
Submitted:
09 October 2025
Posted:
09 October 2025
You are already at the latest version
Abstract
Predicting whether a compound is subject to active transport is crucial in drug development. We propose a simple threshold for passive membrane permeability Pm, derived from the cell’s energy limitation, to identify compounds unlikely to be actively effluxed. For MDCK cells, this threshold—normalized to the applied compound concentration (Cext)—was determined to be log(Pm*Cext / [cm/s*µM] ) = -1.7.
To derive this threshold, we conducted an extensive analysis of literature-reported efflux ratios (ER) in MDCKII-MDR1, MDCK-BCRP, and MDCK-MRP2 cells (294 datapoints across 136 unique compounds). Concentration-dependent measurements for Amprenavir, Eletriptan, Loperamide, and Quinidine enabled the most accurate determination of the threshold. Literature ER values were re-evaluated through the experimental determination of reliable Pm values, as well as newly measured ER values with MDCK efflux assays. The results of these assays and the re-evaluation allowed us to reclassify all but three outliers (compounds with ER > 2.5 and log(Pm*Cext) > −1.7). In contrast, more than 60% of the compounds analyzed without significant ER values (123 compounds) fell above the threshold, in strong agreement with our theory of an energy limitation to active transport.
This permeability threshold thus provides a simple and broadly applicable criterion to identify compounds for which active efflux is energetically not feasible, offering a practical tool for early drug discovery and optimization.
Keywords:
passive permeability
; P-glycoprotein
; active transport
; efflux ratio
; energy limit
; MDCK
1. Introduction
Transport across biological membranes significantly influences the pharmacokinetic and toxicokinetic properties of drugs. Understanding active transport—especially efflux mechanisms—is essential, as these processes greatly impact a compound’s bioavailability, toxicity, and therapeutic efficacy. Active transport of molecules through cell membranes functions in parallel with passive diffusion; however, instead of being driven by concentration gradients, active transport is energy-dependent and can occur against such gradients. As passive membrane permeability increases for more hydrophobic chemicals, more energy is needed for their active transport to counteract their rate of passive diffusion. Given that cells have a limited energy budget, this work sets out to prove the existence of a membrane permeability threshold beyond which active transport of molecules is no longer energetically viable.
Efflux proteins located in the apical membrane such as P-glycoprotein/multi-drug resistant protein 1 (P-gp, MDR1), breast cancer resistance protein (BCRP) and multi-drug resistance associated protein 2 (MRP2) are responsible for actively pumping out foreign substances from cells, often reducing the efficacy of drug uptake (Juvale et al., 2022; Sharom, 2008). The resistance of cancerous tissue to multiple drugs is largely attributed to the over-expression of such efflux proteins, due to their role in decreasing the intracellular concentration of chemotherapeutic agents (Fletcher et al., 2010). Given the role of P-gp overexpression in multidrug-resistance (MDR), which reduces the efficacy of chemotherapeutics, antibiotics, and antivirals, there is a strong demand for cost-effective, rapid methods to identify P-gp substrates. Such methods could not only help predict a compound’s toxicity, bioavailability, and drug-drug interaction potential (Demel et al., 2009), but also enable the early elimination of problematic candidates, mitigating MDR-related challenges during drug discovery (Xue et al., 2004). Therefore, it is of great importance in the pharmaceutical industry to ascertain whether drugs are affected by such efflux transporters. Traditionally, the passive membrane permeability (Pm) of a compound, as well as the involvement of efflux transporters—quantified using a metric known as the efflux ratio (ER)— is determined through bidirectional transport assays using epithelial cell lines such as MDCK or Caco-2. Such assays have also been used to accumulate data on the chemical nature of efflux transporter substrates (Gombar et al., 2003; Li et al., 2014; Penzotti et al., 2002; Wang et al., 2011; Xue et al., 2004), in the hopes of enabling the development of predictive in silico models linking physicochemical properties to carrier-mediated efflux (i.e QSAR models (Chen et al., 2012)). However, the utility of such models is hindered by their limited interpretability, narrow chemical coverage due to limitation in the training datasets, as well as their reliance on inconsistent datasets.
Efforts have also been made to develop simple and fast interpretations of the molecular features that contribute to being an efflux substrate (Didziapetris et al., 2003; Gombar et al., 2003; Seelig, 1998). These studies aim to establish simple and widely-applicable "rules-of-thumb" for hit-to-lead optimisation. It has been suggested that such simple rules may have a greater impact than complex, predictive models (Demel et al., 2009). In this work, we propose another simple and easily applicable rule-of-thumb: compounds above a certain passive membrane permeability threshold are less likely to exhibit significant transporter-facilitated efflux. The objective of this study was to investigate this hypothesis and to see whether it could be translated into a rule for quick, membrane permeability-based separation of compounds that may exhibit significant transporter-facilitated efflux from those that cannot. The permeability-based separation proposed here does not differentiate between efflux substrates and non-substrates. Instead, it distinguishes compounds whose ADME properties can be significantly influenced by efflux transporters from those that cannot, regardless of whether they are actual substrates. A rule-of-thumb for permeability-based separation could be very useful if applied in drug classification, or could be used for the rational direction of lead optimisation towards desired efflux effects. Since it was shown recently by Dahley et al. (2024) that the biological Caco-2/MDCK membrane permeability of drugs is well predicted by the solubility diffusion model (SDM), permeability-based separation can in most cases be done without the need for experimental assays. Furthermore, since this rule is based on a fundamental physical principle (the energy limit of the cell) it is not restricted to P-gp only, but should be applicable to any ATP-consuming efflux transporter.
The aims of this study were (i) to evaluate existing MDCKII ER data for MDR1, BCRP and MRP2 and to identify a crude membrane permeability cut-off line above which compounds no longer seem to be affected by active efflux. Compounds that appear to violate the established threshold can then be identified as outliers and systematically investigated using a variety of measures. Secondly, it was aimed (ii) to identify compounds that lie at or near the threshold so they can be investigated with concentration-dependent monolayer efflux assays. These data can then be used to identify the maximal flux rate (i.e the maximal amount of compound that can be actively effluxed per time) and the corresponding energy plateau for such compounds. Finally, we aimed (iii) to link this energy limit with a certain Pm value and to perform a sensitivity analysis, highlighting all the caveats and limitations that come with such a rule-of-thumb Pm threshold.
2. Theory
2.1. Transport Model
There are various resistances found in series and parallel that a compound encounters as it permeates from one compartment to another across a cell layer. This includes aqueous boundary layers (ABL), as well as the cell layer itself, consisting of the basolateral and apical membranes, as well as the cytosol. The permeability (P) through each barrier is inversely proportional to its resistance. As is evident in Figure 1, the unidirectional active transport facilitated by P-gp (denoted as ) and a basolateral uptake transporter (denoted as ) is found in parallel to the passive diffusion through the apical membrane (Pm,a). The in vitro situation during MDCK/Caco-2 assays is comparable to the in vivo scenario, save for the presence of a permeable filter on which cells are grown, as well as thicker unstirred water layers. A detailed description of the conceptual model used, as well as the various resistances and how they can be quantified can be found in Kotze et al. (2024b).
The total permeability through all these barriers which is measured by the transport assays is known as the apparent permeability, Papp, which is a function of all individual permeabilities found in series and parallel. Papp can be sub-divided into the contributions of these constituent parts, which allows for the individual evaluation and quantification of permeability through each layer, see Equations S1-1 to S1-8 in the Supplementary Materials S1 for modelled permeabilities and local compound concentrations as described in detail in Kotze et al. (2024b).
2.2. Maximal Active Transport Flux and Borderline Compounds
It is crucial to distinguish between the two different threshold values discussed in this work: the maximal flux and the associated maximal passive membrane permeability. The maximal flux, or Jpgp,active, refers to the maximum moles of compound that can be actively transported by any transporter per unit area and time (μmol/cm2/s) assuming the cell has limits to the energy it can invest in its transporters. The energy limit thus corresponds to the maximal Jpgp,active possible given limited energy production of the cell. Both the value for active efflux (cm/s) facilitated by P-gp from the apical membrane as well as the actively transported flux Jpgp,active at a given apical freely-dissolved concentration can be extracted from model fits of experimental MDCK data. A theoretical calculation of the maximal possible Jpgp,active given the cells ATP turnover can also be performed to compare with the empirical value as a plausibility check, see Supplementary Materials S1-2. However, Jpgp,active is an impractical metric, since it is complex to determine and not meaningful for the average scientist. Thus, we aimed to ultimately link it with passive membrane permeability, Pm, which is usually readily available, or easily determinable if not. The Pm threshold is thus the specific passive membrane permeability value where the rate of passive influx of a chemical would require an active efflux rate that exceeds the cell’s maximal Jpgp,active.
Chemicals which have a Pm value that exceeds the threshold Pm value would thus be unlikely to exhibit significant efflux, as their high permeability would impose an unsustainable energy demand on the cell. The connection between those two metrics, Jpgp,active and Pm, is provided by the assumption that almost all the compound passively diffusing into the cells is actively effluxed, which is a valid approximation for high efflux ratios. If membrane permeability poses the main passive resistance, passive influx corresponds to Pm*Cext. For significant ER values, the energy limit can thus be approximated by the applied concentration-corrected membrane permeability, Pm*Cext. Although concentrations in MDCK/Caco-2 efflux assays typically vary only within a narrow range (1–100 µM), therapeutic plasma concentrations span more than six orders of magnitude (Schulz and Schmoldt, 2003). It is therefore essential to take Cext into account when defining the threshold.
Since Jpgp,active depends on several factors, the resultant Pm*Cext threshold would not be a hard, definite cut-off line. Rather, it could be expected that there would be some intermediary window of transitionary permeability values that separate compounds that can be effectively effluxed from those that cannot. For compounds that have a Pm*Cext value within this window (which we designate as “borderline compounds”) concentration plays a particularly pivotal role. For such borderline compounds, we observed concentration-dependent saturation of active transport. The rationale is that at low concentrations, compounds can be efficiently effluxed without substantially straining the cell’s energy budget. However, as concentration increases, the greater the amount of compound entering the cell, and the nearer the increased efflux would get to approaching the energy limit. Finally, at some higher concentration and above, the amount of compound passively permeating into the cell far exceeds what can be effluxed, since the energy budget has been depleted.
3. Material and Methods
3.1. Determination of Passive Membrane Permeability Pm
To determine the energy limit, a reliable Pm is needed. Pm can be determined experimentally, or predicted with in silico methods. According to the pH-partition hypothesis, only the neutral fraction (fn) of a chemical can pass through membranes by passive diffusion due to its exceedingly hydrophobic nature (Shore et al., 1957), because the permeability of the ionic fraction is negligible in comparison (Ebert et al., 2018). The Pm of ionisable chemicals is therefore dependent on pH, or the neutral fraction fn:
The interconversion between the intrinsic permeability P0 and Pm is straightforward when the neutral fraction is known. For all compounds in this study, pKa values were used to determine fn at pH 7.4 according to Escher et al. (2020). Experimental pKa values were preferred, however, where no experimental pKa could be sourced, pKa values were instead determined using the software ACD/pKa GALAS from ACD/Percepta (version 2020.1.2, Advanced Chemistry Development, Inc. (ACD/Labs), Toronto, ON, Canada, www.acdlabs.com). For zwitterions, only the non-charged neutral species was assumed to permeate the membrane, and the respective fraction was calculated according to Ebert and Dahley (2024). See Tables S2-1 to S2-3 for details.
For epithelial cells such as the MDCK line used in this study, it is crucial to note that the apical membrane is folded to form microvilli. As a result, it is generally assumed to have a greater surface area than the basolateral membrane. If there is indeed a difference in surface area between the apical and basolateral membrane, it is suspected to have a significant effect on the resulting energy limit of this work. In our previous study we speculated that the factor of 24 (Palay, 1959) we routinely implemented to account for this increase in apical membrane surface area was likely too high (Kotze et al., 2024b). As such, in the main text of this study we used a more moderate apical membrane surface area factor (SA) of 7.5 (determined specifically for MDCKII cells as the mean value of these cells grown on different filters (Butor and Davoust, 1992)), and compared this to the two other proposed factors of 24 and 1 on the extreme ends of the probable range in the Supplementary Materials S1 (9–16). The factor of 1 naturally indicates that there is no difference in surface area between apical and basolateral membranes.
3.1.1. In Silico Prediction of Pm Using UFZ-LSERD/COSMO-RS
Experimental Pm values are the most reliable, so for this work such values were preferred when available for a given compound. When no reliably extracted experimental P0 value was available for the calculation of Pm, P0 was predicted according to the solubility-diffusion model (SDM) using hexadecane as a model for the hydrocarbon core of the membrane (Bittermann and Goss, 2017; Dahley et al., 2024; Walter and Gutknecht, 1986):
Where is the diffusion coefficient of the compound in hexadecane, is the hexadecane-water partition coefficient of the compound, and is thickness of the hexadecane-like hydrocarbon core of the cell membrane. The is assumed to be one tenth of the (Bittermann and Goss, 2017), and was thus calculated as a function of molecular weight of the compound, corrected to account for the temperature of 37 °C (Avdeef, 2010; Avdeef et al., 2005). The was determined using the LSER database (UFZ-LSER, 2025). values determined from experimental descriptors were preferred and duly sub-categorised. For compounds where experimental descriptors were not available, values determined from calculated descriptors were used instead. For the sake of comparison, values were also generated for all compounds using the quantum chemically-based software COSMOtherm (version C30, release 18, COSMOlogic GmbH & Co. KG, Leverkusen, Germany, www.cosmologic.de)(Eckert and Klamt, 2002). COSMOtherm values were only used for zwitterions, and compounds with a molecular weight > 1000 g/mol. The P0 of the MDCK cell membrane P0,MDCK was then calculated from P0,SDM using the empirical correlation determined by Dahley et al. (2024):
3.1.2. Experimental Determination of Pm with Bidirectional MDCK Assays
Membrane permeability Pm and the resultant P0 values can also be determined with in vitro bidirectional assays. In this study, P0 values for all compounds were preferentially sourced from our own experiments and from Ebert et al. (2024) who extracted P0 values from experimental Caco-2/MDCK Papp data from several sources taking into account the many pitfalls of P0 determination. As such they are considered the most reliable P0 values available.
3.1.3. Experimental Determination of Pm with PAMPA and SDM
Using hexadecane as the membrane in HDM-PAMPA (Parallel Artificial Membrane Permeability Assay) has been shown an effective way to determine reliable experimental Khex/w (Dahley et al., 2025). These values could then be used via Equations (2) and (3) to determine a Pm for MDCK cells that is much more reliable than those generated from predicted values (Dahley et al., 2024). For this work, HDM-PAMPA assays were performed for some compounds at suitable pH values. Detailed descriptions of the methodology used can be found in an accompanying study by Dahley et al. (2025). Further details about the experiments first reported in Dahley et al. (2025) that are relevant to this study (including the chemicals and reagents used, the experimental conditions, the experimentally obtained Papp, P0 and Khex/w values, as well as the resultant Pm values calculated from it, etc.) can be found in the Supplementary Materials S1 (3–4) and S2 (Tables S2-5 and S2-6).
3.2. Analysis of ER Data
3.2.1. Evaluation of ER Data from Literature
Three separate datasets of ER values were curated for P-gp, BCRP and MRP2 substrates as the three most clinically relevant apically-located efflux transporters. A literature search was performed to obtain compounds for which the ER was ≥ 2.5 (Wager et al., 2010), as determined with bidirectional MDCK transport assays. For compounds where ER values from more than one source were available, values from all sources were included in the analyses, even if some sources had a conflicting ER below the cut-off value. A total of 294 datapoints were gathered, representing 136 unique compounds, with those from MDCKII-MDR1 assays making up the bulk of the data, since MDCK-BCRP and MRP2 monolayer efflux assays are far less common. MDCKII-MDR1 assay data from 24 different sources were used (Callegari et al., 2011; Carrara et al., 2007; Chang et al., 2006; Chen et al., 2003; Chen et al., 2005; De Souza et al., 2009; Eriksson et al., 2006; Feng et al., 2008; Gertz et al., 2010; Hellinger et al., 2012; Huang et al., 2006; Liu et al., 2012; Luo et al., 2010; Mahar Doan et al., 2002; Obradovic et al., 2007; Park et al., 2011; Polli et al., 2001; Simoff et al., 2016; Tang et al., 2004; Taub et al., 2005; Troutman and Thakker, 2003; Wager et al., 2010; Wang et al., 2005a; Wegler et al., 2021). The dataset was comprised of 227 data points (i.e ER values) from 107 unique compounds. MDCK-BCRP assay data from 12 different sources were used (Chen et al., 2009; Feng et al., 2019; Mahringer et al., 2009; Marchetti et al., 2008; Muenster et al., 2008; Mukkavilli et al., 2018; Poirier et al., 2014; Polli et al., 2008; Wegler et al., 2021; Xiao et al., 2006; Ye et al., 2013; Zhang et al., 2015). The dataset was comprised of 52 data points from 33 different compounds. MDCK-MRP2 assay data from 8 different sources were used (Hong et al., 2014; Huisman et al., 2005; Jain et al., 2008; Lau et al., 2006; Nielsen et al., 2019; Tang et al., 2002; Williams et al., 2002; Zimmermann et al., 2008). The dataset was comprised of 15 data points from 11 different compounds. A fourth, separate dataset was also curated for compounds with insignificant ER values below the cut-off line. For this, data was obtained from 4 sources (Feng et al., 2008; Hellinger et al., 2012; Mahar Doan et al., 2002; Polli et al., 2001). This dataset was comprised of 125 datapoints representing 123 compounds. For all datasets, compounds with a permanent charge were excluded from further analyses since they have no neutral fraction that can passively permeate through the hydrophobic core of the membrane.
The Pm of each compound was then determined according to Equation (1) and the corresponding applied concentrations used by the respective studies were noted and used to calculate the concentration-corrected Pm values (Pm*Cext). The MDCK ER values from the studies of all three transporters and the Pm*Cext values determined for each respective compound are depicted in Figure 2. Tabulated values of Pgp/MDR1, BCRP and MRP2 substrates along with their chemical properties can be found in the Supplementary Materials (Tables S2-1, S2-2 and S2-3, respectively), along with the concentration-corrected Pm values (Table S2-4).
3.2.2. Re-Determining the ER of Outlier Compounds with Bidirectional MDCK Assays
Chemicals and Reagents
All chemicals and reagents can be found in the Supplementary Materials (S1-3).
Cells and Cell Culture
MDCKII-MDR1 cells were obtained from The Netherlands Cancer Institute (Amsterdam, The Netherlands). The cell medium was Dulbecco's modified Eagle medium (DMEM) (1X) + GlutaMAX™-I supplemented with 10 % foetal bovine serum (FBS), 100 U/mL penicillin and 100 µg/mL streptomycin. Cells were maintained at 37 °C in an atmosphere of 5 % CO2 and passaged twice a week.
Bidirectional MDCK Assays
MDCK bidirectional transport assays were performed as described in Kotze et al. (2024a; 2024b). MDCKII-MDR1 cells (passages 20–40) were seeded at a density of 1.5 x 10⁵ cells/insert onto 12-well transwell inserts from CellQART (Northeim, Germany; pore size: 0.4 µm; filter thickness: 11.5 µm, porosity: 100 x 106 pores/cm2). After seeding, cells were maintained as described in Section 3.2.2.2 and grown for 4 days. On the day before the experiment, the cell medium was refreshed. The transport buffer was HBSS and HEPES with a pH of 7.4. Stock solutions were prepared in the transport buffer. Prior to the experiment, the pH of the buffer and stock solutions was controlled with a rapid pH automated pH meter (Hudson Robotics, Inc., Springfield, NJ, USA), as was the pH of all samples after the completion of the experiment. Inserts were used in 12-well plates from TPP Techno Plastic Products AG (Trasadingen, Switzerland). Sampling occurred at 3–4 time intervals, the length of which was determined uniquely for each compound and direction of measurement in order to ensure sink conditions. Plates were placed in a Titramax and Inkubator 1000 orbital shaking incubator from Heidolph Instruments GmbH & Co. (Schwabach, Germany) at 450 rpm and 37 °C in between sampling steps. At the final sampling step, the donor compartment was sampled for mass balance calculations. The trans-epithelial electrical resistance (TEER) across the cell monolayer was measured for each insert at 37 °C using an EVOM epithelial tissue volt/ohmmeter (World Precision Instruments Inc., Sarasota, FL, USA) before and after the experiment to ensure that cell monolayer remained intact throughout the experiment. Lucifer yellow (LY) was also used as a paracellular marker to further verify the integrity of the cell monolayer. For this, the LY permeability of each insert was evaluated after the experiment by measuring the fluorescence intensity (excitation: 485 nm, emission: 538 nm) of basolateral compartment samples using a SpectraMAX Gemini EM spectrophotometer (Molecular Devices LLC., San Jose, CA, USA). Inserts exhibiting a LY permeability exceeding the pre-defined threshold of 1.5 x 106 cm/s were excluded (Irvine et al., 1999), unless their Papp results were qualitatively consistent with those of replicate inserts that fell within the LY threshold..
Samples were analysed with an Infinity II 1260 LC system coupled with a 6420 triple quadrupole 145 with ESI source (Agilent Technologies Inc., Santa Clara, CA, USA). Either a Kinetex® F5 (2.6 µm; 100 Å; 50 * 3.0 mm) or C18 (2.6 µm; 100 Å; 50 * 3.0 mm) LC column was used (Phenomenex Inc., Torrance, CA, USA). Papp was calculated from acceptor compartment concentrations as described in Kotze et al. (2024b). Papp values at each timestep were corrected with the calculated recovery as done by Neuhoff (2003). Data are presented as the mean of the recovery-corrected Papp ± standard deviation of at least two timestep samples of both replicates. In order to account for lag time (Heikkinen et al., 2009), the first timestep in the A ⟶ B direction was excluded. The ER was calculated as the ratio of the mean Papp values in the B ⟶ A direction and A ⟶ B direction according to:
3.2.3. Concentration-Dependent MDCK Assays for Borderline Compounds
Bidirectional MDCK-MDR1 assays were performed as described in Section 3.2.2.3 and Kotze et al. (2024b) to determine Papp values as well as the ER using stock solutions with varying concentrations. Concentrations were chosen to span the range of viable concentrations within the limits of the experimental procedure and LC-MS quantification. Where DMSO was required for solubility, the total concentration was kept constant at a limit of 0.1 %, and the transport buffer was supplemented with the same concentration to prevent a DMSO gradient between compartments. MDCK assays for this section were performed in triplicate, and sampling occurred at 4 consistent time intervals. Data from these assays are presented as the mean of the recovery-corrected Papp ± standard deviation of at least three timestep samples for all replicates.
3.2.4. Determination of and Maximal Flux Jpgp,active
The recovery-corrected A ⟶ B and B ⟶ A permeabilities determined for each concentration of the assays in Section 3.2.3 were used in the evaluation of the saturation experiments. The thickness of the apical and basolateral ABL, the thickness of the filter and its effective surface area, as well as the P0, Dw, Dcyt and pKa of each respective compound were used to calculate the permeability through the individual resistances (ABLs, membranes, cytosol and filter). Paracellular permeability was calculated according to Bitterman et al. (2017) and a factor of 0.1 applied so that its final value matches the paracellular permeabilities typically observed for our MDCKII-MDR1 cell set-up (Kotze et al., 2024b). The external neutral fraction was once again calculated according to Escher et al. (2020) based on the compound's pKa values and the external pH. The neutral fraction in the cytosol was similarly calculated after determining the cytosolic pH as a function of the external pH according to Dahley et al. (2024).
The experimental Papp and known P0 values were then used to fit the apparent permeabilities facilitated by P-gp and the basolateral uptake transporter and . Papp A⟶B (see Eq. S1-3) was fitted at each concentration with the Excel SOLVER function which minimised the difference between the calculated and experimental apparent permeability by varying . Using the extracted as well as the starting concentrations (μmol L-1), the calculation of compound concentrations adjacent to the apical membrane in the cytosol was possible (ccyt,a) (see Eq. S1-6). The flux of actively transported compound, Jpgp,active, could then be calculated from * ccyt,a in μmol cm-2 s-1. Ideally, a consecutive calculation would have been performed: First, for the basolateral transporter , by fitting the B ⟶ A permeability (see Eq. S1-4) under the assumption that the apical membrane is not a significant resistance in this direction of transport. Then would be determined by fitting A ⟶ B permeability. However, due to unforeseen experimental effects, only A ⟶ B permeability could be fitted to determine , under the assumption of insignificant basolateral active transport. This is elaborated upon and justified in the Supplementary Materials (S1-7).
3.2.5. Linking the Maximal Flux Value with a Membrane Permeability Threshold
For the compounds that exhibited saturation effects in the concentration-dependent MDCK assays and thus evidently reached the maximal flux plateau, classic non-linear Michaelis-Menten fits for extracted Jpgp,active depending on Ccyt,a were performed using IGOR Pro 7 (WaveMetrics Inc., Lake Oswego, USA) to determine the maximal Jpgp,active. The maximal Jpgp,active was then used to calculate the corresponding threshold Pm value depending on ER (i.e the maximum passive membrane permeability a compound can have in order to potentially be affected by active efflux), again using the Excel solver function to optimize Pm for various , minimizing Jpgp,active,max- *Ccyt,a. ER and Ccyt,a were calculated using Eq. S1-5 and S1-6, respectively. In contrast to our earlier assumption that nearly all compounds passively diffusing into the membrane are subsequently effluxed, this approach also allows determination of Pm for low ER values, where that assumption is not valid. In essence, Pm was back-calculated from P-gp activity, and it was determined what Pm value is possible for P-gp activity to equal the maximal flux value. Compound concentrations, paracellular transport and the apical membrane surface area were varied for the sensitivity analysis of the Pm threshold.
4. Results and Discussion
4.1. First Estimation of Pm*Cext Limit
To validate our assumption of a Pm*Cext limit for active transport, the efflux ratios for P-gp, BCRP and MRP2 substrates were extracted from literature as described in section 3.2.1. Figure 2 shows the Pm*Cext plotted against the reported efflux ratios for a total of 286 datapoints, representing 132 unique compounds (after exclusions, see details in Section 3.3). Different colors indicate the source of each Pm value, which in turn reflects the reliability of the experimental or predicted data.
A rough approximation of the cut-off value for compound permeability was delineated to enable rational direction of the initial investigations. This cut-off Pm*Cext value was determined by assessing the distribution of all the data (Figure 2). Particular weight was given to datapoints which had Pm*Cext values based on the reliable P0 values extracted by Ebert et al. (2024) and Ebert and Dahley (2024). Consequently, as a first approximation as to where the energy threshold (and thus concomitant membrane permeability threshold) could lie, a preliminary threshold of log(Pm*Cext) = -2 was established, as it can be observed that none of the reliable experimental Pm*Cext values by Ebert et al. were found above this.
4.2. Identification and Investigation of Outliers
All 59 datapoints (41 compounds) with an ER ≥ 2.5 and with a log(Pm*Cext) > -2 were thus identified as tentative outliers to our hypothesis, see Table S2-6. Owing to the specific threshold selection, this classification inherently resulted in all outliers having Pm values predicted from values, determined either with experimental or calculated descriptors. values determined from experimental descriptors are generally regarded as quite reliable, so for outliers in this category it was more likely that the reported ER values were erroneous. Thus, for outliers in this category, MDCK assays were preferentially performed to determine the ER independently in an attempt to reproduce the results of the original source study. Since only the MDR1 dataset had outliers in this category, only MDCKII-MDR1 assays were performed. values from calculated descriptors are deemed less reliable, so for outliers in this category it was generally assumed that the calculated Pm was false. For outliers in this category, HDM-PAMPA experiments were preferentially performed to obtain more reliable values as already described in Section 3.1.3. Figure 3 depicts a schematic summarising the aforementioned process of deciding how to probe each outlier compound. The aforesaid assumptions were merely used as a general guideline to determine which experimental method would be preferentially implemented to investigate a given outlier. However, for some compounds both MDCK as well as HDM-PAMPA were eventually performed.
4.3. Outlier Reclassification
Figure 4 represents the collection, analysis and reclassification of the data. Five outlier compounds (gefitinib, lopinavir, ritonavir, zotepine and dasatinib) were excluded for exhibiting stability and solubility issues that precluded reliable PAMPA/MDCK assays. It is worth noting that two thirds of the outlier compounds for the MDR1 dataset were contributed by only three of the 22 sources. Data sourced from Wager et al. (2010) represented more than 30% of the outliers. Moreover, except for one compound, all Wager et al. (2010) outliers fell in the "Experimental Descriptors" category, meaning that the ER value (not the Pm) is more likely dubious for these outliers. Significant ER values reported by Wager et al. and two other sources overrepresented in the outlier data— Obradovic et al. (2007) and Wang et al. (2005b)— were also often contradicted by one or more other sources, which would report no significant ER. As such, values from these sources were treated with caution. Accordingly, the 22 outliers from these sources were reclassified based on contradictory non-significant ER values produced by our own MDCK assays and/or by other sources. Two outliers were reclassified as non-outliers based on newly determined Pm values from PAMPA experiments. Ten outliers were reclassified as borderline compounds based on Pm values— often newly-determined with PAMPA— that placed their log(Pm*C) values between -2 and -1. The outliers, their reclassification and the basis for it can be found in Table S2-6 of the Supplementary Materials. The results of the MDCK and PAMPA assays can be found in the Supplementary Materials S1 (4 and 5) as well as S2 (Table S2-5).
After evaluation, there are three remaining outliers: dextrorphan, mequitazine and terfenadine. For dextrorphan, the reported ER of 2.6 barely surpasses the significance threshold and is thus not a very convincing outlier. This was also the case for mequitazine with an ER of 2.8. For terfenadine, our own MDCK assays did find a significant, albeit also very low ER value of 2.8. Furthermore, a newly-determined PAMPA Khex/w value for terfenadine confirmed a log(Pm*Cext) value of 0.08, therefore above the threshold. However, this compound exhibits very poor recovery in the MDCK assays— which would have likely been the case in the assays from the other sources as well. These poor recoveries may very well result in a false ER.
4.4. Concentration-Dependent Investigation of Borderline Compounds
Figure 5 shows the results of the concentration-dependence assays for a borderline compound (amprenavir) compared to a low Pm compound (acebutolol). The top panels show ER values as a function of applied assay concentration. The bottom panels show the Jpgp,active values (μmol/cm2/s) calculated as described in Section 3.2.4 from the Papp,A⟶B values at each concentration. Similar graphs for all compounds for which concentration-dependent experiments were performed can be found in the Supplementary Materials S1 (6, 9–11) along with tabulated Papp, recovery and ER values at each concentration. From Figure 5 it is evident that for the low Pm compound acebutolol, P-gp has not reached saturation, and there is no change in ER values even at very high concentrations. In contrast, for the borderline compound amprenavir the decline in ER values is attributed to classic saturation effects of the P-gp transporter. This supports our theory that there is concentration-dependent saturation of active transport for compounds near the maximal flux limit. The decline in ER can be attributed to classic saturation effects of the P-gp transporter. At low compound concentrations the P-gp transporter is not yet saturated and this results in high transport rates, resulting in high ER values. At higher concentrations, the transporter has likely reached saturation, and active transport no longer increases with concentration. Thus, passive permeation becomes more dominant as it increases proportionally with concentration.
The observed saturation effects coinciding with the energy plateau is likely no coincidence. Indeed, these two phenomena lead to the same result: no further increase in the activity of the transporter with increasing concentration past some maximal flux value. As such, the energy limit which is dictated by physical principles is enforced by the cell through the mechanism of saturation. While the concept of transporter saturation and its impact on transporter-facilitated efflux is not new (Heikkinen et al., 2010; Li et al., 2008; Tubic et al., 2006), this study is to our knowledge the first to link it to an energy threshold. It is important to note that this does not imply that every observed saturation effect is caused by an energetic limitation; rather, a saturation effect is always observed before the energetic limit is reached, which is plausible from an evolutionary perspective, as it avoids the energy depletion of the cell. It is unclear how exactly the saturation effect would be linked to the energy limit. One hypothesis is that ATP binding kinetics may become rate-limiting at high active transport rates; however, this potential relationship is beyond the scope of the present study.
Tachibana et al. (2010) had already applied a sophisticated model to extract Jpgp,active,max (referred to as Vmax in their work) from concentration-dependent measurements reported by Shirasaka et al. (2006) for verapamil, vinblastine, and quinidine. Their model accounted for passive permeation into and out of the cell on both the apical and basolateral sides of the membrane, as well as unidirectional P-gp transport. While our model for obtaining the Km value differs from theirs, both approaches use the intracellular Km parameter relevant for transporter saturation rather than the extracellular one. The main difference between their approach and ours is that we also included paracellular transport and ABL resistance. It should be emphasized that ABL resistance cannot simply be lumped together with passive permeability; only passive permeability runs in parallel with active transport, whereas the ABL does not. Moreover, paracellular transport can strongly influence Papp, since Papp will not fall below Ppara, even when Ptrans is negligibly low because of active efflux.
Unfortunately, re-analyzing their published data with our model did not yield reliable results, as the evaluable concentration window was rather narrow. At higher concentrations, all compounds appeared to be limited by ABL effects (their data suggested a total ABL thickness of ~4 mm, compared to 426 µm in our experiments). As we were unfamiliar with their experimental setup, estimating paracellular transport was difficult. However, based on the predictions of Avdeef (2012), paracellular transport could have affected Papp at low concentrations for both vinblastine and quinidine. Furthermore, while we could extract a total membrane thickness, the distribution of the ABL between the apical and basolateral sides is critical for the evaluation, and this information was unavailable. In addition, recovery data were missing. Collectively, these factors prevented us from reliably applying our model to their dataset. A fourth compound, digoxin, was included in the study by Shirasaka et al. (2006). It showed no signs of saturation across the tested concentration range (up to 26 µM). With a P0 of 4.14 (Ebert et al., 2024), corresponding to a log Pm⋅Cext of –2.72, this completely neutral compound lies well below our permeability threshold—fully consistent with our model. Finally, the Vmax of 5.7 × 10⁻⁶ µmol/cm²/s for quinidine, obtained by Heikkinen et al. (2010) using a five-compartment model that accounted for ABL effects, is in good agreement with our own Jpgp,active,max of 9.7 × 10⁻⁶ µmol/cm²/s (for SA = 1) derived from our quinidine experiments.
As such, it is worth emphasising once again that experimental conditions are critical for obtaining meaningful results in MDCK efflux assays. We previously showed that pH can play a role in the false classification of compounds, as ER values can change based on the pH (Kotze et al., 2024b). Here once again it can be observed that using concentrations that are too high can easily lead to the erroneous conclusion that compounds are not P-gp substrates.
4.5. Empirical Determination of the Energy Limit
Four out of the six compounds suspected to be borderline compounds (for which concentration-dependent assays were performed) exhibited the expected plateau when the transport of these compounds started reaching the maximal Jpgp,active . Because these compounds exhibited saturation effects and evidently reached the maximal flux plateau, Michaelis-Menten fits were performed as described in Section 3.2.5, the results of which are depicted in Figure 6. The final Jpgp,active,max value was determined from the average of the individual maximum flux values determined for the four compounds depicted in Figure 6. Analogous fits for the same compounds using the other apical membrane surface area factors of 1 and 24 as well as the resultant mean Jpgp,active values in these cases can be found in the Supplementary Materials S1 (12–14). The mean (N=4) Jpgp,active determined for the case considered as most plausible (apical membrane surface area factor of 7.5) was determined to be 1.6 x 10⁻⁴ μmol/cm2/s.
Since the maximal flux value is based on cellular energy constraints, we expect that all borderline compounds should plateau at the same maximal Jpgp,active. As is evident from Figure 6, this is not quite the case. This is easily explained when one considers the influence of P0 values in determining Jpgp,active. P0 values always come with some threshold of error, and the source of the P0 is the biggest determining factor of the level of error. Quinidine has a very reliable experimental P0 value determined from MDCK assays, whereas amprenavir and eletriptan both also have experimental (PAMPA-SDM) P0 values. The results for loperamide, in contrast, are considered less precise because of uncertainty in predicted P0 values. The P0 for loperamide could not be determined via MDCK or PAMPA assays, and is thus based only on an SDM prediction. While SDM predictions derived from experimental descriptors can be quite accurate, experimental P0 are more reliable. The uncertainty in the P0 prediction for loperamide consequently results in greater uncertainty in its fitted Jpgp,active,max values. Though experimental P0 values are generally reliable, they are still subject to error. The experimental P0 for quinidine, amprenavir and eletriptan may still lead to an estimation that is off by one order of magnitude. Thus, the maximal Jpgp,active determined from these fits are fairly consistent within the inextricable error that comes with P0 values.
This maximal Jpgp,active of 1.6 x 10⁻⁴ μmol/cm2/s generated by the Michaelis-Menten fits for four borderline compounds is the energy threshold for efflux transport determined for the MDCKII-MDR1 cells used in this study. Essentially: it is unlikely that highly membrane-permeable compounds that have a higher flux demand for its effective efflux would be affected by any efflux transporter. As stated before, compounds that lie in the borderline window of membrane permeability could exhibit efflux, depending on their concentration.
4.6. Linking a Passive Membrane Permeability Threshold to the Energy Limit
While the Jpgp,active value is interesting, it must be linked with a more accessible metric such as membrane permeability to be useful in practice. As described earlier, for high ER Jpgp,active≈ Jpassive,in, meaning almost all compound passively diffusing into the cell is actively transported out again. If the membrane poses the main resistance, Jpassive,in corresponds to Pm*Cext. However, this assumption is not valid for low ER values, or if other transport resistances are dominant. We thus used our model to calculate the maximum Pm that would lead to a specific ER assuming a maximal Jpgp,active of 1.6 x 10⁻⁴ μmol/cm2/s as described in Section 3.2.5.
As is evident from Figure 7, the Pm*Cext threshold stays constant across all ER values except in the lower ranges. To understand why this is, one needs to consider that at low ER values when P-gp is less active, passive back-flow of the compound from the cytosol is highly relevant, which is not the case for compounds with high ER values where P-gp is more active. In the low ER value range, in order to double the ER, active efflux has to increase substantially to compete with the passive backflow. However, even with a substantial increase in P-gp activity, there is only a modest drop in cytosol concentration. Thus, in the low ER ranges, P0 has to decrease in order for the system to continue adhering to the maximal energy consumption value when the ER increases. In contrast, at higher ER values, active efflux dominates, making the passive backflow negligible. Doubling ER in this range involves proportionally smaller increases in Ppgp since it already vastly exceeds P0, and active transport largely dictates the efflux. As a result, the cytosolic concentration decreases proportionally with the increase in Ppgp activity. Energy consumption remains the same despite the higher ER and reaches a plateau- leading to a concurrent Pm plateau. This is of course a simplified scenario, since the activity of the basolateral transporter and other factors also play a role— but it allows for a fundamental understanding of the phenomenon that can be observed in the lower ER ranges. However, this affects only a small percentage of the significant efflux ratios in our database (those that barely surpass the significance threshold), therefore, the plateau remains the most interesting value. However, this sharp increase in the Pm*Cext limit for low ER values might explain the few remaining outliers that did indeed show low ER values (2.6–2.8). Especially when one considers that low recovery may also have resulted in an overestimation of ER.
4.7. Sensitivity Analysis of Pm Threshold
Though the energy threshold should be static across compounds and concentrations, translating Jpgp,active into a Pm value is dependent on various factors. Firstly, the apical membrane surface area factor SA is expected to be quite consequential, as this directly affects the maximal Jpgp,active value (see S1-11-S1-13). Fortunately, SA does not affect the extracted Pm threshold if we consider the maximal Jpgp,active that corresponds with the respective SA. For example, if the SA is increased by 3.2 (as is the case with 7.5 vs. 24), the extracted Jpgp,active is also increased by a factor of 3.2, but the extracted Pm*Cext threshold is not affected (see S1-14). The determination of the Pm*Cext threshold specific to our cells is thus not affected by the uncertainty of the SA factor. However, if a fixed maximal Jpgp,active is used to extract Pm, the resulting values will scale directly with SA (see Figure S1-10). This becomes critical when the energy limit is determined independently (e.g from ATP-turnover rates, see Supplementary Materials S1-2) because SA variability would then introduce a major source of uncertainty.
Secondly, as stated in the preceding section, the maximal Jpgp,active presented in this work was determined specifically for MDCK-MDR1 cells. The maximal flux value can be different for different cell types. MDCK cells likely have a higher energy limit than the average cell, since their energy needs are higher than that of other, less active cells (see Supplementary Materials S1-2). As such, it is critical to bear in mind that there will be differences between different cell types. Cells with higher energy demands/production are likely to have a higher maximal flux value. For example, in cancer cells an upregulation of mitochondrial respiration has been reported (Giddings et al., 2021), which would also suggest an increased Jpgp,active,max. The observation that inhibition of the electron transport chain restored the cells’ drug sensitivity (Giddings et al., 2021) is fully consistent with our assumption of an energy limitation.
It was found that the energy limit of the cells and thus their maximal Jpgp,active is directly proportional to the corresponding Pm threshold. An increase in maximal flux shifts the logPm threshold higher by the same factor. Thus, it has to be emphasised once again that the Pm threshold presented here is not a universal value, since it was determined for the MDCK-MDR1 cells at our disposal. Therefore, the exact same Pm cut-off cannot be used across all cell types. For example, cells of the blood-brain barrier (BBB) are more active than Caco-2 cells, since they express very high amounts of various efflux transporters to maintain stringent control of brain access. As such, if BBB cells have a higher maximal flux value, it is reasonable to conclude that this would allow for the efficient efflux of compounds with a higher passive membrane permeability. The higher density of mitochondria in the blood–brain barrier (Salmina et al., 2021) may result in a higher energetic limit (and thus higher Pm*Cext threshold). This— together with the expected lower compound concentrations in the blood compared to the intestine— may explain why certain compounds have a high bioavailability, but low brain uptake if they are not actively effluxed in the gut, but are in the brain.
Finally, the importance of concentration for the Pm threshold was very apparent. As expected it was found that the Pm threshold is indirectly proportional to the concentration, since their product determines the passive diffusive flux rate through the membrane that counteracts active transport. The lower the compound concentration, the higher the threshold (and vice versa for an increasing concentrations). This is why the metric proposed for the threshold is not simply Pm, but rather the Pm-concentration product, Pm*Cext (µM cm/s). Instead of the threshold shifting whenever a new concentration is considered, we found that when the Pm is normalised to concentration it always results in the same threshold, regardless of assay concentration applied.
The effect of paracellular transport, compound charge, as well as basolateral uptake on the Pm*Cext threshold was also evaluated, but was found to be inconsequential (Supplementary Materials S1-16). Thus, the final log(Pm*Cext) threshold for our MDCK-MDR1 cell system— determined empirically with borderline compounds—was found to lie at -1.7. This is slightly higher than the threshold considered initially for the identification of outliers, and as such did not result in the re-identification of more outliers not previously considered.
4.8. Re-Evaluation of Literature Data
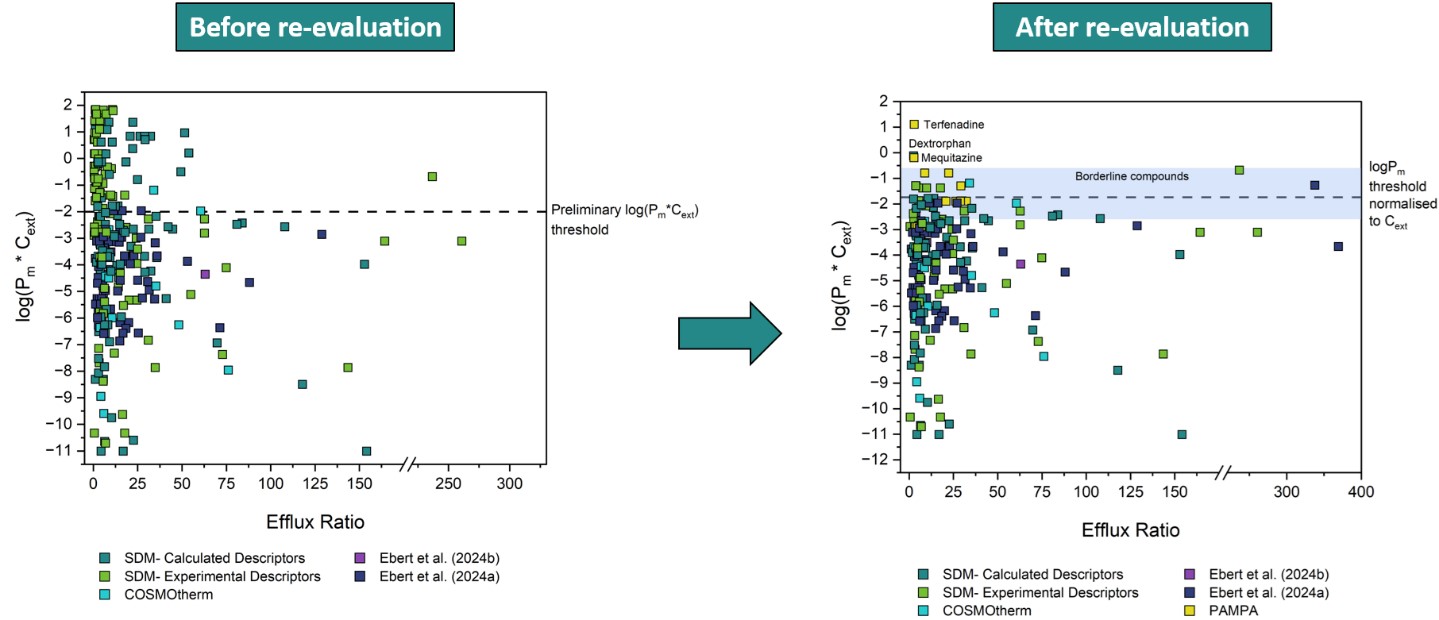
Nearly 300 significant ER values from MDCK assays were collected from 46 different literature sources. Considering the spread of the initial experimental data, it was initially hypothesised that for MDCK cells, compounds with a Pm*Cext value greater than 1 x 10⁻² cm/s would be too membrane permeable for the cell to maintain efficient efflux against their high rates of passive diffusion. From the outset, two thirds of the data did not contradict this hypothesis. That is, they were confirmed efflux substrates with a Pm*Cext lower than 1 x 10⁻² cm/s. Figure 8 shows the distribution of the data of all three transporters after re-evaluation of the outliers, along with the final Pm*Cext threshold line of 2.2 x 10⁻² cm/s (and borderline area) that was determined empirically in this study.
The depicted Pm*Cext threshold is based on the Jpgp,active,max of 1.6 x 10⁻⁴ μmol/cm2/s determined for our MDCK-MDR1 cells. Due to normalisation of the threshold Pm to external concentration, it is independent of assay concentration used.
It is remarkable that of all compounds reported in the literature as being substrates of one of the three major efflux transporter implicated in MDR, all have Pm*Cext values either below the threshold, or they fall in the borderline window and exhibit only concentration-dependent efflux. This supports the theory that there is indeed a Pm limit for active efflux — and due to it being based on the fundamental principle of cellular energy constraints, that it is universal for three different transporters. Ultimately, there are only three unconvincing, low ER compounds which have a Pm*Cext value above the threshold and its accompanying borderline window. This is notable as there is no shortage of pharmaceutical compounds with log(Pm*Cext) values above the threshold. As described in Section 3.2.1, 123 compounds with non-significant ER values were also evaluated. Figure 9 depicts the Pm*Cext values for these compounds with ER values less than 2.5 in red, and as is evident about 60 % of them fall above the threshold. Compounds below the threshold may potentially be affected by efflux transport, and in vitro transwell assays for these compounds are warranted. However, compounds above the threshold are not expected to be affected by efflux transporters, and assays to check for an ER value would be unnecessary.
Our results align with the Biopharmaceutics Drug Disposition Classification System (BDDCS), which categorizes drugs into four classes according to solubility and intestinal permeability. According to Benet et al. (2011), efflux transport should be considered for Class II compounds (low solubility, high passive permeability), whereas membrane transporters—both uptake and efflux—play a critical role for Class III (high solubility, low permeability) and Class IV (low solubility, low permeability) drugs. In contrast, for Class I drugs (high solubility, high permeability), active transport is generally not relevant. This is fully consistent with our defined Pm*Cext threshold, since we would not anticipate active transport under conditions of high permeability combined with high concentrations.
5. Conclusions
In this study, we propose an energy limit for active efflux which can be translated into a membrane permeability threshold value that can be used to simplify identification of compounds that can exhibit significant efflux. Nearly 300 ER values from MDCK assays of three transporters (P-gp, BCRP and MRP2) were sourced from literature to investigate this hypothesis. A systematic analysis of outlier compounds of a preliminary threshold (compounds with ER values greater than 2.5 and log(Pm*Cext) values greater than -2) resulted in the reclassification of most outliers as conformers. Concentration-dependent transwell assays for borderline compounds enabled the more precise identification of the maximal flux value (Jpgp,active,max) of 1.6 x 10⁻⁴ μmol/cm2/s for our MDCK-MDR1 cell systems. It was found that the energy limit seems to be enforced by the cell through the mechanism of saturation. The maximal Jpgp,active was then translated into a more accessible threshold Pm value. The threshold Pm was normalised to external concentration for a concentration independent Pm*Cext threshold. This Pm*Cext threshold falls within the mid-range of typical hydrophobicity/lipophilicity values for most chemicals of interest, making it relevant across a broad spectrum of compounds.
Our results confirm that passive membrane permeability (Pm*Cext) can be used as a filtering metric to determine whether the pharmacokinetics of pharmaceutical compounds can be affected by efflux. If the energy limit of certain cells expressing an efflux transporter of interest is known or determined, then it can also be determined what the maximal membrane permeability of a compound can be that would still allow the maintenance of efficient efflux. Consequently, for compounds that have a Pm value above the threshold it can with some certainty be concluded that their disposition will likely not be affected by any efflux transporters relevant for those cells. However, accurate Pm values are absolutely critical for determining whether efflux can occur. This approach would reduce the need for time- and resource-intensive transport assays for compounds above the threshold. Furthermore, it can aid rational lead optimisation by enabling drugs of interest to be engineered for desired transporter interactions through adjustments in membrane permeability. Future research could extend the present framework to account for influx transport. In addition, the role of saturation as a cellular mechanism for maintaining efflux within the cell’s energy limit warrants further investigation. Finally, future studies could determine the energy limit and corresponding Pm*Cext threshold for other cell lines.
Supplementary Materials
The following supporting information can be downloaded at the website of this paper posted on Preprints.org.
Funding
This research did not receive any specific grant from funding agencies in the public, commercial, or not-for-profit sectors.
CRediT authorship contribution statement
Soné Kotze: Methodology, Formal Analysis, Investigation, Writing - Original Draft, Visualization. Kai-Uwe Goss: Conceptualization, Writing - Review & Editing, Supervision Andrea Ebert: Conceptualization, Methodology, Formal Analysis, Writing - Review & Editing.
Declaration of Competing Interest
The authors declare that they have no known competing financial interests or personal relationships that could have appeared to influence the work reported in this paper.
References
- ACD Percepta, Version 2020 1.2 ed. Advanced Chemistry Development, Inc., Toronto, ON, Canada.
- Avdeef, A. Leakiness and size exclusion of paracellular channels in cultured epithelial cell monolayers-interlaboratory comparison. Pharmaceutical Research 2010, 27, 480–489. [Google Scholar] [CrossRef]
- Avdeef, A. , 2012. Absorption and Drug Development. John Wiley & Sons.
- Avdeef, A. , Artursson, P., Neuhoff, S., Lazorova, L., Gråsjö, J., Tavelin, S. Caco-2 permeability of weakly basic drugs predicted with the Double-Sink PAMPA pKaflux method. European Journal of Pharmaceutical Sciences 2005, 24, 333–349. [Google Scholar] [CrossRef]
- Benet, L.Z. , Broccatelli, F., Oprea, T.I. BDDCS applied to over 900 drugs. AAPS J 2011, 13, 519–547. [Google Scholar] [CrossRef]
- Bittermann, K., Goss. Predicting apparent passive permeability of Caco-2 and MDCK cell-monolayers: A mechanistic model. PLoS ONE 2017, 12. [Google Scholar] [CrossRef] [PubMed]
- Butor, C. , Davoust, J. Apical to Basolateral Surface Area Ratio and Polarity of MDCK Cells Grown on Different Supports. Experimental cell research 1992, 203, 115–127. [Google Scholar] [CrossRef] [PubMed]
- Callegari, E. , Malhotra, B., Bungay, P.J., Webster, R., Fenner, K.S., Kempshall, S., Laperle, J.L., Michel, M.C., Kay, G.G. A comprehensive non-clinical evaluation of the CNS penetration potential of antimuscarinic agents for the treatment of overactive bladder. British Journal of Clinical Pharmacology 2011, 72, 235–246. [Google Scholar] [CrossRef] [PubMed]
- Carrara, S. , Reali, V., Misiano, P., Dondio, G., Bigogno, C. Evaluation of in vitro brain penetration: Optimized PAMPA and MDCKII-MDR1 assay comparison. International Journal of Pharmaceutics 2007, 345, 125–133. [Google Scholar] [CrossRef]
- Chang, C. , Bahadduri, P.M., Polli, J.E., Swaan, P.W., Ekins, S. Rapid identification of P-glycoprotein substrates and inhibitors. Drug Metabolism and Disposition 2006, 34, 1976–1984. [Google Scholar] [CrossRef]
- Chen, C. , Hanson, E., Watson, J.W., Lee, J.S. P-Glycoprotein limits the brain penetration of nonsedating but not sedating H1-antagonists. Drug Metabolism and Disposition 2003, 31, 312–318. [Google Scholar] [CrossRef]
- Chen, C. , Mireles, R.J., Campbell, S.D., Lin, J., Mills, J.B., Xu, J.J., Smolarek, T.A. Differential interaction of 3-hydroxy-3-methylglutaryl-CoA reductase inhibitors with ABCB1, ABCC2, and OATP1B1. Drug Metabolism and Disposition 2005, 33, 537–546. [Google Scholar] [CrossRef]
- Chen, L. , Li, Y., Yu, H., Zhang, L., Hou, T. Computational models for predicting substrates or inhibitors of P-glycoprotein. Drug Discovery Today 2012, 17, 343–351. [Google Scholar] [CrossRef] [PubMed]
- Chen, Y. , Agarwal, S., Shaik, N.M., Chen, C., Yang, Z., Elmquist, W.F. P-glycoprotein and breast cancer resistance protein influence brain distribution of dasatinib. Journal of Pharmacology and Experimental Therapeutics 2009, 330, 956–963. [Google Scholar] [CrossRef] [PubMed]
- Dahley, C., Böckmann. Predicting the intrinsic membrane permeability of Caco-2/MDCK cells by the solubility-diffusion model. European Journal of Pharmaceutical Sciences 2024, 195. [Google Scholar] [CrossRef] [PubMed]
- Dahley, C., Goss. Predicting Caco-2/MDCK Intrinsic Membrane Permeability from HDM-PAMPA-Derived Hexadecane/Water Partition Coefficients (Pre-print). European Journal of Pharmaceutical Sciences 2025. [Google Scholar] [CrossRef]
- De Souza, J. , Benet, L.Z., Huang, Y., Storpirtis, S. Comparison of bidirectional lamivudine and zidovudine transport using MDCK, MDCK-MDR1, and Caco-2 cell monolayers. Journal of Pharmaceutical Sciences 2009, 98, 4413–4419. [Google Scholar] [CrossRef]
- Demel, M.A. , Krämer, O., Ettmayer, P., Haaksma, E.E.J., Ecker, G.F. Predicting ligand interactions with ABC transporters in ADME. Chemistry and Biodiversity 2009, 6, 1960–1969. [Google Scholar] [CrossRef]
- Didziapetris, R. , Japertas, P., Avdeef, A., Petrauskas, A. Classification analysis of P-glycoprotein substrate specificity. Journal of Drug Targeting 2003, 11, 391–406. [Google Scholar] [CrossRef]
- Ebert, A. , Dahley, C. Can membrane permeability of zwitterionic compounds be predicted by the solubility-diffusion model? European Journal of Pharmaceutical Sciences 2024, 199. [Google Scholar]
- Ebert, A., Dahley. Pitfalls in evaluating permeability experiments with Caco-2/MDCK cell monolayers. European Journal of Pharmaceutical Sciences 2024, 194. [Google Scholar] [CrossRef]
- Ebert, A. , Hannesschlaeger, C., Goss, K.U., Pohl, P. Passive Permeability of Planar Lipid Bilayers to Organic Anions. Biophysical Journal 2018, 115, 1931–1941. [Google Scholar] [CrossRef]
- Eckert, F. , Klamt, A. Fast Solvent Screening via Quantum Chemistry: COSMO-RS Approach. AIChE Journal 2002, 48, 369–385. [Google Scholar] [CrossRef]
- Eriksson, U.G. , Dorani, H., Karlsson, J., Fritsch, H., Hoffmann, K.J., Olsson, L., Sarich, T.C., Wall, U., Schützer, K.M. Influence of erythromycin on the pharmacokinetics of ximelagatran may involve inhibition of P-glycoprotein-mediated excretion. Drug Metabolism and Disposition 2006, 34, 775–782. [Google Scholar] [CrossRef]
- Escher, B.I. , Abagyan, R., Embry, M., Klüver, N., Redman, A.D., Zarfl, C., Parkerton, T.F. Recommendations for Improving Methods and Models for Aquatic Hazard Assessment of Ionizable Organic Chemicals. Environmental Toxicology and Chemistry 2020, 39, 269–286. [Google Scholar] [CrossRef]
- Feng, B. , Mills, J.B., Davidson, R.E., Mireles, R.J., Janiszewski, J.S., Troutman, M.D., De Morais, S.M. In vitro P-glycoprotein assays to predict the in vivo interactions of P-glycoprotein with drugs in the central nervous system. Drug Metabolism and Disposition 2008, 36, 268–275. [Google Scholar] [CrossRef]
- Feng, B. , West, M., Patel, N.C., Wager, T., Hou, X., Johnson, J., Tremaine, L., Liras, J. Validation of Human MDR1-MDCK and BCRP-MDCK Cell Lines to Improve the Prediction of Brain Penetration. Journal of Pharmaceutical Sciences 2019, 108, 2476–2483. [Google Scholar] [CrossRef] [PubMed]
- Fletcher, J.I. , Haber, M., Henderson, M.J., Norris, M.D., 2010. ABC transporters in cancer: More than just drug efflux pumps, Nature Reviews Cancer, pp. 147–156.
- Gertz, M. , Harrison, A., Houston, J.B., Galetin, A. Prediction of human intestinal first-pass metabolism of 25 CYP3A substrates from in vitro clearance and permeability data. Drug Metabolism and Disposition 2010, 38, 1147–1158. [Google Scholar] [CrossRef] [PubMed]
- Giddings, E.L. , Champagne, D.P., Wu, M.H., Laffin, J.M., Thornton, T.M., Valenca-Pereira, F., Culp-Hill, R., Fortner, K.A., Romero, N., East, J., Cao, P., Arias-Pulido, H., Sidhu, K.S., Silverstrim, B., Kam, Y., Kelley, S., Pereira, M., Bates, S.E., Bunn, J.Y., Fiering, S.N., Matthews, D.E., Robey, R.W., Stich, D., D'Alessandro, A., Rincon, M. Mitochondrial ATP fuels ABC transporter-mediated drug efflux in cancer chemoresistance. Nat Commun 2021, 12, 2804. [Google Scholar] [PubMed]
- Gombar, V.K. , Polli, J.W., Humphreys, J.E., Wring, S.A., Serabjit-Singh, C.S. Predicting P-Glycoprotein Substrates by a Quantitative Structure-Activity Relationship Model. Journal of Pharmaceutical Sciences 2003, 4, 957–968. [Google Scholar]
- Heikkinen, A.T. , Korjamo, T., Lepikkö, V., Mönkkönen, J. Effects of experimental setup on the apparent concentration dependency of active efflux transport in in vitro cell permeation experiments. Molecular Pharmaceutics 2010, 7, 605–617. [Google Scholar] [CrossRef]
- Heikkinen, A.T. , Mönkkönen, J., Korjamo, T. Kinetics of cellular retention during caco-2 permeation experiments: Role of lysosomal sequestration and impact on permeability estimates. Journal of Pharmacology and Experimental Therapeutics 2009, 328, 882–892. [Google Scholar] [CrossRef]
- Hellinger, É. , Veszelka, S., Tóth, A.E., Walter, F., Kittel, Á., Bakk, M.L., Tihanyi, K., Háda, V., Nakagawa, S., Dinh Ha Duy, T., Niwa, M., Deli, M.A., Vastag, M. Comparison of brain capillary endothelial cell-based and epithelial (MDCK-MDR1, Caco-2, and VB-Caco-2) cell-based surrogate blood-brain barrier penetration models. European Journal of Pharmaceutics and Biopharmaceutics 2012, 82, 340–351. [Google Scholar]
- Hong, L. , Xu, C., O'Neal, S., Bi, H.C., Huang, M., Zheng, W., Zeng, S. Roles of P-glycoprotein and multidrug resistance protein in transporting para-aminosalicylic acid and its N-acetylated metabolite in mice brain. Acta Pharmacologica Sinica 2014, 35, 1577–1585. [Google Scholar] [CrossRef] [PubMed]
- Huang, L. , Wang, Y., Grimm, S. ATP-dependent transport of rosuvastatin in membrane vesicles expressing breast cancer resistance protein. Drug Metabolism and Disposition 2006, 34, 738–742. [Google Scholar] [CrossRef] [PubMed]
- Huisman, M.T. , Chhatta, A.A., Van Tellingen, O., Beijnen, J.H., Schinkel, A.H. MRP2 (ABCC2) transports taxanes and confers paclitaxel resistance and both processes are stimulated by probenecid. International Journal of Cancer 2005, 116, 824–829. [Google Scholar] [CrossRef] [PubMed]
- Irvine, J.D. , Takahashi, L., Lockhart, K., Cheong, J., Tolan, J.W., Selick, H.E., Grove, J.R. MDCK (Madin-Darby canine kidney) cells: A tool for membrane permeability screening. Journal of Pharmaceutical Sciences 1999, 88, 28–33. [Google Scholar] [CrossRef]
- Jain, R. , Agarwal, S., Mandava, N.K., Sheng, Y., Mitra, A.K. Interaction of dipeptide prodrugs of saquinavir with multidrug resistance protein-2 (MRP-2): Evasion of MRP-2 mediated efflux. International Journal of Pharmaceutics 2008, 362, 44–51. [Google Scholar] [CrossRef]
- Juvale, A. , Imtiyaz, I., Hamid, A., Azzar, A., Halim, A., Bariyyah, K., Has, C., Tarmizi, A., 2022. P-glycoprotein: new insights into structure, physiological function, regulation and alterations in disease, Heliyon. Elsevier Ltd.
- Kotze, S. , Ebert, A., Goss, K.U. Effects of Aqueous Boundary Layers and Paracellular Transport on the Efflux Ratio as a Measure of Active Transport Across Cell Layers. U. Effects of Aqueous Boundary Layers and Paracellular Transport on the Efflux Ratio as a Measure of Active Transport Across Cell Layers. Pharmaceutics 2024, 16. [Google Scholar]
- Kotze, S. , Goss, K.U., Ebert, A., 2024b. The pH-dependence of efflux ratios determined with bidirectional transport assays across cellular monolayers. International Journal of Pharmaceutics: X 8.
- Lau, Y.Y. , Okochi, H., Huang, Y., Benet, L.Z. Multiple transporters affect the disposition of atorvastatin and its two active hydroxy metabolites: Application of in vitro and ex situ systems. Journal of Pharmacology and Experimental Therapeutics 2006, 316, 762–771. [Google Scholar] [CrossRef]
- Li, C. , Liu, T., Broske, L., Brisson, J.M., Uss, A.S., Njoroge, F.G., Morrison, R.A., Cheng, K.C. Permeability evaluation of peptidic HCV protease inhibitors in Caco-2 cells-correlation with in vivo absorption predicted in humans. Biochemical Pharmacology 2008, 76, 1757–1764. [Google Scholar]
- Li, D. , Chen, L., Li, Y., Tian, S., Sun, H., Hou, T. ADMET evaluation in drug discovery. 13. Development of in silico prediction models for p-glycoprotein substrates. Molecular Pharmaceutics 2014, 11, 716–726. [Google Scholar] [CrossRef]
- Liu, W. , Okochi, H., Benet, L.Z., Zhai, S.D. Sotalol permeability in cultured-cell, rat intestine, and PAMPA system. Pharmaceutical research 2012, 29, 1768–1774. [Google Scholar] [CrossRef]
- Luo, S. , Pal, D., Shah, S.J., Kwatra, D., Paturi, K.D., Mitra, A.K. Effect of HEPES buffer on the uptake and transport of p-glycoprotein substrates and large neutral amino acids. Molecular Pharmaceutics 2010, 7, 412–420. [Google Scholar] [CrossRef]
- Mahar Doan, K.M. , Humphreys, J.E., Webster, L.O., Wring, S.A., Shampine, L.J., Serabjit-Singh, C.J., Adkison, K.K., Polli, J.W. Passive permeability and P-glycoprotein-mediated efflux differentiate central nervous system (CNS) and non-CNS marketed drugs. Journal of Pharmacology and Experimental Therapeutics 2002, 303, 1029–1037. [Google Scholar] [CrossRef] [PubMed]
- Mahringer, A. , Delzer, J., Fricker, G. A fluorescence-based in vitro assay for drug interactions with breast cancer resistance protein (BCRP, ABCG2). European Journal of Pharmaceutics and Biopharmaceutics 2009, 72, 605–613. [Google Scholar] [CrossRef] [PubMed]
- Marchetti, S. , De Vries, N.A., Buckle, T., Bolijn, M.J., Van Eijndhoven, M.A.J., Beijnen, J.H., Mazzanti, R., Van Tellingen, O., Schellens, J.H.M. Effect of the ATP-binding cassette drug transporters ABCB1, ABCG2, and ABCC2 on erlotinib hydrochloride (Tarceva) disposition in in vitro and in vivo pharmacokinetic studies employing Bcrp1-/-/Mdr1a/1b-/- (triple-knockout) and wild-type mice. Molecular Cancer Therapeutics 2008, 7, 2280–2287. [Google Scholar] [PubMed]
- Muenster, U. , Grieshop, B., Ickenroth, K., Gnoth, M.J. Characterization of substrates and inhibitors for the in vitro assessment of bcrp mediated drug-drug interactions. Pharmaceutical Research 2008, 25, 2320–2326. [Google Scholar] [CrossRef]
- Mukkavilli, R., Jadhav. Evaluation of Drug Transport in MDCKII-Wild Type, MDCKII-MDR1, MDCKII-BCRP and Caco-2 Cell Lines. Current Pharmaceutical Biotechnology 2018, 19. [Google Scholar] [CrossRef]
- Neuhoff, S. , Ungell, A.-L., Zamora, I., Artursson, P., 2003. pH-Dependent Bidirectional Transport of Weakly Basic Drugs across Caco-2 Monolayers: Implications for Drug-Drug Interactions.
- Nielsen, S. , Westerhoff, A.M., Gé, L.G., Carlsen, K.L., Pedersen, M.D.L., Nielsen, C.U. MRP2-mediated transport of etoposide in MDCKII MRP2 cells is unaffected by commonly used non-ionic surfactants. International Journal of Pharmaceutics 2019, 565, 306–315. [Google Scholar] [CrossRef]
- Obradovic, T. , Dobson, G.G., Shingaki, T., Kungu, T., Hidalgo, I.J. Assessment of the first and second generation antihistamines brain penetration and role of P-glycoprotein. Pharmaceutical Research 2007, 24, 318–327. [Google Scholar] [CrossRef]
- Palay, S.L. , Karlin, L.J. An Electron Microscopic Study of the Intestinal Villus II. The Pathway of Fat Absorption*. The Journal of Biophysical and Biochemical Cytology 1959, 5, 373–384. [Google Scholar] [CrossRef]
- Park, M.S. , Okochi, H., Benet, L.Z. Is Ciprofloxacin a Substrate of P-glycoprotein? Archives of Drug Information 2011, 4, 1–9. [Google Scholar] [CrossRef]
- Penzotti, J.E. , Lamb, M.L., Evensen, E., Grootenhuis, P.D.J. A computational ensemble pharmacophore model for identifying substrates of P-glycoprotein. Journal of Medicinal Chemistry 2002, 45, 1737–1740. [Google Scholar] [CrossRef]
- Poirier, A. , Portmann, R., Cascais, A.C., Bader, U., Walter, I., Ullah, M., Funk, C. The need for human breast cancer resistance protein substrate and inhibition evaluation in drug discovery and development: Why, when, and how? Drug Metabolism and Disposition 2014, 42, 1466–1477. [Google Scholar] [CrossRef]
- Polli, J.W. , Humphreys, J.E., Harmon, K.A., Castellino, S., O'Mara, M.J., Olson, K.L., St. John-Williams, L., Koch, K.M., Serabjit-Singh, C.J. The role of efflux and uptake transporters in N-{3-chloro-4-[(3- fluorobenzyl)oxy]phenyl}-6-[5-({[2-(methylsulfonyl)ethyl]amino}methyl)-2-furyl] -4-quinazolinamine (GW572016, lapatinib) disposition and drug interactions. Drug Metabolism and Disposition 2008, 36, 695–701. [Google Scholar]
- Polli, J.W. , Wring, S.A., Humphreys, J.E., Huang, L., Morgan, J.B., Webster, L.O., Serabjit-Singh, C.S. Rational Use of in Vitro P-glycoprotein Assays in Drug Discovery. The Journal of Pharmacology and Experimental Therapeutics 2001, 299, 620–628. [Google Scholar] [CrossRef] [PubMed]
- Salmina, A.B., Kharitonova. Blood-Brain Barrier and Neurovascular Unit In Vitro Models for Studying Mitochondria-Driven Molecular Mechanisms of Neurodegeneration. Int J Mol Sci 2021, 22. [Google Scholar] [CrossRef] [PubMed]
- Schulz, M. , Schmoldt, A. Therapeutic and toxic blood concentrations of more than 800 drugs and other xenobiotics. Pharmazie 2003, 58, 447–474. [Google Scholar] [PubMed]
- Seelig, A. A general pattern for substrate recognition by P-glycoprotein. European Journal of Biochemistry 1998, 251, 252–261. [Google Scholar] [CrossRef]
- Sharom, F.J. , 2008. ABC multidrug transporters: Structure, function and role in chemoresistance, Pharmacogenomics, pp. 105–127.
- Shirasaka, Y. , Kawasaki, M., Sakane, T., Omatsu, H., Moriya, Y., Nakamura, T., Sakaeda, T., Okumura, K., Langguth, P., Yamashita, S. Induction of human P-glycoprotein in Caco-2 cells: development of a highly sensitive assay system for P-glycoprotein-mediated drug transport. Drug Metab Pharmacokinet 2006, 21, 414–423. [Google Scholar]
- Shore, P.A. , Brodie, B.B., Hogben, C.A.M. The Gastric Secretion Of Drugs: A pH Partition Hypothesis. The Journal of Pharmacology and Experimental Therapeutics 1957, 119, 361–369. [Google Scholar] [CrossRef]
- Simoff, I. , Karlgren, M., Backlund, M., Lindström, A.C., Gaugaz, F.Z., Matsson, P., Artursson, P. Complete Knockout of Endogenous Mdr1 (Abcb1) in MDCK Cells by CRISPR-Cas9. Journal of Pharmaceutical Sciences 2016, 105, 1017–1021. [Google Scholar] [CrossRef]
- Tachibana, T. , Kitamura, S., Kato, M., Mitsui, T., Shirasaka, Y., Yamashita, S., Sugiyama, Y. Model analysis of the concentration-dependent permeability of p-gp substrates. Pharmaceutical Research 2010, 27, 442–446. [Google Scholar] [CrossRef]
- Tang, F. , Horie, K., Borchardt, R.T., 2002. Are MDCK Cells Transfected with the Human MRP2 Gene a Good Model of the Human Intestinal Mucosa?
- Tang, F. , Ouyang, H., Yang, J.Z., Borchardt, R.T., 2004. Bidirectional Transport of Rhodamine 123 and Hoechst 33342, Fluorescence Probes of the Binding Sites on P-glycoprotein, across MDCK-MDR1 Cell Monolayers, JOURNAL OF PHARMACEUTICAL SCIENCES, pp. 1185–1194.
- Taub, M.E. , Podila, L., Ely, D., Almeida, I. Functional assessment of multiple p-glycoprotein (P-gp) probe substrates: influence of cell line and modulator concentration on P-gp activity. Drug Metabolism and Disposition 2005, 33, 1679–1687. [Google Scholar] [CrossRef] [PubMed]
- Troutman, M.D. , Thakker, D.R. Novel Experimental Parameters to Quantify the Modulation of Absorptive and Secretory Transport of Compounds by P-Glycoprotein in Cell Culture Models of Intestinal Epithelium. Pharmaceutical Research 2003, 20, 1210–1224. [Google Scholar] [CrossRef] [PubMed]
- Tubic, M. , Wagner, D., Spahn-Langguth, H., Bolger, M.B., Langguth, P. In silico modeling of non-linear drug absorption for the P-gp substrate talinolol and of consequences for the resulting pharmacodynamic effect. Pharmaceutical Research 2006, 23, 1712–1720. [Google Scholar] [CrossRef] [PubMed]
- UFZ-LSER, 2025. UFZ-LSER database v4.0 [internet]. Helmholtz Centre for Environmental Research-UFZ, Leipzig, Germany.
- Wager, T.T. , Chandrasekaran, R.Y., Hou, X., Troutman, M.D., Verhoest, P.R., Villalobos, A., Will, Y. Defining desirable central nervous system drug space through the alignment of molecular properties, in vitro ADME, and safety attributes. ACS Chemical Neuroscience 2010, 1, 420–434. [Google Scholar] [CrossRef]
- Walter, A. , Gutknecht, J. Membrane Biology Permeability of Small Nonelectrolytes through Lipid Bilayer Membranes. J. Membrane Biol 1986, 90, 207–217. [Google Scholar] [CrossRef]
- Wang, Q. , Rager, J.D., Weinstein, K., Kardos, P.S., Dobson, G.L., Li, J., Hidalgo, I.J. Evaluation of the MDR-MDCK cell line as a permeability screen for the blood-brain barrier. International Journal of Pharmaceutics 2005, 288, 349–359. [Google Scholar] [CrossRef]
- Wang, Y.H. , Li, Y., Yang, S.L., Yang, L. Classification of substrates and inhibitors of P-glycoprotein using unsupervised machine learning approach. Journal of Chemical Information and Modeling 2005, 45, 750–757. [Google Scholar] [CrossRef]
- Wang, Z. , Chen, Y., Liang, H., Bender, A., Glen, R.C., Yan, A. P-glycoprotein substrate models using support vector machines based on a comprehensive data set. Journal of Chemical Information and Modeling 2011, 51, 1447–1456. [Google Scholar] [CrossRef]
- Wegler, C. , Gazit, M., Issa, K., Subramaniam, S., Artursson, P., Karlgren, M. Expanding the Efflux In Vitro Assay Toolbox: A CRISPR-Cas9 Edited MDCK Cell Line with Human BCRP and Completely Lacking Canine MDR1. Journal of Pharmaceutical Sciences 2021, 110, 388–396. [Google Scholar] [CrossRef]
- Williams, G.C. , Liu, A., Knipp, G., Sinko, P.J. Direct evidence that saquinavir is transported by multidrug resistance-associated protein (MRP1) and canalicular multispecific organic anion transporter (MRP2). Antimicrobial Agents and Chemotherapy 2002, 46, 3456–3462. [Google Scholar] [CrossRef]
- Xiao, Y. , Davidson, R., Smith, A., Pereira, D., Zhao, S., Soglia, J., Gebhard, D., De Morais, S., Duignan, D.B. A 96-well efflux assay to identify ABCG2 substrates using a stably transfected MDCK II cell line. Molecular Pharmaceutics 2006, 3, 45–54. [Google Scholar] [CrossRef]
- Xue, Y. , Yap, C.W., Sun, L.Z., Cao, Z.W., Wang, J.F., Chen, Y.Z. Prediction of P-glycoprotein substrates by a support vector machine approach. Journal of Chemical Information and Computer Sciences 2004, 44, 1497–1505. [Google Scholar] [CrossRef]
- Ye, L. , Yang, X., Yang, Z., Gao, S., Yin, T., Liu, W., Wang, F., Hu, M., Liu, Z. The role of efflux transporters on the transport of highly toxic aconitine, mesaconitine, hypaconitine, and their hydrolysates, as determined in cultured Caco-2 and transfected MDCKII cells. Toxicology Letters 2013, 216, 86–99. [Google Scholar]
- Zhang, J. , Zhang, L., Yan, Y., Li, S., Xie, L., Zhong, W., Lv, J., Zhang, X., Bai, Y., Cheng, Z. Are capecitabine and the active metabolite 5-FU CNS penetrable to treat breast cancer brain metastasis? Drug Metabolism and Disposition 2015, 43, 411–417. [Google Scholar] [CrossRef] [PubMed]
- Zimmermann, C. , Van De Wetering, K., Van De Steeg, E., Wagenaar, E., Vens, C., Schinkel, A.H. Species-dependent transport and modulation properties of human and mouse multidrug resistance protein 2 (MRP2/Mrp2, ABCC2/Abcc2). Drug Metabolism and Disposition 2008, 36, 631–640. [Google Scholar] [CrossRef]
Figure 1.
Schematic representation of permeation barriers in vivo and in vitro. In vivo (left), well-mixed donor and acceptor compartments are separated by the apical ABL, the cell monolayer, and the basolateral ABL. The in vitro system (right) additionally includes a filter layer and exhibits a thicker ABL (not to scale). Reproduced from Kotze et al. (2024b), licensed under CC BY 4.0. In the case of in vivo transport in intestinal cells for example, the apical compartment would be the lumen of the gastrointestinal tract (GIT), and the basolateral compartment would be the blood.
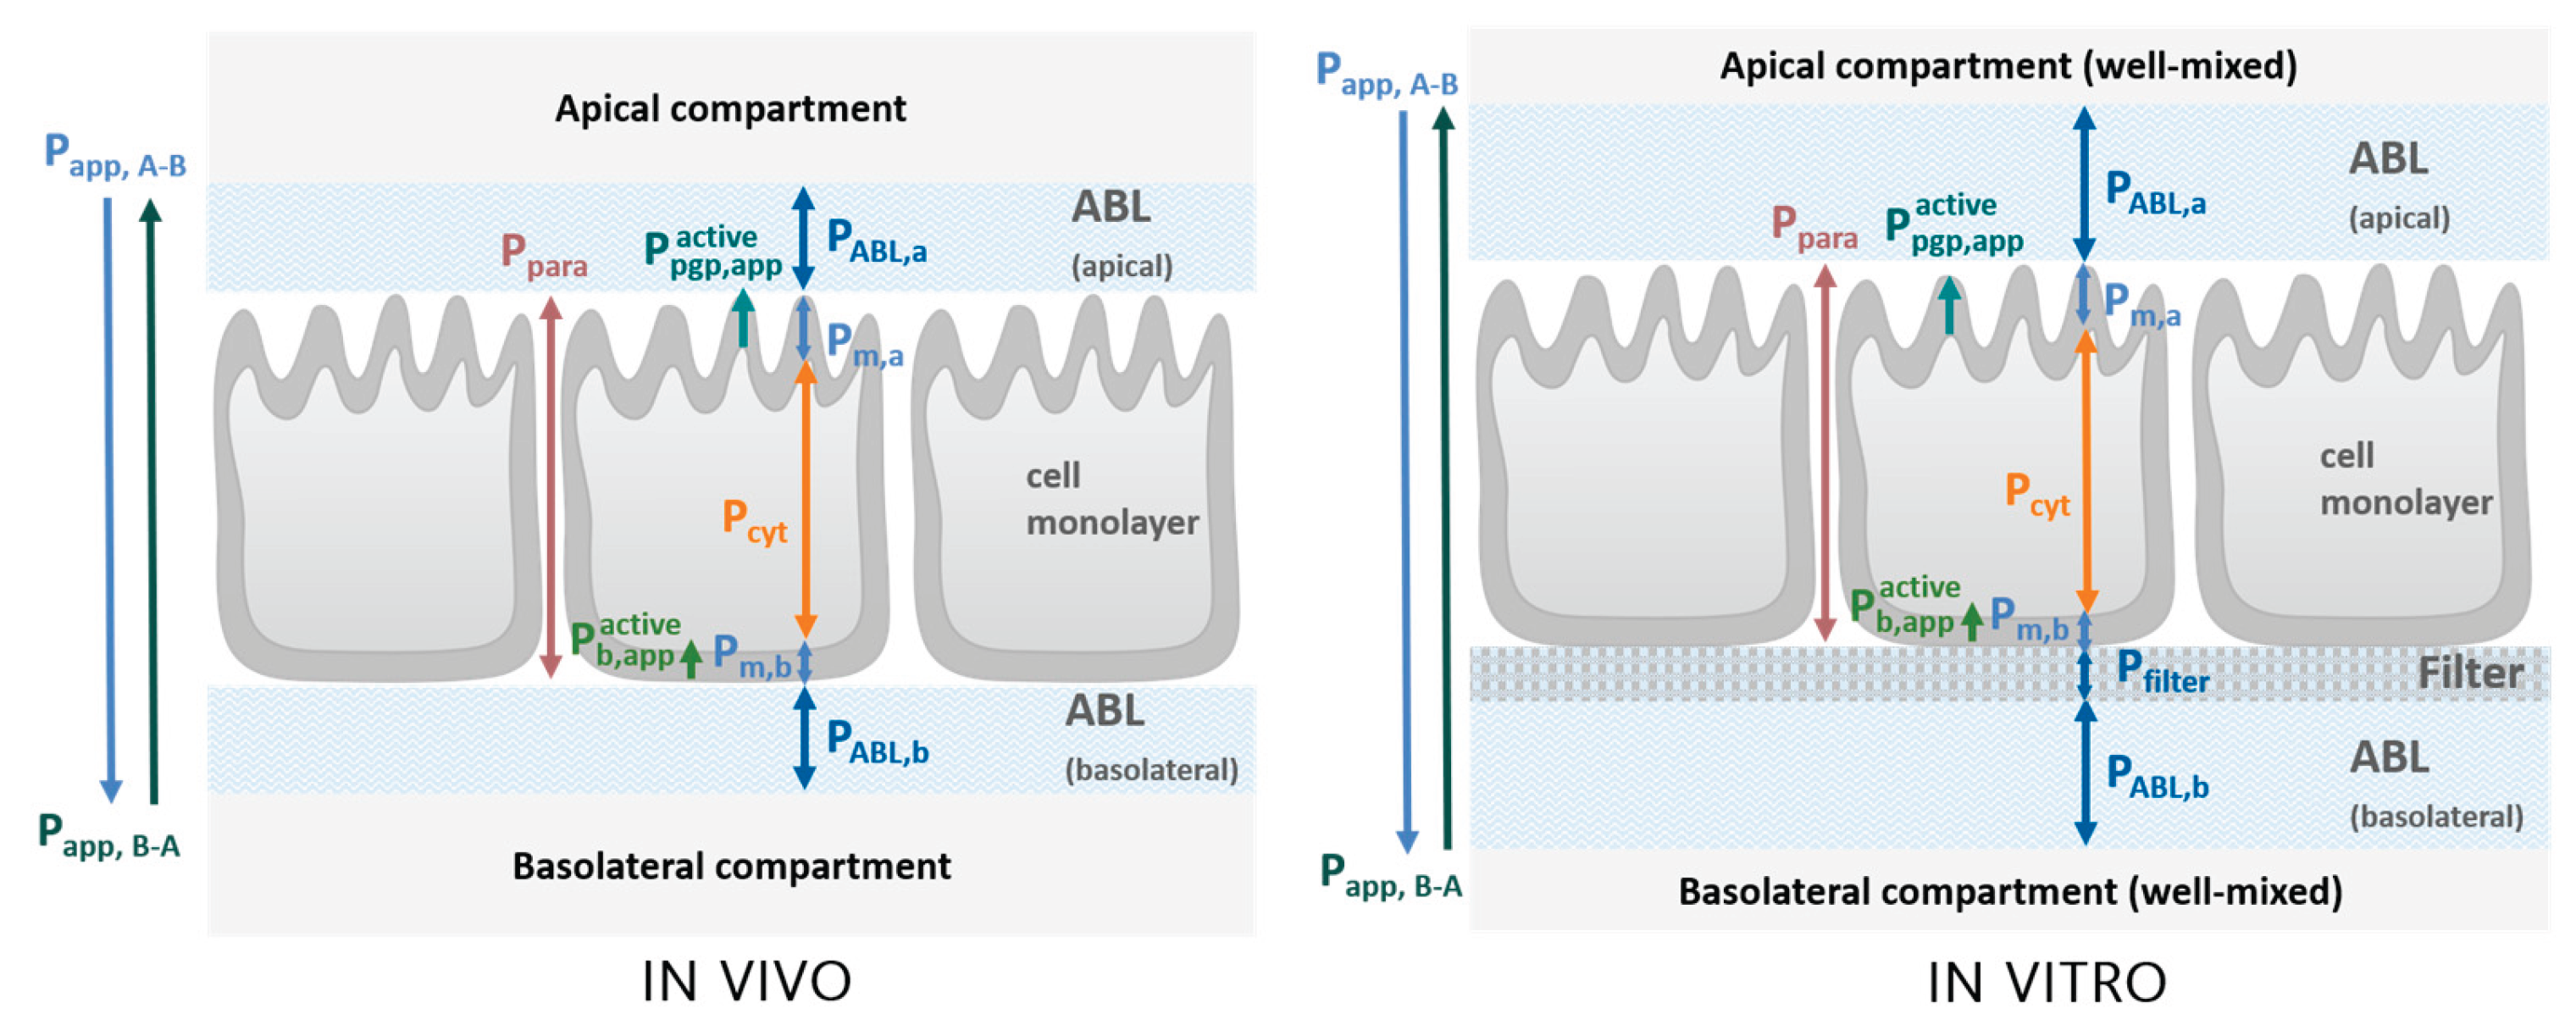
Figure 2.
ER and log(Pm*C) values of compounds shown to have significant (> 2.5) ER values as determined with MDCK assays. All ER values sourced from literature for MDCKII-MDR1, -BCRP and -MRP2 bidirectional assays. Experimental Pm values sourced from Ebert et al. (2024) and Ebert and Dahley (2024) were preferred. If no experimental Pm values were available, Pm was calculated with the Solubility Diffusion Model (SDM) using Khex/w values determined preferably from experimental descriptors if available, and calculated descriptors if not. For zwitterions and compounds with MW > 1000 g/mol, COSMOtherm was used to calculate Pm.
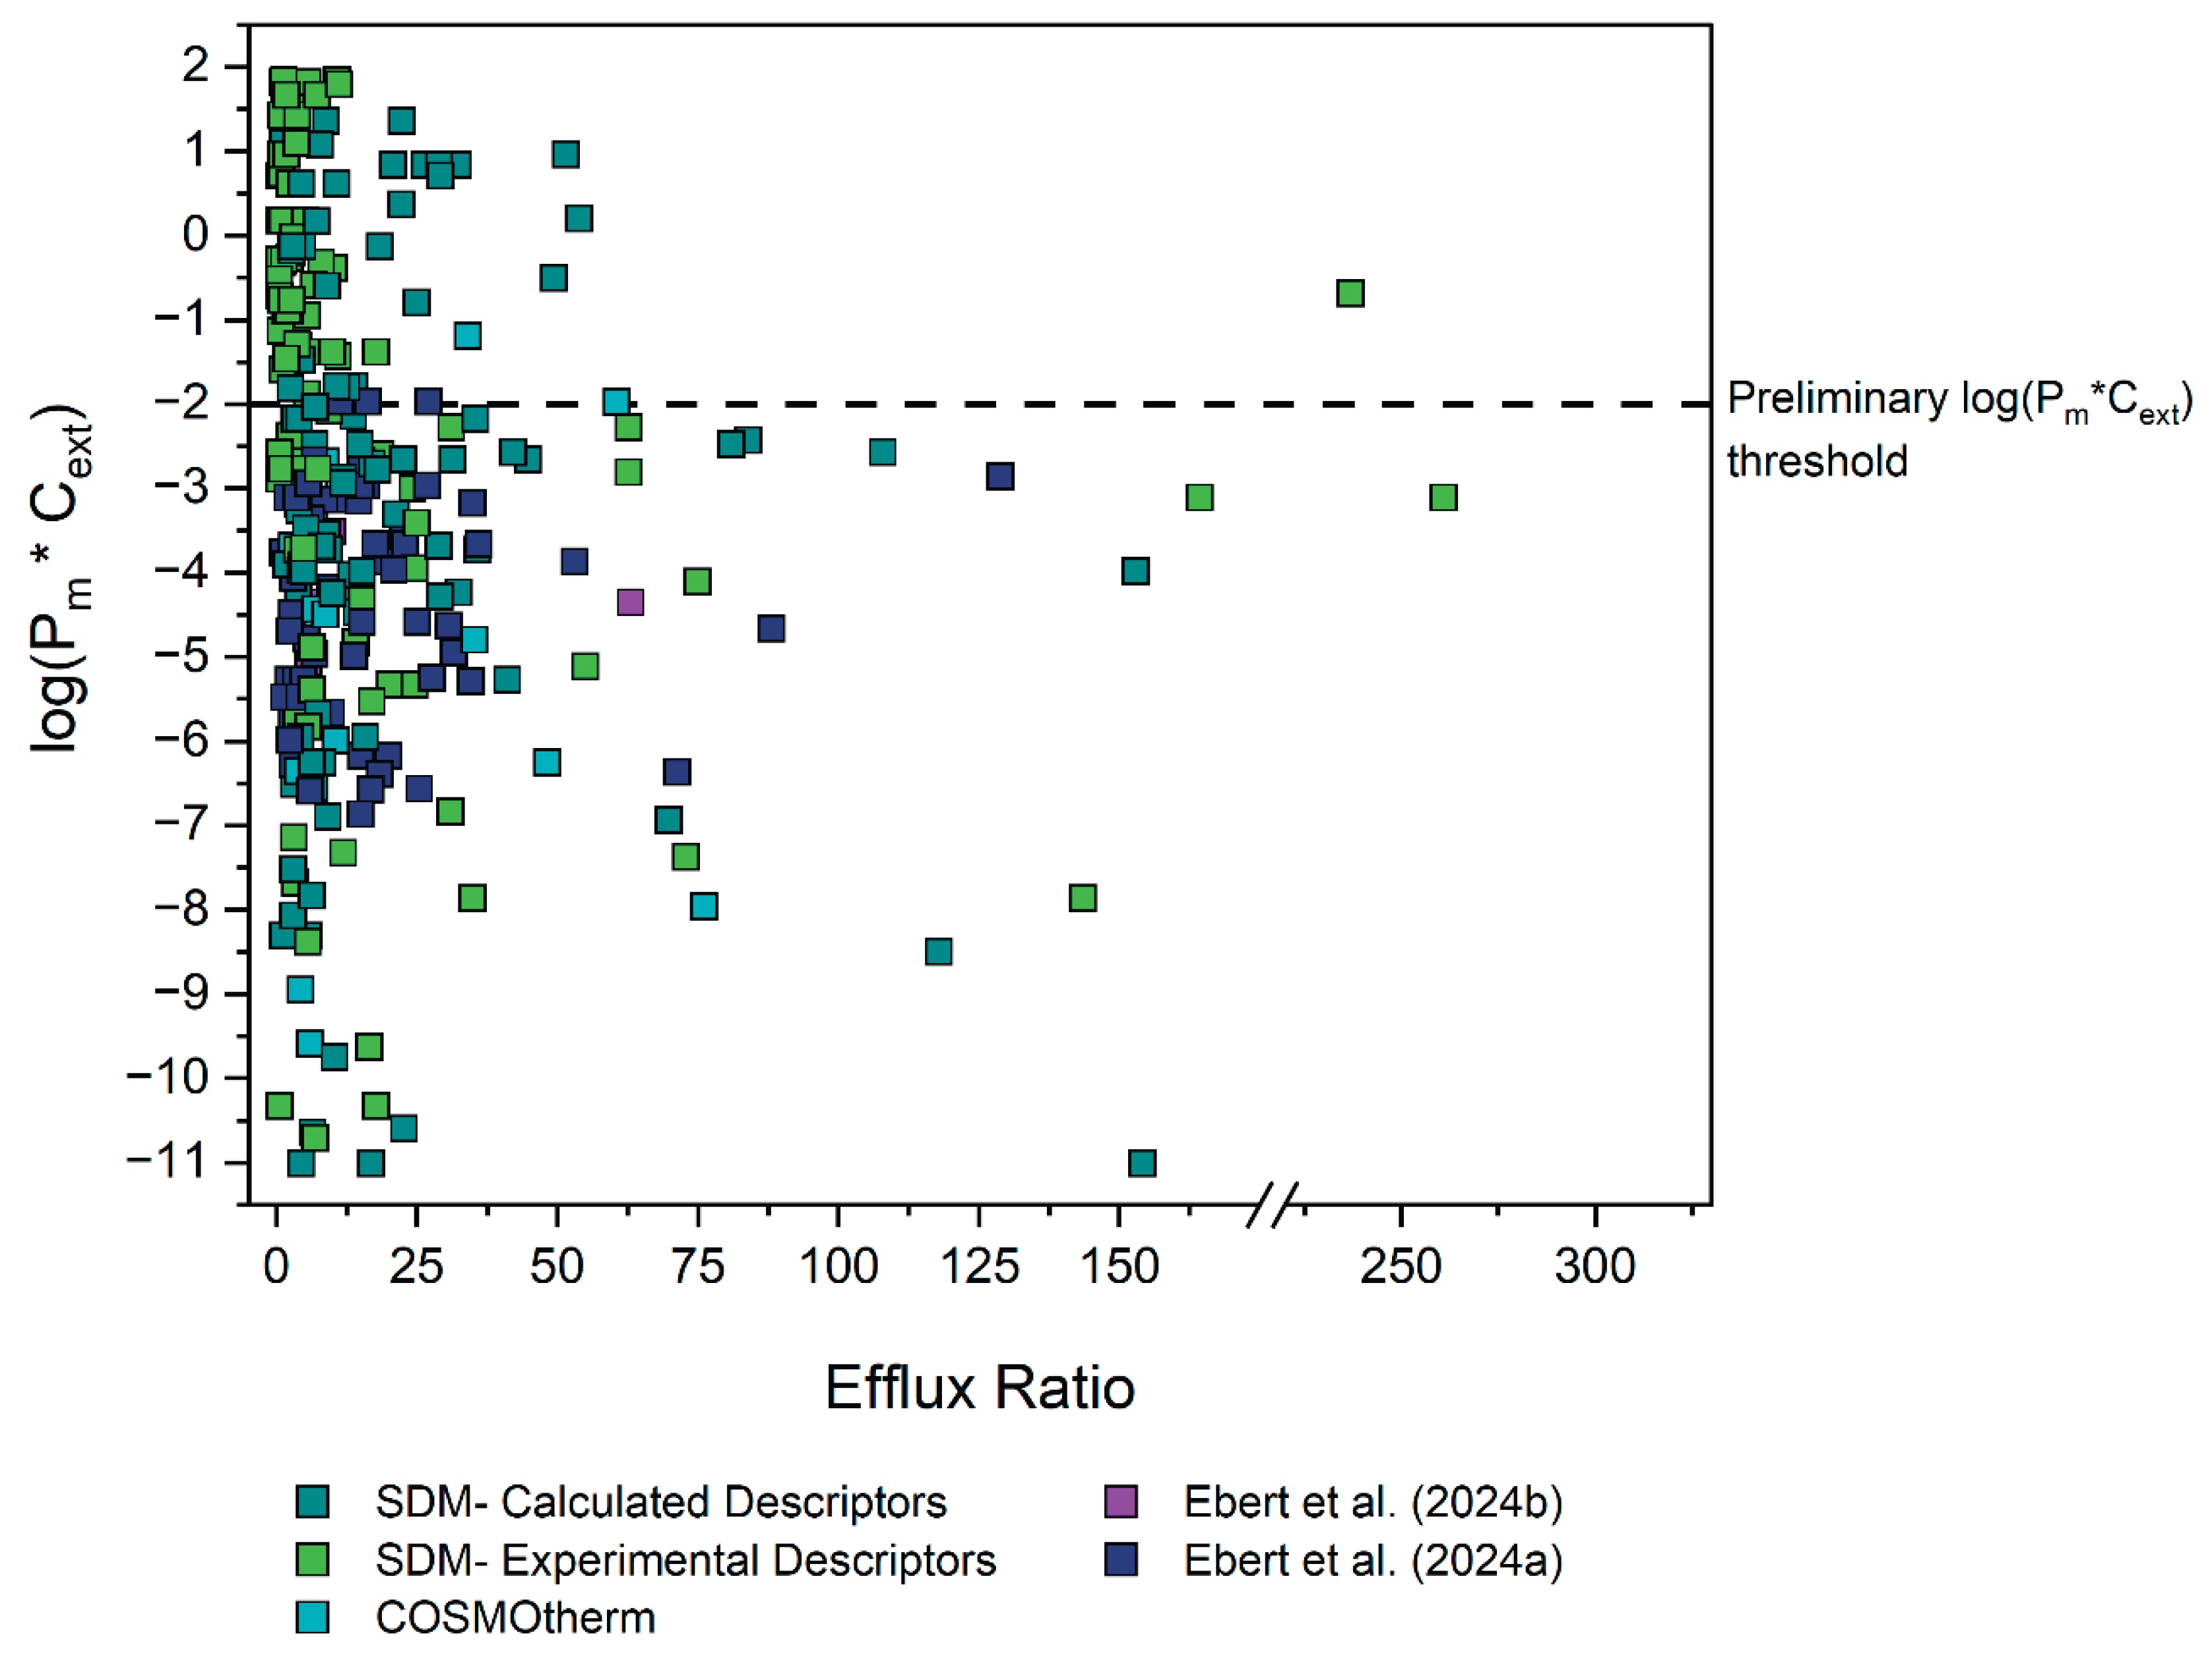
Figure 3.
Schematic depicting the methodical experimental investigation of outlier compounds based on the assumed reliability of Pm values. All outlier compounds had Pm values determined from predicted Khex/w values. If the Khex/w was determined from experimental descriptors (reliable Pm values), MDCK assays would preferentially be performed to confirm the reported ER. If the Khex/w was determined from calculated descriptors (unreliable Pm values), HDM-PAMPA was preferentially performed to determine a reliable Pm based on experimental Khex/w values.
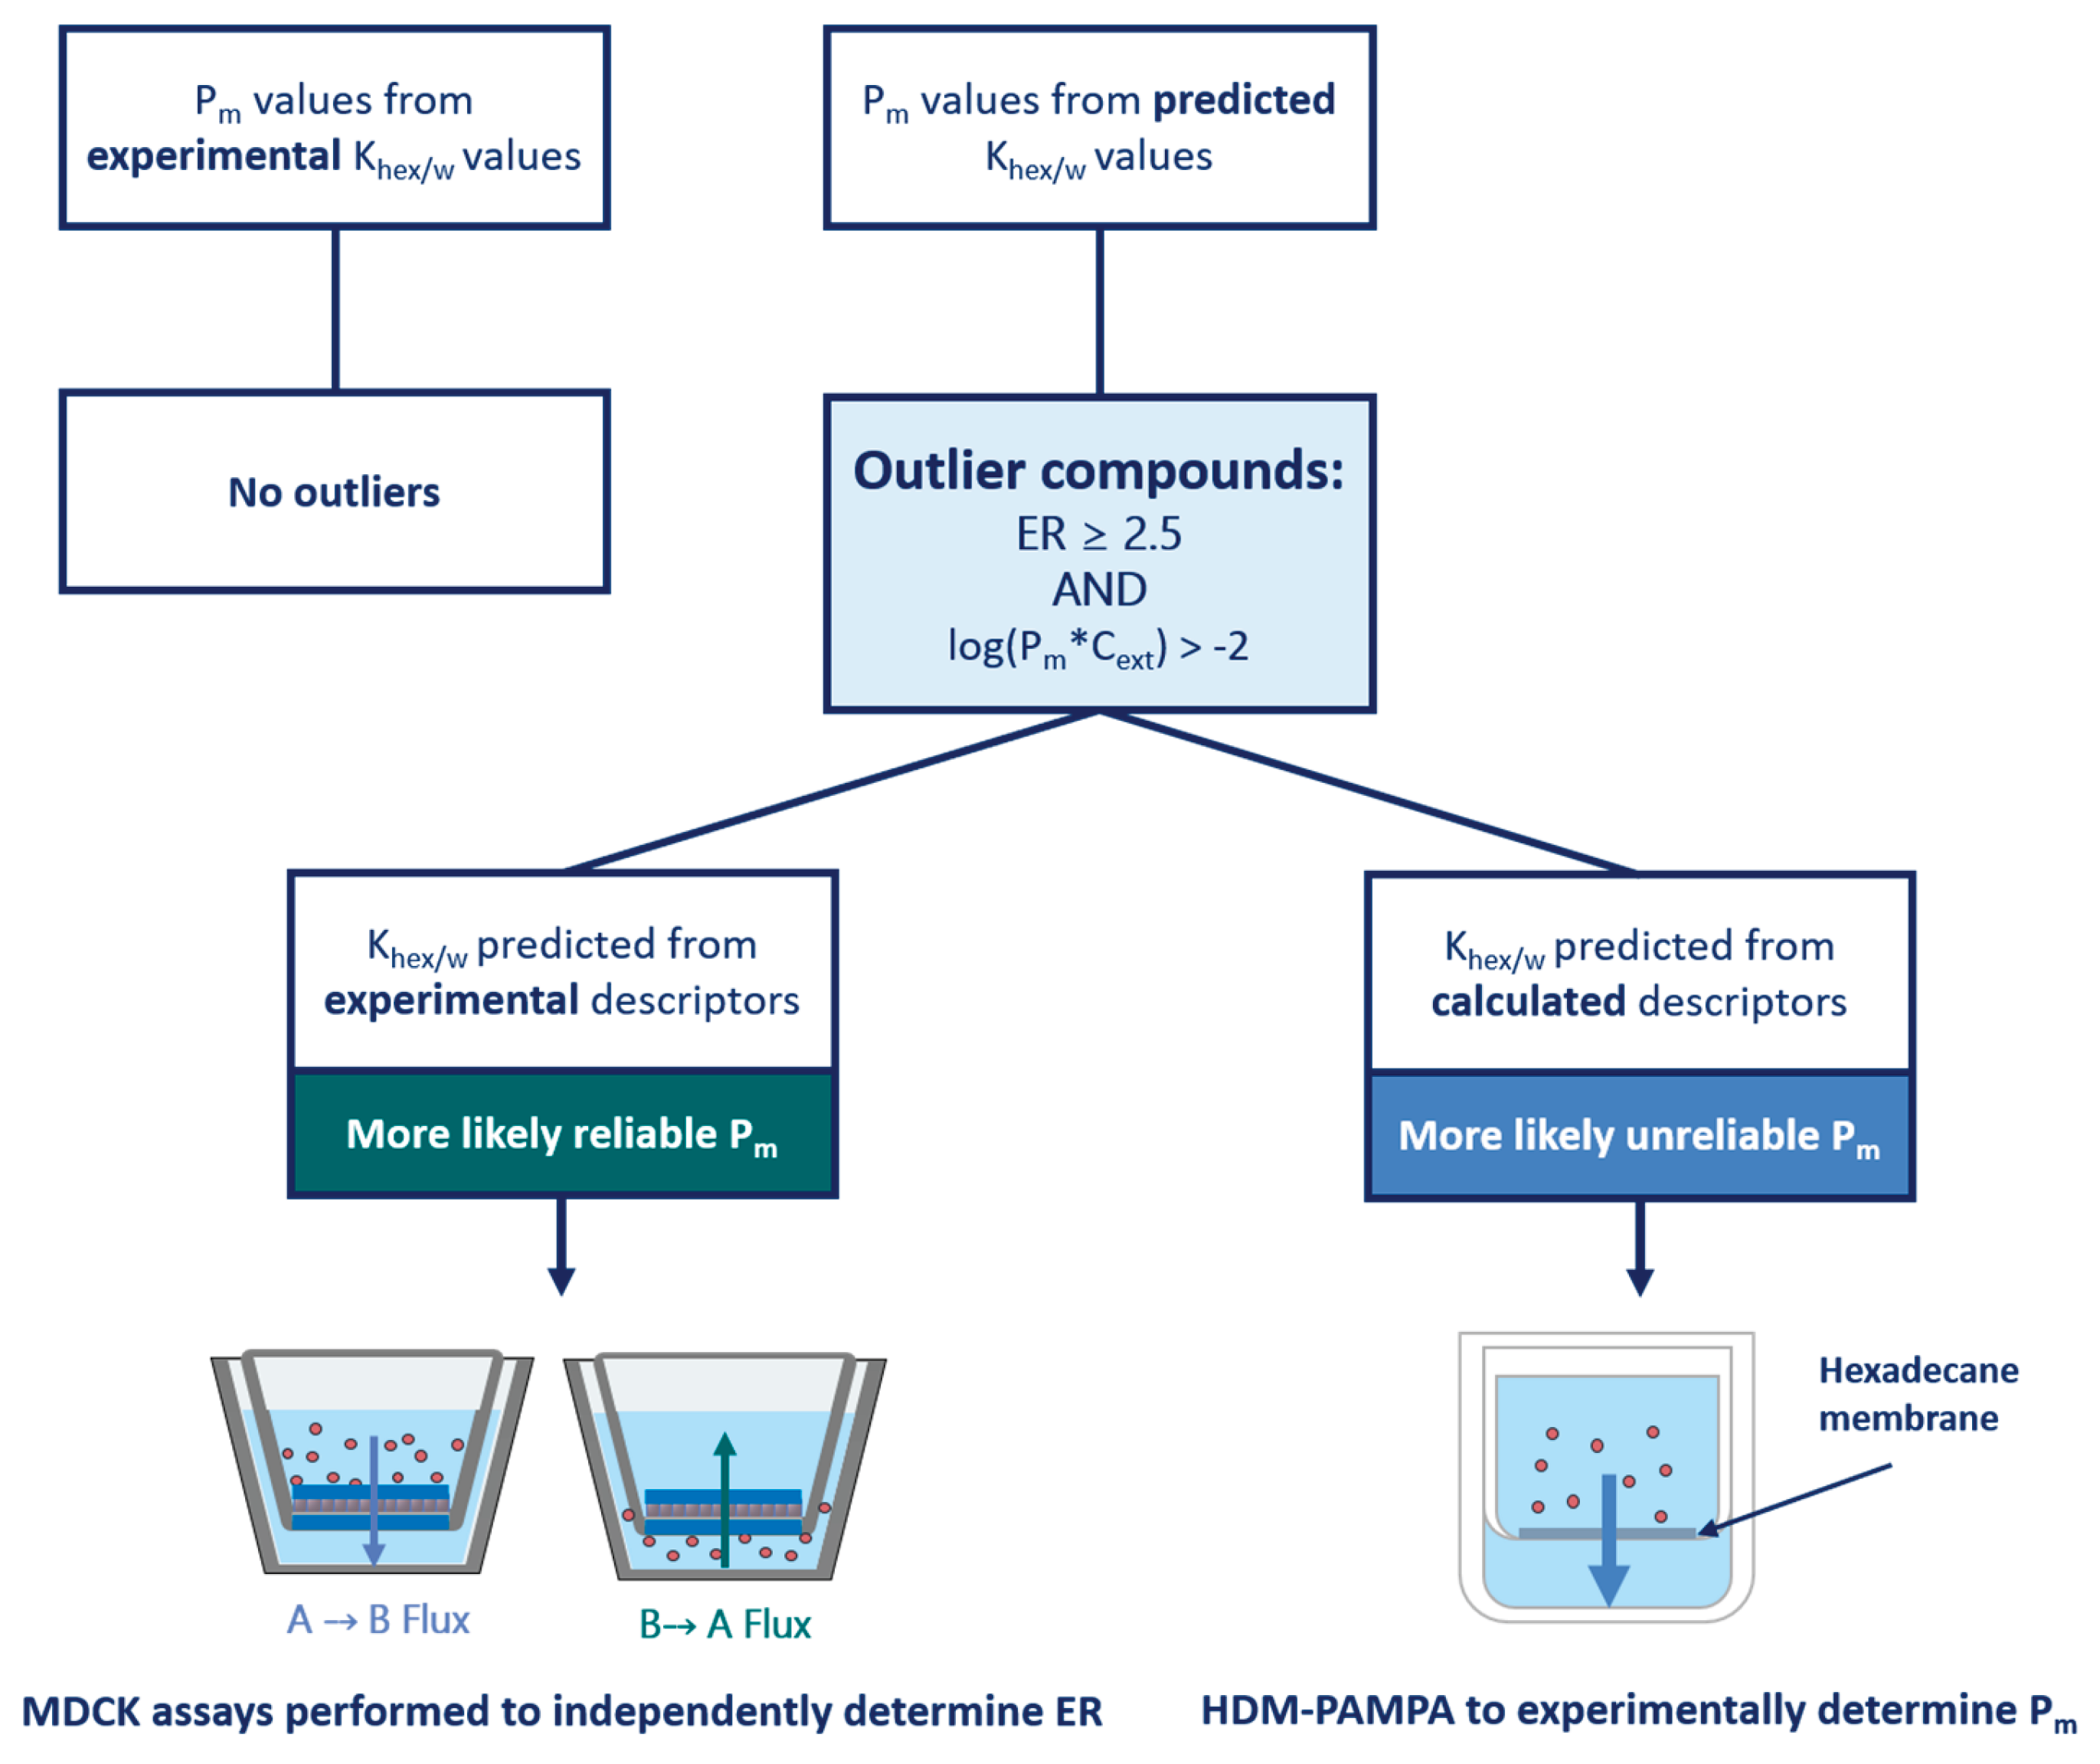
Figure 4.
Diagram illustrating the classification and processing of 294 efflux ratios (136 unique compounds) from MDR1, BCRP, and MRP2 transporter datasets. Some compounds were excluded due to having a permanent charge, or for exhibiting solubility stability issues. Outliers were identified and investigated with MDCK or HDM-PAMPA assays, or by other means. As is evident, the vast majority of outliers were reclassified and found to conform to the energy limitation theory, as 90% of the data supports the existence of a membrane permeability cut-of value for compounds exhibiting significant efflux.
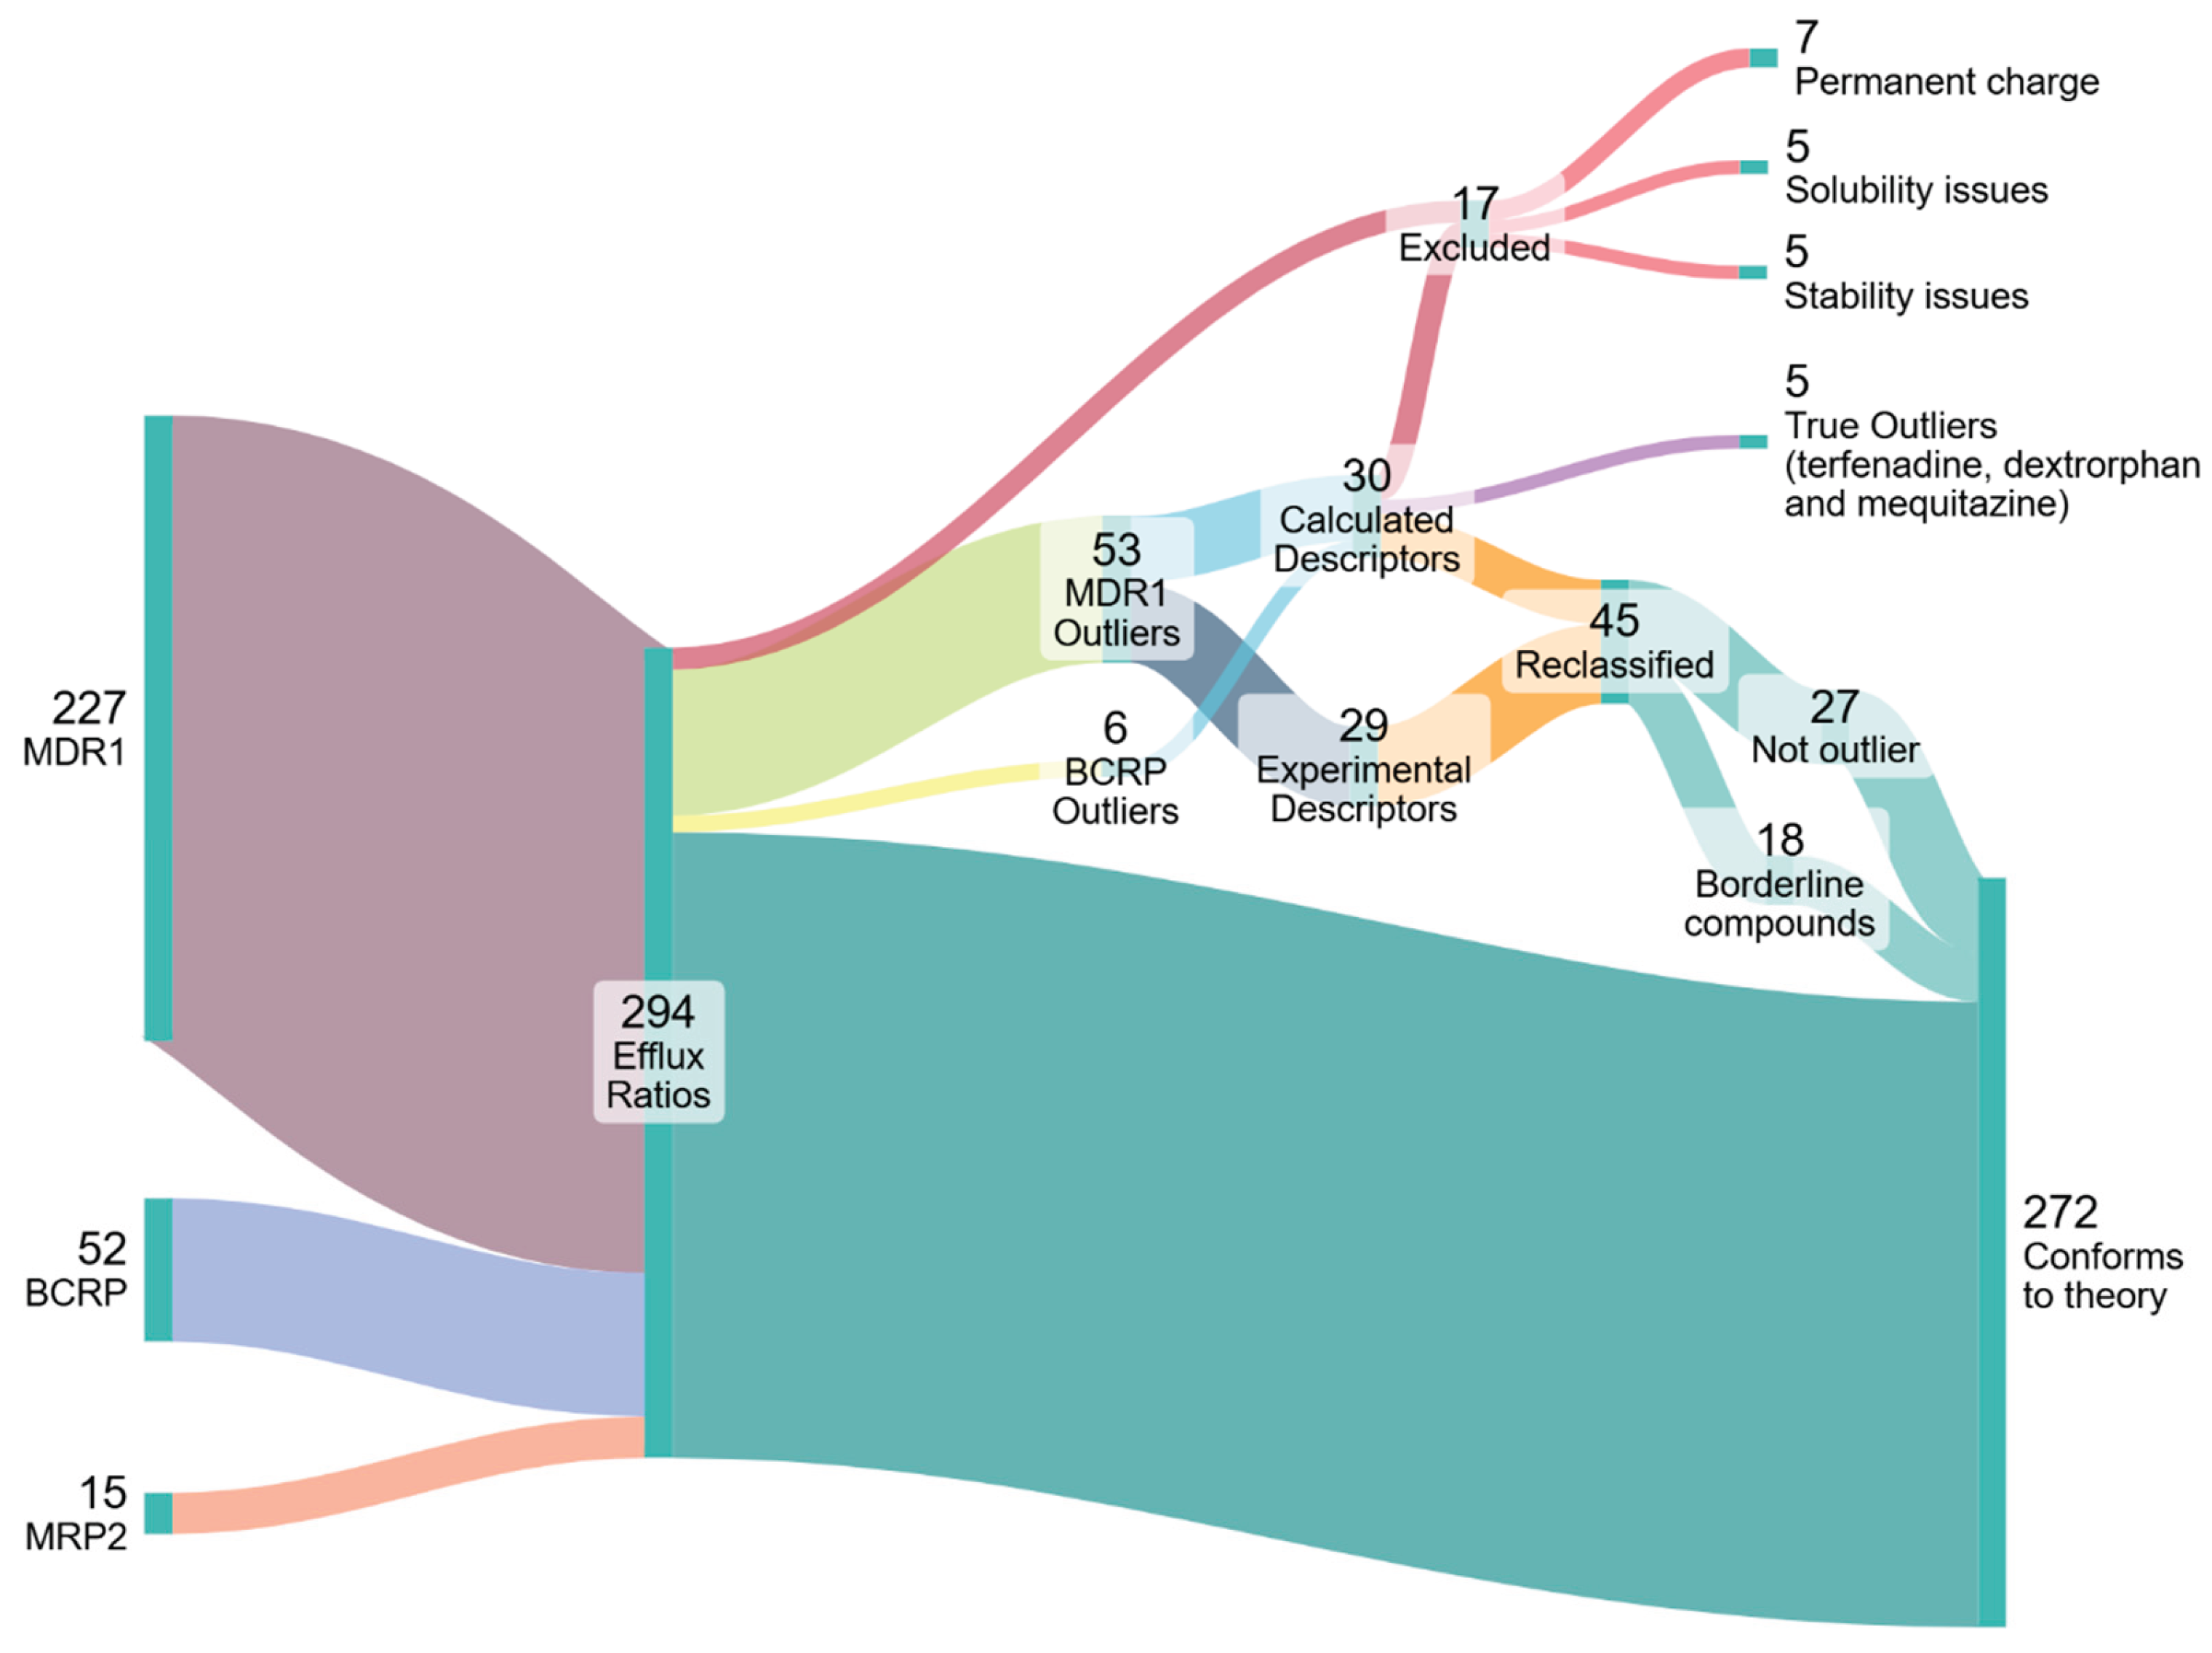
Figure 5.
ER vs external concentration for the borderline compound amprenavir (top), compared to the low Pm compound acebutolol (bottom). For borderline compounds, the ER decreases with increasing concentration. For the low Pm compound, the ER stays constant even at high external concentrations.
Figure 5.
ER vs external concentration for the borderline compound amprenavir (top), compared to the low Pm compound acebutolol (bottom). For borderline compounds, the ER decreases with increasing concentration. For the low Pm compound, the ER stays constant even at high external concentrations.
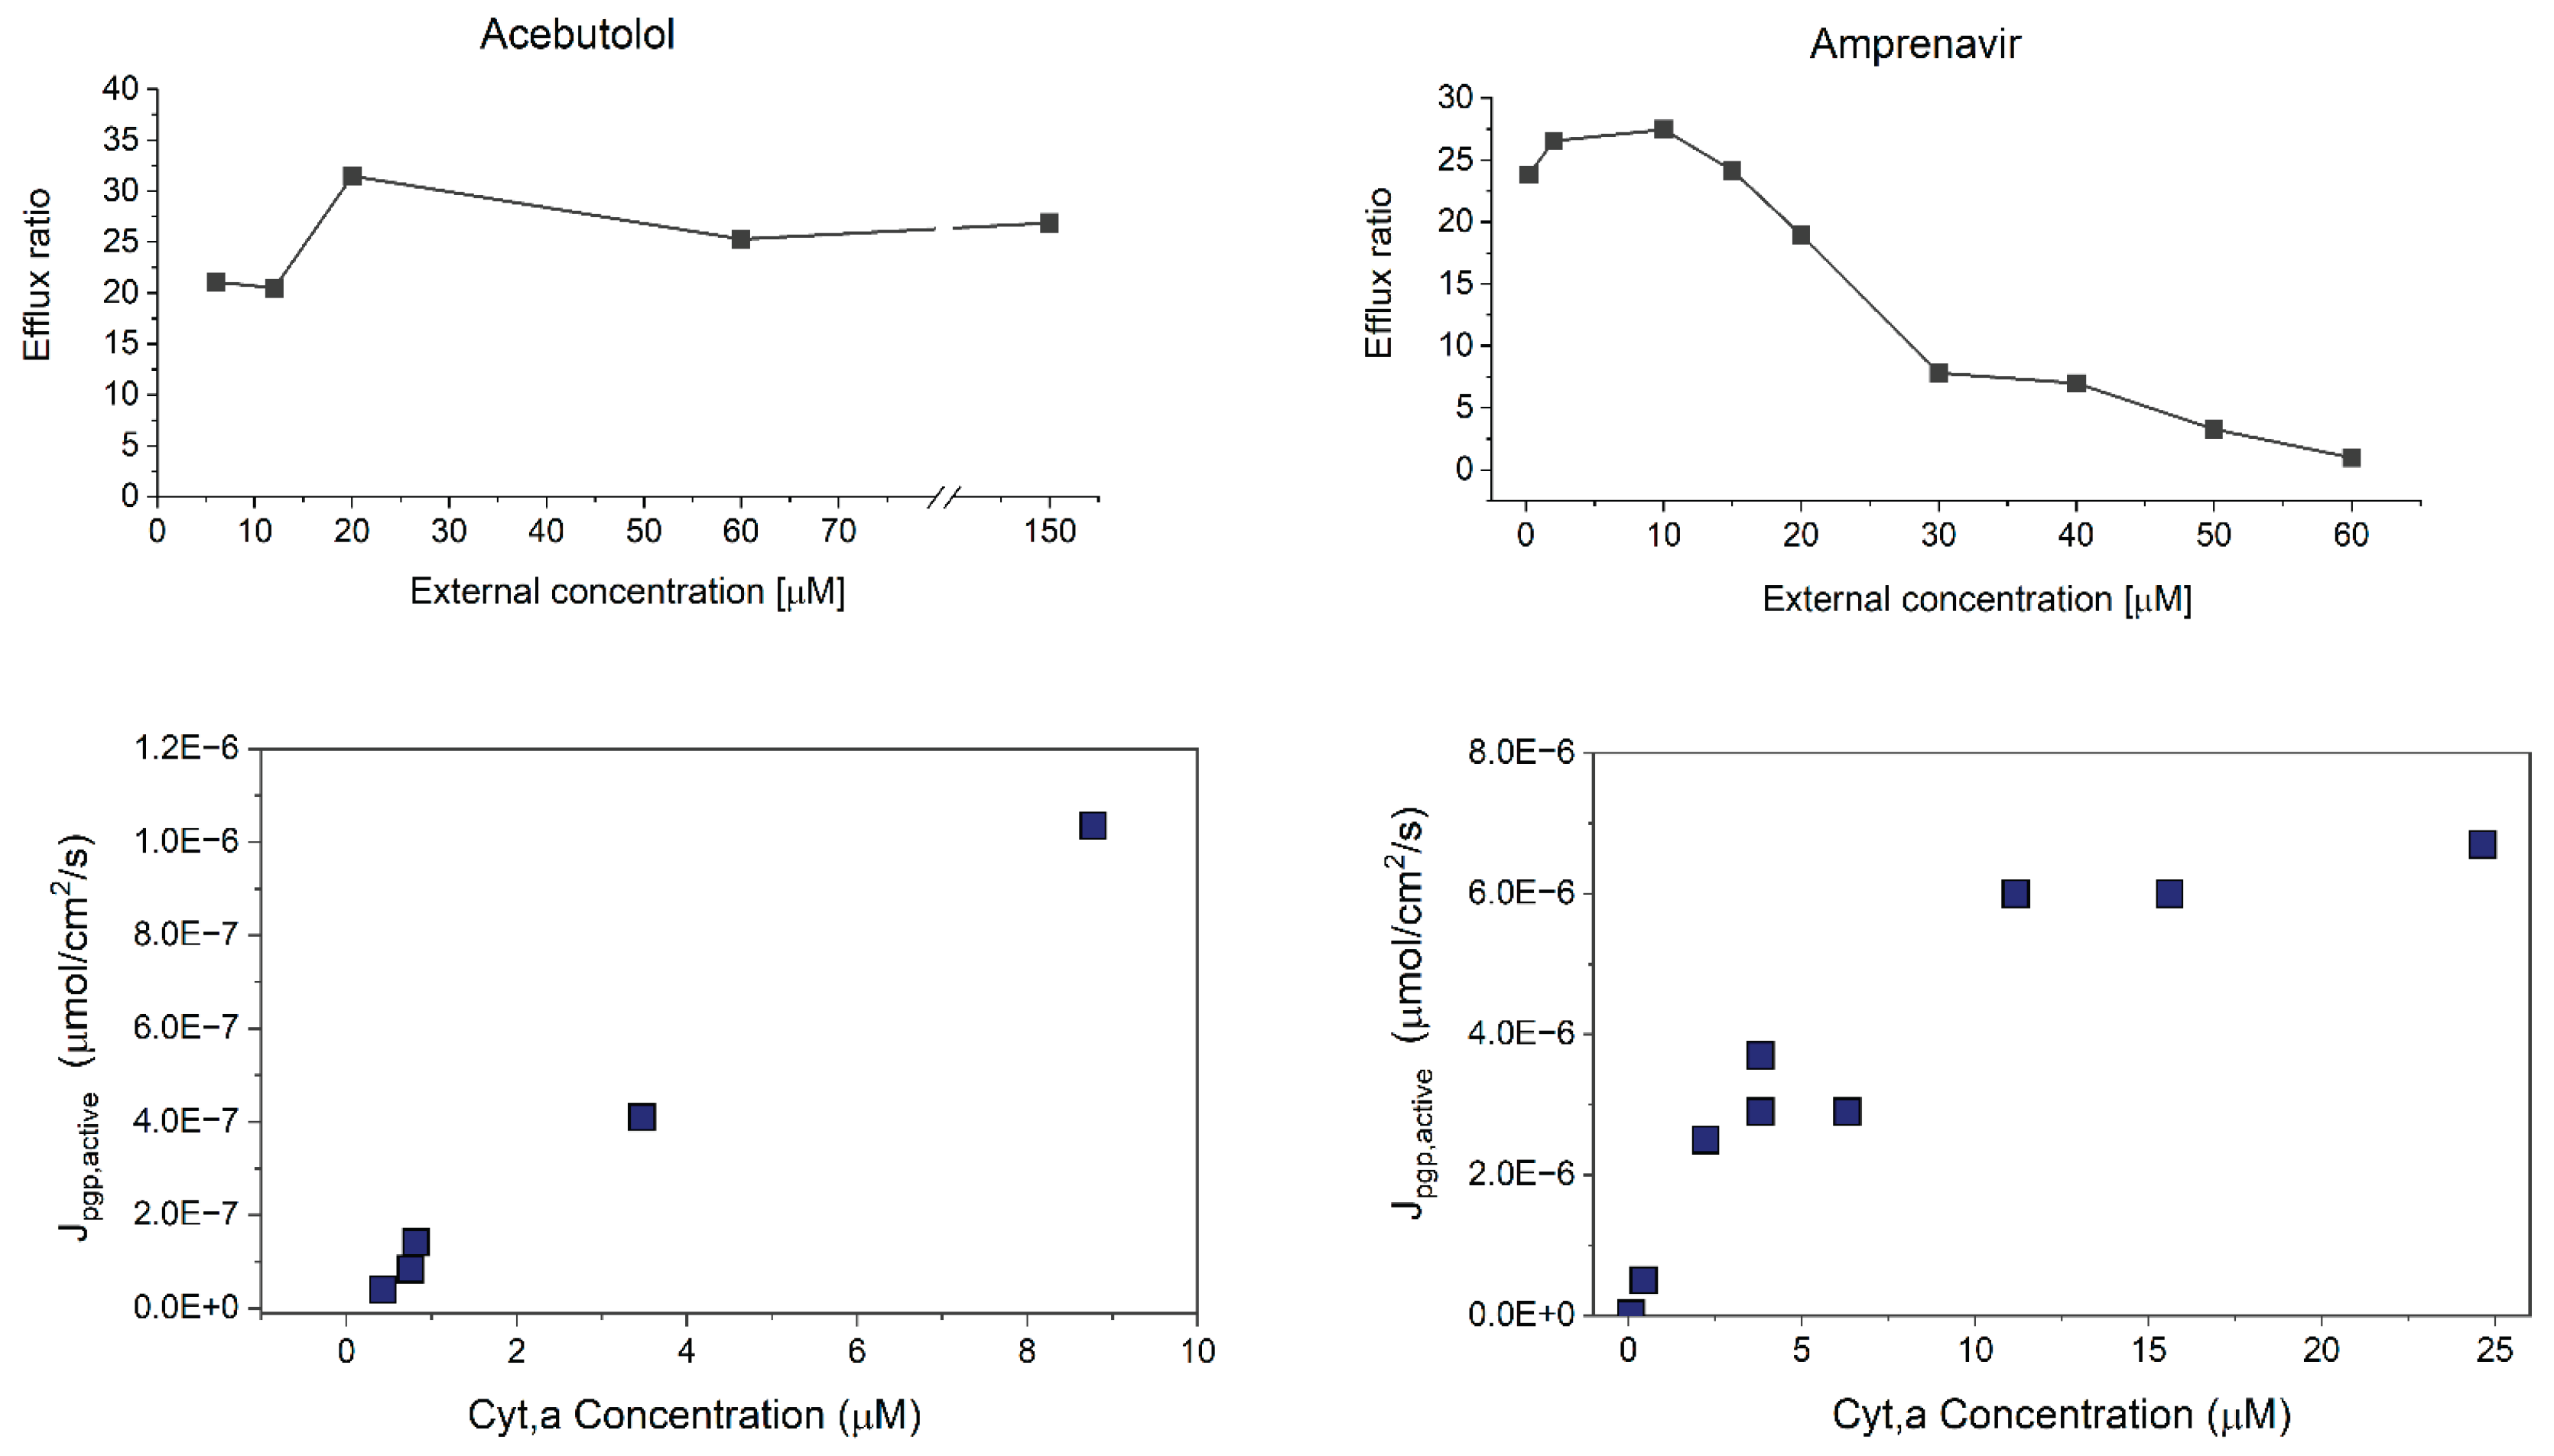
Figure 6.
Non-linear Michaelis-Menten fits for borderline compounds exhibiting the maximal flux (Jpgp, active) plateau. Markers indicate concentration dependent calculated Jpgp,active values, determined from fitted P-gp activity values based on MDCK assays. For the compound quinidine (C), the unfilled marker was not included in the fit.
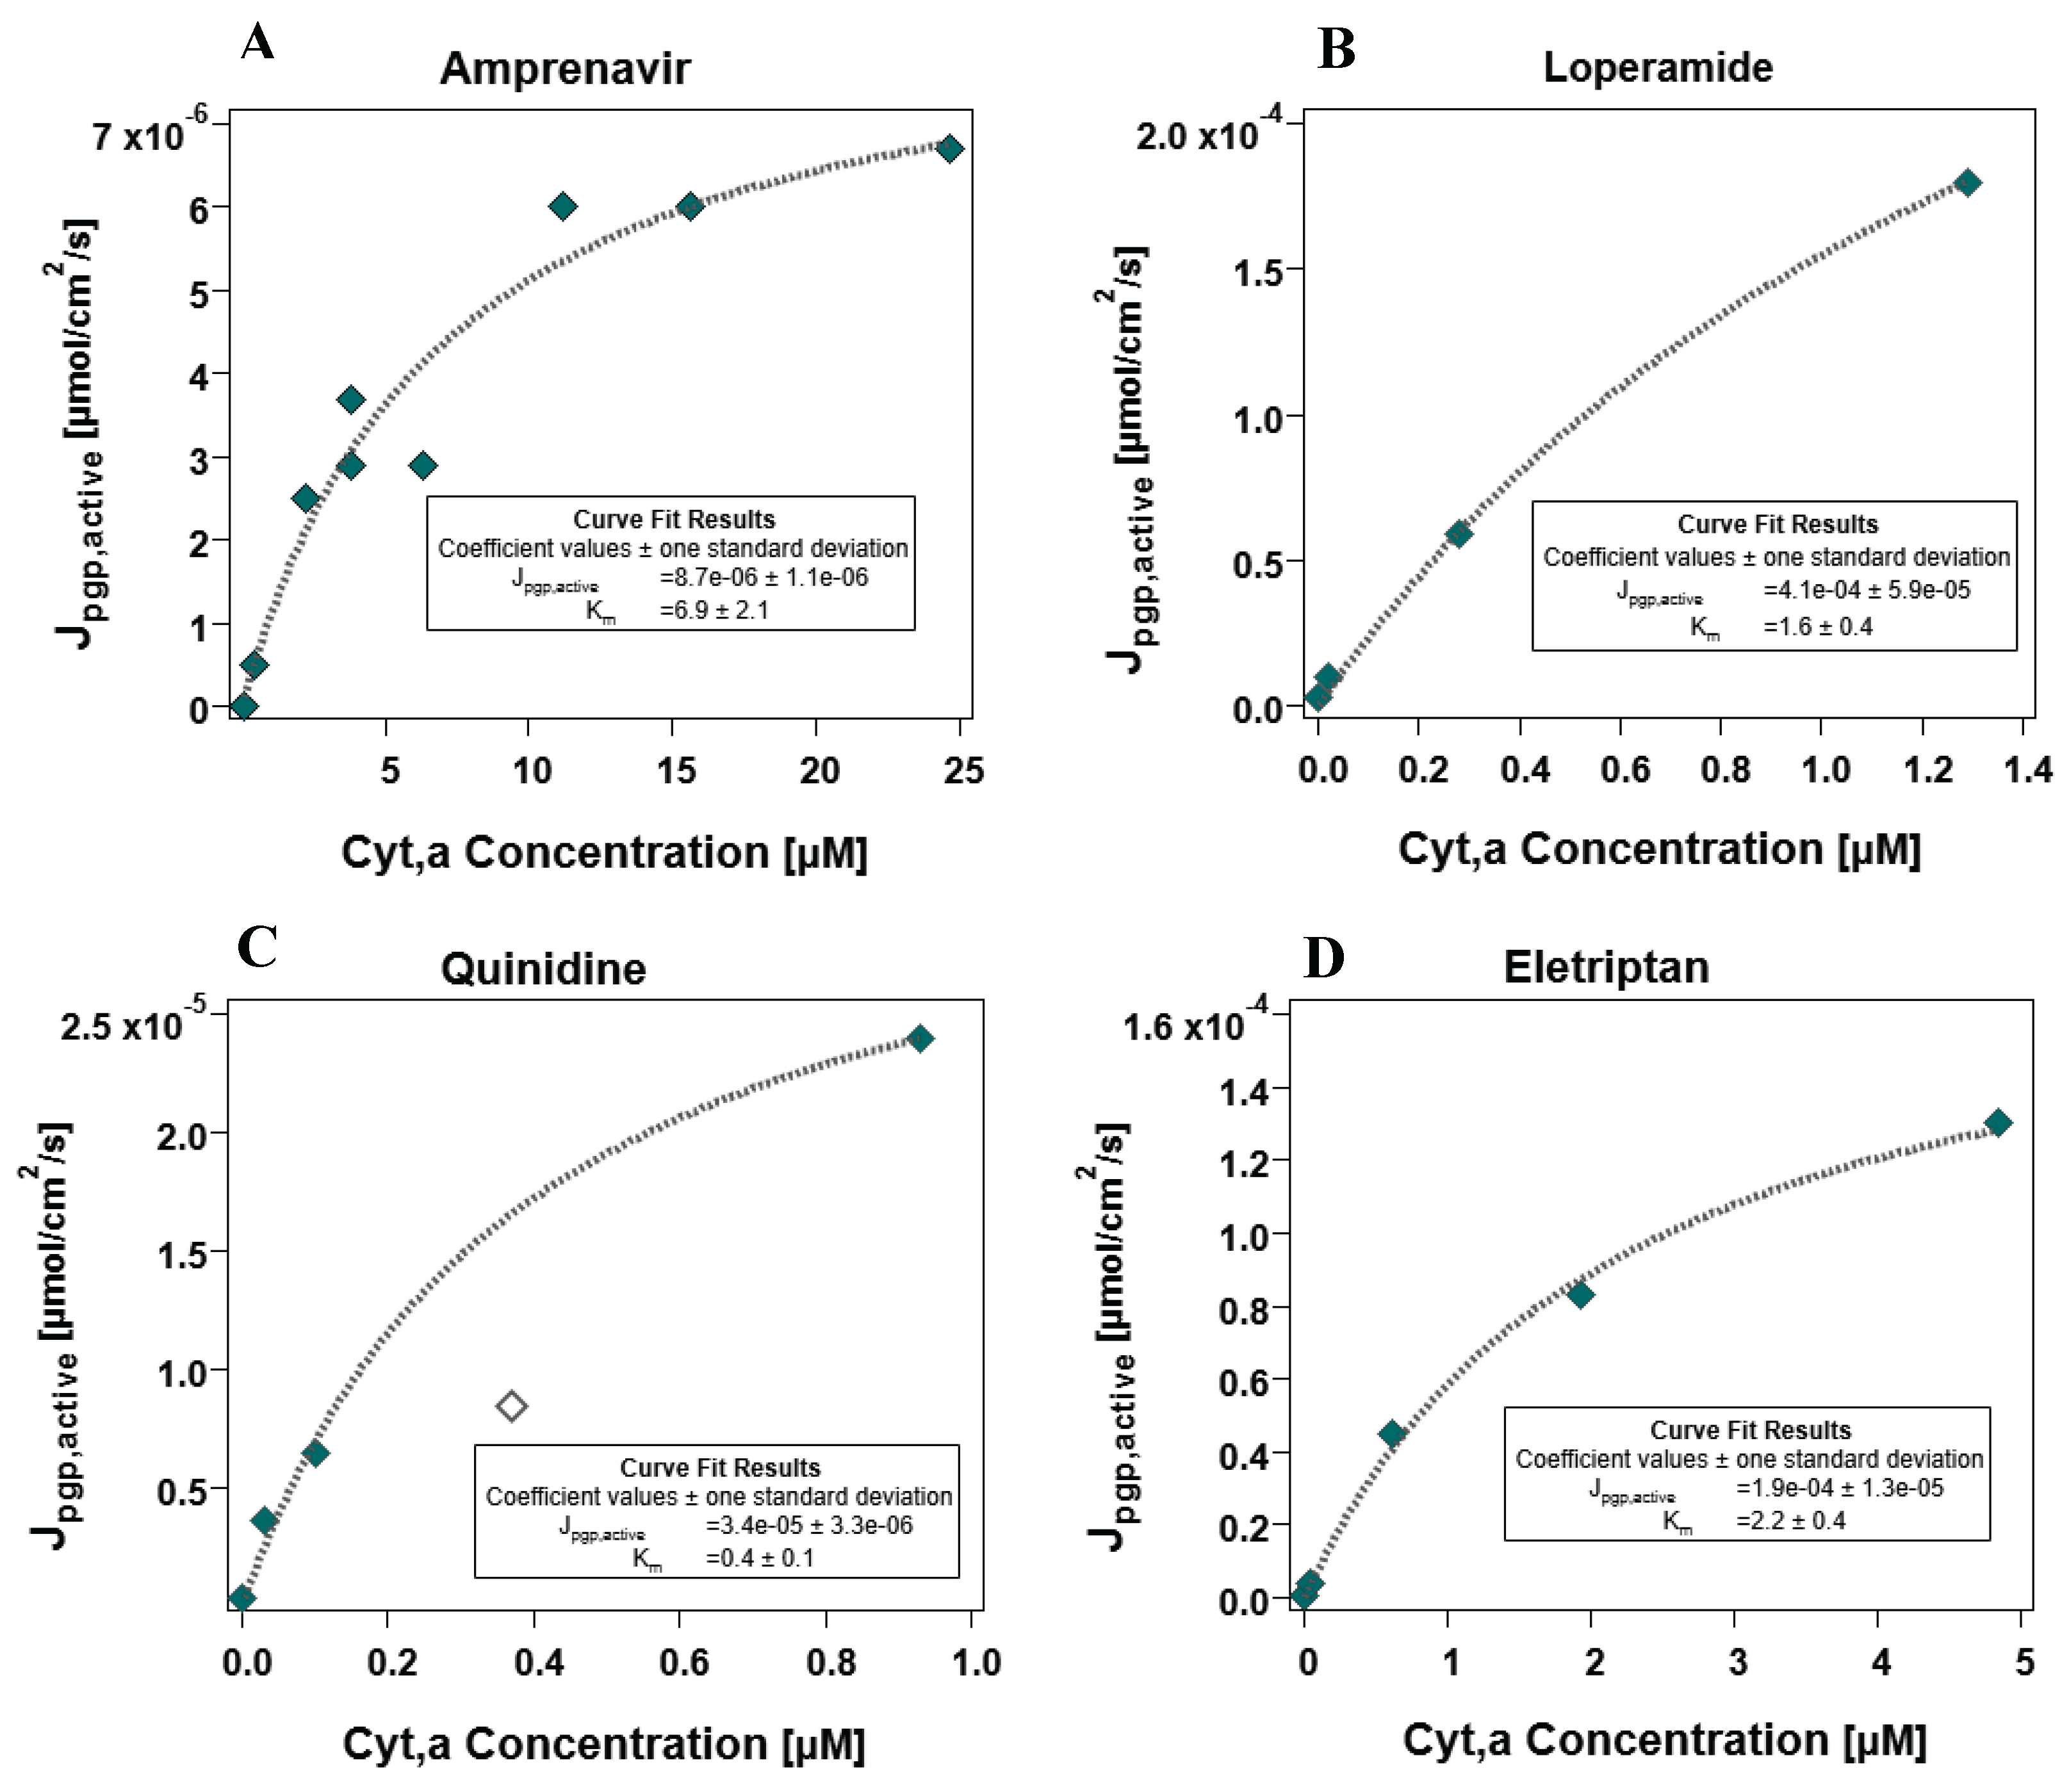
Figure 7.
The Pm*Cext threshold associated with the maximal Jpgp,active value of 1.6 x 10⁻⁴ μmol/cm2/s as a function of ER values. The threshold lies at a value of log(Pm*Cext) = -1.7.
Figure 7.
The Pm*Cext threshold associated with the maximal Jpgp,active value of 1.6 x 10⁻⁴ μmol/cm2/s as a function of ER values. The threshold lies at a value of log(Pm*Cext) = -1.7.
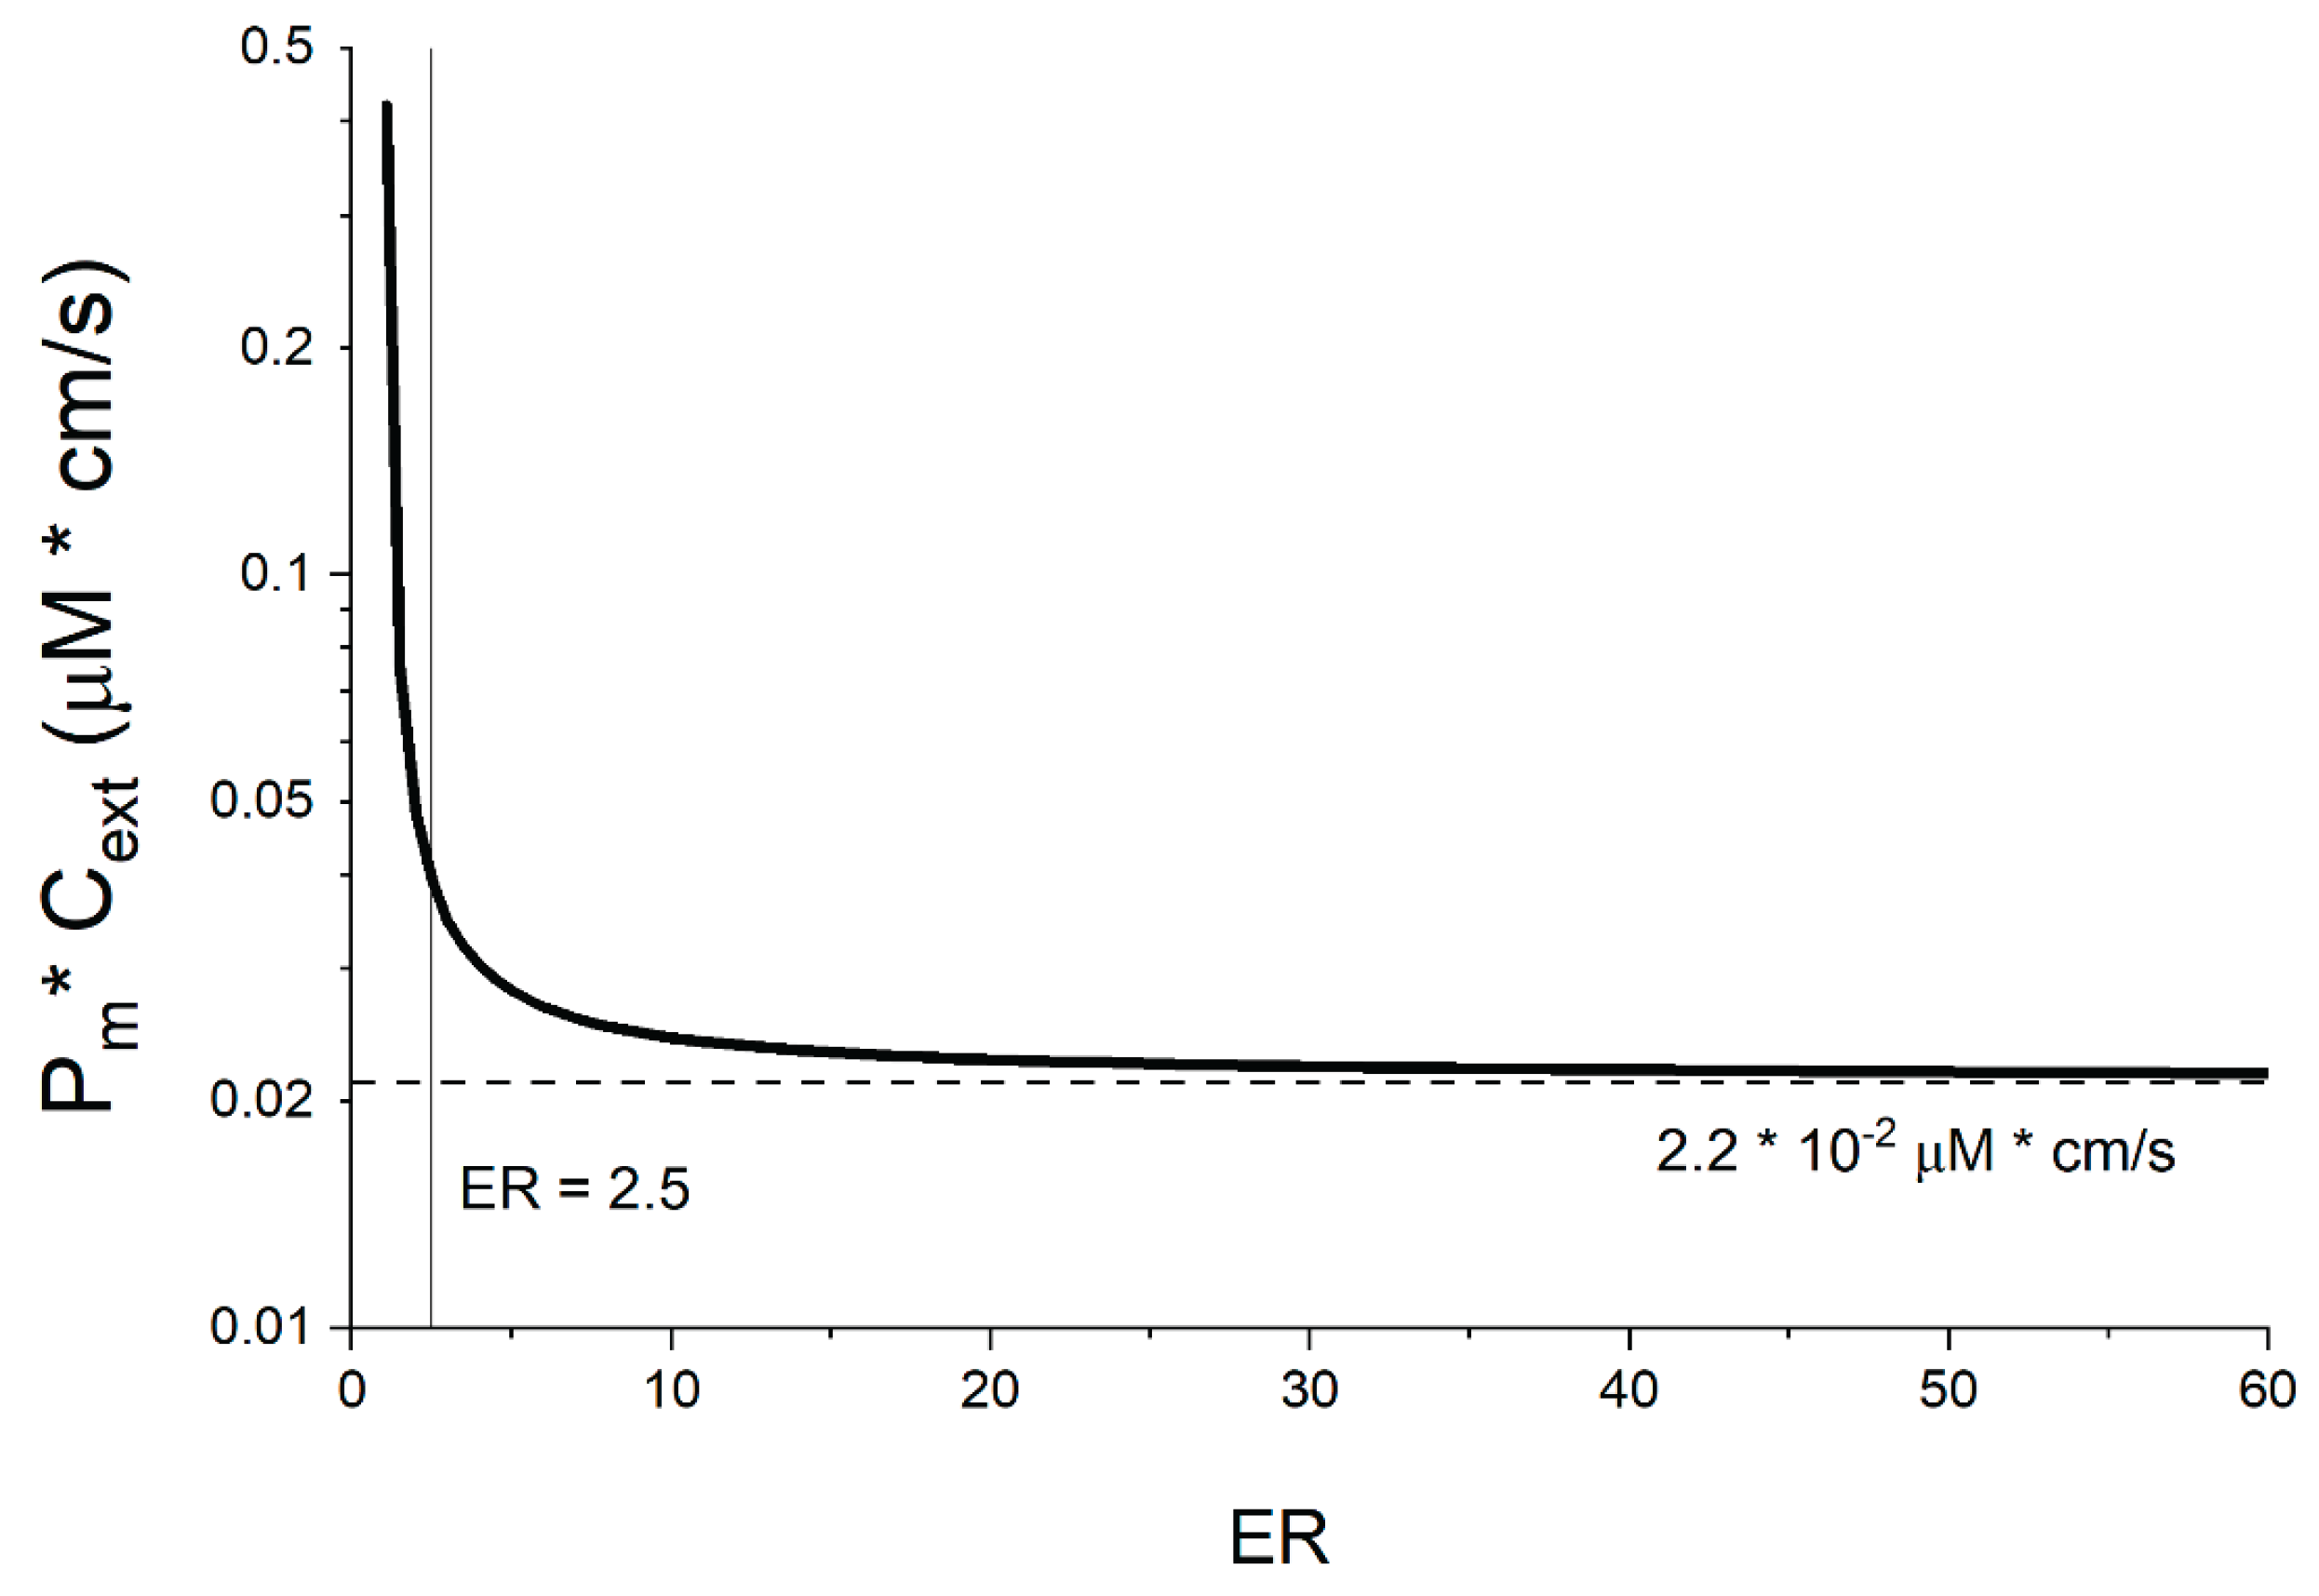
Figure 8.
Combined data from the P-gp, BCRP and MRP2 datasets log(Pm*Cext) vs ER with re-evaluated data. The log(Pm *Cext) threshold for the MDCKII-MDR1 cells was found to lie at -1.7. Aside from the three indicated outlier compounds, no compounds with a permeability above 2.2 x 10⁻² cm/s were found to be significantly effluxed. The efflux of borderline compounds is highly dependent on concentration.
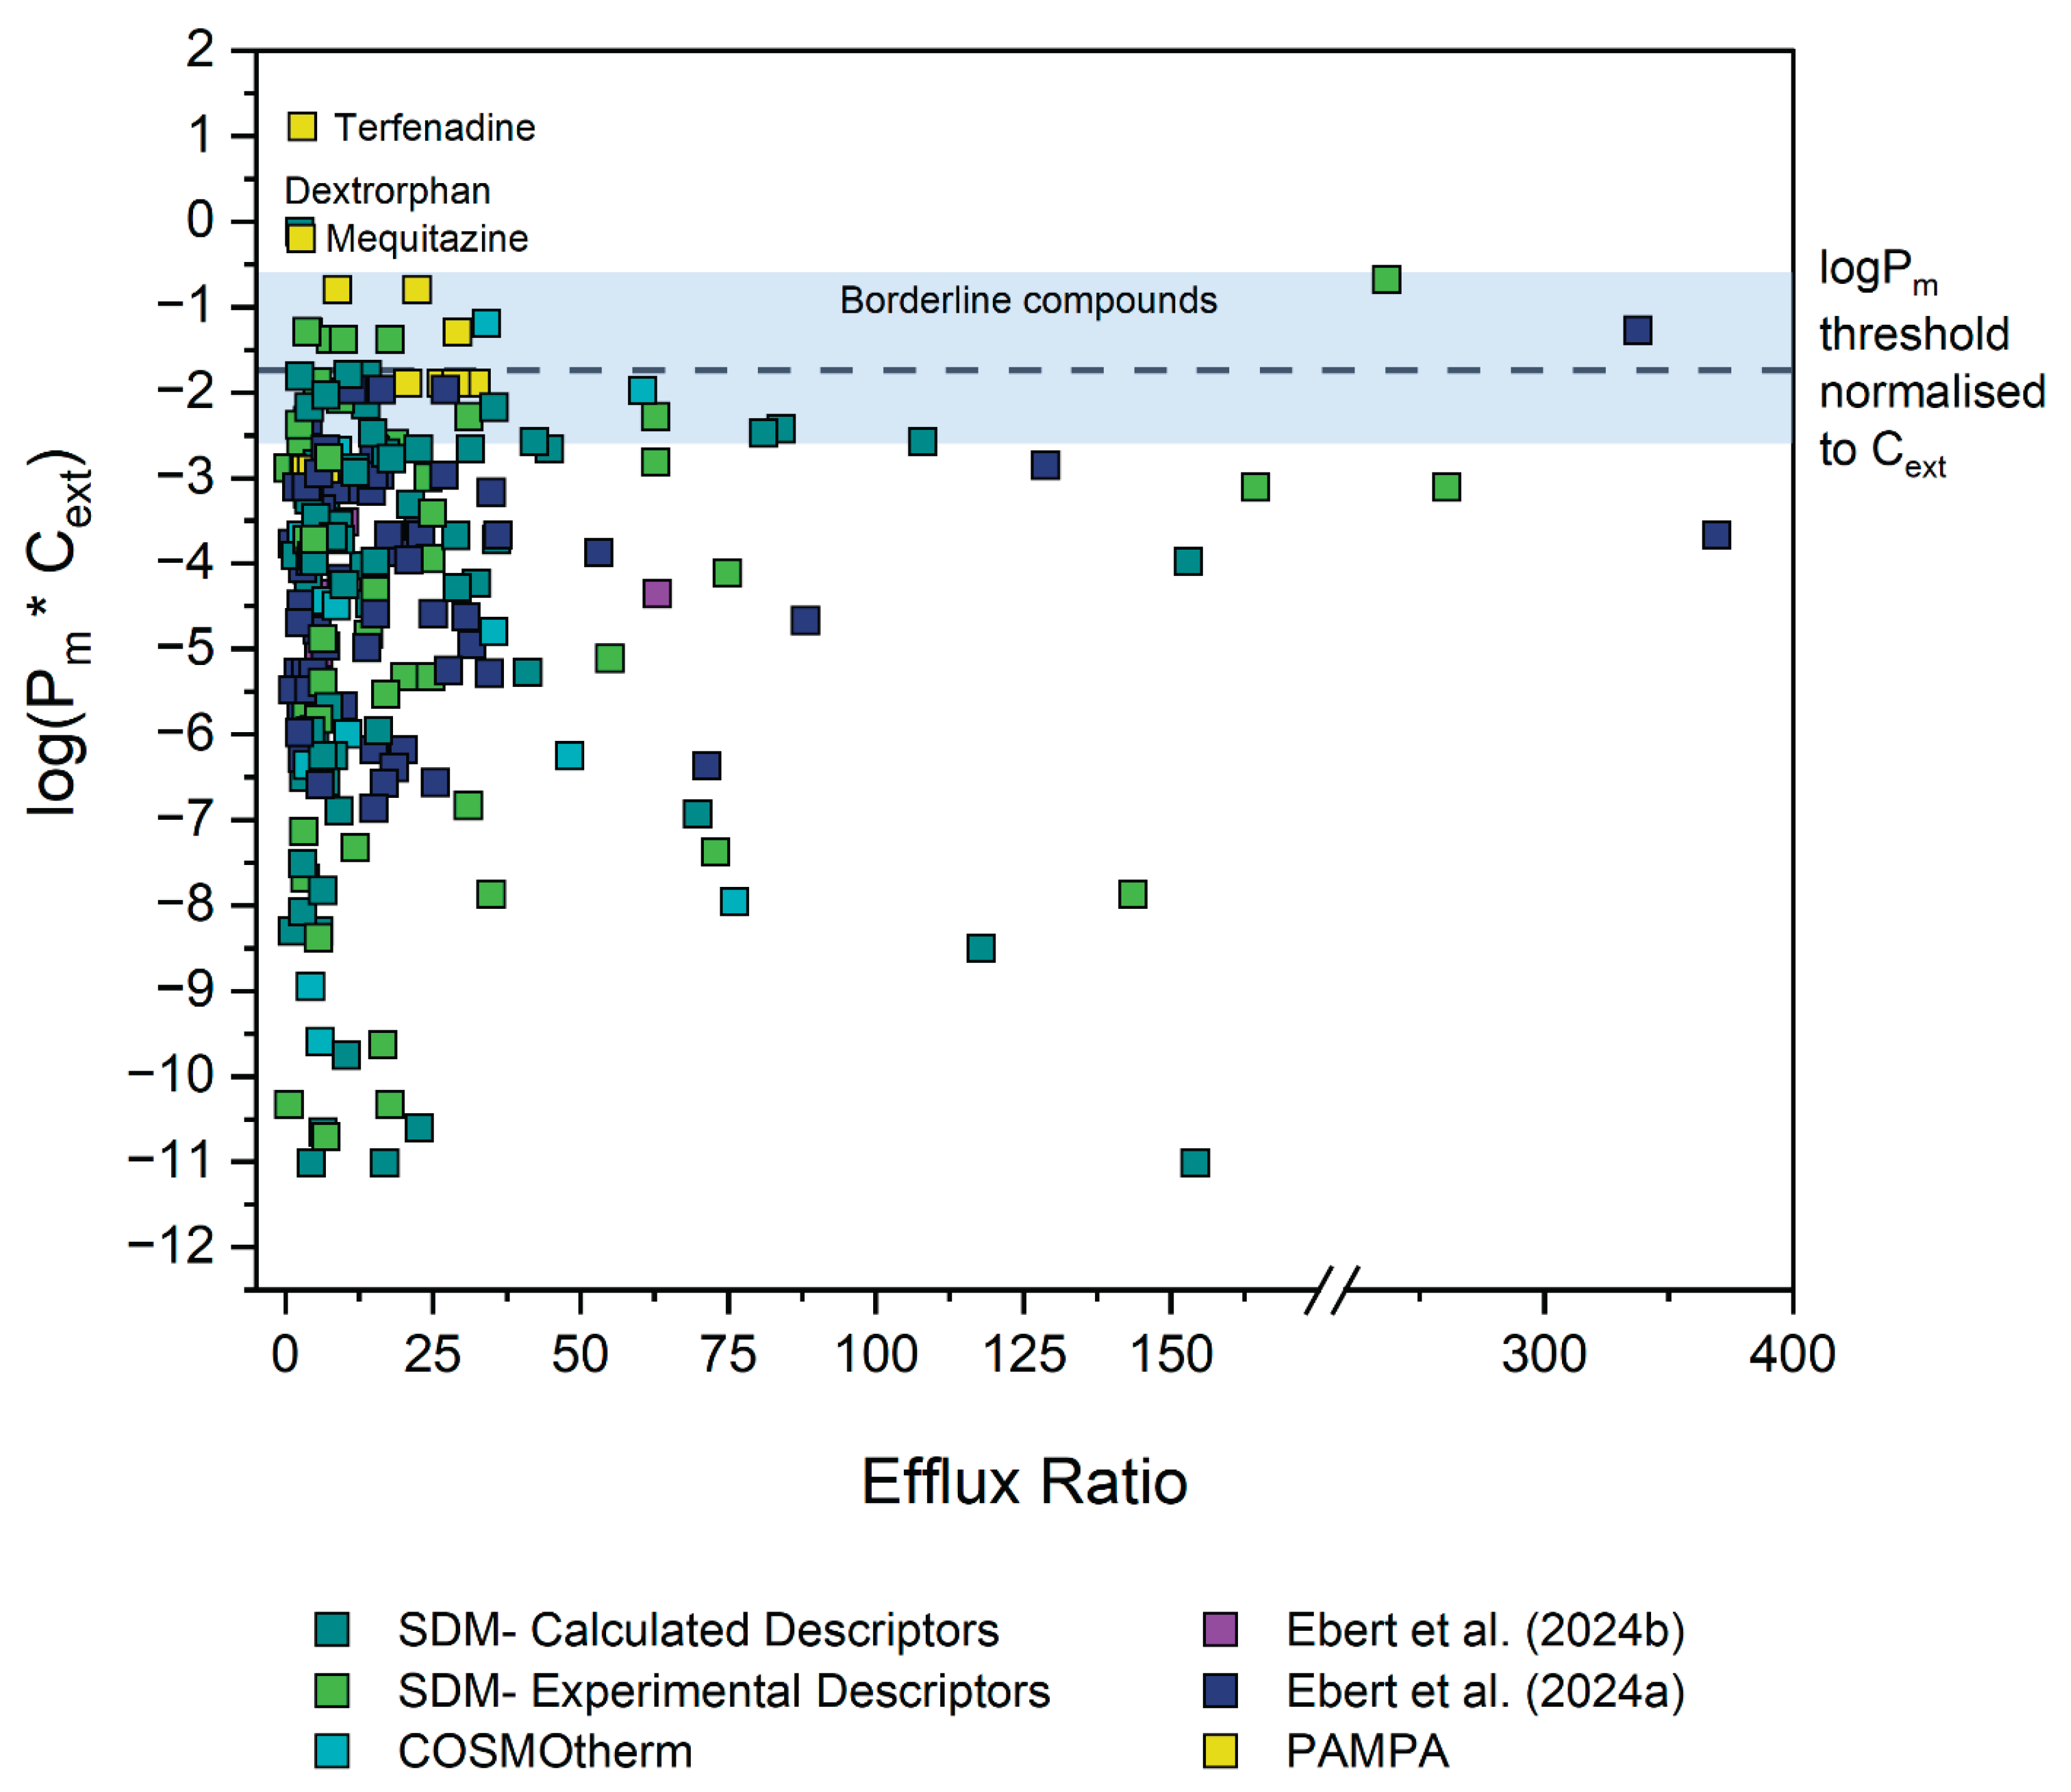
Figure 9.
Combined data from the P-gp, BCRP and MRP2 datasets log(Pm * Cext) vs ER with re-evaluated data, along with non-transported compounds in red.
Figure 9.
Combined data from the P-gp, BCRP and MRP2 datasets log(Pm * Cext) vs ER with re-evaluated data, along with non-transported compounds in red.
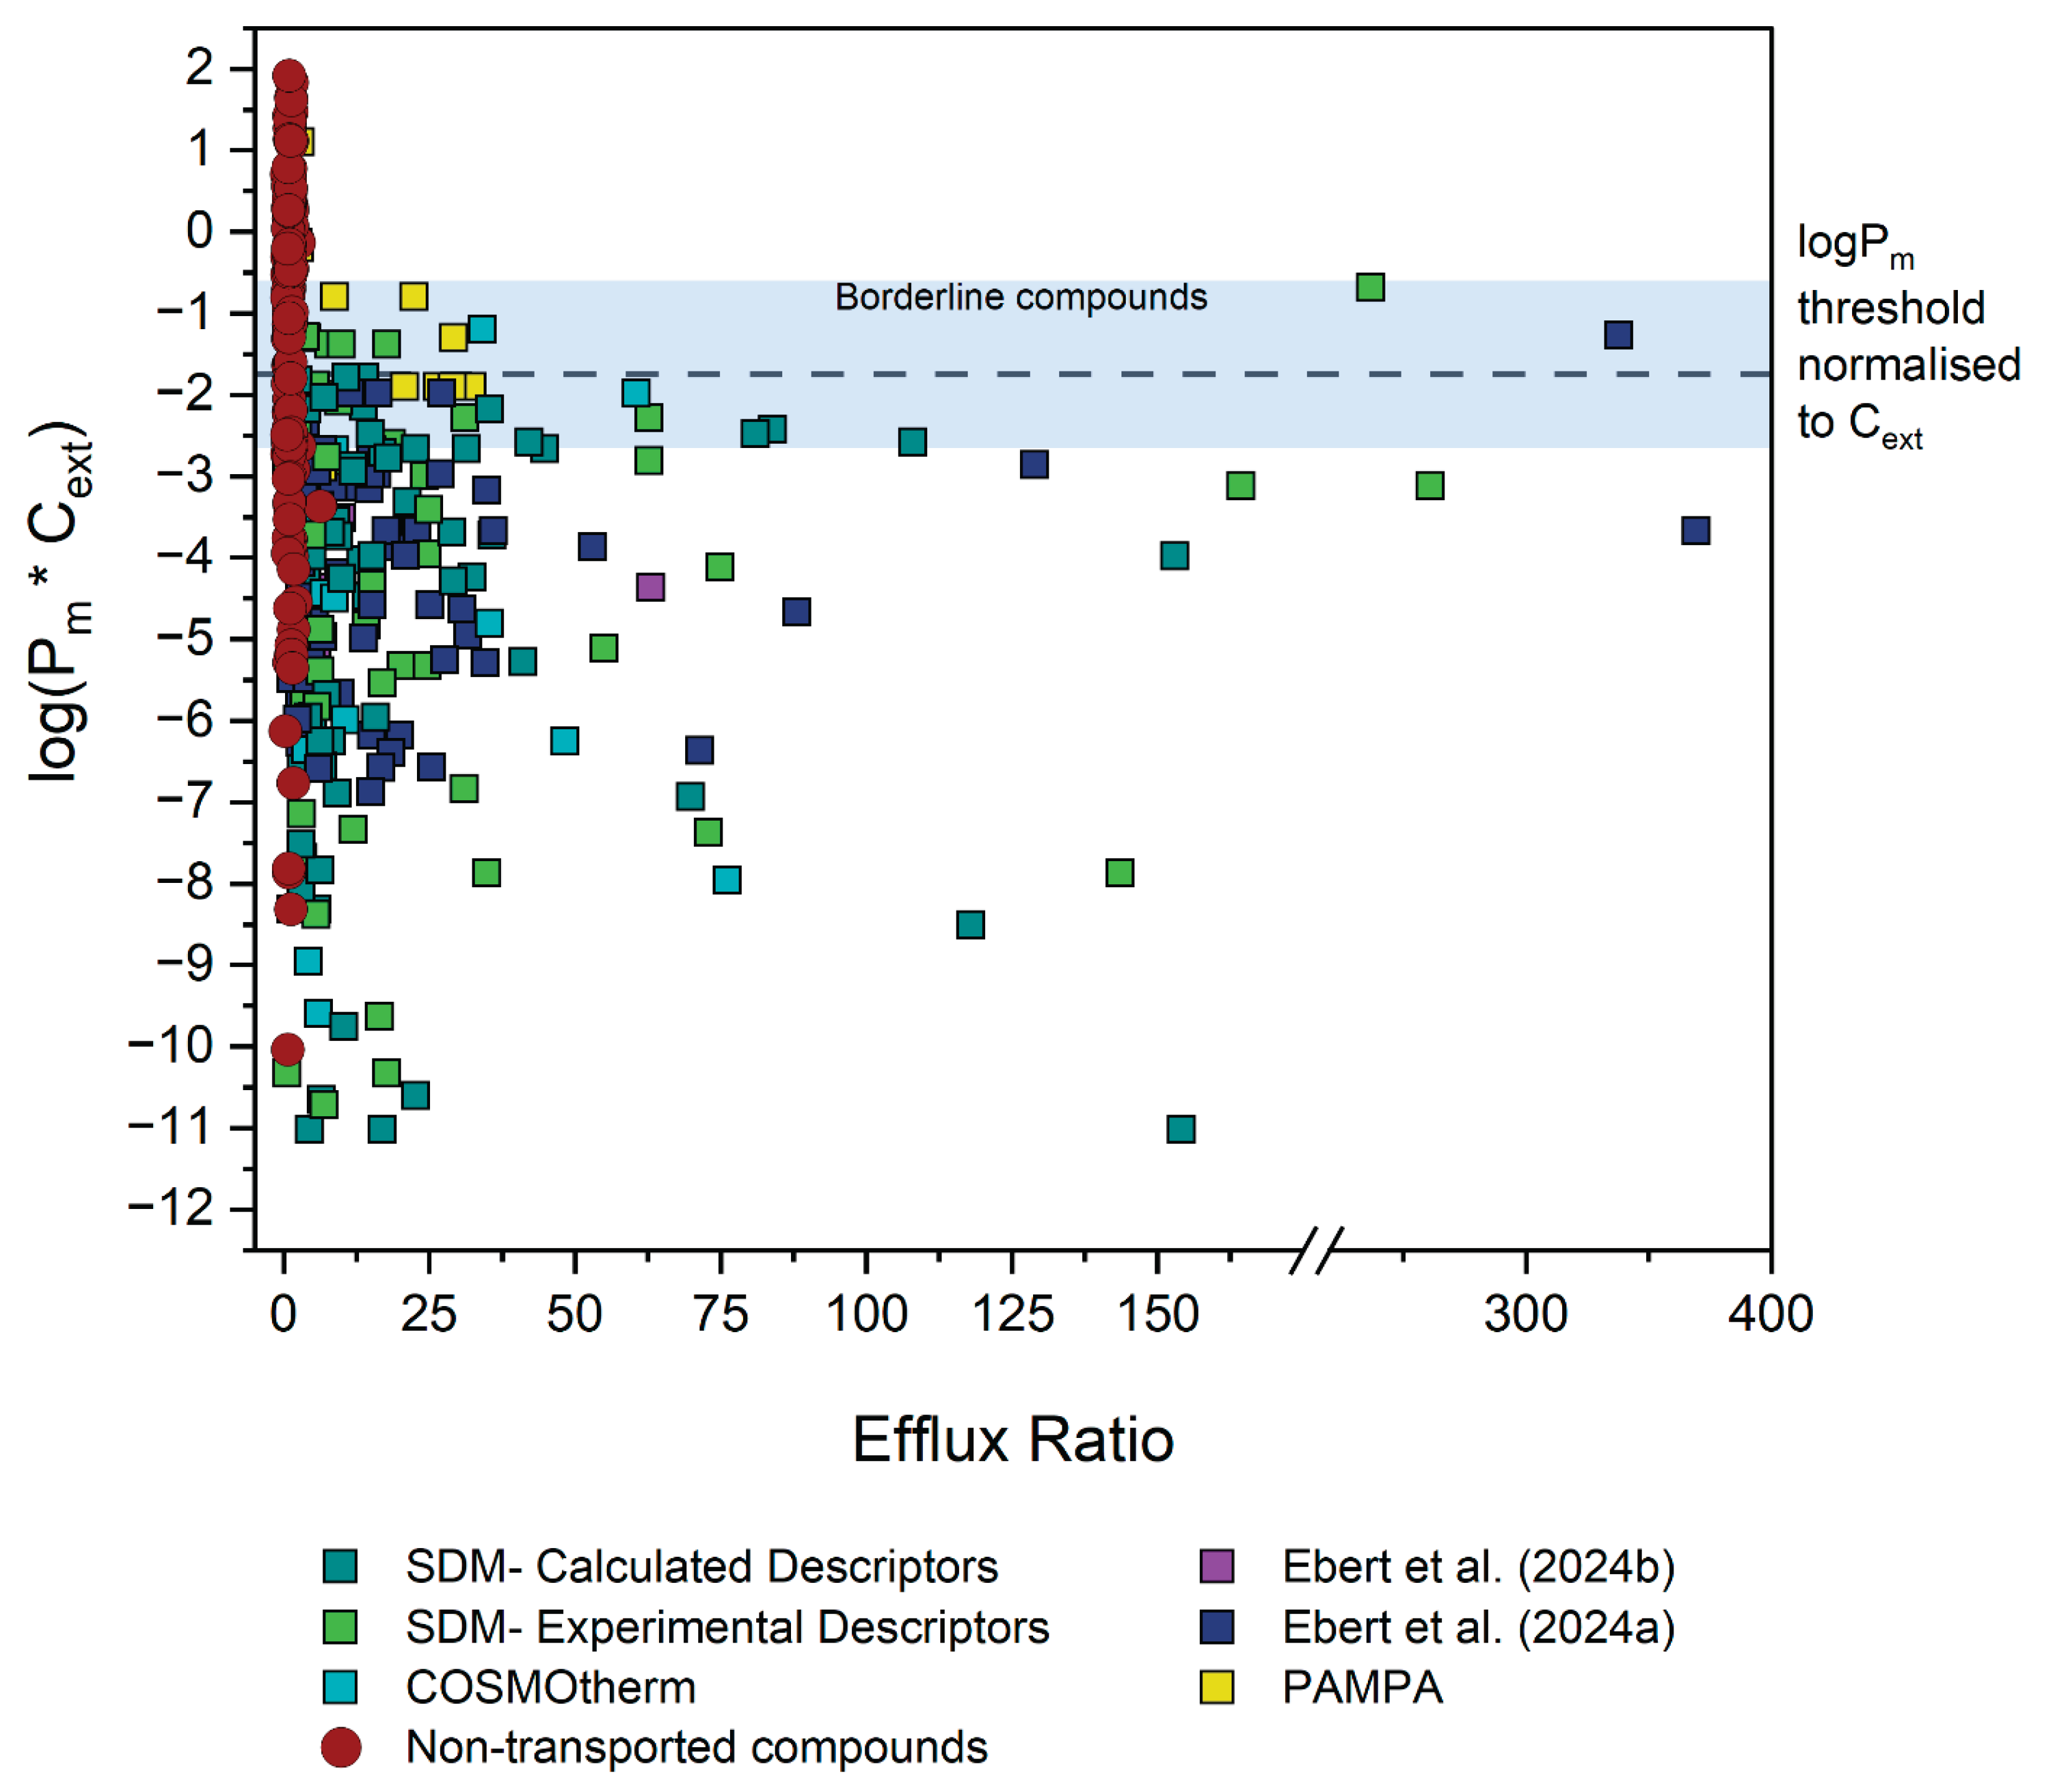
Disclaimer/Publisher’s Note: The statements, opinions and data contained in all publications are solely those of the individual author(s) and contributor(s) and not of MDPI and/or the editor(s). MDPI and/or the editor(s) disclaim responsibility for any injury to people or property resulting from any ideas, methods, instructions or products referred to in the content. |
© 2025 by the authors. Licensee MDPI, Basel, Switzerland. This article is an open access article distributed under the terms and conditions of the Creative Commons Attribution (CC BY) license (http://creativecommons.org/licenses/by/4.0/).
Copyright: This open access article is published under a Creative Commons CC BY 4.0 license, which permit the free download, distribution, and reuse, provided that the author and preprint are cited in any reuse.


