Submitted:
08 October 2025
Posted:
09 October 2025
You are already at the latest version
Abstract
Chrysotile asbestos has been and continue to be widely used in Zimbabwe in the manufacturing of asbestos cement products that include asbestos-cement roofing sheets and facia boards. Static exposure monitoring to chrysotile asbestos fibre has been ongoing since the 1990s in the two main chrysotile cement factories. The study assessed changes in static exposure chrysotile asbestos fibre levels over a 25 year period from 1996 to 2019. About 6677 static chrysotile fibre data was used to evaluate changes and extent of exposure to chrysotile asbestos fibre in the two chrysotile asbestos factories. Exposure changes were characterized according to calendar year and time period. Static exposure chrysotile asbestos fibre levels showed a decline over the period 1996 to 2019, with Harare showing an overall decrease of about 82.4% in exposure levels (0.17 f/ml in 1996 to 0.03 f/ml in 2019) while in the Bulawayo factory exposure declined by about 47%, moving from 0.17 f/ml in 1996 to about 0.09 f/ml in 2019. Both factories generally exhibited static overexposure before 2008. The decline in static exposure levels over time suggests improved occupational safety and health practices by the factories over the years. The data generated from this study can further compliment personal exposure data in giving detailed chrysotile asbestos exposure profile across key manufacturing factories in Zimbabwe. Data of this nature can also be used in future epidemiology studies and can aid in possible asbestos related diseases compensation cases.
Keywords:
chrysotile asbestos
; changes
; static exposure chrysotile fibre levels
1. Introduction
Chrysotile asbestos, being one of the three naturally occuring mineral fibres has been widely used in manufacturing asbestos-cement products. Despite its unique positive properties that include high tensile strength and being heat resistent, chrysotile asbestos fibre is recognised as a health hazard linked to serious health outcomes such as lung cancer, mesothelioma and asbestosis [1,2,3].
Previous studies have examined personal exposure chrysotile asbestos fibre concentrations for operators in various operational areas of two chrysotile asbestos cement manufacturing plants in Harare and Bulawayo cities in Zimbabwe [4]. Despite this elaborate evaluation of personal exposure to chrysotile asbestos fibre there remain extensive static chrysotile asbestos fibre exposure data taken over a 25 year period from 1996 to Static monitoring is usually used to determine the distribution of airbourne contaminants in the general ambient atmosphere of working areas, identify problem areas and set priorities for preventive action. With static sampling, air samples are usually collected close to sources of emissions in order to evlauate the levels of exposure or the extent of functionality of engineering controls or evaluate work practices [5]. This type of exposure may not only affect workers directly around sources of exposure, but can also affect those workers in adjacent areas who can get exposed to dust and fibres that escape from controlled work environments and move distant places from sources of exposure.
Static sampling generally gives a snapshot of exposure concentration in a specific area, while personal exposure sampling evaluates a worker’s individual actual exposure. While personal sampling is generally the preferred method of assessing exposure and health risk thereof [4], static sampling can also be quite useful in identifying sources of exposure as well as evaluating the effectiveness of control measures in a particular operating area and generally understanding the quality of the ambient environment being operated in. Hence, the study focusing on exposure assessment through static measurement data will further aid in a better understanding of the quality of the ambient air, and gives the exposure profile of chrysotile asbestos fibre in chrysotile asbestos cement factories in Zimbabwe. The exposure concentrations whether obtained through static or personal sampling, is compared with the occupational exposure limit (OEL) to evaluate extent of health risk.
Given the established health risks associated with chrysotile asbestos, it is important that comprehensive studies that assess static exposure levels in the chrysotile asbestos cement manufacturing industry be undertaken to compliment the already generated personal exposure levels evaluated. Despite collecting both static and personal chrysotile exposure data for about two and half decades, comprehensive exposure assessment with respect to static chrysotile fibre data is limited in Zimbabwe chrysotile asbestos cement manufacturing sector. Hence such static chrysotile exposure data will provide and expand on critical exposure profile to chrysotile asbestos fibre in asbestos-cement manufacturing entities in Zimbabwe. Additionally, retrospective analysis of such static chrysotile fibre exposure data will further provide insights into possible asbestos related diseases (ARD) that may occur in Zimbabwe and help in future asbestos related diseases compensation cases that may arise.
2. Materials and Methods
2.1. Study Sites
The study was done at two major chrysotile asbestos-cement manufacturing factories located in Harare and Bulawayo. Key activities in the factories include manufacture of chrysotile asbestos cement roofing sheets, facio boards and pipes for water and sewage reticulation.
2.2. Study Design
Secondary static chrysotile asbestos fibre data was used to evaluate extent of exposure to chrysotile fibre in the chrysotile cement factories and evaluation was done against the occupational exposure limit (OEL) of 0.1 f/ml, a standard widely used in a number of countries including Zimbabwe [6,7,8]. A detailed retrospective review of chrysotile fibre concentrations for static exposure data for the period 1996-2019 in various areas of operations was done. Areas evaluated for static chrysotile asbestos fibre are as follows and as described in Table 1:
- Kollergong (loading of fibre into process).
- Tables for handling chrysotile products
- Saws area (for cutting chrysotile products such as sheets to size).
- Ridges moulding.
- Laundry room
- Laboratory
- Ground handling waste
2.3. Research Methods
2.3.1. Analysis of Changes in Static Chrysotile Asbestos Fibre Exposure Levels in Th Chrysotile Cement Factories for the Period 1996-2019
A detailed retrospective static exposure data assessment for the period 1996 to 2019 was done per calendar year and for 3 time periods of 1996-2001; 2002 – 2008 and 2009 to 2019. The time periods selected were conceived against the backdrop of the fact that during the period 1996 to 2001, manufacturing activities in these factories were quite high, industry was largely driven by self-regulation and chrysotile exposure monitoring in the factory were quite consistent in light of the need then to phase out world wide use of all forms of asbestos including chrysotile [4]. During the period 2002 – 2008, chrysotile exposure monitoring program continued, however production processes and equipment in use were largely compromised due to difficulties in procuring new parts as a result of a sharp decline in economic performance nationally due to hyperinflation. Monitoring of exposure continued for the period 2009 to 2019 against the backdrop of improved retooling of the industry and change from the use of local chrysotile asbestos fibre to imported fibre [4].
The respective data set used was obtained by the factories using the standard method of the Asbestos International Association (AIA) Recommended Technical Membrane Filtre Reference Method, (1982) [9]. Field blank filtre samples were used as controls as part of the quality control programme. Additionally, the two chrysotile asbestos manufacturing factories participated in interlaboratory quality assurance fibre counting programme which involved laboratories in Zimbabwe and another laboratory in Zambia.
To evaluate possible implications of the chrysotile asbestos static exposure levels to human health, mean static exposure levels were evaluated against the chrysotile asbestos fibre occupational exposure limit of 0.1 f/ml.
3. Results
3.1. Operational Areas USED in Static Chrysotile Fibre Measurements in the Harare and Bulawayo Factories
These areas were considered to have potential for high exposure to airborne chrysotile asbestos fibre.
For the period 1996 to 2019, a total of about 6677 static chrysotile asbestos fibre exposure data was collected, of which 3631 (54%) were from the Harare factory and about 3046 (46%) was from the Bulawayo factory. Table 2 and Table 3 show summary statistics of the static exposure levels for the various operational areas in the factories. Generally high static chrysotile exposure levels were recorded at the saws cutting operations, ground hard waste and kollergang operational areas in both factories. Overall, about 50% of static measurement values in the Harare factory and 43% in the Bulawayo factory were above the occupational exposure limit of 0.1 f/ml respectively.
In the Harare factory, saw cutting, fettling table, kollergang and laundry areas had more than 50% of the exposure levels above the OEL with saw cutting and fettling table operations leading with exposure levels generally above the OEL (Table 2). Additionally, ground hard waste and kollergang operations exhibited higher mean exposure levels compared to other operational areas in the Harare factory.
The chrysotile asbestos exposure data from the Bulawayo plant reveals notable differences in exposure levels across various operational areas with exposures fluctuating over the years, however exhibiting a gradual decline during the period 1996 to about More specifically, in the Bulawayo factory, exposures above the OEL were observed at the saws cutting, fettling table, ground hard waste and pipe joint operations from 1996 to 2002/2003, while exposures above the OEL at the kollergang, full length pipe and multi-cutter operations and boundary site area were observed during the period 1996 to about Overall, fibre concentrations across the factory show moderate averages, but the saw cutting, kollergang and boundary site areas show elevated exposure levels, with 67% and 63% of exposure levels at kollergang and boundary site areas respectively showing exposure levels above the OEL. Furthermore, like in the Harare factory, saw cutting operations, kollergang and ground hard waste indicate elevated levels of chrysotile asbestos fibre exposure levels. The pipe joint section area and full length pipe operations showed slightly lower and more or less the same average exposures at 0.08 f/ml and 0.09 f/ml, with 38% and 35% of exposure values exceeding OEL respectively. Both operational areas involve handling or machining of asbestos cement pipes, where dust release can occur during cutting, turning, or fitting operations.
Figure 1 and Figure 2 show changes in static mean exposure chrysotile asbestos fibre levels from 1996 to 2019.
For the Harare factory, static exposure levls declined steadly over the years with year 1996 reporting a mean exposure level of 0.17 f/ml and down to 0.03 f/ml by 2019 (a decrease of about 82.3% over the 25 year period). The Bulawayo factory also show a similar decline in exposure from 0.17 f/ml in 1996 to 0.03 f/ml in 2015 (an 82.3% decrease), but exposure levels begin to be elevated to about 0.1 f/ml for the period 2016 to 2019.
3.2. Changes in Static Exposure Chrysotile Asbestos Fibre by Time Periods
Table 4 and Table 5 show static exposure chrysotile fibre concentrations by time-period for the Harare and Bulawayo Factories. The factory-wide static mean chrysotile asbestos fibre exposure (Site Area Mean) fell from about 0.17 f/ml during the time-period 1996–2000 to ~0.12 f/ml during the period 2001–2008 and further declined to ~0.04 f/ml during the period 2009-2019, indicating strong overall exposure control gains. Changes in mean static chrysotile asbestos exposure levels in various operational areas mirror this pattern during the specific three time periods.
The Bulawayo factory also showed a similar pattern, with overall factory static mean chrysotile asbestos fibre concentrations decreasing from 0.17 f/ml during the period 1996 to 0.11 f/ml in 2001-2008 (a 35.3% decrease) and further declining to 0.06 f/ml during the period 2009 to Thus significant decline of 64.7% was registered from the base time period of 1996-2000 (range; 0.20-0.15 f/ml) to the time period 2009 to 2019 (range 0.11-0.01f/ml), indicating that higher static exposure concentrations were generally concentrated during the earlier years of 1996 to Individual work areas also follow a similar trend of significant decrease from the base time period (1996 to 2000) compared to the time period 2009 to 2019, with saw cutting (0.19-0.07 f/ml), ground hard waste (0.14 – 0.04 f/ml) and multi-cutter (0.16-0.06 f/ml) work areas showing substantial decreases.
4. Discussion
The study examined and described static exposure chrysotile asbestos fibre levels in two chrysotile asbsetos cement manufacturing factories with static chrysotile asbestos fibre exposure data collected over a 25 year period from 1996 to It is one of the largest static chrysotile asbestos exposure data set of about 6677 exposure values with a significant data collection period. Additionally, this static sampling data set is unique in that it is actual chrysotile asbestos fibre concentrations and not concentrations derived data from dust concentrations as reported elsewhere in literature [10,11,12].
Generally, elevated levels at saw cutting and ground hard waste operational areas suggests abrasive mechanical process involved in preparing and processing cement products, which then releases considerable amount of airborne fibres in the absence of wet processes to suppress release of fibre into the ambient air. Additionally, the kollergang area also appear to be prone to elevated levels of chrysotile asbestos fibre levels which can be attributed to possible low suction system or poor handling of chrysotile asbestos bags as they are fed into the process for subsequent production of asbestos sheets and other products. However, these elevated levels were generally observed to be more prevalent prior to 2008 in the case of the Harare factory while for the Bulawayo factory high levels were generally experienced before 2003/For the period 1996 to 2008 static exposure levels exceeding the OEL were experienced for a relatively longer period (8 years) in the case of Harare compared to the Bulawayo factory which had a shorter span (5 years) of elevated exposure levels. This observation can be attributed to the fact that Harare factory was the main source of manufactured asbestos products and thus had increased manufacturing activity compared to the Bulawayo factory.
Moulded goods operations area in the Harare factory indicated relatively lower risk operations, possibly because the products are made through a wet process and do not undergo aggressive mechanical processes that could release fibres in the ambient air. Exposure levels in the laundry room operations suggests that fibre release occurs during specific tasks like shaking out contaminated clothing or loading machines, causing possible short bursts of high exposure that raise the risk despite seemingly low risk operations in this area. Exposure levels at the boundary site areas in both factories were just about the same as the OEL, suggest that airborne chrysotile fibre are not necessarily confined to specific high-risk workstations but could disperse throughout the facility requiring strict controls at all operational areas to minimise spread of asbestos fibre out of the factory premises.
For the Bulawayo factory, it is important to note that despite a gradual decline in exposure particularly for the period 1996 to 2015, exposure levels began to be elevated to about 0.1f/ml or slightly more during the period 2016 to Increased exposure during the period 2016 to 2019 can be attributed to increased manufacturing activity of chrysotile asbestos products as manufacturing of all asbestos-cement products shifted to the Bulawayo factory, while Harare factory ceased manufacturing any chrysotile asbestos cement products during this period.
Like with personal exposure chrysotile asbestos evaluations done by Mutetwa et al., 2021 [4], the decline in static exposure to chrysotile asbestos is similar to trends observed in other studies. Such declines were generally attributed to good OSH practices and compliance with regulatory requirements [11,13,14].
Collectively, these results suggests substantial and sustained improvements in exposure control at Harare and Bulawayo factories, with most operations now clustered at low static exposure concentrations; the relatively higher means for Kollergang and Saw cutting suggest that these areas remain the priority for continued monitoring and targeted elaborate controls. These findings demonstrate significant long-term improvements in exposure control, while also highlighting the need for sustained monitoring of higher-risk operations such as at the kollergang and ground hard waste areas.
5. Strengths and Limitations
One key strength in this study is that a significant amount of static chrysotile asbestos fibre levels were collected over a long period spanning about two and half decades. The static exposure data set represent actual fibre levels obtained from actual measurements and not derived from fibre to dust ratios. Additionally, static exposure chrysotile asbestos fibre levels were obtained using a recognised standard method of asbestos fibre measurements adding assurance to the quality of data produced. However, consistent measurements were disrupted during the hyperinflation period of 2007 to 2008 affecting productivity and in turn limiting regular carrying out of static chrysotile asbestos measurements. Nonetheless, the large unique data set obtained through static sampling does provide additional insights into the chrysotile asbestos fibre exposure levels in the chrysotile asbestos cement manufacturing industry sector in Zimbabwe.
6. Conclusion and Recommendations
The declining pattern established by the static exposure trends over time is similar to that observed with personal exposure to chrysotile asbestos as indicated by Mutetwa et al, (2021) [4]. However, like in the case of personal exposure to chrysotile fibre concentrations and based on the occupational exposure limit (OEL) of 0.1 f/ml, descriptive statistics for both factories (Table 2 and Table 3), indicate over exposure during the earlier years of 1996-2000 and 2001 to The Harare factory shows that about 50% of static exposure values and for the Bulawayo factory 43% of static exposure values were above the OEL, with the time periods 1996-2000 and 2001-2008 contributing considerably to the frequency of exposure values above the OEL. The first two decades of 1996 to 2008 presented increased risk of developing asbestos related diseases (ARDs) among workers exposed to chrysotile asbestos as static exposure levels like in personal exposure (Mutetwa et al., 2021), were above the OEL, below which exposure may present reduced risk of health impairment [8].
Static exposure measurements as observed in this study can yield vital indications of extent of exposure controls and thus can be used where personal exposure measurements may not be possible to obtain. Additionally, data generated through static exposure sampling can be used as baseline information to establish exposure limits and also give indication to regulatory authorities and workplaces with exposure monitoring programmes on extent of compliance with chrysotile asbestos exposure standards. Furthermore, static exposure data can also quickly give indication of where interventions can be directed to reduce risk of exposure.
Zimbabwe has ratified Convention 162 on asbestos and hence efforts exhibited by the asbestos industry in Zimbabwe where static exposure sampling is implemented alongside personal sampling is commendable. Chrysotile asbestos use and handling remains a contentious issue, however with industry applying good OSH practices and implementing robust chrysotile asbestos fibre monitoring programme, the country can produce evidence based data on chrysotile asbestos exposure profile over a long period.
To further support the work being done by the chrysotile industry in Zimbabwe, it is recommended that:-
- The chrysotile asbestos industry be commended for keeping the chrysotile asbestos monitoring programme in place for a long time and that such a programme be a key OSH programme for all entities dealing with chrysotile asbestos in Zimbabwe.
- Collaborative periodic capacity building exercises be conducted between the chrysotile asbestos industry and OSH regulatory authorities to continuously strengthen the chrysotile asbestos fibre exposure monitoring program with a view to strengthen the protection of workers health against exposure to high chrysotile asbestos fibre levels.
- Given improved technology being applied by some players in the chrysotile asbestos industry in Zimbabwe, further chrysotile asbestos fibre exposure data should be generated now, with a view to monitor exposure trends associated with such technology overtime and how such exposure to chrysotile asbestos fibre under new technological conditions will compare with exposures in the past as reflected in this study.
Author Contributions
Conceptualization, B.M.; methodology, data collection, and formal analysis, B.M and T.K.; writing—original draft preparation, B.M and T.K.; writing—critical review and editing, R.D. and K.M.; supervision, B.N. All authors have read and agreed to the published version of the manuscript.
Funding
This research did not receive any specific grant from funding agencies in the public, commercial, or non-profit sectors.
Institutional Review Board Statement
Not applicable.
Informed Consent Statement
Written informed concern was obtained from the company owning the chrysotile asbestos cement manufacturing factories.
Data Availability Statement
The dataset used in this study are available from the corresponding author on reasonable request. The datasets are not publicly available to maintain confidentiality of the factories used in the study.
Acknowledgments
The authors would like to thank the chrysotile asbestos cement manufacturing factories for availing their static chrysotile asbestos fibre exposure data, which spanned about two and half decades, without which the study could not have materialized.
Conflicts of Interest
The authors declare no conflict of interest.
References
- World Health Organization (WHO) (2014). Chrysotile Asbestos. Available on line at; https://iris.who.int/bitstream/handle/10665/143649/9789241564816_eng.pdf. Accessed 1 July 2025.
- International Agency for Research on Cancer (IARC). IARC Monograph on Evaluation of Carcinogenic Risks to Human, Arsenic, Metals, Fibres and Dust: A Review of Human Carcinogens; IARC: Lyon, France; WHO: Geneva, Switzerland, 2012; Volume 100C, pp. 219–309.
- World Health Organization. International Programme on Chemical Safety. Chrysotile Asbestos; Environmental Health Criteria UNEP, ILO, WHO and IPCS; World Health Organization: Geneva, Switzerland, 1998.
- Mutetwa, B.; Moyo, D.; Brouwer, D. Trends in Airborne Chrysotile Asbestos Fibre Concentrations in Asbestos Cement Manufacturing Factories in Zimbabwe from 1996 to. Int. J. Environ. Res. Public Health 2021, 18, 10755. [Google Scholar] [CrossRef] [PubMed]
- International Labour Organization (ILO) (2022). Monitoring in the Workplace. Available online, https://webapps.ilo.org/static/english/protection/safework/cis/products/safetytm/chemcode/12.htm. Accessed 23 September 2025.
- Schenk, L. Setting Occupational Exposure Limits: Practices and Outcomes of Toxicological Risk Assessment. Ph.D. Thesis, Division of Philosophy, Department of Philosophy and the History of Technology, Royal Institute of Technology (KTH), Stockholm, Sweden. Available online: https://www.researchgate.net/publication/265044801_Setting_occupational_exposure_limits_Practices_and_outcomes_of_toxicological_risk_assessment/link/545350040cf26d5090a3a902/download (Accessed 5/9/2025).
- National Social Security Authority. Guidelines on Occupational Exposure Limits (OELs) for Chemical Substances and Dust; National Social Security Authority: Harare, Zimbabwe, 2017.
- American Conference of Governmental Industrial Hygienist (ACGIH). Threshold Limit Values for Chemical Substances and Physical Agents and Biological Exposure Indices, 2014 ed.; ACGIH Publications: Cincinnati, OH, USA, 2014; pp. 3–4.
- Asbestos International Association. Reference Method for the Determination of Airborne Asbestos Fibre Concentrations at Workplaces by Light Microscopy (Membrane Filter Method); Asbestos International Association: Ontario, ON, Canada, 1982.
- Schüz J, Bukhtiyarov I, Olsson A, et al. Occupational cohort study of current and former workers exposed to chrysotile in mine and processing facilities in Asbest, the Russian Federation: Cohort profile of the Asbest Chrysotile Cohort study. PLoS One 2020, 15, e0236475. [CrossRef]
- Schonfeld, S.J.; Kovalevskiy, E.V.; Feletto, E.; Bukhtiyarov, I.V.; Kashanskiy, S.V.; Moissonier, M.; Straif, K.; McCormack, V.A.; Shutz, J.; Kromhout, H. Temporal Trends in Airborne Dust Concentrations at a Large Chrysotile Mine and its Asbestos-enrichment Factories in the Russian Federation during 1951. Ann. Work Expo Health 2017, 61, 797–808. [Google Scholar] [CrossRef]
- Feletto E, Schonfeld SJ, Kovalevskiy EV, Bukhtiyarov IV, Kashanskiy SV, Moissonnier M, et al. A comparison of parallel dust and fibre measurements of airborne chrysotile asbestos in a large mine and processing factories in the Russian Federation. Int J Hyg Environ Health 2017, 220, 857–868. [CrossRef] [PubMed]
- Park, D.; Choi, S.; Ryu, K.; Park, J.; Paik, N. Trends in occupational asbestos exposure and asbestos consumption over recent decades in Korea. Int. J. Occup. Environ. Health 2008, 14, 18. [Google Scholar] [CrossRef] [PubMed]
- Yoshizumi, K.; Hori, H.; Satoh, T.; Higashi, T. The trends in Airborne Asbestos Concentrations at Plants Manufacturing Asbestos- Containing Products in Japan. Ind. Health 2001, 39, 127. [Google Scholar] [CrossRef] [PubMed]
Figure 1.
Changes in static exposure chrysotile asbestos fibre levels from 1996 to 2019, Harare Factory.
Figure 1.
Changes in static exposure chrysotile asbestos fibre levels from 1996 to 2019, Harare Factory.
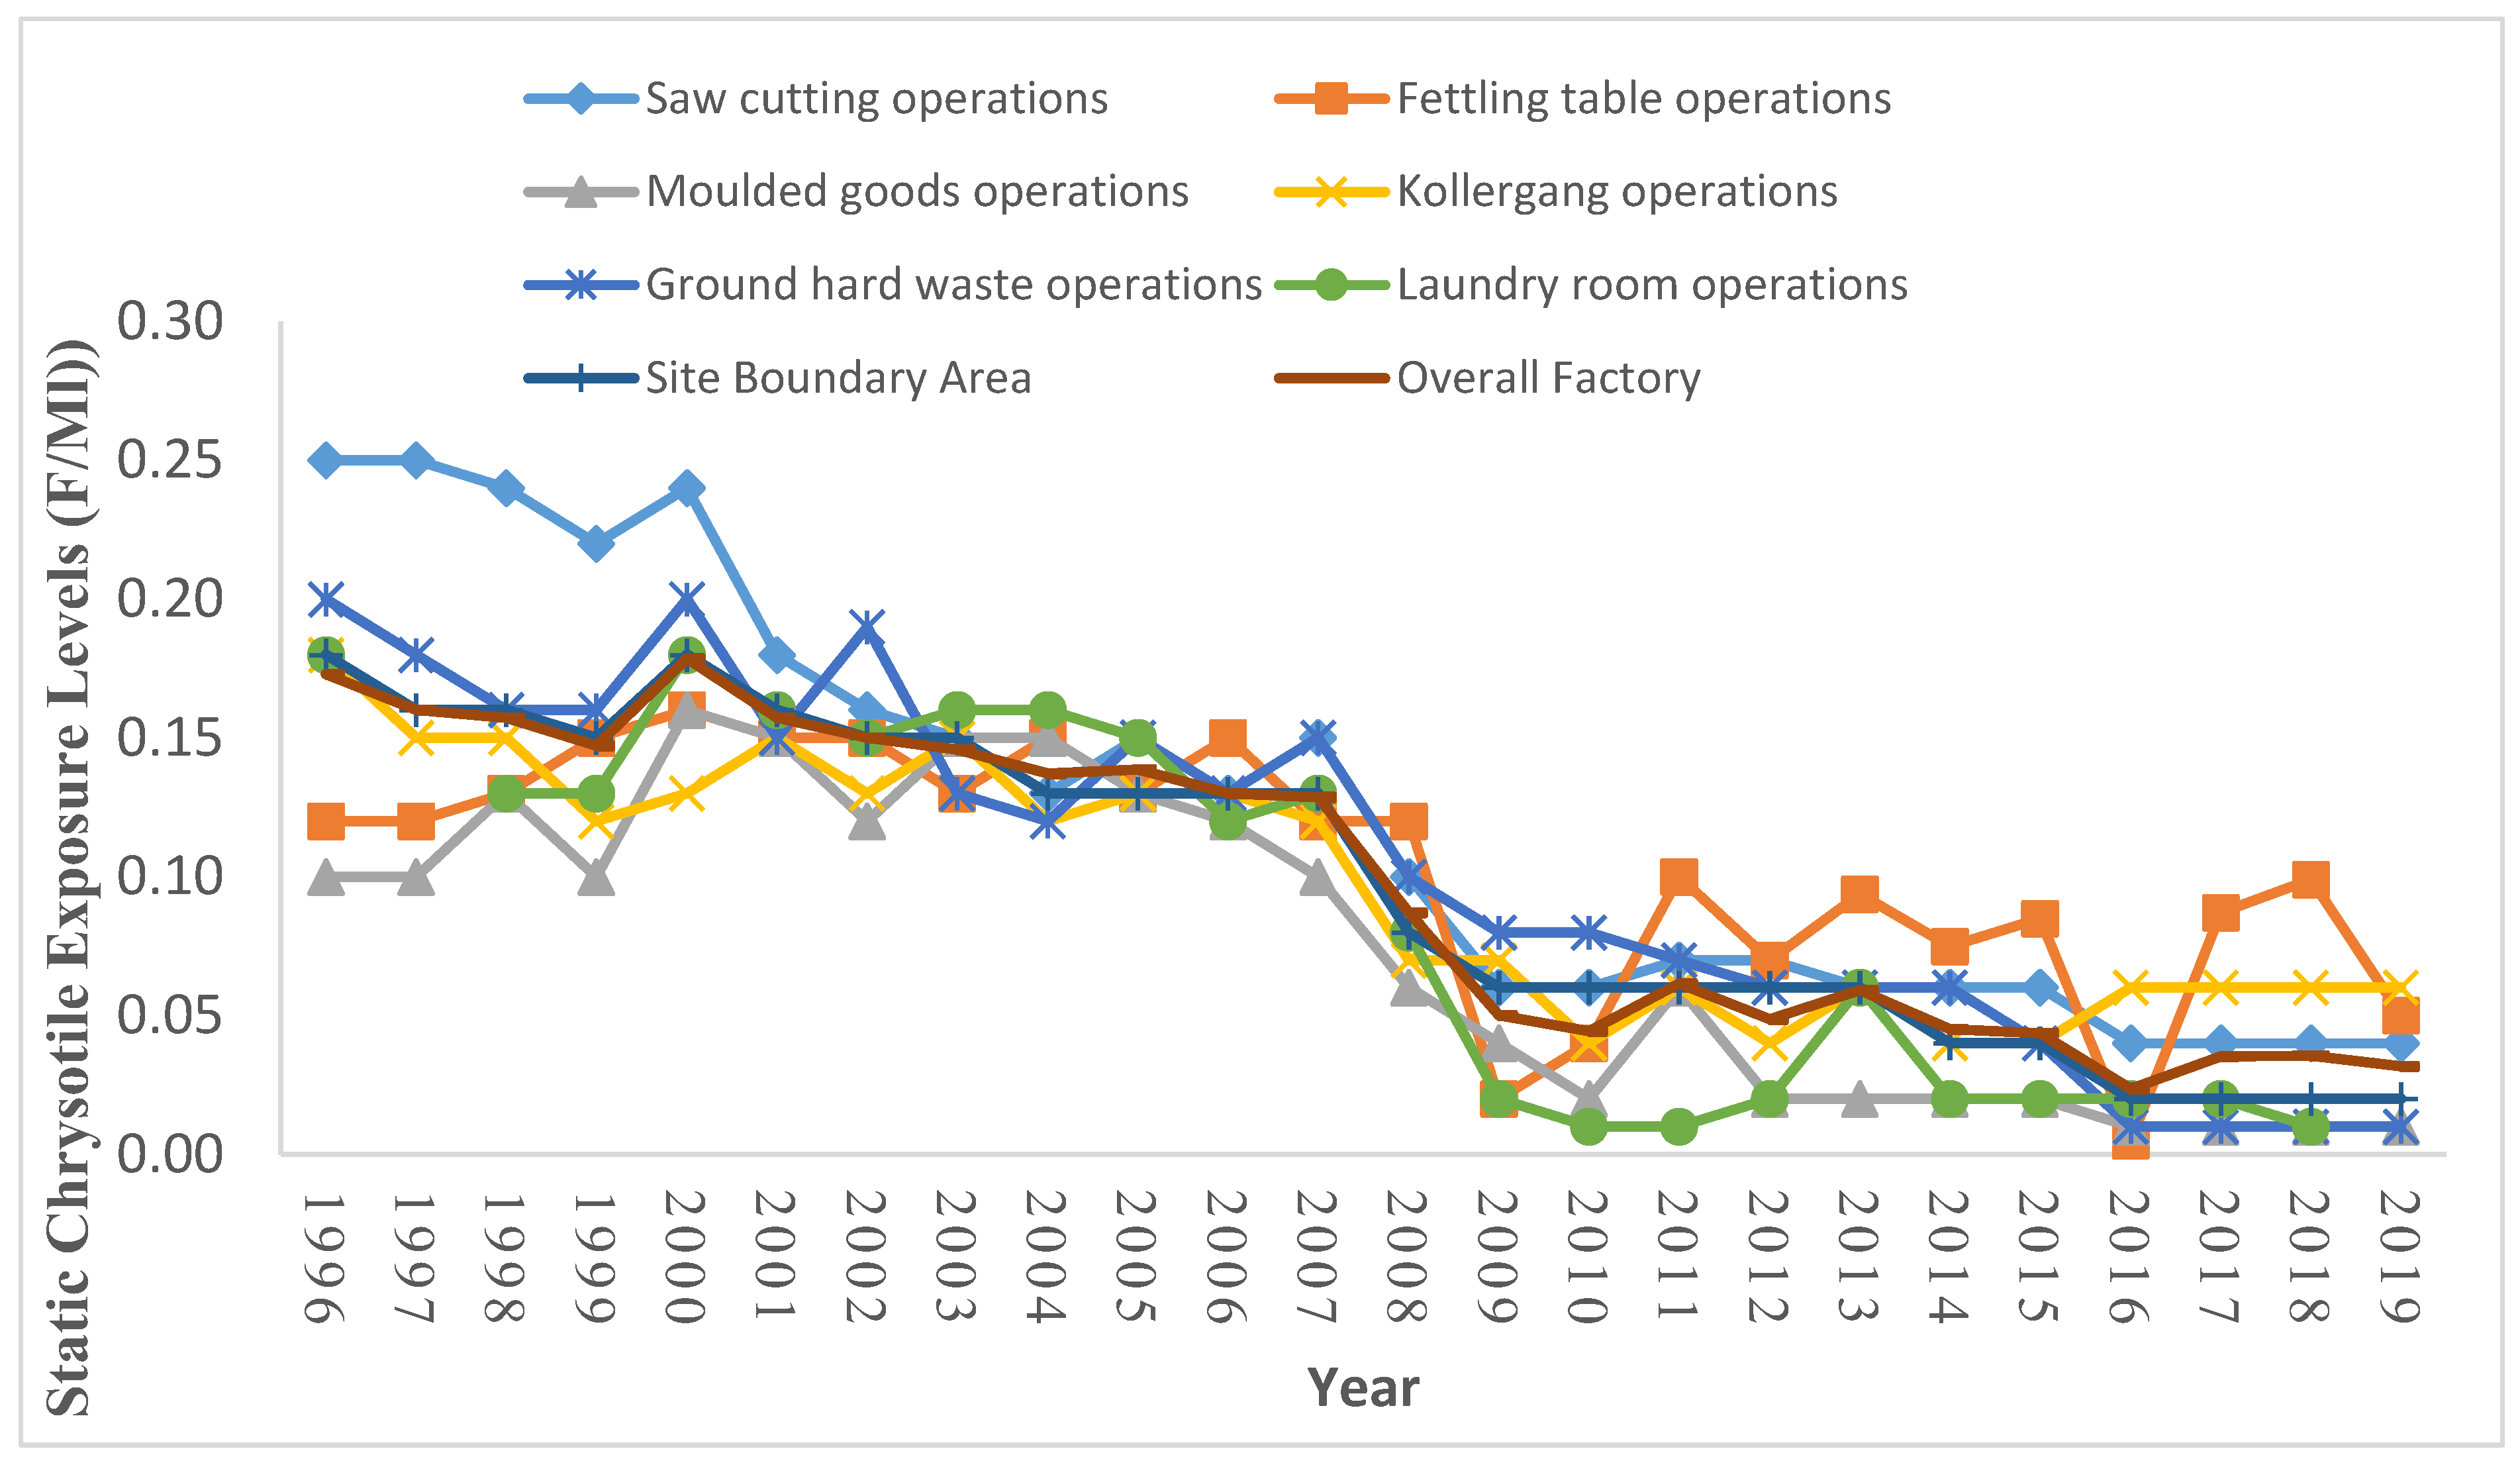
Figure 2.
Changes in static exposure chrysotile asbestos fibre levels from 1996 to 2019, Bulawayo Factory.
Figure 2.
Changes in static exposure chrysotile asbestos fibre levels from 1996 to 2019, Bulawayo Factory.
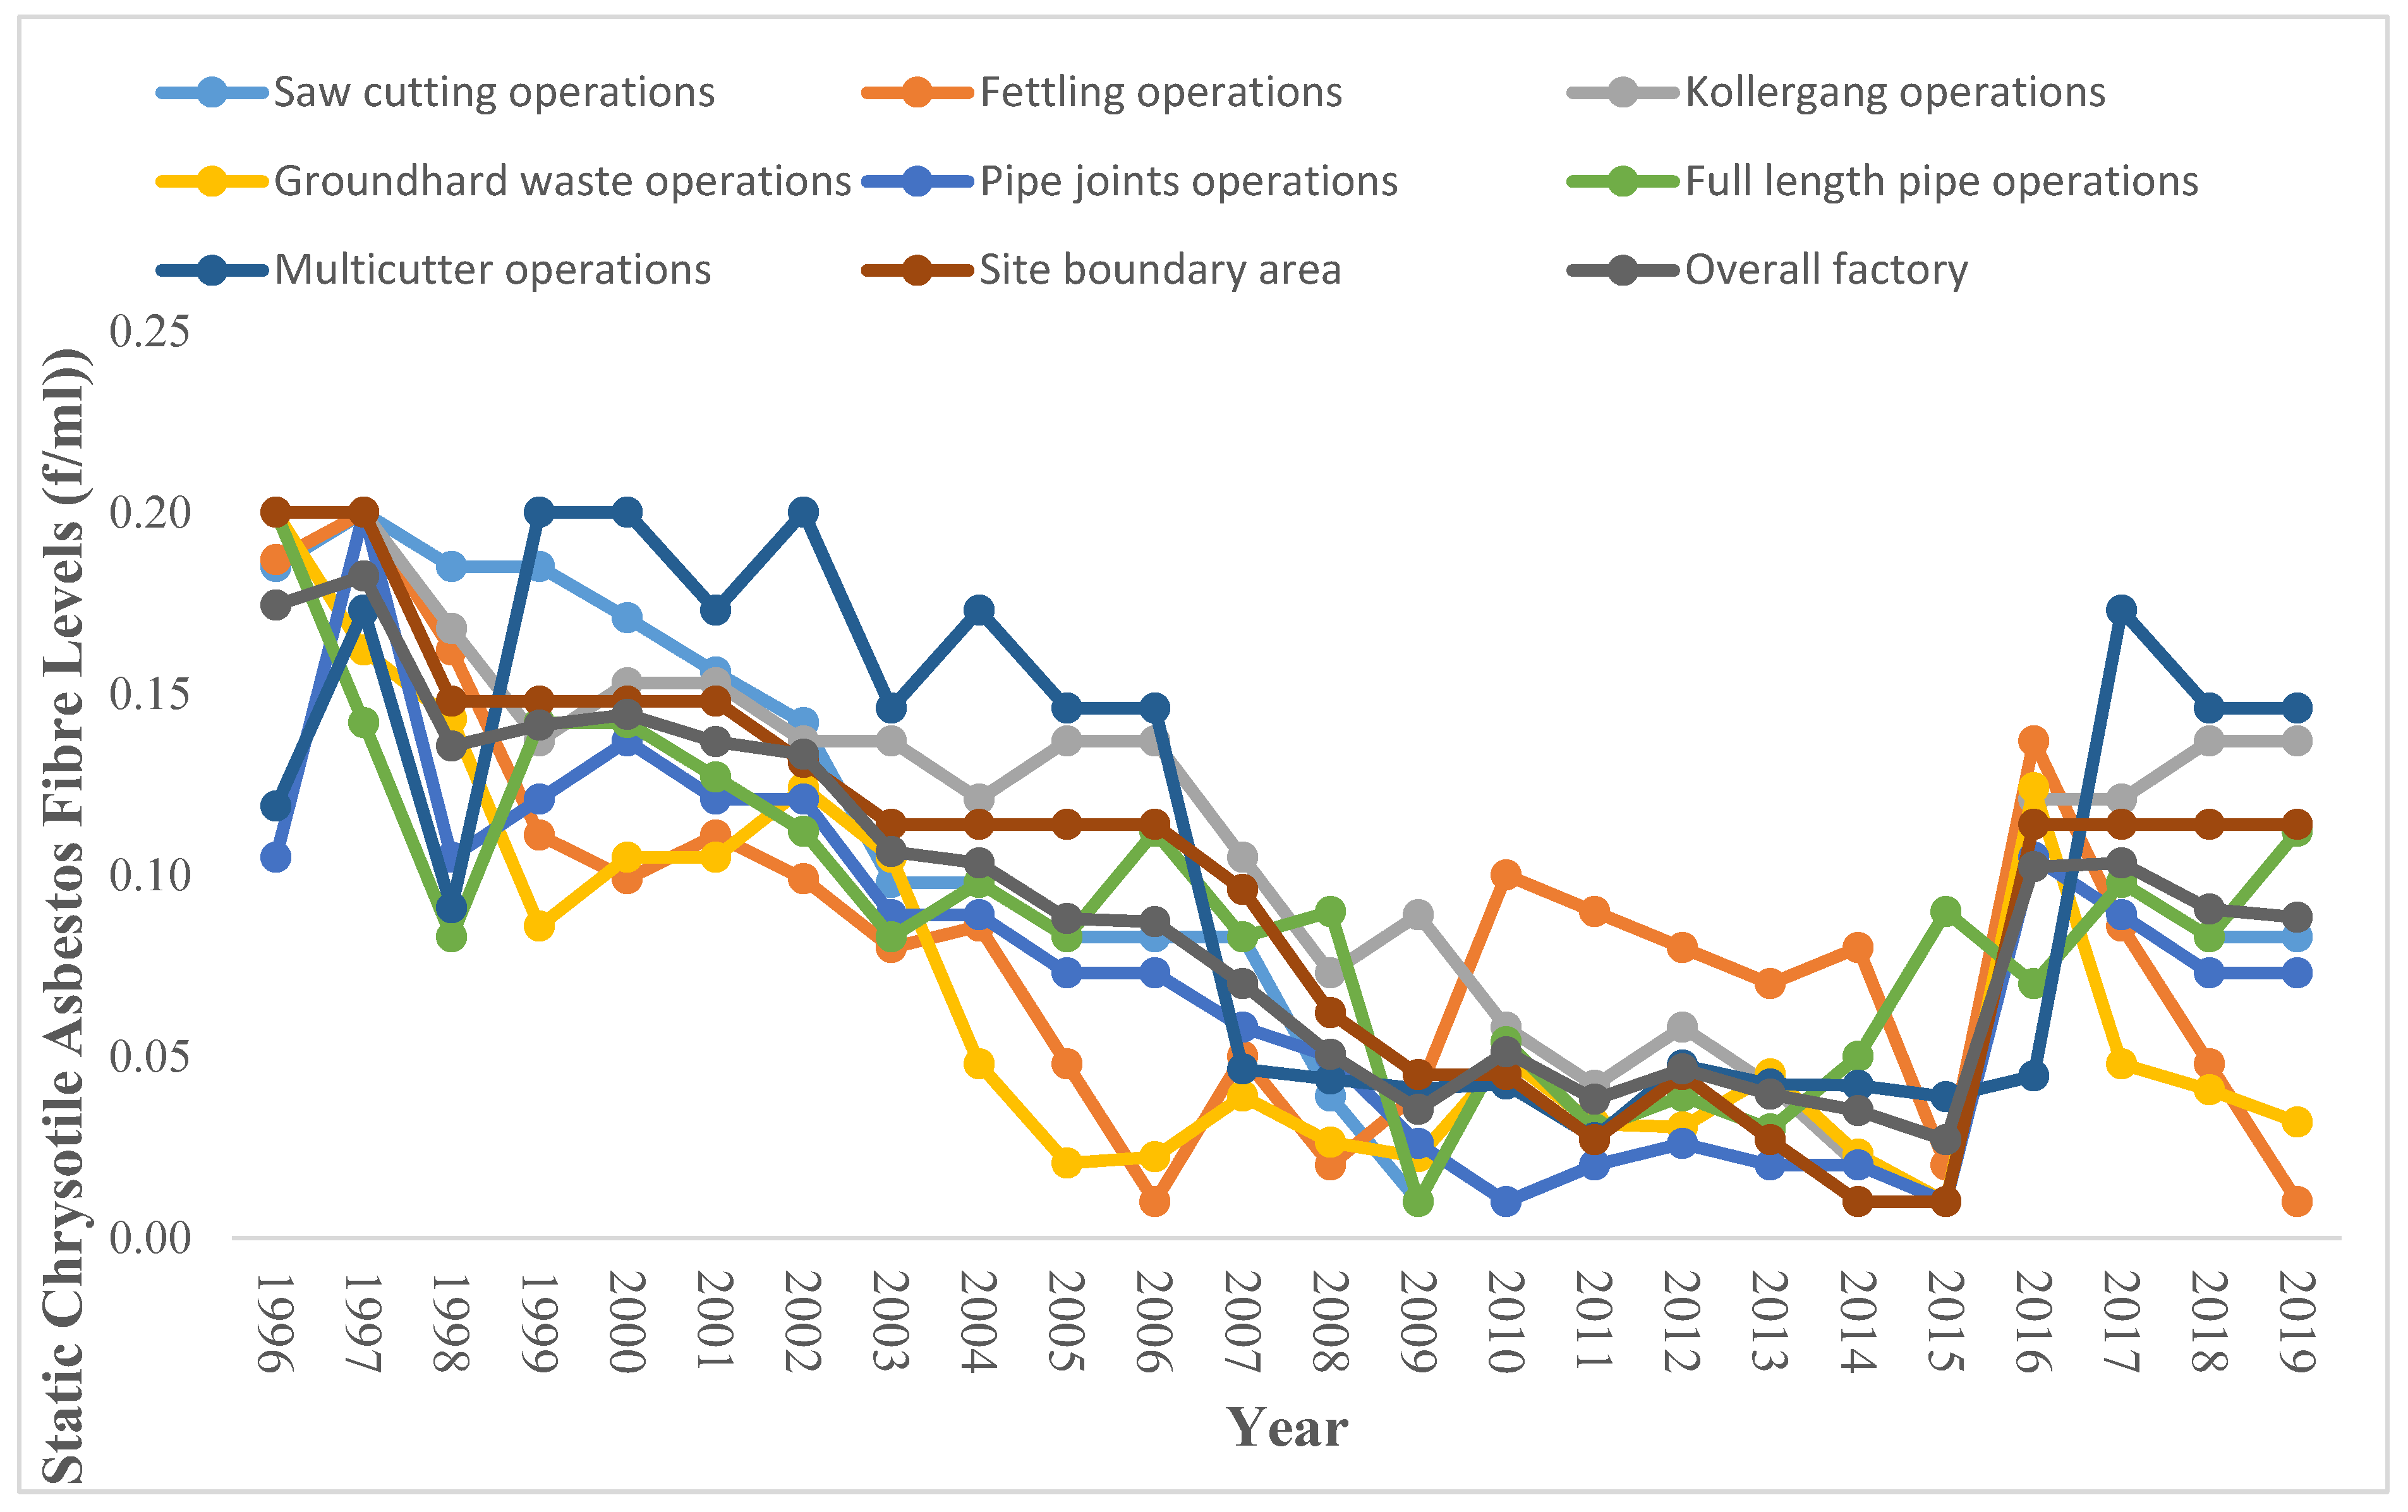

Table.
Description of operational areas used in static chrysotile fibre measurements in the Harare and Bulawayo factories.
Table.
Description of operational areas used in static chrysotile fibre measurements in the Harare and Bulawayo factories.
| Operational area | Description of activities in particular areas |
| Saws cutting operations | Chrysotile asbestos cement sheets and facia boards are cut to size. |
| Fettling table operations | Scrapping of unwanted chrysotile asbestos cement matter on finished moulded goods such as ridges, garden ware and polishing using sandpaper by operators. |
| Kollergang operations | 50 kg chrysotile asbestos bags are opened using a knife and loading the fibre into the process machine. |
| Moulded goods table operations |
Operators mould various goods under wet conditions, such as ridges, garden ware goods like flower vessels. |
| Ground hard waste operations |
Operator feeds chrysotile asbestos cement waste material into grinder machine for recycling back into process. |
| Pipe section – lathe machining of chrysotile asbestos pipe joints: |
Operators operate lathe machines such as sewer lathe, Lang lathe, broad bend lathe and Germinis lathe machines by machining joints so that they are ready for coupling pipes. |
| Pipe section – lathe machining of full-length chrysotile asbestos Sewer/water pipes. |
Operator operates lathe machines namely Faben, Voith and O&S lathe machines to prepare full length pipe for a joint and polish joint with sandpaper. |
| Pipe section - multi-cutter operations | Cutting full length pipes into collars used for coupling pipes using a multi-cutter machine. |
Source: Mutetwa et al., 2021 [4].
Table.
Mean static chrysotile asbestos fibre exposure levels (f/ml) for various operational areas in the chrysotile cement manufacturing factory – Harare Factory.
Table.
Mean static chrysotile asbestos fibre exposure levels (f/ml) for various operational areas in the chrysotile cement manufacturing factory – Harare Factory.
| Area | N | Mean | SD | Range | %>0.1 f/ml | |
| Max | Min | |||||
| Saw Cutting Section | 735 | 0.12 | 0.07 | 0.25 | 0.04 | 54 |
| Fettling Table Section | 645 | 0.10 | 0.04 | 0.14 | 0.01 | 58 |
| Moulded goods | 453 | 0.08 | 0.05 | 0.16 | 0.01 | 33 |
| Kollergang Section | 521 | 0.10 | 0.04 | 0.18 | 0.06 | 50 |
| Ground Hard Waste Section | 302 | 0.11 | 0.06 | 0.20 | 0.01 | 42 |
| Laundry room | 230 | 0.09 | 0.07 | 0.20 | 0.01 | 50 |
| Site (Boundary) area | 745 | 0.10 | 0.06 | 0.18 | 0.02 | 49 |
| Overall Factory | 3631 | 0.10 | 0.05 | 0.19 | 0.02 | 50 |
Table.
Mean static chrysotile asbestos fibre exposure levels (f/ml) for various operational areas in the chrysotile cement manufacturing factory – Bulawayo Factory.
Table.
Mean static chrysotile asbestos fibre exposure levels (f/ml) for various operational areas in the chrysotile cement manufacturing factory – Bulawayo Factory.
| Area | N | Mean | SD | Range | %>0.1 f/ml | |
| Max | Min | |||||
| Saw Cutting Section | 551 | 0.12 | 0.06 | 0.20 | 0.01 | 38 |
| Fettling Table Section | 431 | 0.08 | 0.05 | 0.20 | 0.01 | 25 |
| Kollergang Section | 325 | 0.11 | 0.05 | 0.17 | 0.01 | 67 |
| Ground Hard Waste Section | 460 | 0.11 | 0.05 | 0.20 | 0.02 | 33 |
| Pipe Joint Section | 309 | 0.08 | 0.06 | 0.20 | 0.01 | 38 |
| Full Length pipe operator | 320 | 0.09 | 0.04 | 0.20 | 0.02 | 35 |
| Site area | 650 | 0.10 | 0.04 | 0.20 | 0.03 | 63 |
| Overall Factory | 3046 | 0.09 | 0.05 | 0.19 | 0.02 | 43 |
Table.
Mean static exposure chrysotile asbestos fibre concentrations (f/ml) by time period between 1996 and 2019: Harare Factory.
Table.
Mean static exposure chrysotile asbestos fibre concentrations (f/ml) by time period between 1996 and 2019: Harare Factory.
| Area | Time Period | N | Mean | SD | 95% CI | Min | Max | |
| LB | UB | |||||||
| Fettling Table | 1996-2000 2001-2008 2009-2019 |
105 102 23 |
0.14 0.14 0.06 |
0.02 0.01 0.03 |
0.12 0.13 0.04 |
0.16 0.15 0.08 |
0.12 0.12 0.01 |
0.16 0.15 0.10 |
| Ground Hard Waste | 1996-2000 2001-2008 2009-2019 |
240 155 250 |
0.18 0.14 0.04 |
0.02 0.03 0.03 |
0.16 0.12 0.02 |
0.20 0.16 0.06 |
0.16 0.10 0.01 |
0.20 0.19 0.08 |
| Kollergang | 1996-2000 2001-2008 2009-2019 |
220 120 113 |
0.15 0.12 0.05 |
0.02 0.03 0.01 |
0.12 0.10 0.05 |
0.17 0.15 0.06 |
0.12 0.07 0.04 |
0.18 0.15 0.07 |
| Laundry Room | 1996-2000 2001-2008 2009-2019 |
221 120 200 |
0.16 0.14 0.02 |
0.03 0.03 0.01 |
0.12 0.12 0.01 |
0.20 0.16 0.03 |
0.13 0.08 0.01 |
0.20 0.16 0.06 |
| Moulded Goods | 1996-2000 2001-2008 2009-2019 |
150 130 22 |
0.12 0.12 0.02 |
0.03 0.03 0.02 |
0.08 0.10 0.01 |
0.15 0.15 0.03 |
0.10 0.06 0.01 |
0.16 0.15 0.06 |
| Saw Cutting | 1996-2000 2001-2008 2009-2019 |
350 255 230 |
0.24 0.14 0.05 |
0.01 0.02 0.01 |
0.22 0.12 0.05 |
0.26 0.16 0.06 |
0.22 0.10 0.04 |
0.25 0.18 0.07 |
| Overall Factory Mean | 1996-2000 2001-2008 2009-2019 |
1286 762 838 |
0.17 0.13 0.04 |
0.01 0.02 0.02 |
0.15 0.11 0.03 |
0.18 0.15 0.05 |
0.15 0.08 0.02 |
0.18 0.16 0.06 |
Table.
Mean static exposure chrysotile asbestos fibre concentrations (f/ml) by time period between 1996 and 2019: Bulawayo Factory.
Table.
Mean static exposure chrysotile asbestos fibre concentrations (f/ml) by time period between 1996 and 2019: Bulawayo Factory.
| Area | Time Period | N | Mean | SD | 95% CI | Min | Max | |
| LB | UB | |||||||
| Fettling | 1996-2000 2001-2008 2009-2019 |
300 121 100 |
0.15 0.06 0.07 |
0.05 0.04 0.04 |
0.10 0.03 0.04 |
0.21 0.09 0.10 |
0.10 0.01 0.01 |
0.20 0.11 0.14 |
| Full Length Pipe | 1996-2000 2001-2008 2009-2019 |
210 100 121 |
0.14 0.10 0.06 |
0.04 0.02 0.03 |
0.09 0.08 0.04 |
0.19 0.11 0.08 |
0.08 0.08 0.01 |
0.20 0.13 0.11 |
| Ground Hard Waste | 1996-2000 2001-2008 2009-2019 |
100 125 100 |
0.14 0.07 0.04 |
0.04 0.04 0.03 |
0.09 0.03 0.02 |
0.19 0.10 0.06 |
0.09 0.03 0.01 |
0.20 0.12 0.12 |
| Kollergang | 1996-2000 2001-2008 2009-2019 |
230 100 130 |
0.17 0.13 0.08 |
0.03 0.03 0.05 |
0.14 0.10 0.04 |
0.21 0.15 0.11 |
0.14 0.07 0.01 |
0.20 0.15 0.14 |
| Multi-cutter | 1996-2000 2001-2008 2009-2019 |
100 101 108 |
0.16 0.13 0.06 |
0.05 0.06 0.05 |
0.09 0.08 0.03 |
0.22 0.18 0.09 |
0.09 0.03 0.02 |
0.20 0.20 0.17 |
| Pipe Joints | 1996-2000 2001-2008 2009-2019 |
200 90 30 |
0.14 0.08 0.05 |
0.04 0.03 0.04 |
0.09 0.06 0.03 |
0.18 0.11 0.08 |
0.11 0.05 0.01 |
0.20 0.12 0.11 |
| Saw Cutting | 1996-2000 2001-2008 2009-2019 |
310 100 240 |
0.19 0.10 0.07 |
0.01 0.04 0.04 |
0.17 0.07 0.01 |
0.20 0.13 0.13 |
0.17 0.04 0.01 |
0.20 0.16 0.10 |
| Site Area Mean | 1996-2000 2001-2008 2009-2019 |
300 105 245 |
0.17 0.11 0.06 |
0.03 0.03 0.04 |
0.14 0.09 0.03 |
0.20 0.13 0.09 |
0.15 0.06 0.01 |
0.20 0.15 0.11 |
| Overall Factory Mean | 1996–2000 2001–2008 2009–2019 |
0.17 0.11 0.06 |
0.03 0.03 0.04 |
0.14 0.09 0.03 |
0.20 0.13 0.09 |
0.15 0.06 0.01 |
0.20 0.15 0.11 |
|
Disclaimer/Publisher’s Note: The statements, opinions and data contained in all publications are solely those of the individual author(s) and contributor(s) and not of MDPI and/or the editor(s). MDPI and/or the editor(s) disclaim responsibility for any injury to people or property resulting from any ideas, methods, instructions or products referred to in the content. |
© 2025 by the authors. Licensee MDPI, Basel, Switzerland. This article is an open access article distributed under the terms and conditions of the Creative Commons Attribution (CC BY) license (http://creativecommons.org/licenses/by/4.0/).
Copyright: This open access article is published under a Creative Commons CC BY 4.0 license, which permit the free download, distribution, and reuse, provided that the author and preprint are cited in any reuse.


