Submitted:
08 October 2025
Posted:
08 October 2025
You are already at the latest version
Abstract
Driver distraction and diminished alertness remain key contributors to road‑traffic accidents. This study introduces a real‑time multimodal driver‑monitoring framework that fuses heart rate (HR) signals with gaze‑based metrics. Five licensed drivers undertook 480 minutes of naturalistic driving in both urban and motorway settings while instrumented with Polar H10 chest‑strap ECG sensors and Pupil Labs Invisible eye‑tracking glasses. Inferential statistics (p<0.05) revealed significantly higher mean HR and more frequent gaze indicators of cognitive load during urban driving. Leveraging these findings, we designed a weighted‑fusion algorithm that combines HR, blink duration, fixation duration, and saccade kinematics into a single alertness score, which is then compared with a tunable binary threshold. A sensitivity analysis shows that adjusting feature weights and the decision threshold enables a controllable trade‑off between false alarms and missed detections. The results demonstrate the feasibility of integrating physiological and gaze information for practical, real‑time detection of reduced driver alertness, paving the way for adaptive in‑vehicle safety systems that proactively mitigate risk.
Keywords:
multimodal driving framework
; heart rate
; gaze tracking
; mental workload
1. Introduction
Road traffic accidents remain a significant global public health concern, accounting for more than 1.35 million fatalities annually [1]. Driver distraction and reduced alertness have consistently been cited as the major contributors to these accidents, with studies substantial proportion of crashes involve a distracted driver [2,3]. This challenge is further compounded by the steady increase in automobile usage worldwide, where the total number of vehicles grew from 1.2 billion to 1.59 billion between 2015 and 2020 [4]. Therefore, developing strategies to maintain driver awareness and mitigate distraction is crucial to reducing road traffic incidents.
A promising approach to improving road safety centers on the continuous monitoring of physiological and behavioral states [5]. Heart Rate (HR) data, in particular, can serve as a real-time signal of stress, cognitive workload, and fatigue [6,7,8]. For example, a study observed that HR increased by roughly 2.5% to 3% during aggressive driving [6], indicating an association between increased physiological reactivity and increased driving tension [9]. Simultaneously, gaze-based measures, such as blink rate, fixation duration, and saccadic movements, have been shown to correlate with fluctuations in visual attention and cognitive load [10,11,12,13,14,15,16]. By combining insights from both vital signs and gaze behavior, it become possible to to achieve a more comprehensive understanding of a driver’s alertness and detect early signs of potential distraction or fatigue [17].
Despite the evident synergy between physiological and gaze-based signals, most multimodal driver monitoring systems have been validated primarily under controlled laboratory or simulator conditions [18,19,20]. Although simulators offer significant advantages, such as the precise reproducibility of driving tasks and seamless synchronization of sensor data, they cannot fully encapsulate the variability of real-world driving environments. Factors like unpredictable traffic, adverse weather, and evolving driver mental states are more difficult to replicate in a simulator [21], casting doubts on the direct applicability of simulator findings to actual on-road scenarios.
In addition, many real-world studies continue to rely on single-modality techniques [7,10,22], which may provide an incomplete picture of the driver’s state. An outstanding research gap exists in the development and validation of truly multimodal frameworks that incorporate both HR and gaze metrics validated in naturalistic driving settings.
This study aims to address these limitations by:
- Collecting real-world multimodal data: Acquiring a synchronized dataset of HR and gaze measurements from real-world driving, extending beyond what simulator-based or single-modality research has thus far achieved.
- Performing scenario-based and subject-based analyses: Examining how different driving environments shape the interaction between physiological and visual indicators, ultimately informing more about driving behavior. Statistical analysis will help set thresholds for the proposed multimodal algorithm.
- Proposing a multimodal driver monitoring algorithm: Developing a weighted scoring system that integrates physiological signals (HR) with gaze-related metrics (blink, fixation, and saccade) in real time, classifying driving segments as either normal or abnormal, and illustrating how the fusion of these modalities can provide enhanced understanding of driver vigilance.
The remainder of this paper is organized as follows. Section 2 provides a detailed review of related work on driver monitoring approaches. Section 3 describes the experimental methodology, detailing the hardware setup, data synchronization procedures, and the proposed multimodal algorithm. Section 4 then outlines our experimental results, including scenario-based analyses and the proposed algorithm. Finally, Section 5 concludes the paper by summarizing key findings and discussing future directions for enhancing multimodal driver monitoring.
2. Related Work
The evolution in driver monitoring systems has been considerable due to advances in physiological and eye-tracking sensing technologies. This section reviews notable advancements in driver monitoring, addresses persistent issues in multimodal integration, and situates our study within the practical context of algorithmic innovation.
2.1. Physiological Monitoring in Driving Contexts
Physiological metrics such as HR have emerged as a robust biomarker of cognitive states, with a study by [7] showing a 9.3% reduction in HR during drowsy highway driving. Real-world studies, such as [6], have further established task-dependent HR fluctuations, showing increases from 2.5% to 3% during aggressive maneuvers. Another study [23] utilized HR to assess driver fatigue. However, such research predominantly examined a single modality and used bulk medical electrocardiogram (ECG) systems (e.g., Holter monitors), which limit naturalistic validity. In contrast, wearable chest sensors such as the Polar H10 [24] now enable unobtrusive monitoring and have already been used in validated research [25].
2.2. Gaze Monitoring in Driving Contexts
Eye-tracking research has progressed from controlled experiments to naturalistic driving studies. Early simulator work [26] established baseline blink thresholds (100–400 ms) and fixation thresholds (150–900 ms), while [27] linked cognitive load to gaze metrics. Real-world advancements include [10], who demonstrated 20% wider gaze dispersion on residential roads versus motorways using head-mounted eye trackers, and [28], who proposed purpose-based gaze interpretation for pedestrian detection. The DR(eye)VE project [29] marked a milestone by correlating gaze patterns with the saliency of the real-world scene between different drivers, but omitted physiological integration. Despite these advances, gaze-only systems struggle to differentiate cognitive states (e.g., stress vs. fatigue) [30], which requires considering other modalities and metric inputs.
2.3. Multimodal Approaches
Recent efforts to fuse physiological and visual data highlight the potential and challenges of multimodal systems. [18] achieved 89% distraction detection accuracy in simulators using thermal cameras and ECG, while [20] developed a six-degree-of-freedom simulator dataset with synchronized EEG and eye tracking. However, as Table 1 illustrates, multimodal studies [18,19,20] remain simulator bound, failing to capture real environment factors.
Significant progress has been made in driver monitoring systems, but limitations remain, particularly in the reliance on simulator and laboratory environments [18,20,22,23,26,33]. Real-world studies are needed for better generalization. Integrating multimodal data, such as combining gaze and physiological signals, can enhance the accuracy of the system [34]. This present study collects real-world data, integrating eye-tracking and HR metrics for a comprehensive driver monitoring system, enhancing abnormal state detection beyond single modality or simulator-based approaches.
3. System Model
In this section, the detailed workflow of the study is explained, starting with data collection, moving on to analyzing the results, and ending with the proposed multimodal algorithm. The system model is generally depicted in Figure 1.
3.1. Data Collection Setup
Real-world driving environment experiments were conducted to collect data for our multimodal driver monitoring project. Although the presented work here is a pilot study, it includes a substantial amount of driving data, totaling 480 minutes, which provides sufficient data points for preliminary validation and statistical analysis. Five licensed participants, as detailed in Table 2, drove their vehicles, ensuring they were comfortable with the driving environment and minimizing the influence of unfamiliar vehicle dynamics.
Before commencing the actual drives, participants underwent a familiarization period in a parking lot. During this period, all sensors were worn for at least 20 minutes while the copilot ensured correct sensor operation and participant comfort. Participants also drove short loops within the parking area to acclimate to the equipment, proceeding to public roads only when they felt safe and comfortable.
Two wearable sensing systems were deployed: Pupil Labs Invisible eye-tracking glasses [35] connected to a companion smartphone for continuous gaze data acquisition, and the Polar H10 chest-worn sensor [24] for HR monitoring. A dashcam recorded the forward road view for reference and potential manual labeling. The copilot was responsible for hardware handling, synchronization, and real-time monitoring of data quality. Figure 2 illustrates the complete setup in a real driving environment.
Data collection took place mostly during the daytime and under various weather conditions, including clear skies, overcast conditions, and light rain. Extreme weather scenarios (e.g., heavy rain, fog) were intentionally excluded to maintain consistent visual and physiological measurement conditions. Traffic conditions were naturally variable, ranging from low-density rural motorway segments to dense urban traffic, and included both high-flow and stop-and-go conditions. While traffic density and environmental variability are recognized as influencing factors, this pilot dataset reflects uncontrolled, realistic conditions. More systematic control of these variables is planned for future large-scale studies.
Driving scenarios were naturally mixed, with participants alternating between city and motorway environments over multiple sessions and on different days. The final dataset comprises approximately urban driving and motorway driving. In total, the data collection yielded 28,963 HR samples, 10,669 blink events, 63,300 fixation events, and 63,050 saccade events, forming a rich multimodal dataset for analysis.
All participants provided informal consent before the study, acknowledging the voluntary nature of participation and their understanding of the procedures involved. Given the pilot nature of this work and the use of commercially available sensors, formal institutional ethical approval was not sought at this stage; however, future studies involving broader participant recruitment will follow formal ethical approval protocols.
3.2. HR Data Collection and Processing
HR data were collected using the Polar H10 chest strap [24], a device known for its high reliability and validity in measuring HR in various settings [36] and shown in Figure 2c. The Polar H10 records raw electrocardiogram (ECG) signals at a sampling frequency of 1000 Hz [36]. In this study, HR data were processed to output an HR value at 1 Hz, which is sufficient for capturing temporal changes in HR during real-world driving. The strap incorporates plastic electrodes on the underside to detect the heart’s electrical activity, and was securely positioned around the lower chest to ensure stable and accurate measurements throughout each driving session. Data collection was managed via the Polar Beat smartphone application, which allowed real-time monitoring and session control. Upon completion, the recorded data were uploaded to the Polar cloud service for secure storage and subsequently downloaded to a PC for further processing and analysis. This study focuses on HR rather than heart rate variability (HRV). While HRV can provide additional information on autonomic nervous system activity, our focus is motivated by the fact that HR alone has demonstrated strong sensitivity to cognitive and environmental driving demands. State-of-the-art research [37] has shown that HR can achieve higher accuracy than HRV in differentiating cognitive load during urban and motorway driving scenarios. Nevertheless, HRV analysis is recognized as a valuable complementary measure and will be incorporated in future studies to provide a more comprehensive physiological assessment.
3.3. Gaze Data Collection and Processing
The gaze data were collected using Pupil Labs Invisible glasses [35], an advanced eye-tracking device designed for dynamic real-world scenarios, as shown in Figure 2b. The glasses are equipped with a front-facing scene camera and two infrared (IR) eye cameras that capture eye images at a resolution of 192 x 192 pixels and a frequency of 200 Hz. A companion device runs a neural network algorithm [38] to compute gaze data. During recording, the Pupil invisible companion device calculates gaze data in real-time, with the frame rate dependent on the companion device model. For this work, using a OnePlus 8, the frame rate is over 120 Hz. Once uploaded to the Pupil Lab cloud, the gaze data is recalculated at the maximum frame rate of 200 Hz. Then, the Pupil Labs algorithms were employed for gaze data processing. Blink detection is achieved through an XGBoost classifier trained on device-specific datasets, ensuring high recall and low false detection rates [39]. This algorithm processes optical flow patterns associated with eyelid closure and reopening events, resulting in accurate detection of blink events with a recall of approximately 95% [39].
Fixation events were identified using an extended I-VT (identification by velocity threshold) algorithm [40]. This method compensates for head and body movements through optical flow correction and applies adaptive velocity thresholds based on dynamic scene conditions. Events with durations below physiological plausibility thresholds were filtered, ensuring precise fixation detection even in challenging real-world scenarios. Saccade events were detected as transitions between fixations using thresholds for velocity, amplitude, and duration [40].
3.4. Data Analysis
The collected gaze and HR data were systematically analyzed to extract meaningful metrics to assess the state of the driver. The analysis consisted of reading and synchronizing the data, cleaning outliers, and performing statistical analyses to uncover insights based on subjects and driving scenarios.
Initially, gaze data, including blinks, fixations, and saccades, and HR data were read from their respective files. Synchronization was achieved by normalizing the timestamps to ensure temporal alignment across datasets. The normalized timestamp t was calculated as:
where is the original timestamp, is the minimum timestamp in the dataset segment.
Outlier removal was performed to enhance data quality by excluding physiologically implausible values. For each metric m, data points that fall outside the predefined lower and upper bounds were discarded:
This step ensured that the analyses were not skewed by erroneous measurements or artifacts. The limits used in this study are illustrated in Table 3.
To gain insights into driver behavior, we conducted a frequency distribution analysis and computed metric counts. Frequency distributions were generated for key metrics such as blink duration, fixation duration, saccade duration, saccade amplitude, saccade velocity, and HR. For each metric, data were binned, and the frequency percentage for each bin was calculated:
Analyzing these distributions enabled us to observe patterns and variations in HR and gaze behavior under different conditions. Ultimately, it also helped establish the thresholds for what can be considered normal or abnormal. Moreover, to get an idea of how different scenarios and subjects vary, normalized counts per minute were calculated for blinks, fixations, and saccades. The counts per minute or second, which facilitated fair comparisons irrespective of the duration of each driving session, were computed as:
To statistically validate scenario-based differences in HR and gaze metrics, pairwise comparisons were conducted between driving scenarios using Welch’s t-test [41], which does not assume equal variances. For each metric, samples and corresponding to two different scenarios were compared. The test statistic was computed as:
where , , and denote the sample mean, variance, and size for scenario i, respectively. The resulting p-values were used to assess the statistical significance of observed differences, with indicating a significant effect of the driving scenario on the corresponding metric. This analysis ensured that only metrics with sufficient sample size and statistically significant variation were used to inform the threshold and weight selection in the proposed multimodal algorithm that will be detailed next.
3.5. Driver Multimodal Monitoring Algorithm
As discussed in Section 1 and Section 2, there is a need for a comprehensive algorithm that is both computationally lightweight and practical for real-time deployment in on-road driving environments. To address this, we propose a Driver Multimodal Monitoring Algorithm that integrates physiological and gaze-based metrics at the decision level. The fusion occurs through a weighted decision-making process, combining HR and gaze metrics into a unified state score. This approach not only enables real-time driver state estimation but also establishes a foundation for future refinements in parameter tuning based on scenario-specific labeling and deep learning models.
The collected data are divided into fixed-length segments of duration T (set to 10 seconds in this study). Although the proposed algorithm can be adapted to any window length, a 10-second duration has been shown to effectively capture short-term changes in physiological and visual attention, while remaining responsive to transient events. Longer windows could capture more context but would reduce the temporal sensitivity of the system [42]. Optimizing the window size for each modality is left for future work. For each segment s, key metrics are calculated, including the mean HR (), mean blink duration (), mean fixation duration (), and mean saccade metrics—duration (), amplitude (), and velocity (). Each metric is compared against statistically informed thresholds and classified as Normal or Abnormal. To prioritize more informative modalities, a weighted scoring system is employed. The metric weights were initially determined based on statistical analyses of our dataset (Section 4.1), with additional validation through sensitivity analysis (Section 4.2.3). These initial values serve as a baseline for future refinement once larger, more comprehensively labeled datasets are available. The weighting framework follows methodologies from mental workload estimation [43] and cognitive workload fusion [44], emphasizing factors that contribute most significantly to classification performance [45]. The overall score for each segment is computed as:
Here, , , , and are the respective metric weights, and is an indicator function returning 1 if the condition is true and 0 otherwise.
The final decision is derived using a decision threshold , set to in this pilot study. A binary classification (Normal vs. Abnormal) was intentionally adopted for real-time practicality, as it facilitates rapid intervention in safety-critical contexts without the computational overhead of multi-class classification [46]. The classification rule is:
Sensitivity analyses were conducted to examine how varying and the weights affect classification outcomes (Section 4.2.3). The results confirm that weight calibration strongly influences detection rates and highlight the importance of carefully selecting that represents accurate driver state detections. Algorithm 1 presents a step-by-step pseudocode implementation of the proposed system, showing the complete flow from metric extraction to decision-level fusion.
| Algorithm 1:Multimodal Driver Monitoring |
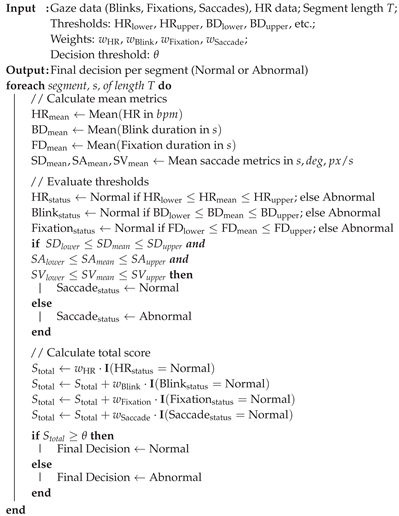 |
4. Experimental Results
This section presents the experimental results derived from our study, which involved collecting and analyzing approximately 480 minutes of real driving data from five subjects. The driving scenarios included city and motorway conditions, capturing a diverse range of driving behaviors and environments.
The results are organized into two main subsections. In Section 4.1, observations based on different scenarios and subjects are detailed, highlighting variations in HR and gaze metrics. In Section 4.2, the proposed multimodal driver monitoring algorithm is applied and evaluated.
4.1. Observations Based on Different Scenarios and Subjects
4.1.1. HR Analysis
The HR distribution for each subject in different scenarios is illustrated in Figure 3. HR was consistently higher during city driving compared to motorway driving. Subject 3 exhibited the highest HR in both scenarios, averaging 97.35 bpm in the city and 96.54 bpm on the motorway. In contrast, Subject 5 recorded the lowest HR averages, at 71.30 bpm in the city and 69.89 bpm on the motorway. HR values across all participants ranged from 69.89 bpm to 97.35 bpm, highlighting personal variability that may be influenced by stress levels, driving experience, or acclimatization to different driving conditions. Notably, Subject 3 drove on a warm sunny day without air conditioning, potentially contributing to increased physiological responses. Subject 5, with over 20 years of driving experience, drove an automatic car, likely influencing lower physiological stress responses. The overall HR distribution across all subjects is presented in Figure 4, confirming a statistically significant difference between scenarios (city: 91.63 bpm, motorway: 89.42 bpm; , ).
4.1.2. Blink and Fixation Analysis
Blink and fixation rates were segmented into 1-minute intervals for detailed analysis across different driving scenarios and subjects. As depicted in Figure 5, blink rates were consistently higher on the motorway compared to the city. For example, Subject 1 showed an increased blink rate on the motorway (31.03±6.89 blinks/min) compared to the city (26.61±5.91 blinks/min). Similar trends were observed for other subjects, with increased blink rates in motorway driving.
Conversely, fixation rates (per second) were higher in city scenarios, indicating increased visual engagement and cognitive workload (e.g., Subject 1 city: 2.18±0.29 fixations/s vs. motorway: 1.77±0.34 fixations/s). A similar pattern was evident across other subjects, with Subject 2 showing the highest fixation rate of 2.60±0.31 fixations/s in the city, compared to 2.29±0.25 fixations/s on the motorway.
Aggregated data across subjects revealed statistically significant scenario differences for blink rates (motorway: 24.29±8.02 blinks/min vs. city: 21.20±7.51 blinks/min; , ) and fixation rates (city: 2.29±0.40 fixations/s vs. motorway: 2.02±0.41 fixations/s; , ), aligning with previous research [47,48,49].
Detailed analysis of blink and fixation durations (Figure 6) showed motorway driving had slightly longer blink durations (367.38±82.68 ms) compared to city driving (359.99±82.46 ms; , ). Fixation durations were significantly longer during motorway driving (390.84±385.23 ms) versus city driving (343.57±331.27 ms; , ). These findings reflect the different visual engagement patterns required in each driving scenario.
4.1.3. Saccadic Movement Characteristics
Analysis of saccade metrics (duration, amplitude, and velocity) is presented in Figure 7. Motorway driving resulted in longer average saccade durations (99.60±108.93 ms) compared to city driving (87.14±108.92 ms; , ). Similarly, mean saccade amplitude was higher on the motorway (11.18±11.34°) versus the city (10.46±9.71° , ). Conversely, saccade velocity was faster in city driving (2403.99±1016.49 px/s) compared to motorway (2335.76±1064.29 px/s; , ). These findings suggest distinct gaze behavior patterns, influenced by visual demands specific to each scenario.
4.1.4. Interpretation and Implications of Findings
These observations show that physiological and gaze metrics differ across driving scenarios and subjects. Higher HR and lower blink rates during city driving indicate greater cognitive demands due to the urban environment’s dynamic nature. Conversely, longer fixation durations on motorways suggest sustained attention is necessary for monitoring the road ahead. The extended saccade durations likely relate to longer gaze transitions between the road and mirrors.
The noted differences among subjects underscore the impact of individual factors such as driving experience, environmental conditions, and vehicle characteristics on physiological responses. These findings establish baseline variations in HR and gaze metrics, providing a foundation for the multimodal algorithm discussed next.
4.2. Real-Time Multimodal Algorithm Performance
4.2.1. Justification of Algorithm Parameters
The multimodal driver monitoring algorithm, detailed in Section 3.5, was evaluated using the collected dataset to assess its real-time efficacy in driver state monitoring. This evaluation aimed to showcase the algorithm’s capability to integrate HR and gaze metrics for crucial driving state classification. Threshold values for the algorithm were established through statistical data analysis presented in Section 4.1, and supported by insights from previous research.
Normal segments were characterized by HR and gaze metrics that fell within well-established normal ranges, which were determined by a combination of existing literature [26,50] and the statistical distributions observed in our dataset. For instance, the threshold for blink duration (set at 100–400 ms) was selected based on normative values reported in prior studies and further refined using our collected dataset. Specifically, the distribution of blink durations in our study (Figure 6a) showed a mean of 367.38 ms with a standard deviation of 82.68 ms, supporting the chosen upper and lower bounds.
Similarly, other thresholds were derived as follows: segments with mean HR between 65–95 bpm, fixation duration between 150–900 ms, saccade duration between 0–100 ms, saccade amplitude between 0°–15°, and saccade velocity between 0–3000 px/s were defined as normal (see Table 4). Each range was selected by referencing published physiological norms and the actual distributions observed in this study. Conversely, segments in which one or more metrics exceeded the predefined thresholds were classified as abnormal.
In terms of how each metric would influence the final output of the proposed algorithm, HR was assigned the highest weight (0.5) due to its clear differentiation between urban and motorway driving conditions, as demonstrated by the statistically significant difference in mean HR and the distinct distributions presented in Figure 3 and Figure 4. This suggests HR is a strong indicator of the driver’s physiological state in response to varying driving environments. Gaze metrics were weighted lower (blink: 0.2, fixation: 0.2, saccade: 0.1), reflecting the more subtle and overlapping differences observed in blink, fixation, and saccade characteristics across scenarios (Figure 5, Figure 6 and Figure 7). Furthermore, during the manual review of approximately 5% of segments by the first author with the assistance of dashcam recordings captured during data collection, the effects identified as most clearly linked to abnormal segments were primarily related to HR fluctuations, such as stops at traffic lights or driving in busy congestion areas (see example in Figure 9). Nonetheless, these weight settings are subject to further refinement in future studies with a more detailed dataset.
Labeling of segments as normal or abnormal was performed automatically using the multimodal algorithm (Algorithm 1), referencing statistically justified thresholds as described earlier. To ensure labeling consistency, approximately 5% of segments were manually reviewed by the first author with the assistance of dashcam recordings captured during data collection. An example of this manual verification process is shown in Figure 9.
4.2.2. Multimodal Classification Results
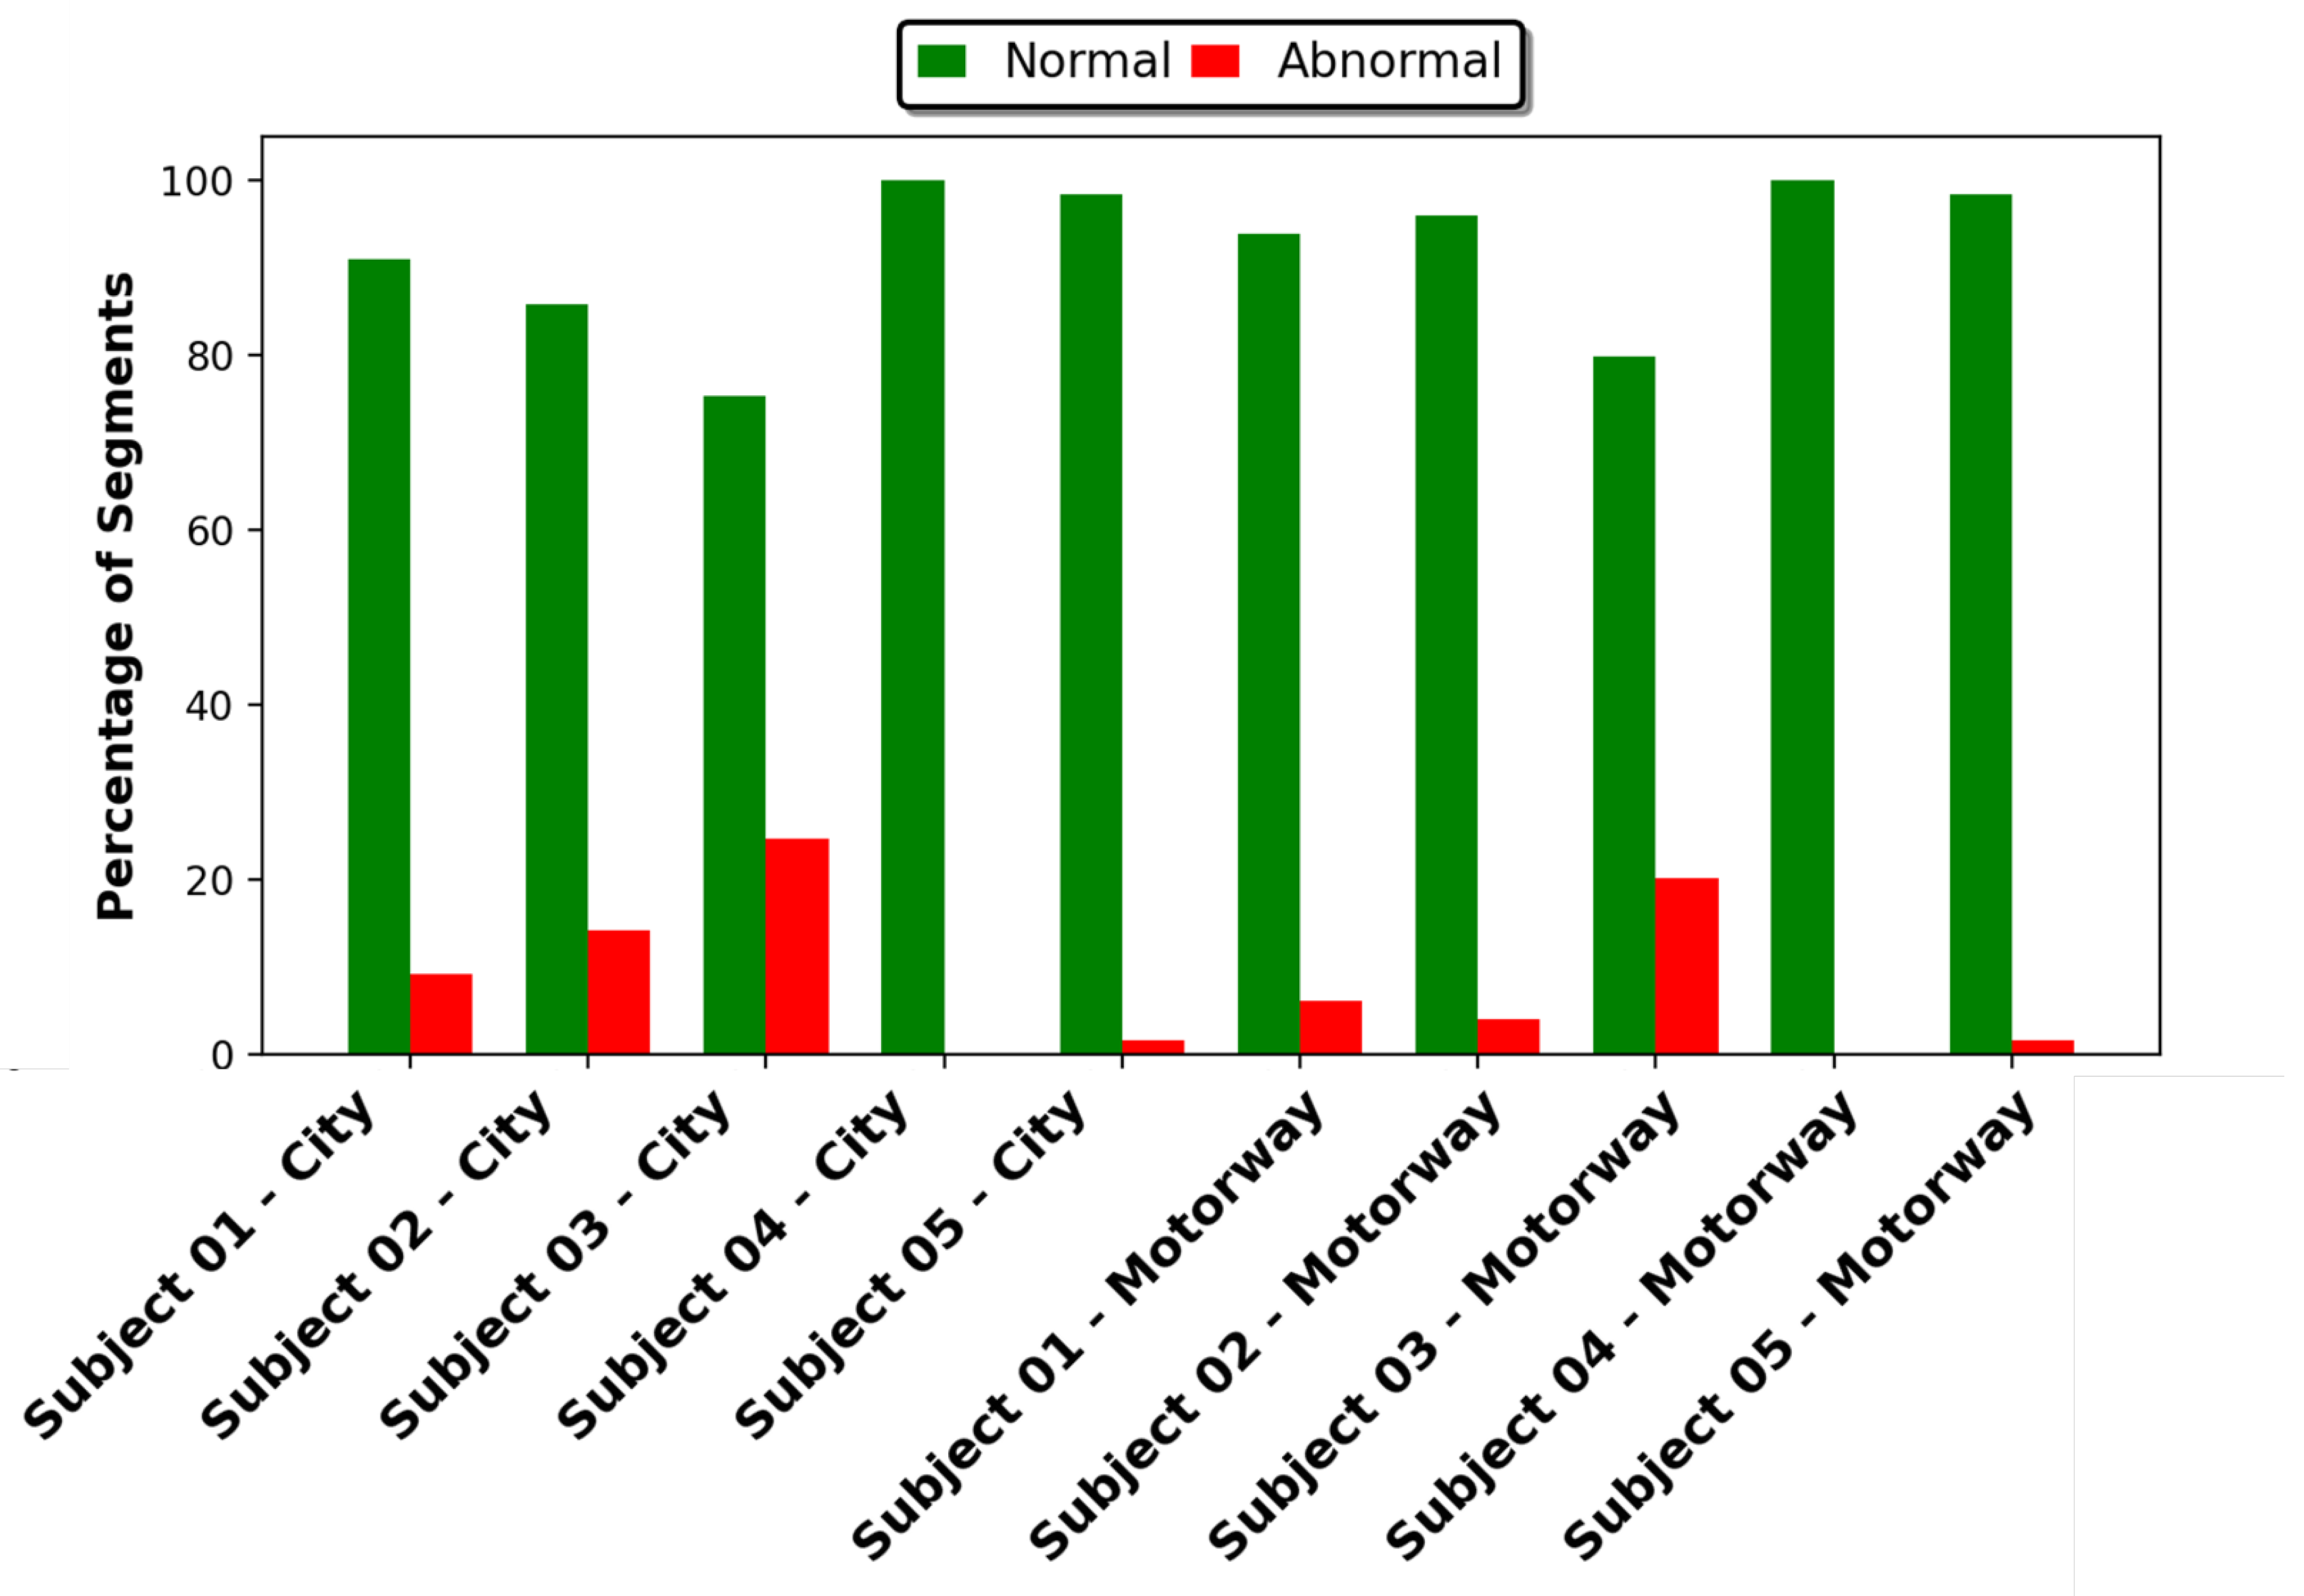
The algorithm results across all subjects and scenarios are illustrated in Figure 8. Of the 2,937 analyzed segments (each with a duration of 10 seconds), 89.38% were classified as normal, while 10.62% were classified as abnormal. Notably, intra-subject variability revealed a higher frequency of abnormal segments during city driving, which is consistent with the elevated HR and increased cognitive demands discussed in Section 4.1.
Subject-specific classification further underscores the impact of individual characteristics on algorithm outcomes. Subject 3, who had less driving experience and drove under warm conditions without air conditioning, exhibited the highest proportion of abnormal segments (24.73% in city driving and 20.16% on the motorway). In contrast, Subject 5, who possessed extensive driving experience and drove an automatic vehicle, had minimal abnormal classifications (1.65% in city driving and nearly none on the motorway). These results are in strong agreement with the physiological differences previously described in Section 4.1, highlighting the algorithm’s sensitivity to meaningful physiological and behavioral variations across different scenarios and subjects.
Figure 8.
Percentage of normal and abnormal segments for various subjects, illustrating subject-specific variability based on defined thresholds.
Figure 8.
Percentage of normal and abnormal segments for various subjects, illustrating subject-specific variability based on defined thresholds.
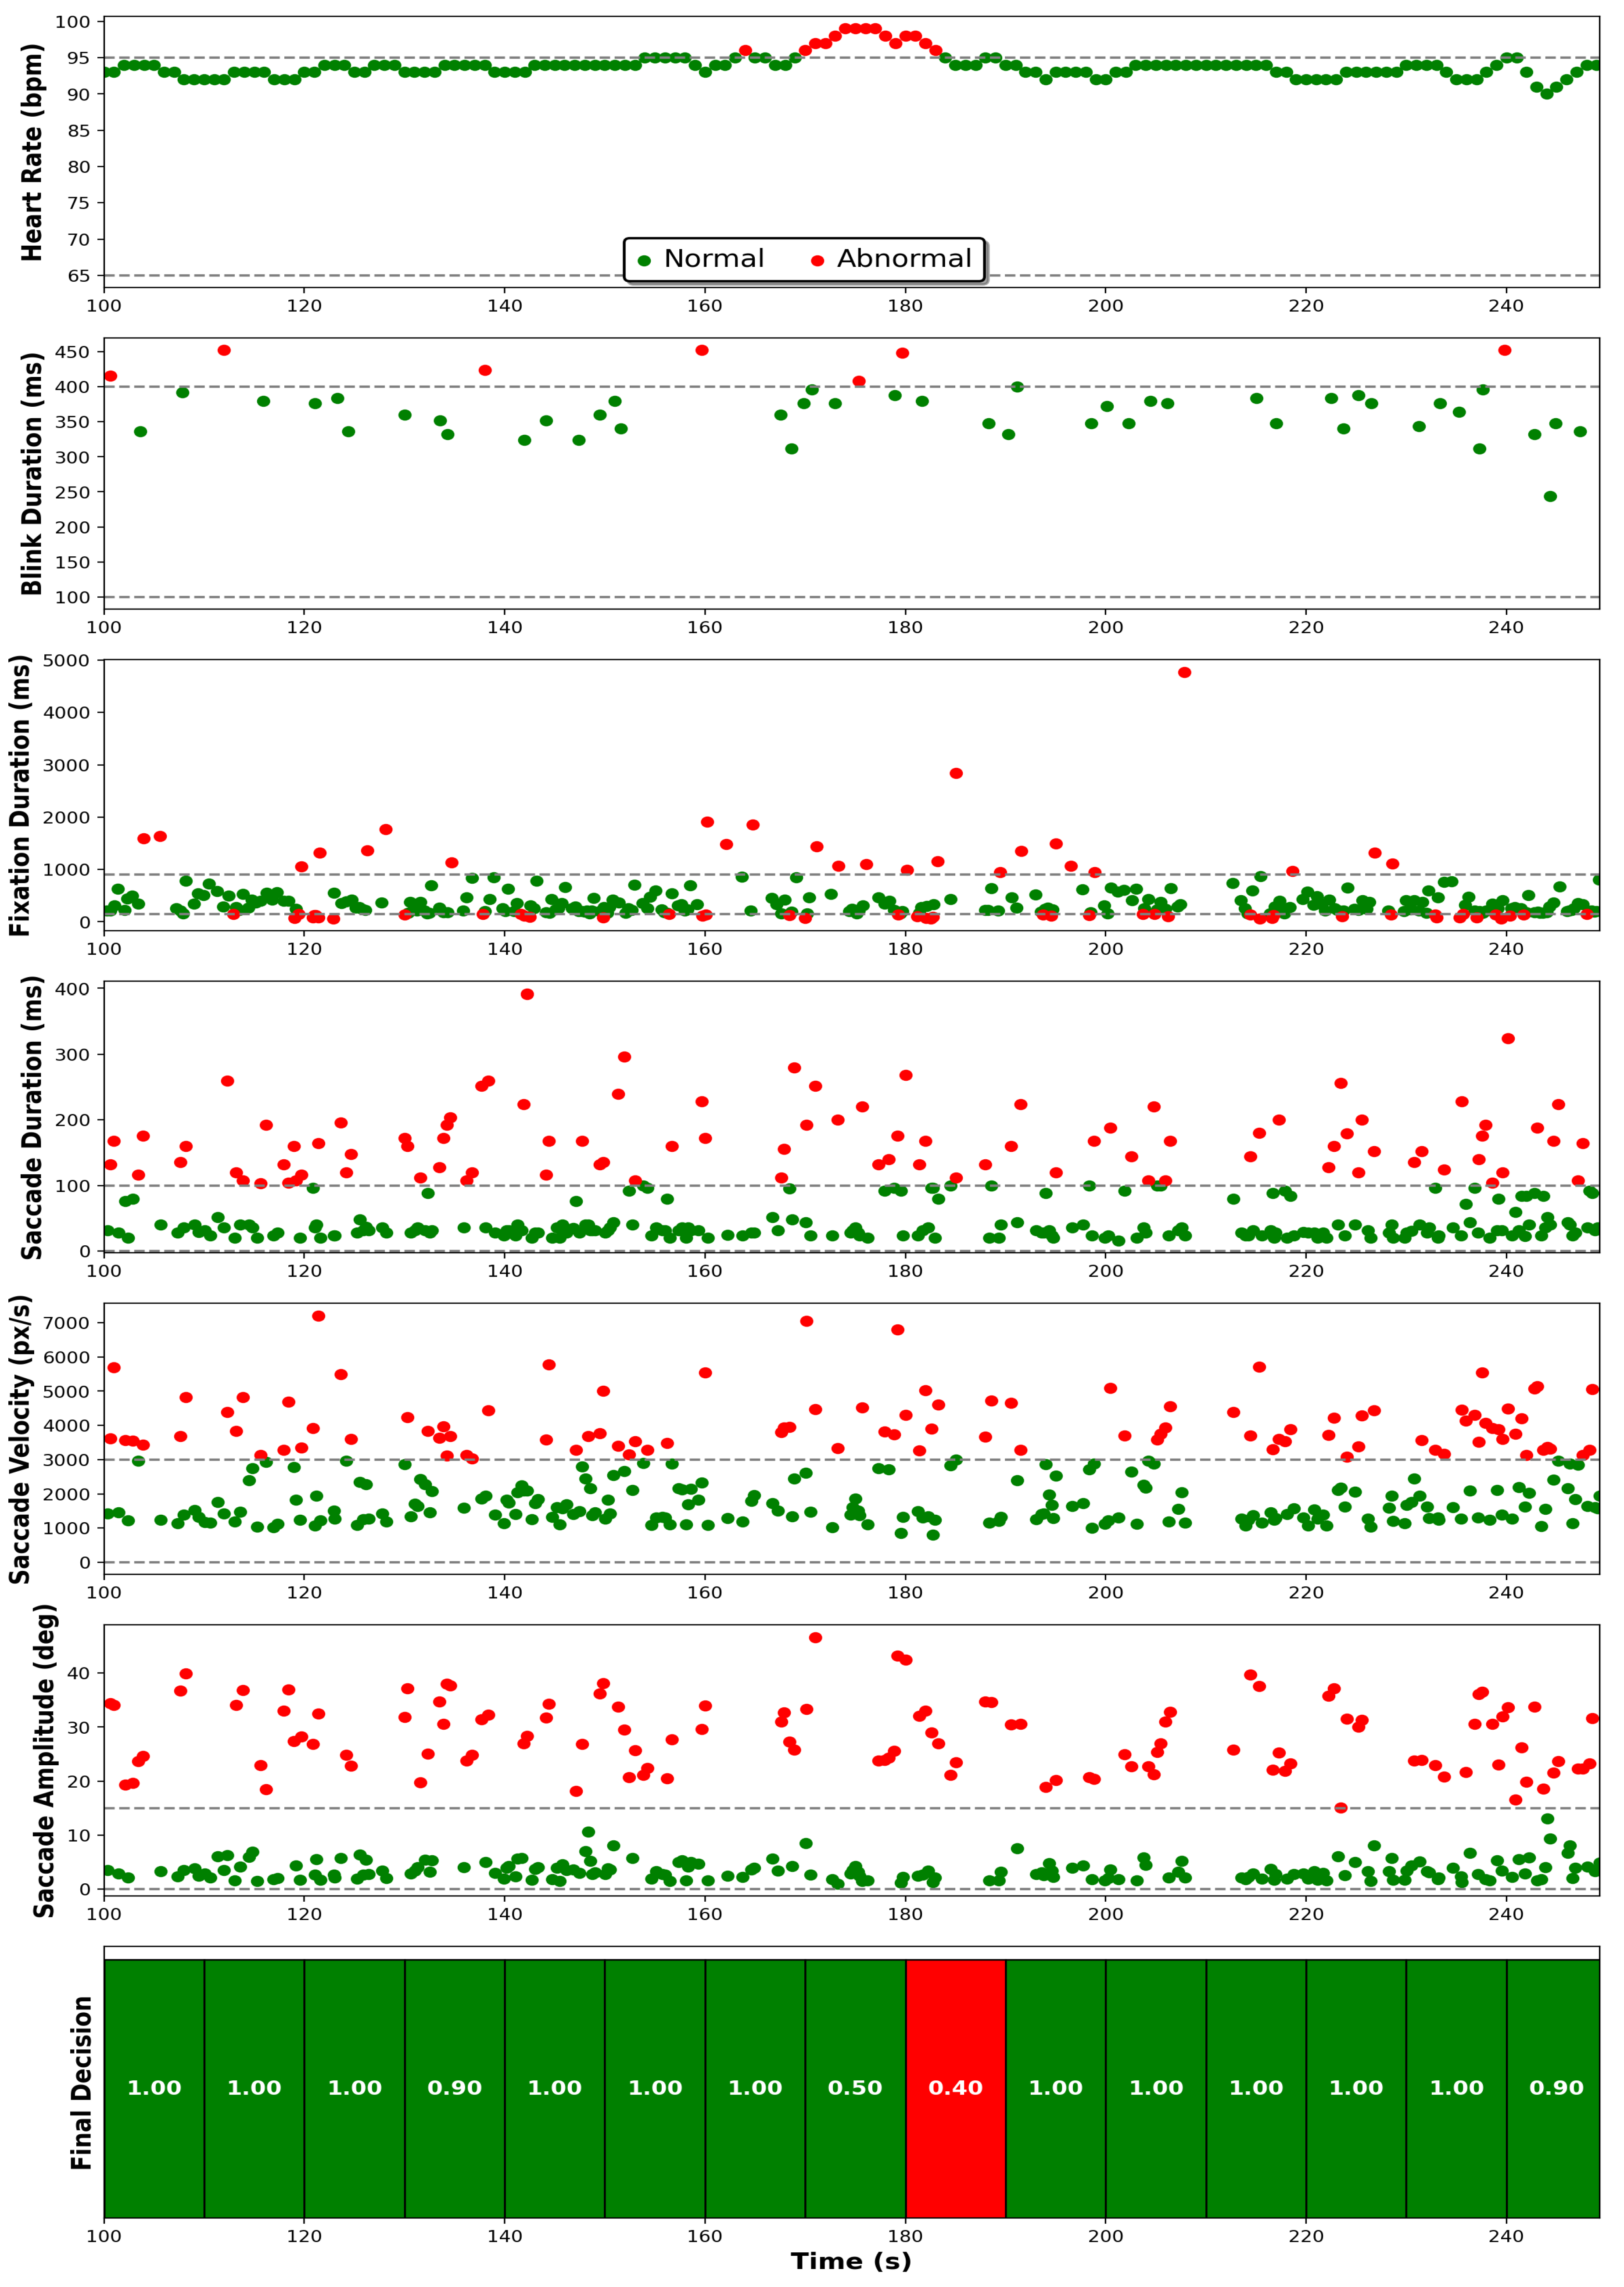
Real-time examples presented in Figure 9 and Figure 10 further validate algorithm responsiveness. Figure 9 illustrates typical city driving patterns, where HR decreases at traffic stops and gaze metrics normalize, while Figure 10 demonstrates stable motorway driving with brief HR fluctuations leading to transient abnormal classifications.
Figure 9.
Subject metrics and decision-making during city driving, illustrating HR normalization during traffic stops. Final decisions are highlighted based on the threshold .
Figure 9.
Subject metrics and decision-making during city driving, illustrating HR normalization during traffic stops. Final decisions are highlighted based on the threshold .
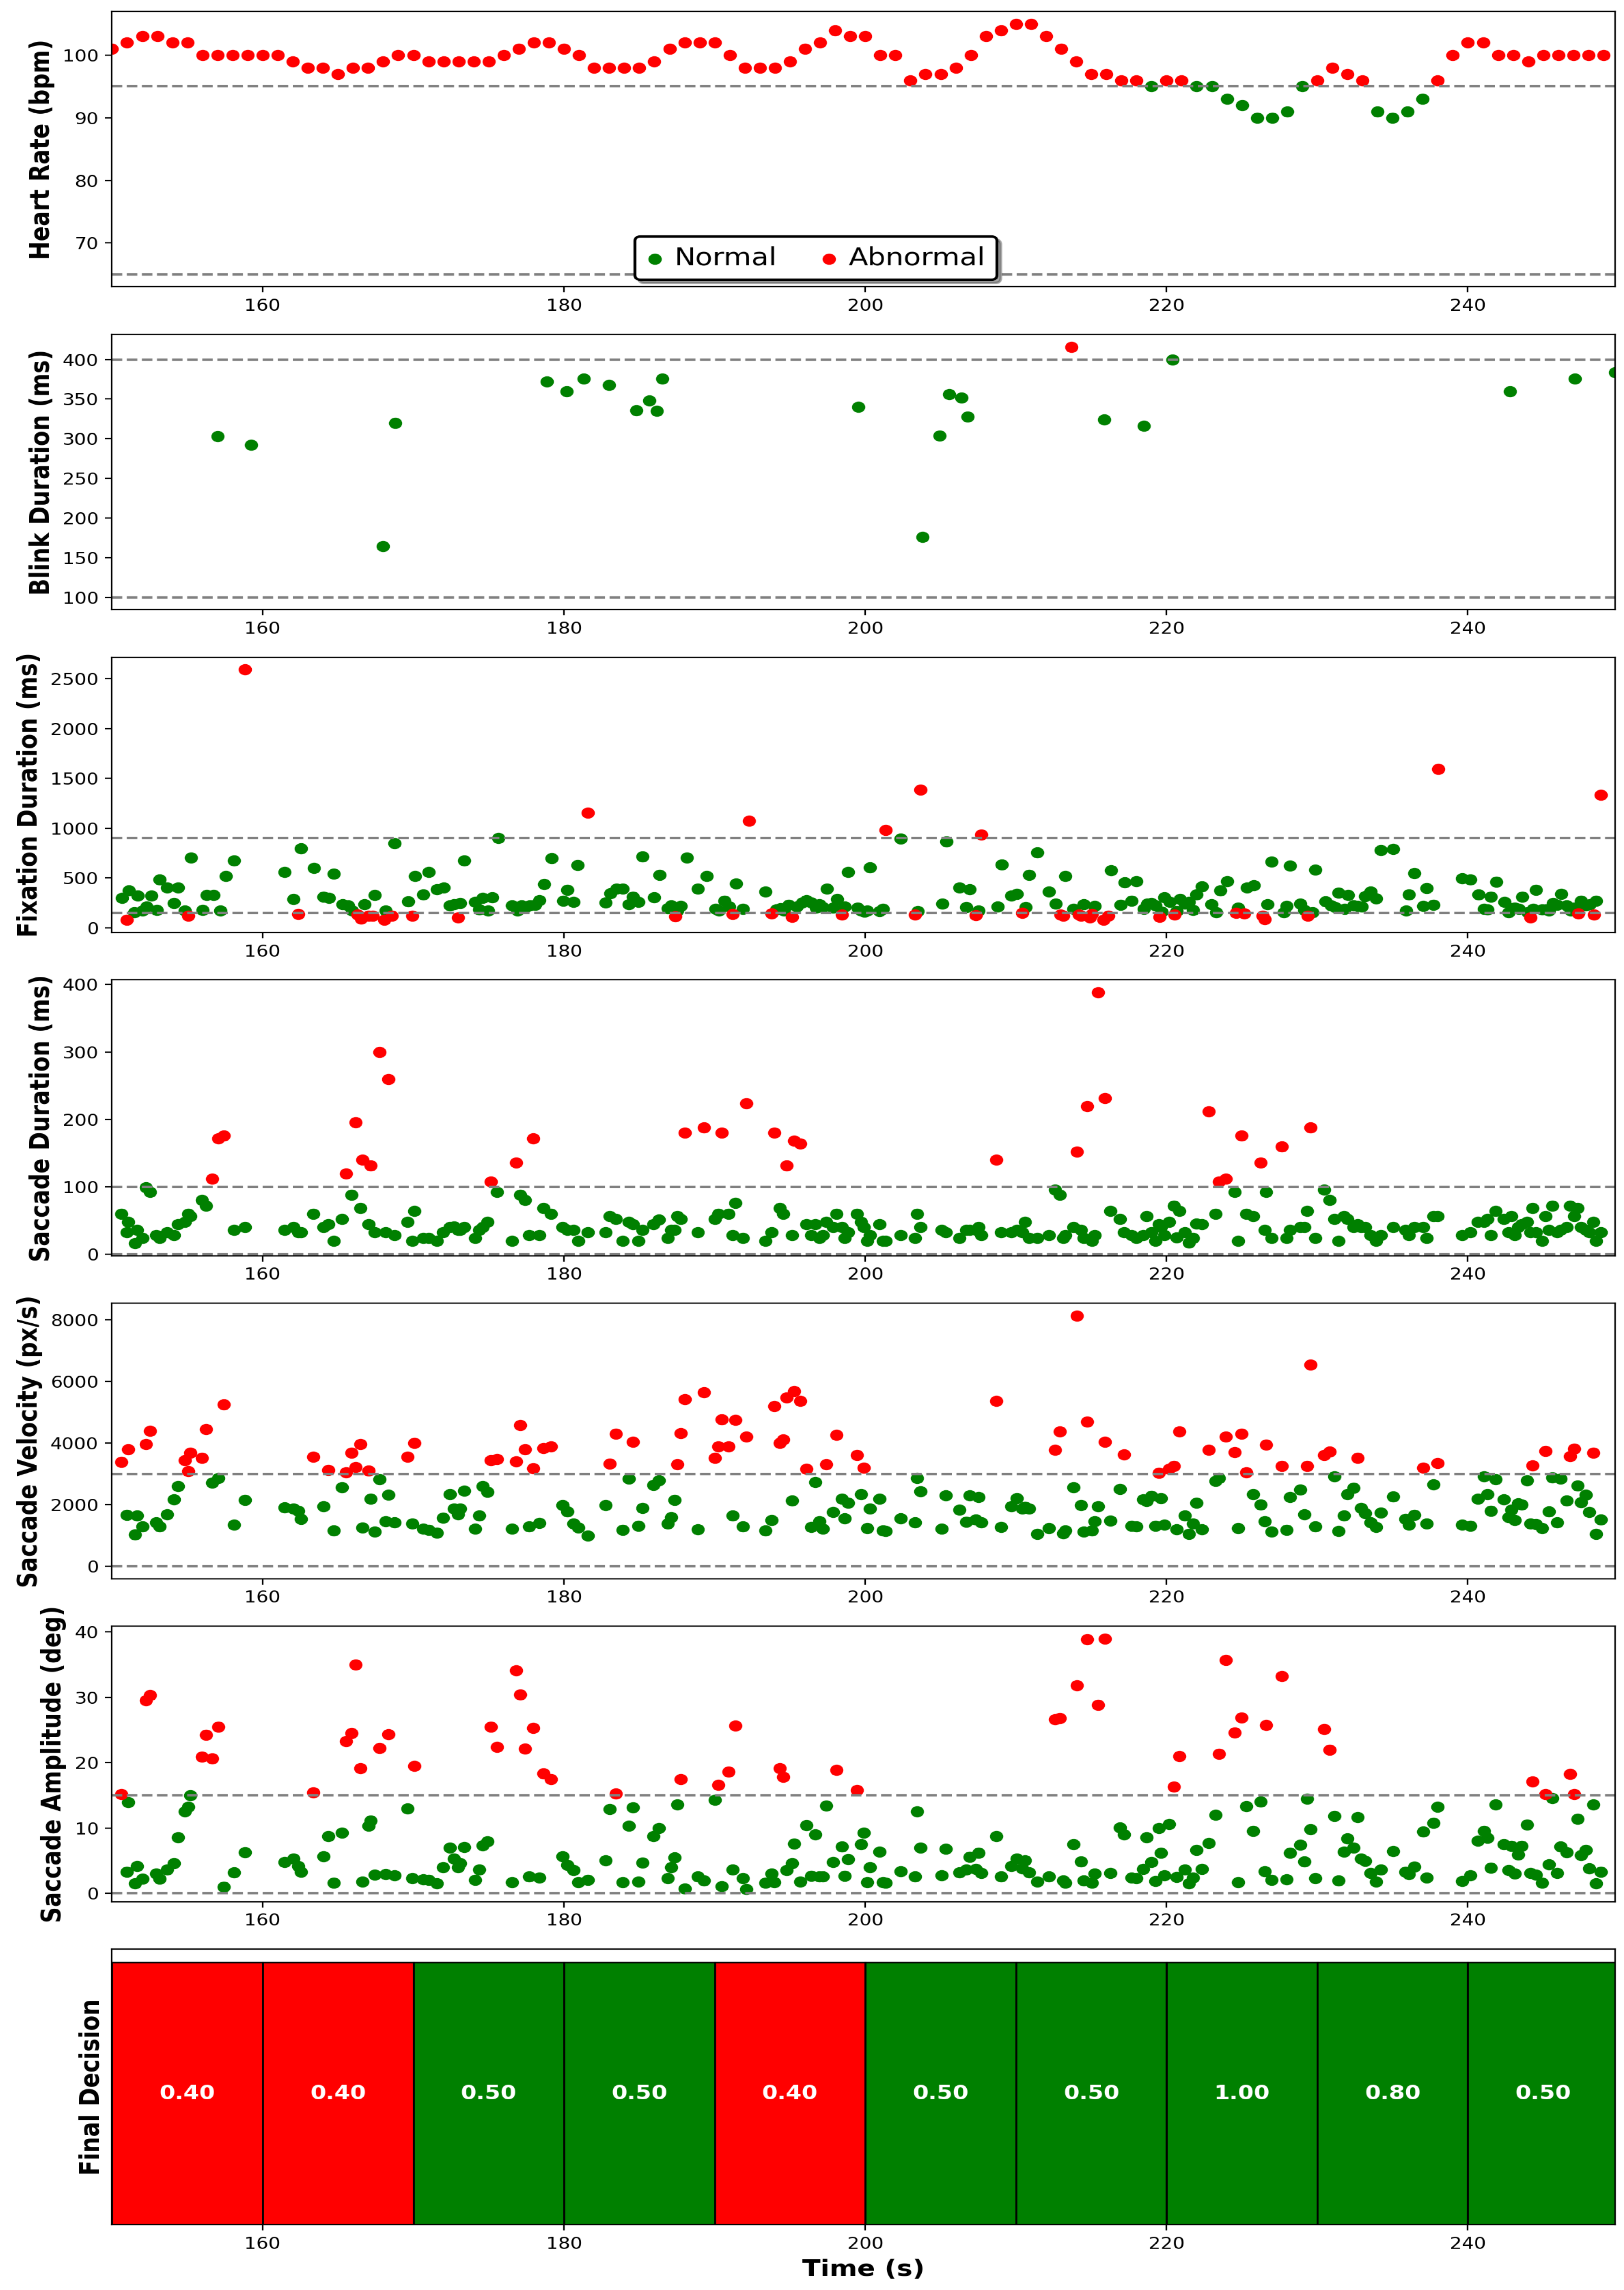
Figure 10.
Motorway driving showing stable HR with brief increases influencing abnormal classification decisions.
Figure 10.
Motorway driving showing stable HR with brief increases influencing abnormal classification decisions.
4.2.3. Sensitivity Analysis and Parameter Optimization
Sensitivity analysis (Table 5 and Table 6) demonstrated the critical importance of parameter selection in the algorithm’s performance. Variations in HR and gaze weights had a noticeable effect on the classification outcomes. For example, increasing the HR weight to 0.7 substantially reduced the proportion of segments classified as normal to 64.79%, highlighting the dominant influence of HR in the final decision. Similarly, adjusting the decision threshold from 0.30 to 0.80 led to a marked decrease in normal segment classifications, from 97.34% down to 59.76%.
These analyses support the need for careful algorithm calibration, ensuring it reliably adapts to diverse real-world driving contexts and individual differences. Future enhancements should focus on automating adaptive parameter adjustments based on real-time driver characteristics and environmental factors.
5. Conclusions
This study presented a multimodal driver state monitoring framework combining HR and gaze measures to assess driver states under naturalistic driving conditions. Using a collected dataset and detailed statistical analyses, we found that greater HR and lower blink rates occur when driving in city conditions, reflecting greater cognitive load and environment complexity characteristic of urban driving conditions. The algorithm could differentiate between normal and abnormal driving states and, interestingly, detected a greater prevalence of abnormal segments when driving in city conditions, paralleling differences noted in HR and gaze metrics.
Despite these positive findings, several limitations need to be investigated further. First, as this is a pilot study, it involved a small number of participants; a larger pool of volunteers will be recruited as the project progresses. Second, the manually chosen thresholds and metric weights, although based on statistical calculations and literature, might not be fully reflective of variations in individual physiology or driving behavior. Third, although naturalistic driving data improves ecological validity, it introduces variability that demands robust experimental design and well-defined labeling procedures to ensure consistency and reliability.
To tackle these issues and continue to advance this field, future work would investigate objective, automatic parameter optimization methods, e.g., by applying machine learning algorithms or adaptive methods that can dynamically vary thresholds and weights based on individual driver behavior and driving conditions. Furthermore, augmenting the dataset’s richness by capturing a wider variety of scenarios would significantly enhance the algorithm’s stability. Combining other modalities, like electroencephalography (EEG) or breathing measurements, could provide richer information about driver states.
Based on the HR and gaze metrics examined, this multimodal solution has significant potential to increase road safety. Such an adaptive, comprehensive, and data-driven monitoring system could offer real-time warnings of driver abnormal situations such as distraction and fatigue. Ongoing improvement of this multimodal framework would make it even more accurate, dependable, and universally applicable across different driving conditions and driver profiles.
Author Contributions
Conceptualisation, B.A. and A.Z.; methodology, B.A. and A.Z.; software, B.A; validation, B.A., F.A. and A.Z.; formal analysis, B.A., F.A., L.M., S.H. and A.Z.; writing original draft, B.A.; writing, review and editing, B.A., F.A., L.M., S.H. and A.Z.; supervision, A.Z.
Funding
This research received no external funding
Data Availability Statement
The data that support the findings of this study are available on request from the corresponding authors.
Conflicts of Interest
The authors declare no conflicts of interest.
Use of Artificial Intelligence
During the preparation of this work, the authors used ChatGPT in order to proofread the manuscript. After using this tool, the authors reviewed and edited the content as needed and take full responsibility for the content of the publication.
References
- Organization, W.H. Global status report on road safety 2018; World Health Organization, 2019.
- McEvoy, S.P.; Stevenson, M.R.; Woodward, M. The impact of driver distraction on road safety: results from a representative survey in two Australian states. Injury Prevention 2006, 12, 242–247. [Google Scholar] [CrossRef]
- Reason, J.; Manstead, A.; Stradling, S.; Baxter, J.; Campbell, K. Errors and violations on the roads: a real distinction? Ergonomics 1990, 33, 1315–1332. [Google Scholar] [CrossRef] [PubMed]
- TOTAL WORLD VEHICLES IN USE. [Online] Available: https://www.oica.net/category/vehicles-in-use. Accessed: 22 July 2024.
- Halin, A.; Verly, J.G.; Van Droogenbroeck, M. Survey and synthesis of state of the art in driver monitoring. Sensors 2021, 21, 5558. [Google Scholar] [CrossRef]
- Meseguer, J.E.; Calafate, C.T.; Cano, J.C. On the correlation between heart rate and driving style in real driving scenarios. Mobile Networks and Applications 2018, 23, 128–135. [Google Scholar] [CrossRef]
- Jo, S.H.; Kim, J.M.; Kim, D.K. Heart rate change while drowsy driving. Journal of Korean medical science 2019, 34. [Google Scholar] [CrossRef] [PubMed]
- Brookhuis, K.A.; De Waard, D. The use of psychophysiology to assess driver status. Ergonomics 1993, 36, 1099–1110. [Google Scholar] [CrossRef] [PubMed]
- Healey, J.A.; Picard, R.W. Detecting stress during real-world driving tasks using physiological sensors. IEEE Transactions on intelligent transportation systems 2005, 6, 156–166. [Google Scholar] [CrossRef]
- Winter, J.; Fotios, S.; Völker, S. Gaze direction when driving after dark on main and residential roads: Where is the dominant location? Lighting Research & Technology 2017, 49, 574–585. [Google Scholar]
- Chen, E.; Guan, H.; Yan, H.; Xu, Z. Drivers’ Visual Behavior under Various Traffic Conditions. In ICCTP 2011: Towards Sustainable Transportation Systems; 2011; pp. 1854–1864.
- Cardona, G.; Quevedo, N. Blinking and driving: the influence of saccades and cognitive workload. Current eye research 2014, 39, 239–244. [Google Scholar] [CrossRef]
- Salvucci, D.D.; Goldberg, J.H. Identifying fixations and saccades in eye-tracking protocols. In Proceedings of the Proceedings of the 2000 symposium on Eye tracking research & applications, 2000, pp. 71–78.
- Land, M.; Tatler, B. Looking and acting: vision and eye movements in natural behaviour; Oxford University Press, 2009.
- Duchowski, A.T.; Duchowski, A.T. Eye tracking methodology: Theory and practice; Springer, 2017.
- Mackenzie, A.K.; Harris, J.M. A link between attentional function, effective eye movements, and driving ability. Journal of experimental psychology: human perception and performance 2017, 43, 381. [Google Scholar] [CrossRef]
- Cao, S.; Feng, P.; Kang, W.; Chen, Z.; Wang, B. Optimized driver fatigue detection method using multimodal neural networks. Scientific Reports 2025, 15, 12240. [Google Scholar] [CrossRef] [PubMed]
- Das, K.; Papakostas, M.; Riani, K.; Gasiorowski, A.; Abouelenien, M.; Burzo, M.; Mihalcea, R. Detection and recognition of driver distraction using multimodal signals. ACM Transactions on Interactive Intelligent Systems 2022, 12, 1–28. [Google Scholar] [CrossRef]
- Dargahi Nobari, K.; Bertram, T. A multimodal driver monitoring benchmark dataset for driver modeling in assisted driving automation. Scientific data 2024, 11, 327. [Google Scholar] [CrossRef]
- Tao, X.; Gao, D.; Zhang, W.; Liu, T.; Du, B.; Zhang, S.; Qin, Y. A multimodal physiological dataset for driving behaviour analysis. Scientific data 2024, 11, 378. [Google Scholar] [CrossRef]
- Endsley, M.R. Toward a theory of situation awareness in dynamic systems. Human factors 1995, 37, 32–64. [Google Scholar] [CrossRef]
- Underwood, G.; Humphrey, K.; Van Loon, E. Decisions about objects in real-world scenes are influenced by visual saliency before and during their inspection. Vision research 2011, 51, 2031–2038. [Google Scholar] [CrossRef] [PubMed]
- Trutschel, U.; Heinze, C.; Sirois, B.; Golz, M.; Sommer, D.; Edwards, D. Heart rate measures reflect the interaction of low mental workload and fatigue during driving simulation. In Proceedings of the Proceedings of the 4th International Conference on Automotive User Interfaces and Interactive Vehicular Applications, 2012, pp. 261–264.
- Polar H10 Chest Strap. https://support.polar.com/e_manuals/h10-heart-rate-sensor/polar-h10-user-manual-english/manual.pdf.
- Schaffarczyk, M.; Rogers, B.; Reer, R.; Gronwald, T. Validity of the polar H10 sensor for heart rate variability analysis during resting state and incremental exercise in recreational men and women. Sensors 2022, 22, 6536. [Google Scholar] [CrossRef]
- Schleicher, R.; Galley, N.; Briest, S.; Galley, L. Blinks and saccades as indicators of fatigue in sleepiness warnings: looking tired? Ergonomics 2008, 51, 982–1010. [Google Scholar] [CrossRef]
- Kountouriotis, G.K.; Merat, N. Leading to distraction: Driver distraction, lead car, and road environment. Accident Analysis & Prevention 2016, 89, 22–30. [Google Scholar] [CrossRef]
- Ahlström, C.; Kircher, K.; Nyström, M.; Wolfe, B. Eye tracking in driver attention research—how gaze data interpretations influence what we learn. Frontiers in Neuroergonomics 2021, 2, 778043. [Google Scholar] [CrossRef]
- Palazzi, A.; Abati, D.; Solera, F.; Cucchiara, R.; et al. Predicting the driver’s focus of attention: the dr (eye) ve project. IEEE transactions on pattern analysis and machine intelligence 2018, 41, 1720–1733. [Google Scholar] [CrossRef] [PubMed]
- Gorin, H.; Patel, J.; Qiu, Q.; Merians, A.; Adamovich, S.; Fluet, G. A Review of the Use of Gaze and Pupil Metrics to Assess Mental Workload in Gamified and Simulated Sensorimotor Tasks. Sensors 2024, 24, 1759. [Google Scholar] [CrossRef]
- Solovey, E.T.; Zec, M.; Garcia Perez, E.A.; Reimer, B.; Mehler, B. Classifying driver workload using physiological and driving performance data: two field studies. In Proceedings of the Proceedings of the SIGCHI conference on human factors in computing systems, 2014, pp. 4057–4066.
- Yoon, H.S.; Hong, H.G.; Lee, D.E.; Park, K.R. Driver’s eye-based gaze tracking system by one-point calibration. Multimedia Tools and Applications 2019, 78, 7155–7179. [Google Scholar] [CrossRef]
- Yahoodik, S.; Tahami, H.; Unverricht, J.; Yamani, Y.; Handley, H.; Thompson, D. Blink rate as a measure of driver workload during simulated driving. In Proceedings of the Proceedings of the Human Factors and Ergonomics Society Annual Meeting.; SAGE Publications Sage CA: Los Angeles, CA, 2020, Vol. 64, pp. 1825–1828. [Google Scholar]
- Yang, S.; Kuo, J.; Lenné, M.G. Analysis of gaze behavior to measure cognitive distraction in real-world driving. In Proceedings of the Proceedings of the Human Factors and Ergonomics Society Annual Meeting.; SAGE Publications Sage CA: Los Angeles, CA, 2018, Vol. 62, pp. 1944–1948. [Google Scholar]
- Pupil Invisible Eye Tracking Glasses. [Online] Available: https://docs.pupil-labs.com/invisible/. Accessed: 20 November 2024.
- Navalta, J.W.; Davis, D.W.; Malek, E.M.; Carrier, B.; Bodell, N.G.; Manning, J.W.; Cowley, J.; Funk, M.; Lawrence, M.M.; DeBeliso, M. Heart rate processing algorithms and exercise duration on reliability and validity decisions in biceps-worn Polar Verity Sense and OH1 wearables. Scientific Reports 2023, 13, 11736. [Google Scholar] [CrossRef]
- Arutyunova, K.R.; Bakhchina, A.V.; Konovalov, D.I.; Margaryan, M.; Filimonov, A.V.; Shishalov, I.S. Heart rate dynamics for cognitive load estimation in a driving simulation task. Scientific Reports 2024, 14, 31656. [Google Scholar] [CrossRef]
- Tonsen, M.; Baumann, C.K.; Dierkes, K. A high-level description and performance evaluation of pupil invisible. arXiv preprint, arXiv:2009.00508 2020.
- Lab, P. Pupil Labs blink detector. https://assets.pupil-labs.com/pdf/Pupil_Labs_Blink_Detector.pdf, 2023. Accessed: 18-11-2024.
- Drews, M.; Dierkes, K. Strategies for enhancing automatic fixation detection in head-mounted eye tracking. Behavior Research Methods, 2024; 1–23. [Google Scholar]
- Welch, B.L. The generalization of ‘STUDENT’S’problem when several different population varlances are involved. Biometrika 1947, 34, 28–35. [Google Scholar] [PubMed]
- Chakraborty, S.; Kiefer, P.; Raubal, M. Estimating perceived mental workload from eye-tracking data based on benign anisocoria. IEEE Transactions on Human-Machine Systems, 2024. [Google Scholar]
- Zhang, P.; Wang, X.; Chen, J.; You, W. Feature weight driven interactive mutual information modeling for heterogeneous bio-signal fusion to estimate mental workload. Sensors 2017, 17, 2315. [Google Scholar] [CrossRef]
- Debie, E.; Rojas, R.F.; Fidock, J.; Barlow, M.; Kasmarik, K.; Anavatti, S.; Garratt, M.; Abbass, H.A. Multimodal fusion for objective assessment of cognitive workload: A review. IEEE transactions on cybernetics 2019, 51, 1542–1555. [Google Scholar] [CrossRef]
- Adarsh, V.; Gangadharan, G.; Fiore, U.; Zanetti, P. Multimodal classification of Alzheimer’s disease and mild cognitive impairment using custom MKSCDDL kernel over CNN with transparent decision-making for explainable diagnosis. Scientific Reports 2024, 14, 1774. [Google Scholar] [CrossRef]
- Visconti, P.; Rausa, G.; Del-Valle-Soto, C.; Velázquez, R.; Cafagna, D.; De Fazio, R. Innovative driver monitoring systems and on-board-vehicle devices in a smart-road scenario based on the internet of vehicle paradigm: A literature and commercial solutions overview. Sensors 2025, 25, 562. [Google Scholar] [CrossRef] [PubMed]
- Wiberg, H.; Nilsson, E.; Lindén, P.; Svanberg, B.; Poom, L. Physiological responses related to moderate mental load during car driving in field conditions. Biological psychology 2015, 108, 115–125. [Google Scholar] [CrossRef] [PubMed]
- Faure, V.; Lobjois, R.; Benguigui, N. The effects of driving environment complexity and dual tasking on drivers’ mental workload and eye blink behavior. Transportation research part F: traffic psychology and behaviour 2016, 40, 78–90. [Google Scholar] [CrossRef]
- Galley, N.; Andres, G. Saccadic eye movements and blinks during long-term driving on the autobahn with minimal alcohol ingestion. Vision in vehicles 1996, 5, 381–388. [Google Scholar]
- Cardona, G.; Quevedo, N. Blinking and driving: the influence of saccades and cognitive workload. Current eye research 2014, 39, 239–244. [Google Scholar] [CrossRef] [PubMed]
Figure 1.
The workflow of Multimodal Monitoring of Driver starting from real driving data collection, analyzing the data, and proposing a multimodal algorithm based on gaze and heart metrics.
Figure 1.
The workflow of Multimodal Monitoring of Driver starting from real driving data collection, analyzing the data, and proposing a multimodal algorithm based on gaze and heart metrics.
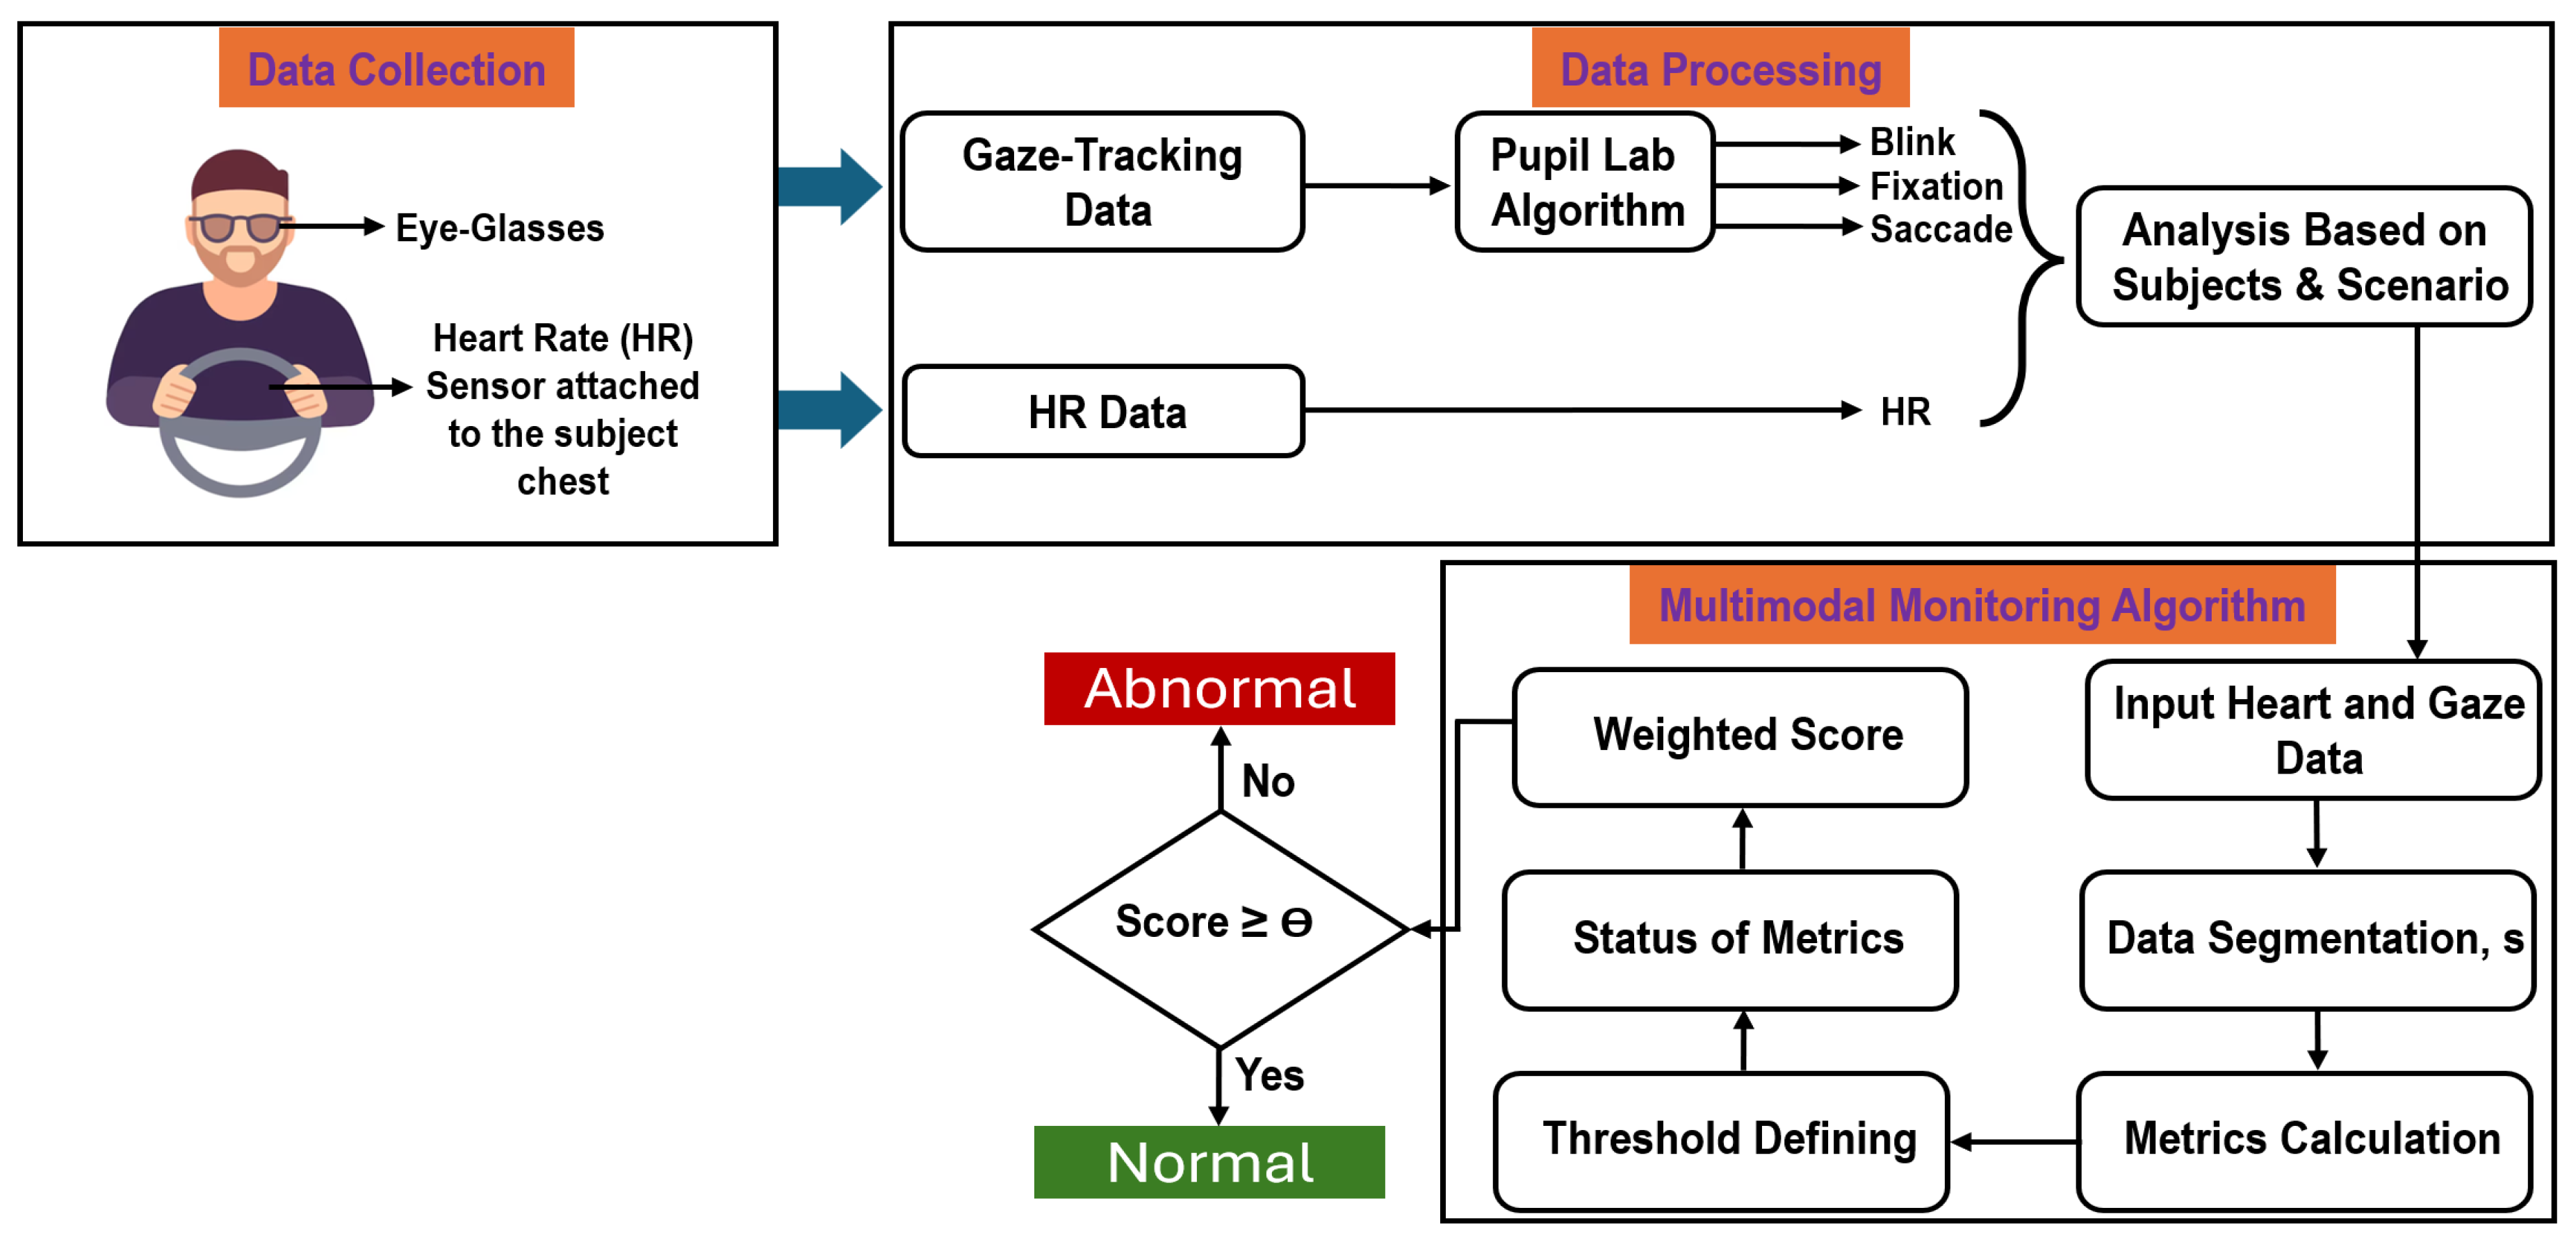
Figure 2.
(a) Data Collection Setup. (b) Pupil Lab Invisible Eye-Tracking glasses, and (c) Polar H10 HR Sensor.
Figure 2.
(a) Data Collection Setup. (b) Pupil Lab Invisible Eye-Tracking glasses, and (c) Polar H10 HR Sensor.
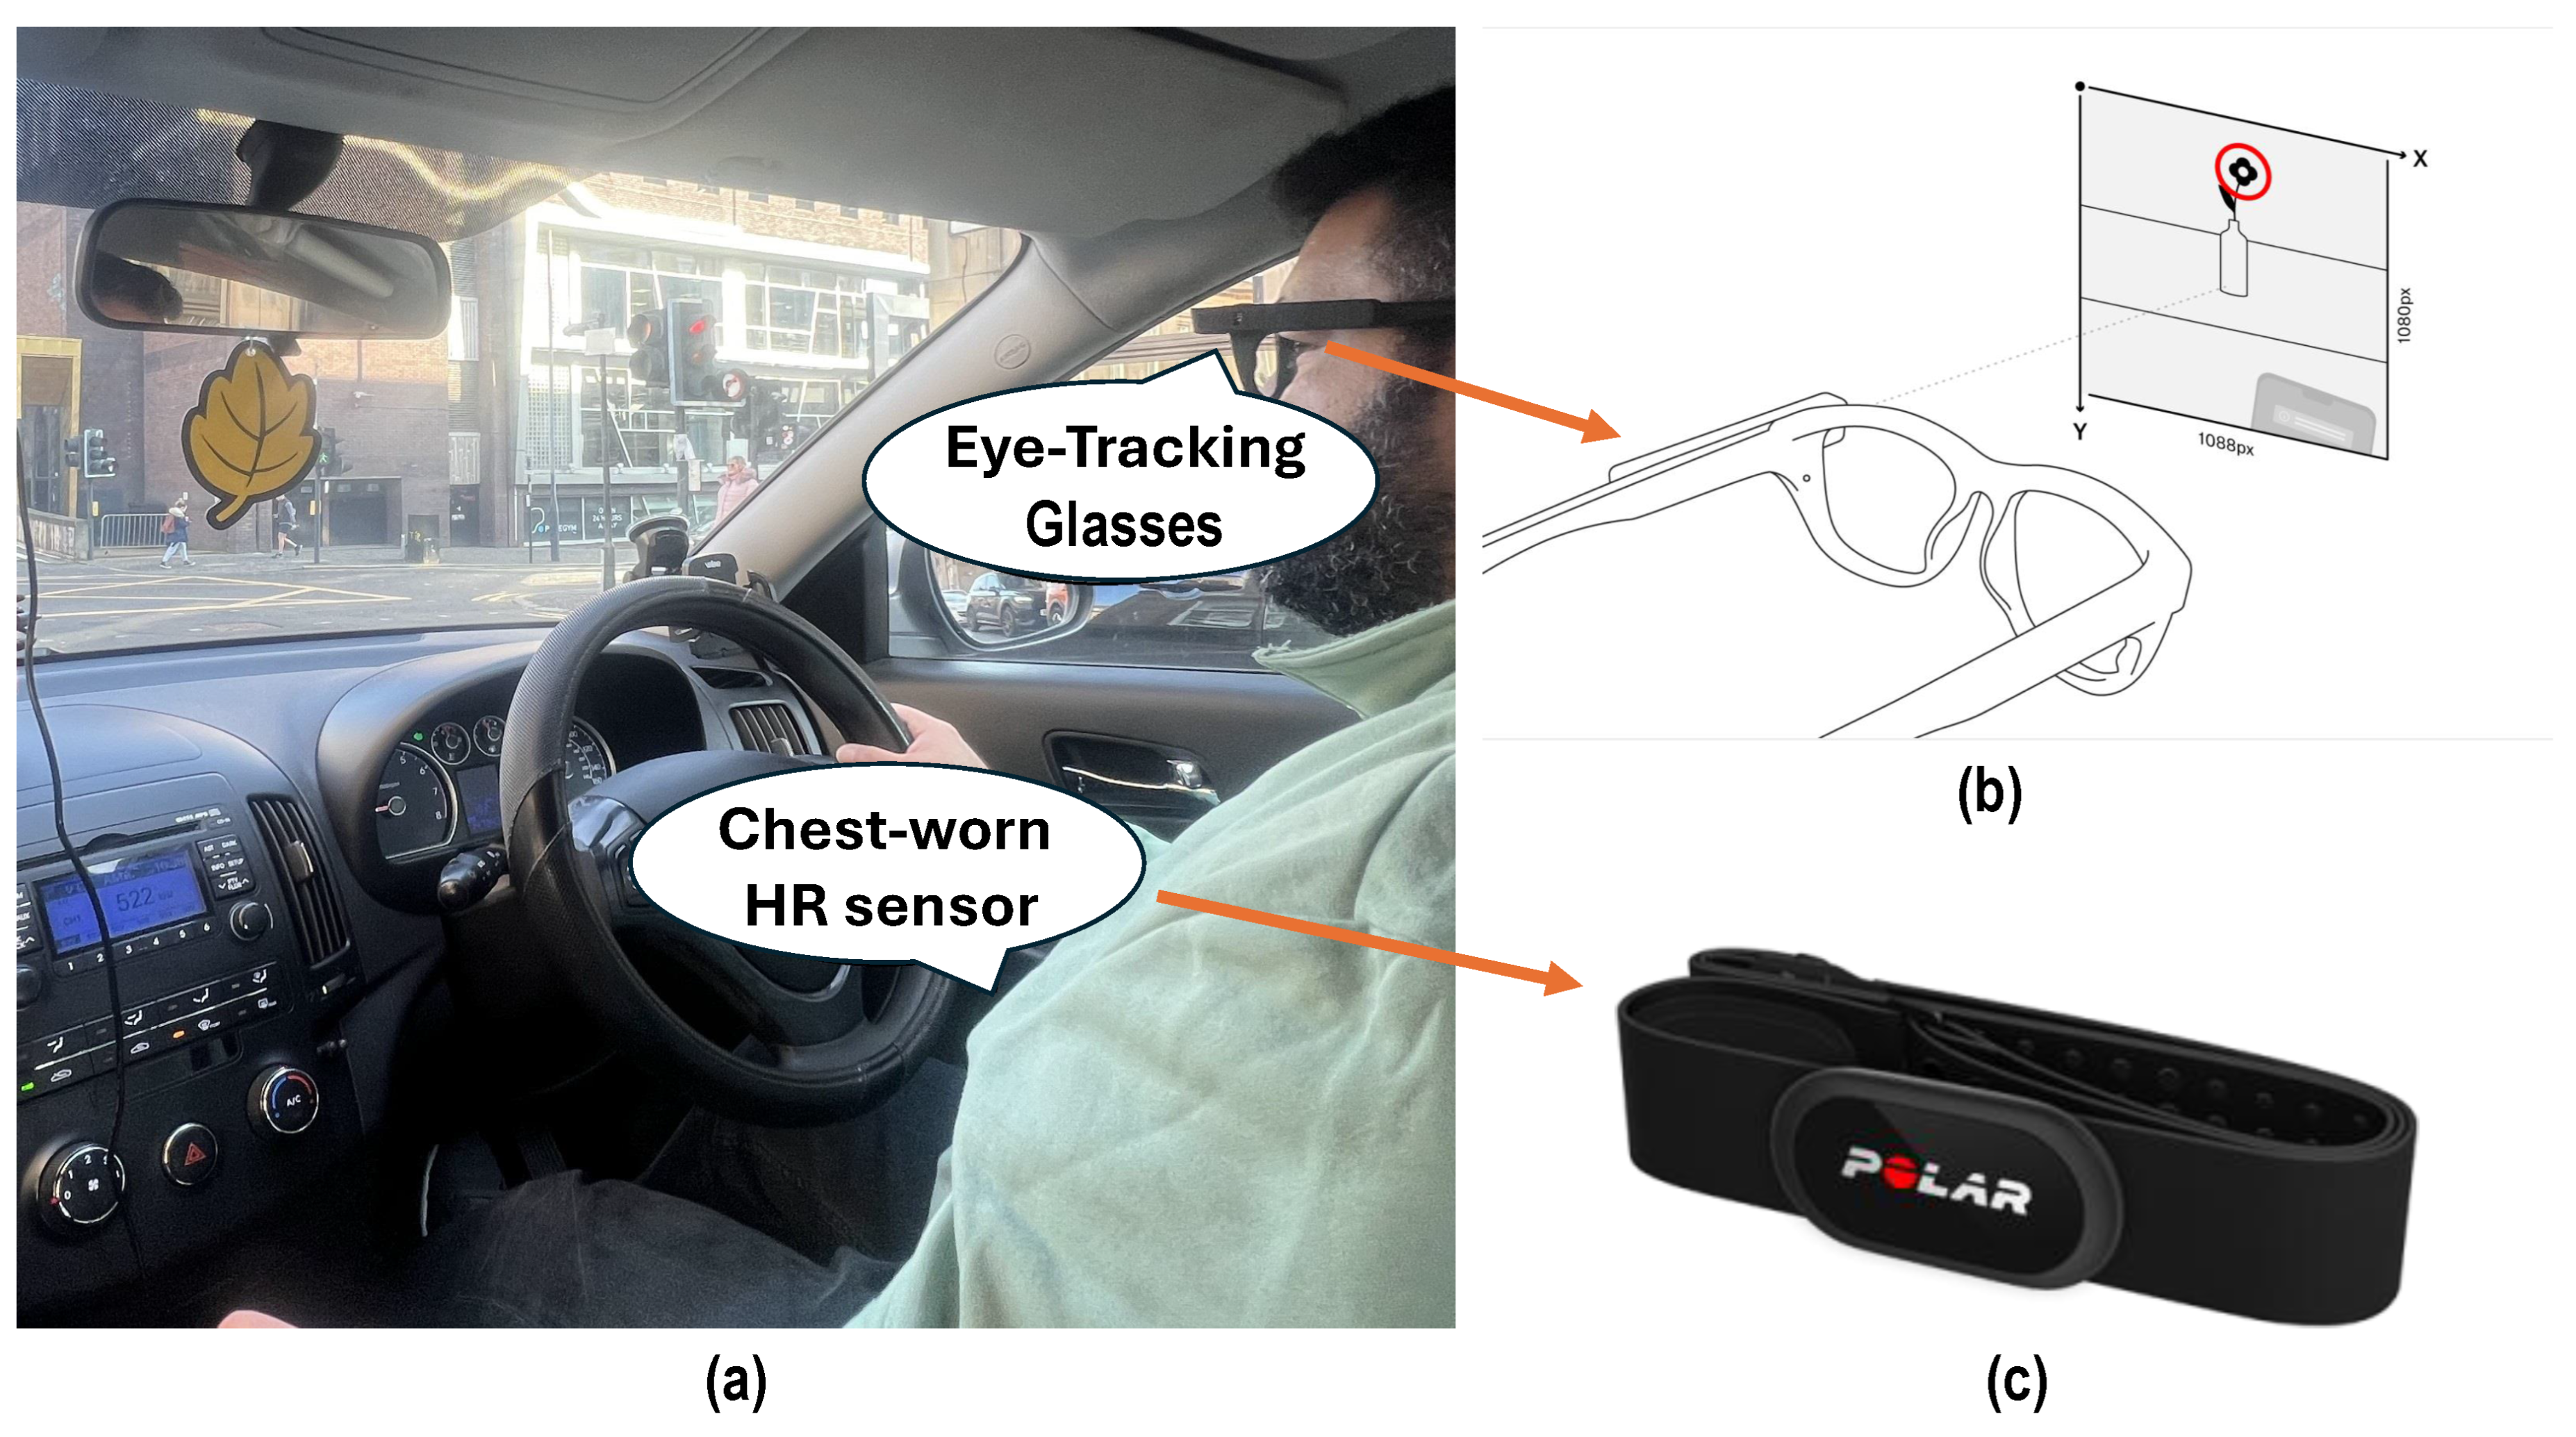
Figure 3.
HR distribution of each participant during motorway and city driving.
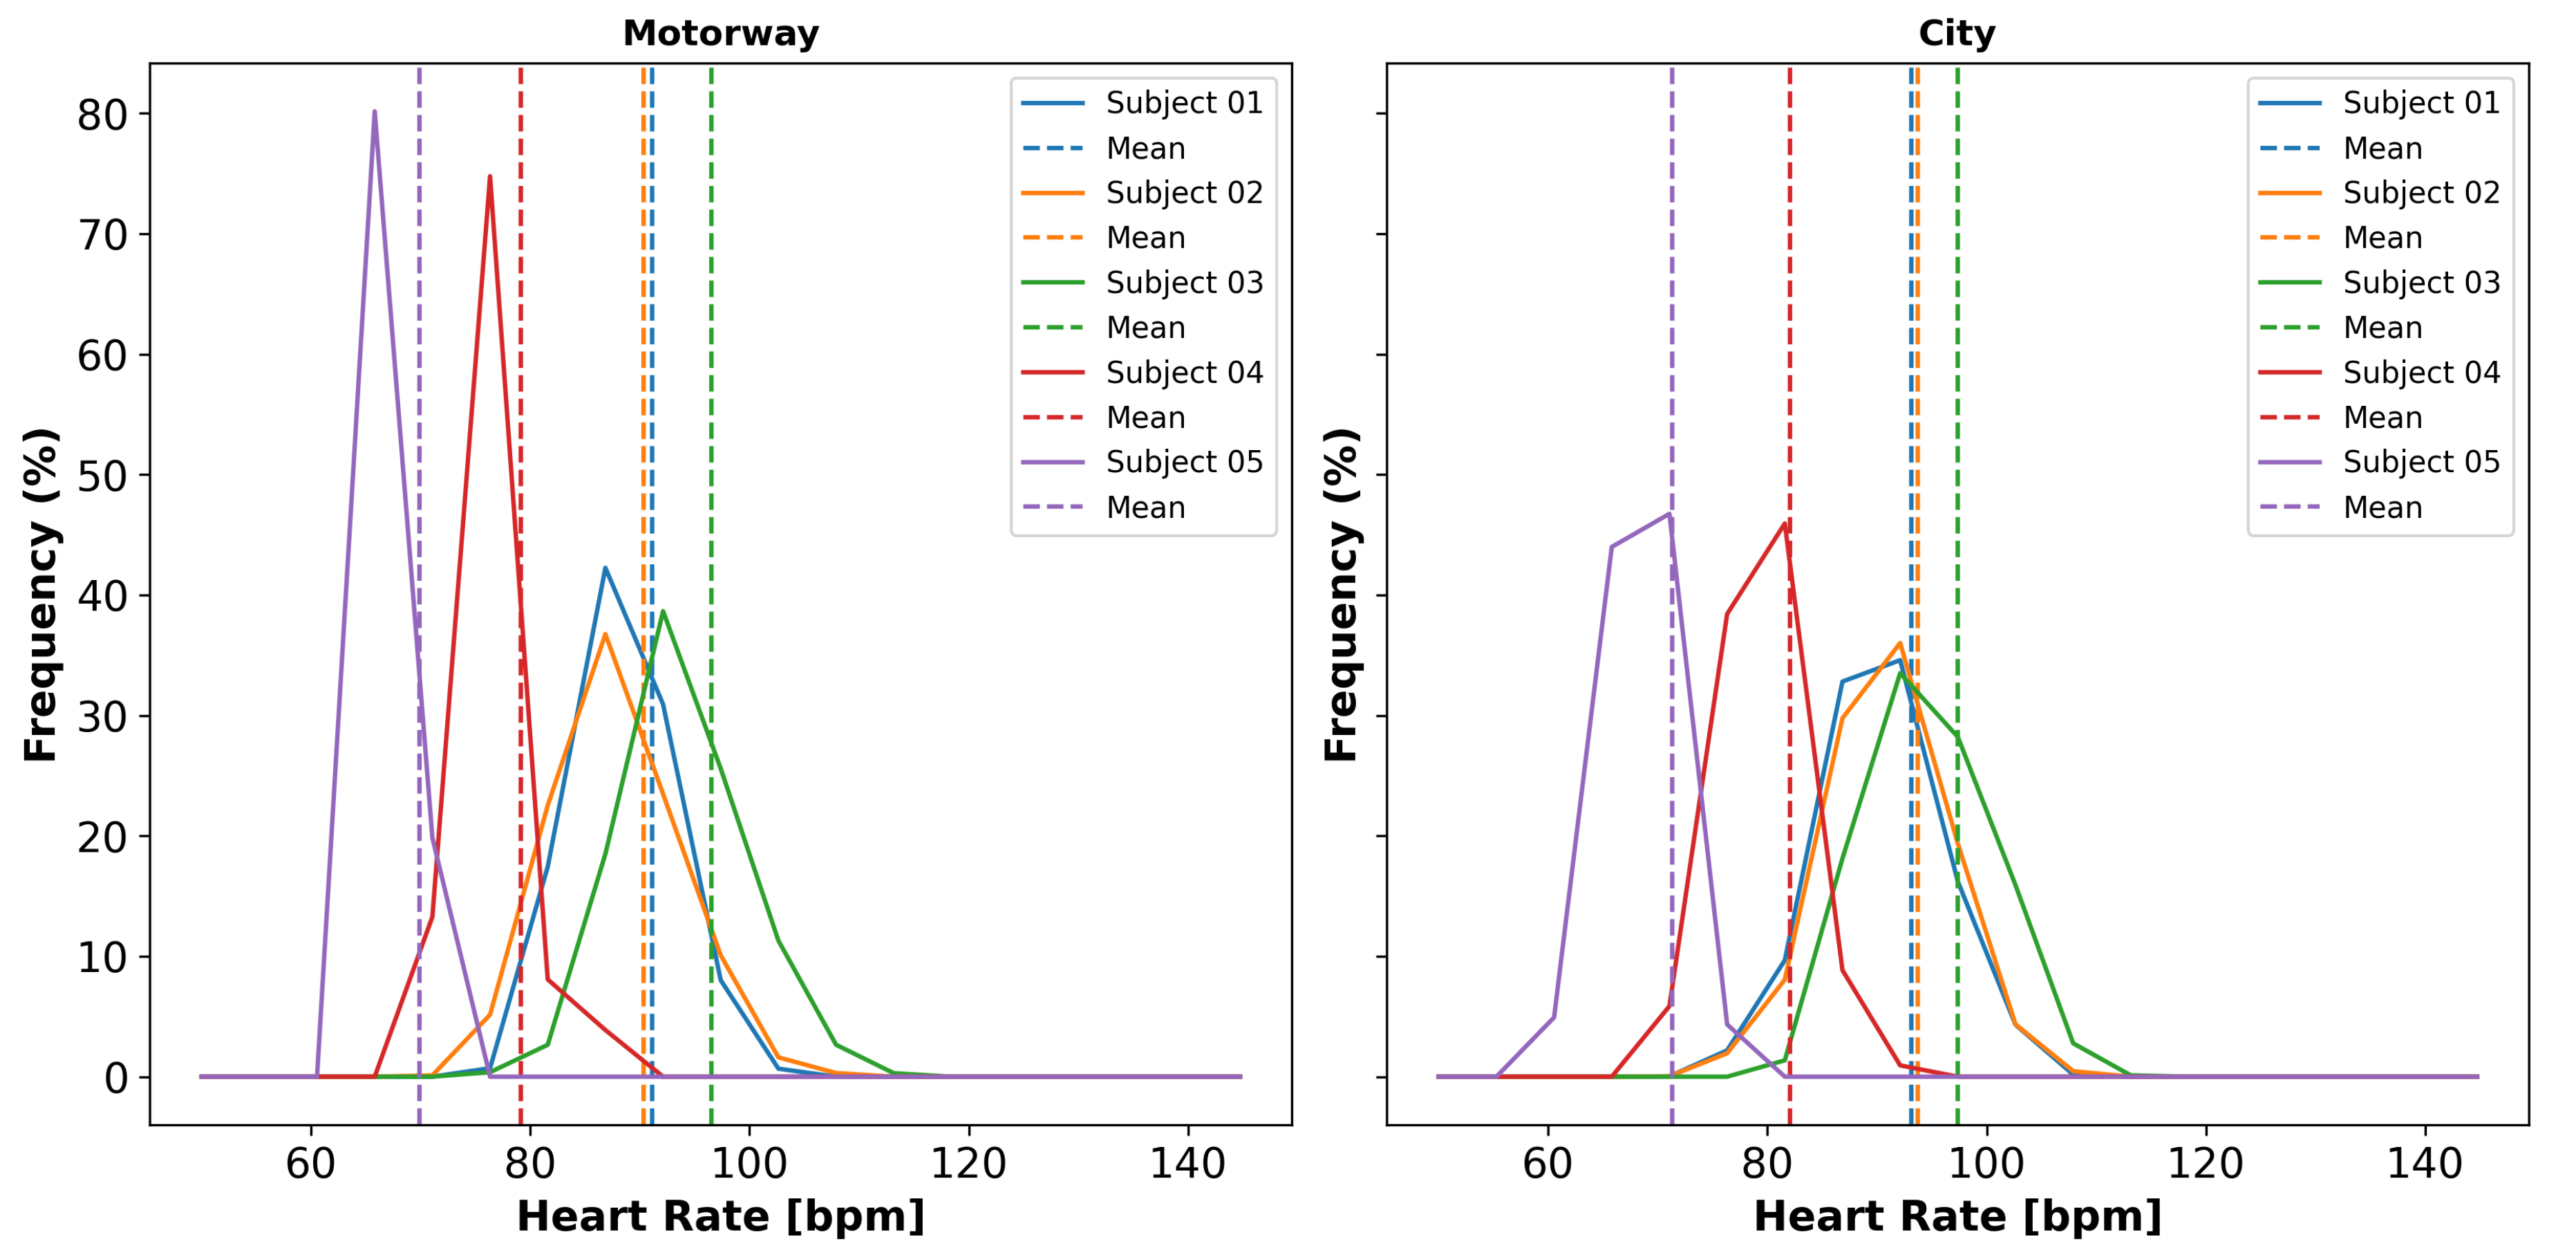
Figure 4.
HR distribution of all data based on two different scenarios: motorway and city driving.
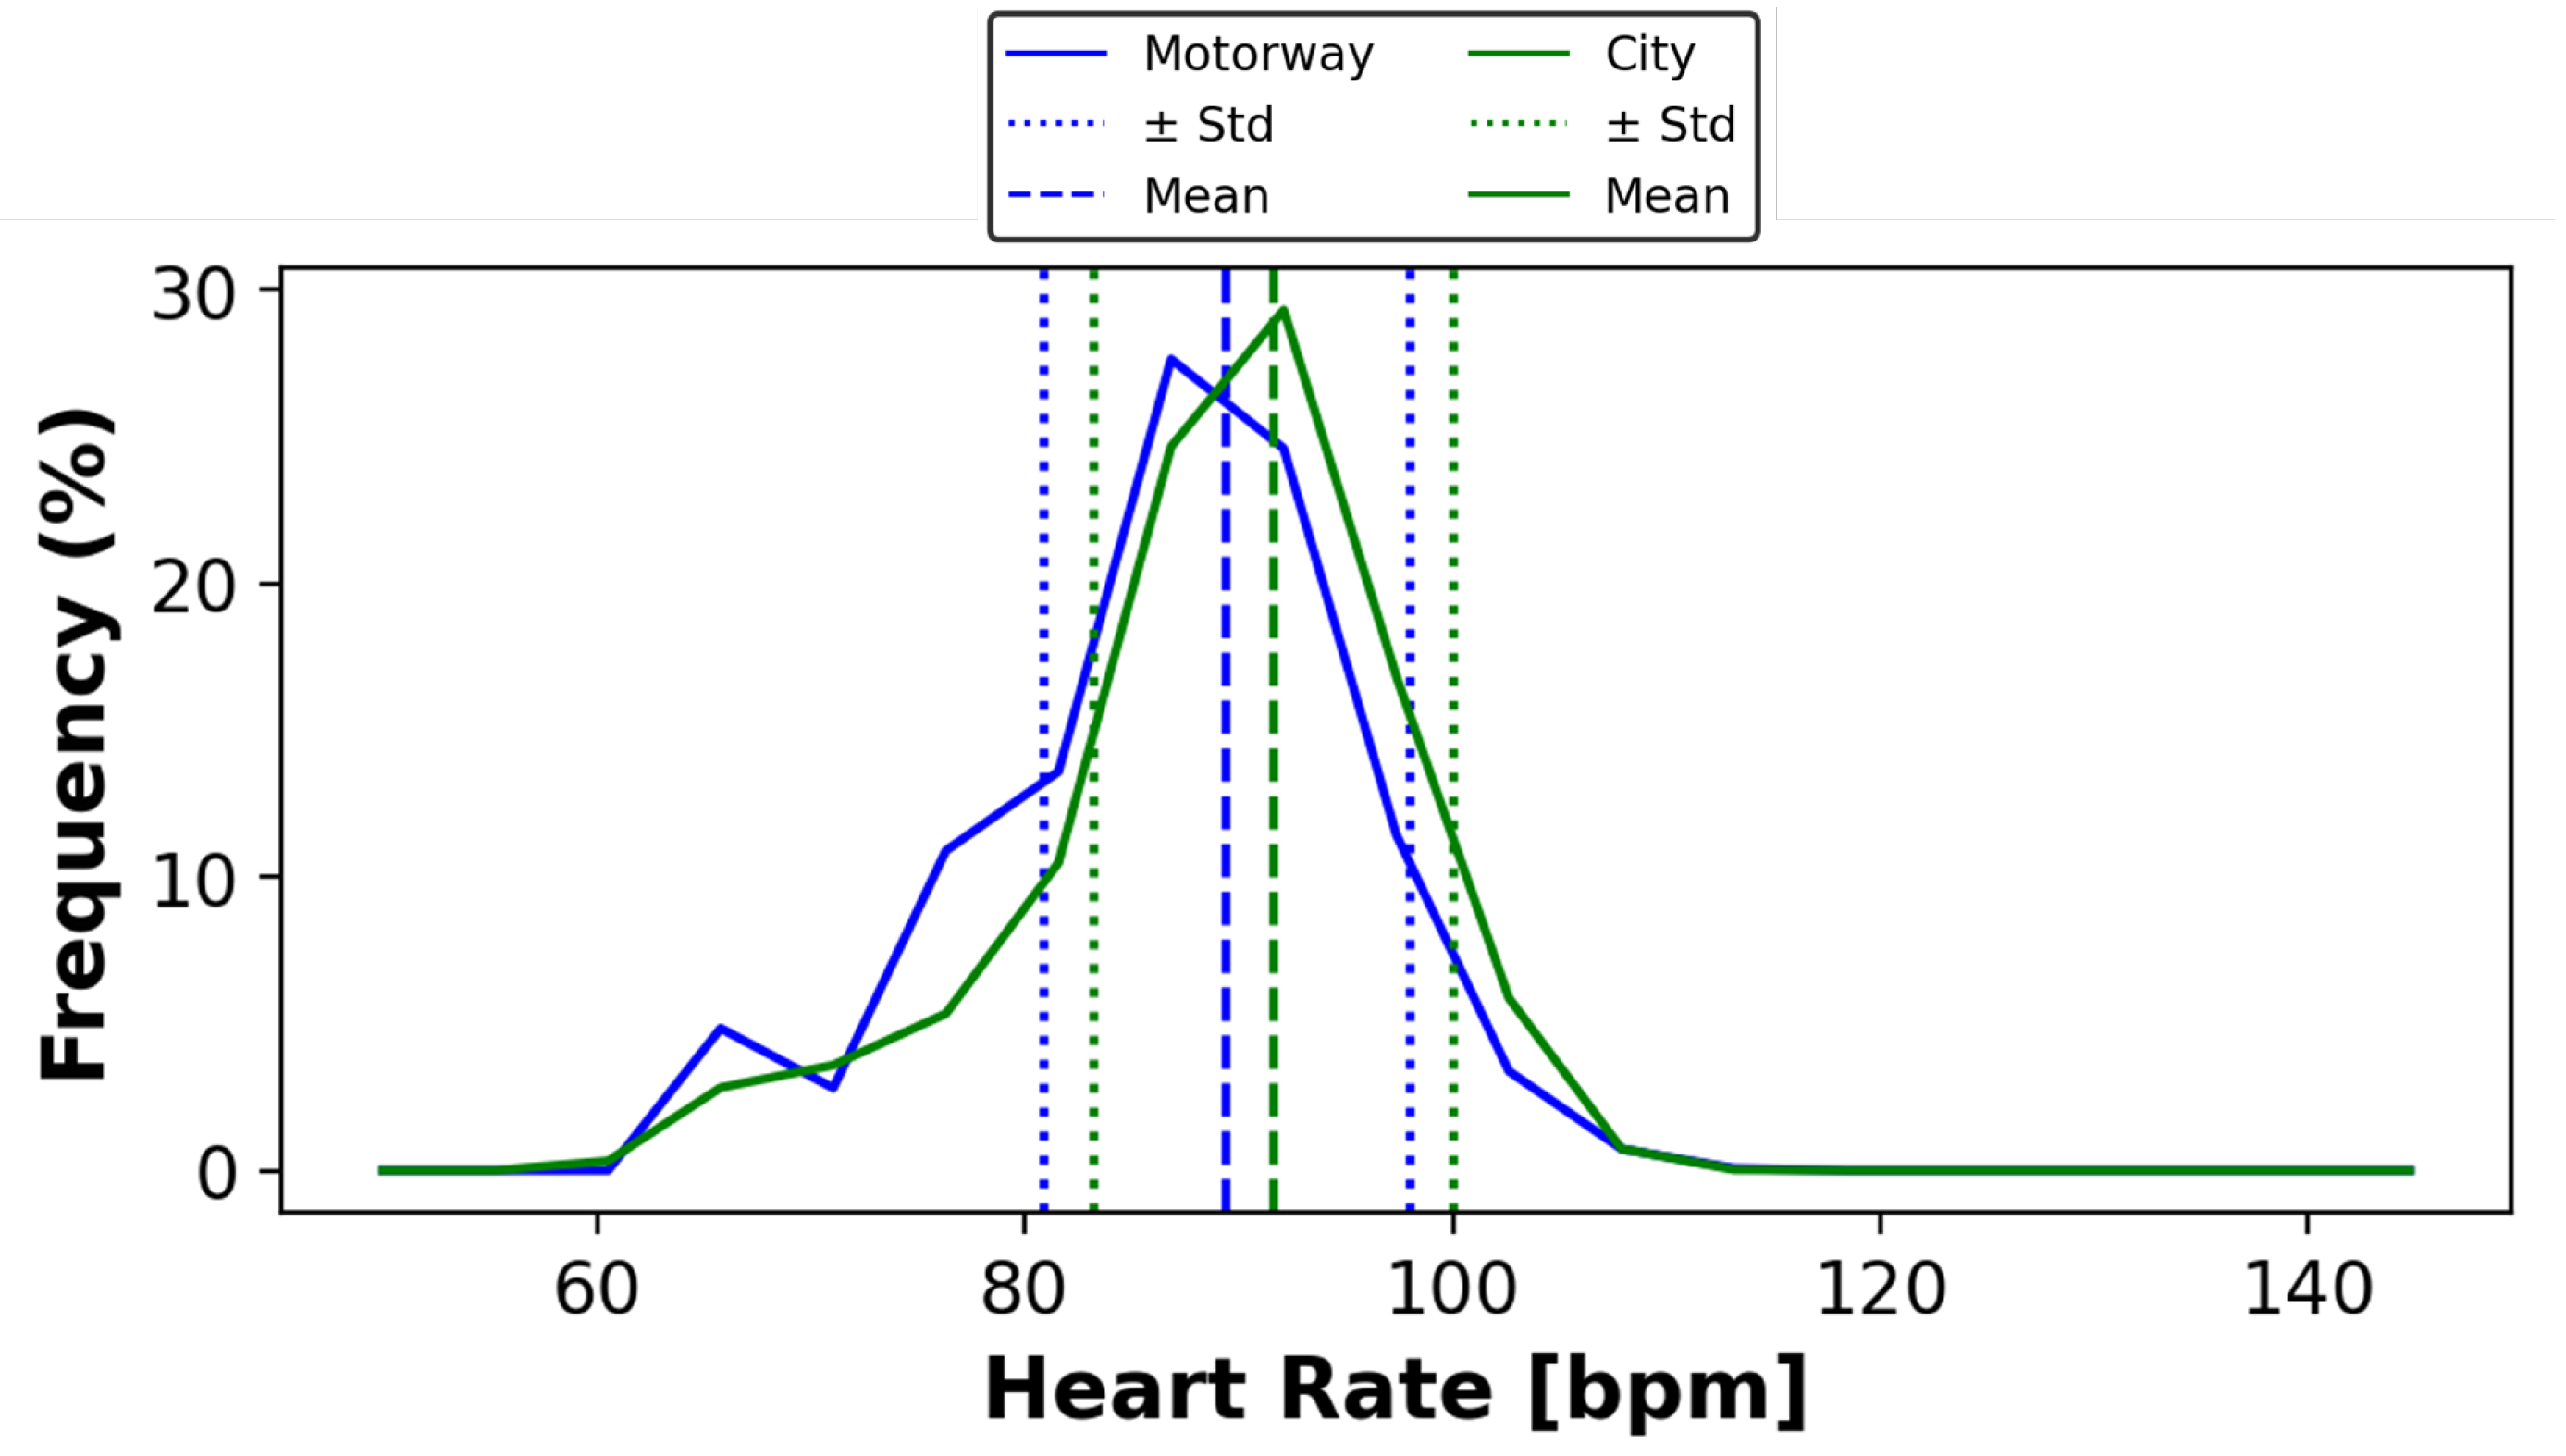
Figure 5.
Blink count per minute and fixation count per second for all subjects across different scenarios.
Figure 5.
Blink count per minute and fixation count per second for all subjects across different scenarios.
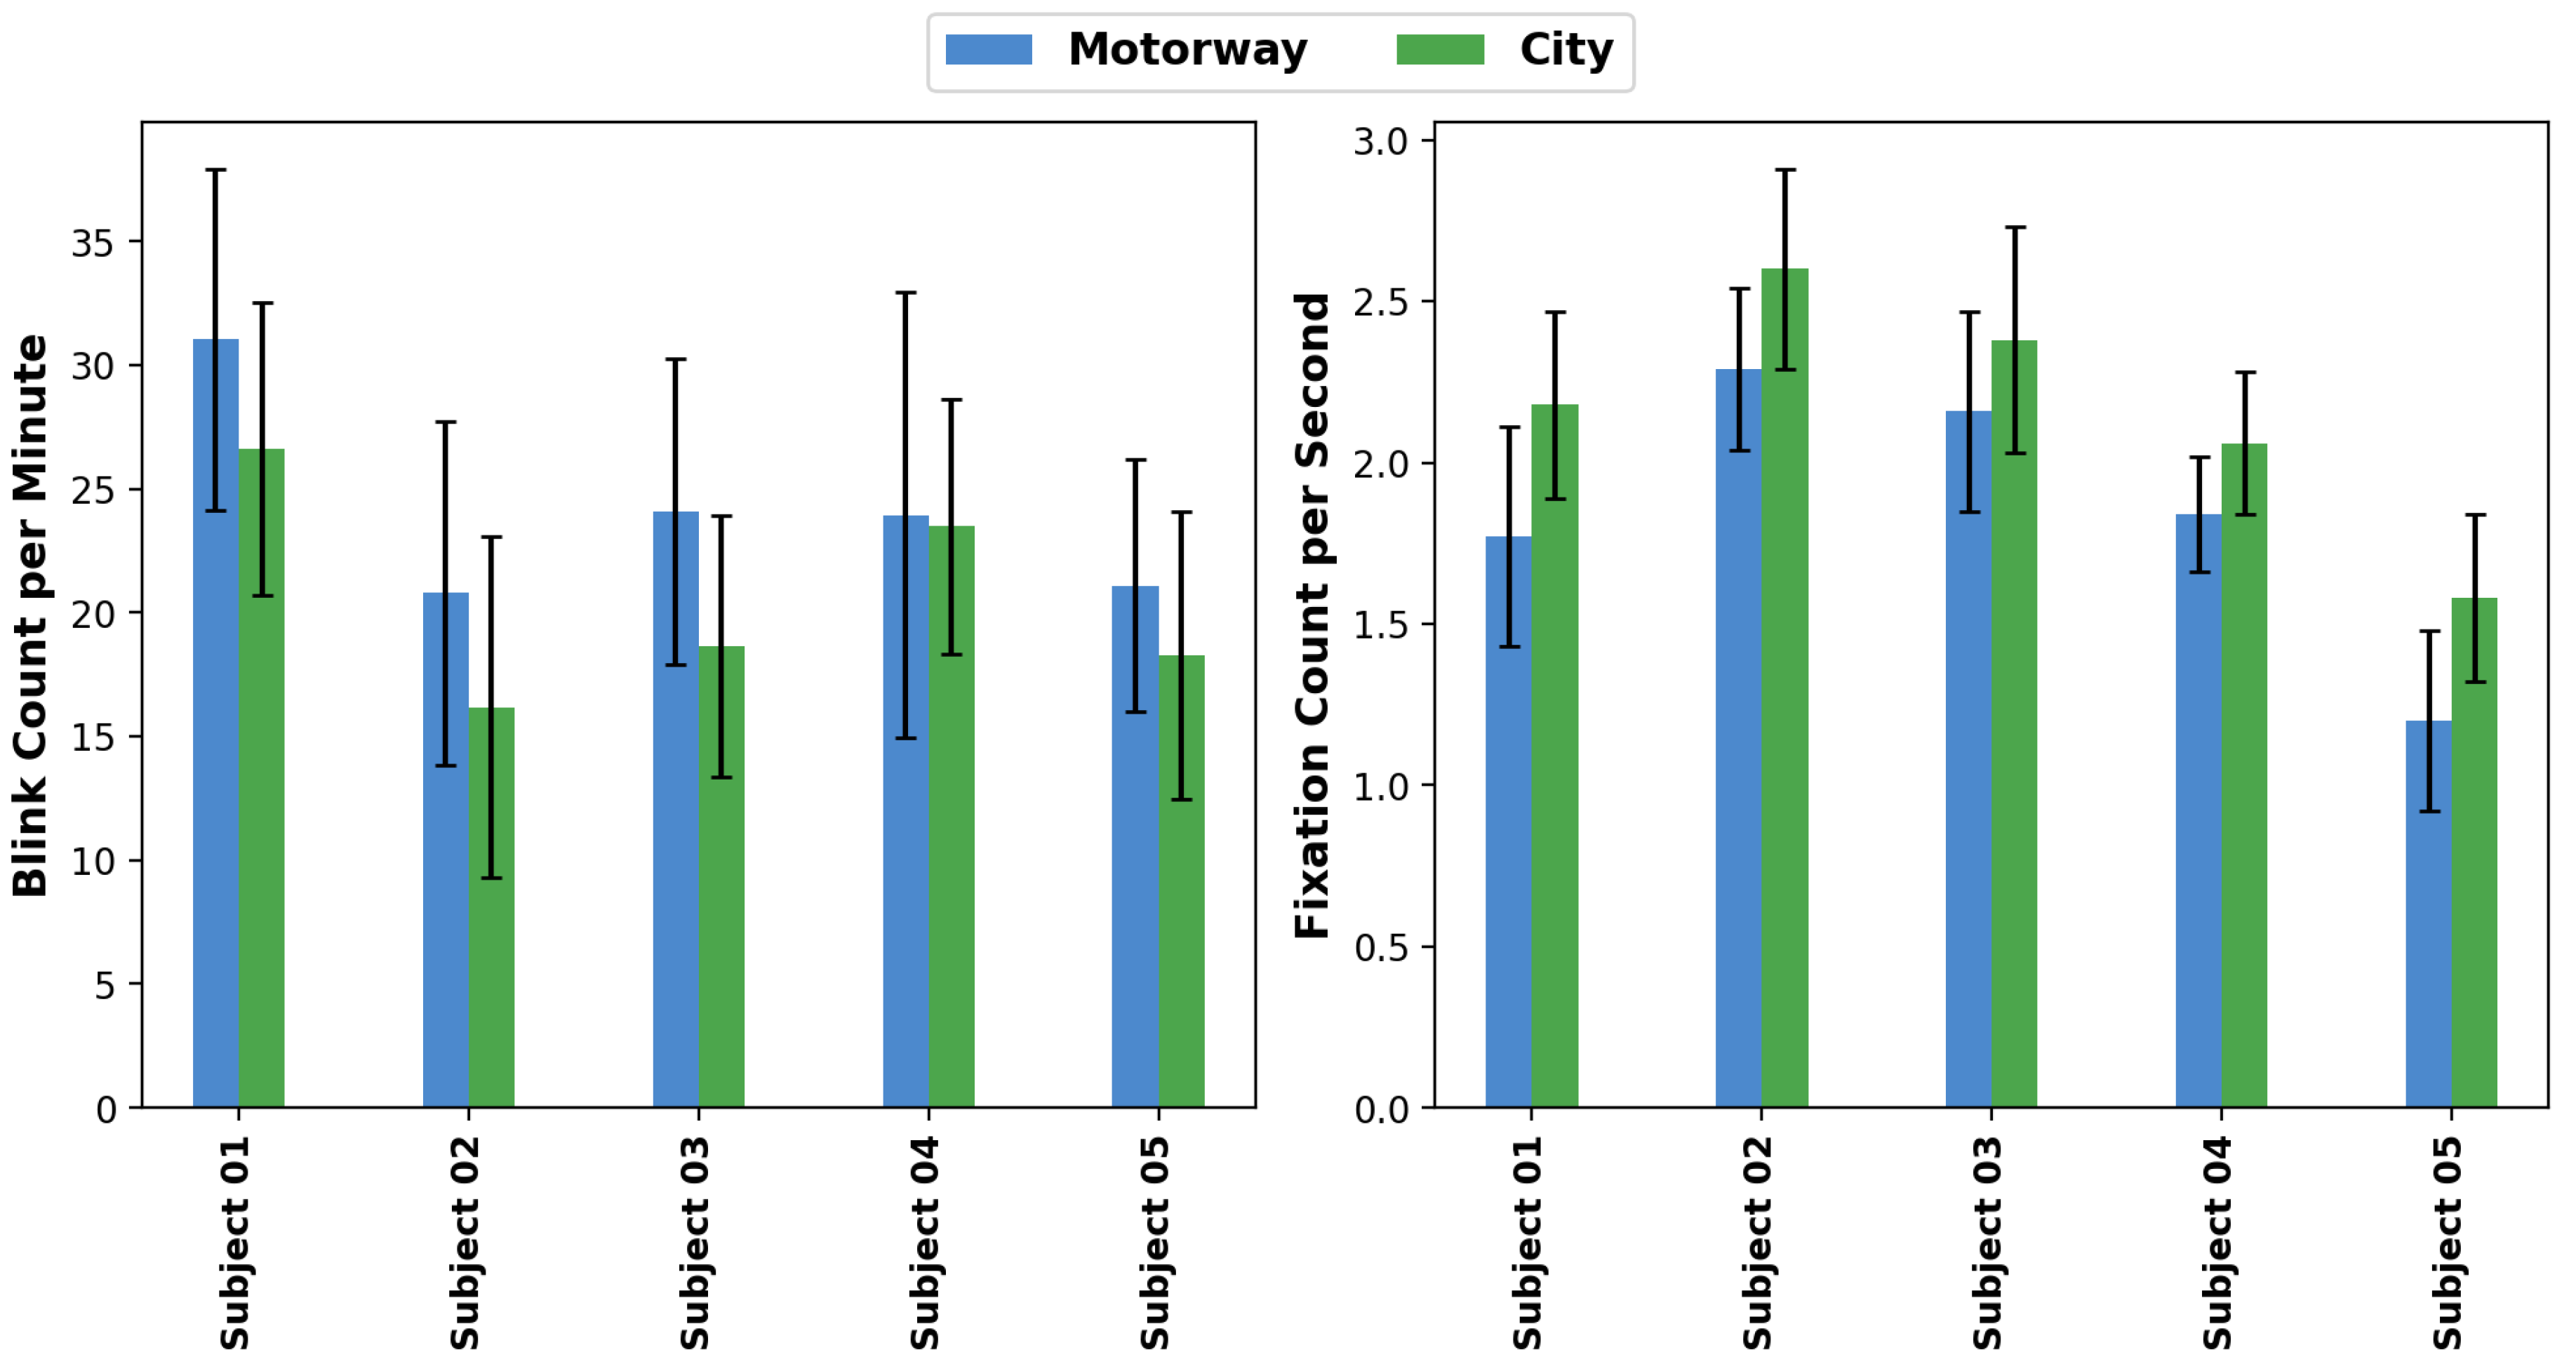
Figure 6.
Blink and fixation duration distributions with mean and standard deviation values for motorway and city driving.
Figure 6.
Blink and fixation duration distributions with mean and standard deviation values for motorway and city driving.
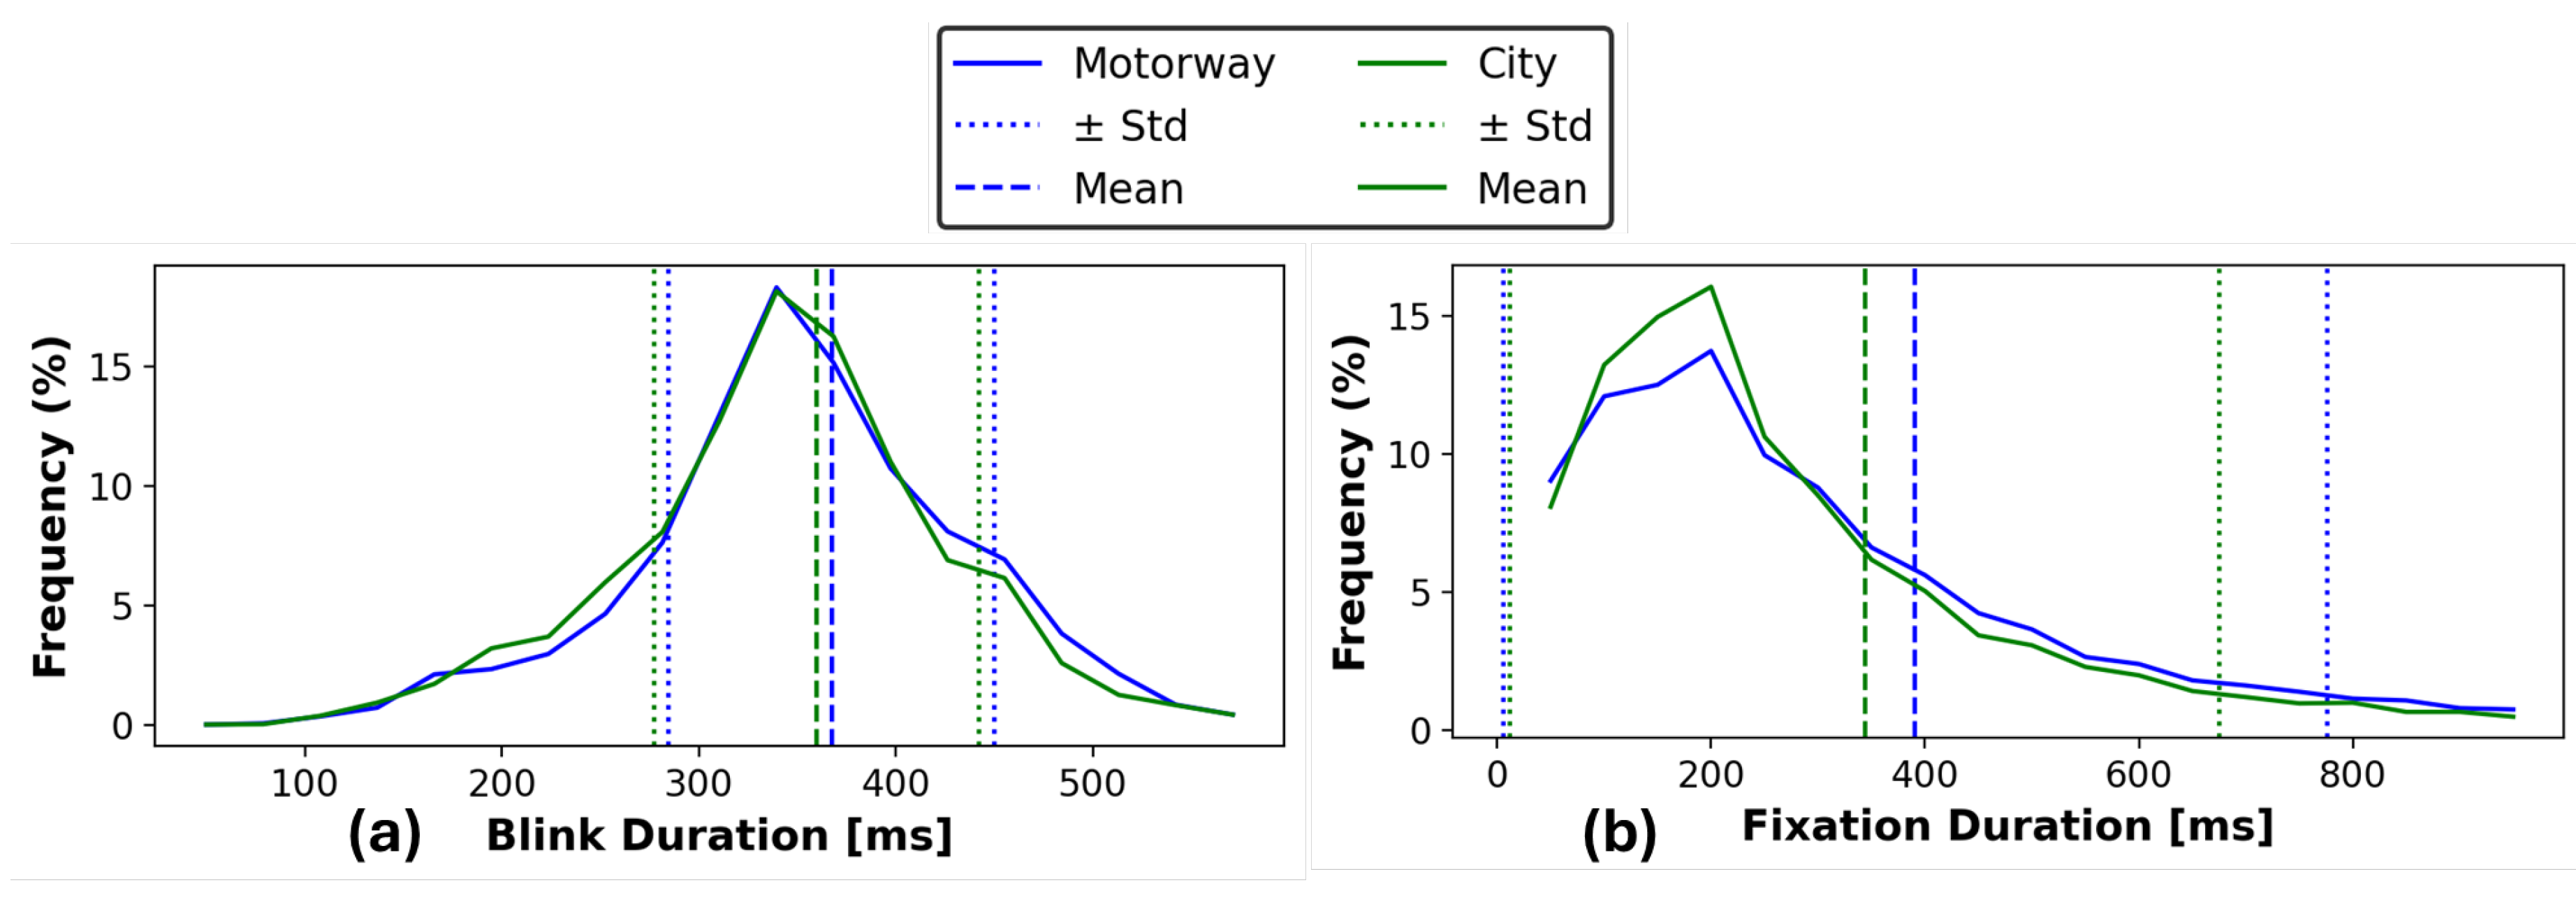
Figure 7.
Saccade duration, amplitude, and velocity distributions with mean and standard deviation values for motorway and city driving.
Figure 7.
Saccade duration, amplitude, and velocity distributions with mean and standard deviation values for motorway and city driving.
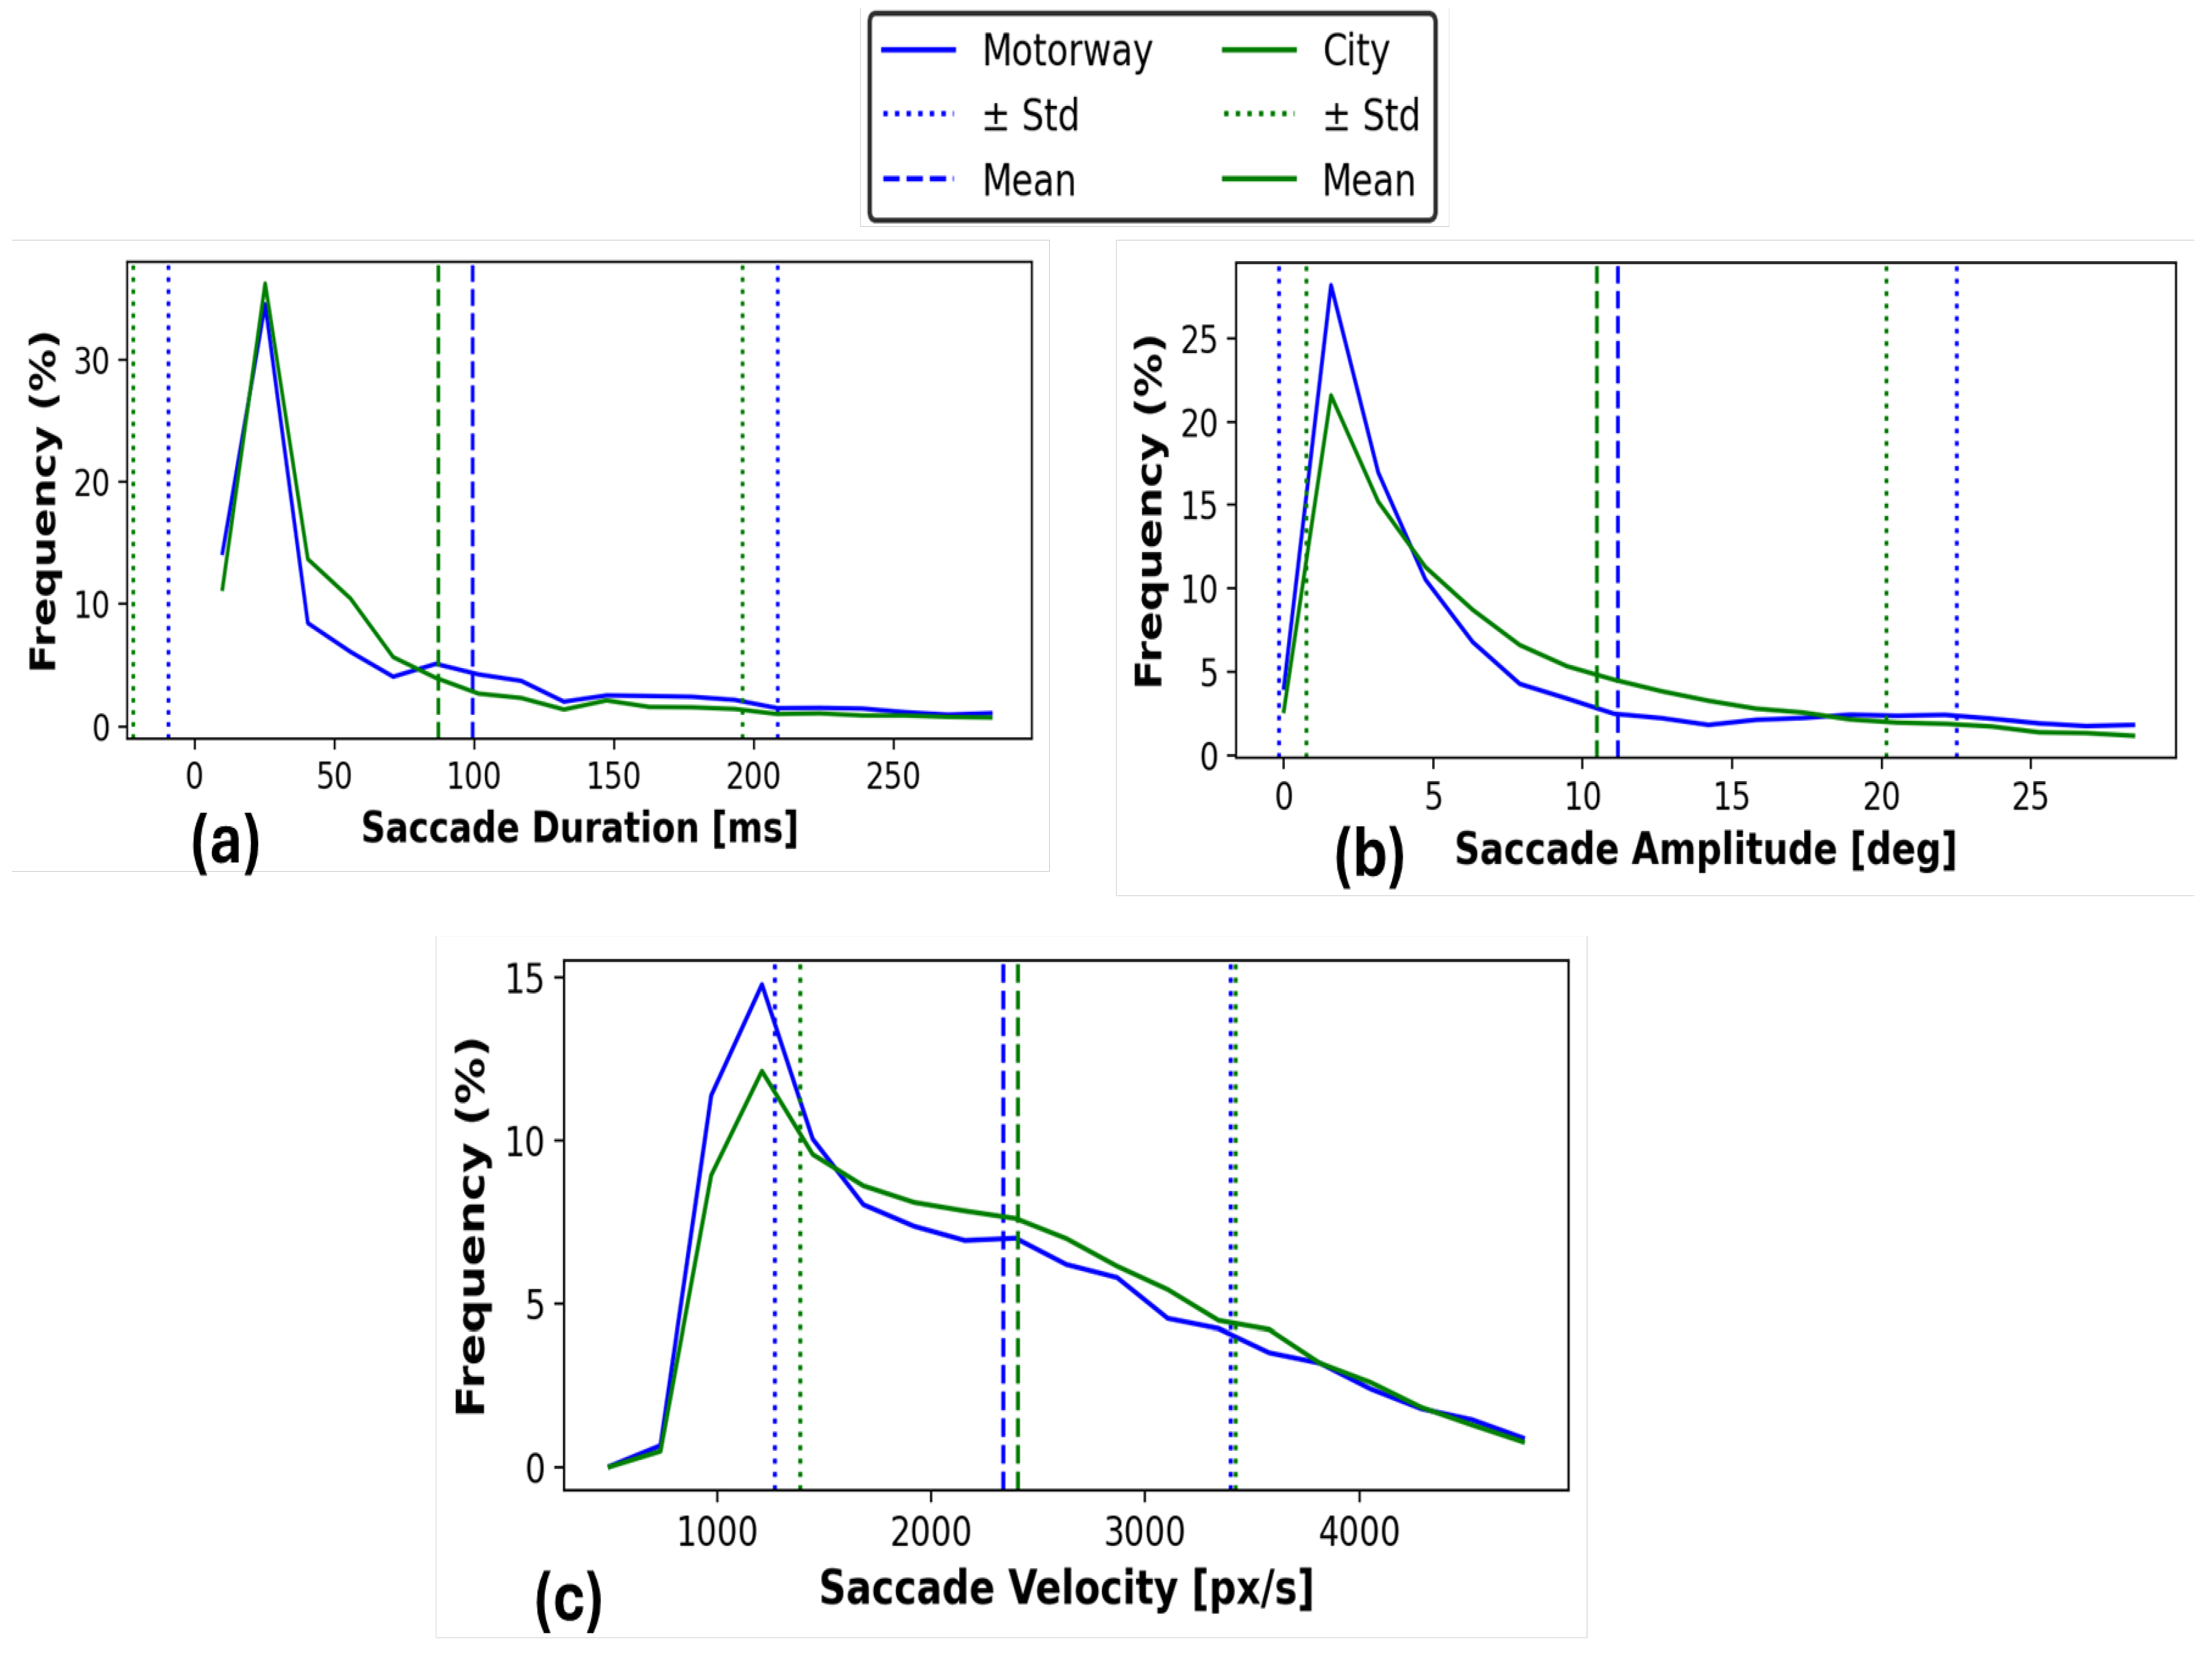

Table 1.
Comparison of Driver Monitoring Utilizing HR and Gaze Metrics.
| Study | HR | Gaze Metrics | Real Environment | ||
|---|---|---|---|---|---|
| Blink | Fixation | Saccade | |||
| [7] | ✓ | ✗ | ✗ | ✗ | ✓ |
| [31] | ✓ | ✗ | ✗ | ✗ | ✓ |
| [23] | ✓ | ✗ | ✗ | ✗ | ✗ |
| [32] | ✗ | ✗ | ✓ | ✗ | ✓ |
| [18] | ✓ | ✓ | ✓ | ✗ | ✗ |
| [20] | ✓ | ✓ | ✓ | ✗ | ✗ |
| [19] | ✓ | ✓ | ✓ | ✓ | ✗ |
| Present Work | ✓ | ✓ | ✓ | ✓ | ✓ |
Table 2.
Participant demographics.
| Participant | Age | Gender | Driving Experience (Years) |
|---|---|---|---|
| 1 | 35–40 | Male | 15–20 |
| 2 | 25–30 | Male | 5–10 |
| 3 | 30–35 | Male | 5–10 |
| 4 | 30–35 | Male | 10–15 |
| 5 | 40–45 | Male | 20–25 |
Table 3.
Limits for eye-tracking and physiological metrics.
| Metric | Lower Limit | Upper Limit |
|---|---|---|
| Blink Duration (ms) | 50 | 2000 |
| Fixation Duration (ms) | 50 | 5000 |
| Saccade Duration (ms) | 10 | 1000 |
| Saccade Velocity (px/s) | 0 | 10000 |
| Saccade Amplitude (degrees) | 0 | 50 |
| HR (bpm) | 40 | 200 |
Table 4.
Threshold values and weights assigned to each metric to assess the proposed algorithm.
| Threshold Values for Each Metric | ||
|---|---|---|
| Metric | Lower Bound | Upper Bound |
| HR | ||
| Blink Duration [26] | ||
| Fixation Duration [26] | ||
| Saccade Duration | ||
| Saccade Amplitude [50] | ||
| Saccade Velocity | ||
| Weights Assigned to Each Metric | ||
| Metric | Weight | |
Table 5.
HR and Gaze Weights with Normal Segment Percentage at a threshold () of the total score.
| HR Weight | Gaze Weight | Normal Segment (%) |
|---|---|---|
| 0.1 | 0.9 | 92.32 |
| 0.2 | 0.8 | 91.75 |
| 0.3 | 0.7 | 91.75 |
| 0.4 | 0.6 | 86.32 |
| 0.5 | 0.5 | 87.38 |
| 0.6 | 0.4 | 64.79 |
| 0.7 | 0.3 | 64.79 |
| 0.8 | 0.2 | 64.79 |
| 0.9 | 0.1 | 64.79 |
Table 6.
Threshold values and corresponding normal percentages.
| Threshold () | Normal Percentage (%) |
|---|---|
| 0.30 | 97.34 |
| 0.35 | 93.26 |
| 0.40 | 93.26 |
| 0.45 | 87.38 |
| 0.50 | 87.38 |
| 0.55 | 63.73 |
| 0.60 | 63.73 |
| 0.65 | 63.28 |
| 0.70 | 63.28 |
| 0.75 | 59.76 |
| 0.80 | 59.76 |
Disclaimer/Publisher’s Note: The statements, opinions and data contained in all publications are solely those of the individual author(s) and contributor(s) and not of MDPI and/or the editor(s). MDPI and/or the editor(s) disclaim responsibility for any injury to people or property resulting from any ideas, methods, instructions or products referred to in the content. |
© 2025 by the authors. Licensee MDPI, Basel, Switzerland. This article is an open access article distributed under the terms and conditions of the Creative Commons Attribution (CC BY) license (http://creativecommons.org/licenses/by/4.0/).
Copyright: This open access article is published under a Creative Commons CC BY 4.0 license, which permit the free download, distribution, and reuse, provided that the author and preprint are cited in any reuse.


