Submitted:
06 October 2025
Posted:
07 October 2025
You are already at the latest version
Abstract
AbstractCultural Intelligence (CQ) has traditionally only been embraced by those organizations that participated in global endeavors, but discounted or ignored by those whose operations were domestic or local. This paper uses Hofstede’s cultural Dimension Theory that was developed as a part of International Business Machines’ (IBM) global marketing strategy to compare the cultural mores of a small, sub-culture of Native Americans to accepted American norms. The Cherokee Tribe of Northeast Alabama (CTNEAL) is a state recognized tribe that is made up of the descendants to the Cherokees that either refused to be removed to Oklahoma or returned to the southeast before the final federal census was completed in 1906.This research explores the existence of substantial cultural differences that are not casually observable. Most of these tribal citizens are often perceived as Euro-American resident/citizens of the United States, but their responses in the study indicates a separate cultural identity. This study documents meaningful differences among the 5 Social and Cultural measures that are defined in Hofstede’s Version 08 study as 1) Power Distance, 2) Individualism /Collectivism, 3) Uncertainty Avoidance, 4) Masculinity/Femininity, and 5) Long versus Short-term orientation and then makes recommendations as to how this information can be used to improve organizational outcomes on not just global, but domestic and even local organizations.
Keywords:
cultural intelligence
; Cherokee
; Hofstede
; Indian removal
; CTNEAL
Introduction
The world abounds with many diverse cultures. These distinct cultures are usually considered to be associated with the country of that culture’s origin, but often there are multiple cultures that co-exist within the confines of one country: especially in a country as large and diverse as the United States. This is a study of an American sub-culture (the Cherokee Tribe of North Alabama) that was created using Hofstede’ s Cultural Dimensions Theory which he originally developed as a business tool while working for International Business Machines (IBM) in the late 1960’s and early 1970’s. This analysis uses an updated version of Hofstede’s factor analysis (Version 08) which adds an additional factor to his original offerings to; 1) evaluate this sub-culture for their specific dimensions, and 2) compare these dimensions to Hofstede’s published cultural traits for residents of the United States.
Cultural Overview
History of the Cherokee Tribes in America—The Cherokee people have lived in the Southeastern United States further back than anyone can say. They are descended from a large and powerful Indian tribe that are of an origin that scholars cannot agree upon. The most current theories contend that the Cherokees came from South America in an attempt to avoid other warlike tribes in that area. The main defense of this theory is that there are certain similarities between the baskets and pottery of some areas of South America and that of the Cherokees (Conley, 2005).
The Cherokees first encountered Europeans in the 1540s during the excursions of Hernando De Soto. De Soto and his expedition who entered Florida in search of gold and then spent three years on an expedition where they entered what is now Georgia, Alabama, Tennessee, Arkansas, Oklahoma, and Mississippi. The Cherokees were lucky in that they were relatively unscathed by their initial contact with the new outsiders unlike many of the other tribes of the region that were looted, ransomed, enslaved, or killed outright. In 1561 the Spanish returned to South Carolina with the French following just a few years later (Conley, 2005; Perdue, 1979).
For the next 100 years there was a somewhat peaceful co-existence between the Indians and the new white settlers. Englishmen first visited Cherokee country in 1673. In an attempt to procure trade goods for return to England, James Needham and Gabriel Arthur accompanied a group of Oconeechee Indians (that acted as interpreters) to the Cherokee town of Chota, on the Little Tennessee River (in present day Monroe County, TN). Trade was established with the English and there was relative peace between them and the Cherokees until a situation arose between the colonists of South Carolina and the Indians in 1715 (Ramsey, 2008). The resulting skirmishes came to be known as the Yamassee War. Within a year an uneasy peace was made between the warring factions and over the next five years, a treaty was hammered out that clearly defined the boundaries between the different cultures and provided a central point of contact for the disjointed Cherokee Tribes (Conley,2005).
In 1738 a smallpox epidemic that was introduced by the slave ship London Frigate into Charleston, SC (South Carolina, 2022) which decimated the Cherokee People. Over half of the Cherokee nation died because the people lacked any of the immunities that protected the European settlers. This epidemic left the Cherokee weakened and the increased dependence on trade with the foreigners further eroded the traditional Cherokee lifestyle. In addition to increased dependence, there was also the emergence of a large mixed-blood population within the Cherokee Nation. The Cherokee became known as one of the “Civilized” Indian Tribes and it looked as though they might be eventually assimilated into the melting pot of North America. The turning point in this scenario came with the American Revolution (Conley, 2005).
The English Crown took full advantage of the distrust between the colonists and the Cherokees, offering to restore the tribal lands if the Indians would help England to quell the revolution. Many of the outspoken “War Chiefs” responded, staging guerilla raids into the Carolinas, Georgia, and Virginia. The American (colonial) response was to attack peaceful villages that were not involved in the fray but were targets of opportunity. Eventually the war was over, treaties were signed, land was ceded, and damages paid, but the damage done was not reconcilable; ill feelings towards the Cherokee, borne out of their collusion with the British, festered between the new states and the Indigenous populations within their borders. The Cherokee had to go! It was just a matter of time (Conley, 2005).
By the 1820s the Cherokee’s tribal lands were reduced to an area less than one quarter the size of their original holdings. In 1830 President Jackson signed into law the Indian Removal Act. This Act coupled with the Treaty of New Echota (a treaty that was not signed by the chiefs in power) sought to remove all the Southeastern Indians to lands west of the Mississippi River. The discovery of gold in the mountains of Northeast Georgia exacerbated the issue with the Georgia statehouse wasting no time in enacting legislation designed to dismantle the Cherokee nation within its borders. (Filler, 1962) Georgia’s attempts to subjugate the Cherokee that lived within their borders resulted in lawsuits instead of uprisings, with hearings that found their way into the U.S. Supreme Court in 1831. In the court’s decision (Worchester v/s Georgia), the justices held that Georgia had no authority to enforce its laws on the Cherokee Nation. Upon hearing the news Andrew Jackson is said to have replied,” John Marshall has made his decision, now let him enforce it” (Filler, 1962). Jackson’s sentiments were echoed throughout Washington D.C. In 1836 the Senate ratified the fraudulent New Echota Treaty, striking out the provisions in it that allowed Cherokees who wished to renounce their Cherokee citizenship to remain behind after swearing an oath of allegiance to the state. The stage was set for removal. Later that year soldiers began “rounding up” the Indians that had not already voluntarily left to join the western villages. The rounded-up Cherokees were imprisoned in crude stockades without shelter, clean water, or latrines for months awaiting transport to the west. Hundreds of the imprisoned Cherokee died of dysentery, especially the young and the very old. Finally, in August of 1838 the first of thirteen waves of Cherokee left the Southeast for their trip to Eastern Oklahoma with the last one being completed in March of 1839. Hundreds died along the way and the total cost of the removal effort amounted to $1,263,228.38 which was deducted from the amount that the Cherokee Nation was paid for their land holdings in the east (Conley, 2005).
Federally Recognized Cherokee Tribes (Modern Day)
Currently, there are three Cherokee Tribes that are recognized by the federal government as independent, self-governing entities. The largest and most prevalent of these is The Cherokee Indian Nation, which is headquartered in Tahlequah, OK. This tribe has specific and exclusive requirements for membership. Like the CTNEAL, they do not require any specific percentage of Cherokee blood, but their documentation requirements are much more stringent:
“To be eligible for tribal membership with the Cherokee Nation, you must apply and be able to present a Certificate of Degree of Indian Blood (CDIB), issued by the Bureau of Indian Affairs. To obtain a CDIB, you must apply formally for one and provide acceptable, legal documents which connect you to an ancestor, who is listed with a roll number and a blood degree from the final rolls of citizens and freedmen of the Five Civilized Tribes, Cherokee Nation, (commonly called the Dawes Commission of Final Rolls). These rolls were compiled between the years of 1899-1906.”(Ummerteskee, 2000)
The second largest federally recognized Cherokee Tribe is the Eastern Band of Cherokee Indians. They are based in western North Carolina and have an even more exclusive membership policy. The ancestors of the Eastern Band refused to be “herded” into Oklahoma in the “Trail of Tears” and were able to successfully evade federal troops by using the natural barrier that was provided by the Smoky Mountains. They remained an “outlaw band” until 1899, when the North Carolina General Assembly recognized them as an independent corporate body. Like the Cherokee Nation in Oklahoma, they are now a sovereign nation, with the ability to define their own laws and citizenship requirements. To be a member of the Eastern Band of Cherokee Indians, you must demonstrate through legal documentation that you are at least 1/16th Cherokee blood and be directly descended from an ancestor whose name appears on the Baker Roll of 1924.The Eastern Band is cognizant that its rules disenfranchises many ethnic Cherokees, but they felt that this particular census was made up exclusively of those Cherokee that wanted to retain their Cherokee heritage, and they were not concerned with those who did not (Haynes, 2001).
The United Keetoowah Band of Cherokee Indians in Oklahoma (UKB) is the smallest of the federally recognized Cherokee Tribes. They owe their charter to the 1934 Indian Reorganization Act and the Oklahoma Indian Welfare Act of 1936. The UKB has the most stringent requirements of the federally recognized tribes. This group is ultra-traditional and has a requirement that members must be at least ¼ Cherokee, based on the US Government policies that validated it.
“Members of the UKB consist of all persons whose names appear on the list of members identified by a resolution dated April 19, 1949, and certified by the Superintendent of the Five Civilized Tribes Agency on November 26, 1949, with the governing body of the UKB having the power to prescribe rules and regulations governing future membership.”(Haynes 2001)
The Cherokee Tribe of Northeast Alabama (CTNEAL, pronounced “Sentinel”)
CTNEAL is a state recognized tribe (AIAC, 1984) that does not qualify for federal recognition because even though their members are descended from documented members of the pre-removal Cherokee tribes, their family members did not appear on much later census rolls (i.e., Dawes Commission, 1906) because they had either escaped removal or left the western reservation and returned east prior to the final rolls.
History of CTNEAL—As the name implies, the Cherokee Tribe of Northeast Alabama comes from the corner where Alabama, Georgia, and Tennessee meet. The history of these Cherokees in Alabama is a rich one. Much of the earliest documented Cherokee law was written in this area using Sequoya’s syllabary (alphabet). There were Cherokee delegates from Northeast Alabama that traveled to Washington DC to appear before Congress in their failed bid to avoid removal in the 1830s. CTNEAL is made up of descendants of the Cherokee from that area that chose to flee the area instead of being relocated to Oklahoma as part of the Native American Relocation Act. The tribe’s name was originally the Cherokee Tribe of Jackson County but that was changed to the tribe’s current name in 1979 when they gained tribal recognition from the State of Alabama under the leadership of Dr. Lindburgh (Lindy) Martin, PhD (Haynes, 2001; AIAC, 2009).
Tribal Demographics—To be a member of CTNEAL, you must be a descendant of a tribal member that is listed in the Dawes, Henderson, Baker, or Guion-Miller Cherokee rolls. This connection must be proven through research that includes documentation of birth and death records, and/or US Census reports. There is no minimum percentage of Cherokee blood (blood quantum) required, though many of the tribal members have resorted to genetic testing to “prove” their blood claims, if to nobody but themselves.
There is not a current tribal census available, but according to the Alabama Indian Affairs Commission (AIAC) and interviews with tribal leaders, CTNEAL is the oldest and the poorest of all the Alabama (state) recognized tribes (AIAC, 2009). The most current estimates are that the tribe is more than 60% female, with approximately 55% of the population being over 50 years of age, and 20% under the age of 21. The estimated median income for the tribe is less than $30,000, and the overwhelming majority of the members have no more than a high school diploma. The tribe has concerns about its long-term sustainability, and studies are currently being done to figure out why younger tribal descendants have not chosen to affiliate with the tribe.
Tribal Business—In addition to the organizational legal status that was afforded to it by state recognition (AIAC, 1984) CTNEAL also elected to retain its earlier designation as a 501(c) 3, not-for profit organization. The tribe is governed by an eight-member Tribal Council that is elected based upon the tribal districts of Alabama (made up of Alabama counties, north of Montgomery) with one representative serving any members that do not live in one of these districts. This Tribal Council is augmented by a total of five administrative officers: consisting of Secretary, Treasurer and three “Chiefs.” The Principal Chief is the executive officer and figurehead of the tribe, and he/she is assisted by the 1st and 2nd Vice-Chiefs that act as parliamentarians and oversee the day-to-day operation of the tribe. Governance of the tribe is facilitated by a tribal constitution that mandates regular meetings and allows for tribal courts. The tribe owns property and maintains a presence in several small towns in North Alabama through school programs, scholarships, and cultural events.
The tribe’s primary business is to affirm its dedication to the Cherokee culture, language, and traditions. They sponsor community events throughout the year that include cultural and educational programs for tribal members of all ages, as well as provide an outreach for non-Indian neighbors. They also honor several inter-tribal and cultural commitments throughout the year and have inter-cultural ties to multiple county schools, two Universities and several active-duty military bases, where they serve as DEI (Diversity, Equity, and Inclusion) consultants. The tribe’s commitment to its culture and the community is communicated effectively by its current Vision and Mission Statements:
Vision Statement —“The vision of the Cherokee Tribe of Northeast Alabama is to work side-by-side with all people as we walk in the culture and traditions of the Cherokee People. Our vision includes educational opportunities to teach others the way of the Cherokee, preserving historical sites within Alabama, and imparting the legacy of the Cherokee to our descendants as was handed down to us.”
Mission Statement—“The mission of the Cherokee Tribe of Northeast Alabama is to preserve and protect the culture, heritage and legacy of the Cherokee people, while actively participating in the 21st Century”.
Since CTNEAL is (only) a state recognized tribe, there are no benefits or funding allocated for its operation or welfare. Funding for the tribe is provided by citizens, donations and grants that are tied to specific goals. Since this level of funding is enough to support only the most basic social services to the tribe (relief and education), the tribe also engages in other business enterprises that aid in making its “not-for-profit activities” sustainable.
For more information on CTNEAL, checkout the tribal website: https://cherokeetribeofnortheastalabama.org/
The Study
Hofstede’s Cultural Study—Gert Hofstede began his study of cultural differences in 1967, while he was an employee of IBM. While there, he was commissioned to begin a work that would take over 10 years and eventually be made up of over 116,000 questionnaires that were completed by over 60,000 participants in 50 countries (Jones, 2007). From the resulting data, he developed a factor analysis that was composed of a battery of 32 questions that was administered in 40 countries. The outcome of these questionnaires provided data on four bipolar dimensions: 1) Power Distance, 2) Individualism/Collectivism, 3) Uncertainty Avoidance, and 4) Masculinity/Femineity, which became the basis of his characterization of culture for each country (Clearly Cultural, 2009). In 1988 while working with M. H. Bond, he included an additional dimension: 5) Long/Short Term orientation (Clearly Cultural, 2009). These dimensions of national culture are each defined as:
Power Distance (PDI)—Hofstede’s Power distance Index measures the extent to which the less powerful members of organizations and institutions (like the family) accept and expect that power is distributed unequally. This represents inequality (more versus less), but defined from below, not from above. It suggests that a society’s level of inequality is endorsed by the followers as much as by the leaders.
Individualism/Collectivism (IDV)—Individualism is the one side versus its opposite, collectivism, which is the degree to which individuals are integrated into groups. On the individualist side, we find societies in which the ties between individuals are loose: everyone is expected to look after him/herself and his/her immediate family. On the collectivist side, we find societies in which people from birth onwards are integrated into strong, cohesive in-groups, often extended families (with uncles, aunts, and grandparents) which continue protecting them in exchange for unquestioning loyalty.
Uncertainty Avoidance (UAI)—Uncertainty avoidance deals with a society’s tolerance for uncertainty and ambiguity; it ultimately refers to man’s search for Truth. It shows to what extent a culture programs its members to feel either uncomfortable or comfortable in unstructured situations. Unstructured situations are novel, unknown, surprising, and different from usual. Uncertainty-avoiding cultures try to minimize the possibility of such situations by strict laws and rules, safety, and security measures, and on the philosophical and religious level by a belief in absolute Truth; “there can only be one Truth, and we have it” (Clearly Cultural, 2009).
Masculinity/Femininity (MAS)—Masculinity versus its opposite, femininity, refers to the distribution of roles between the genders which is another fundamental issue for any society to which a range of solutions are found. The IBM studies revealed that (a) women’s values differ less among societies than men’s values; (b) men’s values from one country to another contain a dimension from very assertive and competitive and maximally different from women’s values on the one side, to modest and caring and similar to women’s values on the other. The assertive pole has been called ‘masculine’ and the modest, caring pole ‘feminine.’
Long/Short Term Orientation (LTO)—Long Term Orientation is the fifth dimension of Hofstede which was added after the original four to try to distinguish the difference in thinking between the East and West. From the original IBM studies, this difference was something that could not be deduced. Therefore, Hofstede created a Chinese value survey which was distributed across 23 countries. From these results, and with an understanding of the influence of the teaching of Confucius in Eastern thought, long term vs. short term orientation became the fifth cultural dimension. Cultures that exhibit long term orientation display tendencies like persistence, ordering relationships by status and observing this order, thrift, and having a sense of shame. Conversely, cultures that identify with a short-term orientation display behaviors of personal steadiness and stability, protecting your ‘face,’ respect of tradition, and reciprocation of greetings, favors, and gifts.
Hofstede’s study, though still labeled as imprecise by some critics, was a breakthrough in cultural awareness. With our new, increasingly global market, Hofstede’s research provides an invaluable tool in understanding the mores and cultures from around the world that are different from our own.
The tool employed for this study is Hofstede’s Values Survey Model, Module 2008 (VSM 08) cultural questionnaire. Because there is sufficient data available for the North American culture, I did not re-create baseline data from a control group, but used Dr. Hofstede’s published results (Hofstede, 2012). (Table 1 contains a table of Hofstede’s published results, by country)
The Survey
Hofstede’s Values Survey questionnaire (2008) was sent to as many active members of CTNEAL as could be reached through both online and personal contact at tribal functions. The result was a sampling of 40 completed surveys. Since there is current published data available for the United States from the Hofstede study, there was no control group data taken for a comparison.
The Research
Because the heritage of the tribe is a mixture of multiple cultures their specific culture often defies categorization. This research project proved to be both eye-opening and controversial. There was a total of 40 surveys completed, with the survey instrument being offered to tribal members in both an online and in-person settings.
Findings
CTNEAL Cultural Orientation (Values)
This was the most exciting part of my study. My experience in working with the tribe over the years had already told me that many of the tribe’s cultural values might not be aligned with a traditional view of mainstream American Culture. The Cultural Values Survey was well received by the tribal citizens and provided much insight into the tribe’s cultural beliefs. Below is the chart and table that is associated with the compilation of the Hofstede Survey.
Figure 1.
Cultural Values for CTNEAL.
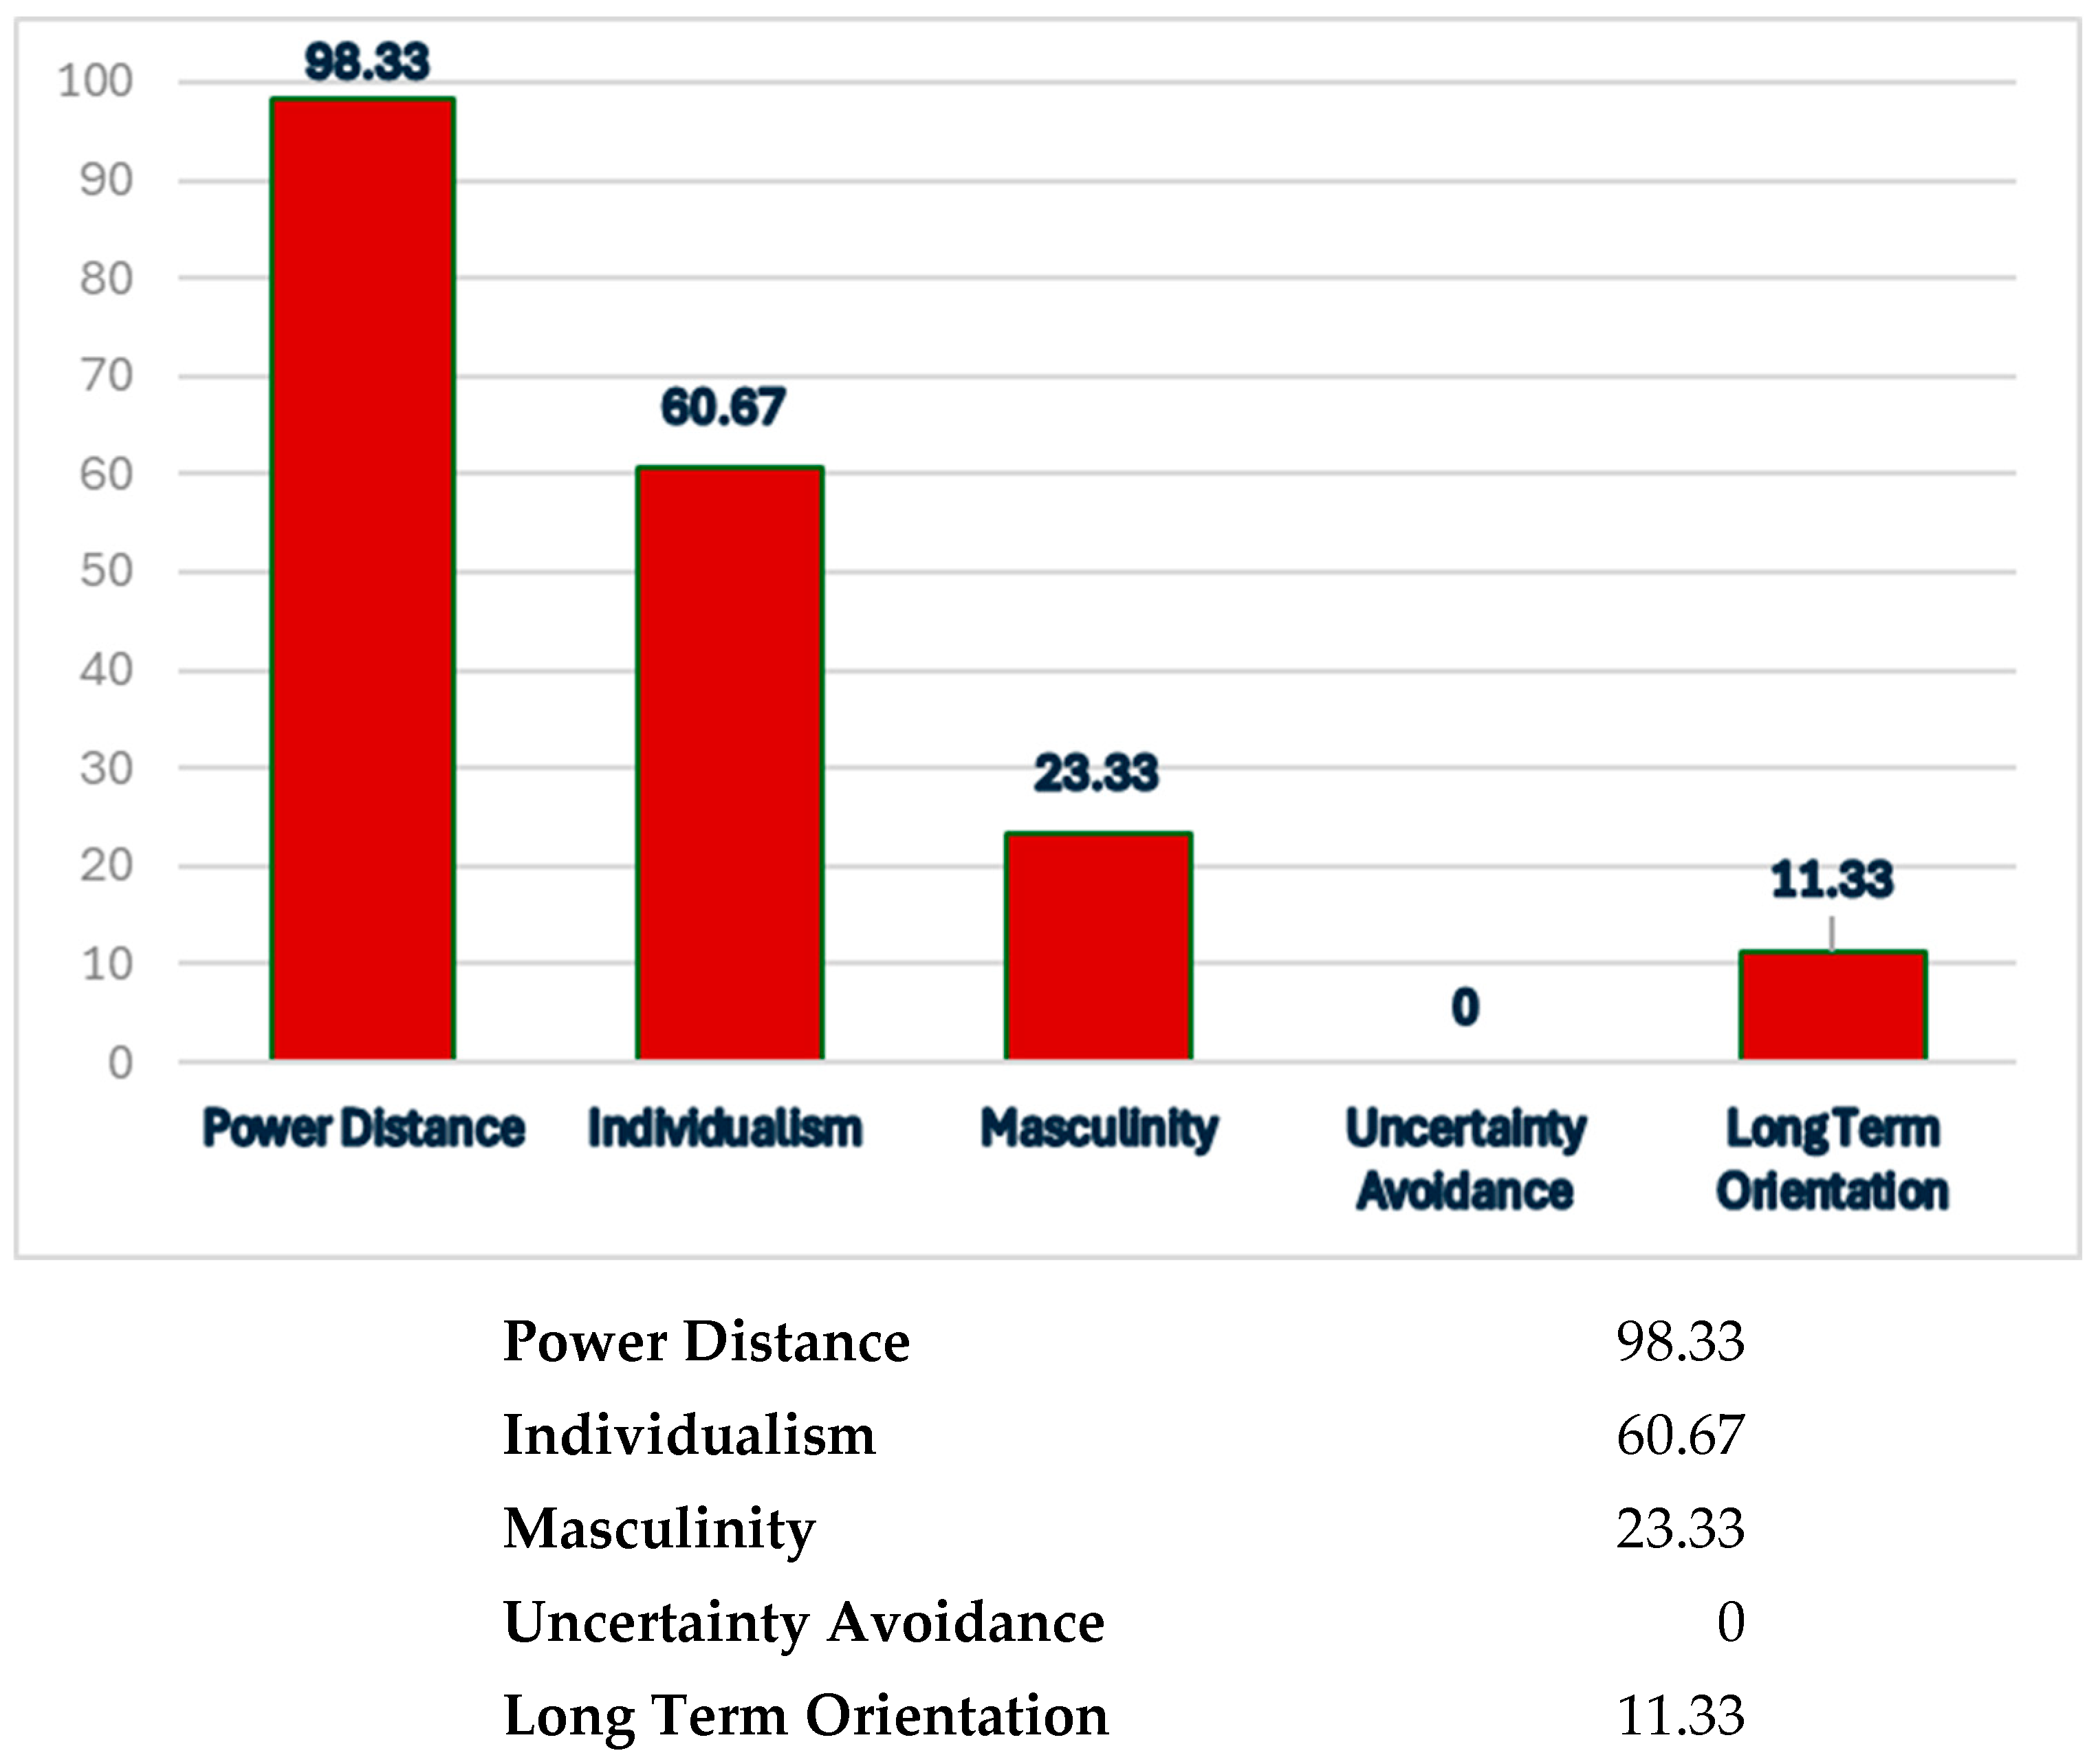
These numbers vary significantly from Hofstede’s model for the United States (See Figure 2 for a comparison of CTNEAL versus USA). (Table 1 contains a listing of countries and their corresponding values). These findings can be summarized as follows:
Power Distance (PDI)—The CTNEAL group survey indicated a Power Distance Index of 98.3. This is an extremely high number and suggests that the tribal citizens recognize and accept the authority of their leaders. This number exceeds the published data for the U.S. by 100%.
Individualism (IDV)—The CTNEAL group survey indicated an Individualism Index of 60.67. This is roughly 30% lower than the Published U.S. Culture Index. This number suggests that tribal citizens envision themselves as less individualistic (more collective) than the U.S. average.
Masculinity (MAS)—The tribal index for Masculinity is 23.3; more than 50% below the published U.S. Index. This number, though low by U.S. standards is normal by Cherokee standards. Their society traditionally empowers women and was the subject of more than one historical writer. One early English trader described their councils as a “Petticoat Congress.” (Conley, 2005)
Uncertainty Avoidance (UAI)—The CTNEAL survey indicated that the tribal citizens surveyed really do not worry themselves about uncertainty. Their index score of 0 is ultra-low and though there are some cultures that indicate an extremely low value in this area, none of them were this low.
Long Term Orientation (LTO)—The tribal index for this Cultural Value is an extremely low 11.33. This number is approximately 50% lower than the published number for the US. This data suggests that CTNEAL citizens are less concerned with long term events and tend to focus on immediate needs.
Summary and Findings
This paper studies and documents the cultural values of a small sub-culture of American Indians that are citizens of CTNEAL (an Alabama, state-recognized tribe). It compares the cultural styles and beliefs of the tribe and compares them to an accepted norm for the United States as a whole.
The findings of this survey are summarized as:
The Cultural Values of CTNEAL (based upon Hofstede’s survey) are significantly different than the published norms for those of the United States as a whole. The Survey sample for the tribe exhibited:
- a much higher Power Distance Index (PDI),
- a significantly lower Individualism Index (IDV),
- a much lower Masculine v/s Feminine index (MAS),
- a non-existent Uncertainty Avoidance Index (UAI), and
- a Short-Term orientation (LTO).
What do these findings mean? According to Hofstede (2001), the findings of this CTNEAL survey indicates a people that are:
- comfortable with the authority of their leaders,
- tend to have more concerns about the community and less about themselves,
- are not overly concerned about masculine versus feminine roles in the tribe,
- are not bothered by uncertainty, and
- are not as concerned about the future as they are the present.
Conclusions
The Cultural Values of CTNEAL defy being categorized with any of the existing, published values for Hofstede’s studies. Literature from the Hofstede Foundation warned me that this could happen. Some of the findings were obvious. I knew from my association with the tribe over the years that they had a short-term orientation and made little or no difference between masculine and feminine roles in the tribe; in fact, the majority of the tribal leaders are women (70%) and they run the majority of the tribe’s projects. The high Power-Distance Index might be a result of the cultural respect for leadership (Chief), and the extremely low measure for Uncertainty Avoidance could be a result of historical resilience to outside cultural influences. I do not have an explanation for these findings and can only attribute them, for the time being, to a statement that was made by Josh Haynes in his Master’s Thesis about the tribe in 2001, in which he states that there are some contradictions within the tribal culture that are due to “Culture Construction” that is made necessary by a lack of upbringing within the total sphere of Cherokee influence (Haynes, 2001).
For What Can This Knowledge Be Used?
As a leader, manager, or consultant, this data is especially useful information. Hofstede (2001) made recommendations on what kind(s) of management styles and organizational structures would best support each of the group dynamics that were measured in this study.
Power Distance (PDI)
Hofstede’s recommendations associated with this dimension are specifically associated with management style and organizational structure. According to Hofstede, cultures (like CTNEAL) that exhibit a high-Power Distance Index (PDI) are more efficient (and happier) with a paternalistic (possibly non-technical) leader, who provides unambiguous goals and strong direction on what is expected. Feedback and suggestions are not usually expected (or encouraged) in this environment. The organizational structure best suited to a high PDI is constructed around a multi-tiered leadership model that provides additional direction and oversite to the business processes. A corporate culture that exhibits a high PDI wants clear objectives and processes as well as a management structure that they can look up to for the approval and direction that leads to satisfaction, performance, and productivity (Hofstede, 2001,2009).
Individualism (IDV)
Acceptable management styles diverge sharply based upon the Individualism Index (IDV) of an organization’s or work group’s culture. Our survey indicated that CTNEAL citizens scored 33% lower in IDV than Hofstede’s baseline for the US. Even though it is not a radical departure from the US norm, it is still significant enough to justify adjustments for a work-team or organization that exhibits less IDV characteristics.
Hofstede recommends that many of the management theories that were developed in the United States (which heavily embrace individualism/high IDV) simply are not always effective in in dealing with groups that have a low IDV (Hofstede, 2001). Hofstede offers a case in point to illustrate this issue, technology implementation. Technology tends to empower individuals (especially in the workplace) and tends to shift the paradigm from collective to individualistic. For this reason, software that was developed in the US is usually well received in countries with a similar IDV ranking (Canada, Finland, Sweden), but not so well in countries with a lower IDV (Mexico, China, Türkiye). Hofstede’s solution was to either only transfer technologies that are “immediate” or “appropriate” for the existing collective climate, or to allow for local design of the political and/or organizational structures so that the two different IDV structures can coexist (or be customized to the environment) (Hofstede, 2001).
Another area of contention when dealing with a workgroup or organization that scores low in IDV would be one of the trademarks of American first-line managers, the performance appraisal. As a part of this appraisal process, managers in the United States are taught to conduct performance interviews in which “bad news” is often communicated to the individual employee in an open and forthright manner. This process usually works well in a society or group that is decisively individualistic, but it is disruptive to a collective group’s harmony and could cause embarrassment or loss of face. A better approach for a more collective group or organization would be the more subtle use of a mutually trusted intermediary to counsel the subordinate (Hofstede, 2001).
Masculinity (MAS)
Not surprisingly, the study group exhibited a markedly lower (65%) Masculinity index (MAS) than did Hofstede’s findings for (mostly) European Americans. Historical writings have made comments on this aspect of the Cherokee for more than 100 years (Conley,2005). From a business point of view this means that there is a small (if any?) gender culture gap where masculine and feminine roles are markedly different. Because of this lack of differentiation there must be provisions for a larger share of women in professional and technical jobs. Additional earmarks of this cultural trait are that men are allowed/expected to be gentle and empathetic, and that male, macho behavior is discouraged or even ridiculed. Women who exist in this culture resist gender stereotypes and describe themselves in their own terms (Hofstede, 2001).
Uncertainty Avoidance (UAI)
Hofstede made several observations that deal with work groups that exhibit a low UAI. They are loosely grouped into three separate areas.
- Employer preferences
Groups with a high tolerance for uncertainty tend to have a weaker loyalty to their employer and usually exhibit a preference for small organizations over large ones. This is important to consider because typically employers depend upon their employees’ fear of uncertainty to retain employees throughout fluctuations within their industry. Workers who exhibit a low UAI index also tend to be relationship oriented and thus are more concerned with the social and/or emotional issues that are associated with their work family than they are the tasks themselves. Care must be exercised to encourage (and facilitate) harmony within the workplace.
- 2.
- Innovation
A group that registers low in UAI tends to be much more tolerant of ambiguity and thus is usually more receptive to new innovations. (Transformational leadership?). This trait can also be associated with a low incidence of Long-Term Orientation (LTO). This dynamic, when paired with employer preferences for smaller organizations, can be useful when developing new markets or products.
- 3.
- Group (task) management.
According to Hofstede (2001) cultural groups that exhibit a low UAI score; A) Tend to have a strong belief in the ability of generalists (as opposed to experts) and place as much or more faith in a manager’s common sense and intuition than they do in a formal education or resume. Because of this respect (or preference) for generalists, it is not surprising that competencies are often not well defined within the work group(s) and that informal leadership within the group is often passed or shared among the group members according to which member has the most experience or insight.
One concern that arises from the informality associated with this type of organization is that precision and punctuality are not always prioritized (or appreciated) and must be taught and/or learned and managed (Hofstede, 2001). Projects engaged by these organizations will need to be selected carefully by project managers (or tribal leaders) because the workers’ views on Uncertainty Avoidance, (which is normally a filter for new ventures), are not a major factor in this group. Care must also be exercised to make sure that contingency planning for unknown issues (time and expense) (Jaafar, 2020; Koops, 2015) are included in projects, because of this culture’s tendency to minimize (or ignore) anticipated long-term problems and issues (Hofstede, 2001).
Long Term Orientation (LTO)
The study group exhibited a low score for LTO that was approximately 60% lower than the model for general American culture. According to Hofstede (2001) this low score (<10) should manifest itself in the form of:
- A workgroup (or group) that is more interested in the present and the extrapolation of processes for recreating past success. A strong concern for short-term results: the bottom line is more important than building long-term relationships or market position.
- Short term virtues: often manifested as preoccupation with rules for governance of processes, social consumption/spending (as opposed frugality or saving), and the importance of tradition.
- Analytic thinking: Problem solving often depends upon heuristic thought processes instead of complete definition of the problem(s) and discovery of most complete solution(s). There could be a preoccupation with tools and processes that have worked in the past, for issues that are similar.
Because of the short-term orientation of the tribe, projects for this group need to include short-term goals (wherever possible). A reliance on strict long-term goals could fail to garner sufficient buy-in to ensure a project’s completion.
The Bottom Line
Hofstede’s research was designed and intended for use by organizations that were doing business in countries other than their native one, but it can be used successfully to understand and influence sub-cultures within one’s own country, society, or organization.
These findings are not absolute, and not all members of a culture have the same views and beliefs. Individuals will always be unique, but this study is a good starting point to begin understanding how an organization, department or workgroup can be inspired to be happier and more efficient by understanding its culture (Hofstede, Hofstede, Minkov. 2010).
Even though the Hofstede studies were originally designed to measure the cultural differences between entire countries, further research has shown that it is scalable and can be used to identify cultural differences within organizational departments or even the workgroups within those departments. It is not hard to imagine the cultural differences that exist between groups that are involved in outside sales versus accounting or maintenance. What this understanding enables is the ability to let management develop the structure and/or strategy to best utilize the abilities and fitness of the workforce to be successful.
References
- AIAC—Alabama Indian Affairs Commission, Alabama Code § 41-9-708.Creation; administration; composition; qualifications; chairman; terms of office; recognition and representation of additional Indian tribes, bands, and groups; written complaints concerning commissioner, //aiac.alabama.gov/pdf/2019/CodeAIAC.pdf, 1984.
- AIAC—Alabama Indian Affairs Commission, The Cherokee Tribe of Northeast Alabama, https://aiac.alabama.gov/tribes_NortheastCherokee.aspx, 2009.
- Conley, Robert J, The Cherokee Nation—A History, The University of New Mexico Press, Albuquerque, NM, 2005.
- Filler, Louis, The Removal of the Cherokee Nation, D. C. Heath and Company, Boston MA, 1962.
- Haynes, Joshua S. Power in the Blood: Identity Construction and the Cherokee Tribe of Northeast Alabama, Master’s Thesis, University of Mississippi, 2001.
- Hofstede, J., Culture’s Consequences—Comparing Values, Behaviors, Institutions and Organizations Across Nations, Sage Publications, Thousand Oaks, CA, 2001.
- Hofstede, G., Hofstede, J., Minkov, M., Cultures and Organizations: Intercultural Cooperation and Its Importance for Survival, McGraw Hill, New York, 2010.
- Hofstede, J., Geert Hofstede on Culture, “Research and VSM,” www.geerthofstede.com, 2012.
- Jones, M.L. Hofstede—Culturally questionable? Oxford Business & Economics Conference. Oxford, UK, University of Wollongong, June 2007.
- Perdue, T., Slavery and the evolution of Cherokee society, 1540-1866. Univ. of Tennessee Press, 1979.
- Ramsey, W. L. (2008). The Yamasee War: A Study of Culture, Economy, and Conflict in the Colonial South. University of Nebraska Press. [CrossRef]
- University of South Carolina, Institute for Southern Studies, Epidemics.
- https://www.scencyclopedia.org/sce/entries/epidemics/, July 2022.
- www.ClearlyCultural.com. Gert Hofstede—Cultural Dimensions, Making Sense of Cultural Communications. June 2009.
Figure 2.
Comparison of Cultural Values.
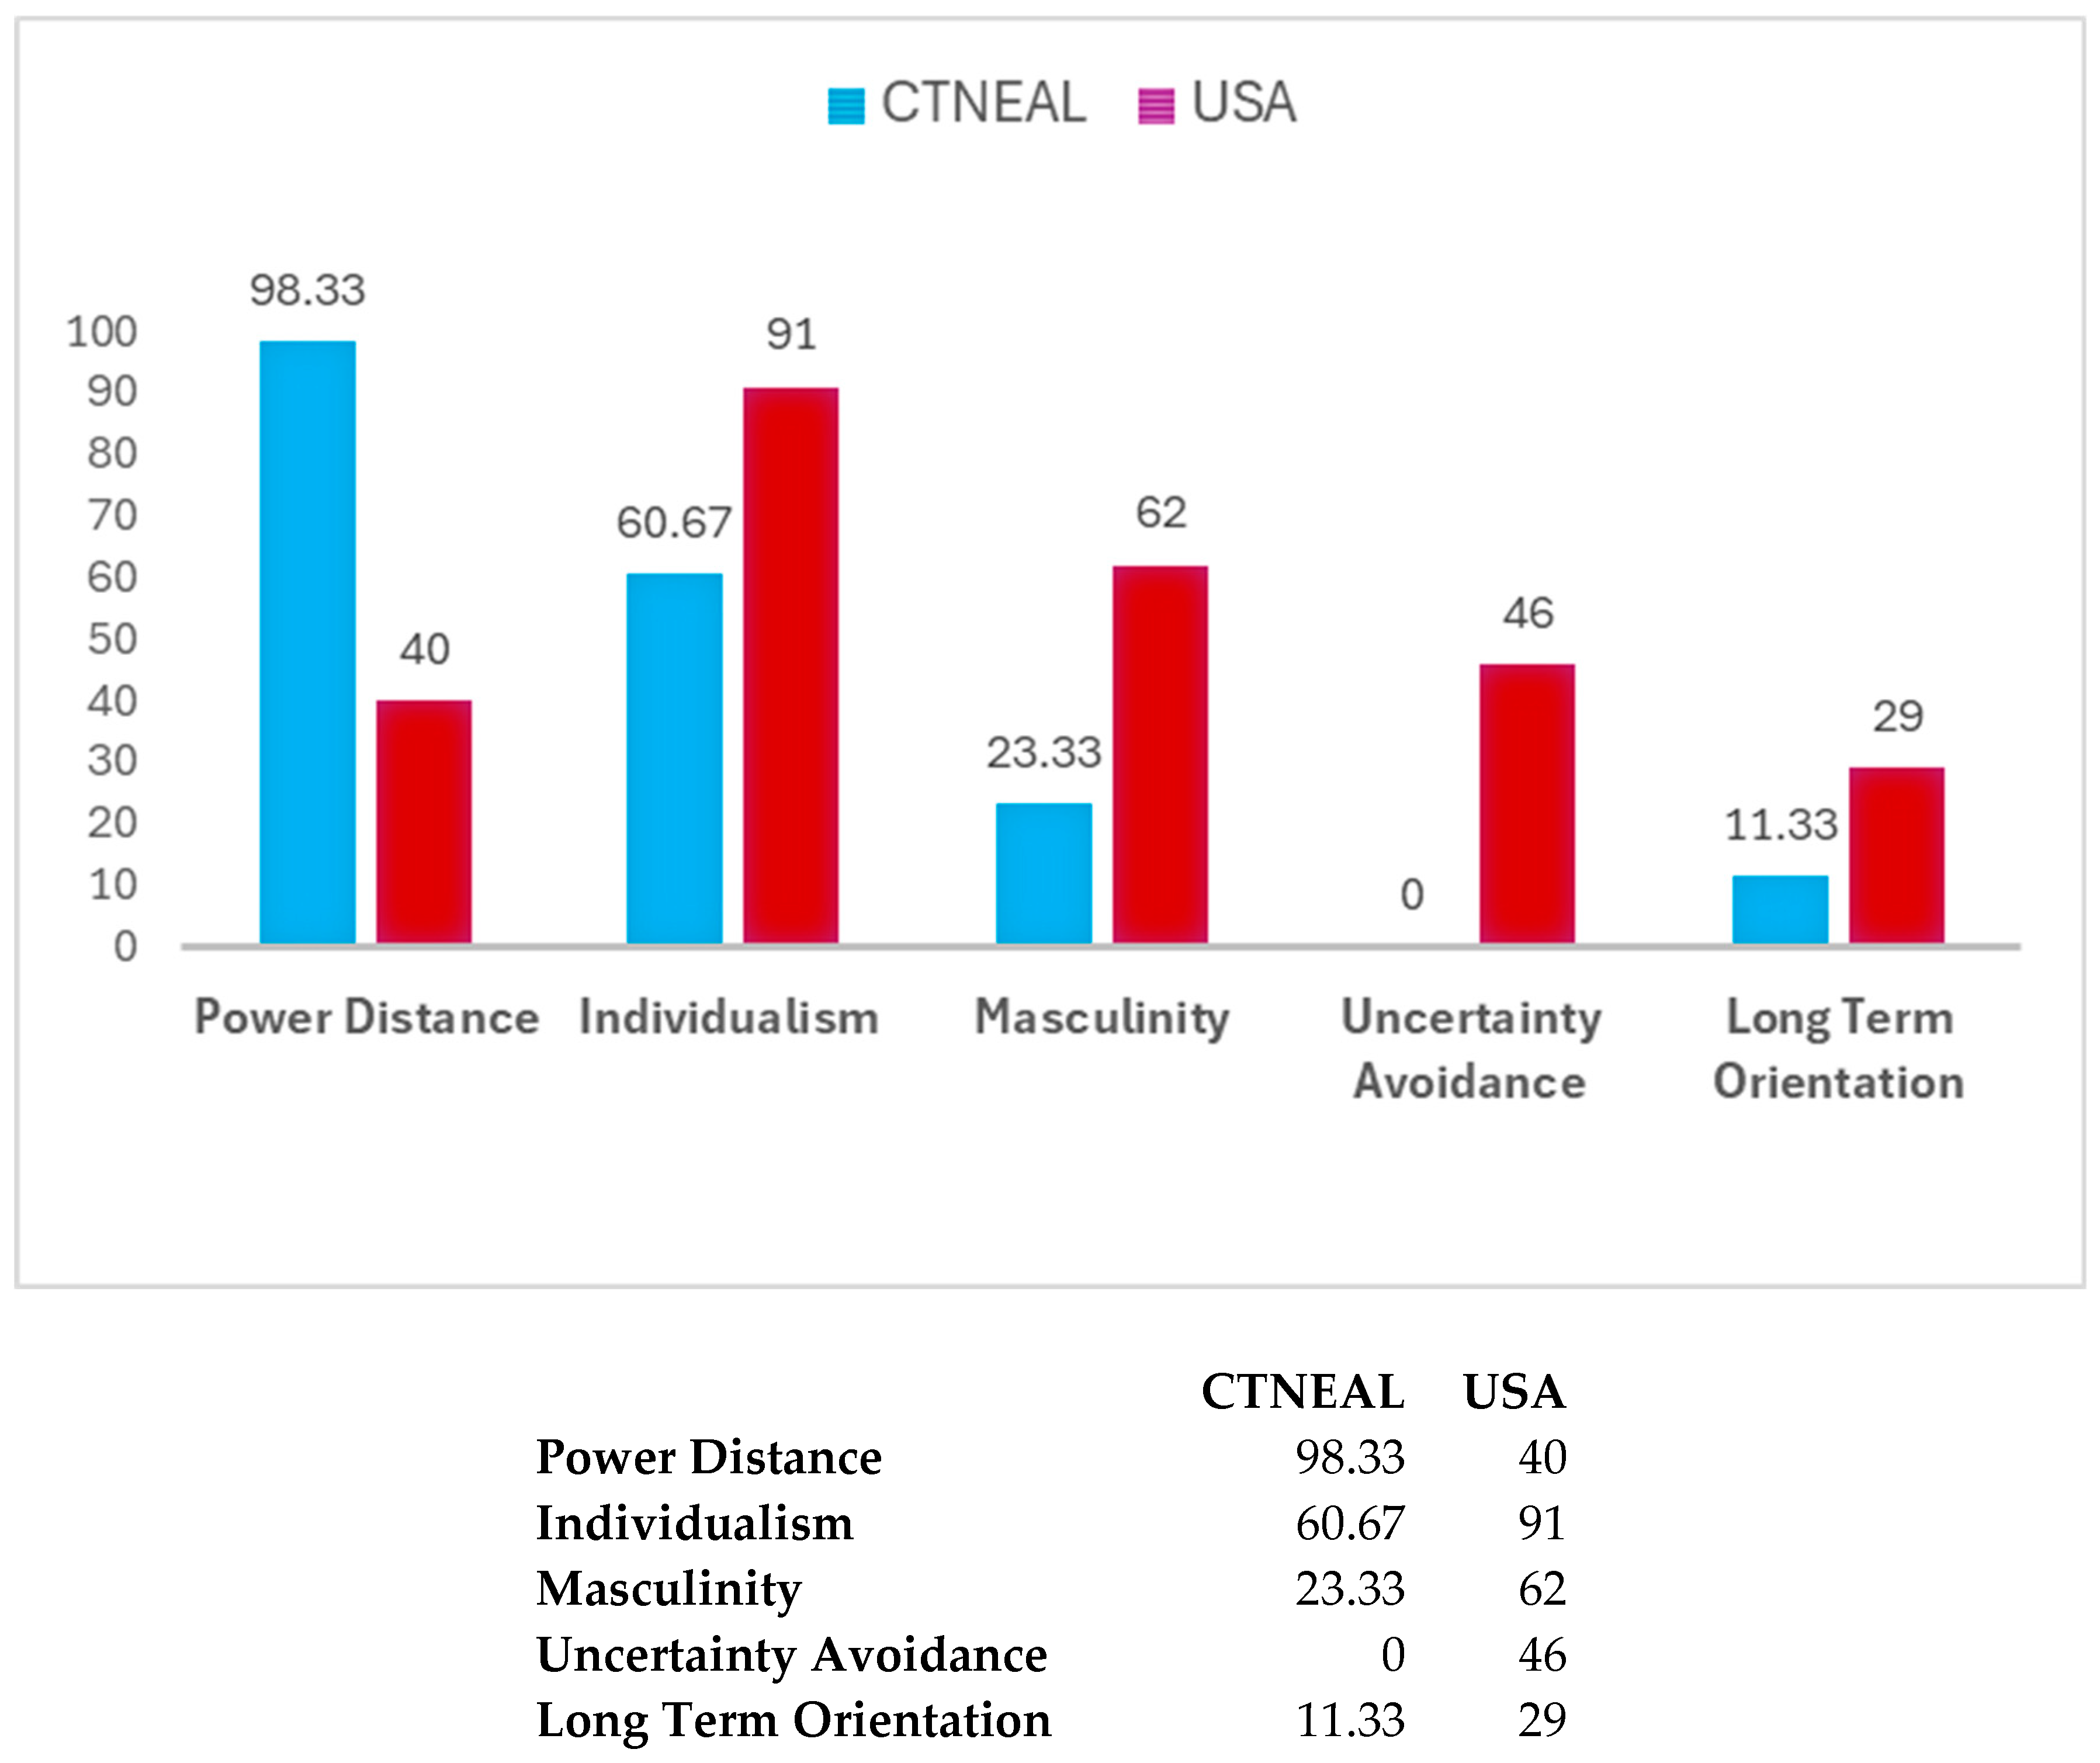

Table 1.
Hofstede’s Cultural Survey (By Country) (adapted from Clearly Cultural, 2015).
| Country | Power Distance | Individuality | Masculinity | Uncertainty Avoidance | Long Term Orientation |
| Africa East | 64 | 27 | 41 | 52 | 32 |
| Africa West | 77 | 20 | 46 | 54 | 9 |
| Arab countries | 80 | 38 | 53 | 68 | 23 |
| Argentina | 49 | 46 | 56 | 86 | 20 |
| Australia | 38 | 90 | 61 | 51 | 21 |
| Austria | 11 | 55 | 79 | 70 | 60 |
| Bangladesh | 80 | 20 | 55 | 60 | 47 |
| Belgium | 65 | 75 | 54 | 94 | 82 |
| Brazil | 69 | 38 | 49 | 76 | 44 |
| Bulgaria | 70 | 30 | 40 | 85 | 69 |
| Canada | 39 | 80 | 52 | 48 | 36 |
| Canada French | 54 | 73 | 45 | 60 | #NULL! |
| Chile | 63 | 23 | 28 | 86 | 31 |
| China | 80 | 20 | 66 | 30 | 87 |
| Colombia | 67 | 13 | 64 | 80 | 13 |
| Costa Rica | 35 | 15 | 21 | 86 | #NULL! |
| Croatia | 73 | 33 | 40 | 80 | 58 |
| Czech Rep | 57 | 58 | 57 | 74 | 70 |
| Denmark | 18 | 74 | 16 | 23 | 35 |
| Ecuador | 78 | 8 | 63 | 67 | #NULL! |
| El Salvador | 66 | 19 | 40 | 94 | 20 |
| Estonia | 40 | 60 | 30 | 60 | 82 |
| Finland | 33 | 63 | 26 | 59 | 38 |
| France | 68 | 71 | 43 | 86 | 63 |
| Germany | 35 | 67 | 66 | 65 | 83 |
| Great Britain | 35 | 89 | 66 | 35 | 51 |
| Greece | 60 | 35 | 57 | 112 | 45 |
| Guatemala | 95 | 6 | 37 | 101 | #NULL! |
| Hong Kong | 68 | 25 | 57 | 29 | 61 |
| Hungary | 46 | 80 | 88 | 82 | 58 |
| India | 77 | 48 | 56 | 40 | 51 |
| Indonesia | 78 | 14 | 46 | 48 | 62 |
| Iran | 58 | 41 | 43 | 59 | 14 |
| Ireland | 28 | 70 | 68 | 35 | 24 |
| Israel | 13 | 54 | 47 | 81 | 38 |
| Italy | 50 | 76 | 70 | 75 | 61 |
| Jamaica | 45 | 39 | 68 | 13 | #NULL! |
| Japan | 54 | 46 | 95 | 92 | 88 |
| Korea South | 60 | 18 | 39 | 85 | 100 |
| Latvia | 44 | 70 | 9 | 63 | 69 |
| Lithuania | 42 | 60 | 19 | 65 | 82 |
| Luxembourg | 40 | 60 | 50 | 70 | 64 |
| Malaysia | 104 | 26 | 50 | 36 | 41 |
| Malta | 56 | 59 | 47 | 96 | 47 |
| Mexico | 81 | 30 | 69 | 82 | 24 |
| Morocco | 70 | 46 | 53 | 68 | 14 |
| Netherlands | 38 | 80 | 14 | 53 | 67 |
| New Zealand | 22 | 79 | 58 | 49 | 33 |
| Norway | 31 | 69 | 8 | 50 | 35 |
| Pakistan | 55 | 14 | 50 | 70 | 50 |
| Panama | 95 | 11 | 44 | 86 | #NULL! |
| Peru | 64 | 16 | 42 | 87 | 25 |
| Philippines | 94 | 32 | 64 | 44 | 27 |
| Poland | 68 | 60 | 64 | 93 | 38 |
| Portugal | 63 | 27 | 31 | 104 | 28 |
| Romania | 90 | 30 | 42 | 90 | 52 |
| Russia | 93 | 39 | 36 | 95 | 81 |
| Serbia | 86 | 25 | 43 | 92 | 52 |
| Singapore | 74 | 20 | 48 | 8 | 72 |
| Slovak Rep | 104 | 52 | 110 | 51 | 77 |
| Slovenia | 71 | 27 | 19 | 88 | 49 |
| South Africa white | 49 | 65 | 63 | 49 | #NULL! |
| Spain | 57 | 51 | 42 | 86 | 48 |
| Suriname | 85 | 47 | 37 | 92 | #NULL! |
| Sweden | 31 | 71 | 5 | 29 | 53 |
| Switzerland | 34 | 68 | 70 | 58 | 74 |
| Switzerland French | 70 | 64 | 58 | 70 | #NULL! |
| Switzerland German | 26 | 69 | 72 | 56 | #NULL! |
| Taiwan | 58 | 17 | 45 | 69 | 93 |
| Thailand | 64 | 20 | 34 | 64 | 32 |
| Trinidad and Tobago | 47 | 16 | 58 | 55 | 13 |
| Turkey | 66 | 37 | 45 | 85 | 46 |
| United States | 40 | 91 | 62 | 46 | 26 |
| Uruguay | 61 | 36 | 38 | 100 | 26 |
| Venezuela | 81 | 12 | 73 | 76 | 16 |
| Vietnam | 70 | 20 | 40 | 30 | 57 |
Disclaimer/Publisher’s Note: The statements, opinions and data contained in all publications are solely those of the individual author(s) and contributor(s) and not of MDPI and/or the editor(s). MDPI and/or the editor(s) disclaim responsibility for any injury to people or property resulting from any ideas, methods, instructions or products referred to in the content. |
© 2025 by the authors. Licensee MDPI, Basel, Switzerland. This article is an open access article distributed under the terms and conditions of the Creative Commons Attribution (CC BY) license (http://creativecommons.org/licenses/by/4.0/).
Copyright: This open access article is published under a Creative Commons CC BY 4.0 license, which permit the free download, distribution, and reuse, provided that the author and preprint are cited in any reuse.


