Submitted:
02 October 2025
Posted:
04 October 2025
You are already at the latest version
Abstract
While data scarcity is often cited as a major challenge in machine learning, the opposite problem—having too much data or an unlimited stream of incoming data—is equally relevant. In such cases, a key question arises: which examples are the most useful for training a model while avoiding excessive computational cost? This work addresses the problem by proposing a strategy to automatically select useful examples while preserving model effectiveness and training efficiency. We propose and evaluate a new strategy—Adding Only Errors (AOE)—to avoid using the full training set for classifier training. Our results show that when the training-validation split is properly sampled, the size of the training set can be reduced by more than three orders of magnitude without compromising performance. Although this reduction may initially incur higher computational costs, in real-world scenarios involving continuous streams of labeled data requiring frequent model retraining, AOE amortizes this cost by significantly decreasing dataset size.
Keywords:
data subset selection
; NSL-KDD dataset
; cybersecurity
; machine learning
; small data
; Network Intrusion Detection Systems
1. Introduction
In production networks, traffic behavior generally shows limited variability over time [1]. This relative stability is mainly due to the structured and predictable nature of the services that operate in such environments [2,3]. Widely adopted communication protocols, such as TCP/IP, HTTP, and DNS, evolve slowly, which contributes to consistent and recognizable patterns in network flows [4].
User interactions with the network are mainly determined by enterprise applications, operating systems, and platforms [5]. Although these systems receive periodic updates, they typically maintain backward compatibility and core functionality. As a result, these updates introduce incremental changes rather than disruptive modifications, allowing traffic patterns to remain relatively stable for long periods [6,7].
Technological migration within production networks—such as infrastructure replacement, adoption of new protocols, or deploying entirely different architectures—occurs infrequently and requires careful planning [8,9]. The high costs, operational risks, and the need for stability in these environments encourage promoting and predictable changes rather than abrupt shifts [10,11].
This stability in normal network traffic is analogous to the signal captured by a fixed security camera focused on a hallway or entrance with minimal activity. In such conditions, the image remains nearly identical over time, apart from minor variations in lighting or background elements [12]. Similarly, in operational networks, normal traffic exhibits consistent patterns influenced by stable protocols, predictable usage routines, and incremental software changes [13,14].
This structural persistence creates an opportunity for efficient model updating in intrusion detection systems (IDS). In this way, the proposed Adding Only Errors (AOE) strategy capitalizes on this stability by focusing exclusively on misclassified samples—analogous to “movements” in a static image. These misclassifications provide informative deviations from baseline behavior, providing significant value for model learning. By retraining exclusively on these errors, AOE drastically reduces the amount of training data while maintaining, or even improving, detection performance. This reduction directly translates into faster retraining cycles and lower computational costs, making AOE an attractive approach to maintaining IDS performance in stable production environments. The strategy design considers that a high percentage of network events detected are positives and only a small percentage of classification errors need to be updated.
The remainder of this paper is organized as follows. Section 2 reviews relevant work in instance selection and its application to intrusion detection systems. Section 3 describes the proposed Adding Only Errors (AOE) strategy in detail, including its design rationale and implementation. Section 4 presents the datasets, data splits, classifiers, and evaluation protocols used in our experiments. We also report and discuss the experimental results by highlighting the comparative performance of AOE against baseline strategies. Finally, Section 5 summarizes the main findings, provides practical recommendations for applying AOE in real-world scenarios, and outlines directions for future research.
2. Related Work
In this section, we review related work on Network Intrusion Detection Systems (NIDS), as well as research focused on selecting training examples efficiently. We then highlight how our proposed approach, AOE, differs from these existing methods.
2.1. Datasets for Network Intrusion Detection
Network intrusion detection research has long relied on public datasets, such as KDDCUP99 [15,16] and its cleaned derivative NSL-KDD [16,17,18]. As the shortcomings of these datasets became evident (e.g. redundancy and outdated attack profiles), newer corpora were introduced to better reflect modern traffic and threats, including UNSW-NB15 [19,20], CIC-IDS2017 [21], UGR’16 [22], CTU-13 [23], and Bot-IoT [24]. Technically, the field spans classical Machine Learning (ML) algorithms such as Decision Trees, Random Forests, Boosted Trees, to deep architectures like Autoencoders and Recurrent Models. Notable examples include online autoencoder ensembles [25] and Long Short-Term Memory (LSTM)-based IDS variants [26,27]. Reviews in this area consistently highlight important factors that affect performance, including class imbalance, distribution shifts between training and validation datasets, and issues related to data quality [28,29].
Compared to prior IDS work, our Adding Only Errors (AOE) strategy addresses two persistent pain points simultaneously: (i) it operates under both matched and mismatched train–validation distributions (as found across NSL-KDD splits and in real deployments), and (ii) it reduces training set size by orders of magnitude without degrading (and sometimes improving) macro-—particularly with tabular SOTA baselines like Random Forest, CatBoost, XGBoost, and TabPFN [30,31,32,33]. Unlike much of the IDS literature that assumes full-data training and focuses on new model families, AOE is orthogonal: it is a data-efficiency procedure that can wrap standard classifiers while remaining effective under distribution shift.
2.2. Selecting Training Examples Efficiently
On the other hand, a significant amount of research focuses on training models with fewer or higher-quality examples. Classical instance selection dates back to condensed and edited nearest neighbors [34,35,36]. For imbalance, Synthetic Minority Over-Sampling Technique (SMOTE) and its variants are pervasive [37]. More recently, data subset selection and coresets provide principled reductions with guarantees or strong heuristics via submodularity, gradient matching, or bilevel objectives [38,39,40,41]. In parallel, active learning aims to query the most informative unlabeled points [42], while dataset distillation/condensation synthesizes tiny sets that approximate full-data training [43,44,45,46,47]. Surveys continue to chart this rapidly evolving area [48].
AOE differs from these lines in two ways. First, it is error-driven on the validation stream: examples are added only when currently misclassified, creating a compact, automatically curated set that points out the blind spots of the model under the operative distribution. Second, AOE preserves real instances (no synthesis), avoiding fidelity concerns from distillation/condensation while requiring no expensive bilevel optimization or submodular surrogates [39,40]. Empirically, AOE achieves comparable or superior macro- to full-data training at a fraction of the size and competes strongly with naive random subsampling across standard tabular classifiers [30,31,32,33].
3. Methods and Materials
In this section, we formally define the problem along with its conditions. We then present the proposed solution and provide a detailed description of the dataset used to evaluate its effectiveness in the experiments section.
3.1. Problem Statement
In many supervised machine learning applications, training models on large or unlimited labeled datasets can be computationally expensive and resource-intensive. However, not all examples are equally informative to achieve satisfactory model performance. For this reason, there is a need to develop methods that reduce the size of the training set by automatically selecting representative examples, without significantly compromising performance or increasing computational cost. What follows is a mathematical formalization of this problem.
Let be a labeled dataset, where and . Consider a dataset where N is finite that comes from a static dataset, or taking a relatively large batch from a data stream. The objective is to find a selection strategy , such that:
- , i.e., the size of the selected subset is significantly smaller;
- The performance of a model f trained on , denoted , satisfies:where is a task-specific performance metric (e.g., accuracy, F1-score);
- The total computational cost remains within acceptable bounds, i.e.,to ensure that the method does not significantly increase training time.
The goal is to design a selection strategy that reduces the dataset size without significantly compromising predictive performance and computational efficiency. We hypothesize that data streams in network security tasks contain redundant instances, which can be automatically removed without requiring human intervention.
3.2. Proposal: Add Only Errors Selection Strategy
The Algorithm 1 presents a data selection strategy designed to iteratively construct a compact and informative training set by including only those examples that the classifier misclassifies during training. This method, referred to as Add Only Errors (AOE), aims to reduce dataset redundancy while preserving performance.
We assume that we know the classes in advance, and they are fixed throughout the model’s life. Then, the process begins by shuffling the original training data and extracting one representative sample per unique class to initialize the training subset . A classifier clf is then trained on this minimal set. The above can be easily adapted in the case of a data stream.
The core of the algorithm is an iterative loop that runs for a fixed number of epochs . In each epoch, the entire training set is shuffled and processed in batches of size . For each batch:
- The classifier predicts labels for the current batch of samples.
- Misclassified instances are identified by comparing the predicted labels with the ground truth labels .
- Only the misclassified samples are added to the current training set .
- The classifier is then retrained on the updated dataset.
This incremental retraining ensures that the model continuously focuses on hard-to-classify examples, which are assumed to be the most informative and valuable for training. Samples of events that share characteristics or behaviors with other classes for the NIDS case. By discarding correctly classified (and potentially redundant) samples, AOE promotes a more compact dataset without requiring manual supervision.
At the end of training, the algorithm returns the reduced training dataset and the final trained classifier.
| Algorithm 1 AOE: Selection strategy based on adding only errors |
|
Require: Training data , labels , batch size , number of epochs , classifier clf Ensure: Updated training data x, y, and trained classifier clf
|
RSS – Random Selection Strategy
The Algorithm 2 defines a baseline strategy referred to as Random Selection Strategy (RSS). Unlike AOE, which incrementally builds the training set based on model errors, RSS selects a fixed-size subset of the original training data uniformly at random.
Given a labeled training dataset , the algorithm 2 randomly selects s unique indices without replacement in order to create a reduced training subset . This sampling process ensures that all examples have an equal probability of being chosen, regardless of their informativeness or difficulty.
The classifier clf is then trained once on the selected subset. Since no iterative refinement is involved, RSS is straightforward to implement and computationally efficient, making it a valuable baseline for evaluating the effectiveness of more sophisticated selection strategies, such as AOE.
At the end of the process, the algorithm returns the selected data and the trained classifier.
| Algorithm 2 RSS: Selection based on random selection strategy |
|
Require: Training data , labels , selection size , classifier clf Ensure: Selected training data x, y, and trained classifier clf
|
In contrast to AOE, which automatically expands the training set based on prediction errors across multiple epochs, RSS uses a one-time random sampling approach. Consequently, RSS does not adjust to the learning process of the classifier, and it can be used as a control mechanism to evaluate whether error-driven selection strategies result in more informative training subsets.
3.3. Datasets
This section is divided into three subsections to present a clear overview of the dataset used to evaluate our proposal. First, we describe the origin and structure of the original KDDCUP99 dataset, along with its limitations. Next, we show the improvements included in the NSL-KDD revision, which categorizes the attack types and their distribution across training and validation subsets. Lastly, we detail the preprocessing steps applied to the dataset to ensure its suitability for machine learning models.
3.3.1. KDDCUP99 Dataset
The original KDDCUP99 dataset was developed in 1998 by MIT Lincoln Laboratory and consists of a wide range of simulated cyberattacks against a U.S. Air Force Local Area Network (LAN). The dataset contains nine weeks of TCP dump data. The training subset corresponds to seven weeks of data and corresponds to approximately 5 million connection records, while the validation subset contains two weeks of traffic, comprising approximately 2 million records. Each connection represents a flow of packets (approximately 100 TCP bytes) between a source IP and destination IP, defined by a start and end time, protocol, and other connection metadata. These are labeled as either normal or as a specific attack type [15,16].
3.3.2. NSL-KDD Dataset
The NSL-KDD dataset is a revised and improved version of the original KDDCUP99 dataset [16,17,18]. It has been widely used in research focused on Network Intrusion Detection Systems (NIDS). However, much of the literature emphasizes classification models [49,50,51,52], feature selection [53,54,55,56], and preprocessing algorithms for dimensionality reduction [57,58,59], among others—leaving the quality and structure of the dataset itself as a secondary concern. The NSL-KDD addresses several issues in the original KDDCUP99 dataset:
- No redundant records in the training subset.
- No redundant records in the validation subset.
- Selection of representative records for each class to improve evaluation accuracy.
- A reasonable dataset size that enables full-set experimentation without random sampling.
The dataset includes 41 features per instance and a label. These features are divided into:
- Basic features: Attributes extracted directly from the TCP/IP connection.
-
Traffic features: Attributes extracted over a time window and divided into:
- -
- Same host: Connections in the last 2 seconds to the same host, capturing protocol behavior, service use, and connection frequency.
- -
- Same service: Connections in the last 2 seconds with the same service as the current one.
- Content features: Attributes within the payload, such as failed login attempts or command execution attempts—indicators of potential account or system compromise.
-
Labels: grouped into five general categories (see Table 1):
- -
- Normal: Benign network activity.
- -
- Denial of Service (DoS): Attacks that flood network services with requests, making them unavailable.
- -
- Probe: Attacks that scan for information about the network (e.g., port scans or vulnerability probes).
- -
- Remote to Local (R2L): Attacks where an external entity attempts to gain local access on a networked machine.
- -
- User to Root (U2R): Attacks that escalate privileges from a local user account to administrative (root) access.
Class Imbalance.
The NSL-KDD dataset remains highly imbalanced (see Table 2). The majority of samples belong to the Normal, DoS, and Probe classes, which together represent more than 90% of the dataset. Meanwhile, R2L and U2R attacks account for less than 10%. Moreover, the complete validation subset includes 14 additional attack types not seen during training and originates from a different probability distribution find to emulate a real-world setting.
Feature Representation.
Although each instance has 41 raw features, three of them—protocol_type, service, and flag—are categorical, with 3, 70, and 11 unique values, respectively. These are encoded using one-hot encoding, which increases the dimensionality to 122 features per instance. This representation has been widely adopted in previous works [60,61,62].
3.3.3. Dataset Preprocessing
To ensure better model performance, preprocessing of the NSL-KDD dataset includes the following:
- One-hot encoding: Categorical features such as protocol_type, service, and flag are transformed into binary vectors. For example, protocol_type with values tcp, udp, and icmp becomes [1,0,0], [0,1,0], and [0,0,1], respectively.
- Normalization: Numerical features are normalized using Min-Max scaling to ensure all values fall within the same range, avoiding dominance of features with larger scales during model training.
4. Experimental Results and Discussion
This section presents a detailed evaluation of the proposed Adding Only Errors (AOE) strategy, comparing its performance against the Random Selection Strategy (RSS) and the conventional approach of training with the full dataset. The experiments are designed to assess the effectiveness of these strategies under different data split conditions, classifier architectures, and parameter configurations.
We first describe the dataset splits used and justify their relevance to real-world machine learning scenarios. Then, we report the results of two main experiments: one restricted to a single epoch to avoid duplicate selections, and another allowing multiple epochs to examine long-term behavior. For each experiment, we analyze the impact of batch size, training time, dataset size reduction, and the absolute and relative performance in -macro score across classifiers. Finally, we discuss key patterns and implications derived from these results.
4.1. Datasets Splits
We perform an experimental evaluation of the selection strategies on two different splits of the same dataset, NSL-KDD. These two types of splits represent common situations in real-world applications. During model development, it is typical to generate the validation set by sampling from a static version of training data, which ensures matching distributions. However, once deployed, models often encounter new, labeled data whose distribution may differ significantly from the original training set. Therefore, evaluating the selection strategies in both settings provides a more robust understanding of their capabilities.
The Original splits, provided by the authors of the NSL-KDD dataset, represent a scenario where the validation set is not a representative sample of the training set distribution. In addition, we construct our own Resampled splits to ensure representativeness. Specifically, we merge the original training and validation sets, shuffle the combined data, and then divide it again into new training and validation subsets. This ensures that the validation set is a representative sample of the same distribution as the training set. Figure 1 illustrates the distribution of samples per class for both the Original and the Resampled splits of the NSL-KDD dataset. Table 3 presents a quantitative comparison in terms of class-wise validation-to-training ratios and feature distribution statistics.
It is evident that the Original splits exhibit significantly unbalanced ratios across classes (e.g., 2.8995 for class 3 versus 0.1442 for class 0), suggesting that the validation set is not proportionally representative of the training set. In contrast, the Resampled splits yield much more uniform class ratios, around 0.17. This uniformity ensures that the validation set maintains a similar class distribution to the training set.
Additionally, the mean and standard deviation of the feature vectors in the training and validation subsets are more closely aligned in the Resampled splits ( vs. ), compared to the Original splits, where there is a more noticeable discrepancy ( vs. ).
These two observations support the claim that the Resampled splits yield a validation set with a probability distribution that more closely matches that of the training set. In contrast, the Original splits present a validation set with a distribution that significantly deviates from the corresponding training data.
4.2. Experiment 1: Only One Epoch
4.2.1. Experimental Setup
To evaluate the effectiveness of the proposed AOE strategy, we conducted experiments varying several key factors. The training strategies considered were: the proposed Adding Only Errors (AOE) strategy, the Random Selection Strategy (RSS), and the full-training dataset strategy. Furthermore, to ensure a fair comparison, the size of the random subset selected for RSS was matched to the final subset size produced by AOE in each run.
As we have said, we evaluated each strategy on two different data splits: the original NSL-KDD split and a resampled version designed to match the training and validation distributions. The classifiers used in the experiments included six common machine learning models: Decision Tree [63], Support Vector Machine (SVM) [64], Random Forest [65], XGBoost [66], CatBoost [67], and TabPFN [68]. All models were trained using their default hyperparameters, with no hyperparameter optimization.
For the AOE strategy, we tested multiple values for the batch size , and fixed the number of epochs . This is to avoid including duplicated examples in the reduced dataset in this first set of experiments. Each experiment was repeated using 100 different random seeds to ensure statistical robustness. For the TabPFN classifier, which has specific computational requirements, only batch sizes were used, and all experiments involving TabPFN were executed using a GPU.
4.2.2. Performance Comparison Across Selection Strategies and Models
Since the most common strategy is to train with all available examples in the training set, we present the -macro results obtained by AOE and RSS in comparison with the -macro achieved when training with the full dataset, as follows: . This implies that if is positive, the sampling strategy performed better than training with all examples, whereas if it is negative, it performed worse. Figure 2 presents these performance differences across various classifiers when using different example selection strategies in the original and resampled splits of the NSL-KDD dataset. The abscissa of each plot corresponds to the size of the reduced dataset resulting from applying the RSS and AOE strategies. The black dashed vertical line indicates the total number of training examples in the full dataset, while the black dashed horizontal line marks the -macro score obtained by training with the full dataset (serving as a performance reference).
As we could expect, we observe that as the number of training examples increases in the reduced dataset , both RSS strategies (green and red lines) gradually approach the performance of the full dataset. This trend is more pronounced in the resampled split (red) across all the classifiers. Comparing the AOE (blue and orange lines) and RSS strategies, AOE consistently outperforms or matches RSS across most classifiers, regardless of whether the original or resampled split is used. The only exception is the decision tree classifier, where RSS performs slightly better in the original split. Notably, our AOE method can achieve higher -scores than training with all examples when using the Random Forest and TabPFN classifiers, while reducing the training set size by several orders of magnitude. These results suggest that AOE is generally a more effective strategy for training with reduced datasets, offering strong generalization performance even with significantly fewer examples.
4.2.3. Impact of Batch Size on the Number of Selected Examples
Figure 3 shows how the number of selected training examples in the resulting dataset from the AOE strategy varies as a function of the batch size. Each curve corresponds to a different classifier, evaluated on both the original (left) and resampled (right) splits of the NSL-KDD dataset.
The parameter batch size plays a key role in controlling the final number of selected examples. Interestingly, the final reduced dataset size is generally smaller than the batch size itself across most classifiers, indicating that AOE often finds few misclassifications in each batch. There are two saturation regions at low values and high values of batch size. As we approach small batch size values, for example, 100 examples, the resulting reductions become smaller. In other words, setting a batch size of 10 will not necessarily yield a final set of 10 examples; instead, it will likely contain a few hundred examples. At high values, saturation appears because we are using all the examples in the training set.
Regardless of the split type, classifiers such as Random Forest, TabPFN, and CatBoost consistently result in smaller reduced datasets, indicating that they are more efficient in terms of instance selection with AOE. In contrast, classifiers like SVM and Decision Trees retain larger subsets, suggesting a more conservative filtering behavior.
Overall, this analysis highlights the effect of batch size on reduction dynamics and shows that model architecture plays a significant role in determining how many training examples are retained during AOE.
4.2.4. Training Time Comparison Between AOE and RSS
Figure 4 shows the total training time ratios for AOE and RSS strategies across six classifiers and varying batch sizes. The training time is normalized with respect to the time taken to train a model using the full dataset. The horizontal dashed line at 1 represents this baseline; values above 1 indicate longer training times, while values below 1 represent faster training compared to the full-data training strategy.
As expected, the RSS consistently results in fractional training times across all batch sizes and classifiers. This is because RSS uses only a single subset of the training data and requires only one training iteration. In contrast, AOE generally incurs higher training times—particularly at smaller batch sizes—due to its iterative nature and repeated retraining of the model as new informative samples are added.
This effect is especially pronounced in classifiers such as Random Forest, XGBoost, CatBoost, and TabPFN, where the training time increases steeply as batch size decreases. However, we observe that for a batch size more than , AOE achieves training times that are comparable to full training (time ratio close to 1), making it a practical choice when balancing efficiency and performance.
Importantly, Random Forest stands out as a favorable option: it provides competitive performance with significantly reduced training set sizes while incurring only moderate increases in training time under AOE. In some configurations, it even achieves better performance than training with the full dataset.
4.2.5. Absolute Performance of AOE Across Splits and Classifiers
Figure 5 shows the absolute -macro scores obtained by each classifier using the AOE strategy, plotted against the mean size of the reduced training dataset. The blue and green dotted horizontal lines represent the -macro scores achieved by training each classifier on the full training dataset for the resampled and original splits, respectively.
The results reveal a clear difference between the two types of splits. When the validation set is well sampled—i.e., in the resampled split—performance remains remarkably high even when the training dataset is reduced by more than three orders of magnitude. In several cases, classifiers achieve performance close to that of the full dataset while using only a few hundred or thousand training examples.
In contrast, under the original split (where the validation set is not a representative sample of the training distribution), most classifiers experience a noticeable drop in performance, typically of at least 0.1 in -score. This illustrates the importance of using validation sets that reflect the training distribution. Fortunately, in practical settings, validation sets can always be resampled from the training distribution to ensure representativeness.
An additional observation in the resampled split is that increasing the number of selected samples through AOE can lead to slightly lower performance, due to increased sensitivity to random seed initialization. This effect emphasizes the benefit of selecting only the most informative examples rather than larger subsets.
4.3. Experiment 2: More Epochs
4.3.1. Experimental Setup
This second set of experiments focuses exclusively on evaluating the AOE strategy under more epochs than 1. The experiments were conducted across two different data splits: the original and the resampled versions of the NSL-KDD dataset. The classifiers included in this evaluation are Random Forest, XGBoost, and TabPFN because they showed better performance in the previous experiment.
All models were trained using default hyperparameters, without any hyperparameter optimization. For AOE, we fixed the batch size at 1000 and trained for 20 epochs. To ensure statistical robustness and account for variability due to random initialization, each experiment was repeated using 100 different random seeds. In the special case of TabPFN, the number of epochs was limited to 5, and all experiments involving this model were executed using a GPU.
4.3.2. Iteration Dynamics of Added Samples
Figure 6 illustrates the evolution of the number of added samples (first and third columns) and the corresponding -macro score (second and fourth columns) across iterations of the AOE method. The first two columns correspond to the original split, while the last two correspond to the resampled split. Each row represents a different classifier: Random Forest, XGBoost, and TabPFN. Approximately every 126 iterations correspond to one epoch. The blue line represents the mean across 100 random seeds, and the shaded blue region denotes the 5th to 95th percentile range.
In general, fewer than one epoch is required before the average number of added samples per iteration approaches zero. This indicates that the models quickly learn to avoid misclassifications, meaning that few new informative examples are identified after the initial iterations.
Two distinct behaviors emerge depending on the split type. For the Original splits, the maximum mean -score is reached at the very beginning of the iterations. This suggests that the most critical examples for correctly classifying the validation set are encountered and added early in training. However, adding more samples afterward can harm validation performance, as the validation set is not a representative subset of the training distribution. This effect is particularly evident for TabPFN, where additional samples lead to a noticeable performance decline. For the Resampled splits, the maximum mean -score is reached asymptotically as the iterations progress. This behavior is consistent with the fact that the validation set in this split is drawn to faithfully represent the training distribution, meaning that it takes more iterations to encounter and learn from the rarest but relevant examples.
4.3.3. Duplicate Samples in AOE-Generated Training Sets
Since AOE training may span more than one epoch, it is possible for duplicate examples to be added to the reduced training set. To assess this effect, we measured the proportion of duplicates in the final reduced dataset for each classifier, averaged over 100 independent runs with different random seeds.
As shown in Table 4, only XGBoost produced any duplicate samples, with an average proportion of just 0.005% of the dataset size. In contrast, both Random Forest and TabPFN generated no duplicates across all runs. This indicates that, in practice, AOE is highly effective at avoiding redundant sample inclusion, and even in the sole case where duplicates occur, their impact is negligible.
5. Conclusions
We have proposed and evaluated a new strategy to avoid using all the examples in the training set for training classifiers. The results obtained across all experiments confirm that the proposed Adding Only Errors (AOE) strategy is an effective approach for reducing the size of training datasets while maintaining, and in some cases improving, model performance. In scenarios where the validation set is representative of the training distribution (resampled split), AOE was able to reduce the dataset size by more than three orders of magnitude without a significant drop in -macro score. Even under the less favorable original split, where the validation set does not match the training distribution, AOE often performed comparably to or better than the Random Selection Strategy (RSS), particularly when using classifiers such as Random Forest and TabPFN. These findings highlight the importance of ensuring a representative validation split, as it directly impacts the ability of selection strategies to generalize.
From a practical standpoint, AOE offers a trade-off between dataset reduction and computational cost. While smaller batch sizes lead to more substantial reductions in dataset size, they also result in higher training times due to the iterative nature of the method. Nevertheless, selecting reasonable batch sizes (e.g., to ) can yield significant data reduction with training times close to those of the full dataset. The fact that AOE can outperform full-dataset training in some cases suggests that it may act as a form of implicit regularization, filtering out noisy or redundant examples. This property, combined with its flexibility, makes AOE a promising tool not only for intrusion detection tasks such as NSL-KDD, but also for broader machine learning applications where efficiency and generalization are critical.
From our experiments, we derive several practical recommendations for applying the AOE strategy effectively:
- One epoch may be sufficient for simpler tasks, but more epochs might be required for more complex problems.
- A batch size of 1000 often reduces the dataset by several orders of magnitude without significantly impacting performance or increasing computational cost.
- For quick training with AOE, use a Random Forest classifier, which provides good performance with minimal tuning.
- If computational cost and time are not a constraint, we recommend using a smaller batch size (e.g., 100), up to five epochs, and a high-performance model such as CatBoost or TabPFN.
We also plan to expand the study to include a wider set of benchmarks beyond the cybersecurity domain, covering more diverse and representative tasks. We aim to extend the AOE strategy to other machine learning problems, for example: self-supervised learning, where labels exist but are not manually generated (e.g., generative models or large language models), and unstructured data problems, such as computer vision tasks, including object detection, segmentation, and depth estimation. Additionally, we seek to advance this research by exploring automatic methods for selecting examples without requiring labels, relying solely on measuring distributional diversity to guide the selection process.
Author Contributions
Conceptualization, E.Z.; data curation, R.Q.-B., formal analysis, R.Q.-B., F.A. E.Z., E.A.-A. and J.A.B.-M.; funding acquisition, E.Z., E.A.-A., R.A.-B, M.S.-R. and J.A.B.-M.; investigation, R.Q.-B., F.A. E.Z., E.A.-A., R.A.-B, M.S.-R. and J.A.B.-M.; methodology, R.Q.-B., F.A. and E.Z.; software, R.Q.-B. and E.Z.; validation, R.Q.-B., F.A. E.Z., E.A.-A. and J.A.B.-M.; writing–original draft, R.Q.-B., F.A. E.Z., E.A.-A., R.A.-B, M.S.-R. and J.A.B.-M.; writing–review and editing, R.Q.-B., F.A. E.Z., E.A.-A., R.A.-B, M.S.-R. and J.A.B.-M. All authors read and agreed to the published version of the manuscript.
Funding
This work was supported by the Centro de Investigación en Computación - Instituto Politécnico Nacional (20220002, 20230232, 20240108, 20253734, 20240975, 20250200), and the Mexican National Council of Humanity, Science and Technology CONAHCyT under the doctoral grant 2020-2025. Agradecemos el apoyo a la Secretaria de Investigación y Posgrado y al Instituto Politécnico Nacional.
Institutional Review Board Statement
Not applicable.
Data Availability Statement
We use public data.
Conflicts of Interest
The authors declare no conflicts of interest.
Abbreviations
The following abbreviations are used in this manuscript:
| IDS | Intrusion Detection System |
| AOE | Adding Only Errors |
| RSS | Random Subset Selection |
| NSL-KDD | NSL-Knowledge Discovery and Data Mining Cup Dataset |
| KDD | Knowledge Discovery and Data Mining Cup Dataset |
| NIDS | Network Intrusion Detection System |
| DoS | Denial of Service |
| U2R | User to Root attack |
| R2L | Remote to Local attack |
| Probe | Probing attack |
| TabPFN | Tabular Prior-data Fitted Networks |
References
- Ferrari, P.; Bellagente, P.; Flammini, A.; Gaffurini, M.; Rinaldi, S.; Sisinni, E.; Brandao, D. Anomaly Detection in Industrial Networks using Distributed Observation of Statistical Behavior. In Proceedings of the 2024 IEEE International Workshop on Metrology for Industry 4.0 & IoT (MetroInd4.0 & IoT), 2024, pp. 180–185. [CrossRef]
- Achour, M.; Mana, M. Seasonal Adjustment for traffic modeling and analysis in IEEE 802.15.4 networks. In Proceedings of the 2022 7th International Conference on Image and Signal Processing and their Applications (ISPA), 2022, pp. 1–6. [CrossRef]
- Achour, M.; Mana, M.; Achour, S. Exploiting traffic seasonality for anomaly detection in IEEE 802.15.4 networks. In Proceedings of the 2022 19th International Multi-Conference on Systems, Signals & Devices (SSD), 2022, pp. 1351–1356. [CrossRef]
- Lieto, A.; Liao, Q.; Bauer, C. A generative approach for production-aware industrial network traffic modeling. In Proceedings of the 2022 IEEE Globecom Workshops (GC Wkshps). IEEE, 2022, pp. 575–580.
- Author(s). AI-Driven Network Traffic Optimization and Fault Detection in Enterprise WAN. International Journal of Scientific Research in Engineering and Management 2024, 08, 1–8.
- Zhang, Y.; Liu, W.; Kuok, K.; Cheong, N. Anteater: Advanced Persistent Threat Detection With Program Network Traffic Behavior. IEEE Access 2024, 12, 8536–8551. [CrossRef]
- Ying, Z.; Zhang, Y.; Xu, S.; Xu, G.; Liu, W. Anteater: Malware Injection Detection with Program Network Traffic Behavior. In Proceedings of the 2022 International Conference on Networking and Network Applications (NaNA), 2022, pp. 169–175. [CrossRef]
- Moazzeni, N.; Katsaros, D. Towards Next-Generation Intelligent Inter-Domain Routing: A Machine Learning-Based Approach. In Proceedings of the Proceedings of the International Conference on Advanced Networking, 2024.
- Chupaev, A.V.; Zaripova, R.S.; Galyamov, R.R.; Sharifullina, A.Y. The use of industrial wireless networks based on standard ISA100.11a and protocol WirelessHART in process control. In Proceedings of the E3S Web of Conferences. EDP Sciences, 2019, Vol. 124, p. 03013. [CrossRef]
- Das, T.; Caria, M.; Jukan, A.; Hoffmann, M. A Techno-economic Analysis of Network Migration to Software-Defined Networking. arXiv preprint arXiv:1310.0216 2013, [arXiv:cs.NI/1310.0216].
- Das, T.; Drogon, M.; Jukan, A.; Hoffmann, M. Study of Network Migration to New Technologies using Agent-based Modeling Techniques. arXiv preprint arXiv:1305.0219 2014, [arXiv:cs.NI/1305.0219].
- Saha, S.; Haque, A.; Sidebottom, G. Multi-Step Internet Traffic Forecasting Models with Variable Forecast Horizons for Proactive Network Management. Sensors 2024, 24, 1871. [CrossRef]
- Canel, C.; Madhavan, B.; Sundaresan, S.; Spring, N.; Kannan, P.; Zhang, Y.; Lin, K.; Seshan, S. Understanding Incast Bursts in Modern Datacenters. In Proceedings of the Proceedings of the 2024 ACM Internet Measurement Conference (IMC ’24), Madrid, Spain, 2024; pp. 674–680. [CrossRef]
- Liu, X.; Huang, C.; Ashraf, M.W.A.; Huang, S.; Chen, Y. Spatiotemporal Self-Attention-Based Network Traffic Prediction in IIoT. Wireless Communications and Mobile Computing 2023, 2023, 1–15. [CrossRef]
- UCI KDD Archive. KDD Cup 1999 Dataset. http://kdd.ics.uci.edu/databases/kddcup99/kddcup99.html, 2007. Accessed: 04-Aug-2025.
- Tavallaee, M.; Bagheri, E.; Lu, W.; Ghorbani, A.A. A detailed analysis of the KDD CUP 99 data set. In Proceedings of the 2009 IEEE Symposium on Computational Intelligence for Security and Defense Applications, 2009, pp. 1–6. [CrossRef]
- Liu, H.; Lang, B. Machine learning and deep learning methods for intrusion detection systems: A survey. applied sciences 2019, 9, 4396.
- Choudhary, S.; Kesswani, N. Analysis of KDD-Cup’99, NSL-KDD and UNSW-NB15 Datasets using Deep Learning in IoT. Procedia Computer Science 2020, 167, 1561–1573. International Conference on Computational Intelligence and Data Science. [CrossRef]
- Moustafa, N.; Slay, J. UNSW-NB15: a comprehensive data set for network intrusion detection systems. Military Communications and Information Systems Conference (MilCIS) 2015.
- Zoghi, Z.; Serpen, G. UNSW-NB15 computer security dataset: Analysis through visualization. Security and privacy 2024, 7, e331.
- Sharafaldin, I.; Lashkari, A.H.; Ghorbani, A.A. Toward generating a new intrusion detection dataset and intrusion traffic characterization. Proceedings of the International Conference on Information Systems Security and Privacy 2018.
- Maciá-Fernández, G.; García-Teodoro, P.; Moriano, G.; et al. UGR’16: A new dataset for the evaluation of cyclostationarity-based network IDSs. Computers & Security 2018, 73, 411–424.
- García, S.; Grill, M.; Stiborek, J.; Zunino, A. An empirical comparison of botnet detection methods. Computers & Security 2014, 45, 100–123.
- Koroniotis, N.; Moustafa, N.; Sitnikova, E.; Turnbull, B. Towards the development of realistic botnet dataset in the Internet of Things for network forensic analytics: Bot-IoT. Future Generation Computer Systems 2019, 100, 779–796.
- Mirsky, Y.; Doitshman, T.; Elovici, Y.; Shabtai, A. Kitsune: An ensemble of autoencoders for online network intrusion detection. In Proceedings of the NDSS, 2018. [CrossRef]
- Laghrissi, F.E.; et al. Intrusion detection systems using long short-term memory. Journal of Big Data 2021, 8, 1–24.
- Imrana, Y.; et al. χ2-BidLSTM: A feature-driven intrusion detection system using bidirectional LSTM. Sensors 2022, 22, 2189.
- Thakkar, A.; Lohiya, R. A review of the advancement in intrusion detection datasets. Procedia Computer Science 2020, 167, 636–645.
- Choudhary, S.; et al. Analysis of KDD-CUP’99, NSL-KDD and UNSW-NB15 datasets. Procedia Computer Science 2020, 167, 1561–1570.
- Breiman, L. Random forests. Machine Learning 2001, 45, 5–32.
- Chen, T.; Guestrin, C. XGBoost: A scalable tree boosting system. In Proceedings of the Proceedings of KDD, 2016, pp. 785–794.
- Prokhorenkova, L.; Gusev, G.; Vorobev, A.; Dorogush, A.V.; Gulin, A. CatBoost: Unbiased boosting with categorical features. In Proceedings of the NeurIPS, 2018.
- Hollmann, N.; Müller, S.; Eggensperger, K.; Hutter, F. TabPFN: A transformer that solves small tabular classification problems in a second. arXiv:2207.01848 2022.
- Hart, P. The condensed nearest neighbor rule. IEEE Transactions on Information Theory 1968, 14, 515–516.
- Wilson, D.L. Asymptotic properties of nearest neighbor rules using edited data. IEEE Transactions on Systems, Man, and Cybernetics 1972, SMC-2, 408–421.
- Tomek, I. Two modifications of CNN. In Proceedings of the IEEE Trans. Systems, Man, and Cybernetics, 1976.
- Chawla, N.V.; Bowyer, K.W.; Hall, L.O.; Kegelmeyer, W.P. SMOTE: Synthetic minority over-sampling technique. Journal of Artificial Intelligence Research 2002, 16, 321–357.
- Wei, K.; Iyer, R.; Bilmes, J. Submodularity in data subset selection and active learning. In Proceedings of the ICML, 2015, pp. 1954–1963.
- Mirzasoleiman, B.; Bilmes, J.; Leskovec, J. Coresets for data-efficient training of machine learning models. In Proceedings of the ICML, 2020, pp. 6950–6960.
- Killamsetty, K.; Sivasubramanian, D.; Ramakrishnan, G.; Iyer, R. GLISTER: Generalization based data subset selection for efficient and robust learning. In Proceedings of the AAAI, 2021, pp. 8110–8118.
- Killamsetty, K.; et al. Gradient matching based data subset selection for efficient learning. In Proceedings of the ICML, 2021, pp. 5464–5474.
- Settles, B. Active learning literature survey. Technical Report UW-CS-2009-1648, University of Wisconsin–Madison, 2009.
- Wang, T.; Zhu, J.Y.; Torralba, A.; Efros, A.A. Dataset distillation. In Proceedings of the NeurIPS, 2018.
- Zhao, B.; Mopuri, K.R.; Bilen, H. Dataset condensation with gradient matching. In Proceedings of the ICLR, 2020.
- Nguyen, T.; et al. Dataset meta-learning from kernel ridge regression. In Proceedings of the NeurIPS, 2021.
- Liu, S.; et al. Dataset distillation via factorization. In Proceedings of the ICLR, 2022.
- Lee, S.; et al. Dataset condensation with contrastive signals. In Proceedings of the ICML, 2022.
- Yu, R.; et al. Dataset distillation: A comprehensive review. arXiv:2301.07014 2023.
- Iftikhar, N.; Rehman, M.U.; Shah, M.A.; Alenazi, M.J.F.; Ali, J. Intrusion Detection in NSL-KDD Dataset Using Hybrid Self-Organizing Map Model. CMES - Computer Modeling in Engineering and Sciences 2025, 143, 639–671. [CrossRef]
- Ghajari, G.; Ghajari, E.; Mohammadi, H.; Amsaad, F. Intrusion Detection in IoT Networks Using Hyperdimensional Computing: A Case Study on the NSL-KDD Dataset. arXiv preprint arXiv:2503.03037 2025.
- Dhanabal, L.; Shantharajah, S. A study on NSL-KDD dataset for intrusion detection system based on classification algorithms. International journal of advanced research in computer and communication engineering 2015, 4, 446–452.
- Meena, G.; Choudhary, R.R. A review paper on IDS classification using KDD 99 and NSL KDD dataset in WEKA. In Proceedings of the 2017 International Conference on Computer, Communications and Electronics (Comptelix), 2017, pp. 553–558. [CrossRef]
- Rahim, R.; Ahanger, A.S.; Khan, S.M.; Masoodi, F. Analysis of IDS using Feature Selection Approach on NSL-KDD Dataset. In Proceedings of the SCRS Conference Proceedings on Intelligent Systems; Pal, R.; Shukla, P.K., Eds., India, 2022; pp. 475–481. [CrossRef]
- Zargari, S.; Voorhis, D. Feature Selection in the Corrected KDD-dataset. In Proceedings of the 2012 Third International Conference on Emerging Intelligent Data and Web Technologies, 2012, pp. 174–180. [CrossRef]
- Mohanty, S.; Agarwal, M. Recursive Feature Selection and Intrusion Classification in NSL-KDD Dataset Using Multiple Machine Learning Methods. In Proceedings of the Computing, Communication and Learning; Panda, S.K.; Rout, R.R.; Bisi, M.; Sadam, R.C.; Li, K.C.; Piuri, V., Eds., Cham, 2024; pp. 3–14.
- Safa, B.; Hamou, R.M.; Toumouh, A. Optimizing the performance of the IDS through feature-relevant selection using PSO and random forest techniques. Comput. Sist. 2024, 28. [CrossRef]
- Patel, N.D.; Mehtre, B.M.; Wankar, R. A computationally efficient dimensionality reduction and attack classification approach for network intrusion detection. International Journal of Information Security 2024, 23, 2457–2487. [CrossRef]
- Thakkar, A.; Kikani, N.; Geddam, R. Fusion of linear and non-linear dimensionality reduction techniques for feature reduction in LSTM-based Intrusion Detection System. Applied Soft Computing 2024, 154, 111378. [CrossRef]
- Nabi, F.; Zhou, X. Enhancing intrusion detection systems through dimensionality reduction: A comparative study of machine learning techniques for cyber security. Cyber Security and Applications 2024, 2, 100033. [CrossRef]
- Xu, W.; Jang-Jaccard, J.; Singh, A.; Wei, Y.; Sabrina, F. Improving Performance of Autoencoder-Based Network Anomaly Detection on NSL-KDD Dataset. IEEE Access 2021, 9, 140136–140146. [CrossRef]
- Jin, L.; Fan, R.; Han, X.; Cui, X. IGSA-SAC: a novel approach for intrusion detection using improved gravitational search algorithm and soft actor-critic. Frontiers in Computer Science 2025. Original Research. [CrossRef]
- B, S.; M, S.; K, M.; B, L. Ensemble of feature augmented convolutional neural network and deep autoencoder for efficient detection of network attacks. Scientific Reports 2025, 15, 4267. [CrossRef]
- Quinlan, J.R. Induction of decision trees. Machine Learning 1986, 1, 81–106. [CrossRef]
- Cortes, C.; Vapnik, V. Support-vector networks. Machine Learning 1995, 20, 273–297. [CrossRef]
- Breiman, L. Random Forests. Machine Learning 2001, 45, 5–32. [CrossRef]
- Chen, T.; Guestrin, C. Xgboost: A scalable tree boosting system. In Proceedings of the Proceedings of the 22nd acm sigkdd international conference on knowledge discovery and data mining, 2016, pp. 785–794.
- Prokhorenkova, L.; Gusev, G.; Vorobev, A.; Dorogush, A.V.; Gulin, A. CatBoost: unbiased boosting with categorical features. Advances in neural information processing systems 2018, 31.
- Hollmann, N.; Müller, S.; Eggensperger, K.; Hutter, F. Tabpfn: A transformer that solves small tabular classification problems in a second. arXiv preprint arXiv:2207.01848 2022.
Figure 1.
Class distribution for the Original (left) and Resampled (right) splits of the NSL-KDD dataset. The Original splits exhibit unequal train-validation proportions. In contrast, the Resampled splits were constructed to ensure that the validation set is a representative sample of the training distribution.
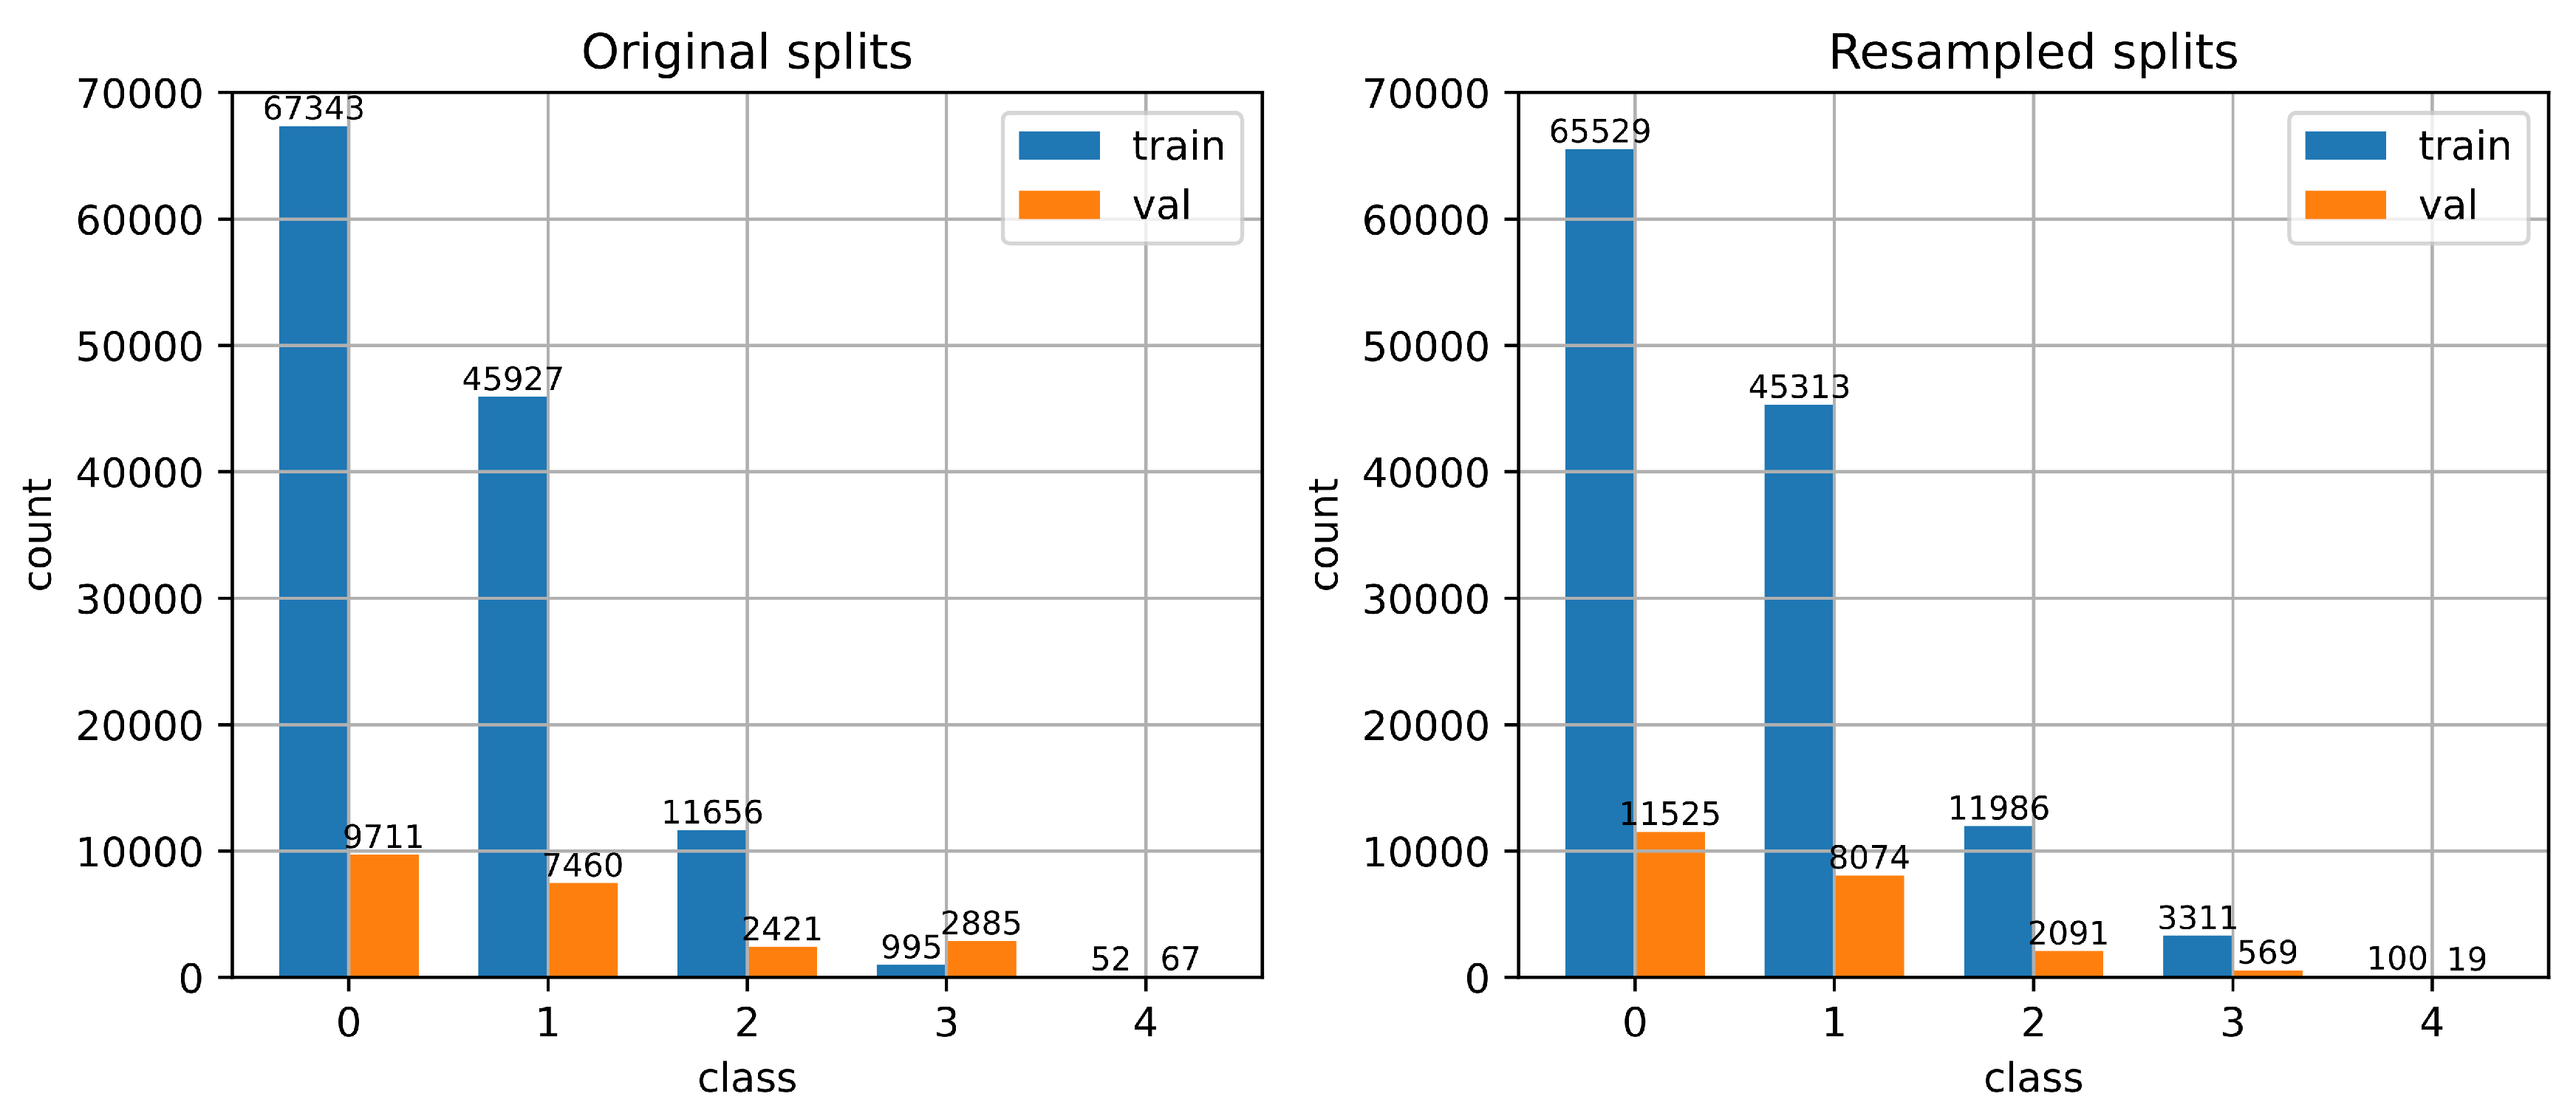
Figure 2.
Performance comparison across classifiers using two selection strategies (AOE and RSS) on both original and resampled splits of the NSL-KDD dataset. The y-axis shows the difference in macro score relative to the baseline obtained when training on the full dataset, marked by the horizontal black dashed line at 0. The x-axis indicates the number of training samples (log scale), with the vertical black dashed line showing the total number of samples in the full training set. As the number of samples increases, the performance of RSS (green and red lines) approaches the full-data baseline, particularly in the resampled split (red). AOE (blue and orange lines) consistently outperforms or matches RSS in most classifiers and across both splits, with the exception of the decision tree model.
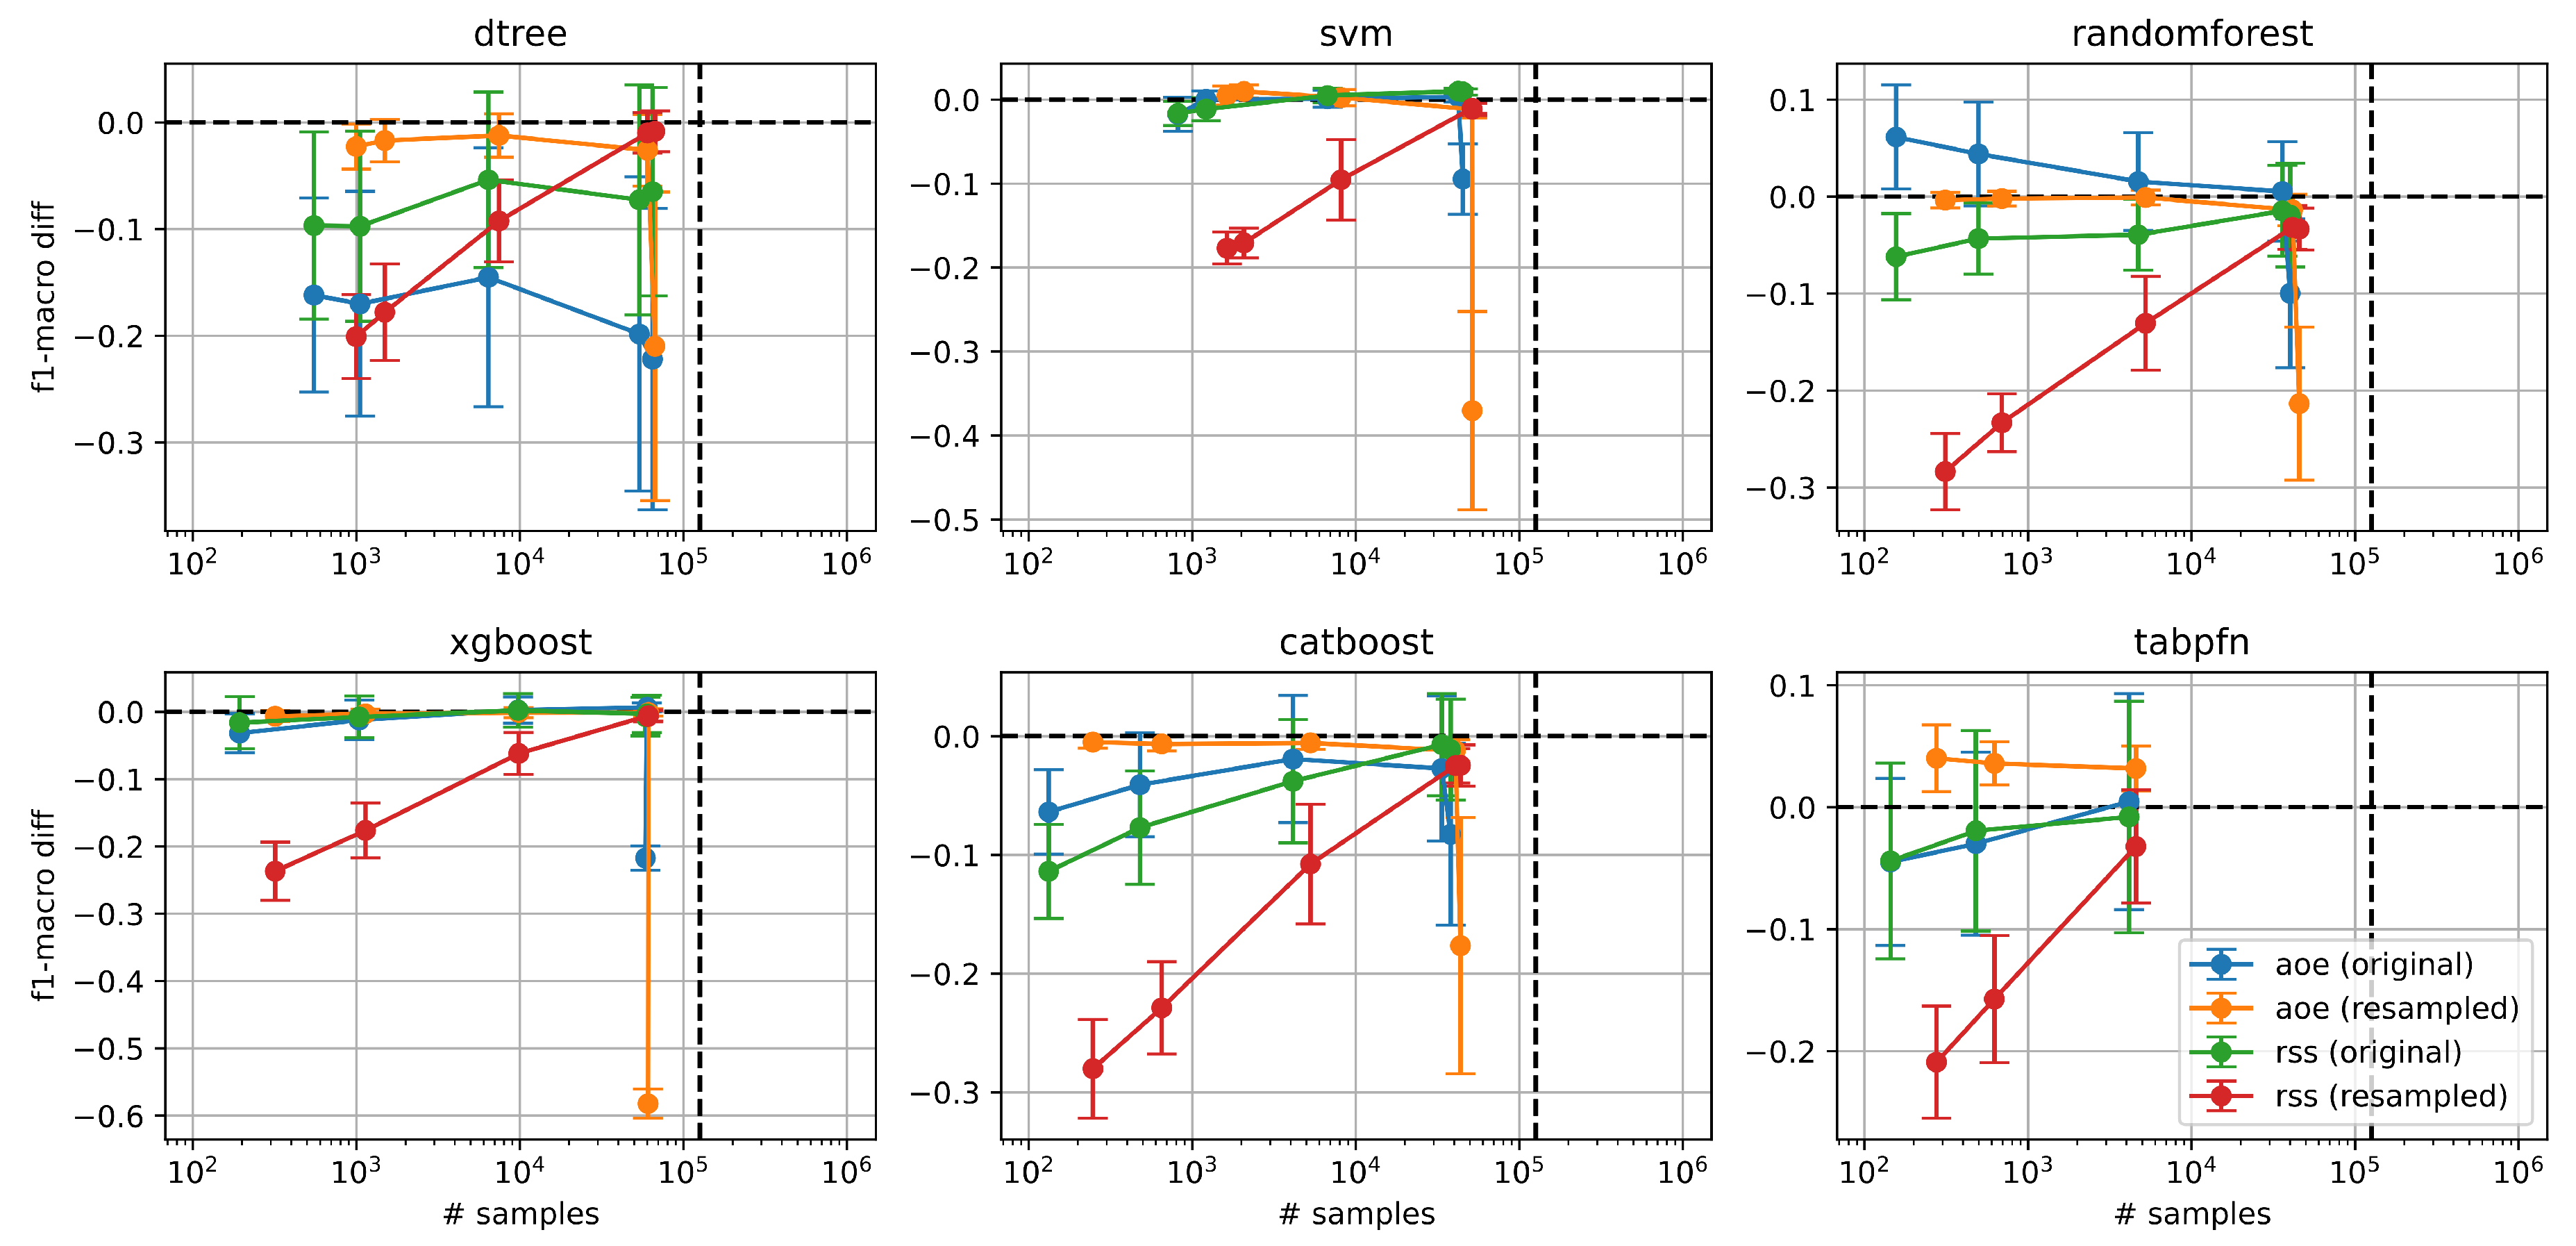
Figure 3.
Number of examples selected by the AOE strategy as a function of the batch size, across different classifiers and for both the original (left) and resampled (right) data splits. In general, the final number of selected examples is smaller than the batch size, indicating early convergence of the AOE process. Random Forest, TabPFN, and CatBoost tend to generate smaller reduced datasets, while SVM and Decision Tree models yield larger ones.
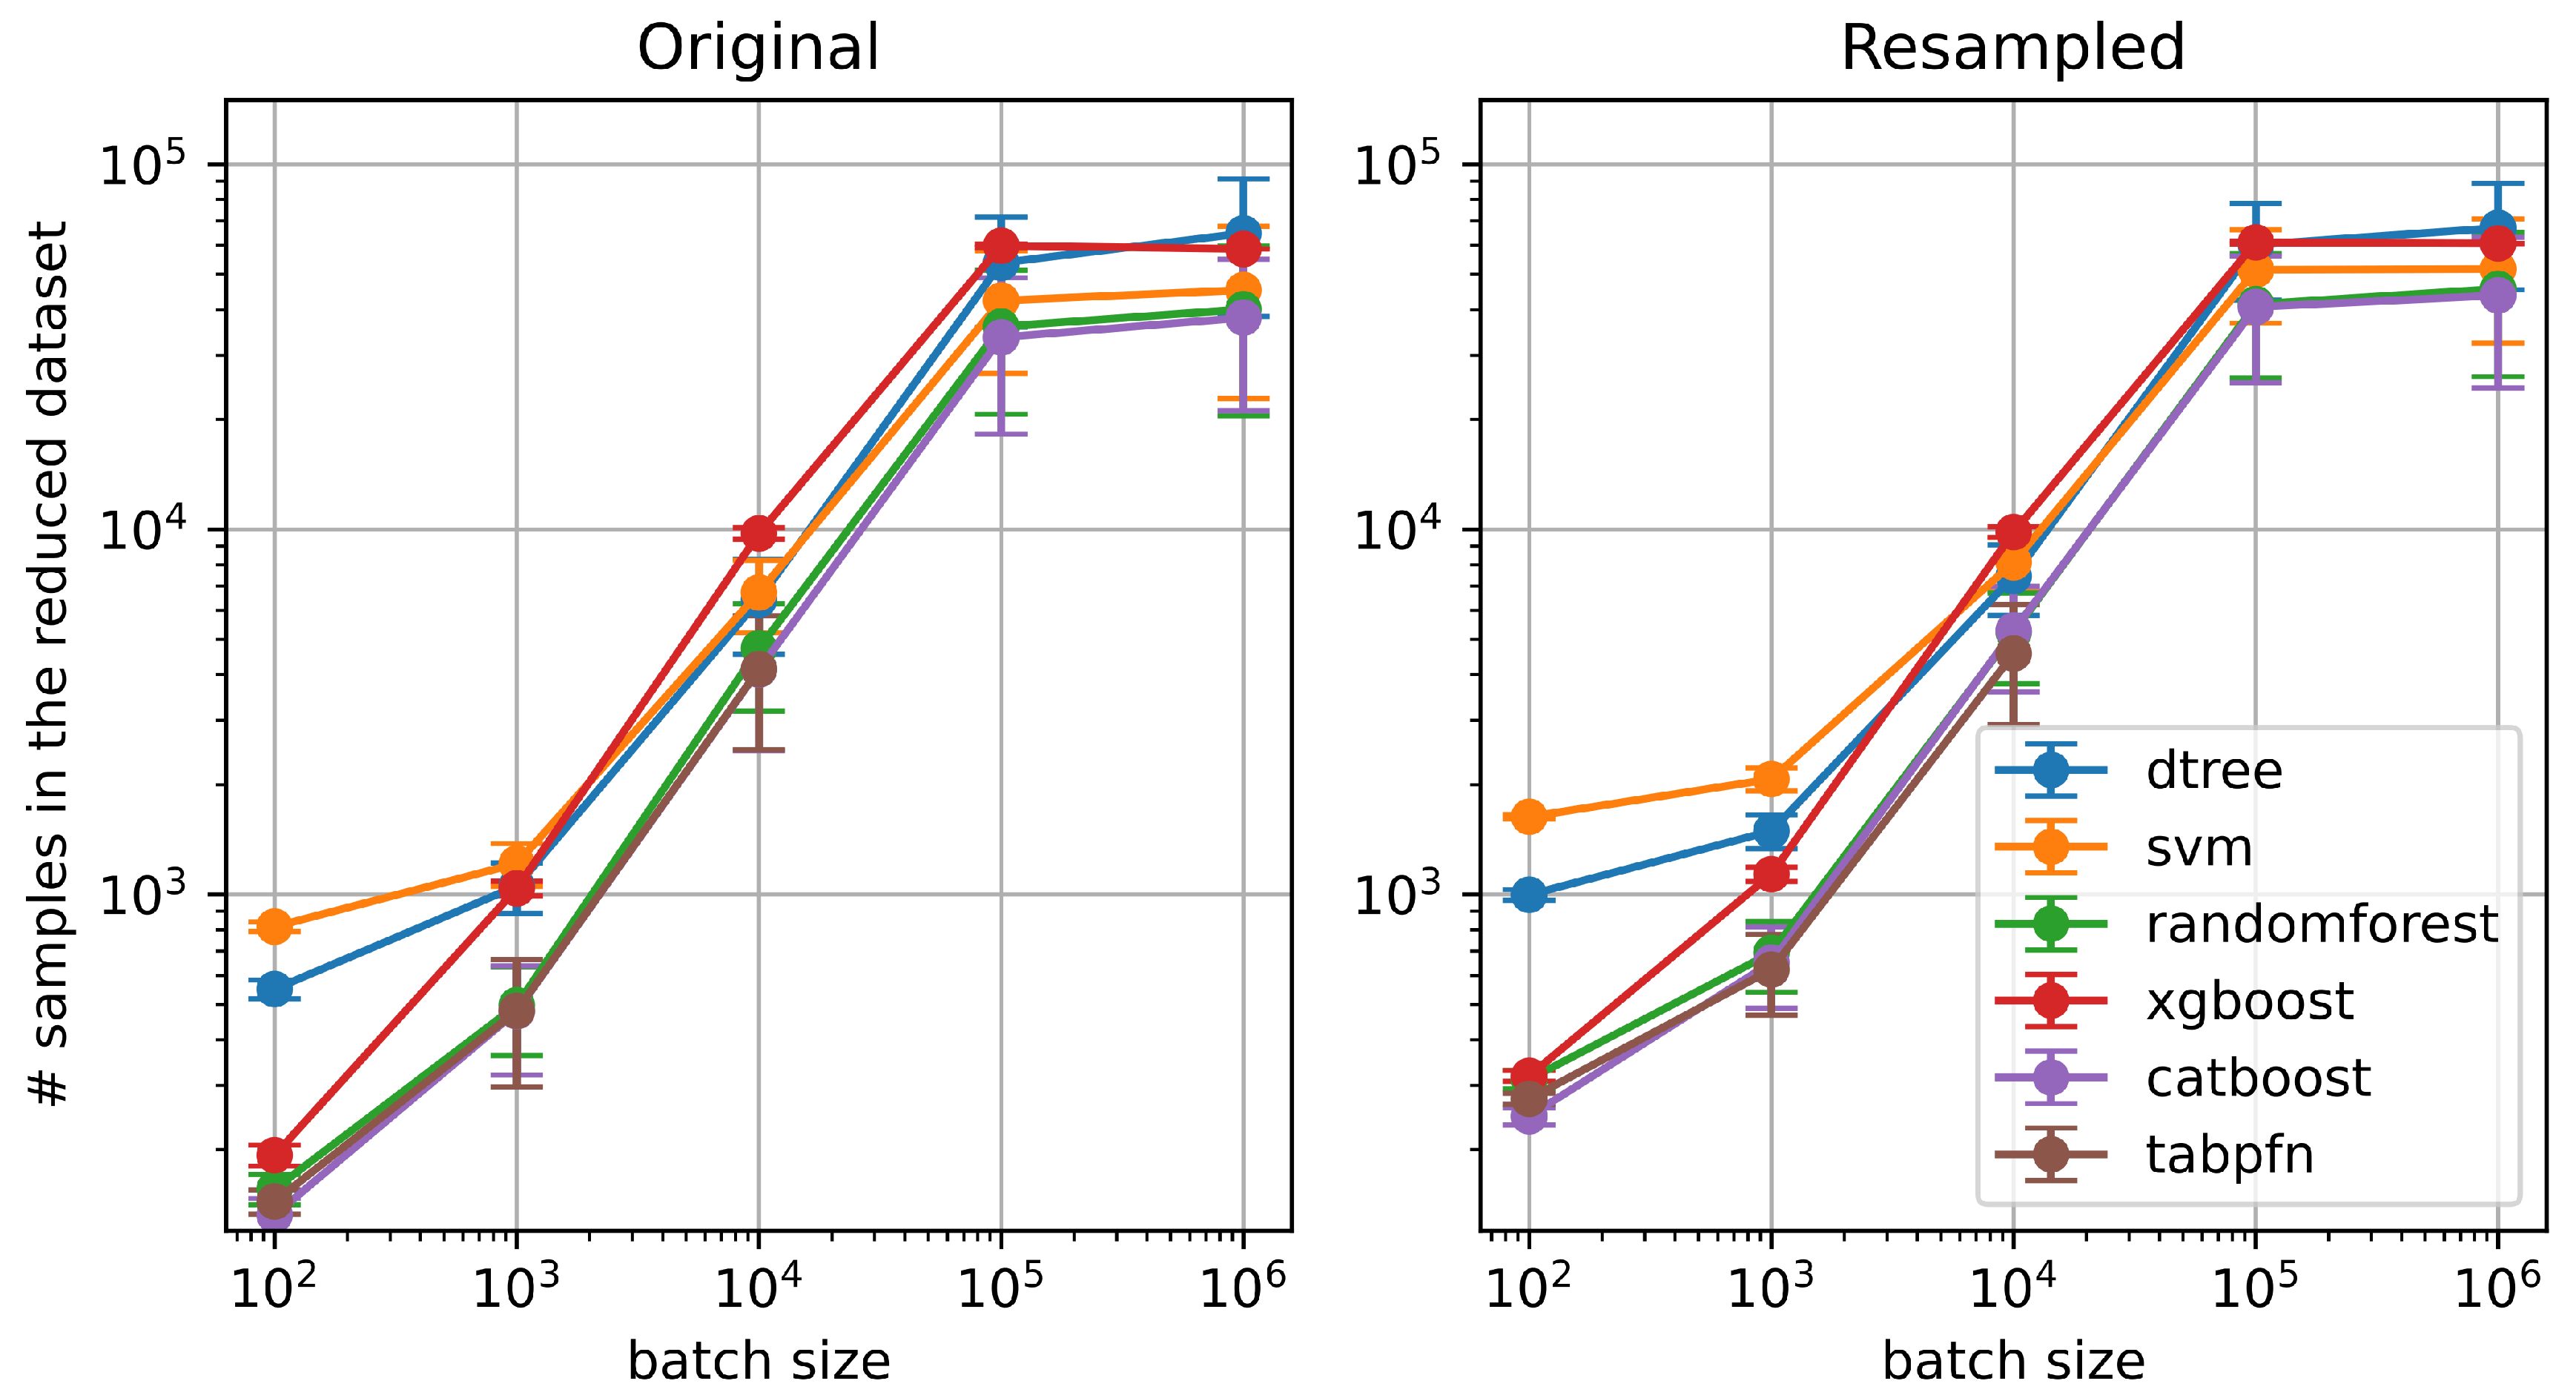
Figure 4.
Training time ratio for different classifiers using AOE and RSS selection strategies across various batch sizes. The training time is normalized relative to the time required to train each model on the full dataset, indicated by the horizontal black dashed line at ratio 1.
Figure 4.
Training time ratio for different classifiers using AOE and RSS selection strategies across various batch sizes. The training time is normalized relative to the time required to train each model on the full dataset, indicated by the horizontal black dashed line at ratio 1.
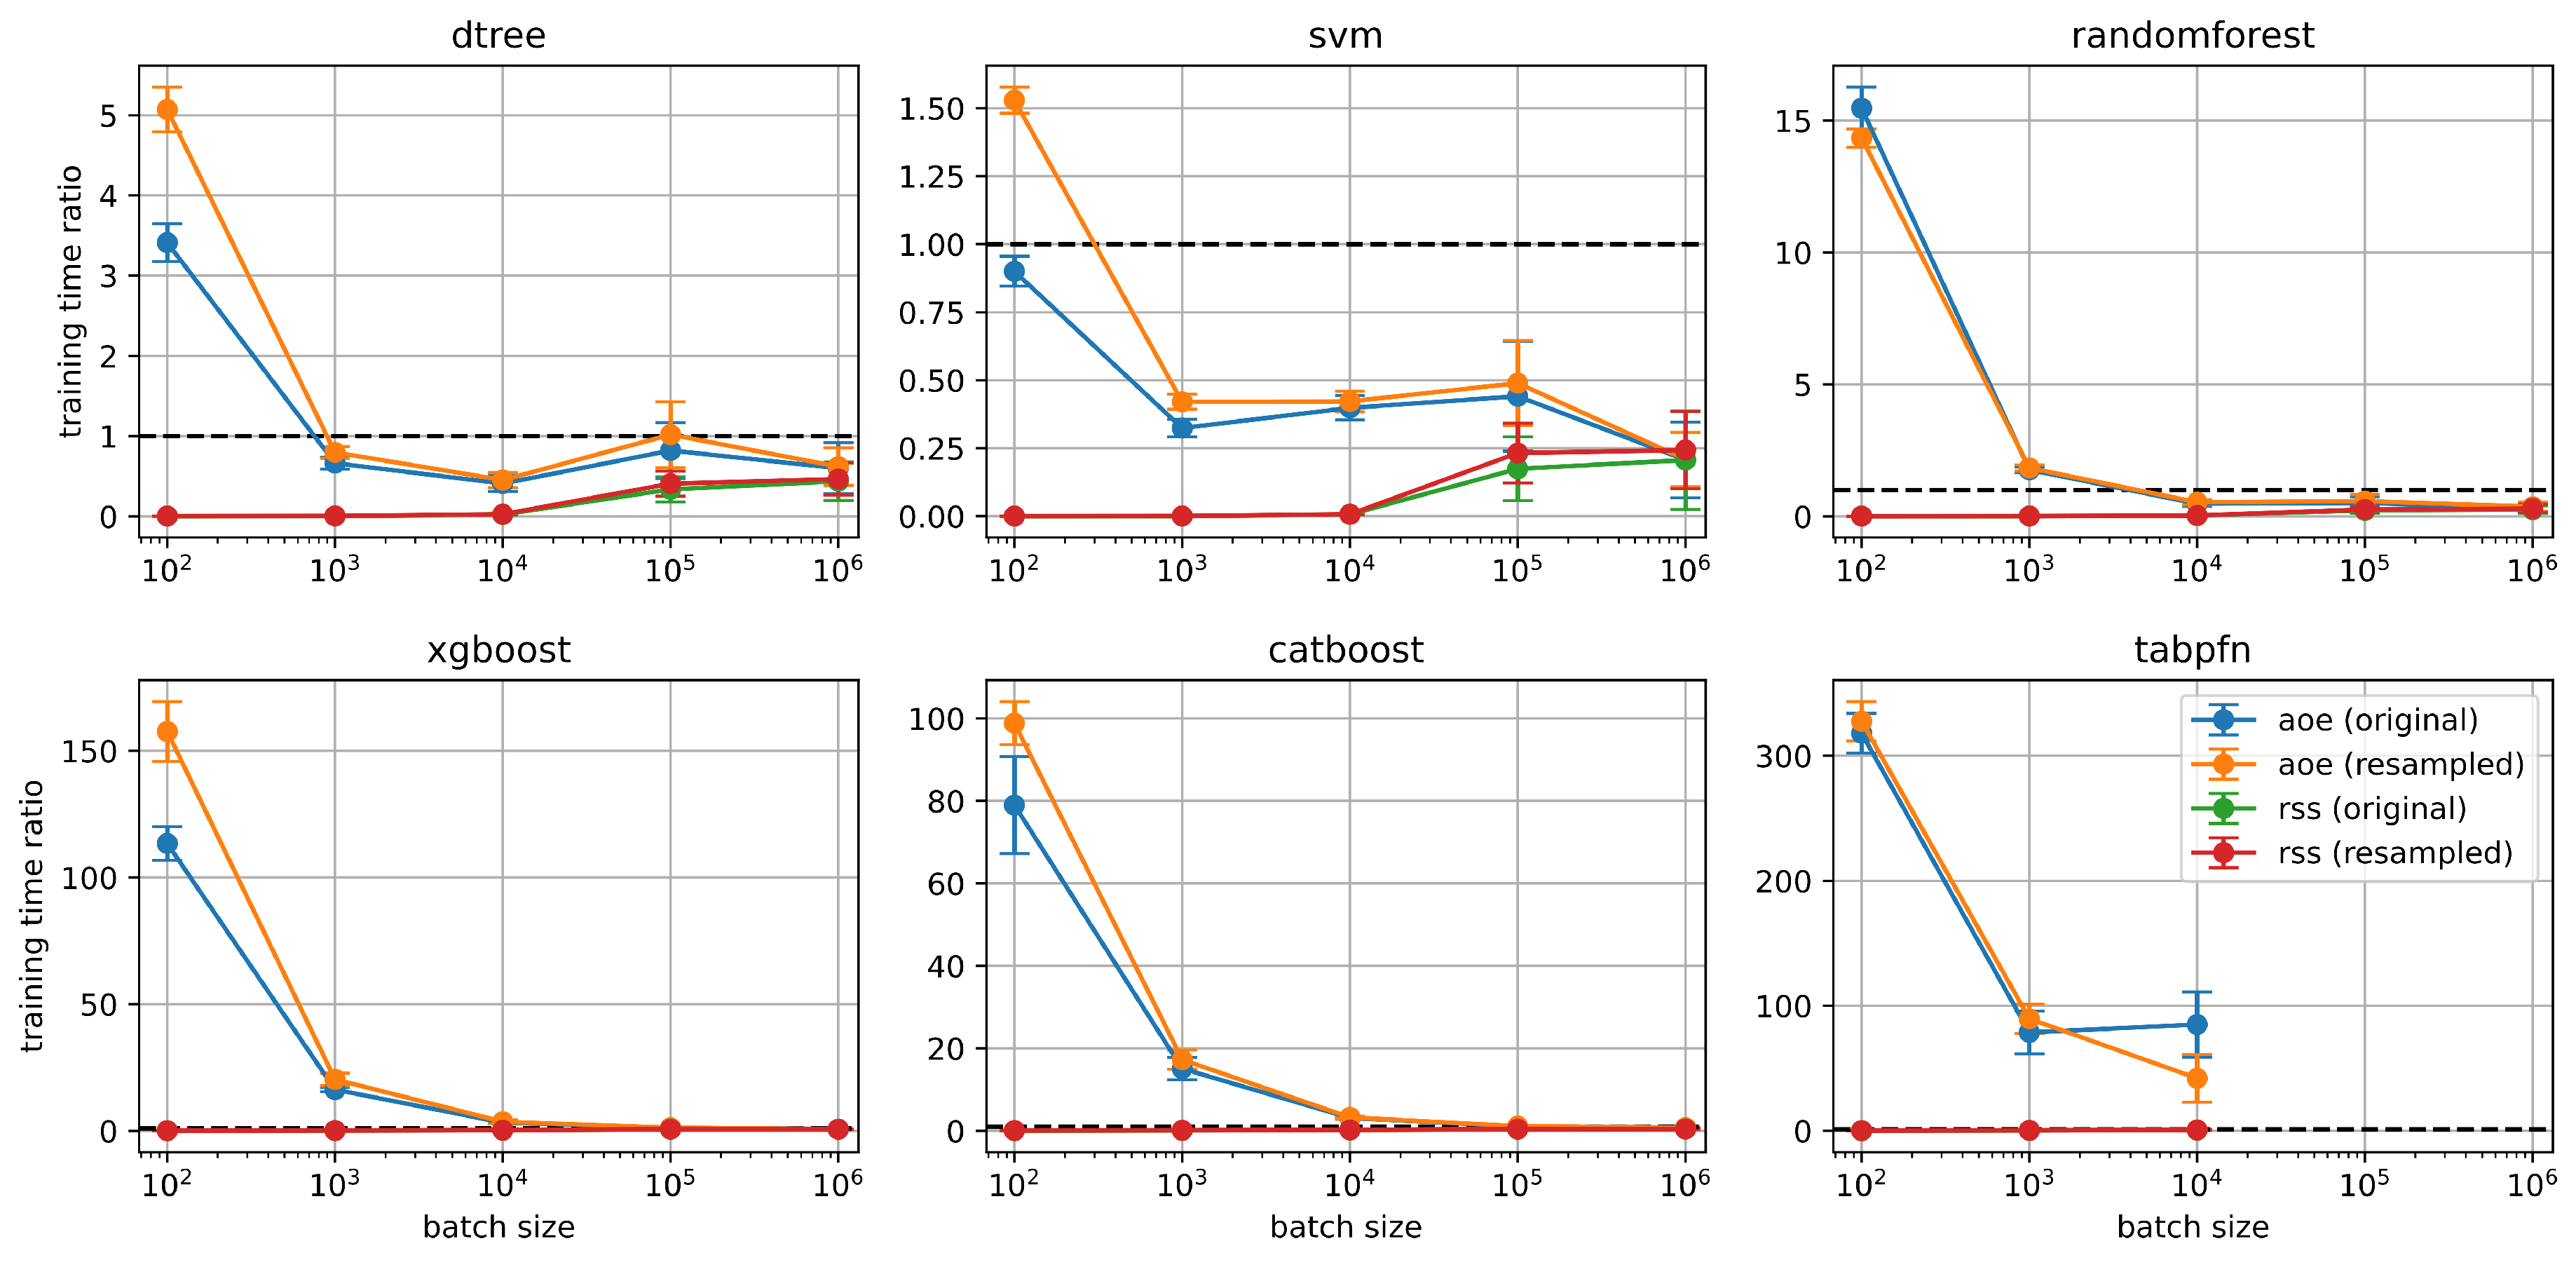
Figure 5.
Absolute -macro performance of classifiers trained with the AOE strategy, as a function of the reduced dataset size. Each point corresponds to the average -score obtained with AOE, using a different batch size. The dashed green line represents the full-data performance under the original split, while the dashed blue line represents the same for the resampled split. When the split is well sampled (resampled), models retain high performance even with significantly fewer examples.
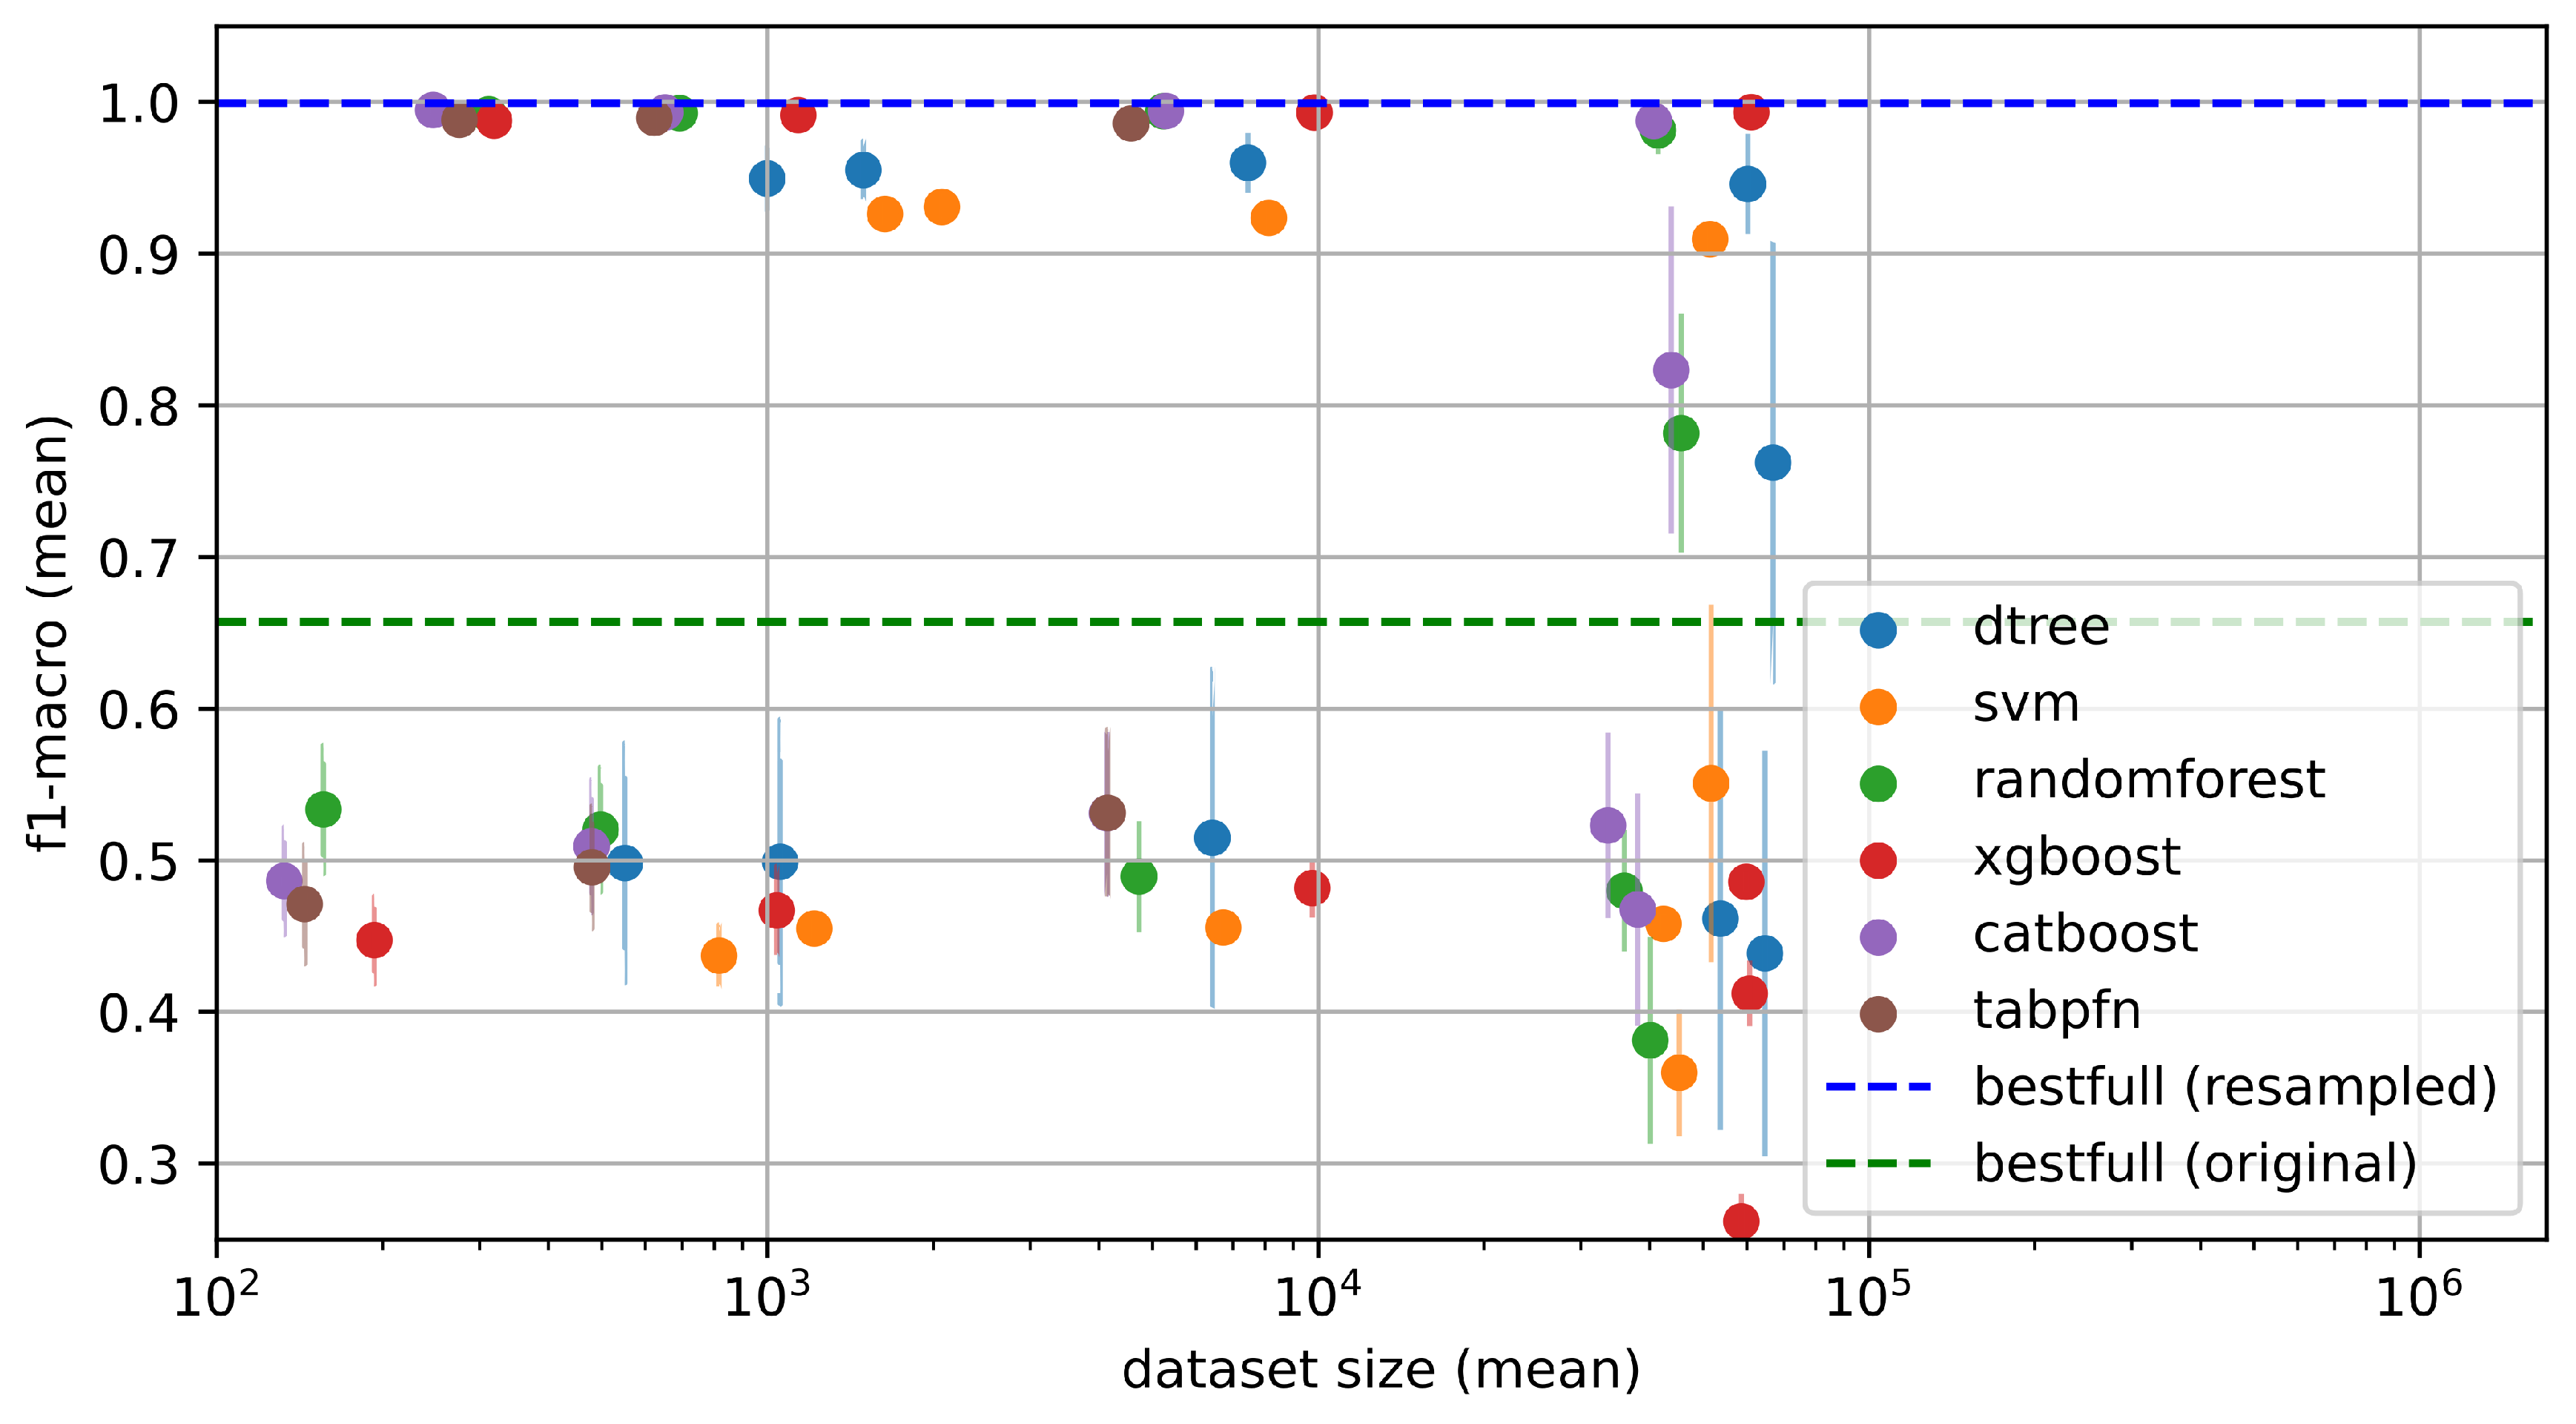
Figure 6.
Evolution of the number of added samples (first and third columns) and -macro score (second and fourth columns) over AOE iterations for three classifiers: Random Forest, XGBoost, and TabPFN. The first two columns correspond to the Original splits, while the last two correspond to the Resampled splits. The blue line shows the mean over 100 random seeds, and the shaded blue region represents the 5th to 95th percentile range. Approximately 126 iterations correspond to one epoch.
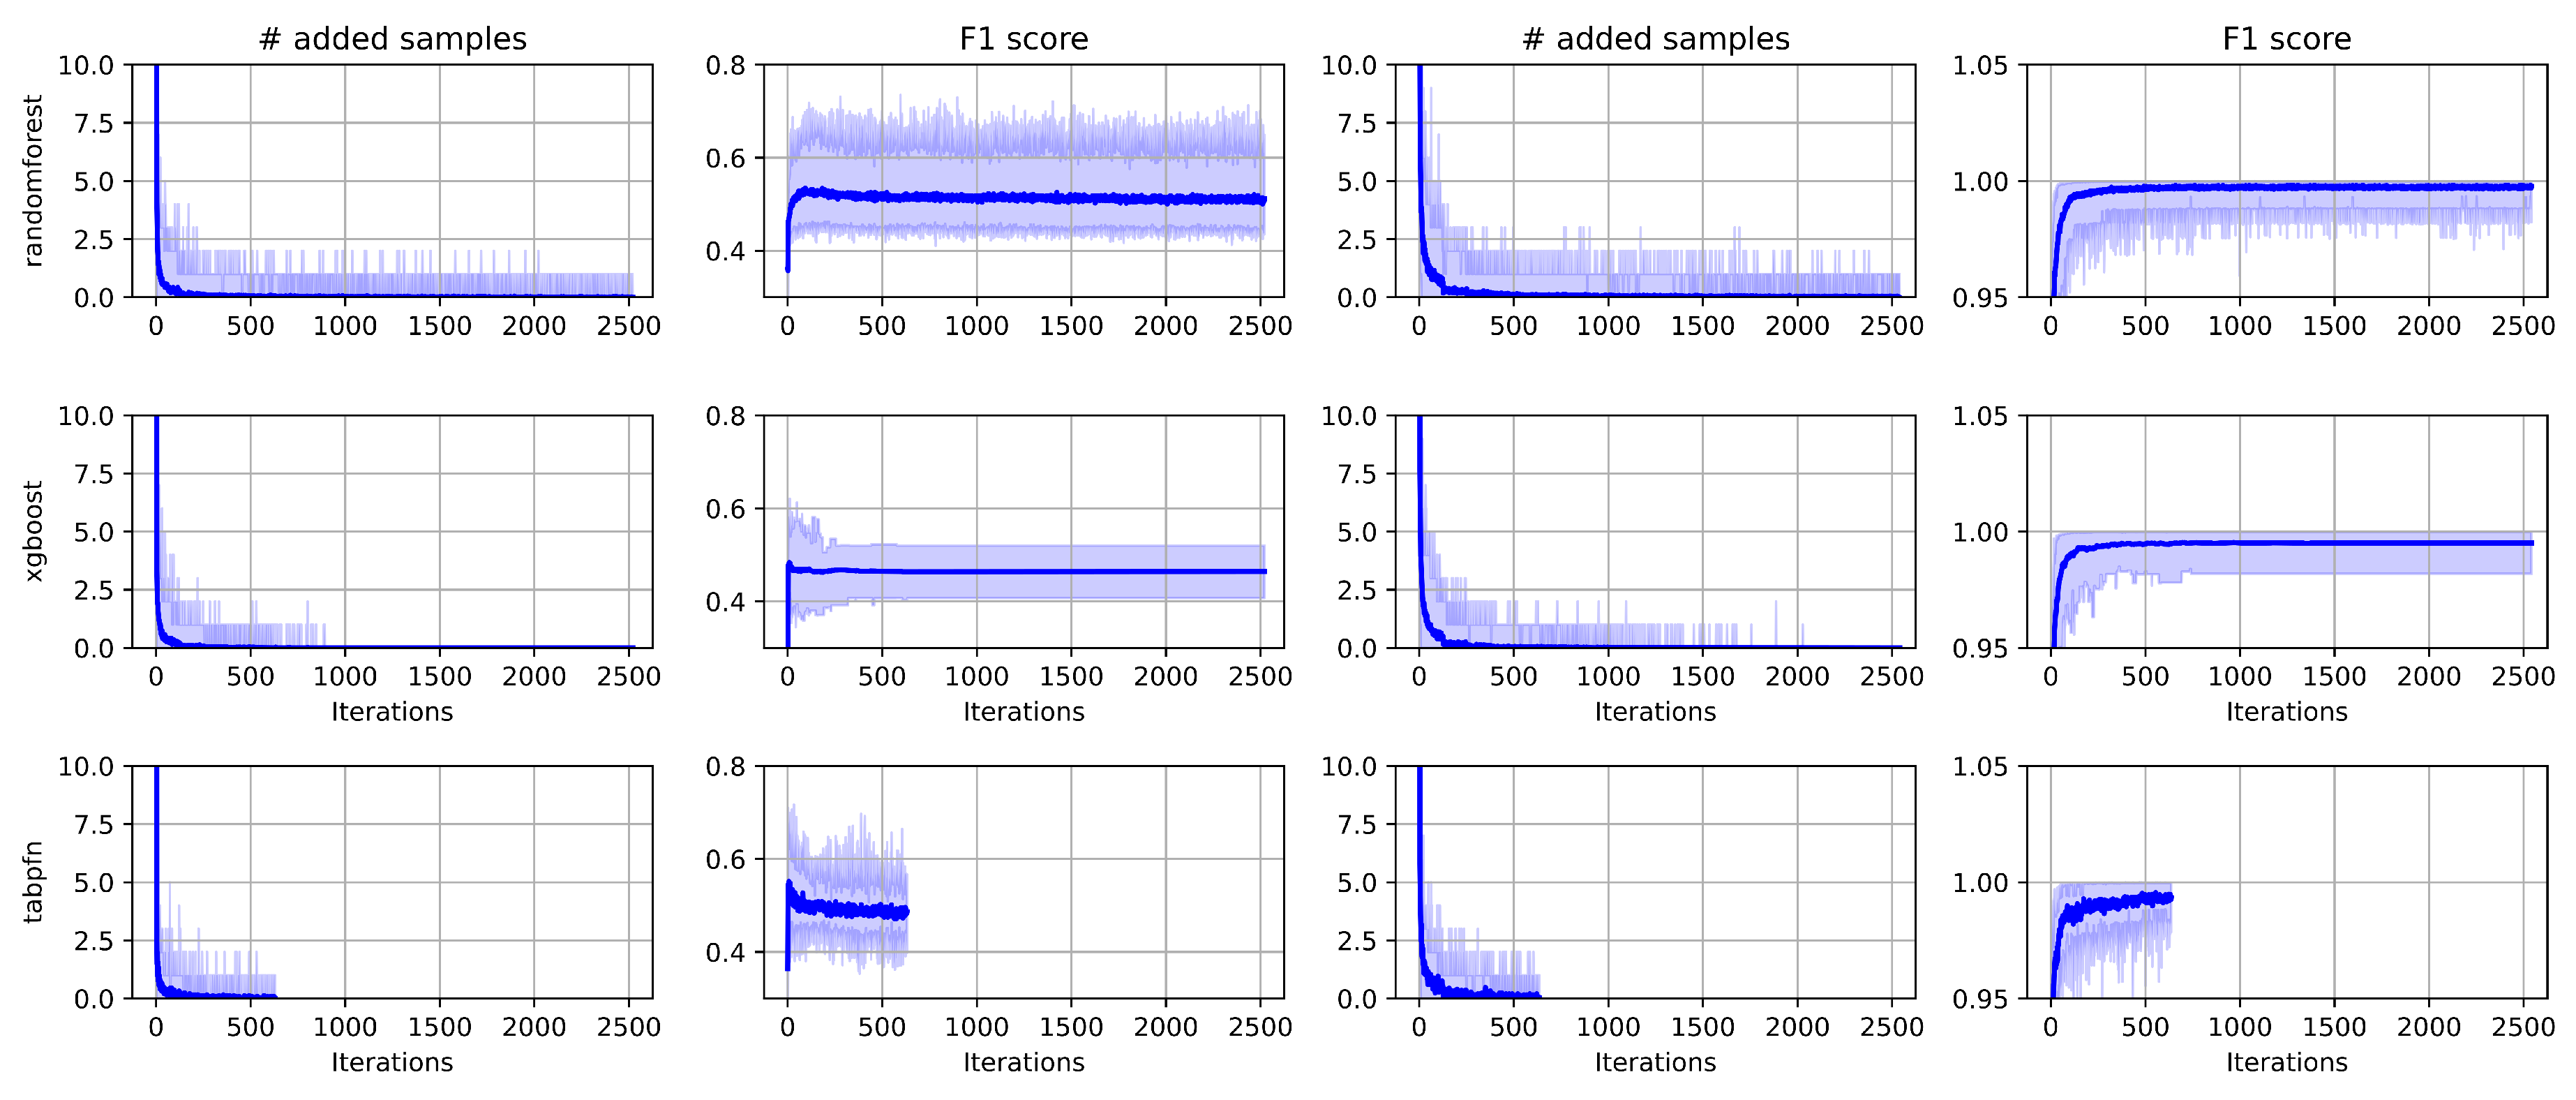

Table 1.
Attack label per class.
| Class | Label |
|---|---|
| Normal | Normal or No Attack |
| DoS | neptune; back; land; pod; smurf; teardrop; mailbomb; apache2; processtable; udpstorm and worm |
| Probe | ipsweep; nmap; portsweep; satan; mscan and saint |
| R2L | ftp write; guess passwd; imap; multihop; phf; spy; warezclient; warezmaster; sendmail; named; snmpgetattack; snmpguess; xlock; xsnoop and httptunnel |
| U2R | buffer overflow; loadmodule; perl; rootkit; ps; sqlattack and xterm |
Table 2.
NSL-KDD sample distribution per class.
| Dataset | Normal | DoS | Probe | R2L | U2R | Total |
|---|---|---|---|---|---|---|
| Training | 67,343 | 45,927 | 11,656 | 995 | 52 | 125,973 |
| Validation | 9,711 | 7,460 | 2,421 | 2,885 | 67 | 22,544 |
Table 3.
Comparison between Original and Resampled splits for class balance and feature distributions.
Table 3.
Comparison between Original and Resampled splits for class balance and feature distributions.
| Stats | Original splits | Resampled splits |
|---|---|---|
| Nval/Ntrain class 0 | 0.1442 | 0.1759 |
| Nval/Ntrain class 1 | 0.1624 | 0.1782 |
| Nval/Ntrain class 2 | 0.2077 | 0.1745 |
| Nval/Ntrain class 3 | 2.8995 | 0.1719 |
| Nval/Ntrain class 4 | 1.2885 | 0.1900 |
| Xtrain(mean)±Xtrain(std) | 0.0660 ± 0.2401 | 0.0662 ± 0.2404 |
| Xval(mean)±Xval(std) | 0.0674 ± 0.2425 | 0.0663 ± 0.2406 |
This table shows the relative validation/training ratio per class, as well as the statistical similarity (mean ± std) of training and validation sets before and after resampling.
Table 4.
Proportion of duplicate predictions by classifier, expressed as a percentage of dataset size.
Table 4.
Proportion of duplicate predictions by classifier, expressed as a percentage of dataset size.
| Model | #duplicates / #dataset size * 100 (average) |
|---|---|
| Random Forest | 0% |
| XGBoost | 0.005% |
| TabPFN | 0% |
Disclaimer/Publisher’s Note: The statements, opinions and data contained in all publications are solely those of the individual author(s) and contributor(s) and not of MDPI and/or the editor(s). MDPI and/or the editor(s) disclaim responsibility for any injury to people or property resulting from any ideas, methods, instructions or products referred to in the content. |
© 2025 by the authors. Licensee MDPI, Basel, Switzerland. This article is an open access article distributed under the terms and conditions of the Creative Commons Attribution (CC BY) license (http://creativecommons.org/licenses/by/4.0/).
Copyright: This open access article is published under a Creative Commons CC BY 4.0 license, which permit the free download, distribution, and reuse, provided that the author and preprint are cited in any reuse.


