Submitted:
01 October 2025
Posted:
02 October 2025
You are already at the latest version
Abstract
Exposure to hypoxia may cause lung injury characterized by hydrostatic pulmonary edema (PE), inflammation and oxidative stress. Norepinephrine (NE) infusion can also induce lung injury with similar pathogenetic characteristics. The main questions of this study were (i) whether NE infusion aggravates hypoxia-induced pulmonary injury; (ii) whether inflammation and oxidative stress deteriorate the hypoxic PE; (iii) whether PE and inflammation recede after three days of normoxic recovery. Ninety-eight female rats were exposed for 72 h to normoxia or normobaric hypoxia and received infusions with NaCl or NE. Some of these animals were transferred to a three-day normoxic recovery period thereafter. We performed histological and immunohistochemical analyses of the lung, determined protein concentrations in pleural fluid (PF) and bronchoalveolar lavage fluid (BALF), and evaluated hemodynamic parameters. While inflammation and oxidative stress receded after 3 days of normoxic recovery, PE did not resolve. Increased protein concentrations in PF and BALF indicated that capillary stress failure increased even further during the normoxic recovery phase, in particular in animals that had previously received NE infusion. These results highlight the fact that inflammation does not play a causal role in the development of hypoxic PE.
Keywords:
hypoxia
; norepinephrine
; pulmonary edema
; oxidative stress
; inflammation
; capillary wall stress
; capillary stress failure
1. Introduction
Exposure to a hypoxic environment such as at high altitudes can exert detrimental effects to the lungs. The best-known lung damage caused by hypoxia is pulmonary edema (PE), e.g. high-altitude pulmonary edema (HAPE). Hypoxia-induced PE including HAPE are often accompanied by an inflammatory reaction in the lung [1,2,3,4], which, however, is not considered the cause of the PE [5]. With regard to its pathogenesis, hypoxic pulmonary edema is classified as non-cardiogenic hydrostatic edema. A markedly increased pulmonary capillary pressure resulting from an uneven hypoxic pulmonary vasoconstriction is considered to be the main cause of the PE. An important component of hypoxic pulmonary vasoconstriction is a reduced bioavailability of nitric oxide (NO) [6,7,8]. In pulmonary regions with strong vasoconstriction, perfusion is low while regions with weak vasoconstriction are overperfused. In these areas, capillary pressure increases and causes an enhanced filtration of fluid from the vessels into the interstitium of the lung [9]. In severe cases of PE, the drainage pathways of the lung, which lead either directly or through the lymph vessels into the pleural space [10,11,12], are not sufficient. As these mechanisms preventing edema formation are limited, flooding of the alveoli may occur [13]. For mountaineers at high altitudes, a rapid descent to lower altitudes and hence, attenuation of the hypoxia, is the most effective therapeutic measure. If descent is impossible, improvement of oxygenation can be achieved by supplemental oxygen or a hyperbaric bag. If all these possibilities are not available, drug treatment with nifedipine or sildenafil is recommended [14].
Although hypoxia-induced PE is mainly a hydrostatic edema, it is commonly accompanied by inflammation. Both in patients at high altitude with HAPE and in rats under conditions of normobaric hypoxia with 10% O2, significant increases in the number of inflammatory cells such as alveolar macrophages and lymphocytes as well as in the expression of tumor necrosis factor (TNF)α and other inflammatory mediators were shown in lung tissue and in bronchoalveolar lavage (BAL) fluid [1,2]. This was also confirmed in previous studies on rats exposed to normobaric hypoxia over 24-72 h demonstrating that PE was associated with signs of inflammation and increased expression of pro-inflammatory cytokines such as TNFα [3,4]. However, as inflammatory markers have been found to not be notably elevated in the early stage of HAPE, the inflammation is considered to be a consequence rather than a cause of PE [5].
In addition to PE and inflammation, hypoxia-induced lung injury is associated with oxidative stress resulting from an excess of reactive oxygen species (ROS), or more comprehensive, reactive oxygen nitrogen species (RONS) with the most important representatives being superoxide, hydrogen peroxide, nitric oxide, and peroxynitrite. Hypoxia can lead to increased production of RONS through several mechanisms, mainly mitochondrial dysfunctions and the activation of various pro-oxidant enzymes [15]. In addition, hypoxia-inducible factors (HIFs), the main regulators of the hypoxia response, also contribute to the upregulation of genes encoding RONS-generating enzymes [16]. Although RONS can be involved in cellular adaptation to stress and hypoxia, overproduction of RONS can lead to damage to cells, proteins, and DNA. Peroxynitrite, which is formed by combination of NO and superoxide, is a highly tissue-toxic RONS that can impair the normal function of the vascular endothelium and increase vascular permeability [17]. Peroxy-nitrite can be detected by its degradation product nitrotyrosine that serves as an important marker of oxidative/nitrosative stress [18]. Furthermore, RONS can activate various signaling pathways involved in the production of pro-inflammatory cytokines and thus, promote inflammation in the lung. In turn, inflammatory cells release RONS, further increasing oxidative stress. This results in a vicious cycle that may progressively deteriorate hypoxic lung damage [15,19].
Hypoxia is associated with activation of the sympathetic nervous system (SNS). Strong sympathetic activation or increased catecholamine levels in the blood can also induce PE. Animal studies showed that even under normoxic conditions, administration of epinephrine or norepinephrine (NE) led to the formation of partly severe PE accompanied by inflammation [20,21,22]. Massive activation of the SNS, as may arise from severe head or spinal cord injury [23,24], can induce an acute severe PE, which is termed neurogenic PE. PE is also a serious complication of pheochromocytoma, a catecholamine-producing tumor of the adrenal medulla or other paraganglia [25,26]. One of the main pathogenic mechanisms of catecholamine-induced PE is a strong vasoconstriction that also includes pulmonary veins [24,27]. Similar to hypoxia, this leads to increased pulmonary capillary pressure. In addition, adrenergic agonists, in particular α-adrenergic stimulators, also exert proinflammatory effects, which may aggravate hypoxic lung injury. However, previous studies on rats under hypoxic conditions receiving adrenergic blockers indicated that the contribution of hypoxia-induced activation of the SNS to the development of hypoxic PE is rather small [4,28]. Travelers to high altitudes are advised to spend at least the first day at rest and to avoid physical exertion. Hence, one important aim of the present study was to investigate whether stronger SNS activation might aggravate complications of hypoxia such as hypoxic lung injury. As a model of strong sympathetic activation, we applied infusion with NE. Secondly, we studied whether inflammation and oxidative stress would deteriorate the hypoxic PE. Finally, we examined whether pulmonary edema and inflammation would recede after a three-day recovery period under normoxic conditions and infusion with 0.9% NaCl solution.
2. Materials and Methods
2.1. Animal Model
All experiments were performed on 98 female Sprague–Dawley rats supplied by Charles River (Sulzfeld, Germany) aged about 10–12 weeks. Their body weight was 242.8 ± 1.9 g at the beginning of this study. All animal protocols were approved by the Federal State Agency (Landesdirektion Sachsen, protocol number TVV 46/18). The experiments were conducted in accordance with the Guide for the Care and Use of Laboratory Animals published by the National Institutes of Health and with the “European Convention for the Protection of Vertebrate Animals used for Experimental and other Scientific Purposes” (Council of Europe No 123, Strasbourg 1985).
2.2. Study Protocol
Animals were subdivided into two cohorts for exposure to normoxia (N, n = 50) or normobaric hypoxia (H, n = 48) for 72 h. The equipment for exposure to hypoxia was as previously described [29,30]. In brief, the animals were placed into a hypoxic chamber with 10% oxygen in nitrogen, while normoxic animals remained under room air conditions. Additionally, all animals received an intravenous infusion over the total experimental time with automatic pumps (Infors AG, Basel, Switzerland) at a rate of 0.1 mL h−1 via an infusion catheter (Vygon, Aachen, Germany). Within both the normoxic and hypoxic cohorts, one group was infused with 0.9% sodium chloride (NaCl) solution, another group was administered NE (0.1 mg kg−1 h−1). The experiment ended after 72 h for a part of the animals of those 4 groups. These four subgroups were referred to as N-NaCl (n = 14), H-NaCl (n = 18), N-NE (n = 14), H-NE (n = 10). The remaining animals were placed for another 72 h under normoxic conditions with NaCl infusion as recovery groups, labeled as N-NaCl+R (n = 8), H-NaCl+R (n = 8), N-NE+R (n = 14) and H-NE+R (n = 12).
The infusion catheter was inserted into the left jugular vein under anesthesia with 2% isofluran. After catheter insertion, the animals woke up and moved freely with access to tap water and a rat chow diet (Altromin C100, Altromin GmbH, Lage, Germany). Exposure to a hypoxic environment started immediately after catheter insertion. The oxygen concentration in the chamber as well as sufficient availability of food and drinking water were checked regularly.
2.3. Hemodynamic Measurements and Sampling of Materials
About 50 min before the end of the experiment, the animals were anesthetized with an intraperitoneal injection of thiopental (Trapanal® 80 mg kg−1). Thereafter, a trache-otomy was performed, and a polyethylene cannula was placed in the trachea. As previously described (see our previous publication [29]), the right ventricle (RV) was catheterized with a Millar® (Millar Instruments, Houston, TX, USA) ultraminiature catheter pressure transducer and the left ventricle (LV) was catheterized with a pressure-volume catheter (Millar Instruments, Houston, TX, USA). Data acquisition and analysis were performed with Power Lab and Lab Chart Software from ADInstruments (version 8.1.9, ADInstruments Europe/UK, Oxford, UK) and a modified LabChart Software (version 1.0) from the ADInstruments sales department (FMI Föhr Medical Instruments GmbH, Seeheim, Germany). We measured left and right ventricular systolic peak pressures (LVSP, RVSP), left ventricular end-diastolic pressure (LV edP), stroke volume (SV) and heart rate (HR). After withdrawing the LV catheter tip into the aorta, the mean aortic pressure (MAP) was measured. The cardiac index (CI, body mass-related cardiac output) was determined by thermodilution using a thermosensitive 1.5F microprobe and a Cardiomax II computer (Columbus Instruments, Columbus, OH, USA). Total peripheral resistance (TPR) was calculated by dividing MAP by CI.
Animals of the H-NaCl and H-NE groups remained in hypoxia until the completion of hemodynamic measurements. After termination of the hemodynamic measurements, the abdominal cavity was opened by midline incision. Animals were sacrificed by drawing blood from the abdominal aorta. The blood was centrifuged for 10 min at 2100 rpm. Then, we opened the thoracic wall, collected pleural fluid (PF) and measured the PF volume. The right bronchus was ligated, and a bronchoalveolar lavage (BAL) of the left lung was performed two times consecutively with 3 mL 0.9% NaCl each. The fluid was instilled via the tracheal cannula into the left lung and withdrawn immediately. While the left lung was discarded, tissue samples from the intact right lung were fixated in formalin for histological and immunohistochemical analyses. Serum, PF, and BAL fluid (BALF) were frozen and stored at -80 °C for analysis of protein content.
2.4. Lung Histology
The formalin-fixated tissue samples of the right lung were embedded in paraffin, sliced, and stained with hematoxylin–eosin. Histological assessments were performed by two independent investigators (S.D. and J.K.) who were blinded to the treatment group. They evaluated PE and blood congestion in the lungs. A detailed quantification of PE was performed as described elsewhere [4]. In brief, PE severity (expressed as PE score ranging from 0 to 3) was assessed by evaluating the width of the alveolar septa and the definition of alveolar spaces (for more details see [4]. The PE scores ranged from 0 to 3 and were defined as follows:
- 0, no PE
- 1, mild PE: alveolar septa slightly thickened, alveolar space well defined
- 2, moderate PE: thickness of alveolar septa about twice the normal width, alveolar space narrowed but still defined
- 3, severe PE: alveolar spaces hardly determinable and/or alveolar edema.
The PE index (PEI) was calculated by cumulating the products of the PE score and the proportionate area of each part of the histological preparation. The congestion index was determined in an analogous way with
- 0, no congestion
- 1, mild congestion, in the interstitium only
- 2, moderate congestion, alveolar walls affected as well
- 3, severe congestion, hemorrhage, erythrocytes in the alveolar spaces.
2.5. Immunohistochemistry
Immunohistochemical analysis was applied as described previously [4] to determine the expressions of TNFα as a potent pro-inflammatory cytokine, and of nitrotyrosine (NT) as a marker of oxidative stress in the lungs. In brief, 2 μm thick sections of the right lung were dewaxed, rehydrated, cooked in 0.01 M citrate buffer (pH = 6) and then blocked with bovine serum albumin (BSA) to saturate unspecific bindings. The specimens were treated with the primary antibodies overnight at 4 °C. For the determination of TNFα, we used rabbit monoclonal anti-TNFα primary antibody (catalogue number SAB4502982, original concentration 1 mg/mL, diluted to 1:100, Sigma-Aldrich, Taufkirchen, Germany), and for the detection of NT, mouse monoclonal anti-nitrotyrosine primary antibody (catalogue number MAB5404, original concentration 1 mg/mL, diluted to 1:100, Merck-Millipore, Darmstadt, Germany) was employed. The next day, the specimens were washed, and the appropriate horseradish peroxidase-labeled secondary antibody was applied for 1 h (TNFα) or 2 h (NT) at room temperature. We used a goat anti-rabbit antibody (catalogue number A0545, 1:200) for TNFα (Sigma-Aldrich, Taufkirchen, Germany), and a goat anti-mouse antibody (catalogue number 12-349, original concentration 1 mg/mL, diluted to 1:200) for NT (Merck-Millipore, Darmstadt, Germany). After another wash cycle, visualization of positive cells was performed with AEC red chromogen (Enzo, Lörrach, Germany). Cell nuclei were counterstained with hemalum.
Microscopic examination and photography were performed using the Axioimager M1 microscope from Zeiss (Carl Zeiss, Jena, Germany) together with an AxioCam MRc 5 camera and Zen Blue 3.1 software (Carl Zeiss, Jena, Germany). For the detection of TNFα, which is mainly located in the bronchial and peribronchial regions, at least 8 photographs per animal were taken from these regions at 200× magnification (20× through the objective lens, 10× through the eyepiece). For NT detection, we took at least 50 photographs per animal at 50× magnification (5× through the objective lens, 10× through the eyepiece). The program ImageJ [31] was used for measurements of the TNFα- or NT-positive areas (in µm2) in the pictures. The expression of TNFα is given as the TNFα-positive area related to the bronchial surface area of the specimen (in percent). The expression of NT is given as the NT-positive area related to the total lung area of the specimen (in percent).
2.6. Protein Concentration in Serum, BALF and PF
Total protein concentration in the fluids was determined using the BCA protein assay from Pierce (catalogue number 23227, Thermo Fisher Scientific, Dreieich, Germany) according to the manufacturer’s instructions. For the analysis of BALF, the undiluted supernatant of the first lavage was used. Pleural fluid (PF) and serum (S) were diluted with distilled water at a ratio of 1:200. A standard curve was generated with bovine serum albumin (25 µg/mL to 2000 µg/mL) and measured together with the unknown samples at 562 nm. We used the spectrophotometer Synergy HTX form BioTek (now Agilent, Waldbronn, Germany) for a twofold determination of the protein concentrations [P]S, [P]PF, and [P]BALF (given in g/L). The concentration ratios [P]PF/[P]S and [P]BALF/[P]S were calculated for each individual animal and are given in %.
2.7. Statistical Analysis
All data are given as mean ± SEM. Statistical analyses were carried out with the software package SigmaPlot Version 16.0 (Systat Software GmbH, Erkrath, Germany) for Windows. All groups were statistically compared using analysis of variance (ANOVA) procedures. At first, a Shapiro–Wilk test of normality was conducted. If the data were normally distributed, we performed a one-way ANOVA with post hoc tests according to Fisher’s method of least significant differences (LSD). If the data were not normally distributed, a Kruskal–Wallis ANOVA on ranks with a post hoc test according to Dunn’s method was applied. p values < 0.05 were considered significant.
3. Results
3.1. Pulmonary Injury
3.1.1. Pulmonary Edema
Lung histology revealed the existence of edema in the lungs of both normoxic and hypoxic rats (Figure 1A-H). Under hypoxic conditions, the type of infusion had different effects on the PE severity. While the PE mildly deteriorated with NaCl infusion, NE rather reduced the PEI. However, contrary to what we had expected, the edema did not recede during the recovery period, but instead became even more severe, particularly in those groups that were previously exposed to hypoxia (Figure 1I). In general, the PE was confined to the interstitium, with the alveoli remaining free of fluid. An alveolar edema was observed in only one animal.
In addition, the histology also showed signs of blood congestion and inflammation (Figure 1A-H). Of note, the degree of blood congestion was not positively correlated with the degree of PE: The congestion index was higher in the N-NaCl group and decreased in the H-NaCl+R and H-NE+R groups (Figure 1K).
3.1.2. Pulmonary Inflammation
The PE was accompanied by inflammation, which was mainly localized in the peribronchial regions (Figure 2). TNFα is one of the most important proinflammatory cytokines in the lung. It has been found predominantly in peribronchial cells. Its expression increased significantly under hypoxic conditions with NaCl infusion, and even more with NE infusion compared to the related normoxic groups. After three days of normoxic recovery, the TNFα levels completely regressed to control level (Figure 3).
3.1.3. Oxidative Stress in the Lung
NT is a degradation product of the RONS peroxynitrite and thus, serves as marker of oxidative stress. NT-positive cells have been found in bronchial and peribronchial cells, but they were also distributed throughout the entire interstitium (see arrows in Figure 4). Similar to TNFα, its expression increased significantly under hypoxic conditions (H-NaCl and H-NE) and returned to control level after three days of normoxic recovery (Figure 4).
3.2. Pleural Fluid and BALF
During the formation of PE, fluid filtration into the pleural space can serve as a drainage route to reduce fluid overload in the interstitium. Animals exposed to hypoxia or infused with NE under normoxic conditions presented higher amounts of PF than normoxic ones or those with hypoxia and NE infusion. Of note, after 3 days of normoxic recovery, animals showed an increase in PE but markedly lower levels of PF (Figure 5).
The total protein concentration ([P]) in PF, BALF, and serum (S) as well as their ratios [P]PF/[P]S and [P]BALF/[P]S (Figure 6) provide further insights into the PE. In the N-NaCl group, [P]PF was in a normal range (<20 g/L), but hypoxia increased it significantly to >30 g/L (H-NaCl) suggesting pleural exudation. The concentration ratio [P]PF/[P]S of 0.5 confirmed this suggestion. With NE infusion, [P]PF increased only slightly in normoxia (N-NE) and hypoxia (H-NE), but the ratio [P]PF/[P]S was also above 0.5 (Figure 6A,B). In contrast, [P]BALF and [P]BALF/[P]S were significantly elevated in the NE groups, but not in the H-NaCl group (Figure 6C,D). Total serum protein concentration ([P]S) decreased in the NE-treated groups (Figure 6E).
After 72 h of normoxic recovery with NaCl infusion, [P]PF returned to control level in the group previously treated with H-NaCl, but even increased in the animals that had previously been treated with NE. This was also reflected in the ratio [P]PF/[P]S. On the contrary, [P]BALF increased in the NaCl groups after recovery while it slightly decreased in the groups with previous NE treatment, but was in all groups higher than in the H-NaCl group. This is even more clearly reflected in the ratio [P]BALF/[P]S. [P]S was low in all recovery groups.
3.3. Hemodynamic Results
The hemodynamic results are presented in Table 1. Hypoxia induced a significant decrease in LVSP. NE infusion did not prevent this LVSP decrease. In contrast, the combination of NE infusion and hypoxia further deteriorated the LVSP depression significantly compared to the effect of hypoxia alone. In contrast to the LV, RVSP slightly increased under hypoxia and even more under hypoxia plus NE infusion resulting in a significant mismatch between LV and RV pressures, presented as ratio of RVSP to LVSP (Figure 7). MAP and SV showed similar changes under hypoxia and/or NE infusion with the lowest values also observed in the H-NE group. HR decreased under hypoxia, but increased with NE infusion, so that the HR in the H-NE group was approximately at the level of the normoxic control. However, this effect was not sufficient to fully compensate for the reduction in LVSP and SV. The CI decreased in the H-NaCl group and even more in the NE groups with the lowest value in the H-NE group. Of note, LV edP increased slightly in the H-NaCl group but showed a significant increase in the H-NE group to about 150% of the normoxic control group. To summarize, animals in the H-NE group presented with the most severely impaired LV function, but also with the highest RVSP and thus the most pronounced imbalance between LV and RV pressures (see Figure 7). The TPR decreased slightly under hypoxia alone and increased with NE infusion, but these changes were not significant.
After three days of normoxic recovery with NaCl infusion, LVSP and MAP completely recovered thus eliminating the imbalance between left and right ventricles. Even more so, in the N-NE+R group, these parameters even slightly exceeded the baseline values observed in the 72 h normoxic control animals. However, in the N-NaCl+R group both LVSP and MAP were significantly lower than after 72 h of N-NaCl treatment. RVSP did not significantly change in the recovery groups. SV completely recovered in the H-NaCl+R group, but was only partially restored in the N-NE+R group. However, in the H-NE+R group SV even significantly exceeded the normoxic control values. HR and CI also reverted in the H-NaCl+R group to normoxic control levels, but did not fully recover in the groups previously infused with NE. LV edP returned in all recovery groups to the level of the normoxic control group. TPR was higher in all recovery groups than in the N-NaCl group, with the exception of the N-NaCl+R group.
4. Discussion
The main result of the present study was that both the hypoxia-induced depression of LV function and markers of inflammation and oxidative stress in the lung receded after 3 days of recovery under normoxic conditions with NaCl infusion. In contrast, the PE did not resolve; on the contrary, it became even more severe. Contrary to our assumption, NE administration did not aggravate PE, but it also did not improve LV function. These unexpected results allow some conclusions to be drawn about the mechanisms involved in the development and progression of hypoxia-induced PE.
4.1. The Effects of Hemodynamic Changes due to Hypoxia and NE Application
The hypoxic PE is considered to be a hydrostatic PE, the main cause of which is an increased pulmonary capillary pressure due to hypoxic pulmonary vasoconstriction (HPV) [9]. HPV is one of the earliest events in the response to hypoxia that occurs both in pulmonary resistance arterioles and venules [32] with vasoconstriction in venous vessels being particularly important for the increase in capillary pressure [33]. As HPV exhibits regional differences, this results in uneven distribution of pulmonary blood flow results with an overperfusion of regions with weak HPV. Capillary pressure increases particularly in these hyperperfused areas inducing filtration of fluid from the capillaries into the interstitium [9,34]. The elevated capillary pressure puts strain on the vessel walls, which is termed capillary wall stress. Excessively high pressure, which is not uncommon in HAPE, can lead to stress failure with ruptures of the blood-gas barrier resulting in increased capillary leakage of fluid, proteins, and cells [35,36].
The hemodynamic measurements of the present study confirmed previous results about the LVSP being significantly decreased under hypoxic conditions while RVSP even increased slightly [30,37]). NE infusion induced similar hemodynamic changes. The increased RVSP leads to an increase in the pulmonary arterial pressure, which, in combination with HPV, also causes the pulmonary capillary pressure to rise. These effects of hypoxia (and similarly, of NE infusion) caused a significant imbalance between the systolic pressures of the LV and RV (see Figure 7), which can lead to blood congestion in the lungs and thus further increase pulmonary capillary pressure. Previous studies showed that such a mismatch between LVSP and RVSP in the early stage of edema formation (within the first 90 min of hypoxia exposure) aggravated the formation of PE [28]. However, pulmonary congestion under hypoxia or with NE infusion in the present study was not more severe than under normoxic conditions suggesting that at this stage, the hemodynamic situation and pulmonary congestion do not contribute significantly to edema formation.
One of the main compensatory mechanisms for increasing pulmonary capillary pressure and increasing fluid filtration into the pulmonary interstitium is fluid drainage into the pleural space, into the mediastinum and via the pulmonary lymphatic vessels [11,38,39]. In fact, we observed a marked increase in the amount of PF in the H-NaCl group, but this did not completely prevent the formation of edema.
Animal experiments have shown that infusion of NE or of other adrenergic agonists can induce PE even under normoxic conditions [21,40], and this was confirmed in the present study. This pro-edematous effect of NE is well known in the human pathology. The neurogenic PE or the PE as a complication of pheochromocytoma are examples of PE induced by adrenergic agonists [25,26,41,42]. The present findings in the NE-infused animals show even more clearly that the hemodynamic situation has only a minor influence on the degree of edema: In the N-NE group, the findings regarding hemodynamics and PF volume were similar; accordingly, the degree of edema was also in a similar range. In the H-NE group, however, the imbalance between LV and RV pressures was even greater than in all other groups. LVSP and SV were significantly lower than in the other groups, and LV edP reached approximately 1.3 to 1.8 times the values of the other groups. However, although these animals produced lower amounts of PF, congestion and edema in the lung were even weaker than in the H-NaCl and N-NE groups. These results correspond to the characterization of HAPE as a non-cardiogenic pulmonary edema with elevated pulmonary capillary pressure and normal left atrial pressure [9]. Furthermore, they are consistent with previous observations in hypoxic rats that NE did not significantly aggravate PE and adrenergic blockers did not significantly reduce it [28,37].
The findings of the recovery groups also confirm the relatively minor influence of hemodynamic factors on the advanced stage of edema: After 3 days of recovery under normoxic conditions with NaCl infusion, the LV function returned to approximately its initial level, which also reduced the imbalance between LVSP and RVSP and blood congestion in the lungs. Nevertheless, the PEI even increased during this recovery phase. But what could be the reasons for the edema persisting even after reoxygenation, despite pulmonary capillary pressures being presumably normalized?
4.2. The Role of Inflammation and Oxidative Stress
The PE was accompanied by inflammation, which was evident in the histological picture as well as in the expression of the proinflammatory cytokine TNFα. The histological signs of inflammation and the expression of TNFα were low under normoxic conditions both with NaCl and NE infusion. Hypoxia induced a significant increase in TNFα expression, and even more so with additional NE infusion. After 3 days of normoxic recovery, the TNFα level returned in all groups to the normoxic control level.
Hypoxia promotes the release of proinflammatory cytokines such as interleukin (IL)-1, IL-6 and TNFα [1,43,44]. Increased levels of these cytokines were found in people at high altitude in their early stage of HAPE development [1] but were also observed in persons who did not develop symptoms of HAPE [44]. Another study demonstrated that the first HAPE symptoms preceded the occurrence of inflammation markers in BALF. From this, the authors concluded that the inflammation is not to be regarded as a cause of HAPE [5]. Our results are completely consistent with this concept. This is impressively highlighted by the complete regression in TNFα expression to control levels after 3 days of recovery under normoxic conditions, while PE persisted after this period.
Hypoxia is also associated with increased production of reactive oxygen nitrogen species (RONS). The reduced oxygen supply leads to disturbances in the mitochondrial electron transport chain. Moreover, RONS-generating enzymes such as superoxide dismutase, NADPH oxidases or NO synthases are upregulated under hypoxia [16,45,46,47]. HIF-1 as one of the main regulators of response to hypoxia plays an important role: On the one hand, it may promote oxidative stress, but on the other hand, it can prevent excessive production of RONS [48,49]. Accumulation of RONS can induce oxidative damage to lipids, proteins and DNA. In particular, in addition to its cytotoxic effect, peroxynitrite directly alters proteins of the endothelial cytoskeleton, leading to dysfunction of the endothelial barrier of pulmonary arteries [17]. Peroxynitrite-induced damage to the vascular barrier can promote fluid accumulation in the lung and consequently, formation of a permeability and hydrostatic PE as demonstrated in a study on isolated rat lungs perfused with peroxynitrite [50].
RONS are also important mediators of inflammatory processes [19,47], which may promote and aggravate formation of PE. A study on rats exposed to hypobaric hypoxia showed a significant increase in ROS generation as well as a significantly increased expression of NFκB and proinflammatory cytokines. These changes were associated with a marked increase in membrane peroxidation and vascular leakage [45]. Peroxynitrite also contributes to the proinflammatory effects of RONS [47]. Conversely, inflammation promotes the production of RONS and thus increases the damage to DNA and cell components. The potent proinflammatory cytokine TNFα has been demonstrated to induce the peroxynitrite-dependent increase in the permeability of pulmonary capillaries [51], indicating that inflammation and oxidative stress can maintain and aggravate edema formation. Although the animals in the recovery groups of the present study showed a clear regression of TNFα and NT levels, damage to the vessel walls has to be assumed, which was at least partly caused by inflammation and oxidative stress and was definitely exacerbated by these factors. The damage to the capillary wall requires a large number of repair and remodeling processes [52]. Some small endothelial or epithelial breaks can be closed within a few minutes when the basement membrane is still intact, however, complete closure of all disruptions is not achieved [53]. The complete repair is part of pulmonary remodeling that lasts days to weeks [54,55]. Hence, we would expect that the vascular leak would still persist after three days of recovery under normoxic conditions.
4.3. The Protein Content in PF and BALF
The significantly elevated protein concentrations in PF and BALF of the hypoxic or NE-infused rats clearly confirm an increased capillary permeability. A protein-rich PF with a specific gravity above 1.016 corresponding to a protein concentration above 30 g/L indicates an exudate, which typically results from increased vascular permeability [56]. In addition, a [P]PF/[P]S ratio above 0.5 is one of Light’s classical criteria that distinguishes exudates from transudates [57]. Animals treated for 3 days with NaCl infusion and hypoxia presented with such elevated protein concentrations in PF. Hypoxia-induced PE is typically a hydrostatic edema, which may be aggravated by an increased vascular permeability due to capillary stress failure [35]. A protein-rich BALF confirming capillary stress failure and increased vascular leak has also been found in climbers to high altitude with HAPE [1,58]. The pulmonary blood-gas barrier (BGB) can withstand transmural pressures of up to approximately 24 mmHg. Above this value, first disruptions in the BGB may occur, but consistent breaks in the BGB have been found at pressure values around 40 mmHg [36]. In humans, pulmonary capillary pressures above 24 mmHg may be achieved during heavy exercise [59]. In athletes after heavy exercise in normoxia, BAL analysis revealed elevated levels in total protein concentration and red blood cells in absence of inflammation markers, indicative of damage to the BGB with high permeability edema [60,61]. Of note, red blood cell numbers and total protein concentrations increased even more when the same exercise protocol was performed under hypoxic conditions. The high concentration of red blood cells in BALF remained even after 26 h indicating a persistent capillary leak [61]. While an elevated protein concentration in PF with low protein level in BALF as found in the H-NaCl group suggests that disruptions mainly concerned the vascular side of the BGB so that fluid and protein filtration is confined to the interstitium, elevated protein levels in BALF as observed in the NE-infused rats signify that the disruptions pass through the entire BGB. This favors the assumption that NE aggravates the capillary stress failure. The elevated capillary pressure is the primary cause of capillary wall stress, and inflammation and oxidative stress further contribute to the damage to the BGB and the vascular leakage. NE infusion or stress reinforced the imbalance between LV and RV systolic pressures, thus increasing capillary wall stress and promoting stress failure. Subjects prone to HAPE have been shown to present an exaggerated sympathetic nerve activity under hypoxic exposure indicating that sympathetic overactivation might contribute to the development of HAPE by increasing pulmonary vasoconstriction [62]. In addition, previous studies on rats demonstrated that infusion of NE and other adrenergic agonists induced both edema and inflammation in the lungs even under normoxic conditions [22,40,63].
The protein concentrations in the recovery groups provide some information about the time course of the BGB repair. Previous studies demonstrated an initial mechanical repair in endothelial and epithelial breaks in the BGB within several minutes. The reversible breaks were mainly the smaller ones with intact basement membranes [53]. On the other hand, biological repair includes proliferation of endothelial cells, angiogenesis as well as vascular remodeling, all of which are processes requiring protein synthesis and therefore take several days [54,55]. In the H-NaCl+R group, the protein concentrations both in PF and in BALF are approximately at control level, indicating that the defects in the BGB are largely closed. In contrast, in the recovery groups after NE treatment (N-NE+R, H-NE+R), the protein concentrations decreased in BALF but increased in PF, suggesting largely closed defects on the alveolar side with persistent vascular leak.
The reduced protein concentrations in serum might be explained, on the one hand, as a result of the protein loss via the capillary leak and, on the other hand, by fluid retention due to reduced diuresis. While individuals climbing to high altitude typically increase their diuresis [64,65], people with no increase in diuresis are prone to develop high-altitude diseases [66]. This might be a further contributing factor to the persistent PE in the recovery groups. Further studies should include measurements of fluid intake and output to assess more accurately the fluid volume changes in hypoxia and their significance for the development and persistence of HAPE.
4.4. Limitations to the Study
We cannot make any definite statements about the volume state of our experimental animals. As discussed above, it is well known that exposure to hypoxia increases diuresis [64,65], which may protect the lung capillaries from excessive pressure increases. Measurement of fluid intake and urine excretion would provide more detailed information on the volume state of the animals and its possible role in formation and resolution of hypoxic PE.
Another limitation of this study is that we only used female rats. This was done to compare the results with previous studies [3,4,28,29,30,37]. Although blood pressure and heart rate were similar in male and female rats under hypoxic conditions [67], female rats are more tolerant to hypoxia and recover their respiration faster than males after hypoxic exposure [68]. Correspondingly, a recent review of HAPE in humans demonstrated that the incidence of HAPE in women averaged only about 14% of the incidence in men, with the percentage ranging from 2% to 37% in individual studies [69]. Hence, a comparison between rats of both sexes would be interesting and would probably show more severe pulmonary edema and injury in male animals than we found in the present study.
5. Conclusions
Our data show that rats exposed to hypoxia over three days develop PE, which is mainly confined to the interstitium. However, capillary stress failure may have occurred as indicated by elevated protein levels in the PF or in the BALF. In addition, hypoxia induces inflammation and increased oxidative stress, which also can induce damage to the BGB. NE infusion can promote PE formation even under normoxic conditions, but the combined exposure of NE plus hypoxia did not aggravate the severity of PE despite a mild further increase in TNFα and NT as markers of inflammation and oxidative stress. Similarly, NE plus hypoxia enhanced the LV depression and the imbalance between LV and RV pressures without increasing the severity of PE. These findings are in full line with the widely accepted definition of HAPE as a hydrostatic but non-cardiogenic PE, which may result in a permeability edema due to capillary stress failure [9,70]. Although the edema is accompanied by inflammation, this develops in parallel with the edema and therefore is considered not to play a causal role in the development of the edema [5]. This is further emphasized by the results of the recovery animals: Despite a complete regression of the markers of inflammation and oxidative stress, PE persists even after three days of recovery in normoxia and with NaCl infusion. It is reasonable to assume that not all breaks in the BGB have been repaired and closed during this short period of time so that fluid and proteins still can pass through the capillary wall and maintain the PE.
Author Contributions
Conceptualization, A.S. and B.R.; methodology, S.D., C.B., J.K., C.R., A.S., and B.R.; formal analysis, S.D., C.B., J.K., C.R., A.S., and B.R.; investigation, S.D., C.B., J.K., C.R., B.R., and A.S.; writing—original draft preparation, B.R., S.D., and A.S.; writing—review and editing, B.R., S.D., C.R. and A.S.; visualization, B.R., S.D.; supervision, A.S. and B.R. All authors have read and agreed to the published version of this manuscript.
Funding
This research received no external funding.
Institutional Review Board Statement
The study was conducted in accordance with the Declaration of Helsinki, and approved by the state agency (Landesdirektion Sachsen, number and date of approval: TVV 46/18; 17 December 2018).
Informed Consent Statement
Not applicable as the study did not involve humans.
Data Availability Statement
Data are available on request from the corresponding author.
Acknowledgments
We acknowledge support from the Open Access Publishing Fund of Leipzig University.
Conflicts of Interest
The authors declare no conflict of interest.
References
- Kubo, K.; Hanaoka, M.; Hayano, T.; Miyahara, T.; Hachiya, T.; Hayasaka, M.; Koizumi T; Fujimoto, K. ; Kobayashi, T.; Honda, T. Inflammatory cytokines in BAL fluid and pulmonary hemodynamics in high-altitude pulmonary edema. Respir. Physiol. 1998, 111, 301–310. [Google Scholar] [CrossRef] [PubMed]
- Madjdpour, C.; Jewell, U.R.; Kneller, S.; Ziegler, U.; Schwendener, R.; Booy, C.; Kläusli, L.; Pasch, T.; Schimmer, R.C.; Beck-Schimmer, B. Decreased alveolar oxygen induces lung inflammation. Am. J. Physiol. Lung Cell Mol. Physiol. 2003, 284, L360–L367. [Google Scholar] [CrossRef] [PubMed]
- Kowalleck, U.; Ahmed, M.A.A.; Koedel, J.; Schierle, K.; Salameh, A.; Rassler, B. Relaxin does not prevent development of hypoxia-induced pulmonary edema in rats. Pflugers Arch. 2022, 474, 1053–1067. [Google Scholar] [CrossRef] [PubMed]
- Riha, I.; Salameh, A.; Hoschke, A.; Raffort, C.; Koedel, J.; Rassler, B. Hypoxia-Induced Pulmonary Injury-Adrenergic Blockade Attenuates Nitrosative Stress, and Proinflammatory Cytokines but Not Pulmonary Edema. J. Cardiovasc. Dev. Dis. 2024, 11, 195. [Google Scholar] [CrossRef]
- Swenson, E.R.; Maggiorini, M.; Mongovin, S.; Gibbs, J.S.; Greve, I.; Mairbäurl, H.; Bärtsch, P. Pathogenesis of high-altitude pulmonary edema: inflammation is not an etiologic factor. JAMA 2002, 287, 2228–2235. [Google Scholar] [CrossRef]
- Berger, M.M.; Hesse, C.; Dehnert, C.; Siedler, H.; Kleinbongard, P.; Bardenheuer, H.J.; Kelm, M.; Bärtsch, P.; Haefeli, W.E. Hypoxia impairs systemic endothelial function in individuals prone to high-altitude pulmonary edema. Am. J. Respir. Crit. Care Med. 2005, 172, 763–767. [Google Scholar] [CrossRef]
- Bärtsch, P.; Gibbs, J.S. Effect of altitude on the heart and the lungs. Circulation 2007, 116, 2191–2202. [Google Scholar] [CrossRef]
- Scherrer, U.; Rexhaj, E.; Jayet, P.Y.; Allemann, Y.; Sartori, C. New insights in the pathogenesis of high-altitude pulmonary edema. Prog. Cardiovasc. Dis. 2010, 52, 485–492. [Google Scholar] [CrossRef]
- Bärtsch, P.; Mairbäurl, H.; Maggiorini, M.; Swenson, E.R. Physiological aspects of high-altitude pulmonary edema. J. Appl. Physiol. (1985) 2005, 98, 1101–1110. [Google Scholar] [CrossRef]
- Broaddus, V.C.; Wiener-Kronish, J.P.; Berthiaume, Y.; Staub, N.C. Removal of pleural liquid and protein by lymphatics in awake sheep. J. Appl. Physiol. (1985) 1988, 64, 384–390. [Google Scholar] [CrossRef]
- Broaddus, V.C.; Wiener-Kronish, J.P.; Staub, N.C. Clearance of lung edema into the pleural space of volume-loaded anesthetized sheep. J. Appl. Physiol. (1985) 1990, 68, 2623–2630. [Google Scholar] [CrossRef]
- Miserocchi, G. Mechanisms controlling the volume of pleural fluid and extravascular lung water. Eur. Respir. Rev. 2009, 18, 244–252. [Google Scholar] [CrossRef] [PubMed]
- Beretta, E.; Romanò, F.; Sancini, G.; Grotberg, J.B.; Nieman, G.F.; Miserocchi, G. Pulmonary Interstitial Matrix and Lung Fluid Balance From Normal to the Acutely Injured Lung. Front. Physiol. 2021, 12, 781874. [Google Scholar] [CrossRef]
- Maggiorini, M. Prevention and treatment of high-altitude pulmonary edema. Prog. Cardiovasc. Dis. 2010, 52, 500–506. [Google Scholar] [CrossRef] [PubMed]
- Mendoza, E.N.; Ciriolo, M.R.; Ciccarone, F. Hypoxia-Induced Reactive Oxygen Species: Their Role in Cancer Resistance and Emerging Therapies to Overcome It. Antioxidants (Basel) 2025, 14, 94. [Google Scholar] [CrossRef]
- Yuan, G.; Khan, S.A.; Luo, W.; Nanduri, J.; Semenza, G.L.; Prabhakar, N.R. Hypoxia-inducible Factor 1 Mediates Increased Expression of NADPH Oxidase-2 in Response to Intermittent Hypoxia. J. Cell. Physiol. 2011, 226, 2925–2933. [Google Scholar] [CrossRef] [PubMed]
- Knepler, J.L. Jr.; Taher, L.N.; Gupta, M.P.; Patterson, C.; Pavalko, F.; Ober, M.D.; Hart, C.M. Peroxynitrite causes endothelial cell monolayer barrier dysfunction. Am. J. Physiol. Cell Physiol. 2001, 281, C1064–C1075. [Google Scholar] [CrossRef]
- Salameh, A.; Zöbisch, H.; Schröder, B.; Vigelahn, J.; Jahn, M.; Abraham, G.; Seeger, J.; Dähnert, I.; Dhein, S. Effects of Hypoxia and Acidosis on Cardiac Electrophysiology and Hemodynamics. Is NHE-Inhibition by Cariporide Still Advantageous? Front. Physiol. 2020, 11, 224. [Google Scholar] [CrossRef]
- Chelombitko, M.A. Role of Reactive Oxygen Species in Inflammation: A Minireview. Moscow Univ. Biol. Sci. Bull. 2018, 73, 199–202. [Google Scholar] [CrossRef]
- Dai, S.; Xue, Q.; Sun, R.; Wang, S.; Li, C.; Wu, Y.; Si, Q.; Hu, S. Hemodynamic and nonhemodynamic mechanisms of experimental pulmonary edema in rats and the effect of anisodamine and tetramethylpyrazine. Part 1: Survival rate, pulmonary index, pathological change and pulmonary vascular permeability. Chin. Med. Sci. J. 1993, 8, 72–76. [Google Scholar]
- Rassler, B.; Barth, W.; Zimmer, H.G. Transient pleural effusion in norepinephrine-stimulated rats. Basic Res. Cardiol. 2001, 96, 471–477. [Google Scholar] [CrossRef]
- Rassler, B.; Reissig, C.; Briest, W.; Tannapfel, A.; Zimmer, H.G. Pulmonary edema and pleural effusion in norepinephrine-stimulated rats--hemodynamic or inflammatory effect? Mol. Cell. Biochem. 2003, 250, 55–63. [Google Scholar] [CrossRef]
- Simmons, R.L.; Martin, A.M. Jr.; Heisterkamp, C.A. 3rd.; Ducker, T.B. Respiratory insufficiency in combat casualties. II. Pulmonary edema following head injury. Ann. Surg. 1969, 170, 39–44. [Google Scholar] [CrossRef]
- Sedý, J.; Zicha, J.; Nedvídková, J.; Kunes, J. The role of sympathetic nervous system in the development of neurogenic pulmonary edema in spinal cord-injured rats. J. Appl. Physiol. (1985) 2012, 112, 1–8. [Google Scholar] [CrossRef]
- Dai, J.; Chen, S.J.; Yang, B.S.; Lü, S.M.; Zhu, M.; Xu, Y.F.; Chen, J.; Cai, H.W.; Mao, W. Recurrence of non-cardiogenic pulmonary edema and sustained hypotension shock in cystic pheochromocytoma. J. Zhejiang Univ. Sci. B. 2017, 18, 449–452. [Google Scholar] [CrossRef] [PubMed]
- Y-Hassan, S.; Falhammar, H. Cardiovascular Manifestations and Complications of Pheochromocytomas and Paragangliomas. J. Clin. Med. 2020, 9, 2435. [Google Scholar] [CrossRef]
- Teboul, J.L.; Douguet, D.; Mercat, A.; Depret, J.; Richard, C.; Zelter, M. Effects of catecholamines on the pulmonary venous bed in sheep. Crit. Care Med. 1998, 26, 1569–1575. [Google Scholar] [CrossRef] [PubMed]
- Appelt, P.; Gabriel, P.; Bölter, C.; Fiedler, N.; Schierle, K.; Salameh, A.; Rassler, B. Left ventricular depression and pulmonary edema in rats after short-term normobaric hypoxia: effects of adrenergic blockade and reduced fluid load. Pflugers Arch. 2021, 473, 1723–1735. [Google Scholar] [CrossRef]
- Bambor, C.; Daunheimer, S.; Raffort, C.; Koedel, J.; Salameh, A.; Raßler, B. Effects of a Three-Day vs. Six-Day Exposure to Normobaric Hypoxia on the Cardiopulmonary Function of Rats. Curr. Issues Mol. Biol. 2025, 47, 125. [Google Scholar] [CrossRef]
- Neubert, E.; Rassler, B.; Hoschke, A.; Raffort, C.; Salameh, A. Effects of Normobaric Hypoxia and Adrenergic Blockade over 72 h on Cardiac Function in Rats. Int. J. Mol. Sci. 2023, 24, 11417. [Google Scholar] [CrossRef]
- Abramoff, M.D.; Magalhaes, P.J.; Ram, S.J. Image processing with ImageJ. Biophotonics Int. 2004, 11, 36–42. [Google Scholar]
- Swenson, E.R. Early hours in the development of high-altitude pulmonary edema: time course and mechanisms. J. Appl. Physiol. (1985) 2020, 128, 1539–1546. [Google Scholar] [CrossRef]
- Magnusdottir, S.O.; Simonsen, C.; Karbing, D.S.; Rasmussen, B.S.; Kjaergaard, B. Hypoxia in the pulmonary vein increases pulmonary vascular resistance independently of oxygen in the pulmonary artery. Animal Model Exp. Med. 2024, 7, 156–165. [Google Scholar] [CrossRef]
- Hopkins, S.R.; Garg, J.; Bolar, D.S.; Balouch, J.; Levin, DL. Pulmonary blood flow heterogeneity during hypoxia and high-altitude pulmonary edema. Am. J. Respir. Crit. Care Med. 2005, 171, 83–87. [Google Scholar] [CrossRef]
- West, J.B.; Tsukimoto, K.; Mathieu-Costello, O.; Prediletto, R. Stress failure in pulmonary capillaries. J. Appl. Physiol. (1985) 1991, 70, 1731–1742. [Google Scholar] [CrossRef]
- West, J.B. Invited review: pulmonary capillary stress failure. J. Appl. Physiol. (1985) 2000, 89, 2483–2489. [Google Scholar] [CrossRef]
- Bölter, C.; Gabriel, P.; Appelt, P.; Salameh, A.; Schierle, K.; Rassler, B. Effects of Adrenergic Agonists and Antagonists on Cardiopulmonary Function During Normobaric Hypoxia in Rat. Front. Physiol. 2019, 10, 860. [Google Scholar] [CrossRef]
- Staub, N.C. New concepts about the pathophysiology of pulmonary edema. J. Thorac. Imaging 1988, 3, 8–14. [Google Scholar] [CrossRef] [PubMed]
- Wiener-Kronish, J.P.; Broaddus, V.C.; Albertine, K.H.; Gropper, M.A.; Matthay, M.A.; Staub, N.C. Relationship of pleural effusions to increased permeability pulmonary edema in anesthetized sheep. J. Clin. Invest. 1988, 82, 1422–1429. [Google Scholar] [CrossRef] [PubMed]
- Rassler, B.; Reissig, C.; Briest, W.; Tannapfel, A.; Zimmer, H.G. Catecholamine-induced pulmonary edema and pleural effusion in rats--alpha- and beta-adrenergic effects. Respir. Physiol. Neurobiol. 2003, 135, 25–37. [Google Scholar] [CrossRef]
- Šedý, J.; Kuneš, J.; Zicha, J. Pathogenetic Mechanisms of Neurogenic Pulmonary Edema. J. Neurotrauma 2015, 32, 1135–1145. [Google Scholar] [CrossRef] [PubMed]
- Rachfalska, N.; Putowski, Z.; Krzych, J. Distant Organ Damage in Acute Brain Injury. Brain Sci. 2020, 10, 1019. [Google Scholar] [CrossRef]
- Ghezzi, P.; Dinarello, C.A.; Bianchi, M.; Rosandich, M.E.; Repine, J.E.; White, C.W. Hypoxia increases production of interleukin-1 and tumor necrosis factor by human mononuclear cells. Cytokine 1991, 3, 189–194. [Google Scholar] [CrossRef]
- Hartmann, G.; Tschöp, M.; Fischer, R.; Bidlingmaier, C.; Riepl, R.; Tschöp, K.; Hautmann, H.; Endres, S.; Toepfer, M. High altitude increases circulating interleukin-6, interleukin-1 receptor antagonist and C-reactive protein. Cytokine 2000, 12, 246–252. [Google Scholar] [CrossRef]
- Sarada, S.; Himadri, P.; Mishra, C.; Geetali, P.; Ram, M.S.; Ilavazhagan, G. Role of oxidative stress and NFκB in hypoxia-induced pulmonary edema. Exp. Biol. Med. (Maywood) 2008, 233, 1088–1098. [Google Scholar] [CrossRef]
- Araneda, O.F.; Tuesta, M. Lung oxidative damage by hypoxia. Oxid. Med. Cell. Longev. 2012, 2012, 856918. [Google Scholar] [CrossRef]
- Mittal, M.; Siddiqui, M.R.; Tran, K.; Reddy, S.P.; Malik, A.B. Reactive oxygen species in inflammation and tissue injury. Antioxid. Redox. Signal. 2014, 20, 1126–1167. [Google Scholar] [CrossRef]
- Liu, Y.; Xiang, D.; Zhang, H.; Yao, H.; Wang, Y. Hypoxia-Inducible Factor-1: A Potential Target to Treat Acute Lung Injury. Oxid. Med. Cell. Longev. 2020, 2020, 8871476. [Google Scholar] [CrossRef] [PubMed]
- El Alam, S.; Pena, E.; Aguilera, D.; Siques, P.; Brito, J. Inflammation in Pulmonary Hypertension and Edema Induced by Hypobaric Hypoxia Exposure. Int. J. Mol. Sci. 2022, 23, 12656. [Google Scholar] [CrossRef] [PubMed]
- Beckman, D.L.; Mehta, P.; Hanks, V.; Rowan, W.H.; Liu, L. Effects of peroxynitrite on pulmonary edema and the oxidative state. Exp. Lung Res. 2000, 26, 349–359. [Google Scholar] [CrossRef]
- Neumann, P.; Gertzberg, N.; Vaughan, E.; Weisbrot, J.; Woodburn, R.; Lambert, W.; Johnson, A. Peroxynitrite mediates TNF-alpha-induced endothelial barrier dysfunction and nitration of actin. Am. J. Physiol. Lung Cell. Mol. Physiol. 2006, 290, L674–L684. [Google Scholar] [CrossRef] [PubMed]
- Caporarello, N.; Ligresti, G. Vascular Contribution to Lung Repair and Fibrosis. Am. J. Respir. Cell. Mol. Biol. 2023, 69, 135–146. [Google Scholar] [CrossRef] [PubMed]
- Elliott, A.R.; Fu, Z.; Tsukimoto, K.; Prediletto, R.; Mathieu-Costello, O.; West, J.B. Short-term reversibility of ultrastructural changes in pulmonary capillaries caused by stress failure. J. Appl. Physiol (1985) 1992, 73, 1150–1158. [Google Scholar] [CrossRef]
- Stenmark, K.R.; Fagan, K.A.; Frid, M.G. Hypoxia-induced pulmonary vascular remodeling: cellular and molecular mechanisms. Circ. Res. 2006, 99, 675–691. [Google Scholar] [CrossRef]
- Su, Y.; Lucas, R.; Fulton, D.J.R.; Verin, A.D. Mechanisms of pulmonary endothelial barrier dysfunction in acute lung injury and acute respiratory distress syndrome. Chin. Med. J. Pulm. Crit. Care Med. 2024, 2, 80–87. [Google Scholar] [CrossRef]
- Jay, S.J. Pleural effusions. 1. Preliminary evaluation--recognition of the transudate. Postgrad. Med. 1986, 80, 164–167. [Google Scholar] [CrossRef]
- Light, R.W.; Macgregor, M.I.; Luchsinger, P.C.; Ball, W.C. Jr. Pleural effusions: the diagnostic separation of transudates and exudates. Ann. Intern. Med. 1972, 77, 507–513. [Google Scholar] [CrossRef]
- Schoene, R.B.; Hackett, P.H.; Henderson, W.R.; Sage, E.H.; Chow, M.; Roach, R.C.; Mills, W.J. Jr.; Martin, T.R. High-altitude pulmonary edema. Characteristics of lung lavage fluid. JAMA 1986, 256, 63–69. [Google Scholar] [CrossRef]
- West, J.B.; Mathieu-Costello, O. Structure.; strength.; failure.; and remodeling of the pulmonary blood-gas barrier. Annu. Rev. Physiol. 1999, 61, 543–572. [Google Scholar] [CrossRef]
- Hopkins, S.R.; Schoene, R.B.; Henderson, W.R.; Spragg, R.G.; Martin, T.R.; West, J.B. Intense exercise impairs the integrity of the pulmonary blood-gas barrier in elite athletes. Am. J. Respir. Crit. Care Med. 1997, 155, 1090–1094. [Google Scholar] [CrossRef]
- Eldridge, M.W.; Braun, R.K.; Yoneda, K.Y.; Walby, W.F. Effects of altitude and exercise on pulmonary capillary integrity: evidence for subclinical high-altitude pulmonary edema. J. Appl. Physiol (1985) 2006, 100, 972–980. [Google Scholar] [CrossRef]
- Duplain, H.; Vollenweider, L.; Delabays, A.; Nicod, P.; Bärtsch, P.; Scherrer, U. Augmented sympathetic activation during short-term hypoxia and high-altitude exposure in subjects susceptible to high-altitude pulmonary edema. Circulation 1999, 99, 1713–1718. [Google Scholar] [CrossRef]
- Rassler, B.; Rohling, M.A.; Reissig, C.; Briest, W.; Tannapfel, A.; Zimmer, H.G. Involvement of cytokines and inflammation in catecholamine-induced pulmonary injury in rats. Vasc. Dis. Prev. 2005, 2, 1–9. [Google Scholar] [CrossRef]
- Haditsch, B.; Roessler, A.; Krisper, P.; Frisch, H.; Hinghofer-Szalkay, H.G.; Goswami, N. Volume regulation and renal function at high altitude across gender. PLoS One 2015, 10, e0118730. [Google Scholar] [CrossRef]
- Hildebrandt, W.; Ottenbacher, A.; Schuster, M.; Swenson, E.R.; Bärtsch, P. Diuretic effect of hypoxia, hypocapnia, and hyperpnea in humans: relation to hormones and O(2) chemosensitivity. J. Appl. Physiol (1985) 2000, 88, 599–610. [Google Scholar] [CrossRef] [PubMed]
- Bärtsch, P.; Swenson, E.R.; Paul, A.; Jülg, B.; Hohenhaus, E. Hypoxic ventilatory response, ventilation, gas exchange, and fluid balance in acute mountain sickness. High Alt. Med. Biol. 2002, 3, 361–376. [Google Scholar] [CrossRef]
- Mortola, J.P.; Saiki, C. Ventilatory response to hypoxia in rats: Gender differences. Respir. Physiol. 1996, 106, 21–34. [Google Scholar] [CrossRef] [PubMed]
- Dzhalilova, D.; Makarova, O. Differences in Tolerance to Hypoxia: Physiological, Biochemical, and Molecular-Biological Characteristics. Biomedicines 2020, 8, 428. [Google Scholar] [CrossRef]
- Pichler Hefti, J.; Jean, D.; Rosier, A.J.; Derstine, M.; Hillebrandt, D.; Horakova, L.; Keyes, L.E.; Mateikaite-Pipiriene, K.; Paal, P.; Andjelkovic, M.; Beidlemann, B.A.; Kriemler, S. High-Altitude Pulmonary Edema in Women: A Scoping Review-UIAA Medical Commission Recommendations. High Alt. Med. Biol. 2023, 24, 268–273. [Google Scholar] [CrossRef]
- West, J. B; American College of Physicians; American Physiological Society. The physiologic basis of high-altitude diseases. Ann. Intern. Med. 2004, 141, 789–800. [Google Scholar] [CrossRef]
Figure 1.
Pulmonary edema and pulmonary blood congestion. Representative histological images (50✕magnification) from: A: N-NaCl, mild to moderate PE, moderate congestion; B: N-NaCl+R, moderate PE, moderate congestion; C: H-NaCl, moderate PE, moderate congestion; D: H-NaCl+R, severe PE, severe congestion; E: N-NE, moderate PE, moderate congestion; F: N-NE+R, moderate PE, severe congestion; G: H-NE, mild PE, moderate congestion; H: H-NE+R, severe PE, moderate congestion; pulmonary edema is indicated by black arrows, blood congestion is indicated by white arrows. I: Pulmonary edema index (PEI); K: Congestion index, both expressed in arbitrary units. Data are given as means ± SEM. Significant differences: vs. N-NaCl: * p < 0.05, ** p < 0.01; vs. corresponding treatment group: °° p < 0.01.
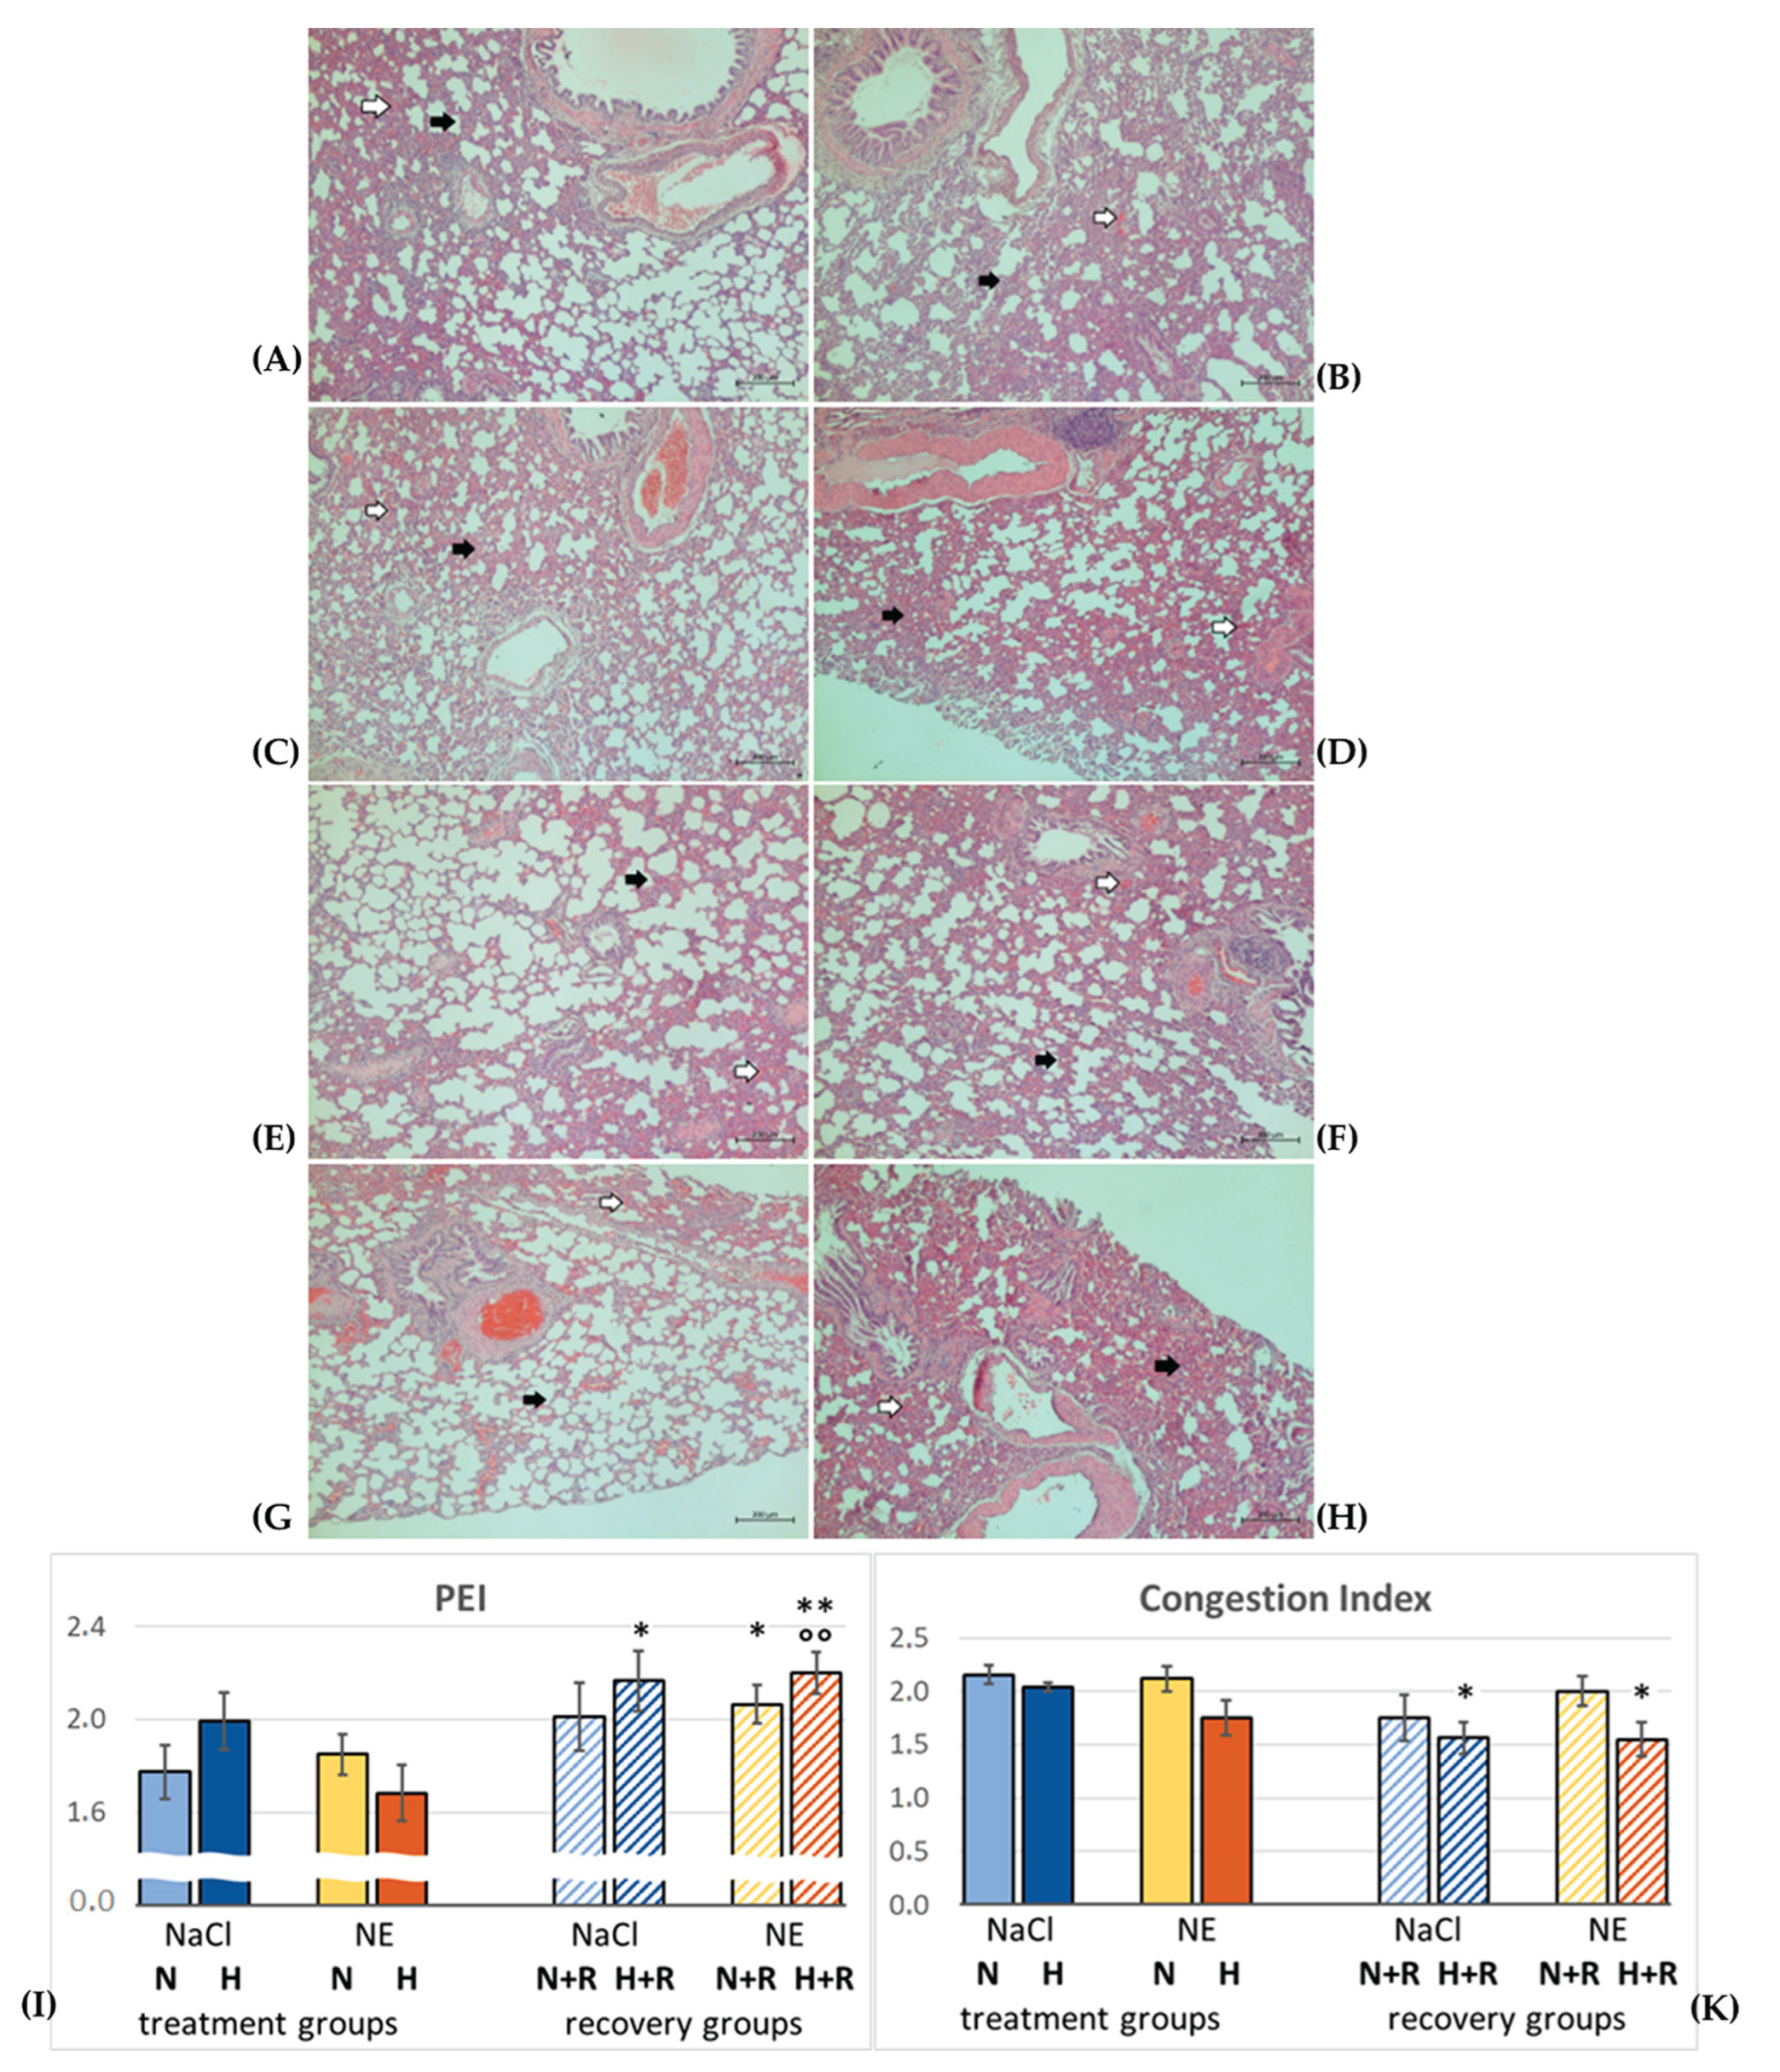
Figure 2.
Lymphocyte accumulation in the lung. Representative histological images (50✕magnification) from: A: N-NaCl: no prominent lymphocyte accumulations; B: H-NaCl; C: H-NE. Lymphocyte accumulations can be found in the peribronchial regions as marked by black arrows.
Figure 2.
Lymphocyte accumulation in the lung. Representative histological images (50✕magnification) from: A: N-NaCl: no prominent lymphocyte accumulations; B: H-NaCl; C: H-NE. Lymphocyte accumulations can be found in the peribronchial regions as marked by black arrows.
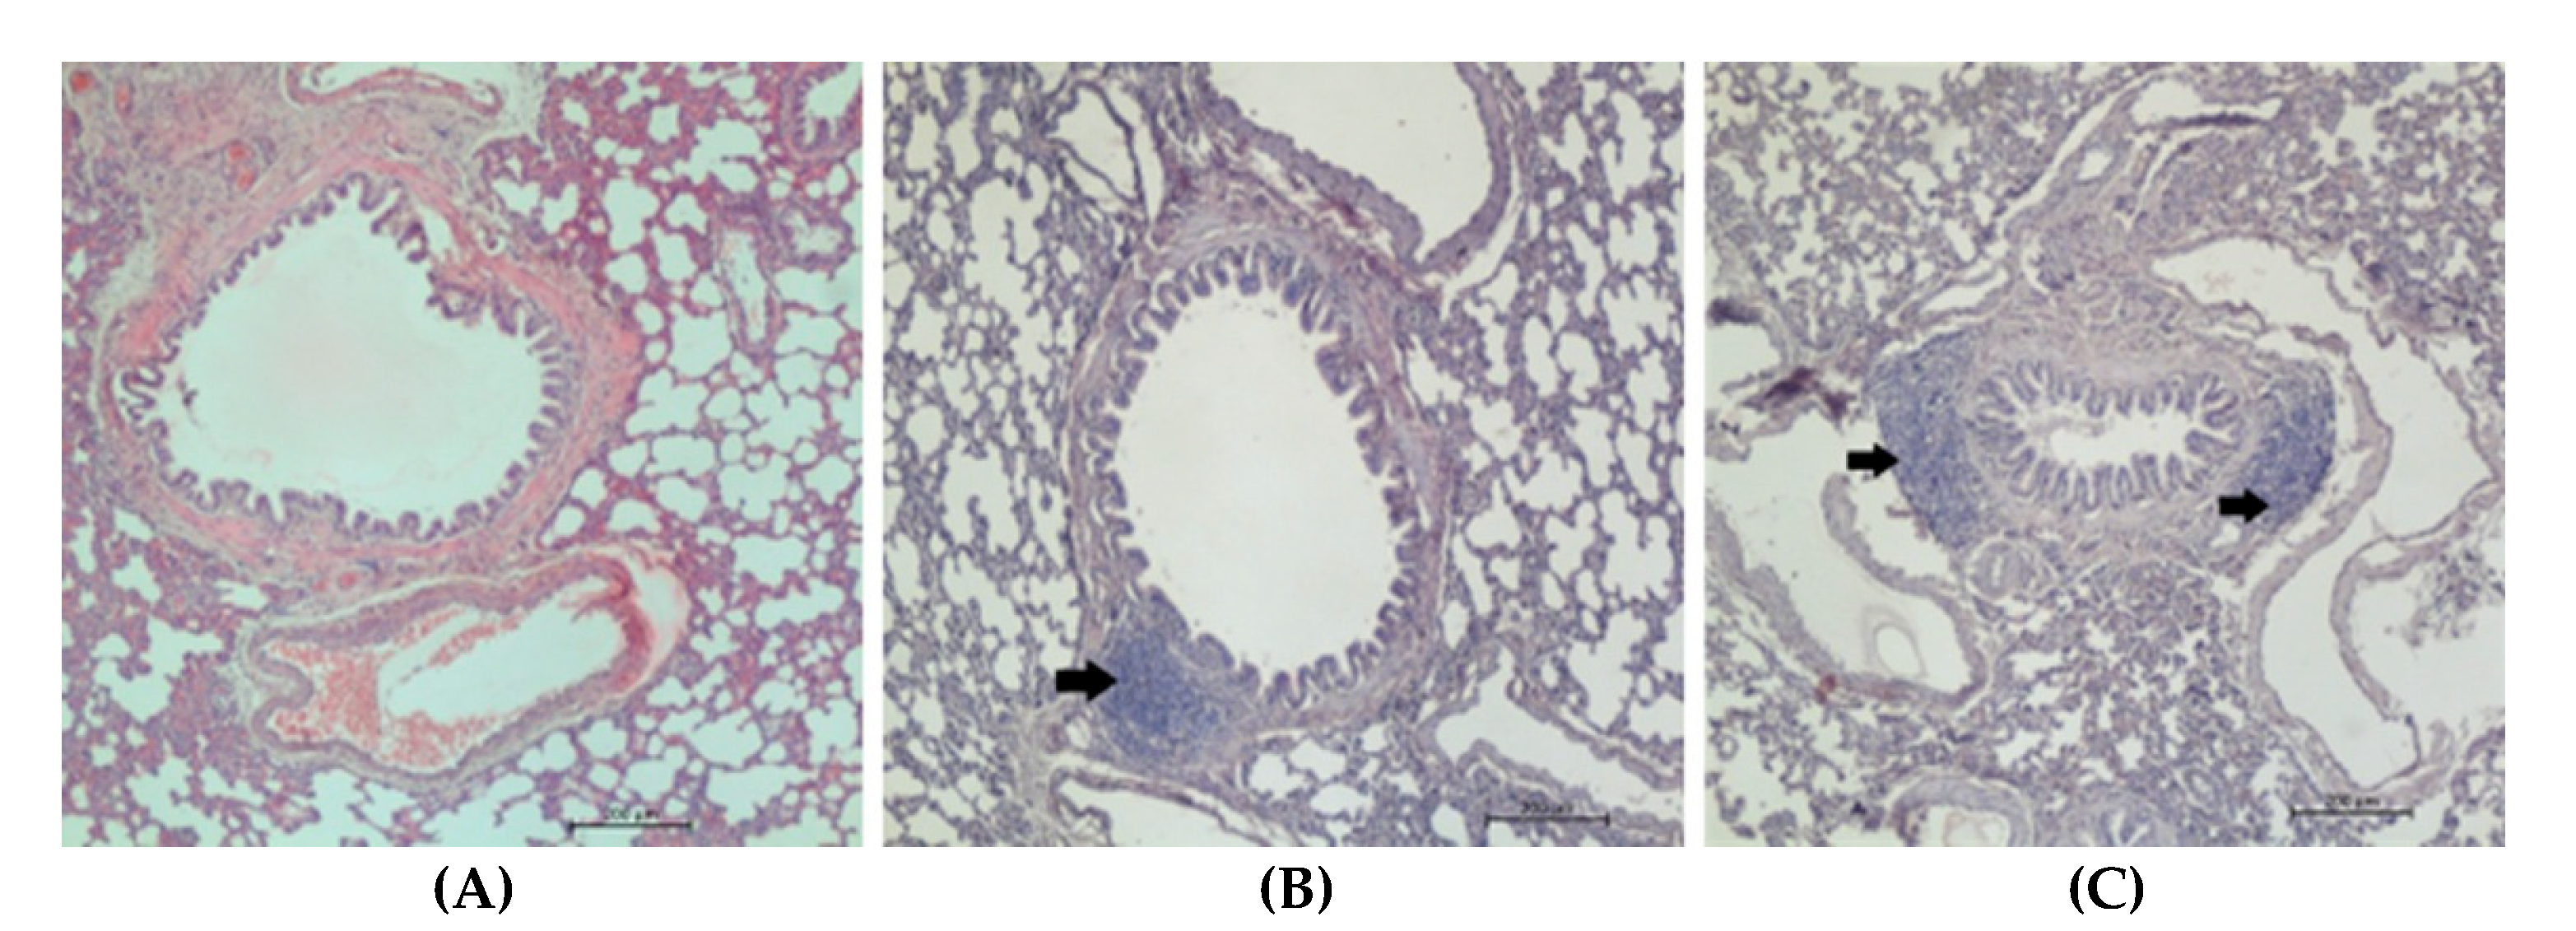
Figure 3.
Tumor necrosis factor alpha (TNFα) in the lung. Representative immunohistological images (200✕magnification) from: A: N-NaCl; B: N-NaCl+R; C: H-NaCl; D: H-NaCl+R; E: N-NE; F: N-NE+R; G: H-NE; H: H-NE+R. TNFα is mainly located in peribronchial cells as marked by black arrows. I: abundance of TNFα in the groups expressed as positive area related to the bronchial surface area of the specimen [%]. Data are given as means ± SEM. Significant differences: vs. N-NaCl: ** p < 0.01; vs. N-NE: +++ p < 0.001; vs. corresponding treatment group: ° p < 0.05, °°° p < 0.001.
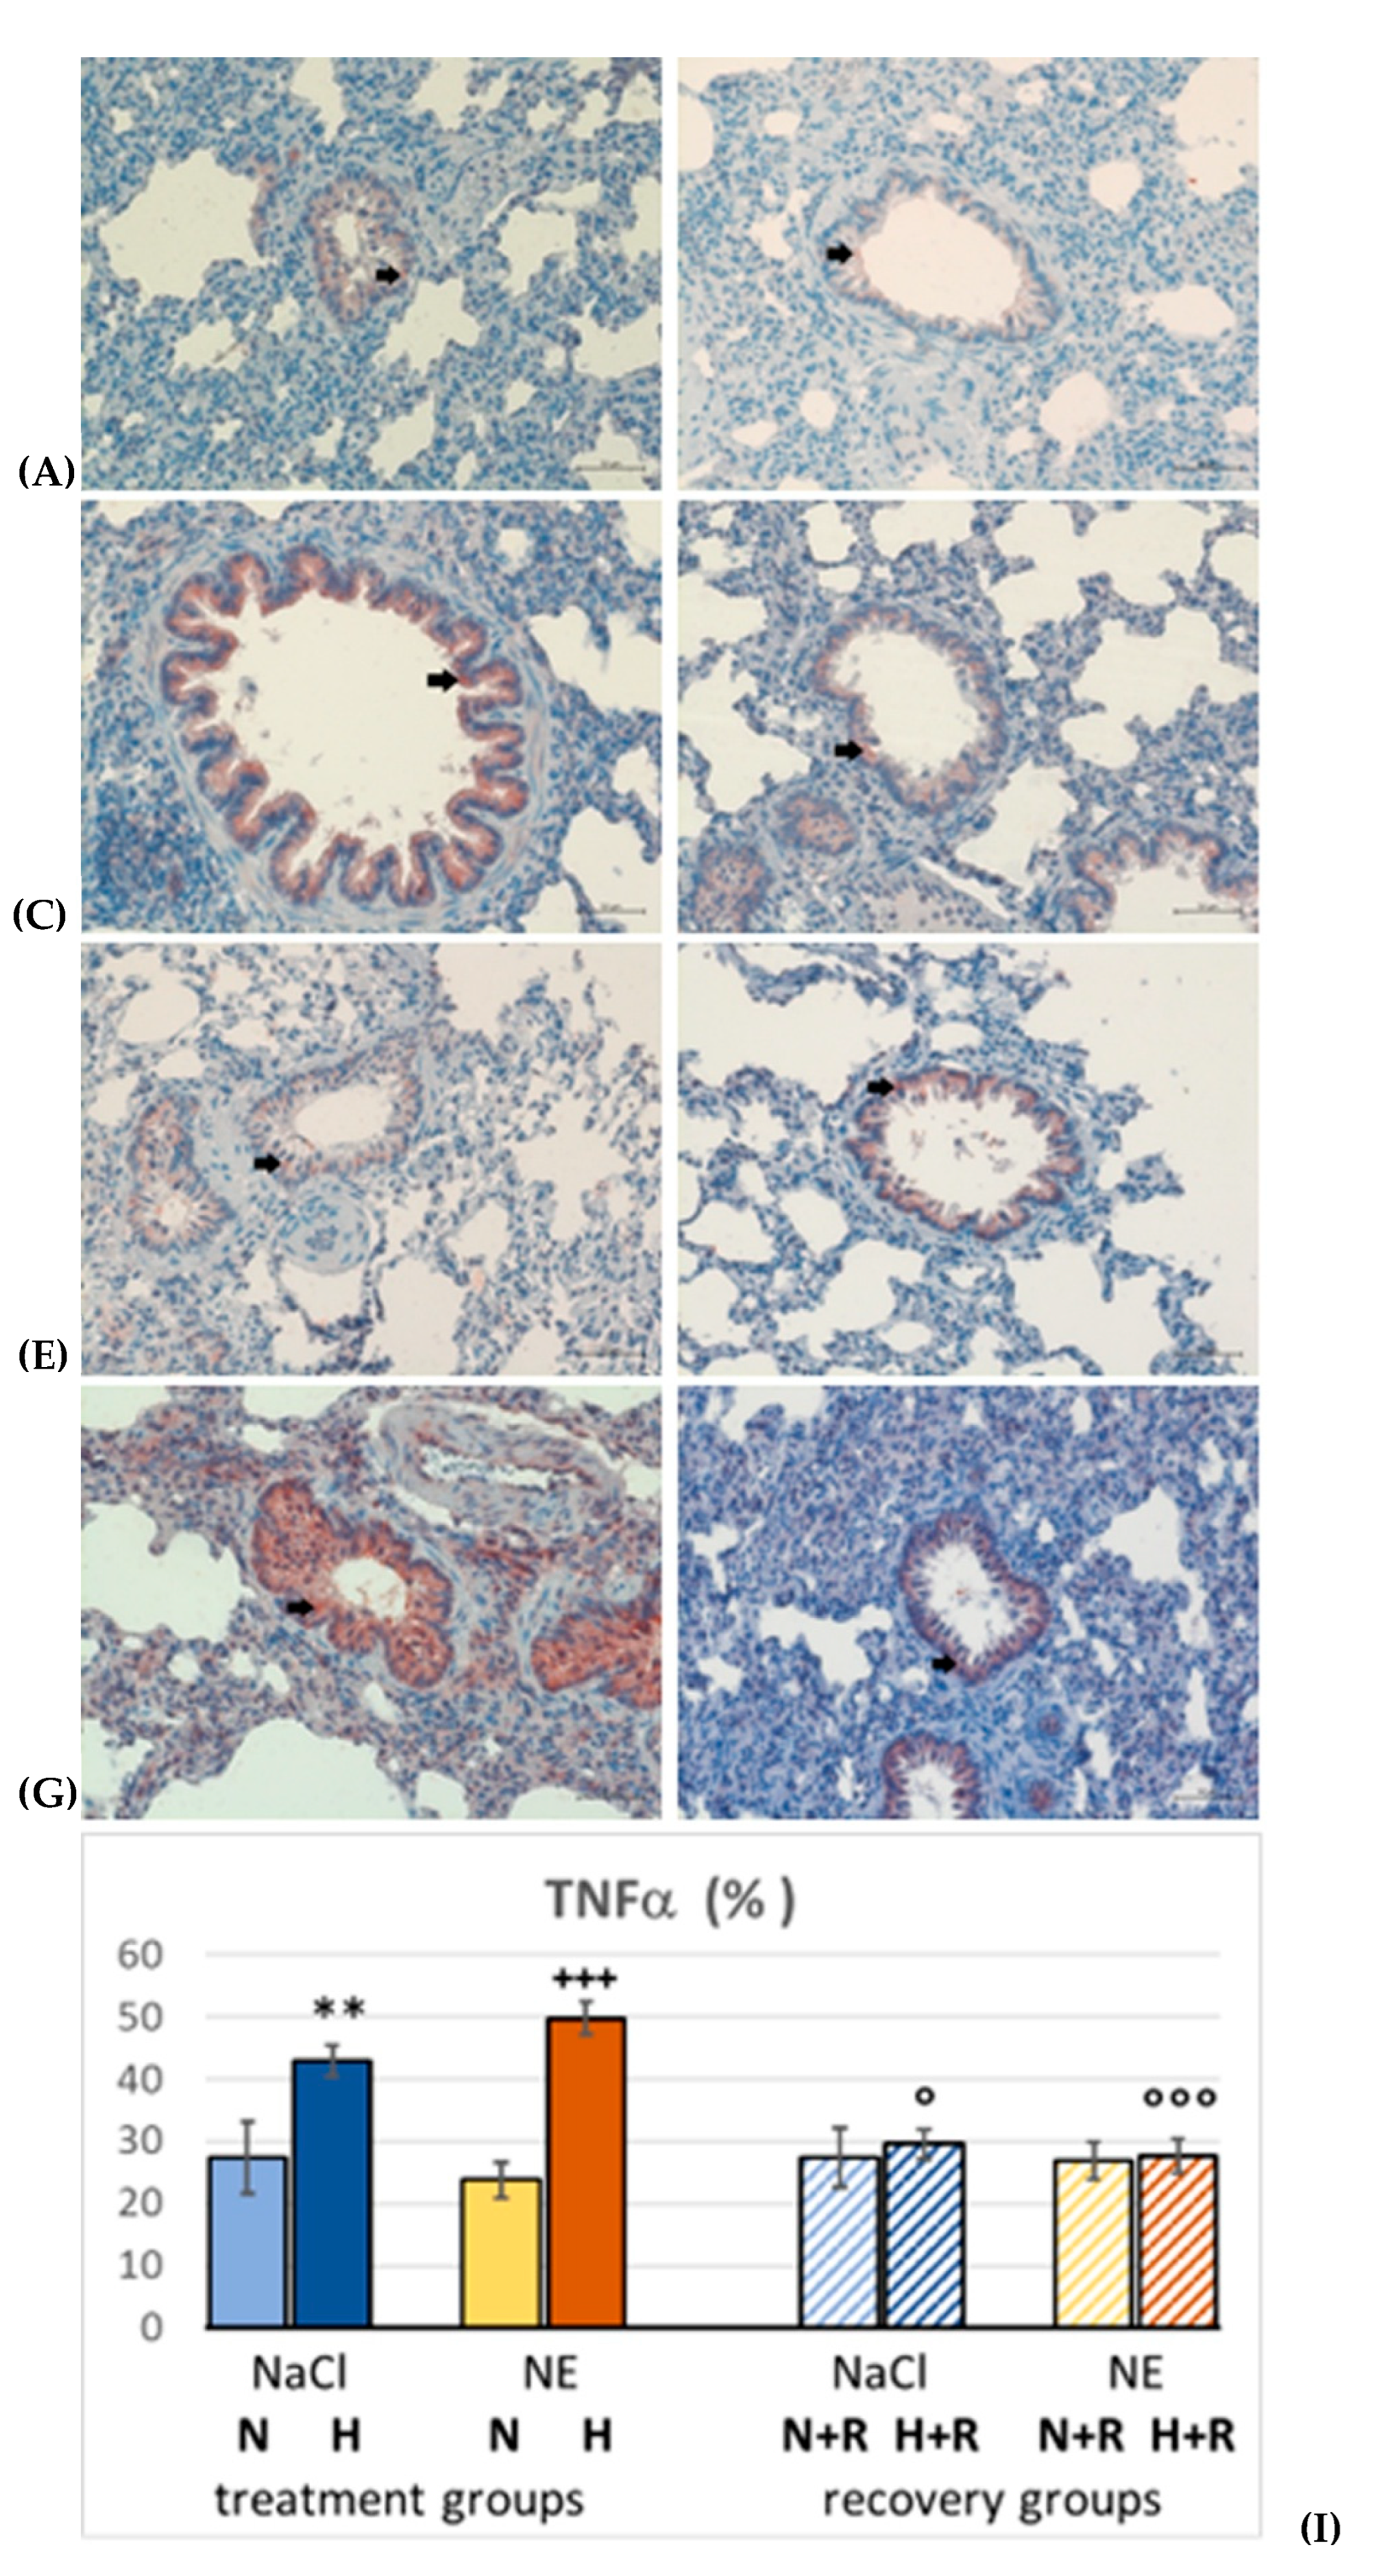
Figure 4.
Nitrotyrosine (NT) in the lung. Representative immunohistological images (50✕magnification) from: A: N-NaCl; B: N-NaCl+R; C: H-NaCl; D: H-NaCl+R; E: N-NE; F: N-NE+R; G: H-NE; H: H-NE+R. NT is located in both peribronchial cells and the entire interstitium as marked by black arrows. I: abundance of NT in the groups expressed as positive area related to the total lung area of the specimen [%]. Data are given as means ± SEM. Significant differences vs. N-NaCl: * p < 0.05.
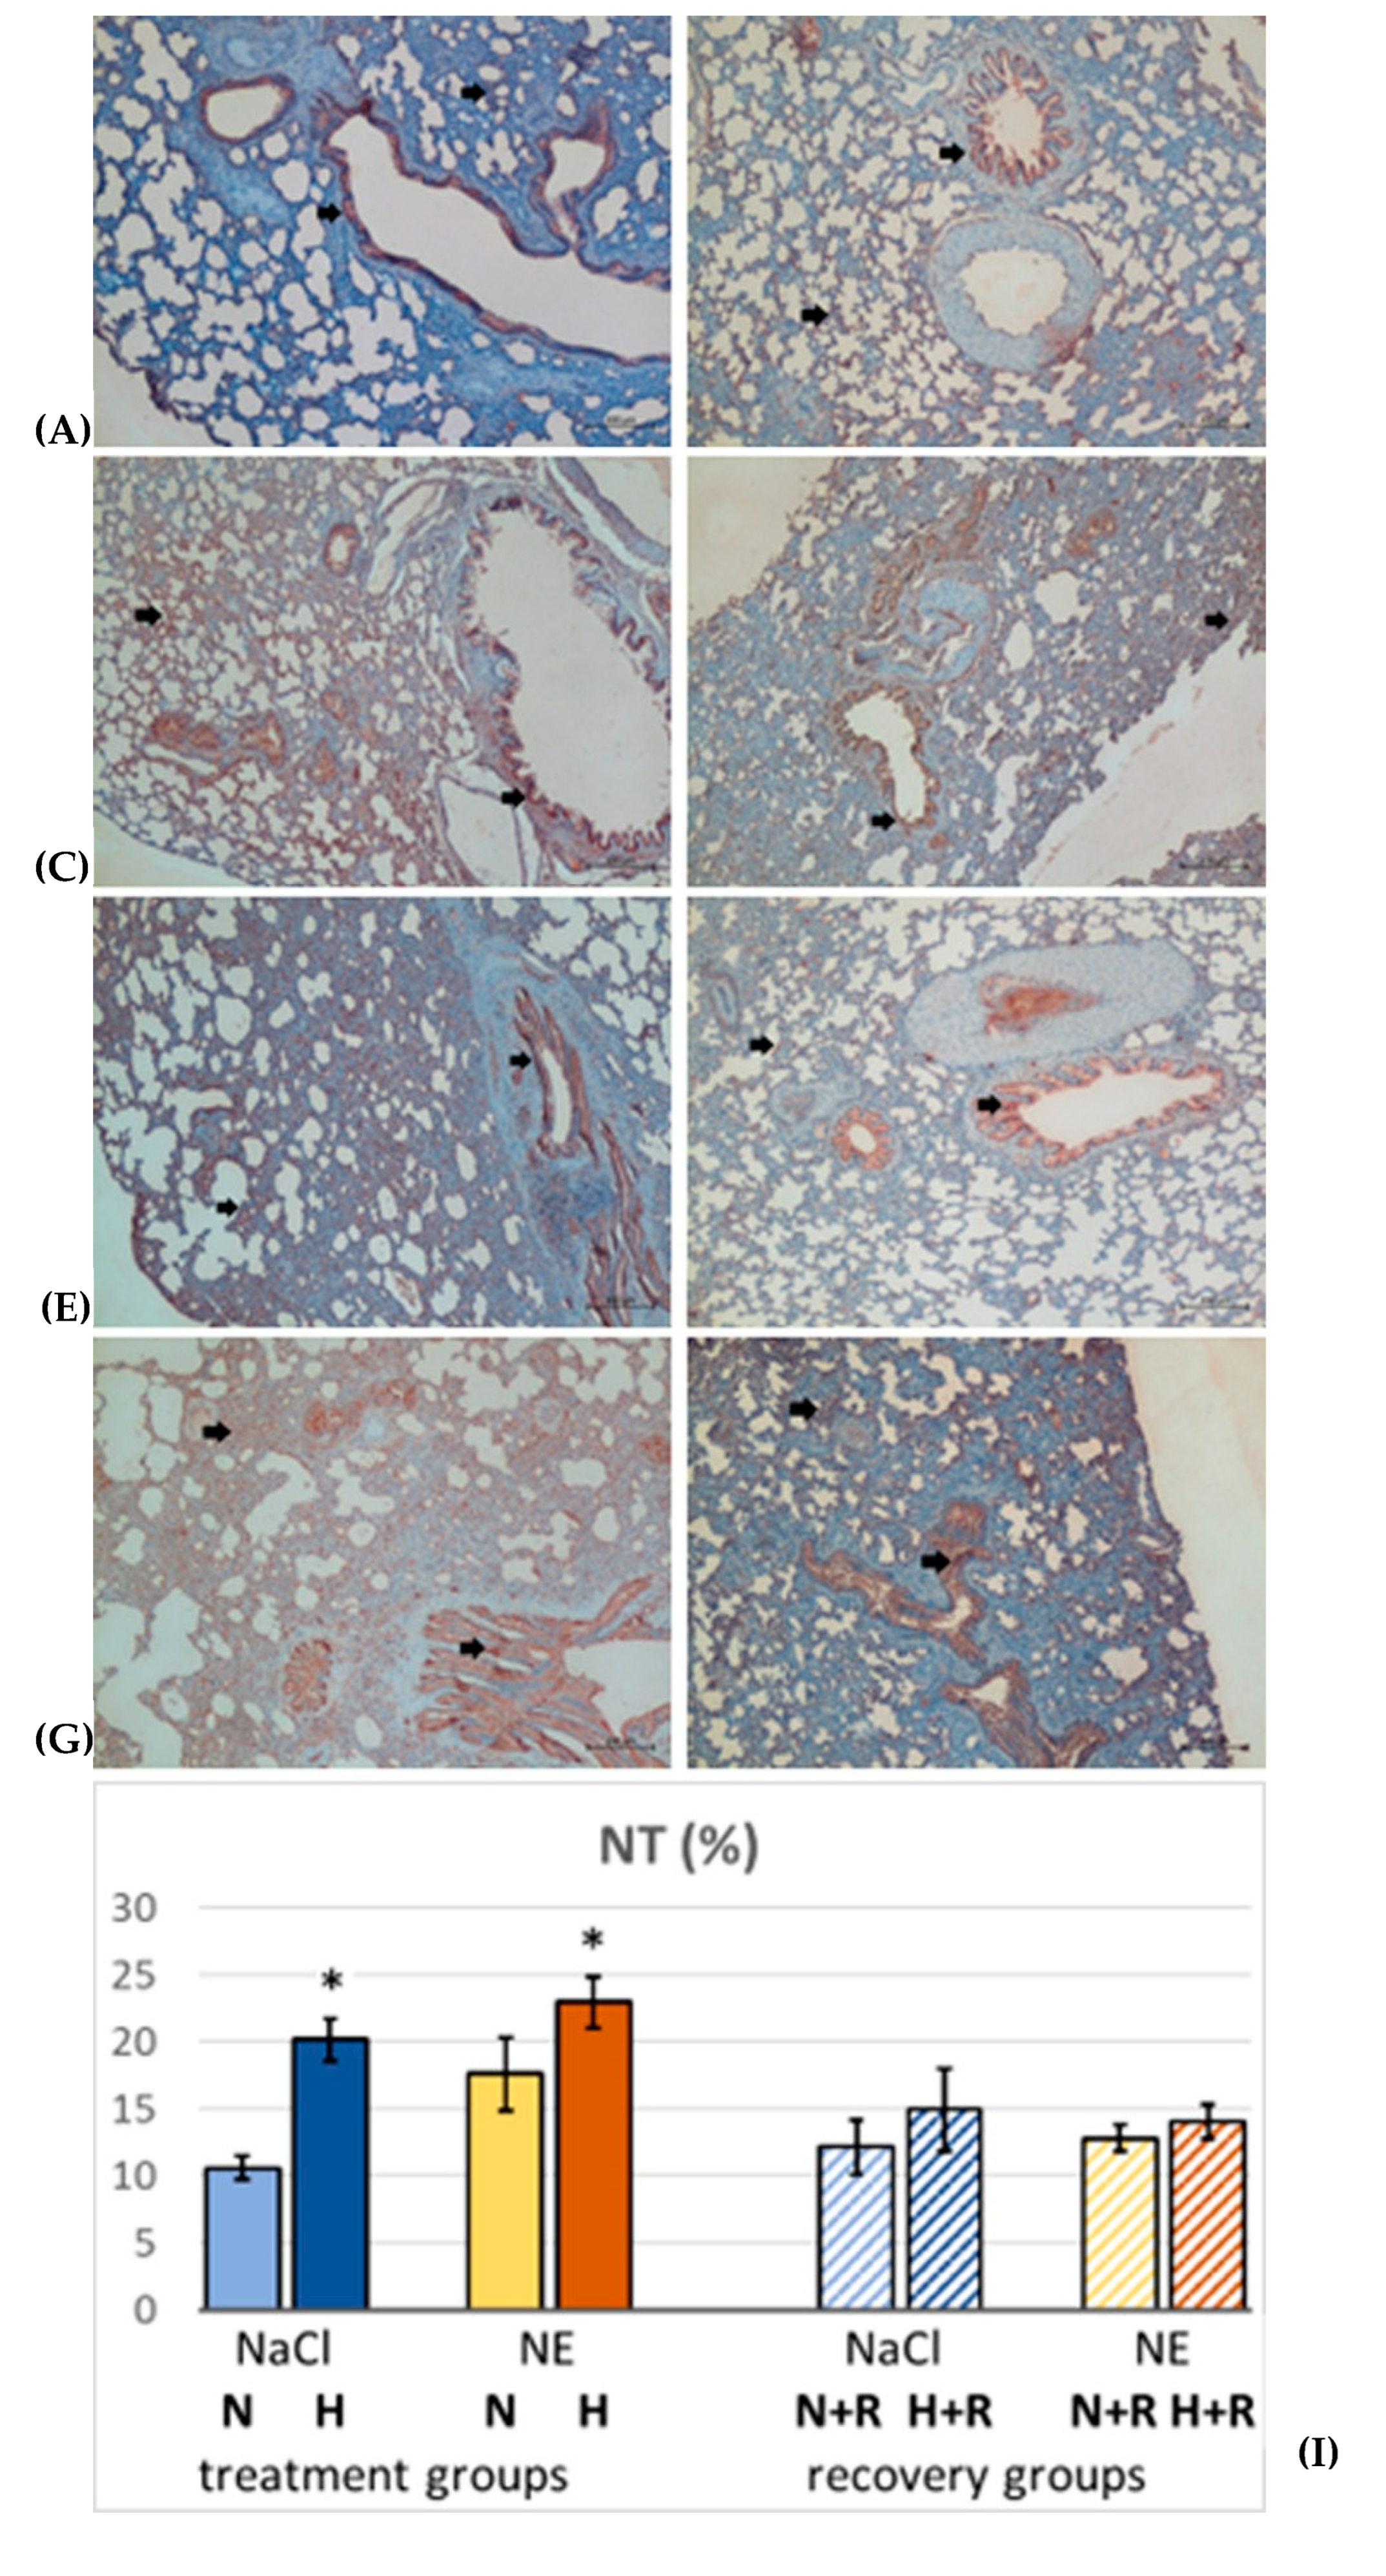
Figure 5.
Pleural fluid volume [mL]. Data are given as means ± SEM.
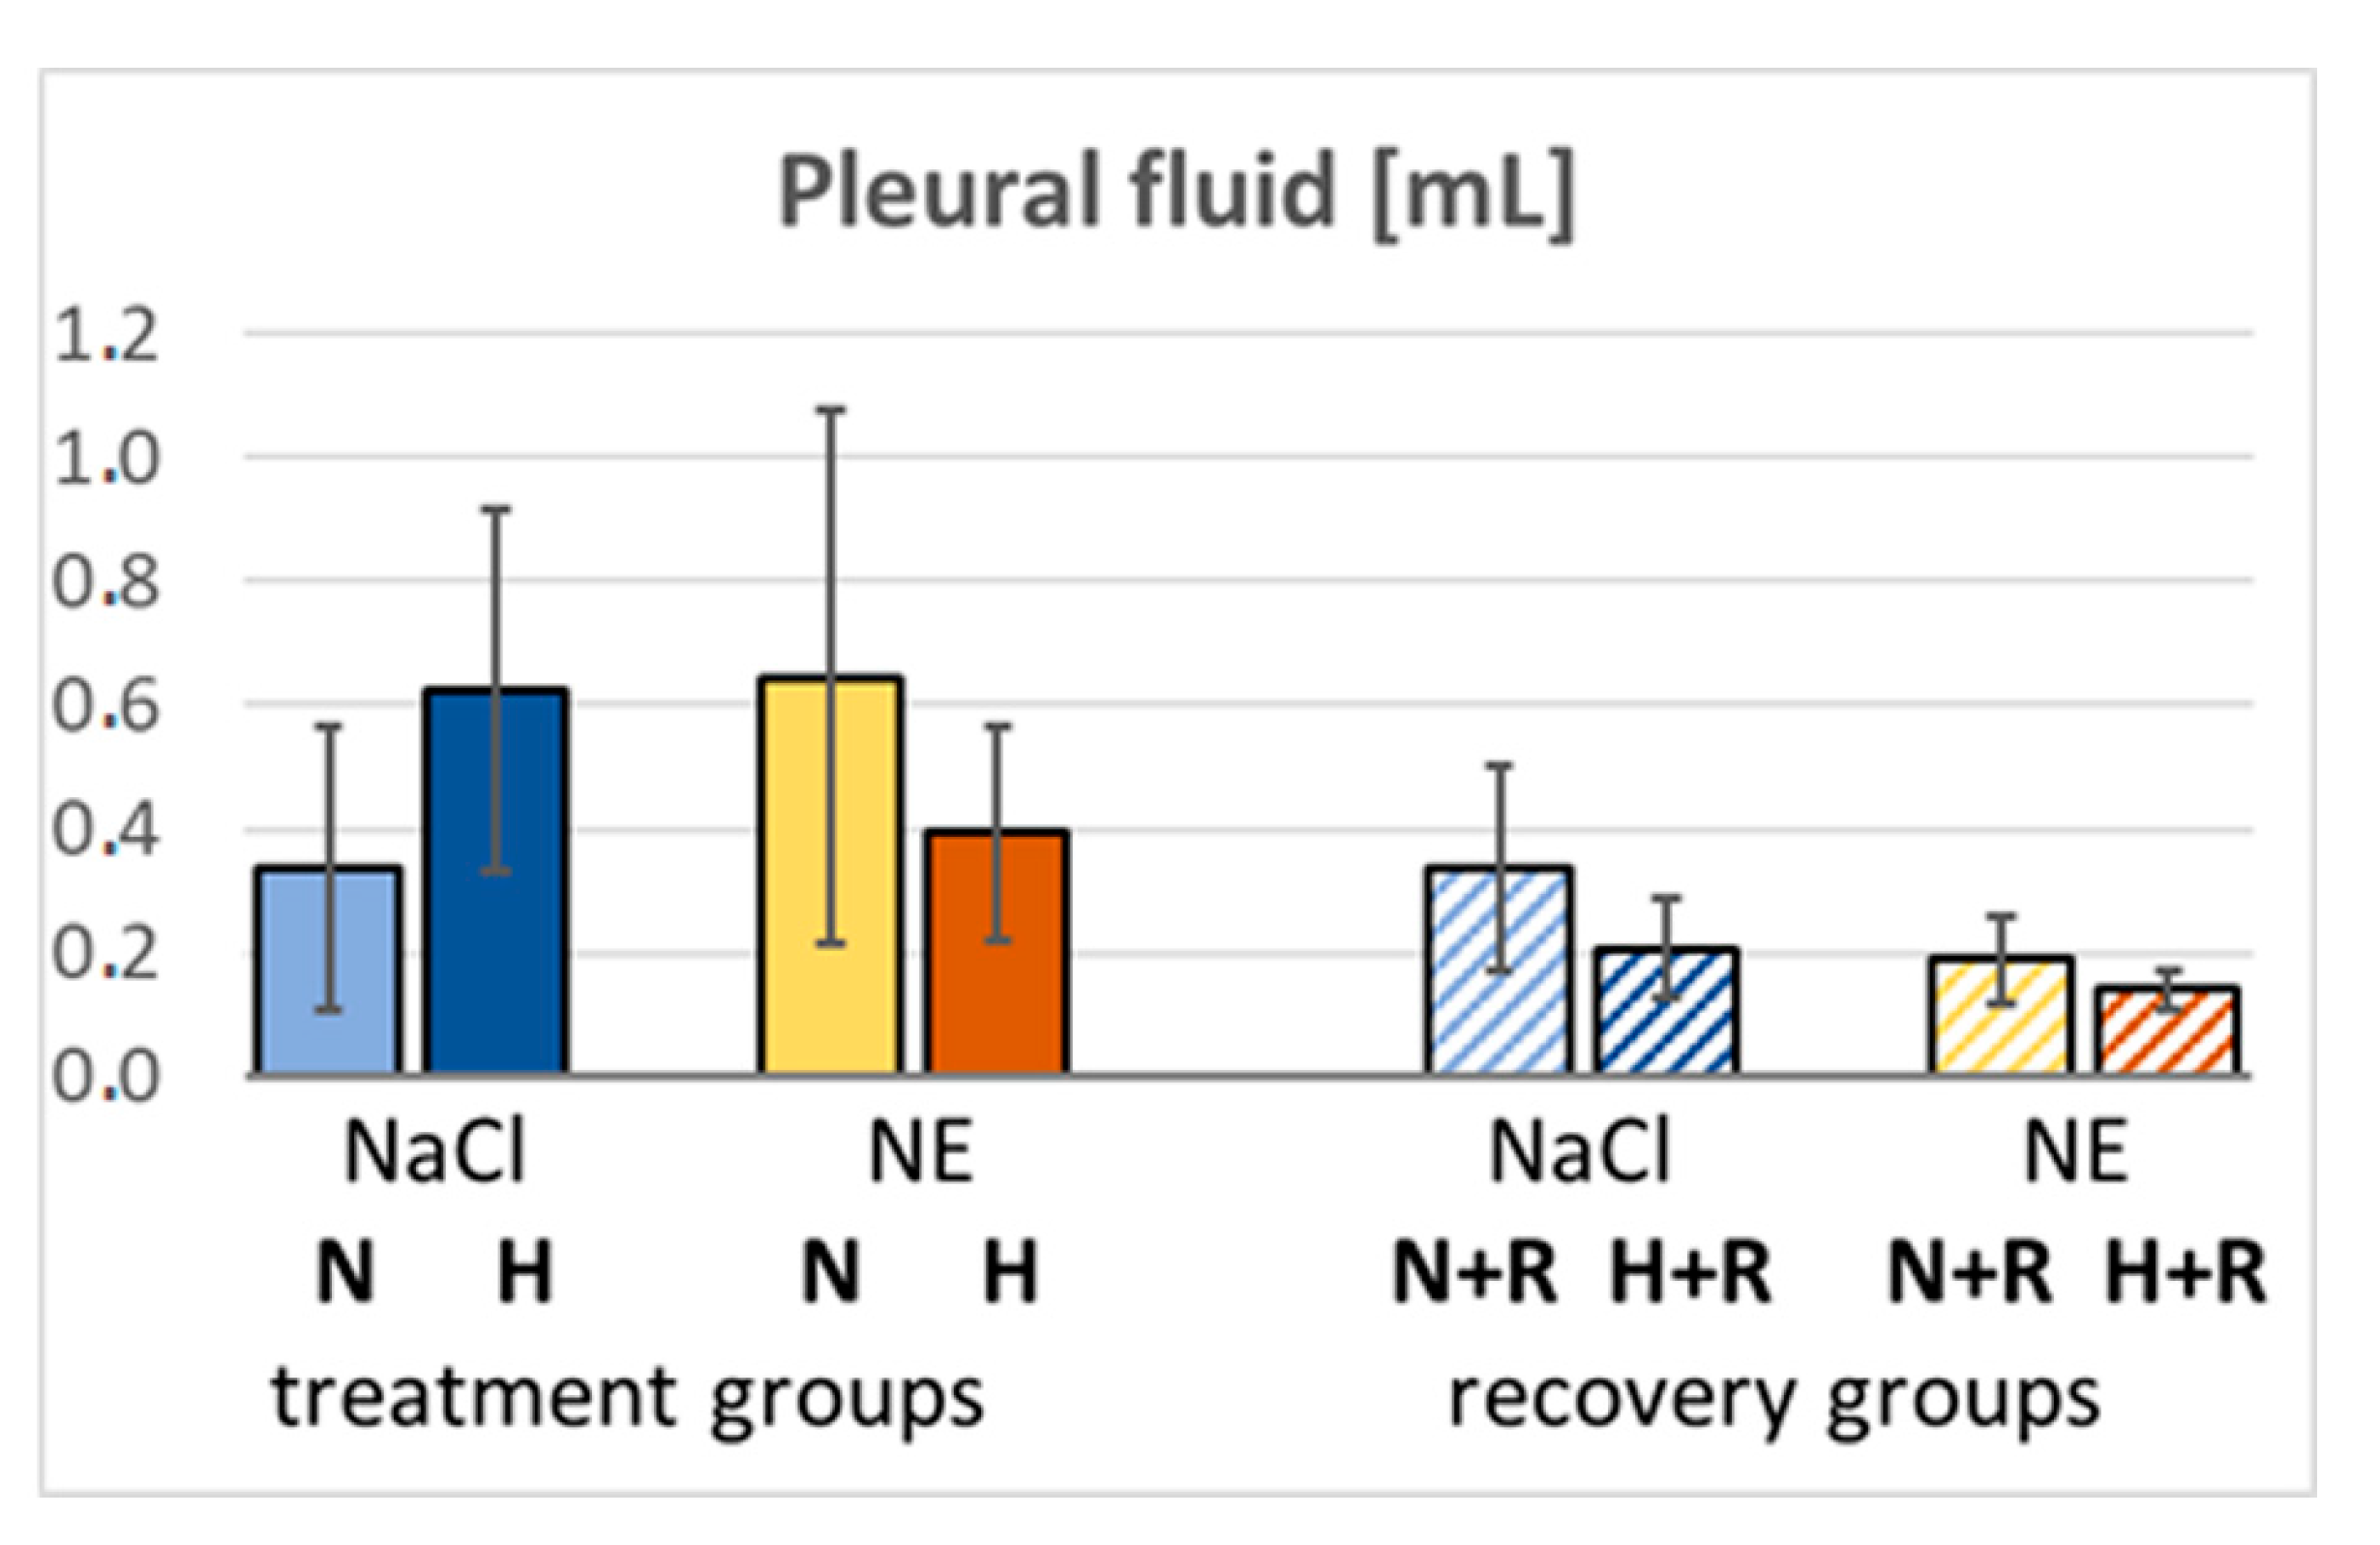
Figure 6.
Protein concentrations [P] and protein concentration ratios. A: [P] in pleural fluid (PF), in g/L; B: Protein concentration ratio between PF and serum (S); C: [P] in bronchoalveolar lavage fluid (BALF), in g/L; D: Protein concentration ratio between BALF and serum (S); E: [P] in serum (S), in g/L. Data are given as mean ± SEM. Significant differences: vs. N-NaCl: * p < 0.05, ** p < 0.01, *** p < 0.001; vs. H-NaCl: # p < 0.05, ## p < 0.01, ### p < 0.001; vs. H-NaCl+R: p < 0.05, p < 0.01.
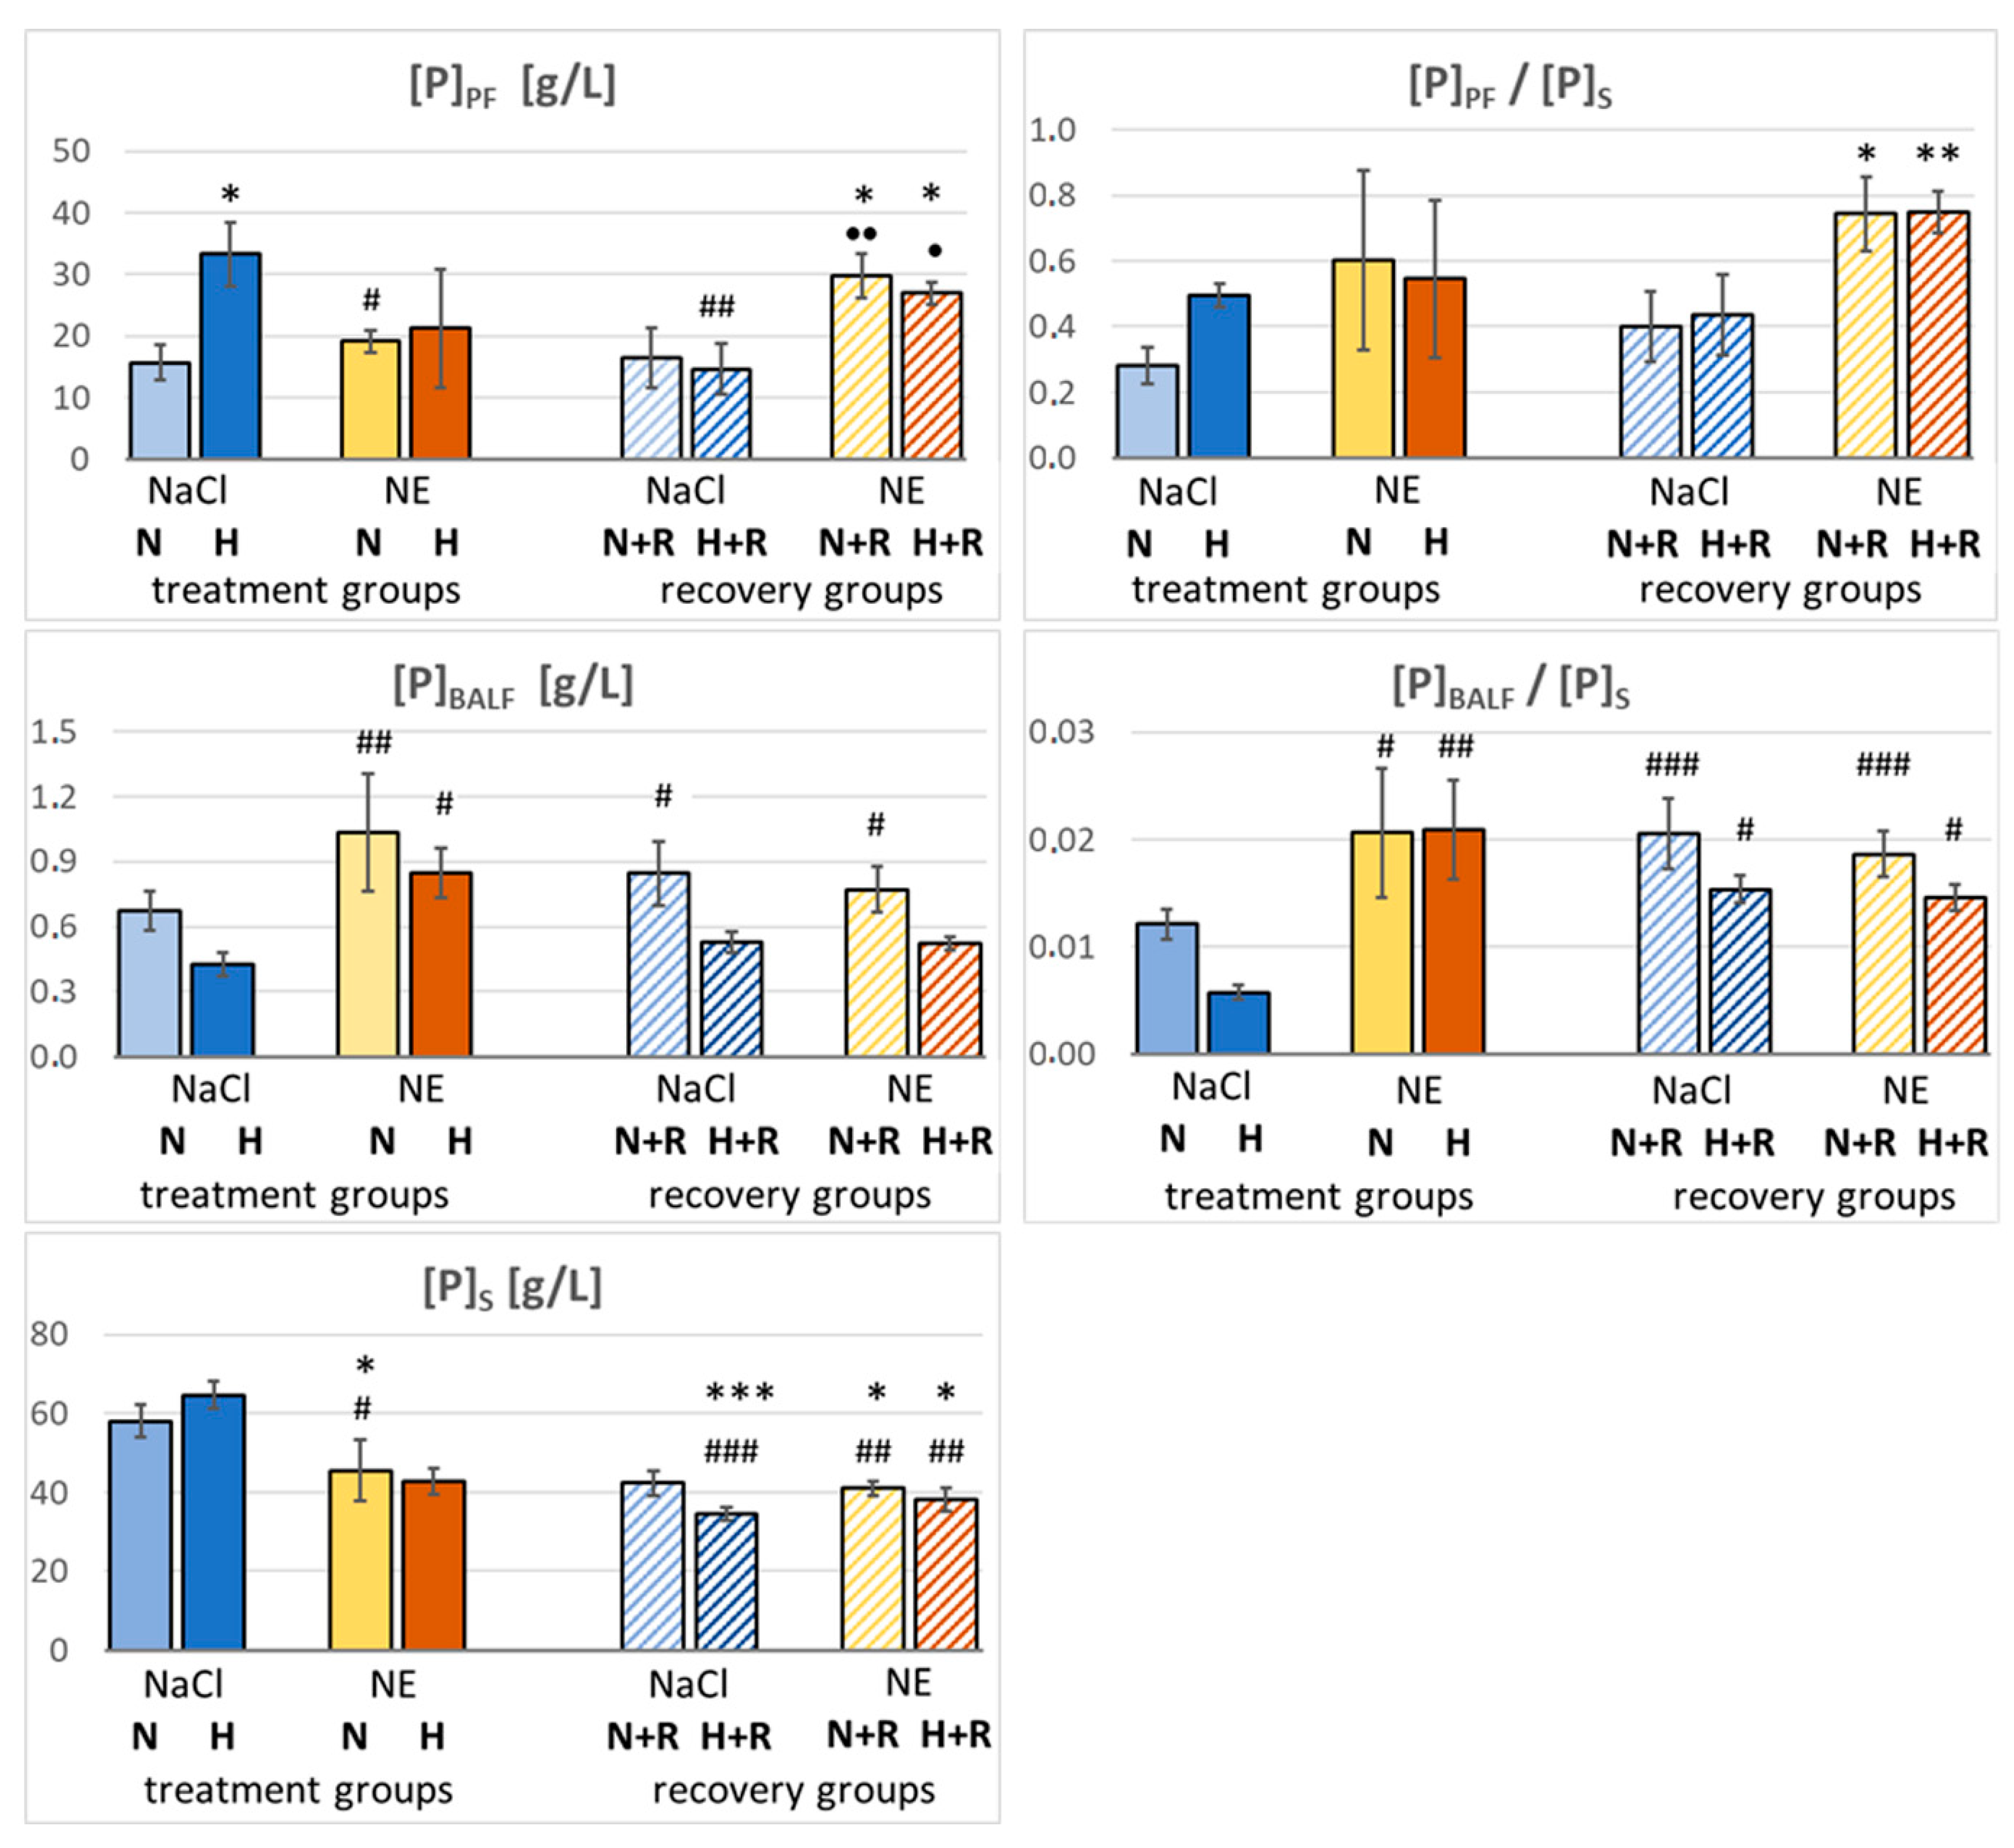
Figure 7.
Ratio of right to left ventricular systolic pressure (RVSP/LVSP) indicating imbalance between systolic functions of RV and LV. Significant differences: vs. N-NaCl: * p < 0.05, *** p < 0.001; vs. corresponding treatment group: ° p < 0.05.
Figure 7.
Ratio of right to left ventricular systolic pressure (RVSP/LVSP) indicating imbalance between systolic functions of RV and LV. Significant differences: vs. N-NaCl: * p < 0.05, *** p < 0.001; vs. corresponding treatment group: ° p < 0.05.
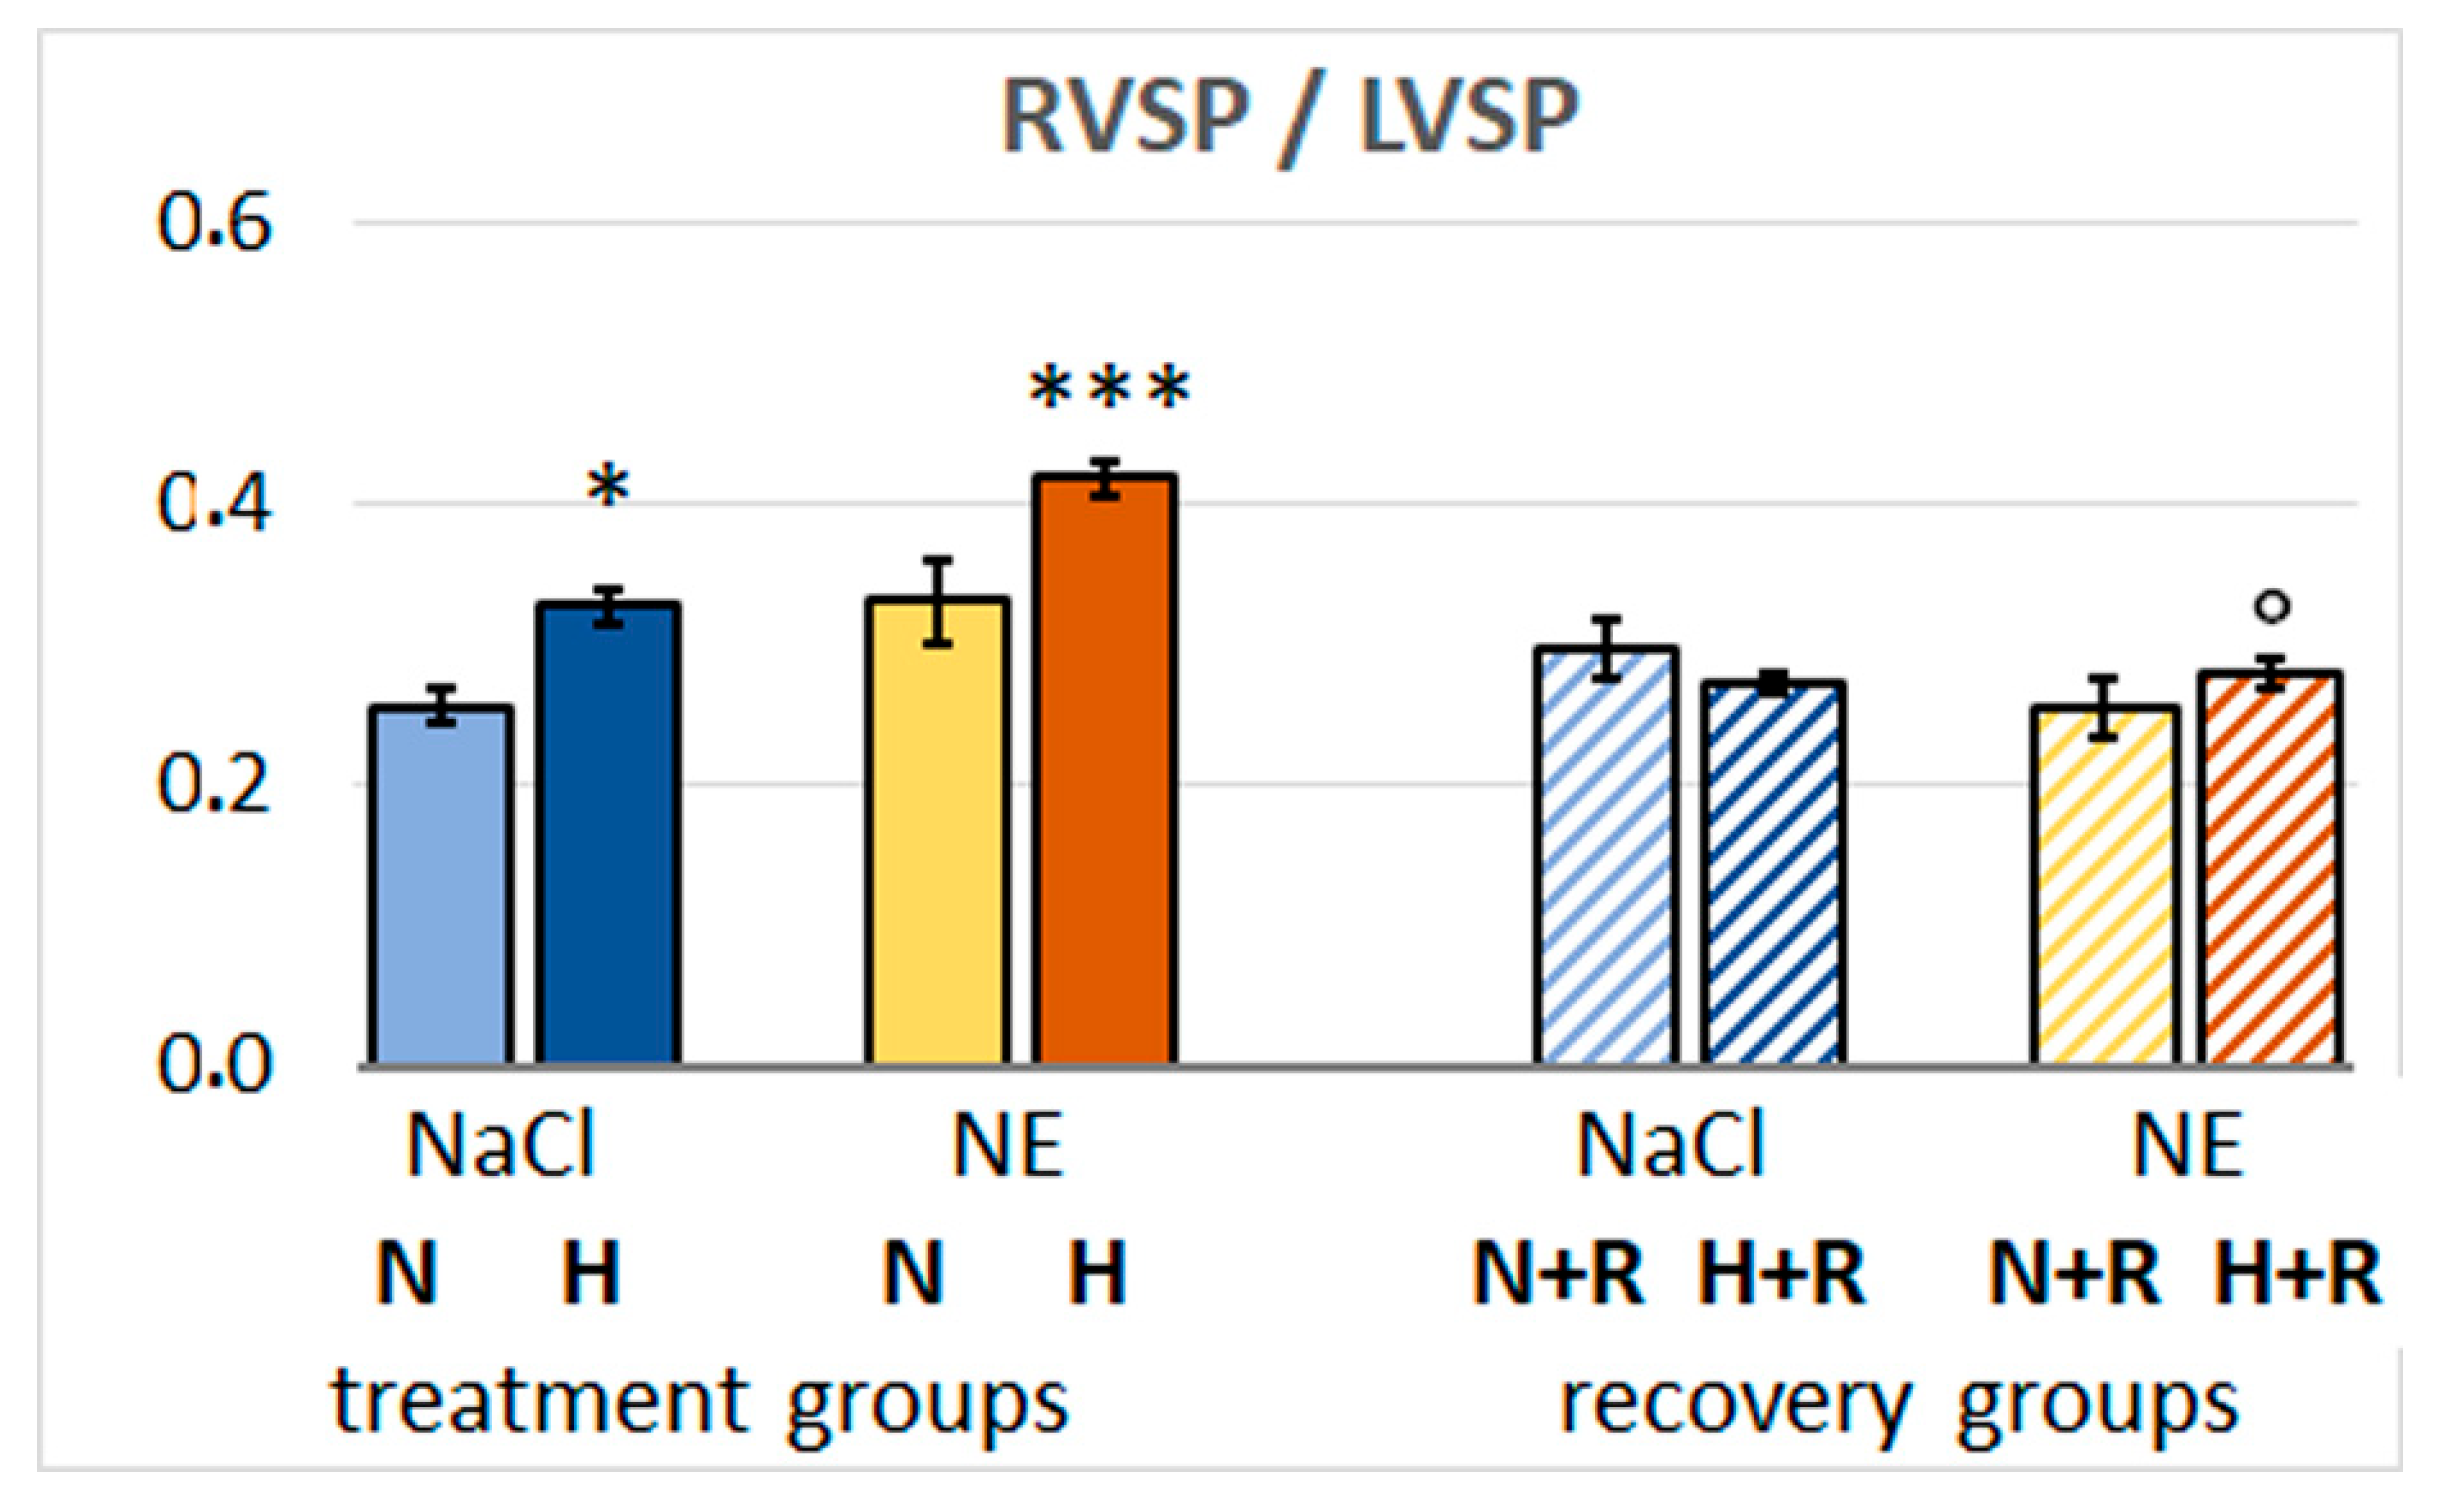

Table 1.
Hemodynamic data.
| --------------Treatment groups -------------- | --------------Recovery groups -------------- | |||||||
|---|---|---|---|---|---|---|---|---|
| N-NaCl | H-NaCl | N-NE | H-NE | N-NaCl +R |
H-NaCl +R |
N-NE +R |
H-NE +R |
|
| LVSP [mmHg] | 123.3 ± 3.4 # |
103.5 ± 3.8 * |
106.7 ± 4.1 * |
92.1 ± 3.4 *#+ |
102.0 ± 5.5 $° |
123.8 ± 3.8 §° |
131.1 ± 3.8 #§° |
120.9 ± 3.3 #§° |
| RVSP [mmHg] | 30.9 ± 0.9 |
34.3 ± 1.5 |
34.5 ± 2.4 |
38.5 ± 1.5 |
30.1 ± 2.7 |
33.9 ± 1.2 |
33.0 ± 1.8 |
33.7 ± 1.1 |
| MAP [mmHg] | 109.6 ± 3.5 # |
91.4 ± 3.6 * |
94.7 ± 4.0 * |
77.9 ± 3.0 *#+ |
91.4 ± 5.6 $° |
111.9 ± 3.2 §° |
117.2 ± 3.5 #§° |
108.0 ± 2.9 #§° |
| SV [µL] | 215.3 ± 7.2 |
185.6 ± 11.6 | 161.6 ± 11.5 * | 131.2 ± 20.0 *#+ |
215.5 ± 13.9 | 214.2 ± 18.5 | 192.3 ± 23.5 §$ | 220.1 ± 7.9 ° |
| HR [min-1] | 441.8 ± 8.1 # |
410.4 ± 8.3 * |
451.0 ± 10.5 | 436.2 ± 8.6 |
431.3 ± 13.0 | 457.0 ± 12.0 ° | 423.4 ± 7.0 $° |
415.8 ± 9.4 $ |
| CI [mL min-1 kg-1] | 397.7 ± 16.7 | 334.9 ± 18.5 | 299.9 ± 19.0 | 223.8 ± 32.5 * | 392.4 ± 24.1 | 388.5 ± 29.1 | 316.5 ± 29.3 | 357.6 ± 14.2 |
| LV edP [mmHg] | 5.93 ± 0.54 |
6.38 ± 0.35 |
4.58 ± 0.38 |
8.08 ± 0.43 + |
5.24 ± 1.74 |
5.20 ± 0.59 |
5.58 ± 0.39 |
5.68 ± 0.86 |
| TPR [mmHg min kg mL-1] | 0.29 ± 0.01 |
0.27 ± 0.02 |
0.33 ± 0.02 |
0.43 ± 0.08 |
0.24 ± 0.02 |
0.30 ± 0.02 |
0.41 ± 0.06 § |
0.31 ± 0.01 |
LVSP, left ventricular systolic pressure; RVSP, right ventricular systolic pressure; MAP, mean aortic pressure; SV, stroke volume; HR, heart rate; CI, cardiac index; LV edP, left ventricular enddiastolic pressure; TPR, total peripheral resistance. Significance symbols: * significant vs N-NaCl, # significant vs H-NaCl, + H-NE significant vs N-NE; recovery groups: § significant vs N-NaCl+R, $ significant vs H-NaCl+R, ° significant vs corresponding treatment group.
Disclaimer/Publisher’s Note: The statements, opinions and data contained in all publications are solely those of the individual author(s) and contributor(s) and not of MDPI and/or the editor(s). MDPI and/or the editor(s) disclaim responsibility for any injury to people or property resulting from any ideas, methods, instructions or products referred to in the content. |
© 2025 by the authors. Licensee MDPI, Basel, Switzerland. This article is an open access article distributed under the terms and conditions of the Creative Commons Attribution (CC BY) license (http://creativecommons.org/licenses/by/4.0/).
Copyright: This open access article is published under a Creative Commons CC BY 4.0 license, which permit the free download, distribution, and reuse, provided that the author and preprint are cited in any reuse.


