Submitted:
30 September 2025
Posted:
01 October 2025
You are already at the latest version
Abstract
Semantic segmentation and deep learning methods have rarely been applied to Fractional Vegetation Cover (FVC) segmentation tasks due to the lack of publicly available datasets for training deep learning models. FVC is a key indicator for assessing vegetation distribution, crop density, and crop responses to water availability and fertilizer application, yet conventional field-based measurement methods are time-consuming, costly, labor intensive, and may lack the accuracy required for critical applications such as drought stress evaluation, and water productivity. In this paper, we introduced causality-based deep learning technique for FVC segmentation on a publicly available RGB dataset that consists of four ground cover crops, Phyla nodiflora L, Cynodon dactylon, Frankenia thymifolia Desf, and Oxalis stricta L. By separating causal from spurious correlations in pretrained features, the stepwise intervention and reweighting (SIR) method reduced confounding bias and enhanced generalization across tasks and datasets. Extensive experiments on the FVC dataset, both with and without causality learning, showed that the proposed U-Net + VGG16 model with causality learning achieved an accuracy of 92.04%, precision of 92.31%, recall of 92.65%, and an F1-score of 91.98%, outperforming non-causal baselines.
Keywords:
causal learning
; fractional vegetation cover
; semantic segmentation
; ground cover plants
1. Introduction
Fractional vegetation cover (FVC) is a key indicator for assessing ecosystem health, vegetation density, and monitoring climate change [1]. It is defined as the proportion of ground area covered by the vertical projection of vegetation [2]. Estimated FVC is essential for modeling vegetation productivity and supporting research in land surface dynamics, dynamics climatology, hydrology, ecology, and agricultural resource management [3]. Precise FVC measurements contribute to monitoring ecosystem health and facilitate sustainable natural resource management, which is critical for environmental conservation [4].
Conventional techniques for measuring FVC typically involve ground-based surveys and manual sampling techniques , such as point intercept methods, line transects, or quadrat sampling, which are labor-intensive and impractical for large-scale monitoring due to limited spatial coverage and sampling frequency [5,6]. These traditional methods often suffer from inadequate sample representativeness and spatial scale discrepancies, especially when compared to pixel resolution in RGB and remote sensing images, which impair their ability to effectively capture spatial heterogeneity (e.g., in drylands) or temporal changes in vegetation cover [7,8]. Moreover, some image-based conventional methods rely on vegetation indices (VIs) and pixel dichotomy models, which may encounter saturation and nonlinear response issues, limiting their accuracy for moderate to high vegetation density areas [9]. To overcome these limitations, semantic segmentation has emerged as effective technique, which divides an image into multiple segments, simplifying its representation into a more meaningful and analyzable form [10]. By classifying each pixel according to the object it belongs to, semantic segmentation produces a segmented image where every pixel is assigned a category label, thereby transforming raw visual data into a structured and interpretable format [11,12]. Semantic segmentation models are more likely to overfit and less stable when used in different settings. To tackle this challenge, our approach includes causality-guided learning, where the Stepwise Intervention and Re-weighting (SIR) framework mitigates these confounding effects and enables the models to focus on task-relevant, causal attributes for more reliable vegetation cover prediction [13].
In this study, we employed a causality-based deep learning approach for enhancing the performance of FVC segmentation and estimation using a high-resolution RGB dataset of four ground cover crops, Phyla nodiflora L, Cynodon dactylon, Frankenia thymifolia Desf, and Oxalis stricta L. Our approach leverages the Stepwise Intervention and Re-weighting (SIR) framework to mitigate confounding biases in pretrained features, thereby improving model generalization and segmentation performance [13]. Furthermore, we evaluated multiple deep learning architectures to assess the effectiveness of causality learning for robust vegetation cover estimation.
2. Related Work
Over the past decade, several approaches have been developed to estimate FVC, ranging from traditional field-based surveys to modern remote sensing and deep learning–based techniques [14,15]. This section reviews both traditional methodologies and semantic segmentation-based techniques for FVC, highlighting their strengths, limitations, and evolving role.
2.1. Traditional and Remote Sensing FVC Estimation Techniques
Traditional methods for FVC estimation have predominantly relied on manual ground-based surveys that involve visual estimation or direct measurement of vegetation cover using quadrats, line transects, or photographic sampling [16,17]. While these approaches can provide detailed and accurate point-based data, they are often labor-intensive, time-consuming, prone to observer bias, and restricted in spatial extent, limiting their applicability at larger scales [16,18]. Given the logistical challenges of ground-based monitoring, integrating remote sensing technologies has become integral to achieving spatially comprehensive and accurate FVC measurements [19,20,21].
Remote sensing approaches uses satellite imagery, aerial photographs, unmanned aerial vehicle (UAV)-based sensors, and multispectral or hyperspectral data to estimate FVC by analyzing vegetation spectral responses [22,23]. These methods afford substantial spatial coverage and frequent data acquisition but face inherent challenges. One major difficulty lies in reconciling spatial scale discrepancies between high-resolution ground measurements and coarser satellite pixels, which often results in scale mismatch errors and uncertainties in fractional cover estimation [24,25]. Additionally, landscapes with sparse, heterogeneous, or desert vegetation pose challenges due to spectral mixing and low signal-to-noise ratios. In such settings, subtle signals from vegetation amid bare soil or non-vegetated areas complicate accurate FVC retrieval [26,27].
2.2. Semantic Segmentation Techniques for Fractional Vegetation Cover
The advent of deep learning technologies has significantly advanced automated FVC estimation through improved image analysis capabilities. Deep learning models, particularly convolutional neural networks (CNNs) [8,27], have been effectively employed for semantic segmentation tasks, where the goal is to classify each pixel in an image according to vegetation presence or type. Semantic segmentation techniques enable direct mapping of canopy cover over large areas with high delineation precision, outperforming traditional threshold-based or spectral index methods. This advancement automates labor-intensive segmentation processes, extracts richer spatial features, and accommodates complex background vegetation interactions [28,29].
Integrating deep learning with multispectral and RGB imagery further enriches feature representation by leveraging spectral and spatial information simultaneously. Such fusion improves discrimination between vegetation and non-vegetation classes, particularly under variable lighting or seasonal conditions, and reduces saturation effects commonly encountered in traditional vegetation indices [30]. In remote sensing of crops like maize (Zea mays), deep learning models utilizing multispectral data have provided superior performance in estimating FVC and related biophysical parameters compared to classical approaches [31]. Additionally, urban vegetation monitoring has benefited from combining deep semantic segmentation with RGB imagery, demonstrating robustness to color variations, viewpoints, and seasonal changes through novel indices like the Multiview Semantic Vegetation Index [32]. In UAV imagery analysis, CNNs have demonstrated success in identifying plant communities and estimating fractional vegetation cover with considerable accuracy by harnessing the fine spatial detail inherent in aerial images [33,34]. Beyond standard CNNs, advanced semantic segmentation architectures such as U-Net, Deeplabv3+, and ReNet have been explored for vegetation classification. U-Net’s encoder-decoder architecture complemented by skip connections effectively preserves fine-grained spatial details crucial for segmenting vegetation patches, and has demonstrated superior accuracy in multispectral land cover classification tasks [35]. Collectively, these developments mark a paradigm shift toward more accurate, automated, and scalable FVC mapping supported by sophisticated deep representation learning frameworks.
3. Materials and Methods
Previous research has primarily employed U-Net architecture and image processing techniques for FVC segmentation [27]. While effective, these models remain susceptible to confounding factors and spurious correlations present in image data. In this study, we extend beyond the U-Net baseline by adopting a causality-guided Stepwise Intervention and Reweighting (SIR) framework for semantic segmentation of high-resolution RGB images [13,36]. The SIR approach systematically intervenes in feature learning and reweights representations to prioritize causal over spurious associations.
3.1. Dataset
A total of 432 images captured with a LG G5 phone camera were used in the dataset. The images have spatial resolution of 2988×5312 pixels, with 344 used for training and 88 for testing. The data were randomly sampled to ensure mutual independence between training and testing sets to enhance the robustness of the models. Each pixel in these images are labeled into two categories: Vegetation, Background. Figure 1 shows an example of images of four different types of crops of FVC.
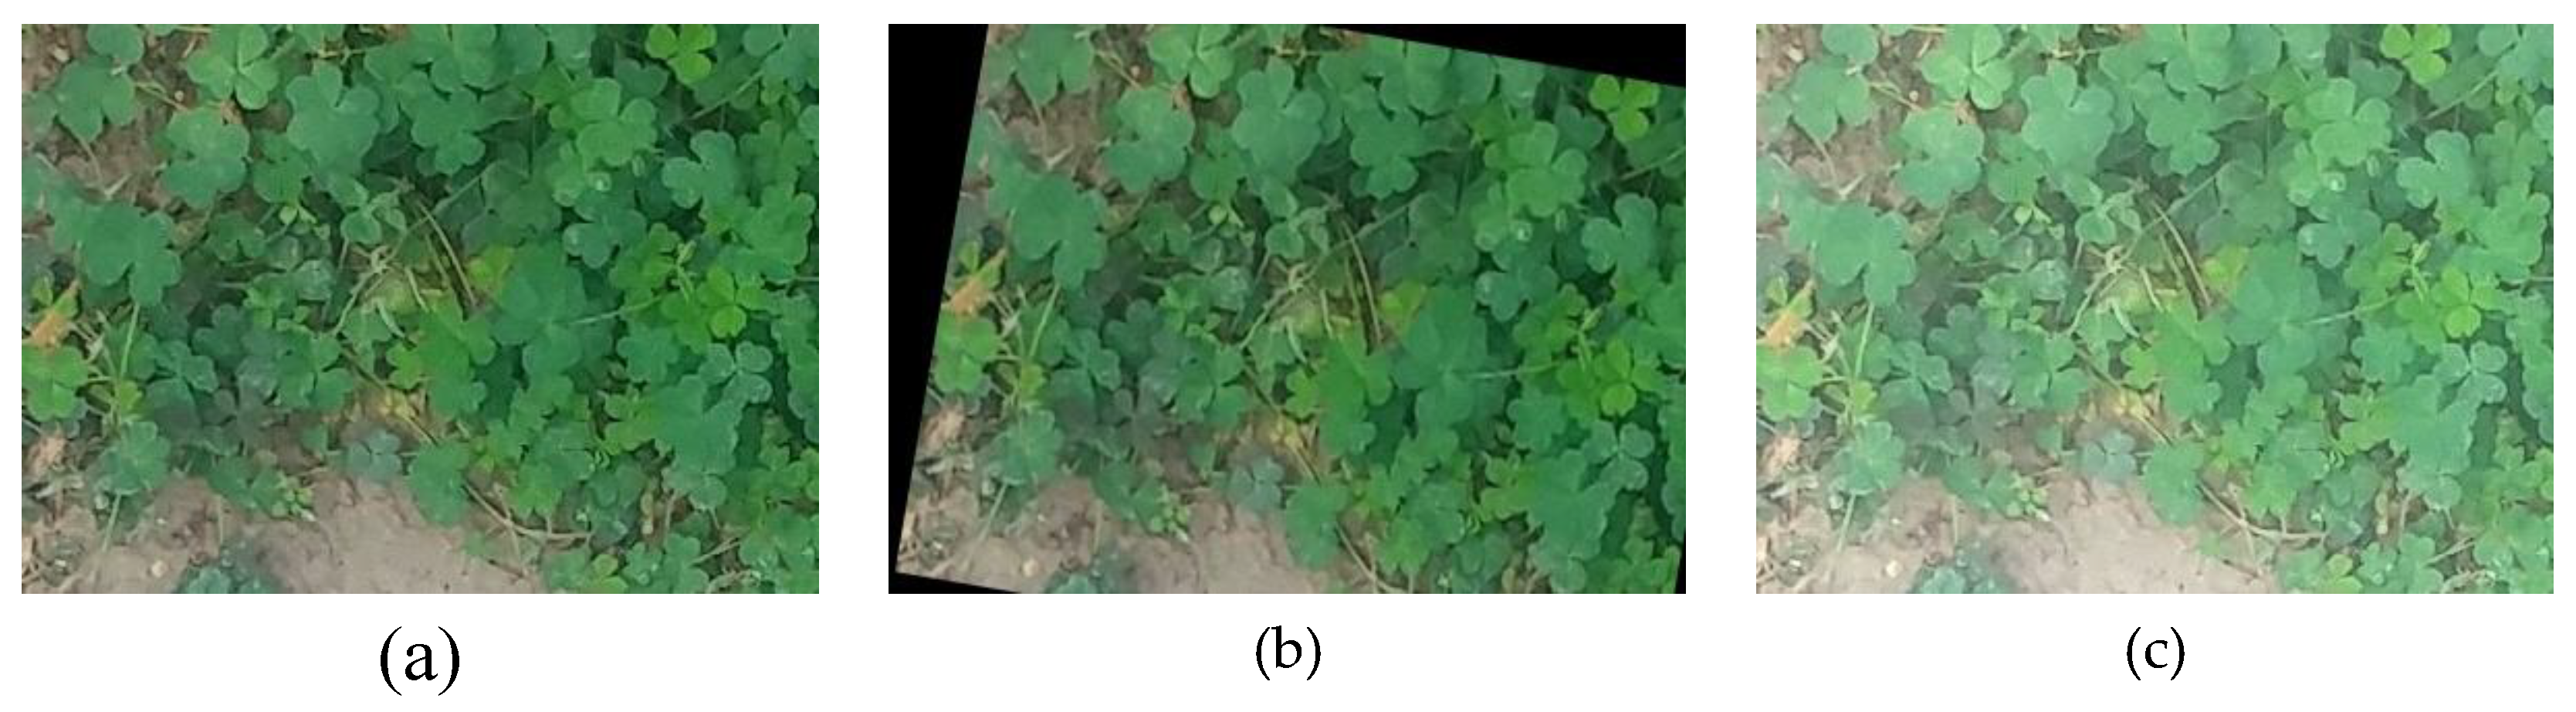
The dataset was augmented using the Albumentations library [37], specifically, techniques such as horizontal and vertical flipping, as well as random cropping, to generate additional variations of the original images. This allowed each image to be transformed into three new versions, effectively tripling the dataset size and introducing meaningful variability that helps in model development and robustness.
By applying these augmentations, the dataset captures more diverse spatial orientations and scale variations of objects, which is especially useful for segmentation tasks where small changes in perspective or framing can significantly affect feature recognition. The expanded dataset not only balances class representation but also reduces overfitting, ensuring that the trained model becomes more robust and reliable in real-world applications.
Figure 2.
Example of images generated through data augmentation (a)Flipping, (b) Rotation, (c) Brightness adjustment.
Figure 2.
Example of images generated through data augmentation (a)Flipping, (b) Rotation, (c) Brightness adjustment.
3.2. Segmentation Models and Backbone Architectures
Each segmentation model can pair with different backbone architecture to achieve different segmentation results. Here we review three widely used segmentation models (U-Net, FCN, and Deeplabv3+) and three common backbone architectures (ResNet50, VGG16, and EfficientNet).
3.2.1. Segmentation Models
3.2.1.1. U-Net
U-Net architecture [38] is a convolutional neural network designed specifically for semantic segmentation tasks. It follows an encoder–decoder structure, where the encoder progressively reduces spatial dimensions to capture contextual information, while the decoder restores spatial resolution through up-sampling operations. A key feature of U-Net is the use of skip connections that transfer fine-grained spatial details from the encoder to the decoder, enabling precise boundary delineation even in complex images.
3.2.1.2. FCN
A Fully Convolutional Network (FCN) [39] is a deep learning architecture designed for dense prediction tasks such as semantic segmentation, where each pixel of an image is classified into a category. Unlike traditional CNNs that end with fully connected layers for image-level classification, FCNs replace these layers with convolutional layers to preserve spatial information throughout the network. This design enables FCNs to process input images of varying sizes and produce output maps that align with the original image dimensions. By incorporating upsampling layers and skip connections (as in FCN-8s and FCN-16s), FCNs combine high-level semantic information with low-level spatial details, allowing for sharper segmentation boundaries.
3.2.1.3. Deeplabv3+
DeepLabv3+ model [43] is an advanced semantic segmentation architecture that builds upon DeepLabv3 by combining atrous (dilated) convolutions with an encoder–decoder structure. Its encoder leverages Atrous Spatial Pyramid Pooling (ASPP) to capture multi-scale contextual information, while the decoder refines object boundaries by recovering spatial details lost during downsampling. This design allows DeepLabv3+ to achieve strong performance in segmenting complex scenes with varied object sizes. It has been widely adopted in applications such as medical imaging, autonomous driving, and environmental monitoring, and is often used with backbones like ResNet, Xception, or EfficientNet for robust feature extraction.
3.2.2. Backbone Architectures
3.2.2.1. ResNet50
Residual Network (ResNet) [40] is a deep convolutional neural network that introduced the concept of residual learning to address the problem of vanishing gradients in extremely deep models. Instead of learning direct mapping, ResNet uses skip connections that bypass one or more layers, allowing the network to learn residual functions. This design enables the training of networks with hundreds of layers while maintaining stable convergence and improving generalization.
3.2.2.2. EfficientNet
EfficientNet [41] is a network developed with the goal of balancing model accuracy and efficiency. Its design is based on a compound scaling method, which uniformly scales network depth, width, and input resolution using a set of fixed coefficients. This systematic scaling strategy allows EfficientNet models to achieve state-of-the-art performance while using significantly fewer parameters and FLOPs compared to traditional backbones like VGG16 or ResNet.
Due to this efficiency–accuracy trade-off, EfficientNet has become a widely adopted backbone in computer vision tasks such as image classification, object detection, and semantic segmentation. Variants from EfficientNet-B0 through B7 (and later EfficientNetV2) provide a spectrum of options depending on computational resources, making it suitable for both mobile devices and large-scale server applications. In segmentation pipelines, EfficientNet is often employed as an encoder, where its lightweight yet expressive features improve model robustness without excessive computational cost.
3.2.2.3. VGG16
VGG16 network [42] is a deep CNN with 16 layers that relies on stacking small 3×33×3 convolutional filters to extract hierarchical image features. It gained prominence for its simplicity and strong performance on large-scale datasets like ImageNet, but its high parameter counts, and computational cost limit efficiency compared to newer models. Despite these drawbacks, VGG16 remains widely used as a backbone for transfer learning and as an encoder in segmentation architectures such as FCN and U-Net, where its structured feature maps provide a solid foundation for pixel-level prediction.
3.4. Causality-Guided Stepwise Intervention and Reweighting Method
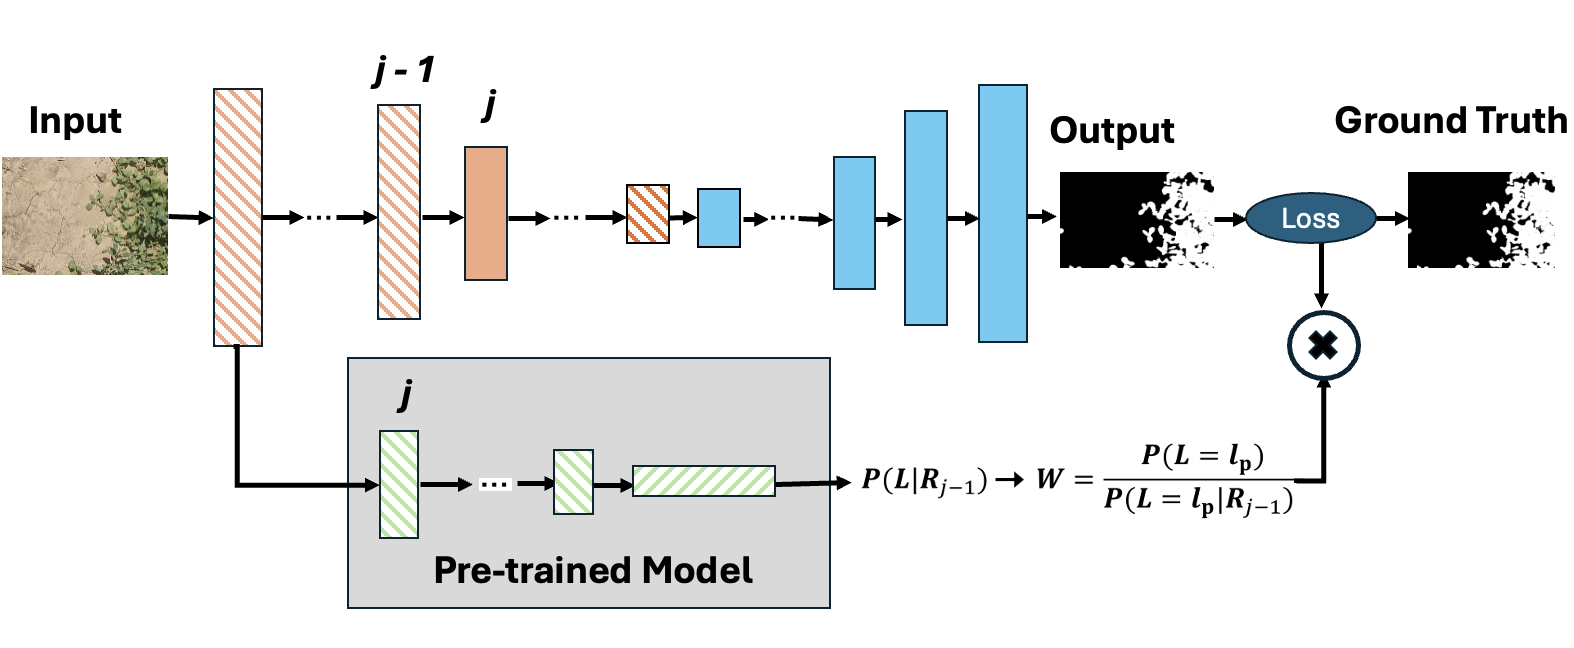
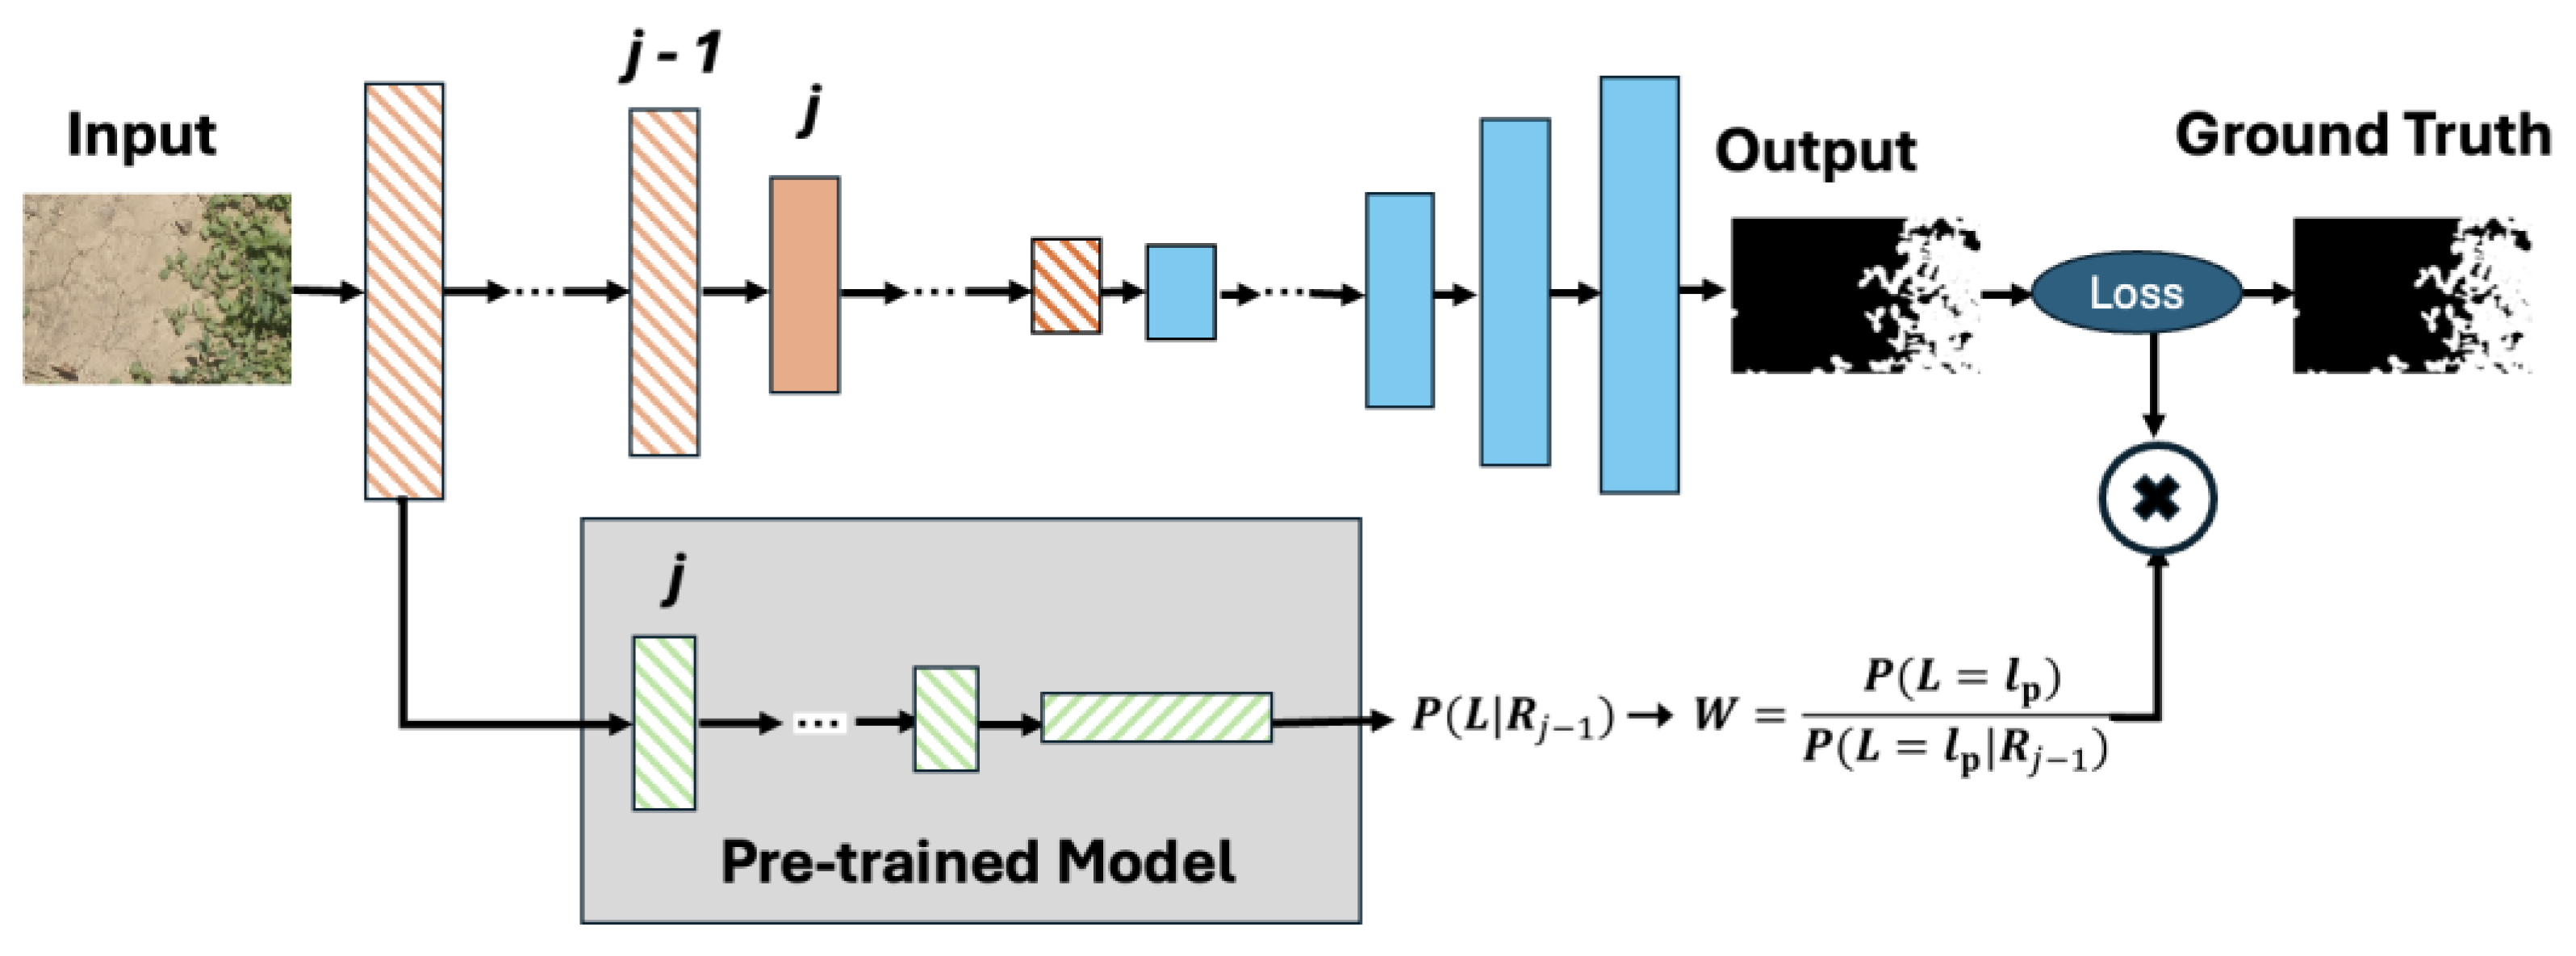
In this work, we introduce causality-guided stepwise intervention and reweighting (SIR) method for FVC, recognizing that features learned from pretrained models consist of both causal factors and spurious correlations. Only the causal factors provide generalizable information that remains consistent across different tasks and datasets. The SIR framework [13], which mitigates the confounding bias inherent in pretrained knowledge and enhances the model’s capacity to extract robust, general features. This enables semantic segmentation of FVC images to benefit more effectively from pretraining. Figure 3 and 4 illustrate the semantic causal model for semantic segmentation. In Semantic segmentation model, the encoder is initialized from a pretrained model, all feature representations are influenced by the pretraining knowledge. Consequently, acts as a confounder between pairs of intermediate representations and . On the causal path X→R1:m→YX→R1:m→Y, this creates non-causal dependencies such as X→Ri←Xpre→Rj→YX→Ri←Xpre→Rj→Y. In this way, the transferred knowledge introduces confounding bias into the learning process, affecting the flow of information from one encoder layer to the next. To address this, the balancing weight = is applied to correct the confounding effect of Xpre between adjacent representations. By reweighting, the distribution of features is adjusted toward a post-intervention distribution, reducing spurious influences and ensuring that the model captures causal, task-relevant signals for more robust segmentation.
Figure 3.
Semantic causal model for semantic segmentation.
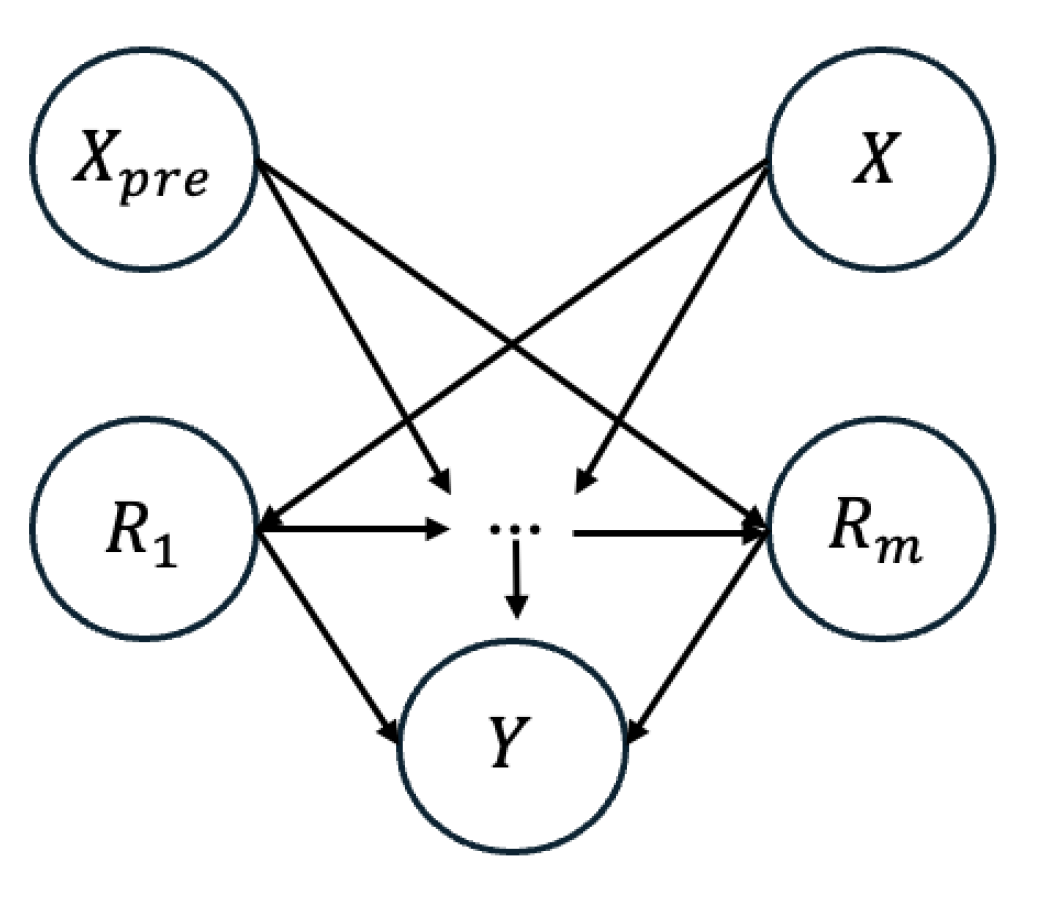
Figure 4.
Framework of the segmentation model with causality-based reweighting, where intermediate features are adjusted using a pre-trained model to reduce confounding effects.
Figure 4.
Framework of the segmentation model with causality-based reweighting, where intermediate features are adjusted using a pre-trained model to reduce confounding effects.
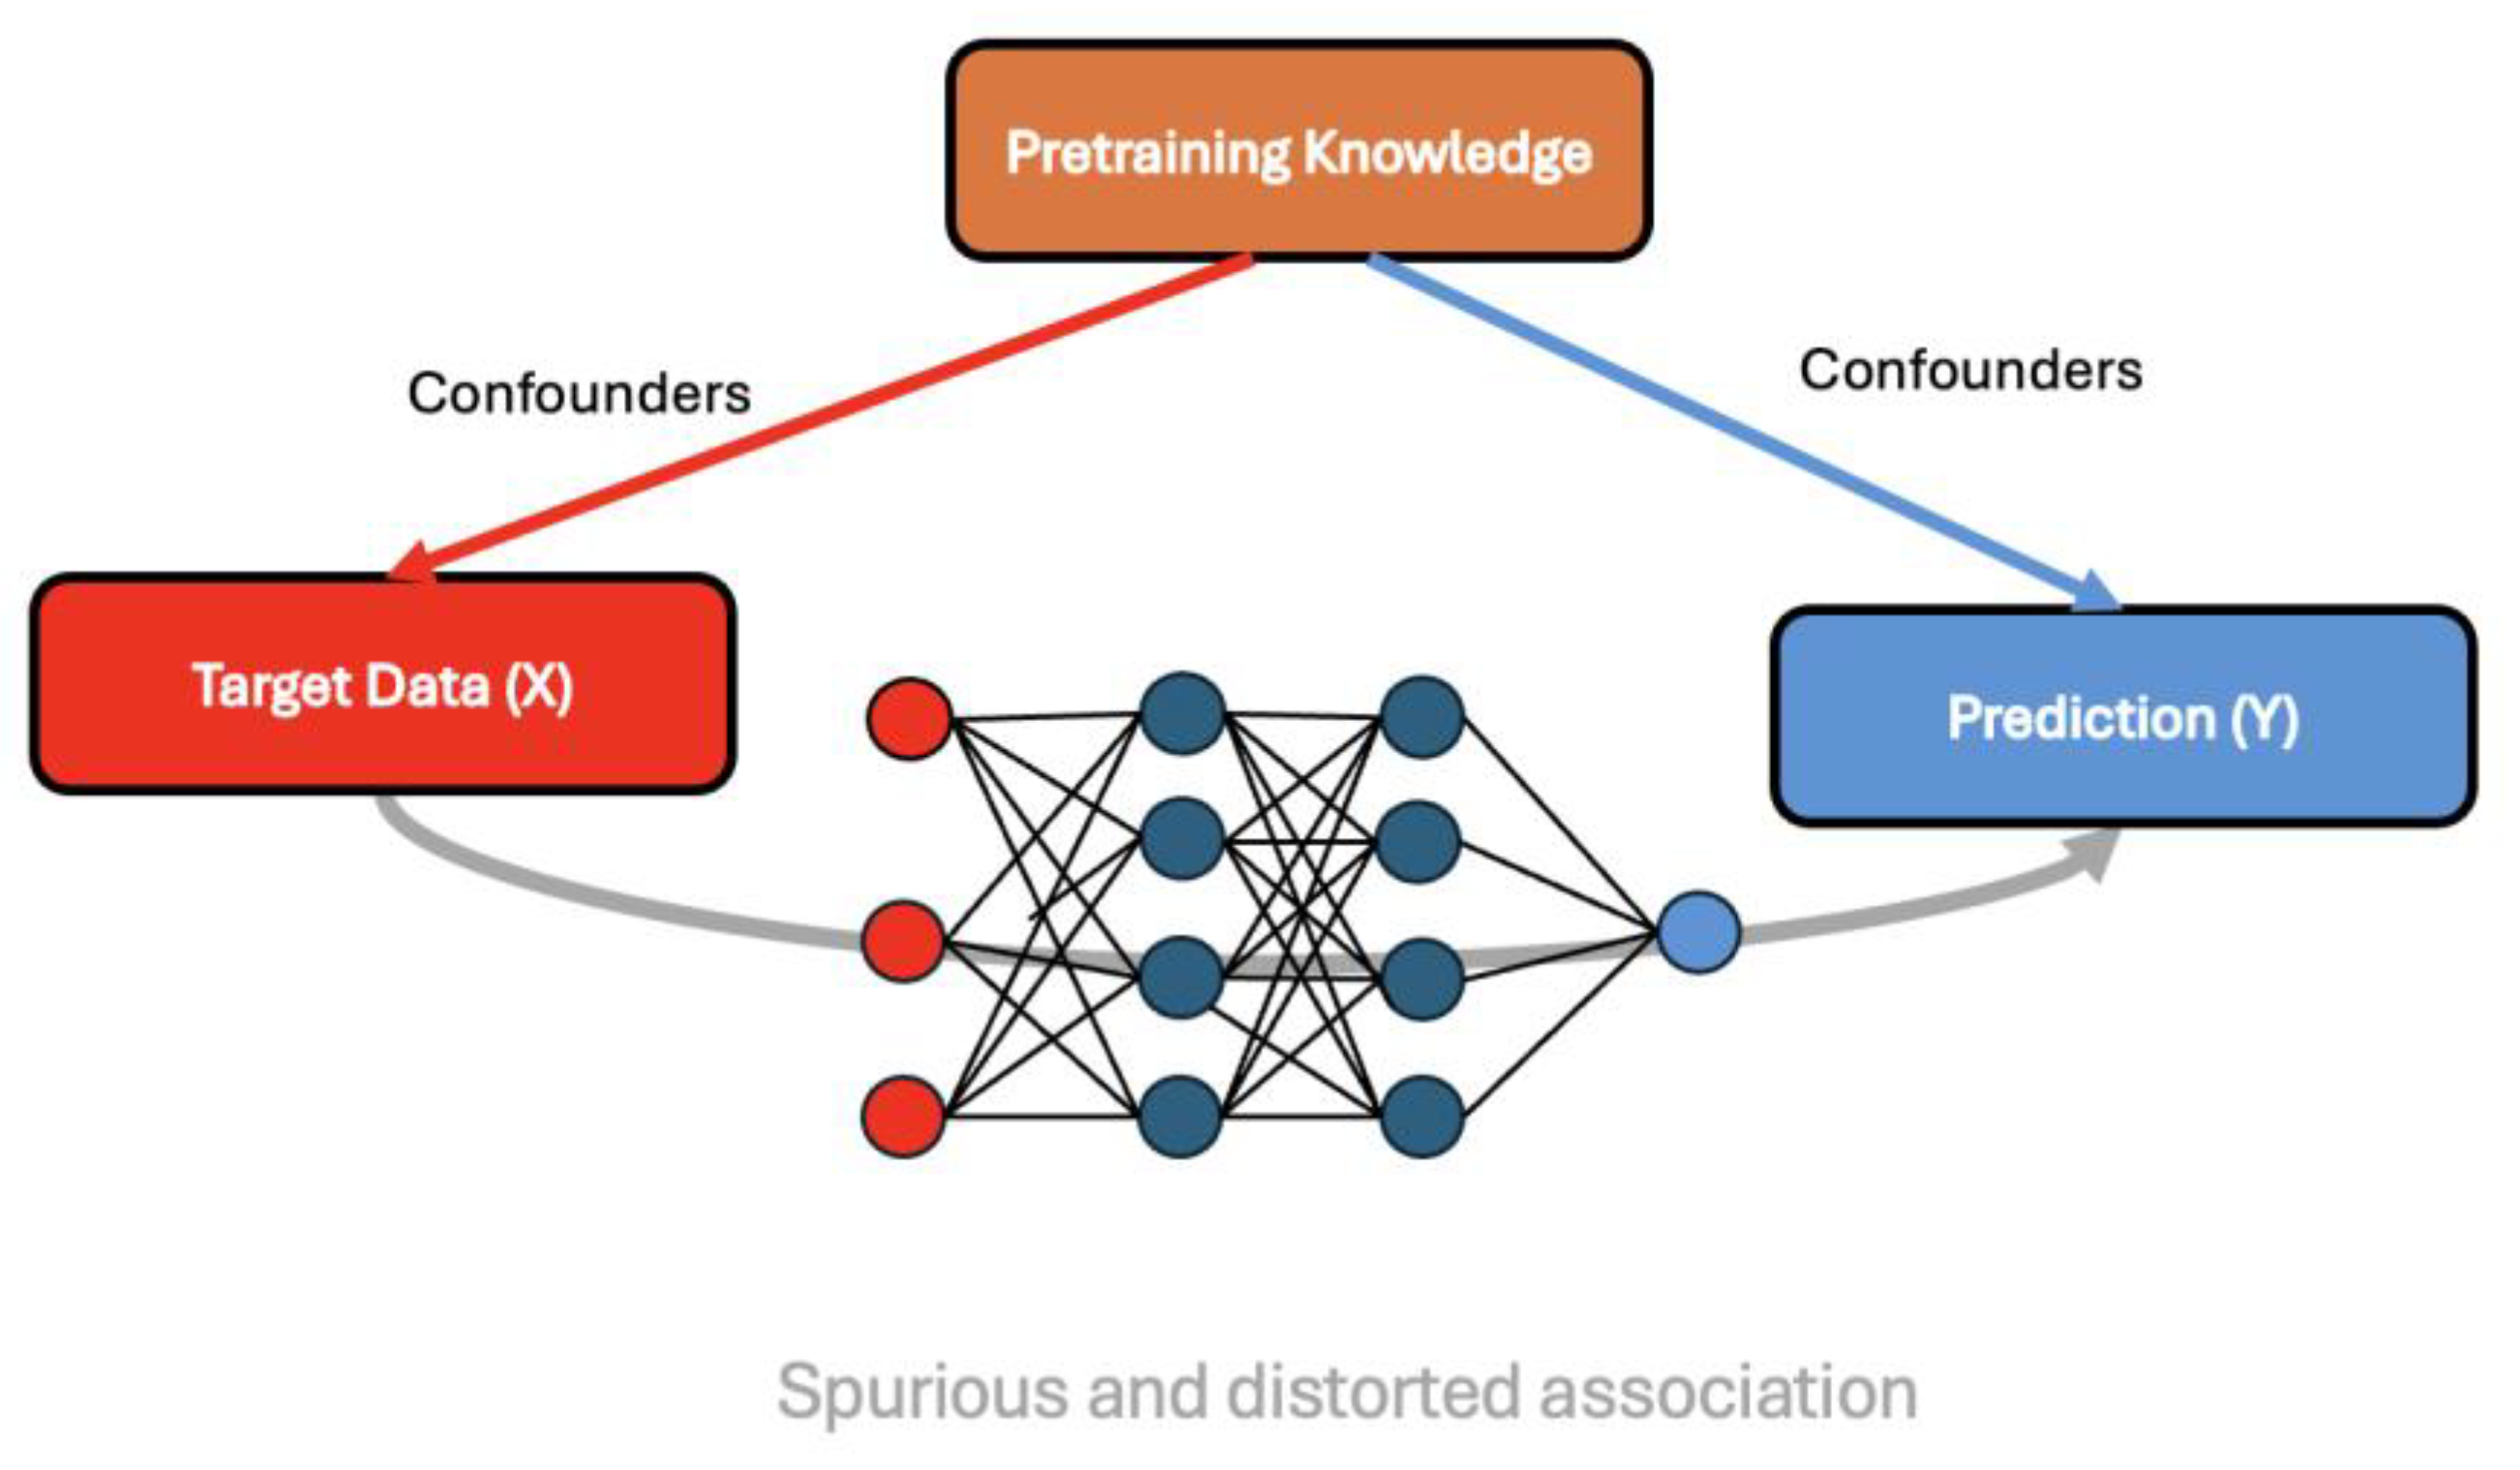
Confounding bias occurs when an external factor, known as a confounder, influences both the input variables and the output, creating misleading or spurious associations. In machine learning, particularly in deep learning for image segmentation, confounding bias can arise when pretrained features or irrelevant background information affect how the model learns the relationships between inputs and labels [44]. Confounders distort the true relationship between input data and output variables, and inadequate handling of these factors often leads to misleading or biased associations. Traditional machine learning and statistical approaches address this issue through techniques such as dataset matching, stratification, or residualizing imaging measurements [45].
In our work, we addressed the issue of confounding bias by applying the SIR method [13]. This approach ensures that the model learns to emphasize causal and task-relevant features rather than relying on biases introduced during pretraining or from the dataset itself. As a result, the segmentation performance becomes more reliable and generalizable, allowing the model to better handle variations in unseen data and improving its robustness in real-world scenarios.
Figure 5.
Illustration of confounding bias introduced by pretraining knowledge, leading to spurious and distorted associations between target data (X) and prediction (Y).
Figure 5.
Illustration of confounding bias introduced by pretraining knowledge, leading to spurious and distorted associations between target data (X) and prediction (Y).
3.4. Evaluation Metrics for Performance Analysis
Evaluation metrics indicate how well the model performs across different classes, providing insights into its strengths and weaknesses for each class. In our study, we used accuracy, precision, recall, and f1 scores to evaluates the effectiveness of SIR based causality method [13] and performance of state-of-the-art (SOTA) models on our dataset. Accuracy, in contrast, provides an overall measure of correctness by calculating the proportion of all correctly classified instances (both positives and negatives) out of the total number of predictions. Precision evaluates how accurate the model’s positive predictions are by measuring the proportion of correctly predicted positives out of all predicted positives. It reflects the model’s ability to minimize false positives. Recall, on the other hand, assesses the model’s capability to detect all actual positive instances, showing how effectively it avoids missing positives (false negatives). The F1-score, calculated as the harmonic mean of precision and recall, provides a balanced metric that captures both aspects. This measure is especially valuable in cases of imbalanced class distributions, as it highlights the trade-off between precision and recall. Equations (1) – (4) represents accuracy, precision, recall, and F1-score, respectively.
In Equations (1) – (4), TP indicates the total number of correct predictions; FP denotes the total number of false positives; TN represents the total number of true negatives; and FN indicates the total number of false negatives.
4. Results
This section presents the performance evaluation of the models on the FVC dataset. Detailed comparisons are provided to highlight the effectiveness of different architectures and the improvements achieved using the causality learning techniques.
4.1. Results of the State-of-the-Art Models
The performance of state-of-the-art (SOTA) segmentation models, including U-Net, FCN, and DeepLabv3+, was evaluated using accuracy, precision, recall, and F1-score (Table 1). U-Net achieved the strongest results with 91.09% accuracy and a 91.98% F1-score, benefiting from its encoder–decoder design with skip connections that effectively preserve spatial details. DeepLabv3+ performed competitively, reaching 91.17% accuracy and a 91.08% F1-score, while FCN showed comparatively lower performance with 90.10% accuracy and a 90.12% F1-score. Data augmentation did not improve results significantly all models, with U-Net maintaining high performance (91.07% accuracy, 91.92% F1-score), DeepLabv3+ achieving the highest balance (91.58% accuracy, 91.48% F1-score), and FCN improving to a 90.81% F1-score. Overall, U-Net proved to be the most robust model, with DeepLabv3+ closely matching its performance and FCN slightly behind, while augmentation consistently enhanced segmentation reliability across architectures.
To assess model generalization across the four ground-cover crops, Phyla nodiflora L (P1), Cynodon dactylon (P2), Frankenia thymifolia Desf (P3), and Oxalis stricta L (P4) we compared the performance of U-Net, FCN, and DeepLabv3+ using accuracy, precision, recall, and F1-score (Figure 6). U-Net outperformed the other models, particularly for P1 and P2, achieving F1-scores of 96.63% for P1 and 96.40% for P2, demonstrating its strong ability to capture spatial features and preserve fine-grained vegetation boundaries. However, U-Net’s performance declined on P3 and P4, with F1-scores dropping to 85.36% and 86.70%, respectively, indicating challenges in segmenting smaller or visually less distinct vegetation.
FCN delivered competitive performance on the larger crops (P1: 94.02% F1, P2: 94.52% F1) but struggled with P3 (81.54% F1) and P4 (86.29% F1), reflecting reduced adaptability to subtle crop textures. DeepLabv3+ showed balanced performance for P1 (95.53% F1) and P2 (94.24% F1) and maintained relatively strong precision and recall, but like the other models, it experienced a notable performance drop for P3 (80.88% F1) and P4 (88.67% F1).
Overall, the results highlight U-Net as the most robust architecture for multi-crop FVC segmentation, excelling especially for the dominant vegetation types P1 and P2. In contrast, FCN and DeepLabv3+ remain competitive for well-defined crops but show reduced accuracy and F1-scores on smaller or visually ambiguous crops P3 and P4, underscoring the persistent challenge of segmenting less distinct vegetation.
4.2. Results of the Stepwise Intervention and Reweighting (SIR) Method
The application of the causality-guided SIR method yielded improvements across a range of backbone and segmentation architectures (Table 2). The results indicate that all tested combinations achieved strong performance, with accuracy, precision, recall, and F1-scores consistently above 90%. Among these, U-Net with VGG16 achieved the best overall performance, reaching an F1-score of 91.98%, while Fully Convolutional Network with EfficientNet also performed strongly with an F1 score of 92.01%. Deeplabv3+ variants showed competitive results, particularly with EfficientNet and VGG16 backbones, both exceeding 91% in F1 score. These outcomes highlight the effectiveness of the SIR framework in reducing confounding effects introduced by pretrained knowledge, enabling the models to learn more generalizable and task-relevant features.
Performance varied across crop types. Models achieved the highest accuracy and F1-scores on P1 and P2, both of which present clearer structural and spectral characteristics, while performance was lower for P3 (Frankenia thymifolia Desf) and P4 (Oxalis stricta L), which exhibit finer textures and less distinct visual boundaries. For instance, DeepLabv3+VGG16 achieved F1 scores of 93.48% (P1) and 92.29% (P2), but only 87.48% (P3) and 88.41% (P4). These results indicate that while the SIR method improves robustness across architectures, segmentation of visually subtle crops remains challenging (Figure 7). Overall, the experiments confirm that incorporating SIR into pretrained models enhances their capacity to extract causal features, improving both precision and recall while ensuring stronger generalization across diverse vegetation types.
A comparison of the state-of-the-art (SOTA) models with those enhanced by the SIR framework shows that the proposed method improved results across all models. In the baseline models, U-Net achieved an F1-score of 91.98%, FCN reached 90.12%, and DeepLabv3+ obtained 91.08%, with modest gains observed when augmentation was applied. Under the SIR framework, U-Net with VGG16 maintained an F1-score of 91.98% but showed improved stability across accuracy, precision, and recall. FCN with EfficientNet achieved an F1-score of 92.01%, surpassing its baseline result of 90.81%. DeepLabv3+ also benefited from SIR, with EfficientNet and VGG16 backbones producing F1-scores above 91%, compared to 91.48% and 91.08% in the baseline models. Overall, SIR reduced variation between backbones, enhanced the balance between precision and recall, and demonstrated more robust performance than the baseline SOTA models, confirming its effectiveness in mitigating confounding effects from pretrained knowledge.Figure 8 shows the comparison of ground truth data to the segmentation outputs from U-Net and U-Net+VGG16.
4.3. Challenges
One of the key challenges with this dataset is the high variability in lighting and shadows, which creates inconsistency in plant appearance across images. The presence of strong shadows alters the texture and tone of vegetation, making segmentation more difficult for models that rely on color cues. This problem is further amplified in outdoor field conditions, where light intensity and direction change throughout the day, producing heterogeneous data.
Another major challenge is the color similarity between plants and soil, particularly for crops such as P4, where the plant exhibits a brownish or soil-like appearance under certain lighting conditions. This visual overlap causes confusion between background and vegetation classes, leading to misclassification. Additionally, small plant patches and dense overlapping vegetation increase intra-class variability, while some species share similar leaf structures and colors, which makes distinguishing them even more complex. Figure 9. illustrates these challenges along with the segmentation performance of different models.
To address these challenges, U-Net with VGG16 and FCN with EfficientNet, demonstrated strong capacity to handle variability in lighting, shadows, and color similarity. The encoder–decoder design of U-Net with skip connections allowed it to preserve fine spatial details, improving discrimination between plants and soil even when color cues overlapped. FCN with EfficientNet benefited from efficient multi-scale feature extraction, which enhanced robustness against inconsistent lighting conditions and shadow effects.
5. Conclusions
In this work, we employed a causality-based deep learning approach to predict FVC with an RGB dataset of four ground cover crops: Phyla nodiflora L, Cynodon dactylon, Frankenia thymifolia Desf, and Oxalis stricta L. The technique employed in this study, which leverages the SIR framework [13], effectively mitigates confounding biases in pretrained features, enhancing model generalization and segmentation performance. Among the evaluated architectures, the U-Net+VGG16 model with causality learning achieved superior results, with an accuracy of 92.04%, precision of 92.31%, recall of 91.65%, and an F1 score of 91.98%, outperforming non-causal baseline models.
Overall, this study demonstrates the effectiveness of incorporating causality-guided learning into semantic segmentation for vegetation analysis. By applying the SIR framework [13], the models were able to focus on causal and task-relevant features, reducing the influence of spurious correlations introduced by pretrained knowledge. This resulted in more robust and generalizable segmentation outcomes across multiple architectures. The findings highlight the potential of causality-based approaches to improve environmental monitoring applications such as crop health assessment, ecosystem management, and precision agriculture. Future work may extend this framework to larger and more diverse datasets, as well as integrate additional modalities such as multispectral or hyperspectral imagery to further enhance vegetation cover estimation.
References
- Andreatta, D.; Gianelle, D.; Scotton, M.; Dalponte, M. Estimating Grassland Vegetation Cover with Remote Sensing: A Comparison between Landsat-8, Sentinel-2 and PlanetScope Imagery. Ecological Indicators 2022, 141, 109102. [Google Scholar] [CrossRef]
- Liu, Y.; Mu, X.; Wang, H.; Yan, G. A Novel Method for Extracting Green Fractional Vegetation Cover from Digital Images. Journal of Vegetation Science 2012, 23, 406–418. [Google Scholar] [CrossRef]
- Chen, X.; Lv, X.; Ma, L.; Chen, A.; Zhang, Q.; Zhang, Z. Optimization and Validation of Hyperspectral Estimation Capability of Cotton Leaf Nitrogen Based on SPA and RF. Remote Sensing 2022, 14, 5201. [Google Scholar] [CrossRef]
- Li, Y.; Sun, J.; Wang, M.; Guo, J.; Wei, X.; Shukla, M.K.; Qi, Y. Spatiotemporal Variation of Fractional Vegetation Cover and Its Response to Climate Change and Topography Characteristics in Shaanxi Province, China. Applied Sciences 2023, 13, 11532. [Google Scholar] [CrossRef]
- Karl, J.W.; McCord, S.E.; Hadley, B.C. A Comparison of Cover Calculation Techniques for Relating Point-Intercept Vegetation Sampling to Remote Sensing Imagery. Ecological Indicators 2017, 73, 156–165. [Google Scholar] [CrossRef]
- Song, W.; Mu, X.; Ruan, G.; Gao, Z.; Li, L.; Yan, G. Estimating Fractional Vegetation Cover and the Vegetation Index of Bare Soil and Highly Dense Vegetation with a Physically Based Method. International Journal of Applied Earth Observation and Geoinformation 2017, 58, 168–176. [Google Scholar] [CrossRef]
- Chen, X.; Sun, Y.; Qin, X.; Cai, J.; Cai, M.; Hou, X.; Yang, K.; Zhang, H. Assessing the Potential of UAV for Large-Scale Fractional Vegetation Cover Mapping with Satellite Data and Machine Learning. Remote Sensing 2024, 16, 3587. [Google Scholar] [CrossRef]
- Wang, H.; Gui, D.; Liu, Q.; Feng, X.; Qu, J.; Zhao, J.; Wang, G.; Wei, G. Vegetation Coverage Precisely Extracting and Driving Factors Analysis in Drylands. Ecological Informatics 2024, 79, 102409. [Google Scholar] [CrossRef]
- Yao, Y.; Shen, J.; Yue, J.; Liu, Y.; Feng, H.; Shu, M.; Fu, Y.; Qiao, H.; Sun, T.; Zheng, G. Remotely Estimate the Cropland Fractional Vegetation Cover Using Linear Spectral Mixture Analysis and Improved Band Operations. International Journal of Remote Sensing 2025, 46, 3466–3486. [Google Scholar] [CrossRef]
- Khan, S.; Jan, A.; Seo, K. Accurate Structural Crack Detection Using NestedUNet from Drone and Handheld Camera Images. KSCE JOURNAL OF CIVIL ENGINEERING 2025, 29. [Google Scholar] [CrossRef]
- Csurka, G.; Volpi, R.; Chidlovskii, B. Semantic Image Segmentation: Two Decades of Research 2023.
- Khan, S.; Jan, A.; Seo, S. Structural Crack Detection Using Deep Learning: An in-Depth Review. Korean Journal of Remote Sensing 2023, 39, 371–393. [Google Scholar]
- Shi, S.; Li, B.; Zhang, L.; Kuang, K.; Wu, S.; Feng, T.; Yan, Y.; Du, Z. Causality-Guided Stepwise Intervention and Reweighting for Remote Sensing Image Semantic Segmentation. IEEE Transactions on Geoscience and Remote Sensing 2024, 62, 1–17. [Google Scholar] [CrossRef]
- Wang, Z.; Song, D.-X.; He, T.; Lu, J.; Wang, C.; Zhong, D. Developing Spatial and Temporal Continuous Fractional Vegetation Cover Based on Landsat and Sentinel-2 Data with a Deep Learning Approach. Remote Sensing 2023, 15, 2948. [Google Scholar] [CrossRef]
- Yue, J.; Tian, Q. Estimating Fractional Cover of Crop, Crop Residue, and Soil in Cropland Using Broadband Remote Sensing Data and Machine Learning. International Journal of Applied Earth Observation and Geoinformation 2020, 89, 102089. [Google Scholar] [CrossRef]
- Chen, J.; Zhao, X.; Zhang, H.; Qin, Y.; Yi, S. Evaluation of the Accuracy of the Field Quadrat Survey of Alpine Grassland Fractional Vegetation Cover Based on the Satellite Remote Sensing Pixel Scale. ISPRS International Journal of Geo-Information 2019, 8, 497. [Google Scholar] [CrossRef]
- Chen, J.; Yi, S.; Qin, Y.; Wang, X. Improving Estimates of Fractional Vegetation Cover Based on UAV in Alpine Grassland on the Qinghai–Tibetan Plateau. International Journal of Remote Sensing 2016, 37, 1922–1936. [Google Scholar] [CrossRef]
- Henrys, P.A.; Jarvis, S.G. Integration of Ground Survey and Remote Sensing Derived Data: Producing Robust Indicators of Habitat Extent and Condition. Ecol Evol 2019, 9, 8104–8112. [Google Scholar] [CrossRef] [PubMed]
- Fernández-Guisuraga, J.M.; Verrelst, J.; Calvo, L.; Suárez-Seoane, S. Hybrid Inversion of Radiative Transfer Models Based on High Spatial Resolution Satellite Reflectance Data Improves Fractional Vegetation Cover Retrieval in Heterogeneous Ecological Systems after Fire. Remote Sensing of Environment 2021, 255, 112304. [Google Scholar] [CrossRef]
- Li, L.; Mu, X.; Jiang, H.; Chianucci, F.; Hu, R.; Song, W.; Qi, J.; Liu, S.; Zhou, J.; Chen, L.; et al. Review of Ground and Aerial Methods for Vegetation Cover Fraction (fCover) and Related Quantities Estimation: Definitions, Advances, Challenges, and Future Perspectives. ISPRS Journal of Photogrammetry and Remote Sensing 2023, 199, 133–156. [Google Scholar] [CrossRef]
- Lin, X.; Chen, J.; Lou, P.; Yi, S.; Qin, Y.; You, H.; Han, X. Improving the Estimation of Alpine Grassland Fractional Vegetation Cover Using Optimized Algorithms and Multi-Dimensional Features. Plant Methods 2021, 17, 96. [Google Scholar] [CrossRef] [PubMed]
- Xie, Y.; Sha, Z.; Yu, M. Remote Sensing Imagery in Vegetation Mapping: A Review. Journal of Plant Ecology 2008, 1, 9–23. [Google Scholar] [CrossRef]
- Yan, K.; Gao, S.; Yan, G.; Ma, X.; Chen, X.; Zhu, P.; Li, J.; Gao, S.; Gastellu-Etchegorry, J.-P.; Myneni, R.B.; et al. A Global Systematic Review of the Remote Sensing Vegetation Indices. International Journal of Applied Earth Observation and Geoinformation 2025, 139, 104560. [Google Scholar] [CrossRef]
- Kim, J.; Kang, S.; Seo, B.; Narantsetseg, A.; Han, Y. Estimating Fractional Green Vegetation Cover of Mongolian Grasslands Using Digital Camera Images and MODIS Satellite Vegetation Indices. GIScience & Remote Sensing 2020, 57, 49–59. [Google Scholar] [CrossRef]
- Gao, L.; Wang, X.; Johnson, B.A.; Tian, Q.; Wang, Y.; Verrelst, J.; Mu, X.; Gu, X. Remote Sensing Algorithms for Estimation of Fractional Vegetation Cover Using Pure Vegetation Index Values: A Review. ISPRS Journal of Photogrammetry and Remote Sensing 2020, 159, 364–377. [Google Scholar] [CrossRef]
- Han, J.; Zhu, J.; Cao, X.; Xi, L.; Qi, Z.; Li, Y.; Wang, X.; Zou, J. Extraction of Sparse Vegetation Cover in Deserts Based on UAV Remote Sensing. Remote Sensing 2025, 17, 2665. [Google Scholar] [CrossRef]
- Sotomayor, L.N.; Lucieer, A.; Turner, D.; Lewis, M.; Kattenborn, T. Mapping Fractional Vegetation Cover in UAS RGB and Multispectral Imagery in Semi-Arid Australian Ecosystems Using CNN-Based Semantic Segmentation. Landsc Ecol 2025, 40, 169. [Google Scholar] [CrossRef]
- Zhang, Y.; Yang, R.; Dai, Q.; Zhao, Y.; Xu, W.; Wang, J.; Wang, L. Boosting Semantic Segmentation of Remote Sensing Images by Introducing Edge Extraction Network and Spectral Indices. Remote Sensing 2023, 15, 5148. [Google Scholar] [CrossRef]
- Said, Y.; Saidani, O.; Algarni, A.D.; Algarni, M.H.; Flah, A. Lightweight Multiscale Information Aggregation Network for Land Cover Land Use Semantic Segmentation from Remote Sensing Images. Sci Rep 2025, 15, 30265. [Google Scholar] [CrossRef] [PubMed]
- Hu, J.; Feng, H.; Wang, Q.; Shen, J.; Wang, J.; Liu, Y.; Feng, H.; Yang, H.; Guo, W.; Qiao, H.; et al. Pretrained Deep Learning Networks and Multispectral Imagery Enhance Maize LCC, FVC, and Maturity Estimation. Remote Sensing 2024, 16, 784. [Google Scholar] [CrossRef]
- Waqar, R.; Grbović, Ž.; Khan, M.; Pajević, N.; Stefanović, D.; Filipović, V.; Panić, M.; Djuric, N. End-to-End Deep Learning Models for Gap Identification in Maize Fields. In Proceedings of the 2024 IEEE/CVF Conference on Computer Vision and Pattern Recognition Workshops (CVPRW); IEEE: Seattle, WA, USA, June 17, 2024; pp. 5403–5412. [Google Scholar]
- Khan, A.; Asim, W.; Ulhaq, A.; Robinson, R.W. A Multiview Semantic Vegetation Index for Robust Estimation of Urban Vegetation Cover. Remote Sensing 2022, 14, 228. [Google Scholar] [CrossRef]
- Sa, I.; Popović, M.; Khanna, R.; Chen, Z.; Lottes, P.; Liebisch, F.; Nieto, J.; Stachniss, C.; Walter, A.; Siegwart, R. WeedMap: A Large-Scale Semantic Weed Mapping Framework Using Aerial Multispectral Imaging and Deep Neural Network for Precision Farming. Remote Sensing 2018, 10, 1423. [Google Scholar] [CrossRef]
- Celikkan, E.; Kunzmann, T.; Yeskaliyev, Y.; Itzerott, S.; Klein, N.; Herold, M. WeedsGalore: A Multispectral and Multitemporal UAV-Based Dataset for Crop and Weed Segmentation in Agricultural Maize Fields.
- Yu, H.; Jiang, D.; Peng, X.; Zhang, Y. A Vegetation Classification Method Based on Improved Dual-Way Branch Feature Fusion U-Net. Front. Plant Sci. 2022, 13. [Google Scholar] [CrossRef] [PubMed]
- Han, H.; Kim, S.; Joo, H.; Hong, S.; Lee, J. Mitigating Spurious Correlations via Disagreement Probability.
- Albumentations: Fast and Flexible Image Augmentations Available online:. Available online: https://albumentations.ai/ (accessed on 20 September 2025).
- Ronneberger, O.; Fischer, P.; Brox, T. U-Net: Convolutional Networks for Biomedical Image Segmentation 2015.
- Long, J.; Shelhamer, E.; Darrell, T. Fully Convolutional Networks for Semantic Segmentation 2015.
- He, K.; Zhang, X.; Ren, S.; Sun, J. Deep Residual Learning for Image Recognition 2015.
- Tan, M.; Le, Q.V. EfficientNet: Rethinking Model Scaling for Convolutional Neural Networks 2020.
- Simonyan, K.; Zisserman, A. Very Deep Convolutional Networks for Large-Scale Image Recognition 2015.
- Chen, L.-C.; Zhu, Y.; Papandreou, G.; Schroff, F.; Adam, H. Encoder-Decoder with Atrous Separable Convolution for Semantic Image Segmentation 2018.
- Pearl, J. CAUSALITY: MODELS, REASONING, AND INFERENCE.
- Satterthwaite, T.D.; Wolf, D.H.; Loughead, J.; Ruparel, K.; Elliott, M.A.; Hakonarson, H.; Gur, R.C.; Gur, R.E. Impact of In-Scanner Head Motion on Multiple Measures of Functional Connectivity: Relevance for Studies of Neurodevelopment in Youth. Neuroimage 2012, 60, 623–632. [Google Scholar] [CrossRef] [PubMed]
Figure 1.
Example Images from Dataset, (P1) Phyla nodiflora L, (P2) Frankenia thymifolia Desf, (P3) Oxalis stricta L, and (P4) Cynodon dactylon.
Figure 1.
Example Images from Dataset, (P1) Phyla nodiflora L, (P2) Frankenia thymifolia Desf, (P3) Oxalis stricta L, and (P4) Cynodon dactylon.
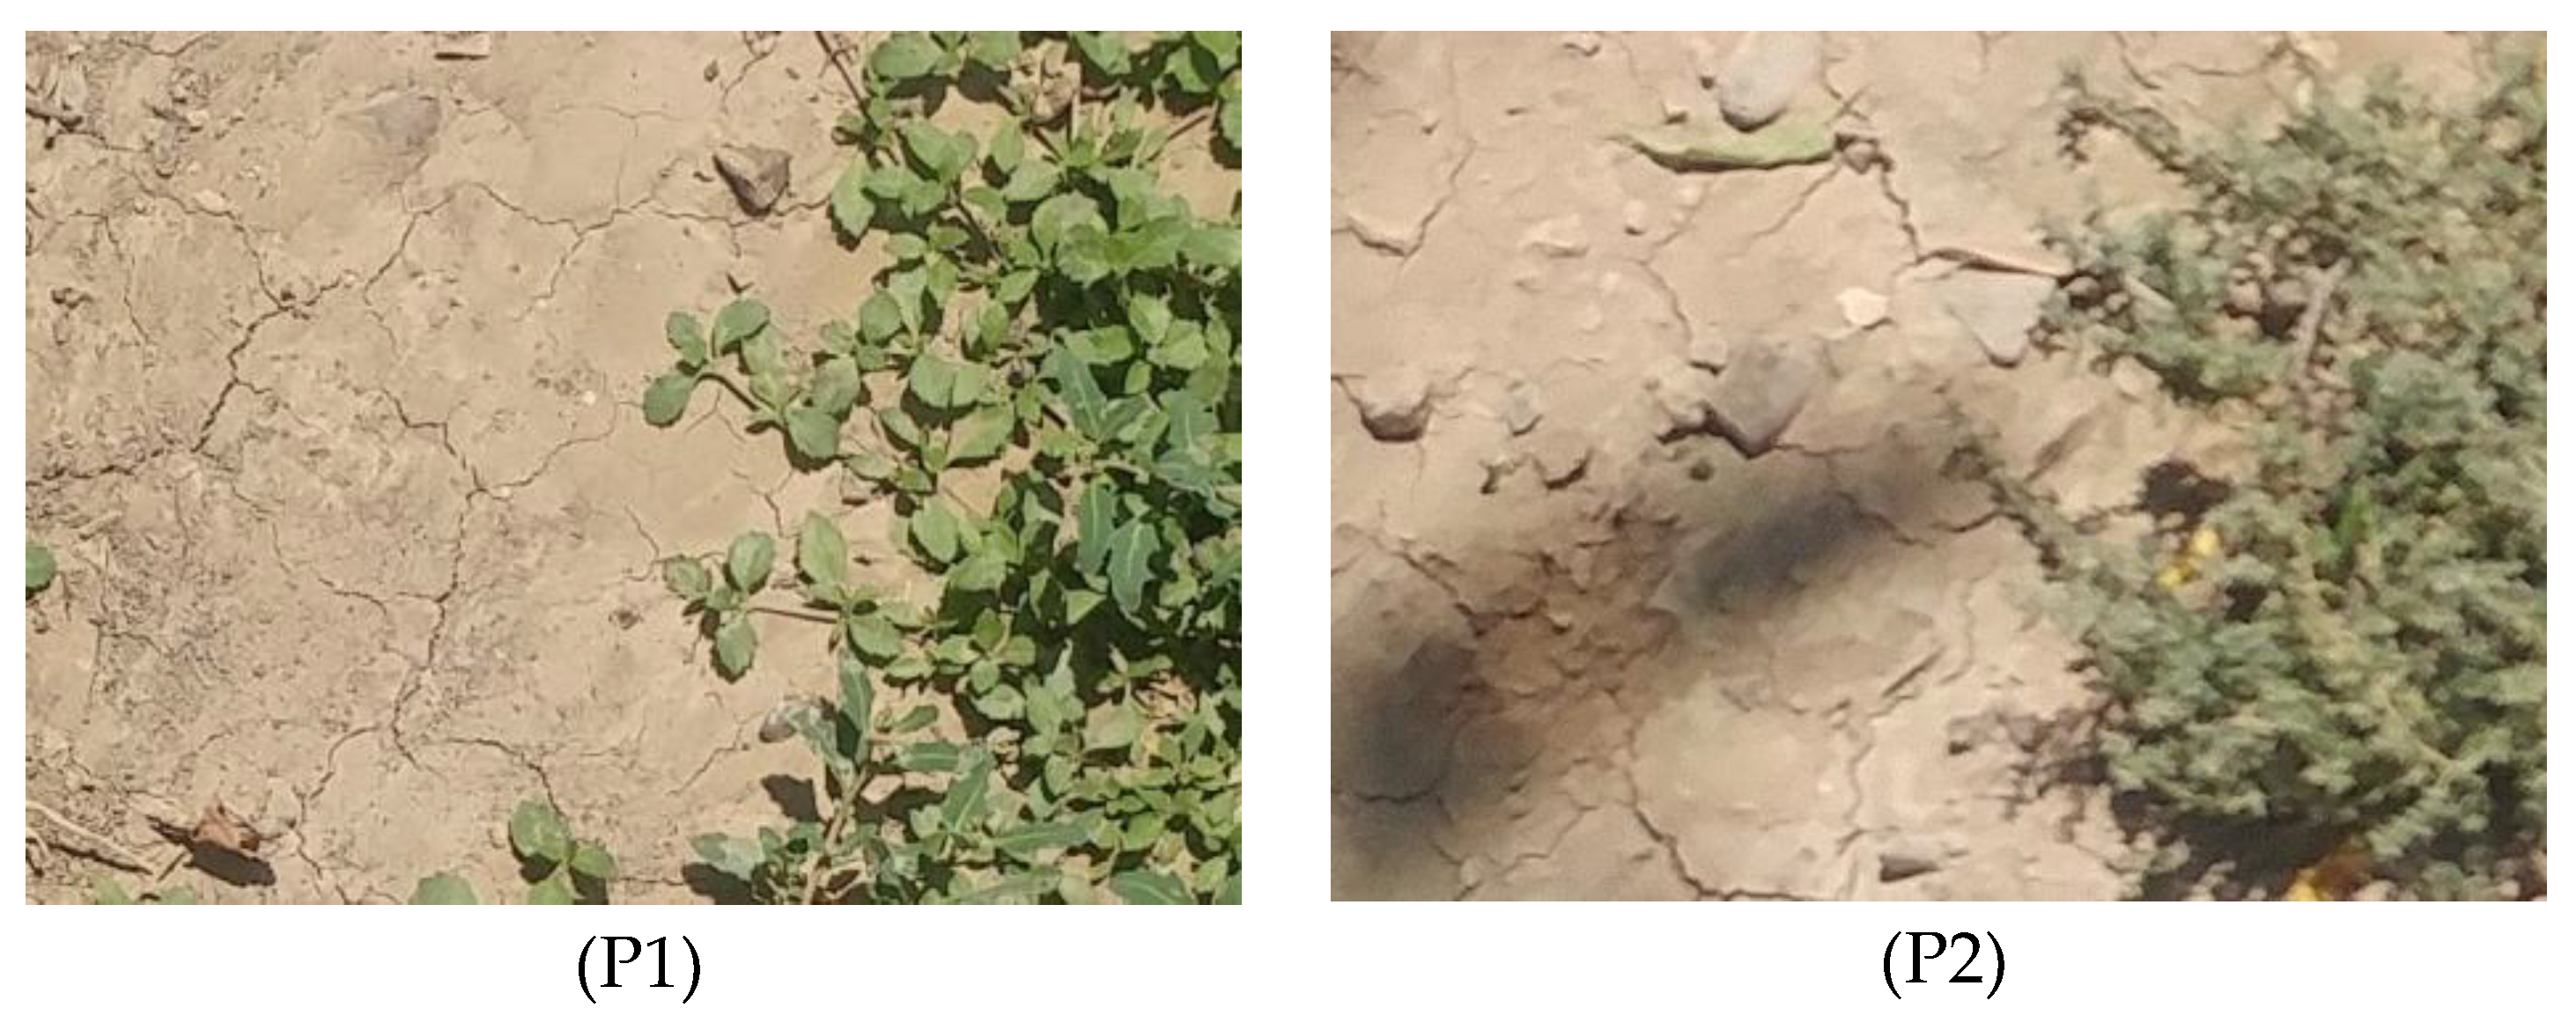
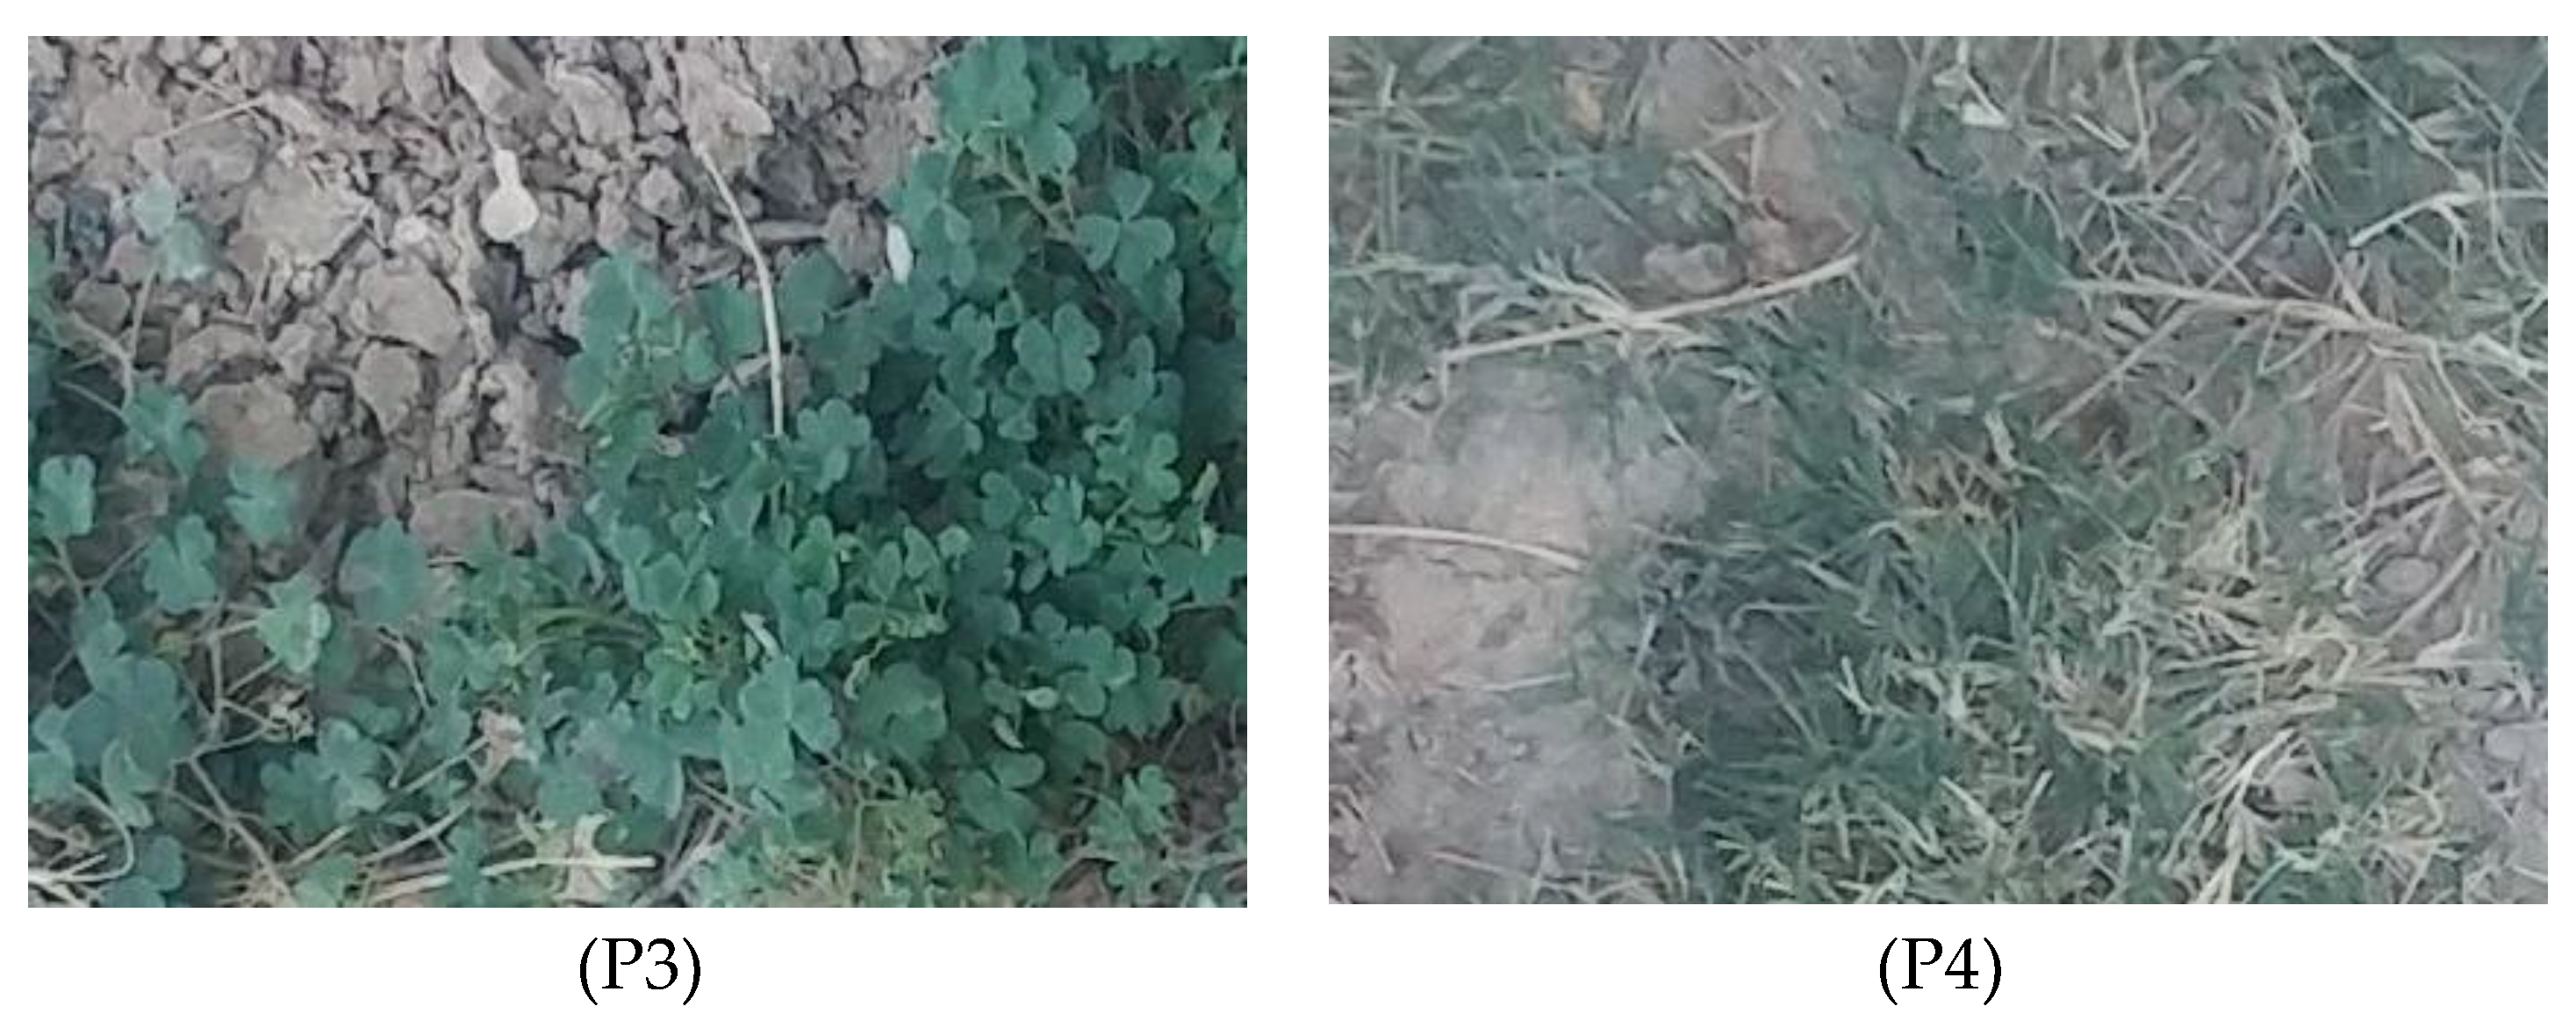
Figure 6.
Performance comparison of SOTA models (U-Net, FCN, DeepLabv3+) across different crop types (P1–P4) with and without augmentation.
Figure 6.
Performance comparison of SOTA models (U-Net, FCN, DeepLabv3+) across different crop types (P1–P4) with and without augmentation.
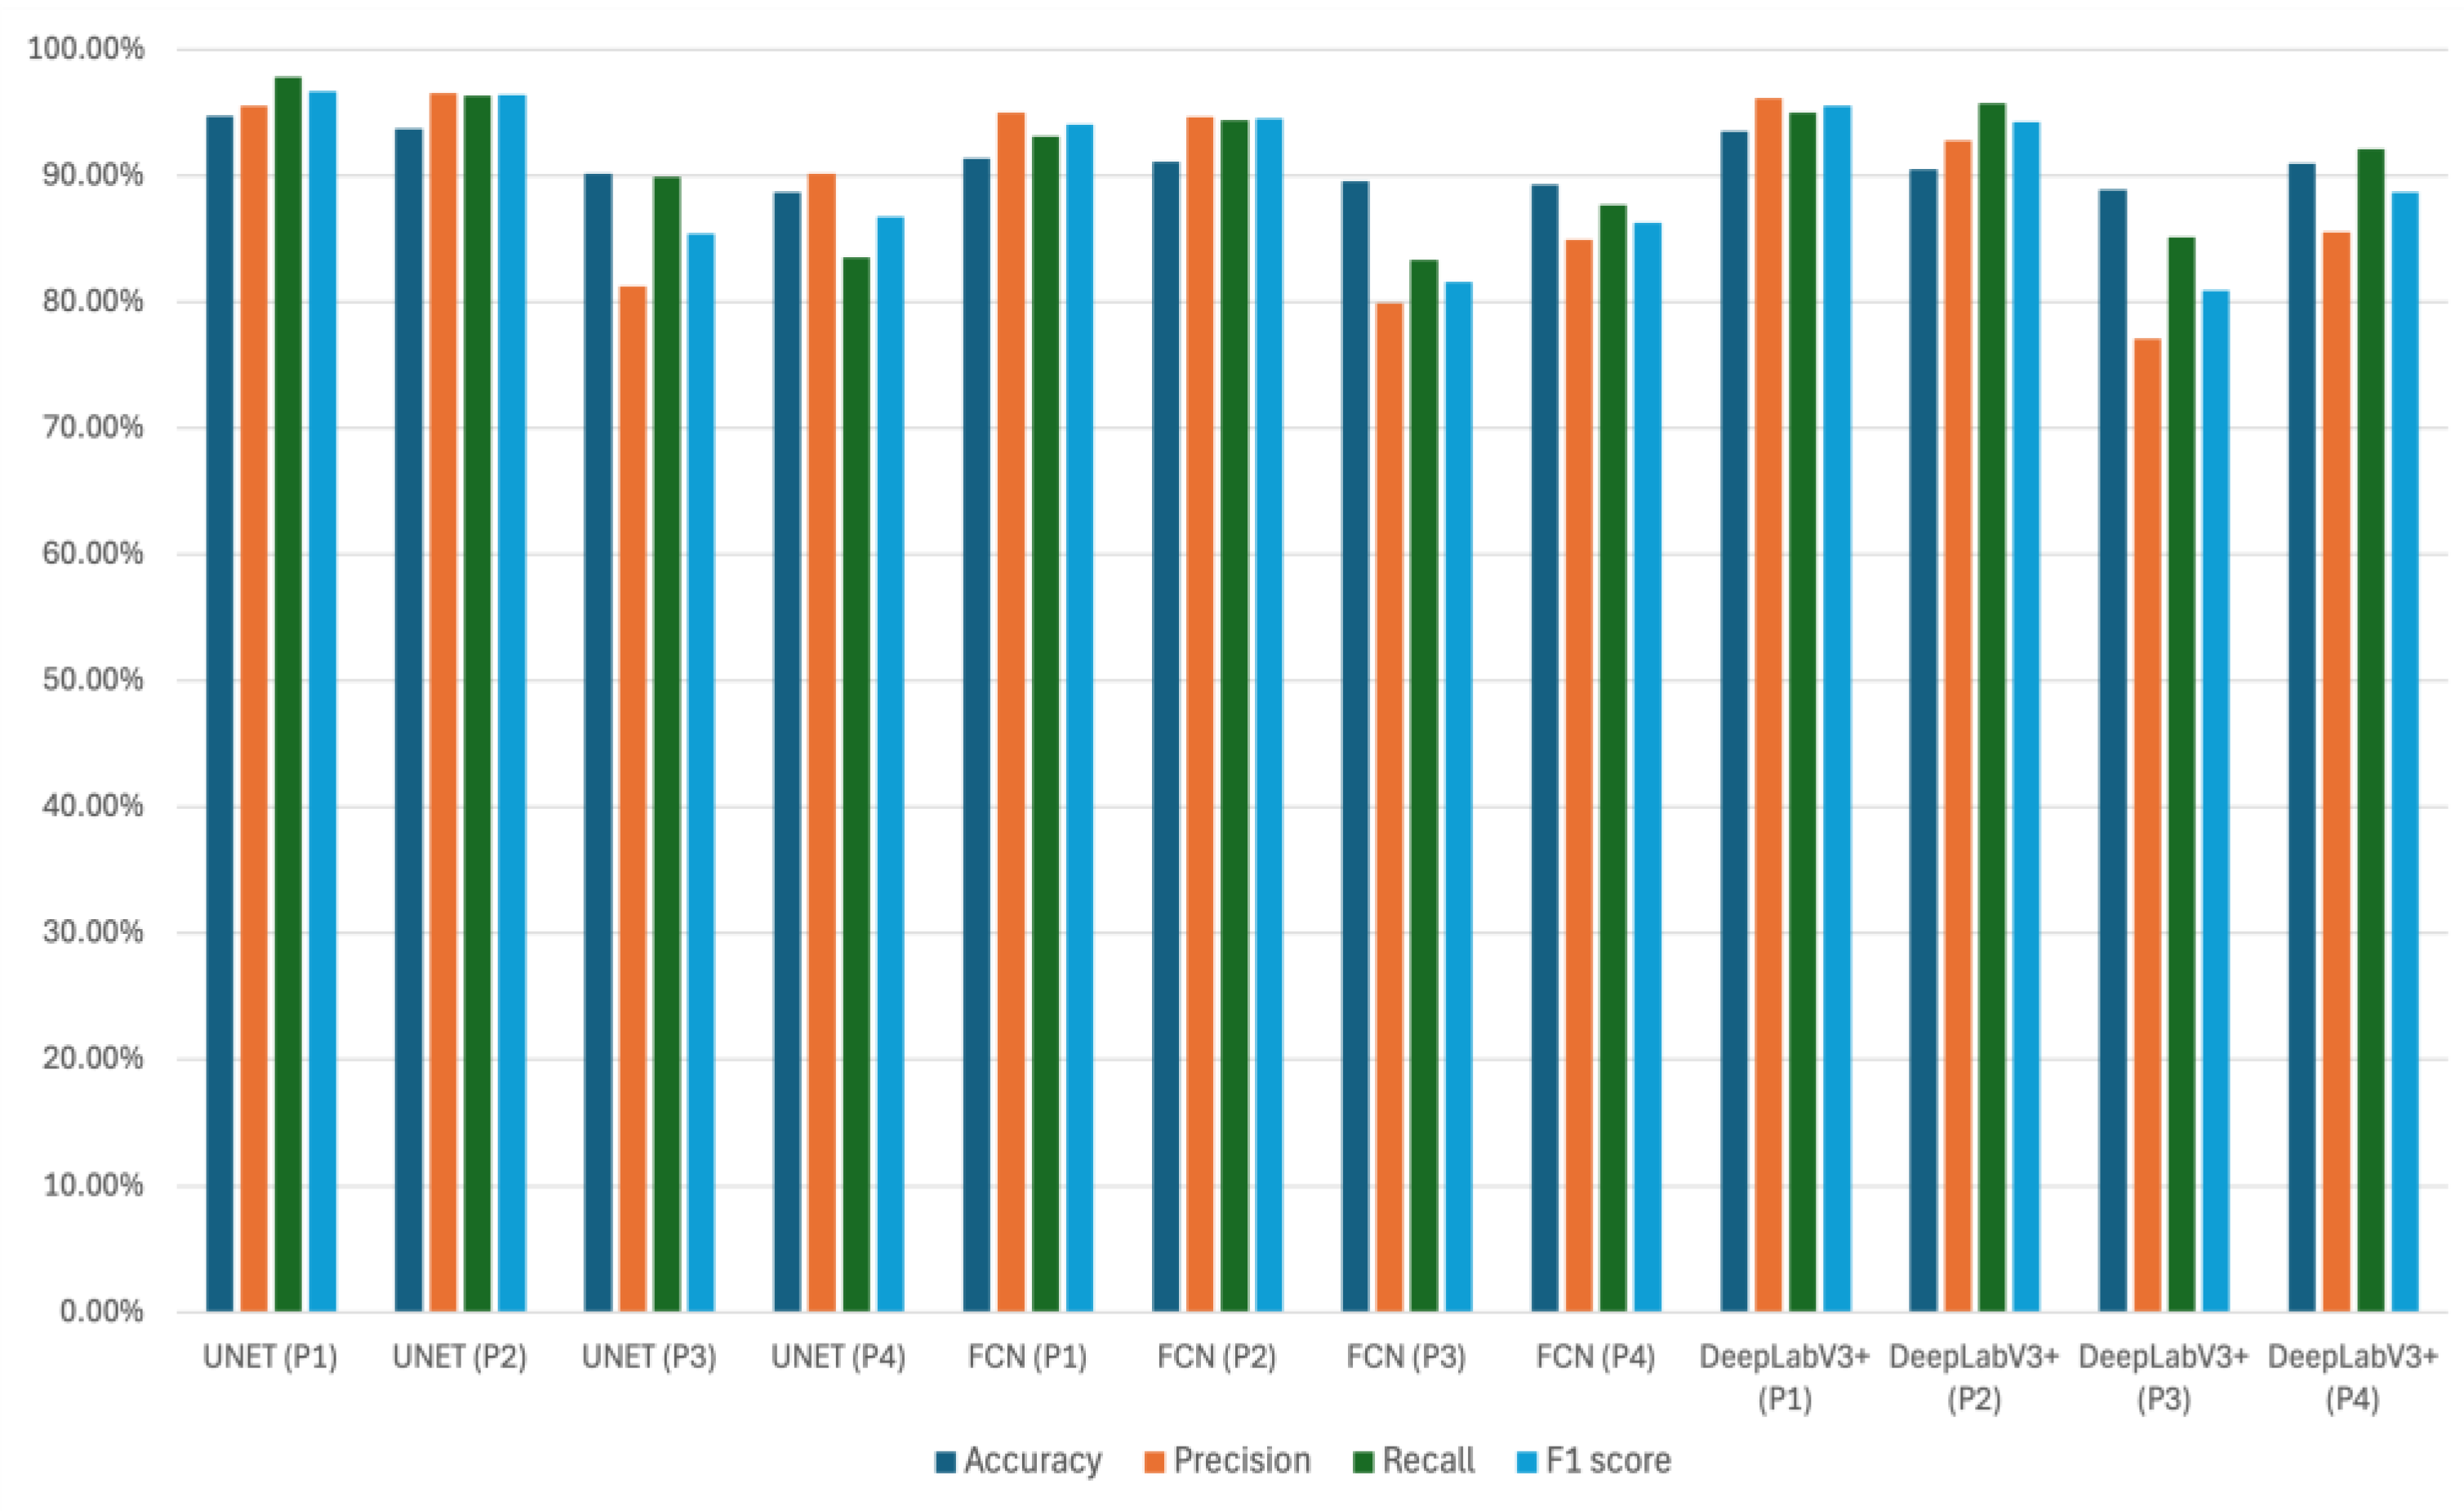
Figure 7.
Performance comparison of FCN, U-Net, and DeepLabv3+ models with backbones (ResNet-50, VGG16, EfficientNet) across plant types (P1–P4).
Figure 7.
Performance comparison of FCN, U-Net, and DeepLabv3+ models with backbones (ResNet-50, VGG16, EfficientNet) across plant types (P1–P4).
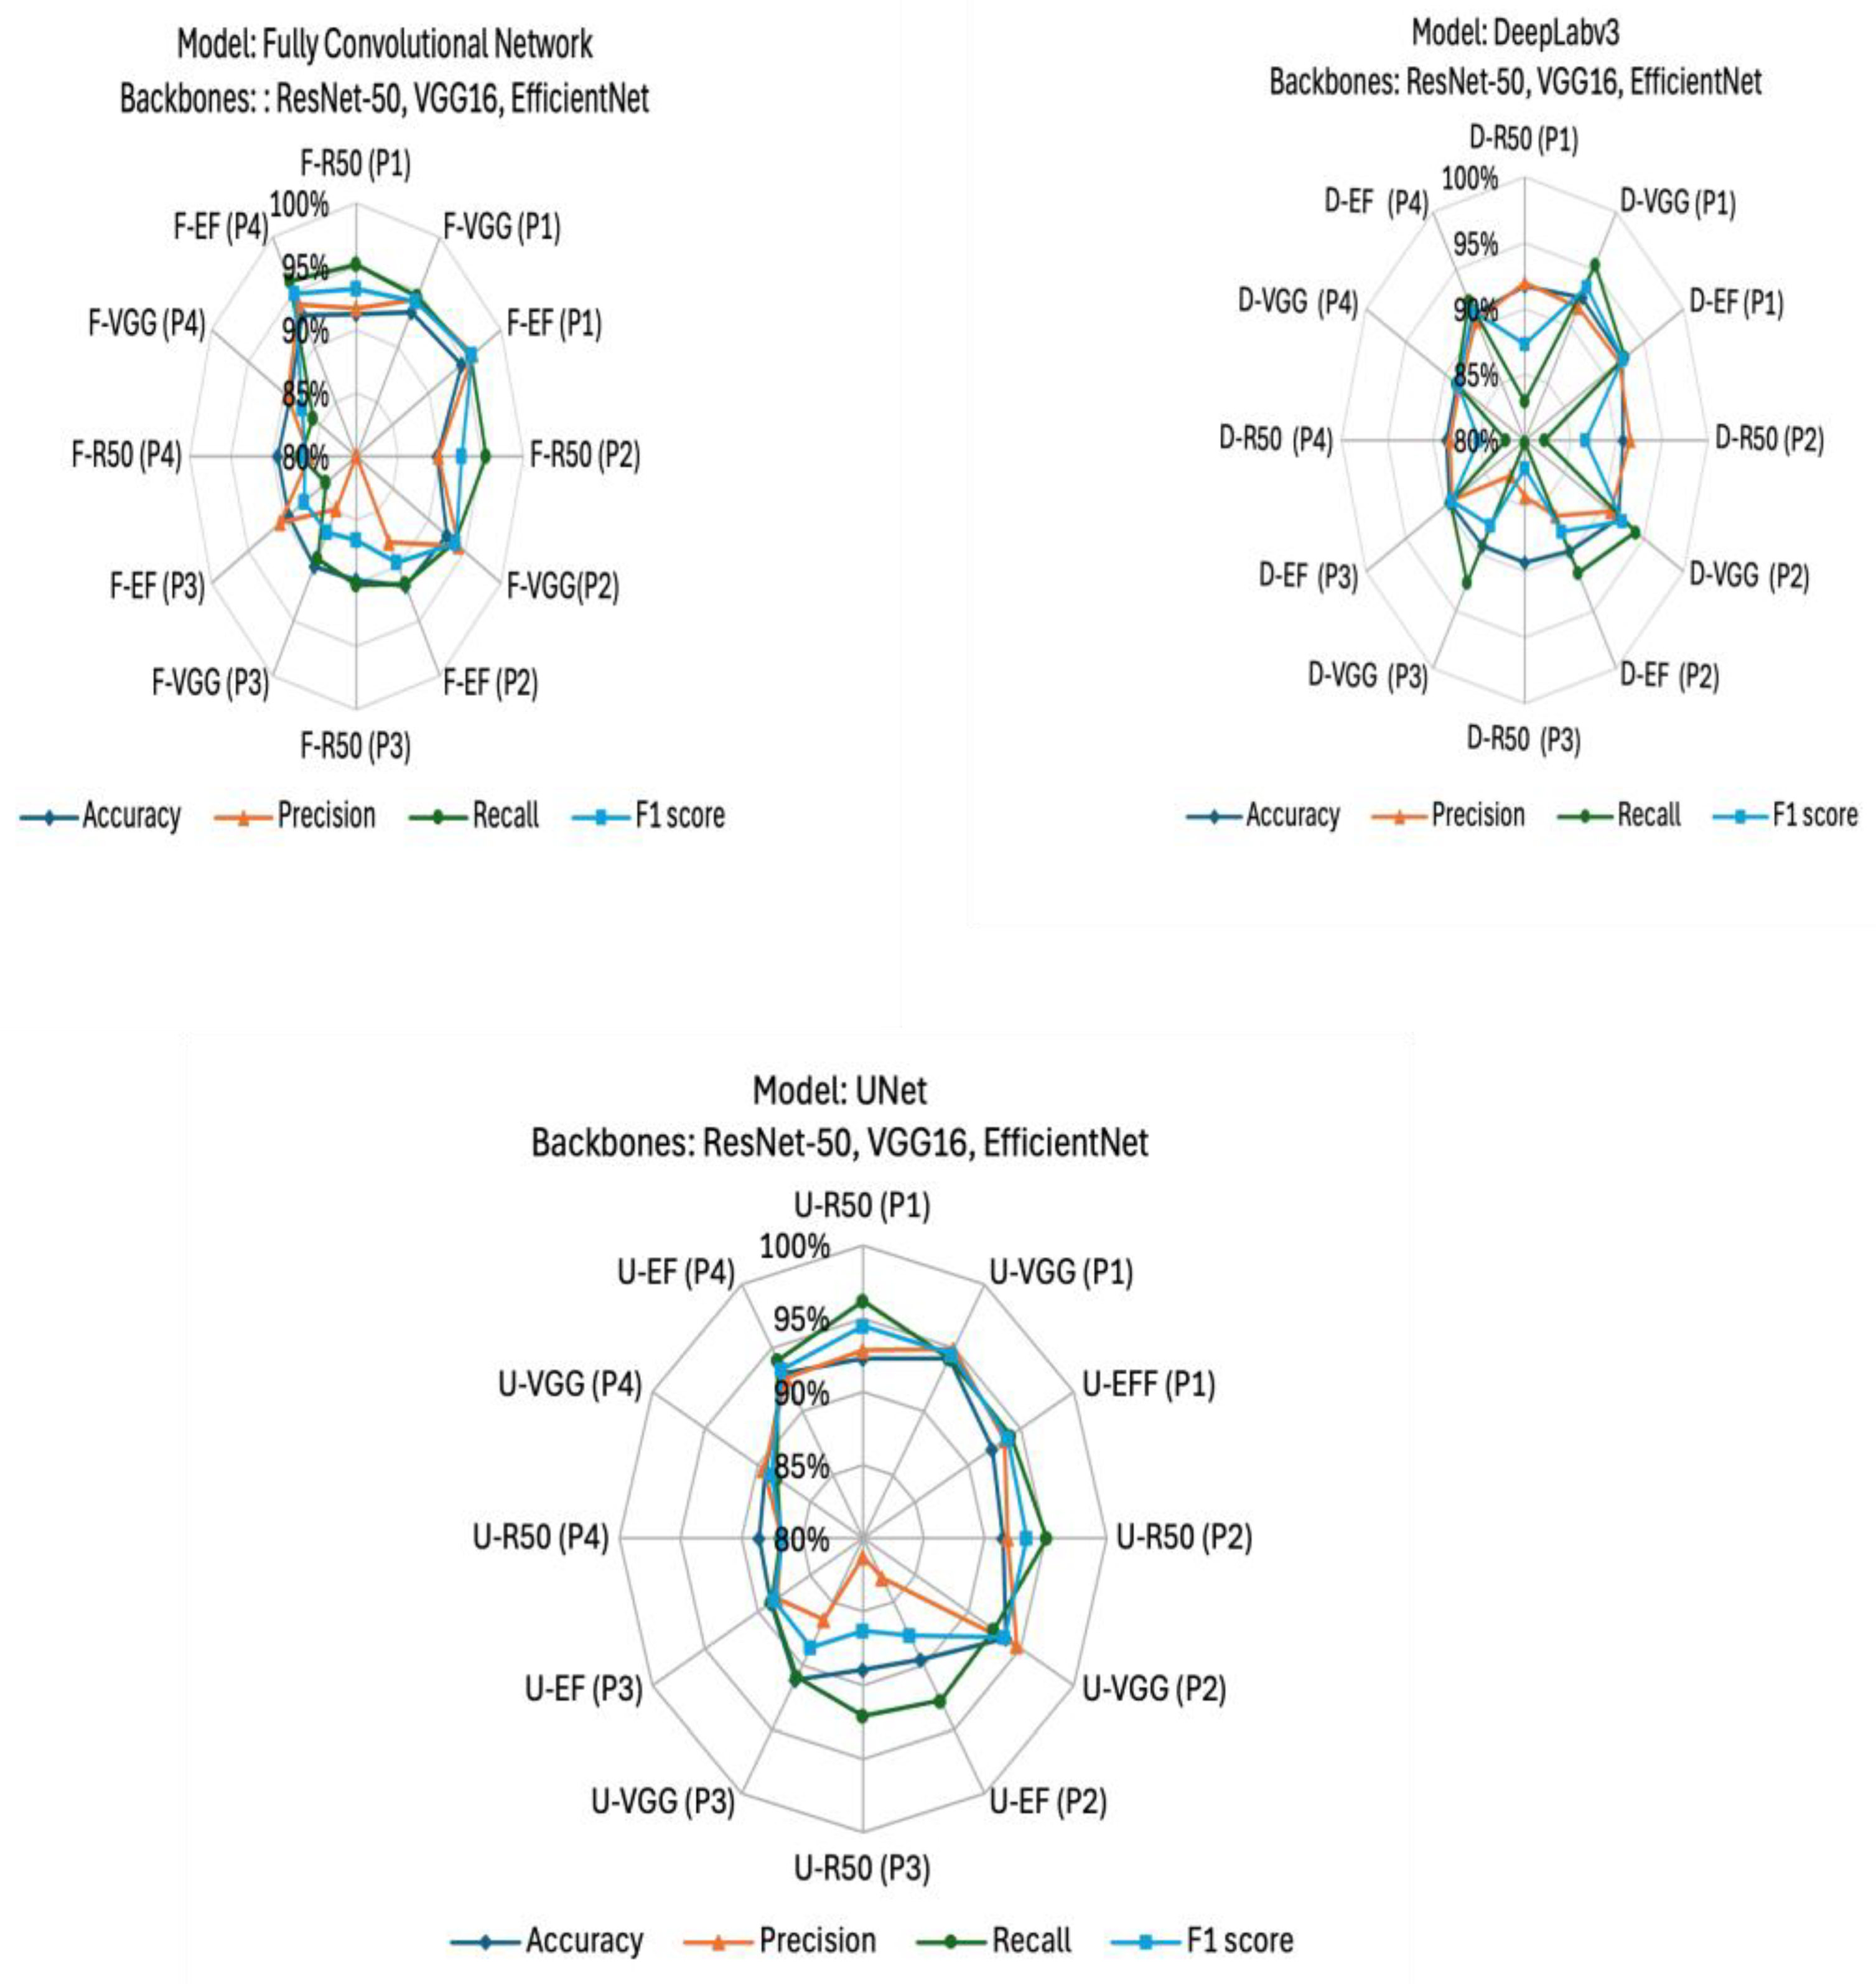
Figure 8.
Comparison of segmentation results for baseline and Stepwise Intervention and Reweighting method.
Figure 8.
Comparison of segmentation results for baseline and Stepwise Intervention and Reweighting method.
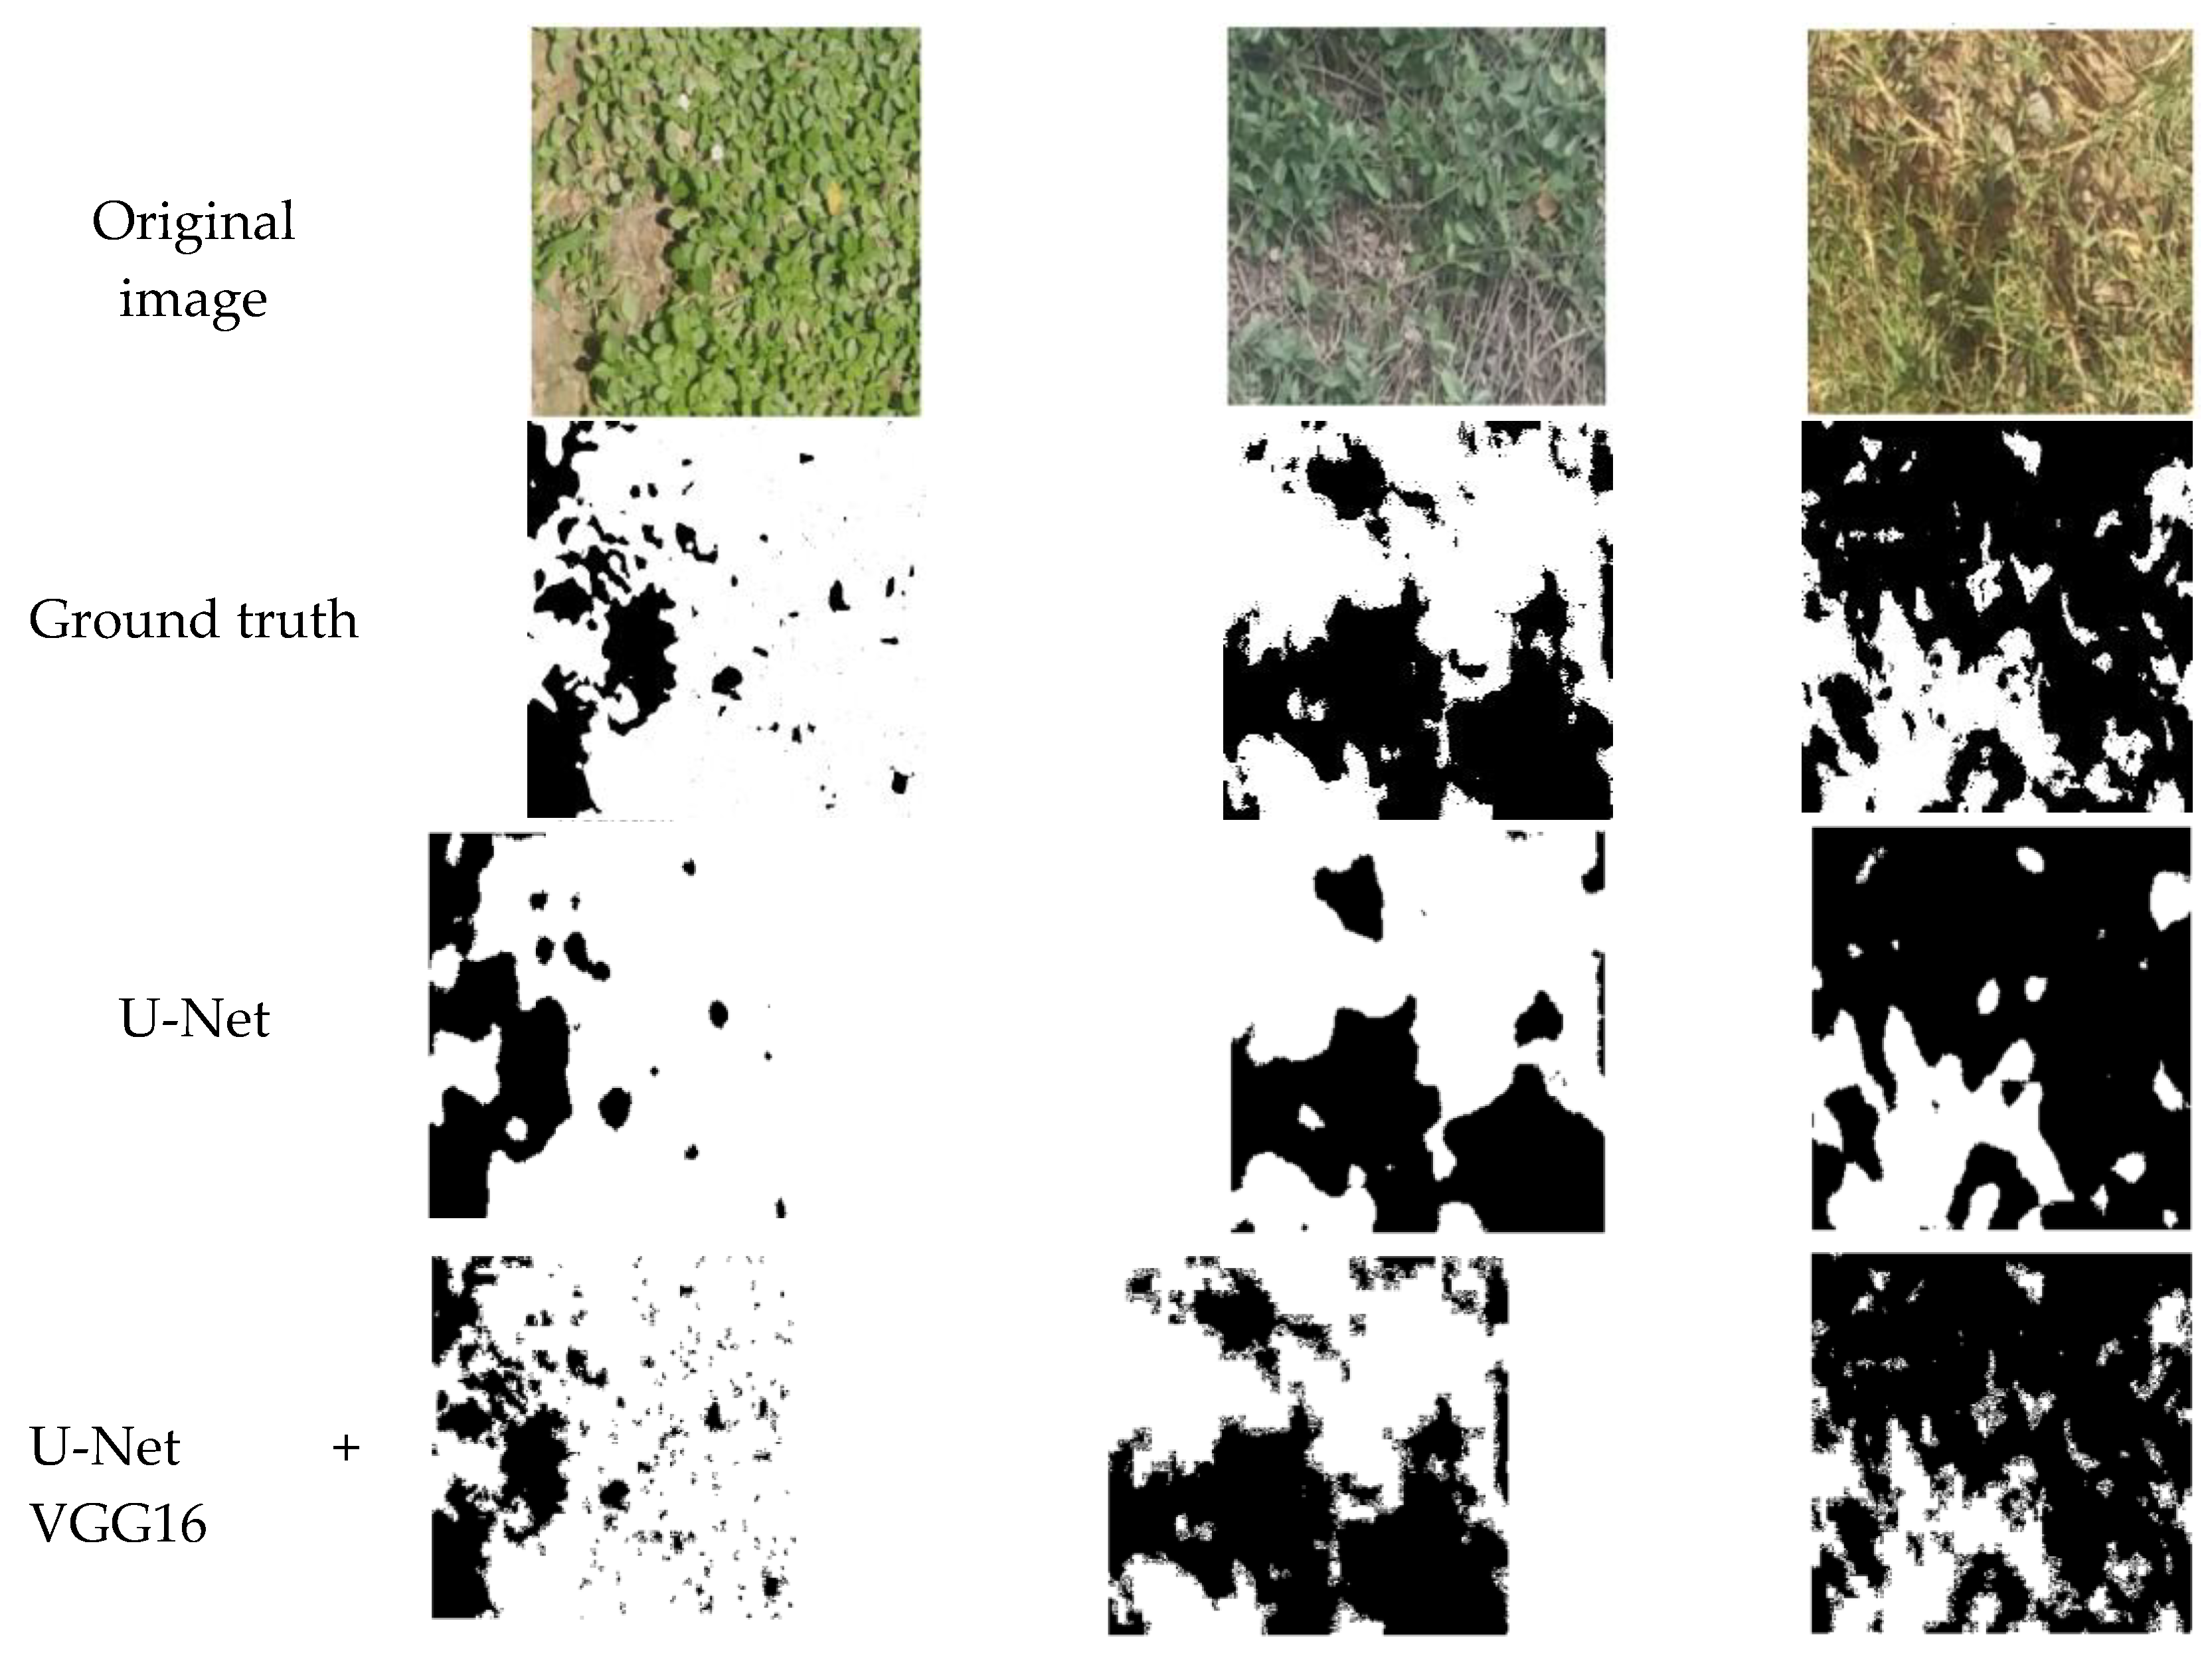
Figure 9.
Example segmentation results under variable lighting, color similarity, and vegetation sparsity.
Figure 9.
Example segmentation results under variable lighting, color similarity, and vegetation sparsity.
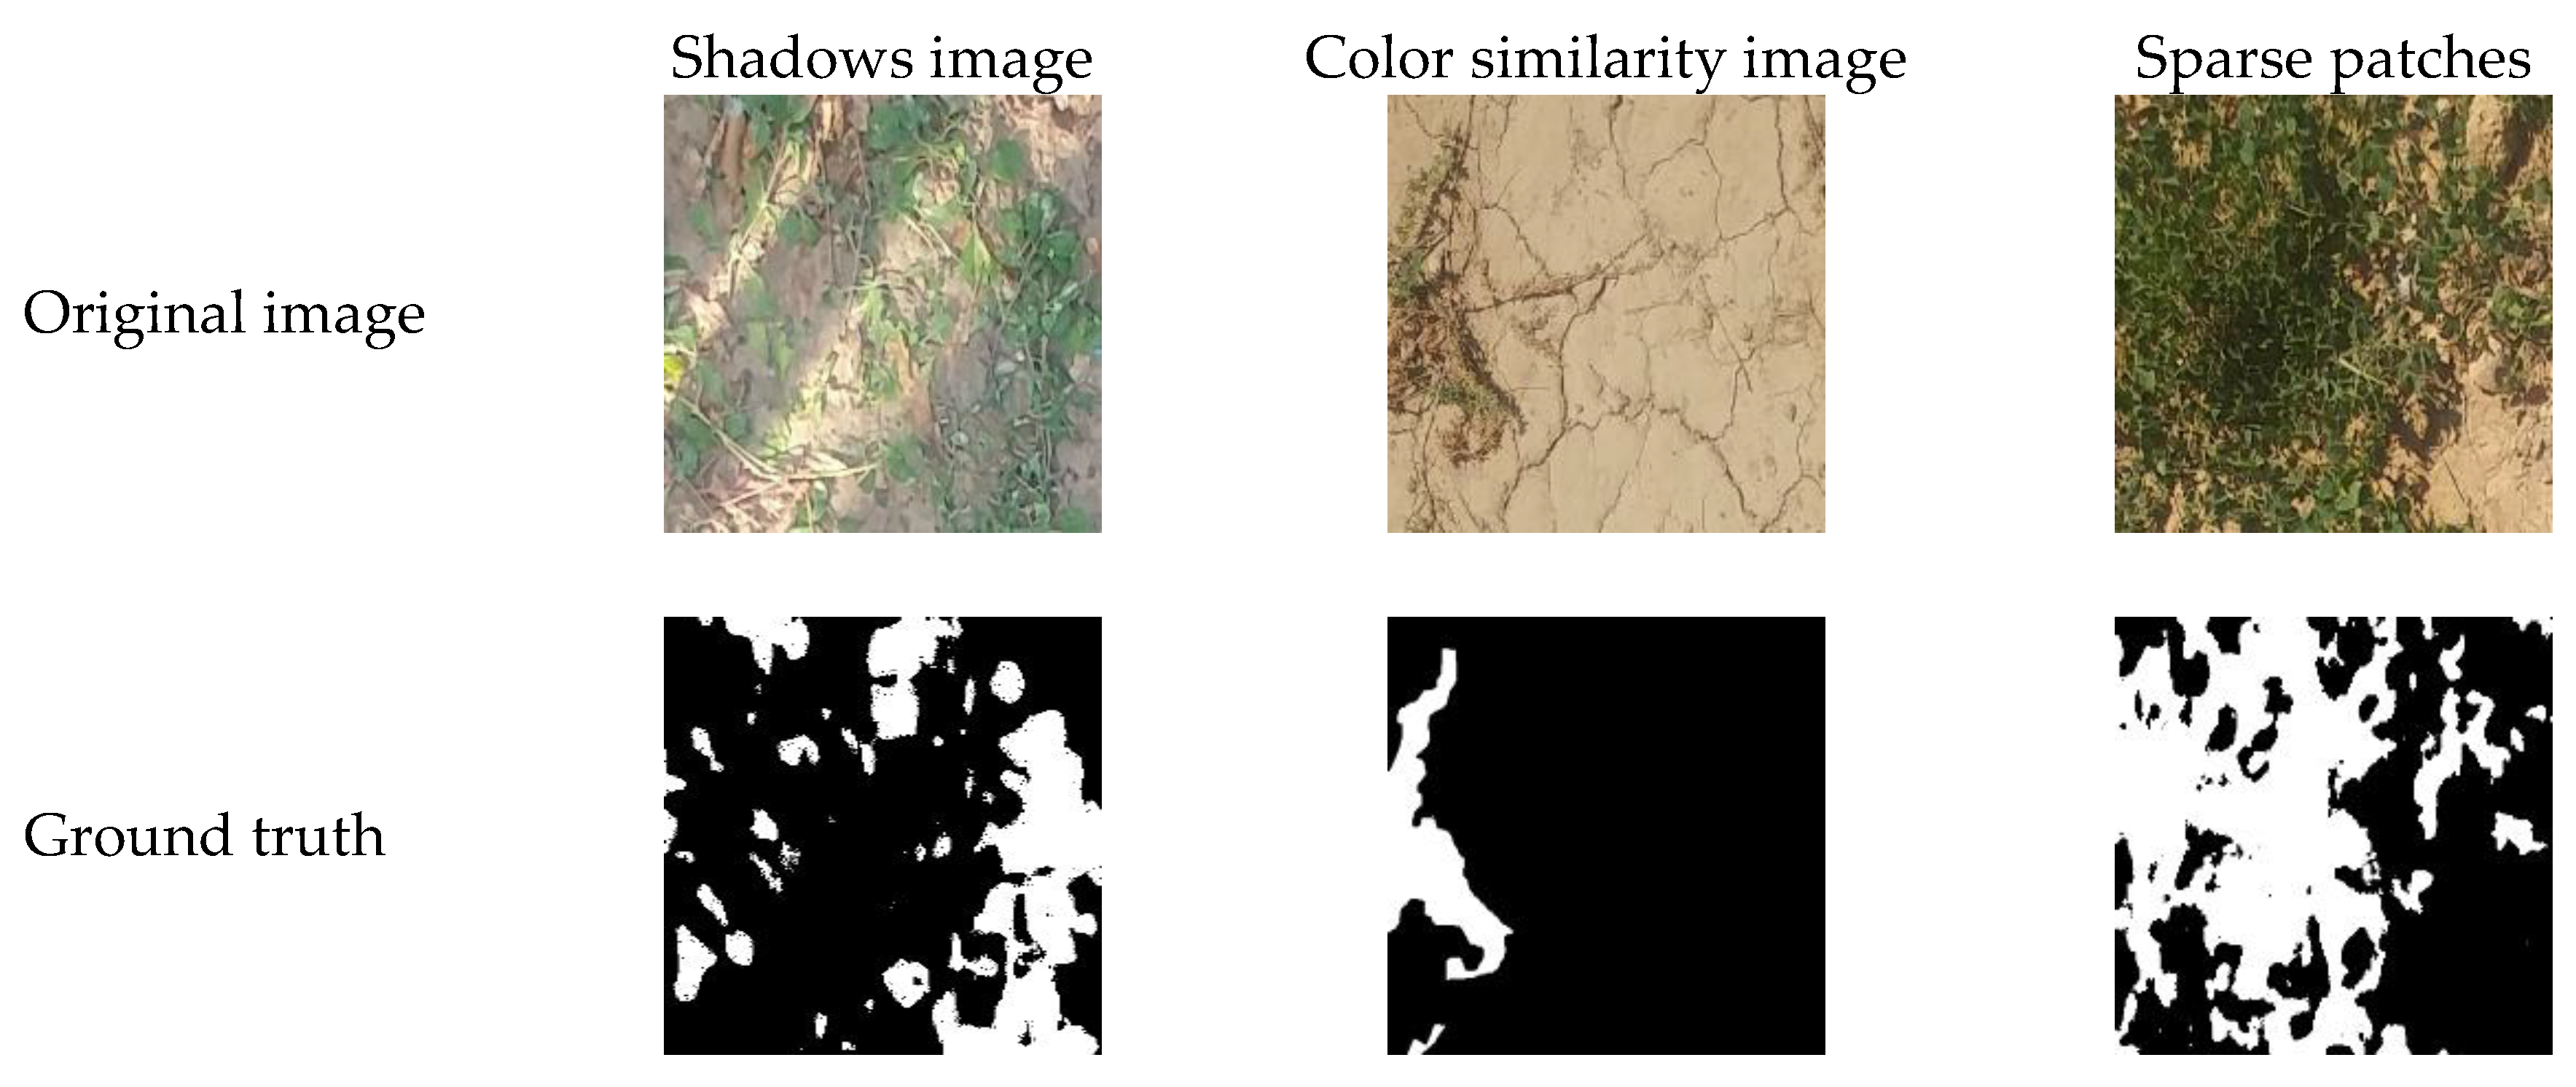
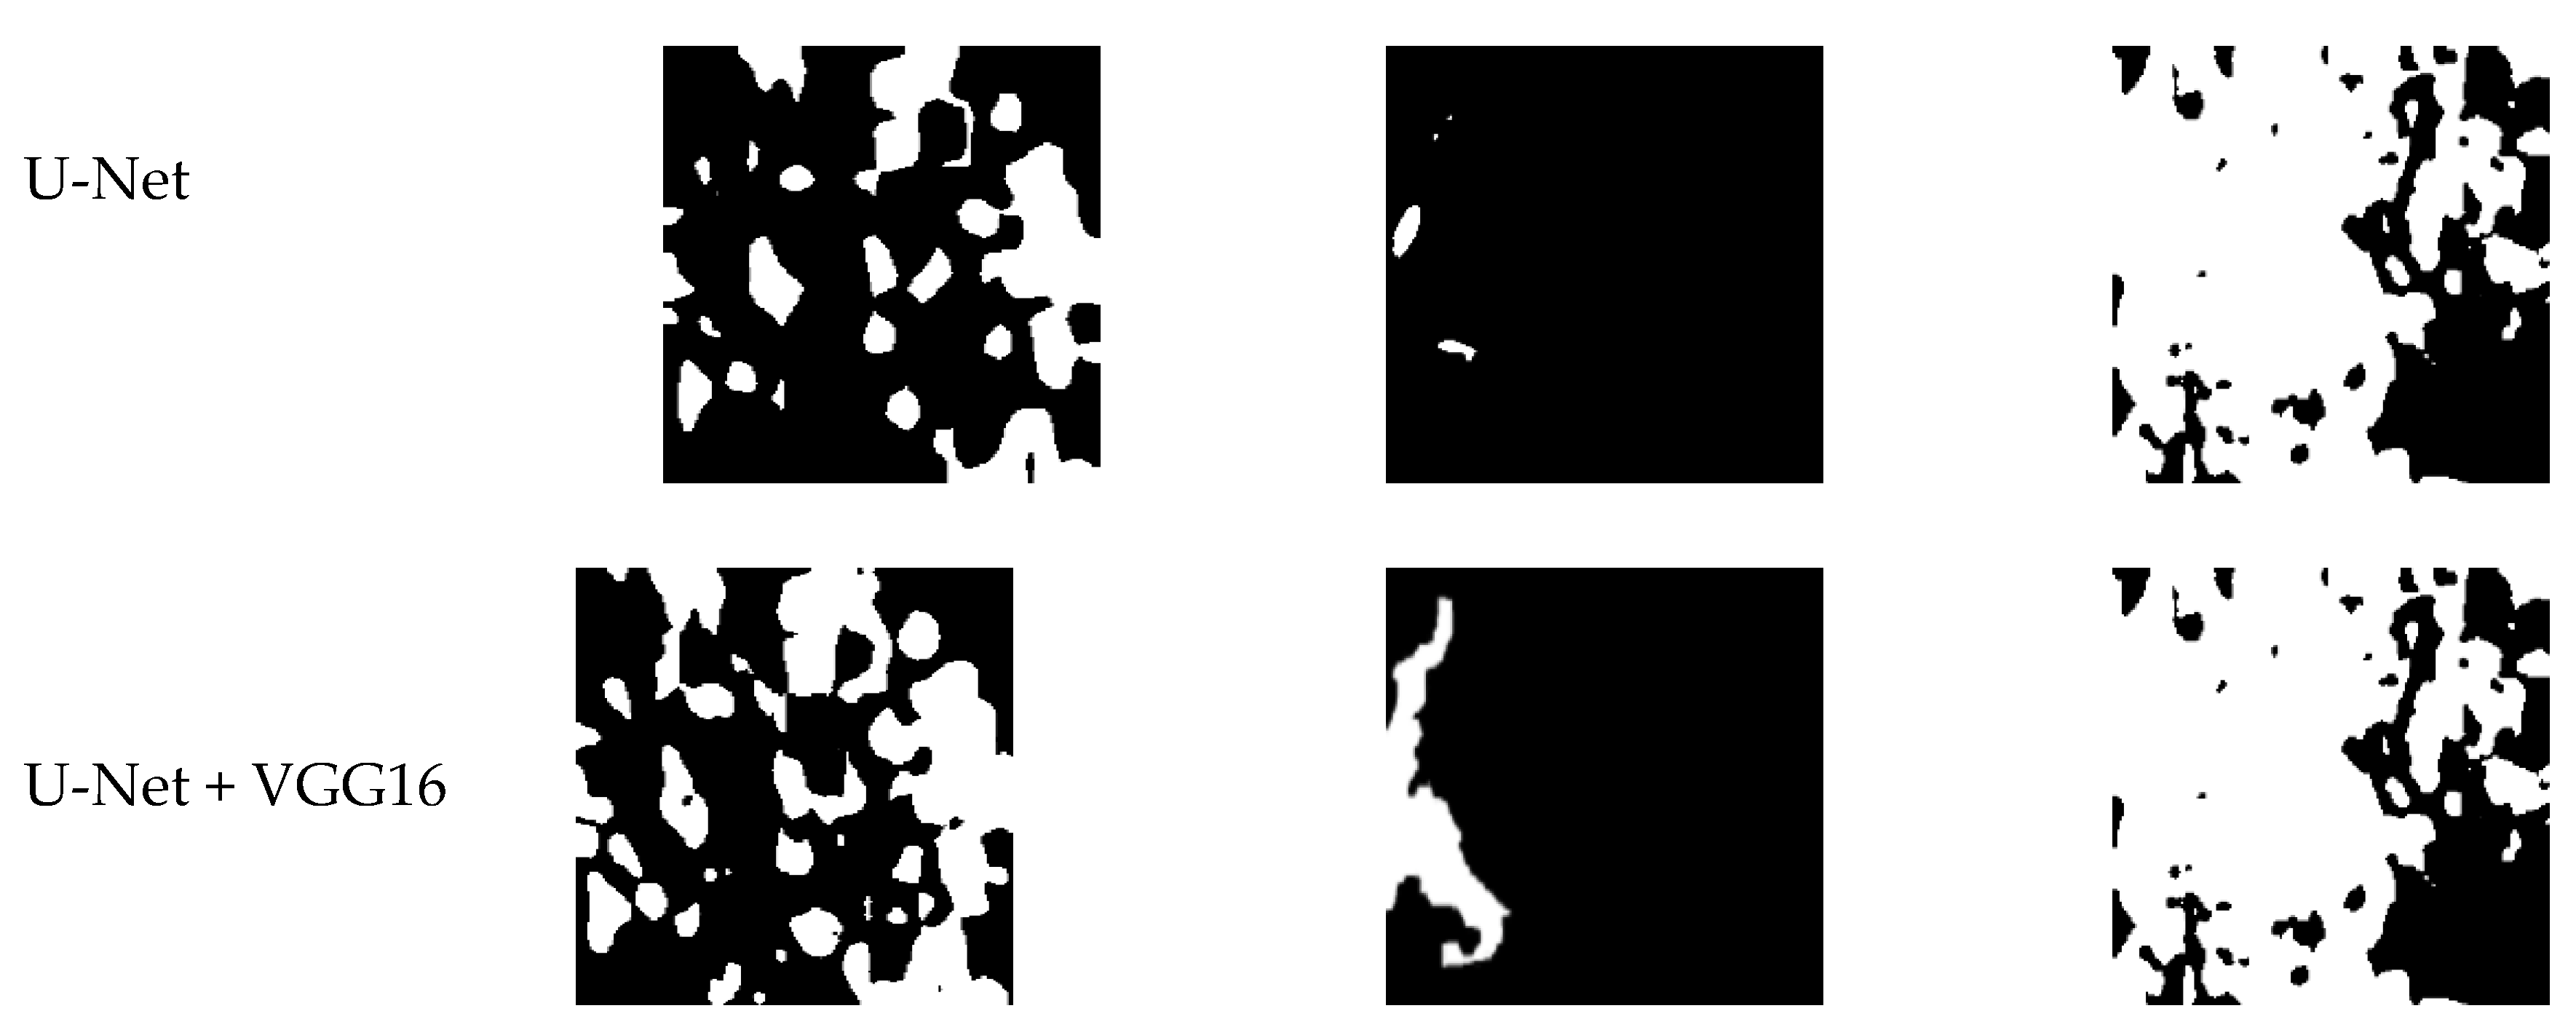

Table 1.
Quantitative performance of U-Net, DeepLabv3+, and FCN models with and without augmentation, evaluated using Accuracy, Precision, Recall, and F1-score.
Table 1.
Quantitative performance of U-Net, DeepLabv3+, and FCN models with and without augmentation, evaluated using Accuracy, Precision, Recall, and F1-score.
| Model | Accuracy | Precision | Recall | F1 |
| U-Net [38] | 91.09% | 90.95% | 93.04% | 91.98% |
| FCN [39] | 90.10% | 89.59% | 90.66% | 90.12% |
| DeepLabv3+ [43] | 91.17% | 91.63% | 90.53% | 91.08% |
| U-Net with Augmentation | 91.07% | 91.37% | 92.48% | 91.92% |
| FCN with Augmentation | 90.69% | 89.32% | 92.35% | 90.81% |
| DeepLabv3+ with Augmentation | 91.58% | 92.26% | 90.71% | 91.48% |
Table 2.
Performance comparison of segmentation models (FCN, U-Net, Deeplabv3+) with EfficientNet, ResNet-50, and VGG16 backbones using the causality-based learning.
Table 2.
Performance comparison of segmentation models (FCN, U-Net, Deeplabv3+) with EfficientNet, ResNet-50, and VGG16 backbones using the causality-based learning.
| Models | Backbone | Abbreviation | Accuracy | Precision | Recall | F1 |
|
FCN |
EfficientNet | F-EF | 91.99% | 91.46% | 92.57% | 92.01% |
| ResNet – 50 | F-R50 | 90.01% | 86.77% | 94.34% | 90.4% | |
| VGG16 | F-VGG | 91.13% | 90.68% | 91.61% | 91.14% | |
|
U-Net |
EfficientNet | U-EF | 90.86% | 88.87% | 93.33% | 91.05% |
| ResNet - 50 | U-R50 | 90.32% | 86.89% | 94.89% | 90.71% | |
| VGG16 | U-VGG | 92.04% | 92.31% | 91.65% | 91.98% | |
|
Deeplabv3+ |
EfficientNet | D-EF | 91.15% | 89.71% | 92.91% | 91.28% |
| ResNet - 50 | D-R50 | 90.57% | 89.49% | 81.86% | 90.66% | |
| VGG16 | D-VGG | 90.85% | 88.57% | 93.87% | 91.09% |
Disclaimer/Publisher’s Note: The statements, opinions and data contained in all publications are solely those of the individual author(s) and contributor(s) and not of MDPI and/or the editor(s). MDPI and/or the editor(s) disclaim responsibility for any injury to people or property resulting from any ideas, methods, instructions or products referred to in the content. |
© 2025 by the authors. Licensee MDPI, Basel, Switzerland. This article is an open access article distributed under the terms and conditions of the Creative Commons Attribution (CC BY) license (http://creativecommons.org/licenses/by/4.0/).
Copyright: This open access article is published under a Creative Commons CC BY 4.0 license, which permit the free download, distribution, and reuse, provided that the author and preprint are cited in any reuse.


