
Submitted:
30 September 2025
Posted:
01 October 2025
You are already at the latest version
Abstract
The objective of this study was to establish a fundamental framework for automated damage recognition in EPDM rubber diaphragms under industrial conditions. This was achieved using a four-light photometric stereo technique. In this study, we utilized a production dataset comprising 313 MD65 components with expert annotations to assess four binary tasks: kidney deformation, warp out-of-tolerance, wrinkle presence, and crack presence. Photometric-stereo normals are integrated into a height map, divergence-based features, and morphology-yield class decisions. The findings indicate an F1 score of 0.81 for both kidney and warp, with recall rates of 0.93 and 0.92, respectively, and precision rates of 0.72 for both. Crack detection is recall-oriented (recall 0.88) but precision-limited (precision 0.19) owing to systematic confusion with wrinkles. Wrinkle detection exhibits perfect recall but degrades specificity at the current operating point. This was addressed as a design choice for recall-first quality assurance and as a target for thresholding improvements. Our error analysis identified crack–wrinkle ambiguity as the predominant failure mode. We delineate a comprehensive methodology, comprising polarization imaging, regulated deformation during acquisition, and a lightweight CNN cascade, to enhance selectivity while maintaining industrial robustness. This study establishes a transparent, reproducible baseline and evaluation protocol for future iterations on elastomeric surfaces.
Keywords:
damage assessment
; industrial optical inspection
; photometric stereo
; elastomer inspection
; EPDM
; height map
; divergence/curvature
; quality assurance
1. Introduction
Elastomer diaphragms employed in diaphragm valves are exposed to several thousand operational cycles during their lifespan, which invariably leads to the emergence of cracks, wrinkles, and other forms of damage. Documenting these patterns is essential to refine the design and enhance the durability of these components. Currently, diaphragm inspection is manually performed using optical methods. SISTO Armaturen S.A. conducted extensive testing on the diaphragms of its valves to enhance the understanding of their wear patterns and to improve the overall process quality. Traditionally, these evaluations have been performed manually. To standardize assessments and minimize reliance on human inspectors, the company plans to transition to an automated surface inspection system that utilizes advanced image processing technologies.
Image processing is used across various fields including, but not limited to, medical imaging, surveillance, industrial inspection, manufacturing, and remote sensing [1]. This paper specifically addresses its application in inspecting damage patterns that may develop over time on the surfaces of elastomer diaphragms. These diaphragms are crucial components within typical diaphragm valve assemblies.
The Photometric Stereo (PS) technique was employed to distinguish and accurately delineate different types of damage patterns on these diaphragms. PS is chiefly used for reconstructing an object’s three-dimensional shape by analyzing its reflective characteristics under controlled lighting conditions. Depending on the specific method employed, one or more images can be used as inputs for this reconstruction [2]. This paper details the application of the Woodham PS algorithm [3] using Lambertian reflectance, highlighting its effectiveness and potential advantages in automated industrial inspections.
Diaphragm Valves
Diaphragm valves are predominantly utilized in industries where maintaining the sterility of the transported liquids is critical. These industries include pharmaceuticals, food processing, and cosmetics. The fundamental components of these valves include valve seating, which features a thin, elevated surface known as a weir, the diaphragm itself, and an actuator that can be operated either manually or pneumatically. In the configuration of these valves, the liquid medium interacts exclusively with the valve seat and the underside of the diaphragm, which together form the lower part of the valve assembly, as shown in Figure 1. This design minimizes surface contact with the medium, which simplifies the cleaning and maintenance processes, making diaphragm valves more advantageous in terms of hygiene and maintenance than other, more commonly used valve types.
2. Related Work
2.1. Photometric Stereo with Multiple Lighting
Shape-from-shading (SFS) is the process of reconstructing 3D shapes or surface normals from the brightness distribution in a single 2D image. Classic SFS methods (such as the one developed by Horn in the 1970s) assume idealized Lambertian surfaces and known lighting. This limits their applicability to industrial applications. Shiny or textured “uncooperative” surfaces violate these assumptions. Alternative approaches have been used in such cases. For instance, Landmann et al. projected thermal noise codes onto highly reflective objects to accurately measure their shape despite their challenging material properties [4]. In addition, SFS is now combined with modern methods. For instance, Selamet et al. [5] integrated SFS into a deep-learning system by extracting additional features for defect detection from an SFS depth image and merging them with a Faster R-CNN. This adaptive fusion method enables a more robust determination of the location, type, and surface profile of defects on metal parts than purely learning-based approaches. Our approach builds on this idea but uses SFS under adapted (material- and lighting-specific) conditions, thus closing the gap of reliable shape reconstruction on elastomer surfaces, a scenario that has hardly been investigated by conventional SFS methods.
The photometric stereo method [3] is an extension of SFS that captures multiple images of an object under different lighting conditions. These brightness differences can be used to calculate the surface normals point by point, which can then be integrated to produce a height profile of the surface. A classic photometric stereo system consists of a fixed camera and multiple-directional light sources. This method is ideal for fast, non-contact 3D measurements, and was initially used for defect detection. However, more recent studies have addressed the limitations of standard methods. In 2023, Liu et al. [6] developed a dynamic photometric stereo method for moving test parts. Through automatic Region-of-Interest (ROI) determination and mapping of the normals obtained from photometric stereo onto a curvature map, surface defects on cast aluminum parts can be detected robustly in real time. This method is fast and efficient for online use. Another trend involves the combination of photometric stereo and classic 3D sensors. In 2024, Shi et al. [7] proposed an adaptive fusion of photometric stereo and line-light projections. Their system combines the high geometric accuracy of structured lighting with the detailed sensitivity of the photometric stereo normal fields. The results were 3D measurement data with high precision and clarity. This study demonstrated the versatility of multiple lighting methods. Photometric stereo approaches have primarily been tested on metal or plastic surfaces. Our work is the first to transfer this concept to EPDM rubber material, showing that targeted multiple illumination can also be used for soft matte surfaces to reveal subtle shape deviations (e.g., micro-cracks).
2.2. Visual Inspection Methods for Industrial Surfaces
Over the past five years, there has been a major shift in automated visual inspection from traditional image processing methods to deep neural networks [8]. Traditional algorithms, such as thresholding and pattern recognition methods, can only reliably detect narrowly defined defect patterns. These algorithms are sensitive to noise, lighting changes, and complex backgrounds. Early systems, such as those described [9] in 2009, used fixed pattern comparison algorithms for defect detection or simple image segmentation techniques [10], which quickly reached their limits under real production conditions involving oil, dirt, and variances. More recent work relies on purely image-based methods, such as detecting forging defects using image preprocessing and thresholding [11]. Deep-learning methods now offer significantly more robust solutions in this area. Numerous review articles, for example by Bhatt et al. (2021) [8], Gao et al. (2022) [12], Qiao et al. (2025) [13], and Ren et al. (2022) [14] categorize current methods and demonstrate the trend toward domain-specific, trained Convolutional Neural Networks (CNN) models for various materials. These networks can also learn from difficult cases such as low contrast, scratches in textures, and lighting reflections. However, a central problem in industrial quality assurance is that defect data is often sparse and difficult to annotate [15]. This is where anomaly detection comes into play. Liu et al. (2024) presented a comprehensive survey of deep learning approaches for industrial anomaly detection, including different network architectures, training types (supervised and unsupervised), and loss functions [16]. Previous studies on anomaly detection have only produced a label indicating whether an object is good or bad. Some of the approaches described here also generate a heat map as part of the output, which can be used to evaluate the size and location of errors. Many current studies rely on self-supervised learning, which involves generating “defects” from defect-free images to train the network. Pei et al. [15] proposed the generation of pseudo-anomalous images through patch-based insertions and targeted augmentation. This approach achieved a detection accuracy of ~97.6% (AUC) on datasets such as MVTec AD. In addition to these universal approaches, specialized solutions are available for specific industries. For example, Ma et al. (2023) investigate the effectiveness of various methods for wafer surface inspection in the semiconductor industry [17]. Qiao et al. [13] and Ren et al. [14] systematically discussed classical versus AI-based methods for metallic surfaces, ranging from classical image-filtering methods to current transformer networks for steel surface defects. An interesting hybrid approach comes from Selamet et al. (2022), who combined deep learning with shape-from-shading to more reliably detect damage on shiny metal parts [5]. Finally, efficiency is also driving research. Zhang et al. showed that a specially equipped CNN could detect conveyor belt damage with over 93% accuracy at 70 fps [18]. Our solution differs from most of these works in that we combine physical lighting principles (photometry) with machine vision. This reduces the need for large error datasets, which is advantageous in our use case because real defects (e.g., aged components) are rare and difficult to label. Additionally, our approach focuses on a material (EPDM rubber) and defect types (aging cracks) that are underrepresented in the existing vision literature.
2.3. Optical Inspection of Rubber and Elastomer Surfaces
Visual quality control of rubber parts (e.g. seals, rollers and O-rings) can be challenging due to the low contrast of dark, often shiny or textured surfaces, and the need for high resolution to detect defects such as burrs, air pockets and fine cracks. To address these issues, specialised systems have been developed. Ho et al. (2020) presented an automated inspection system for rubber O-rings that combined classic image processing with deep learning [19]. By combining rule-based inspection modules with a convolutional neural network (CNN), typical manufacturing defects in silicone seals can be detected with high precision. Nguyen et al. (2023) focused on black rubber rollers and emphasized the importance of adapted lighting [20]. Their machine vision system uses specially arranged area lights and two different detection algorithms (classical and learning-based) to locate defects along the cylinder surface. The system achieves industrial-grade performance and can replace manual visual inspections. Similar domain-specific work exists for other rubber components: for example, Bharathi et al. [21] used texture analysis for defect detection and specific preprocessing to suppress dust on rubber sealing rings. Meng et al. [22] used a visual inspection method toinspect rubber hoses. This demonstrates that tailor-made algorithms are often required. In addition, active optical methods are increasingly being used; for example, Tao et al. (2022) combined structured light projection with a YOLO-based specialized detector to detect defects on rubberized rollers in real time [23]. While existing systems usually work either purely visually or using measurement technology (e.g. laser triangulation), our work is in line with these developments but differs in terms of methodology; we pursue a combined approach. We can obtain shape information in addition to the intensity image through photometric multiple illumination of rubber surfaces, which is particularly advantageous for defects that are difficult to observe (e.g. fine indentations and hairline cracks). This principle has not yet been systematically investigated in relation to elastomers and thus represents a key novel aspect of our process.
2.4. Characterization of EPDM and Detection of Visual Damage
Ethylene propylene diene monomer rubber (EPDM) is a widely used elastomer in seals, sealing profiles, and technical rubber goods. Because of its weather resistance, EPDM is often used outdoors; however, it ages under stress, which can lead to deformation, cracking, and embrittlement [24]. Early detection of such aging damage is important for quality assurance. Until now, however, this has mainly been carried out manually and visually. Automated methods, specifically for EPDM, are rarely found in literature. Xu et al. (2025) described an initial approach for objectively evaluating aging cracks on rubber surfaces. Their system records the crack formation over time and correlates it with the degree of material degradation to better understand the aging process. In addition, related research areas can be drawn upon. For example, in infrastructure monitoring (road construction), a great deal of work has been conducted on the detection of cracks in asphalt and concrete that can be transferred methodologically. Modern approaches use neural networks for pixel-accurate segmentation of fine cracks, even on complex textures. For example, Guo et al. (2022) developed a convolutional neural network (CNN) with a boundary-aware module that can precisely identify thin surface cracks on road surfaces despite strong background differences [25]. Yang et al. (2023) use an encoder-decoder architecture to detect cracks in images of road surfaces end-to-end [26]. Even 3D data were included. Zhang et al. (2019) demonstrated the use of recurrent neural networks for automatic crack detection on 3D asphalt models [27]. These studies demonstrated that cracks can be reliably detected using AI techniques, providing suitable image data. However, in the context of EPDM, suitable image data have largely been lacking to date (e.g., systematically aged components). Furthermore, cracks in brittle asphalt appear to be significantly different from those in more elastic EPDM. Our study closes this gap by presenting a novel approach for visually inspecting EPDM surfaces. Under controlled lighting with specialized analysis, our pipeline sensitively flags crack-like features on EPDM, but currently confuses most true cracks with wrinkles; robust crack discrimination has not yet been achieved. This gap motivates our work toward reliable crack–wrinkle separation under industrially relevant conditions.
3. Materials and Methods
3.1. Object of Investigation: The Elastomer Diaphragm
While diaphragms can be manufactured from various materials, this project focuses exclusively on those made from pure elastomer or EPDM, as illustrated in Figure 2. These materials are particularly suited for demanding environments such as Water For Injection (WFI) systems, which require steam sterilization. Additionally, these diaphragms can operate within a temperature range of -10 °C to 140 °C, with the potential to withstand temperatures up to 160 °C under specific usage conditions and with the incorporation of supplementary materials like TFM (modified polytetrafluoroethylene or PTFE).
The elastomer diaphragm features a circular and concave bottom surface, which may also be termed the medium surface, as it is the sole part of the diaphragm that contacts the transported fluid. The significance of this concavity cannot be overstated, particularly given the potential for deformation over the diaphragm’s operational lifespan under various conditions. Figure 2 further demonstrates an instance of such concave deformation of the diaphragm on the right side.
Additionally, the medium surface includes a thin lip that extends vertically from top to bottom. This lip seals against the weir below to halt fluid flow when necessary. This structural feature is critical for ensuring an effective valve operation and fluid control. The geometry changes described favor the following defect classes.
3.2. Defect Classes
To create a robust ground truth for algorithmic evaluation, a standardized manual inspection protocol was established and executed by two expert quality control operators. This protocol defines the precise criteria for identifying and classifying all relevant surface and deformation phenomena. Each diaphragm underwent a comprehensive quality inspection by expert operators using a standardized assessment protocol that captured 23 distinct defect categories and surface characteristics. The complete annotation scheme includes detailed measurements of surface defects (wrinkle count, position, length, and depth; crack count, position, length, and depth), material degradation indicators (rubber-fabric delamination, swelling and film formation), geometric deformations (kidney-shaped bulge, sealing cord warping, sealing lip and flap deformation), surface damage (tears, diaphragm screw pullouts, sealing lip damage and surface tears), and global surface topology (concave/convex deformation).
A final school grade is typically derived from a weighted formula that combines all 23 parameters. However, for the purpose of this algorithmic study, a direct comparison is not performed on this final aggregated grade but on the individual, disaggregated defect categories to allow for a more granular performance analysis.
For example, a fine crack is considered to be present if a separation of the material layers is recognizable, even if it is barely visible under normal conditions. The distinction between cracks and wrinkles is based on the presence or absence of actual gap formation.
Various defects that describe the state of health of an EPDM diaphragm occur at a wide variety of locations, especially on the media side, and differ fundamentally in both appearance and detectability.
For this study, we chose the most critical categories (illustrated in Figure 3): cracks (Figure 3d–e), wrinkles (Figure 3a, c) and the formation of kidney-shaped bulges (Figure 3b–c).
Cracks
A crack is defined as a physical separation or fracture of material layers, resulting in a discernible gap. This includes very fine cracks, which may appear as scratches under static observation, but are identifiable as fractures upon mechanical deformation. They typically penetrate deeper into the material than wrinkles, making them more severe and potentially compromising the integrity of the diaphragm. (Figure 3d shows a single radial fissure; Figure 3e exhibits two opposing cracks).
Wrinkles
In contrast, a wrinkle is a surface displacement or warping of a material without any physical separation of the material layers. The continuous opening and closing of the valve deforms the diaphragm and leads to wrinkles at the surface areas that experience fatigue. Although wrinkles are not an immediate criterion for diaphragm replacement, they complicate cleaning and may serve as an early warning indicator. They are subdivided into coarse and fine wrinkles. Figure 3a highlights a deep, coarse wrinkle, whereas Figure 3c displays flatter, area-wide wrinkles on an already deformed surface.
Kidneys
Kidney-shaped deformations are permanent alterations caused by a combination of mechanical and thermal stress. When the valve is closed, the weir, onto which the diaphragm is tightly clamped, promotes this characteristic shape. Pronounced kidney bulges are visible in Figure 3b, and initial kidney formation combined with surface wrinkles is presented in Figure 3c.
Additional defects, such as sealing-lip damage and general plastic deformation, can further complicate automated inspection, particularly because they introduce irregular background geometries that impair feature extraction.
Permanent Deformations
Permanent diaphragm deformations do not represent an immediate error criterion that directly leads to failure. Instead, they primarily influence image processing, as the shifts and changes in the surface structure caused by deformation change the lighting situation and, therefore, the representation in the subsequent height map. This means that appropriate adjustments and corrections are necessary for a precise evaluation of the image data to eliminate deformations from the image data and thus enable an undistorted analysis of the actual defects.
3.3. Hardware Setup
3.3.1. Rationale: Why Four-Image PS Instead of Single-View 2D
Before adopting Photometric Stereo (PS) according to Woodham, we evaluated single-view 2D approaches (one image per diaphragm) for detecting cracks, wrinkles, and large-scale deformations. Although contrast- and edge-based methods can highlight linear structures, they proved unreliable once the diaphragm surface deviated from its nominal shallow concave form. Concave/convex warping introduces view-dependent shading and self-occlusion which either masks fine cracks or produces wrinkle-like artifacts. SFS mitigates these effects by controlling the illumination direction and recovering the surface orientation/height cues, which stabilizes the detection across strongly deformed parts.
3.3.2. Imaging System
The inspection station (Figure 4) consists of a top-down industrial camera surrounded by a segmented ring light. The original arrangement of four individually controlled bar lights at azimuth angles of 0°, 90°, 180°, and 270° was replaced with a four-segment ring to improve the homogeneity and switching repeatability.
- Camera: Basler acA2440-35uc, mounted normal to the diaphragm surface. Images were acquired at 2448 × 2048 px.
- Illumination: Four-segment ring light Falcon Illumination FLDR-i170-LA3-4 operated in darkfield geometry. Each acquisition cycle recorded four frames, each with exactly one active segment (45°, 135°, 225°, 315°). The segments are identical in type and nominal intensity and share a fixed elevation angle relative to the sample plane.
- Field of view and part sizes: The mechanical layout accommodates diaphragms from Ø 30 mm to Ø 92 mm without changing the camera pose.
- Sample fixturing: Dedicated diaphragm holders centered each diaphragm under the camera and placed it in a reproducible focal plane. This minimizes the focus drift and perspective variability between parts and reduces the need for geometric post-alignment.
This configuration yielded a set of four directionally shaded images that feed the PS pipeline to compute the albedo, gradient, and relative height maps.
3.3.3. Illumination Evaluation and Final Choice
We assessed common industrial illumination modes for black EPDM with mixed matte/gloss regions and pronounced global curvature, similar to those discussed in [14]. Table 1 summarizes the observations made regarding the representative new and used diaphragms.
Given the need for robust detection across varying concavities and convexities, a segmented darkfield ring was selected. It provides directional gradients necessary for PS while maintaining adequate contrast on low-reflectance EPDM.
3.3.4. Acquisition Protocol and Control
Each diaphragm was imaged once per segment (four frames in total) with fixed exposure and gain across the four shots. Segment intensities are factory-matched; the remaining small differences are handled in the software by per-segment intensity normalization prior to PS. The per-part sequence is limited to a single pass (no repeated captures), which keeps the cycle time practical for inline use and ensures consistent input conditions for reconstruction.
3.3.5. Geometric and Mechanical Considerations
The rigid camera–light stack was kinematically constrained to maintain a constant working distance. The diaphragm holder constrains the lateral translation and rotation so that the sealing-lip axis is consistently oriented in the image. This repeatability simplifies the subsequent region-of-interest definitions (e.g., center-based segmentation) and stabilizes the Hough-based outer-rim detection used downstream.
3.3.6. Practical Limitations
Despite improved robustness, two limitations remain intrinsic to the material and task: (i) black EPDM exhibits localized glossy patches that can introduce small specular components even under a darkfield; (ii) strong global warping modifies local incidence angles and can compress gradient dynamics in parts of the field. These effects are explicitly addressed later in the pipeline by relying on gradient/height products rather than raw intensity and by setting conservative detection thresholds in the recall-critical categories.
3.4. Algorithm/Execution
In recent years, optical quality control and surface inspection have increasingly adopted machine-learning (ML) approaches, moving away from purely hand-crafted algorithms. However, ML methods require large annotated data sets and different preprocessing pipelines to achieve a competitive performance. Given these constraints, the present study relies on a classical rule-based algorithm, that offers a robust and explainable detection path while remaining compatible with the current data situation.
Photometric Stereo (PS) According to Woodham
We recovered the per-pixel surface orientation from the multiple directional illuminations observed from a single fixed view. Unlike single-image shape-from-shading (SFS), PS explicitly uses multiple illuminations to make the normal estimation well-posed under Lambertian assumptions. Four strategically positioned light segments with known directions and relative intensities were used. Each of the four images was captured with illumination from a single segment of the light source, allowing for comprehensive surface analysis.
Using these four images as input, the algorithm processes them to produce three resultant images, each providing unique insights into the surface characteristics and potential damage patterns of the diaphragm. These three processed images are integral to achieving accurate and reliable defect detection and assessment, even for diaphragms that have undergone significant shape changes through use.
- albedo image: A two-dimensional (2D) representation of the diaphragm surface, known as the albedo image, was created. This image displays the reflection characteristics of the diaphragm and provides detailed information on how the surface reflects light. It also indicates local light absorption properties without the presence of shadows, thus offering a clear and unobstructed view of the diaphragm material properties and surface features.
- gradient image: This image captures the three-dimensional form of the diaphragm by calculating the local gradients across its surface, which are then stored within the gradient image. Although it is more challenging to interpret, at first glance, compared with the albedo image, the gradient image is crucial for generating other valuable results used in the damage recognition process. One such result is the height map, detailed below. The gradient image serves as an essential intermediary, facilitating the accurate depiction and analysis of the topography of the diaphragm.
- height map: By integrating the gradients captured in the gradient image, a height map is generated. In this image, each pixel value represents the relative height along the z-axis of the diaphragm’s three-dimensional surface. This precise depiction of surface elevations and depressions is crucial for identifying and evaluating damage patterns and offers a detailed view of the diaphragm’s topography.
Figure 5.
(a) An albedo image of a diaphragm with cracks and wrinkles and a 3D representation of the height map (b).
Figure 5.
(a) An albedo image of a diaphragm with cracks and wrinkles and a 3D representation of the height map (b).
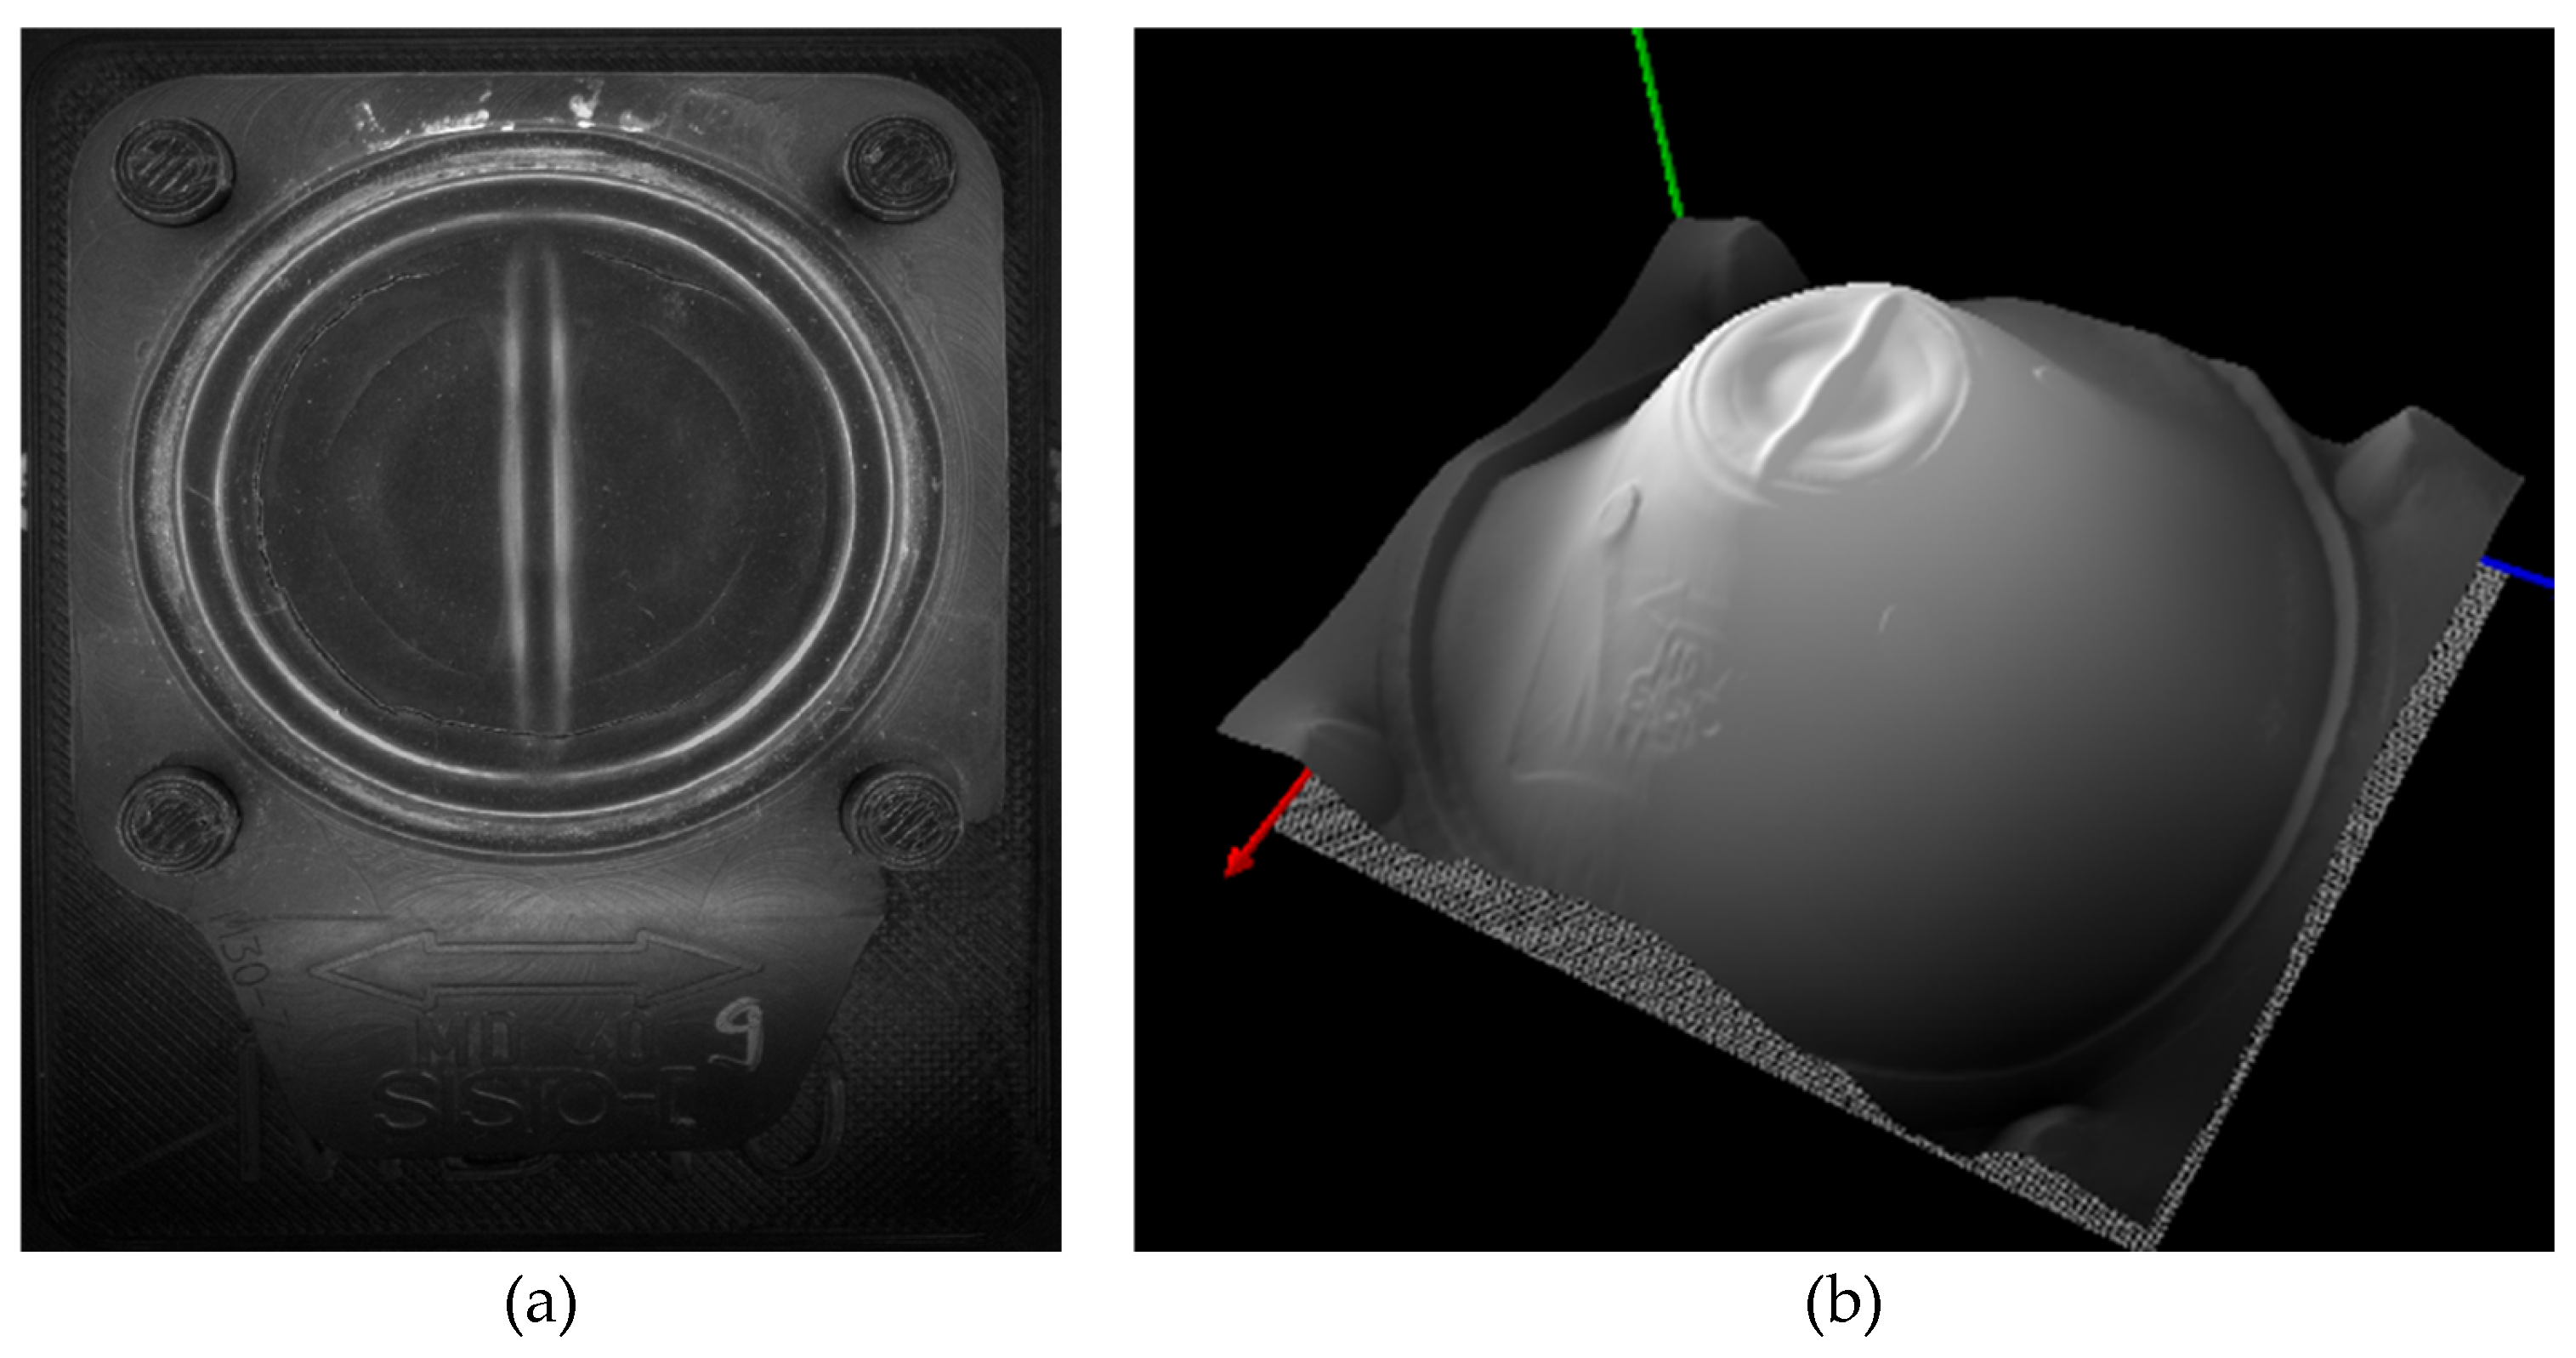
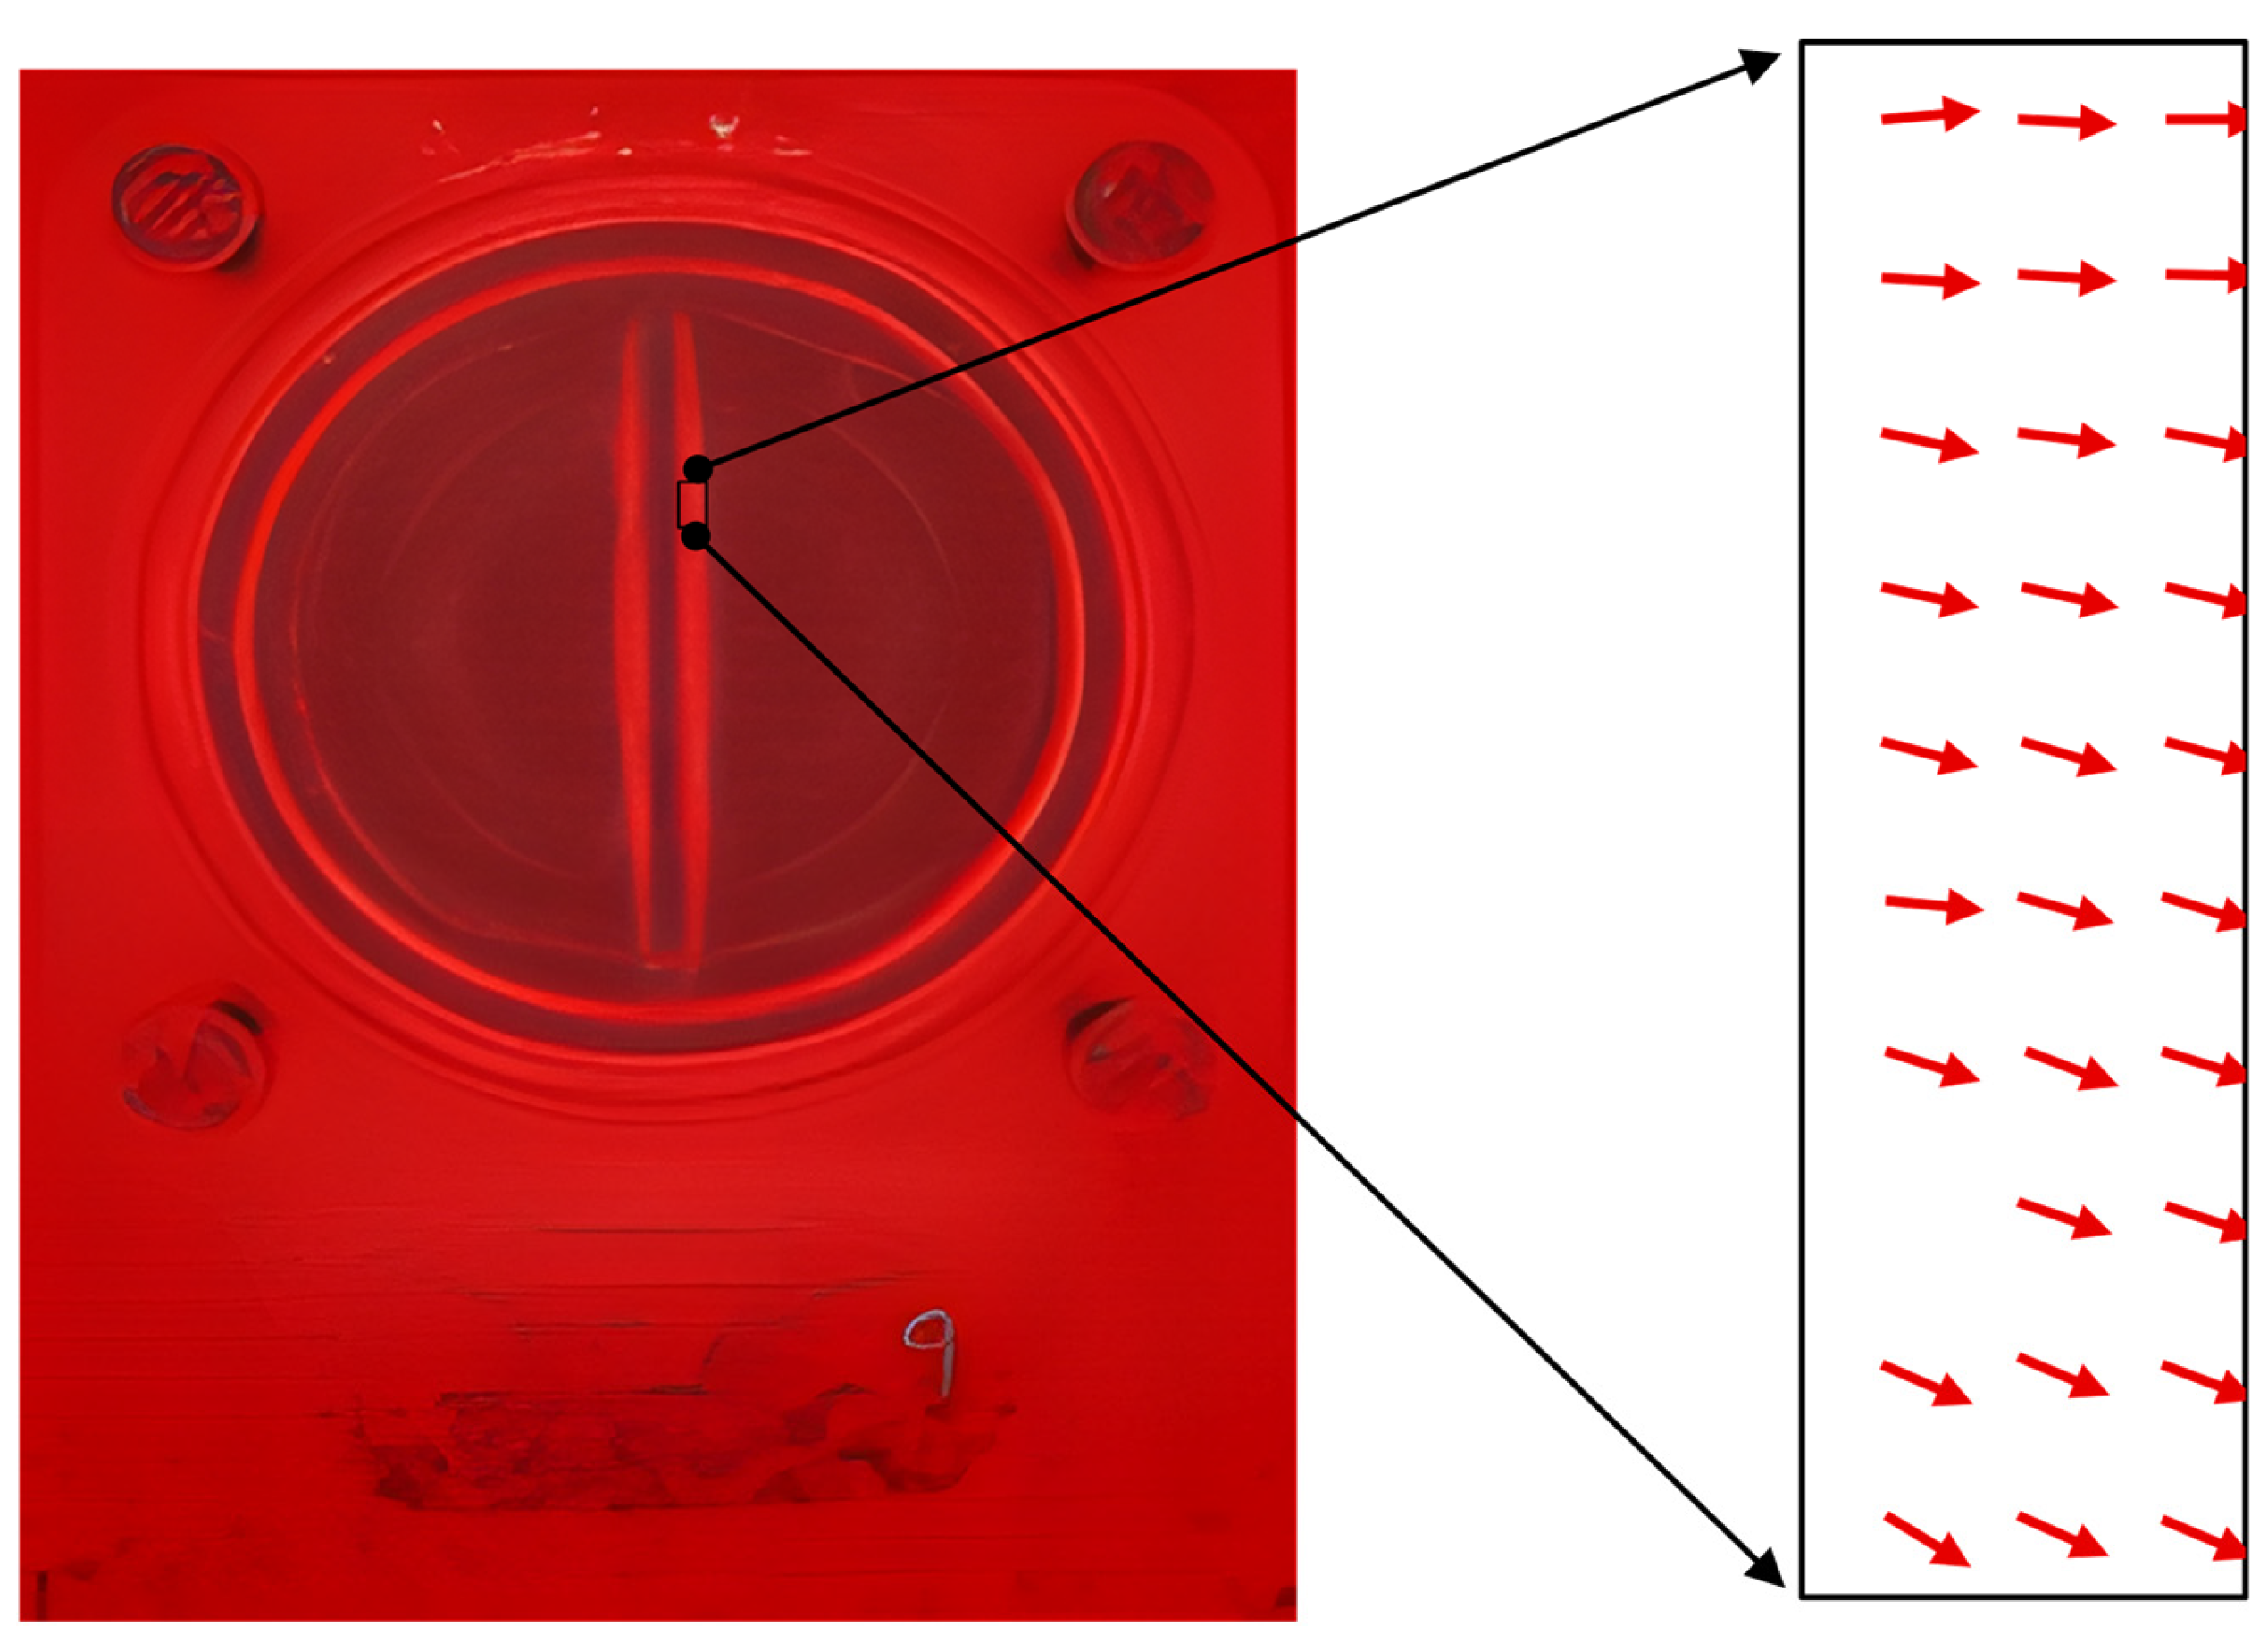
Figure 6.
The gradient image superimposed over the albedo image of the same diaphragm. A zoomed in image on the right shows the gradient orientation within a small area.
Figure 6.
The gradient image superimposed over the albedo image of the same diaphragm. A zoomed in image on the right shows the gradient orientation within a small area.
Execution
Figure 7 summarizes the execution of the algorithm. All four images, each captured under one of the four light sources, were compiled into an input array for PS-based calculations to derive Albedo, Gradient, and height maps. An albedo image is primarily used to visualize the results after recognizing any possible damage patterns. Any detected damage is marked on the albedo image (see Figure 8 and Figure 9) with colors that vary based on the type of damage pattern.
Subsequent images generated after the creation of Albedo, Gradient, and height maps stem solely from the gradient image. This includes a height map, as mentioned previously.
To reduce the computational intensity and associated processing time, the Hough Circle Transform (HCT) [28] (pp 366–369), combined with edge detection using a Sobel operator, was implemented to detect the outer circular boundary of the medium surface. Although brand-new diaphragms of a specific size look identical, the used diaphragms may exhibit slight changes in size that affect the quality of the results. The HCT searches for a small range of circular radii rather than one specific radius value to determine the center of the medium surface. Given the computational intensity of the HCT, this range of radii was kept as narrow as possible.
Subsequently, the height map is used to determine whether the diaphragm has developed a convex or excessively concave deformation beyond its natural concave state. For example, this can be achieved by focusing on the pixel representing the center of the diaphragm, which was identified by HCT.
The center of the diaphragm was also used as a reference for segmenting the medium surface for the remainder of the algorithm. This segmentation assigns regions of interest (ROIs) to specific areas of the medium surface based on their light reflection properties. An example is the thin sealing lip in the center of the medium surface, which stretches from top to bottom.
A Divergence image of the diaphragm, along with the potential application of Gaussian filters, Sobel operators, and Gaussian derivatives as required, facilitates the extraction of the cracks, wrinkles, and kidney-shaped deformations.
The detected damage or wear patterns were then displayed collectively as superimposed markings over the albedo image (see Figure 8 and Figure 9), with colors varying according to the type of damage. This visualization technique allows for easy interpretation of the results.
Figure 8 illustrates the damage to the diaphragm, as shown in Figure 5. In this figure, cracks are marked in orange, whereas wrinkles are marked in white.
Figure 9 shows an example of a kidney-shaped deformation on the diaphragm surface, which also exhibits convex surface deformation. Kidney-shaped deformations are marked in green, coarse wrinkles in magenta, and fine wrinkles in orange.
4. Results
4.1. Experimental Setup
The evaluation was conducted on a dataset of 313 manually annotated EPDM diaphragms with the size “MD65” from production lines. In this study, we focused on four specific binary classification tasks derived from this comprehensive annotation set: kidney-shaped deformations, warp out-of-tolerance conditions (derived from surface topology), wrinkle presence and crack presence. The remaining 19 defect categories are reserved for future algorithmic development, representing a significant potential for extended automated inspection capabilities.
Image acquisition followed a standardized protocol for each diaphragm: four images were captured at 2448×2048-pixel resolution using the four-segment ring illumination system described in Section 3.1. Each image corresponds to illumination from a different angular position (0°, 90°, 180°, 270°), with no repetition of capture conditions. This single-pass acquisition approach ensures consistent data quality while maintaining practical inspection throughput.
The ground truth annotations from expert inspection served as the reference standard for algorithmic performance evaluation. Each diaphragm received binary classification labels for the four investigated defect types, forming the basis of the confusion matrix analysis presented in the following sections.
4.2. Quantitative Results
Table 2 presents the classification performance for all the four defect categories. The PS-based algorithm demonstrated varying effectiveness depending on the defect type, with geometric deformations showing substantially better detection performance than surface texture anomalies.
Figure 10 and Figure 11 show the confusion matrices for each defect category, providing detailed insight into classification patterns and error types.
Geometric Deformations (Kidney and Warp)
Both kidney defects and warp conditions achieved strong performance with F1-scores of 0.81. The high recall values (0.93 and 0.92 respectively) indicate reliable detection of actual defects, while precision values of 0.72 suggest acceptable false positive rates for industrial application.
Surface Texture Anomalies (Cracks and Wrinkles)
Crack detection presents significant challenges with a precision of only 0.19, indicating that 81% of the positive classifications are false alarms. However, the high recall (0.88) ensured that actual cracks were rarely missed. wrinkle detection achieves perfect recall (1.00) but suffers from moderate precision (0.55), suggesting systematic over-detection of wrinkle-like patterns.
4.3. Error Analysis
4.3.1. Industrial Reliability Requirements
In target applications (e.g. pharmaceuticals), missing a real defect (a false negative case) is associated with catastrophic costs, whereas incorrectly rejecting a good part (a false positive case) is merely a cost factor. Therefore, any automated inspection system to be validated for industrial use should always be designed for a high recall rate with a minimal risk of false negatives. Our algorithm fulfils this primary industrial requirement with a recall rate of 0.88 for cracks. The current low precision of 0.19 is therefore not an obstacle to initial use, but rather the defined starting point for optimizations in subsequent development phases.
4.3.2. Wrinkle Detection Sensitivity
The perfect recall (1.00) for wrinkle detection stems from the industrial requirement of identifying even minimally pronounced wrinkle formations. However, this sensitivity has resulted in systematic over-detection, with the algorithm now flagging subtle surface variations as wrinkle defects.
This overcautious behavior reflects the challenge of calibrating the detection thresholds for defects that exist in a continuous severity spectrum rather than discrete presence/absence states. The current implementation prioritizes completeness over specificity, consistent with the quality assurance protocols that err on the side of caution.
4.3.3. Crack-Wrinkle Discrimination Challenge
A significant source of classification errors stems from the fundamental similarity between the crack and wrinkle signatures in both human and algorithmic perception. Figure 3(a) demonstrates a representative case where even expert inspectors require extended examination to definitively classify a surface anomaly as crack or wrinkle.
This ambiguity arises from multiple technical factors inherent to the PS approach:
- Optical Signature Convergence: Both the cracks and wrinkles generated similar gradient patterns in the captured images. While genuine cracks typically exhibit sharp-edged polarization changes at the fracture lips, wrinkles produce comparable gradient signatures without distinctive polarization characteristics. The current RGB-based acquisition method cannot distinguish between these polarization differences. This is precisely why the next iteration of this system will use a polarisation-based camera. Since crack edges and wrinkles reflect polarized light differently, we expect a significant improvement in selectivity that directly addresses this core problem.”
- Variable Reflective Properties: The reflective characteristics of wrinkles vary significantly depending on the surface orientation, material stress, and local geometry. This variability causes certain wrinkle formations to exhibit optical signatures that are nearly indistinguishable from genuine cracks, leading to a systematic misclassification. Although most wrinkles remain detectable through the PS approach, the overlapping reflective properties create ambiguous cases that challenge both algorithmic and human classification.
- Height map Resolution Limitations: The Photometric Stereo reconstruction process applies regularization that smooths micro-surface irregularities. This regularization has contrasting effects on the two defect types: fine cracks become artificially widened in the height map representation, whereas deep wrinkles are underestimated as their true depth falls within the regularization noise floor. Consequently, both defect types converge toward similar height map signatures, complicating the algorithmic discrimination.
- Scale-Dependent Detection Challenges: Very small cracks, particularly those less than 1mm in length, present additional complexity for current imaging resolution and analysis algorithms. Although such micro-cracks are detectable under certain favorable conditions, consistent identification across varying diaphragm surface conditions, lighting angles, and material states requires further algorithmic refinement. The variable success rate for sub-millimeter crack detection contributes to the overall precision limitations observed in the crack classification results.
- Traceability and Consistency Issues: The overlapping characteristics between cracks and wrinkles, combined with their scale-dependent visibility, create challenges in maintaining consistent detection criteria across the entire dataset. This variability in detection consistency partially explains the systematic error patterns revealed by the McNemar test results, in which certain surface features are consistently misinterpreted due to their ambiguous optical and geometric signatures.
4.3.4. Systematic Error Patterns
The extremely low p-values from McNemar’s test indicate that classification errors follow systematic patterns rather than random misclassification. This suggests that the current feature extraction approach consistently misinterprets specific surface characteristics, indicating toward identifiable algorithmic limitations rather than fundamental dataset ambiguity.
The consistent nature of these errors provides a foundation for targeted algorithmic improvements, because systematic biases can be addressed through enhanced feature engineering or supplementary sensing modalities.
4.3.5. Implications for Industrial Deployment
Despite these limitations, the current error patterns align with industrial quality control priorities. The high recall rates ensure that genuine defects are reliably detected, whereas the conservative false positive behavior provides a safety margin consistent with critical application requirements.
The systematic nature of classification errors suggests that performance improvements through refined algorithms and enhanced sensing approaches represent a viable path forward rather than the fundamental limitations of the optical inspection paradigm.
5. Discussion
The use of Photometric Stereo for the detection of surface defects has yielded promising results. Although the accuracy of wrinkle detection requires further improvement, the system successfully recognizes most cracks. This includes cracks smaller than 1 mm, which may otherwise go unnoticed by the naked eye. The detection of kidney-shaped patterns has been highly accurate in almost all the instances tested to date. Additionally, any convex or concave deformation of the exposed surface is easily recognizable due to the three-dimensional nature of the images produced through PS.
As previously mentioned, further work is required to enhance the detection of wrinkles on diaphragm surfaces. Currently, the algorithm can differentiate between coarse and fine wrinkles, a feature particularly that is notable in diaphragms of the MD65 variant or larger. However, severe damage, such as large and thick missing portions of the surface, is still interpreted by the algorithm as a series of cracks and wrinkles dispersed across the area. Future efforts will focus on detecting other types of damage patterns, such as deformation or damage to the sealing lip in the middle of the diaphragm surface. An example of this is shown on the right diaphragm of Figure 2.
Areas for Improvement
Wrinkle Detection: Enhancing the ability of the algorithm to distinguish between fine and coarse wrinkles with greater accuracy remains a priority. Improvements in this area will help to reduce false positives and ensure more precise damage identification.
Complex Damage Interpretation: Refining the algorithm to better interpret severe damage, such as large missing portions of the diaphragm surface, prevents it from misclassifying such damage as a series of minor cracks and wrinkles. This improvement will contribute to a more accurate assessment of the health of the diaphragm.
Additional Damage Patterns: Expanding the algorithm’s capability to detect other types of damage, such as deformations or damage to the sealing lip, will provide a more comprehensive evaluation of the diaphragm’s condition.
Performance and Optimization
Processing Time: While a typical manual inspection takes several minutes, the employed algorithm currently takes between 3 and 10 s to produce a result. The varying delay is due to the intensive calculations performed by the Hough Circle algorithms. Optimizing this processing time is possible, although the extent of such improvements remains uncertain at this stage. Techniques such as parallel processing and algorithmic refinement can be used to achieve faster results.
One of the challenges in distinguishing cracks from wrinkles in our diaphragms is the elastic nature of the material. Unlike many other materials studied in recent papers on crack detection, our diaphragms can compress back into their original shape after the crack forms, making the crack less visible and more difficult to detect. In addition, the diaphragm surface is not always cooperative for image processing. The material, often a black EPDM diaphragm, can have both matte and shiny areas and the diaphragms themselves are often concave. Combined with these factors, the surface reflections and varying textures can make it particularly challenging for image analysis to reliably differentiate between cracks and wrinkles.
In summary, the transition from two-dimensional methods to PS represents a significant advancement in the detection and analysis of diaphragmatic surface defects. Ongoing efforts to refine the technique and address its current limitations are essential. By continuously improving the accuracy and reliability of PS-based inspections, more robust and consistent assessments can be achieved, ensuring the highest standards for quality and performance in diaphragm valve applications.
6. Conclusions and Future Work
This study presents an effective automated optical inspection system for detecting damage patterns on elastomer diaphragms using a Photometric Stereo technique. Future research should focus on improving wrinkle detection and exploring additional damage types. Moreover, optimizing the performance of the system to reduce processing time and enhance computational efficiency is critical. This advancement has the potential to greatly benefit industries that rely on diaphragm valves, thereby ensuring higher quality and reliability in critical applications.
In the next phase of our research, the diaphragms will be clamped and subjected to varying levels of stress, allowing us to examine them both in closed and open positions. This should help us to better differentiate between cracks and wrinkles, as cracks will become more visible under certain conditions. Additionally, we plan to utilize polarization-based cameras to further enhance our ability to distinguish between these defects, as cracks and wrinkles reflect polarized light differently. Finally, we aim to build a comprehensive database by analyzing a larger number of samples, which will allow us to eventually transition to machine-learning techniques, reducing the need for fully manual algorithm development in the future.
Author Contributions
Conceptualization, T.B. and A.S.; methodology, A.P. and T.B.; software, A.P.; validation, T.B., A.S. and A.P.; formal analysis, T.B.; investigation, T.B.; resources, T.B. and A.S.; data curation, B.H. and A.S.; writing-original draft, T.B. and A.P.; writing-review and editing, T.B.; visualization, T.B. and A.P.; supervision, M.V.-S.; project administration, M.V.-S..; funding acquisition, B.H. All authors have read and agreed to the published version of the manuscript.
Funding
This research was funded by SISTO Armaturen S.A.
Data Availability Statement
The data presented in this study are available upon request from the company’s author. The data are not publicly available due to laboratory regulations.
Conflicts of Interest
The authors declare no conflicts of interest.
References
- Du, Q.; Shanben, C.; Tao, L. Inspection of weld shape based on the shape from shading. Int J Adv Manuf Technol 2006, 27, 667–671. [Google Scholar] [CrossRef]
- Zhang, R.; Tsai, P.-S.; Cryer, J.E.; Shah, M. Shape-from-shading: a survey. IEEE Trans. Pattern Anal. Machine Intell. 1999, 21, 690–706. [Google Scholar] [CrossRef]
- Woodham, R.J. A Cooperative Algorithm for Determining Surface Orientation from a Single View. In Proceedings of the 5th International Joint Conference on Artificial Intelligence. Cambridge, MA, USA, August 22-25, 1977; Raj, Reddy, Ed.; William Kaufmann, 1977; pp. 635–641. [Google Scholar]
- Landmann, M.; Heist, S.; Dietrich, P.; Speck, H.; Kühmstedt, P.; Tünnermann, A.; Notni, G. 3D shape measurement of objects with uncooperative surface by projection of aperiodic thermal patterns in simulation and experiment. Opt. Eng. 2020, 59. [Google Scholar] [CrossRef]
- Selamet, F.; Cakar, S.; Kotan, M. Automatic Detection and Classification of Defective Areas on Metal Parts by Using Adaptive Fusion of Faster R-CNN and Shape From Shading. IEEE Access 2022, 10, 126030–126038. [Google Scholar] [CrossRef]
- Liu, H.; Wu, X.; Yan, N.; Yuan, S.; Zhang, x. A Novel Image Registration-Based Dynamic Photometric Stereo Method for Online Defect Detection in Aluminum Alloy Castings. 2023. [Google Scholar] [CrossRef]
- Shi, J.; Li, Y.; Zhang, Z.; Li, T.; Zhou, J. Adaptive Weighted Data Fusion for Line Structured Light and Photometric Stereo Measurement System. Sensors (Basel) 2024, 24. [Google Scholar] [CrossRef]
- Bhatt, P.M.; Malhan, R.K.; Rajendran, P.; Shah, B.C.; Thakar, S.; Yoon, Y.J.; Gupta, S.K. Image-Based Surface Defect Detection Using Deep Learning: A Review. Journal of Computing and Information Science in Engineering 2021, 21. [Google Scholar] [CrossRef]
- Park, M.; Au, S.; Luo, S.; Yue, C. Automated Defect Inspection Systems by Pattern Recognition. International Journal of Signal Processing, Image Processing and Pattern Recognition 2009, 2. [Google Scholar]
- Srividhya, R.; Shanmugapriya, K.; Sindhu Priya, K. Automatic Detection of Surface Defects in Industrial Materials Based on Image Processing. IJET 2018, 7, 61. [Google Scholar] [CrossRef]
- Yamazaki, T.; Fukui, A. Defect Detection for Forged Metal Parts by Image Processing. IJFCC 2020, 9, 23–26. [Google Scholar] [CrossRef]
- Gao, Y.; Li, X.; Wang, X.V.; Wang, L.; Gao, L. A Review on Recent Advances in Vision-based Defect Recognition towards Industrial Intelligence. Journal of Manufacturing Systems 2022, 62, 753–766. [Google Scholar] [CrossRef]
- Qiao, Q.; Hu, H.; Ahmad, A.; Wang, K. A Review of Metal Surface Defect Detection Technologies in Industrial Applications. IEEE Access 2025, 13, 48380–48400. [Google Scholar] [CrossRef]
- Ren, Z.; Fang, F.; Yan, N.; Wu, Y. State of the Art in Defect Detection Based on Machine Vision. Int. J. of Precis. Eng. and Manuf.-Green Tech. 2022, 9, 661–691. [Google Scholar] [CrossRef]
- Pei, M.; Liu, N.; Zhao, B.; Sun, H. Self-Supervised Learning for Industrial Image Anomaly Detection by Simulating Anomalous Samples. Int J Comput Intell Syst 2023, 16. [Google Scholar] [CrossRef]
- Liu, J.; Xie, G.; Wang, J.; Li, S.; Wang, C.; Zheng, F.; Jin, Y. Deep Industrial Image Anomaly Detection: A Survey. Mach. Intell. Res. 2024, 21, 104–135. [Google Scholar] [CrossRef]
- Ma, J.; Zhang, T.; Yang, C.; Cao, Y.; Xie, L.; Tian, H.; Li, X. Review of Wafer Surface Defect Detection Methods. Electronics 2023, 12, 1787. [Google Scholar] [CrossRef]
- Zhang, M.; Zhang, Y.; Zhou, M.; Jiang, K.; Shi, H.; Yu, Y.; Hao, N. Application of Lightweight Convolutional Neural Network for Damage Detection of Conveyor Belt. Applied Sciences 2021, 11, 7282. [Google Scholar] [CrossRef]
- Ho, C.-C.; Su, E.; Li, P.-C.; Bolger, M.J.; Pan, H.-N. Machine Vision and Deep Learning Based Rubber Gasket Defect Detection. Adv. technol. innov. 2020, 5, 76–83. [Google Scholar] [CrossRef]
- Nguyen, T.-H.; Nguyen, H.-L.; Bui, N.-T.; Bui, T.-H.; Vu, V.-B.; Duong, H.-N.; Hoang, H.-H. Vision-Based System for Black Rubber Roller Surface Inspection. Applied Sciences 2023, 13, 8999. [Google Scholar] [CrossRef]
- Shankar Bharathi, S.; Radhakrishnan, N.; Priya, L. Surface Defect Detection of Rubber Oil Seals Based on Texture Analysis. In Proceedings of the Fourth International Conference on Signal and Image Processing 2012 (ICSIP 2012); Kumar, S.S., Ed.; Springer India: India, 2013; pp. 207–216. ISBN 978-81-322-0999-7. [Google Scholar]
- Meng, F.; Ren, J.; Wang, Q.; Zhang, T. Rubber hose surface defect detection system based on machine vision. IOP Conf. Ser.: Earth Environ. Sci. 2018, 108. [Google Scholar] [CrossRef]
- Tao, J.; Zhu, Y.; Jiang, F.; Liu, H.; Liu, H. Rolling Surface Defect Inspection for Drum-Shaped Rollers Based on Deep Learning. IEEE Sensors J. 2022, 22, 8693–8700. [Google Scholar] [CrossRef]
- Xu, Y.; Wang, S.; Tu, H.; Xin, Z.; Xu, H. Automatic recognition for cracks in aging rubber materials. J. Phys.: Conf. Ser. 2025, 2961, 12002. [Google Scholar] [CrossRef]
- Guo, J.-M.; Markoni, H.; Lee, J.-D. BARNet: Boundary Aware Refinement Network for Crack Detection. IEEE Trans. Intell. Transport. Syst. 2022, 23, 7343–7358. [Google Scholar] [CrossRef]
- Yang, Y.; Xu, W.; Zhu, Y.; Su, L.; Zhang, G. A Novel Detection Method for Pavement Crack with Encoder-Decoder Architecture. Computer Modeling in Engineering & Sciences 2023, 137, 761–773. [Google Scholar] [CrossRef]
- Zhang, A.; Wang, K.C.P.; Fei, Y.; Liu, Y.; Chen, C.; Yang, G.; Li, J.Q.; Yang, E.; Qiu, S. Automated Pixel-Level Pavement Crack Detection on 3D Asphalt Surfaces with a Recurrent Neural Network. Computer aided Civil Eng 2019, 34, 213–229. [Google Scholar] [CrossRef]
- Burger, W.; Burge, M.J. Digital Image Processing; Springer International Publishing: Cham, 2022; ISBN 978-3-031-05743-4. [Google Scholar]
Figure 1.
Sectioned view of a diaphragm valve.
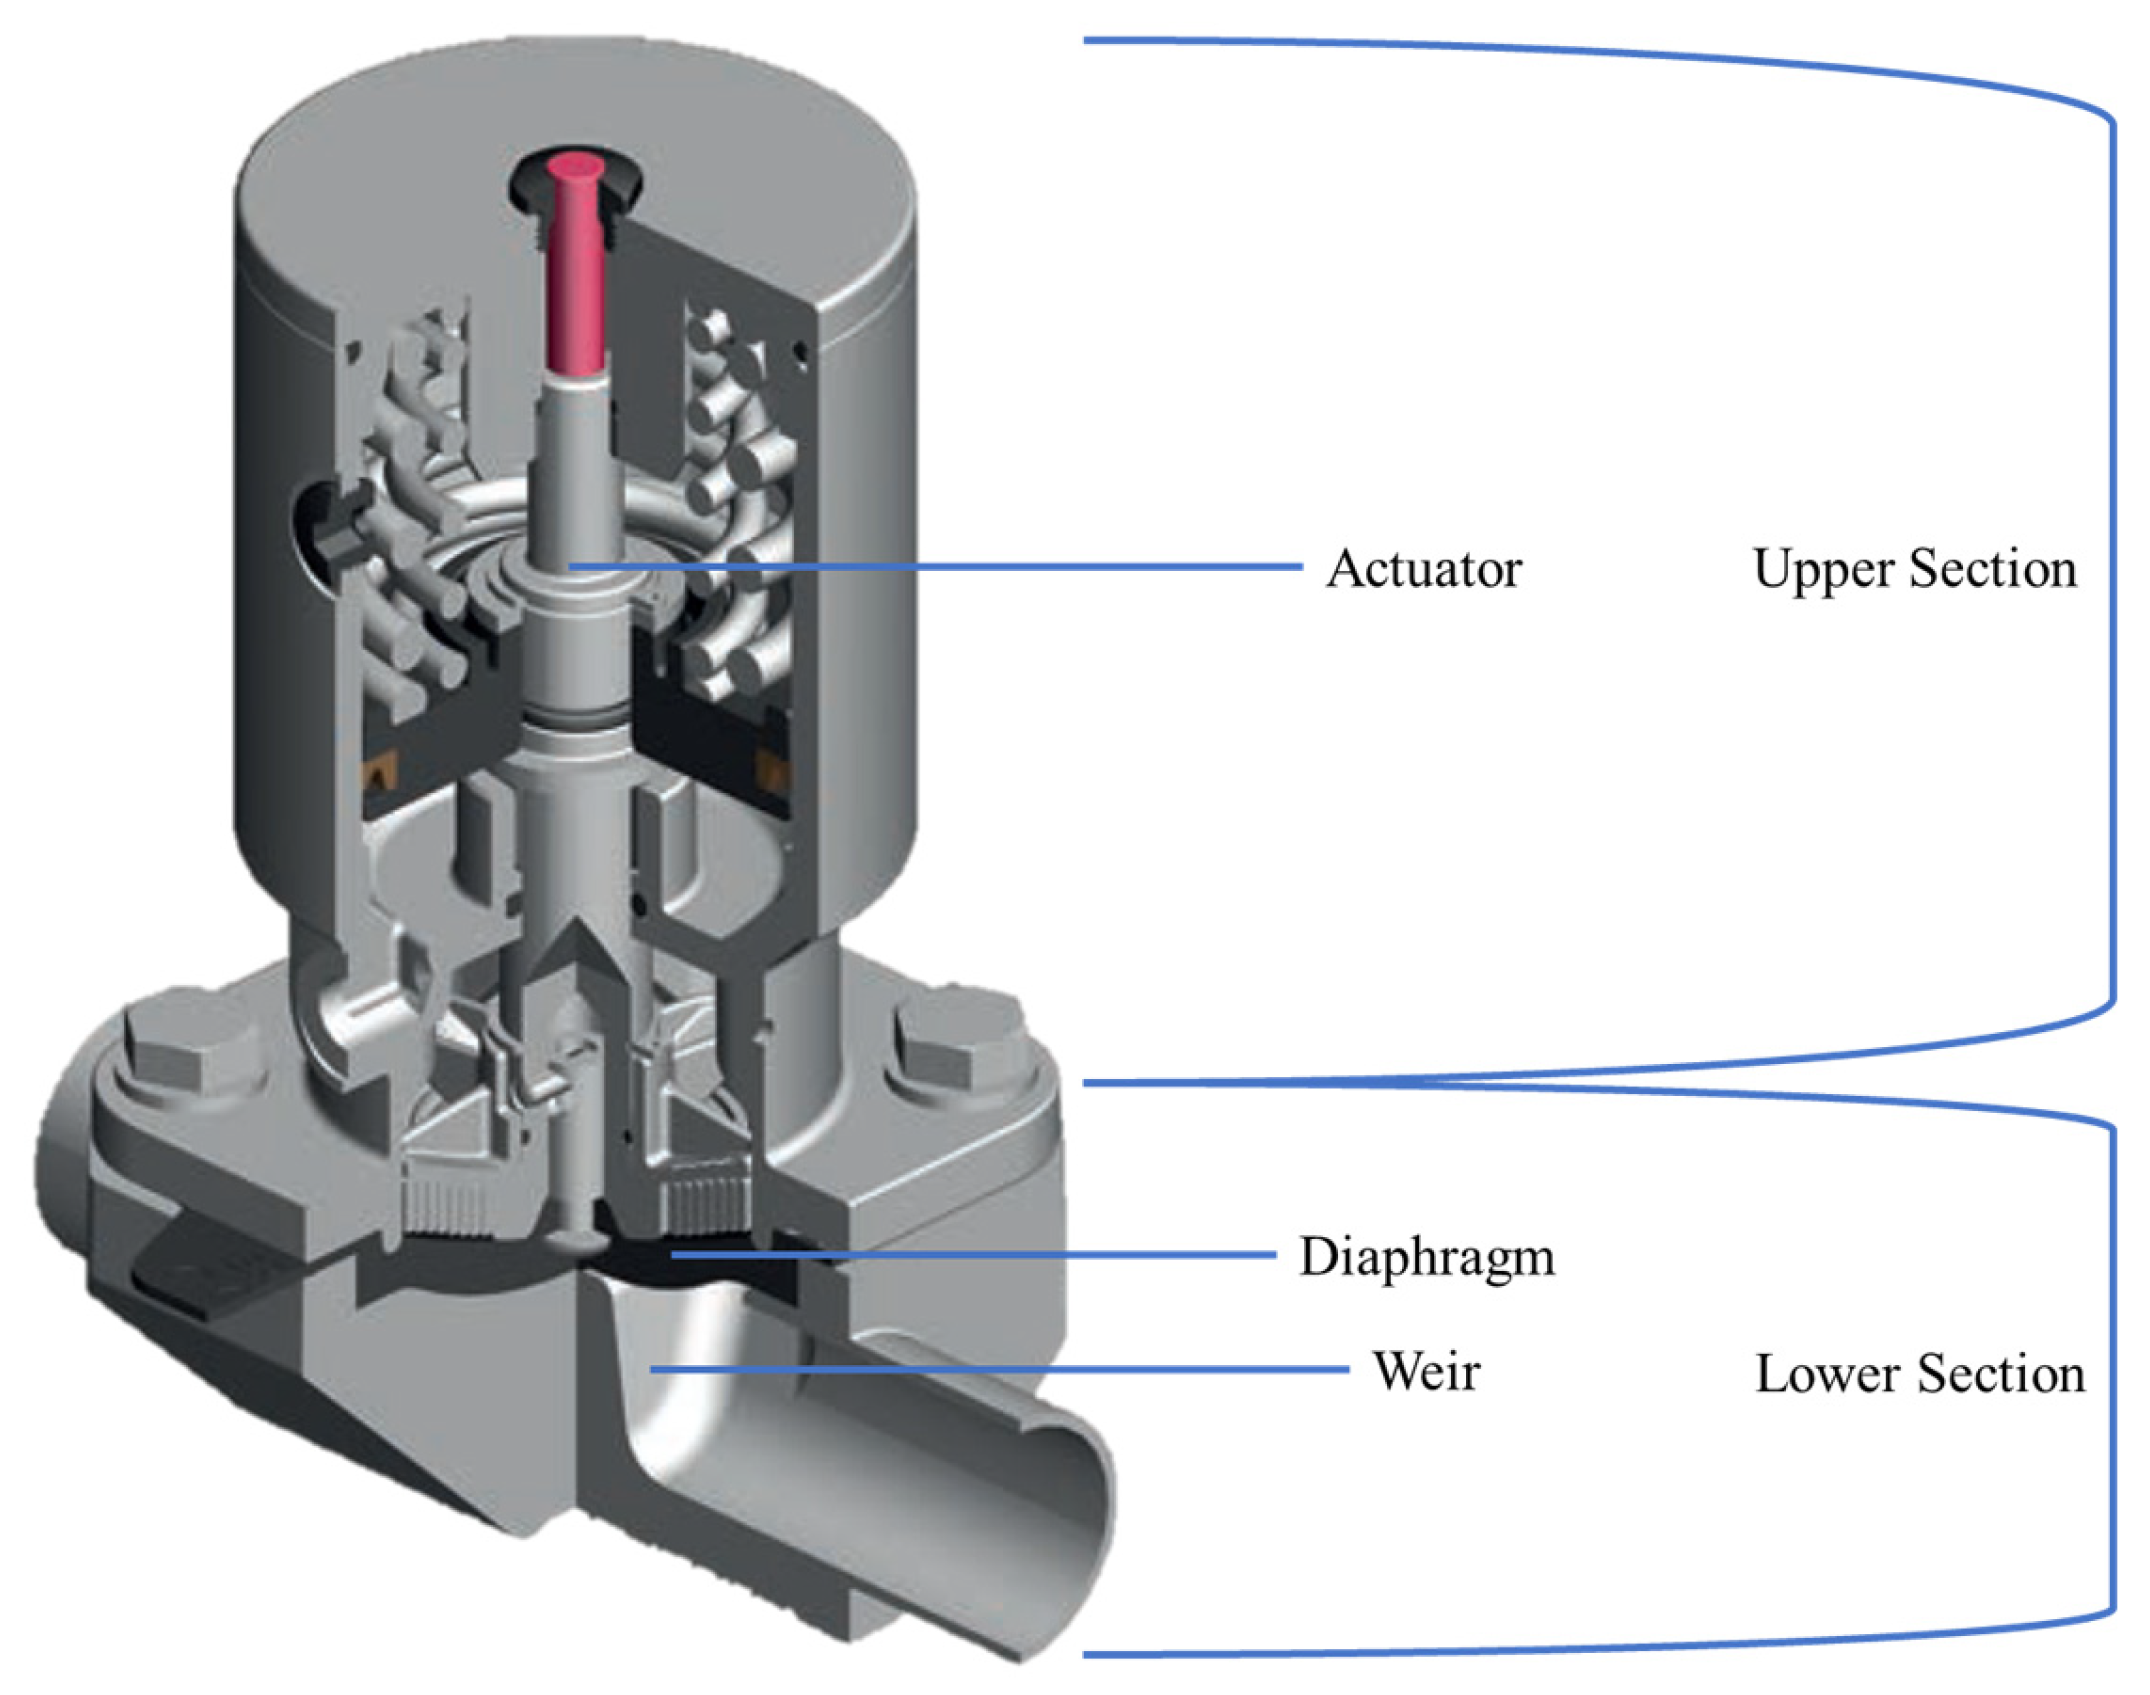
Figure 2.
An unused diaphragm (center) with two additional diaphragms exhibiting various wear patterns.
Figure 2.
An unused diaphragm (center) with two additional diaphragms exhibiting various wear patterns.
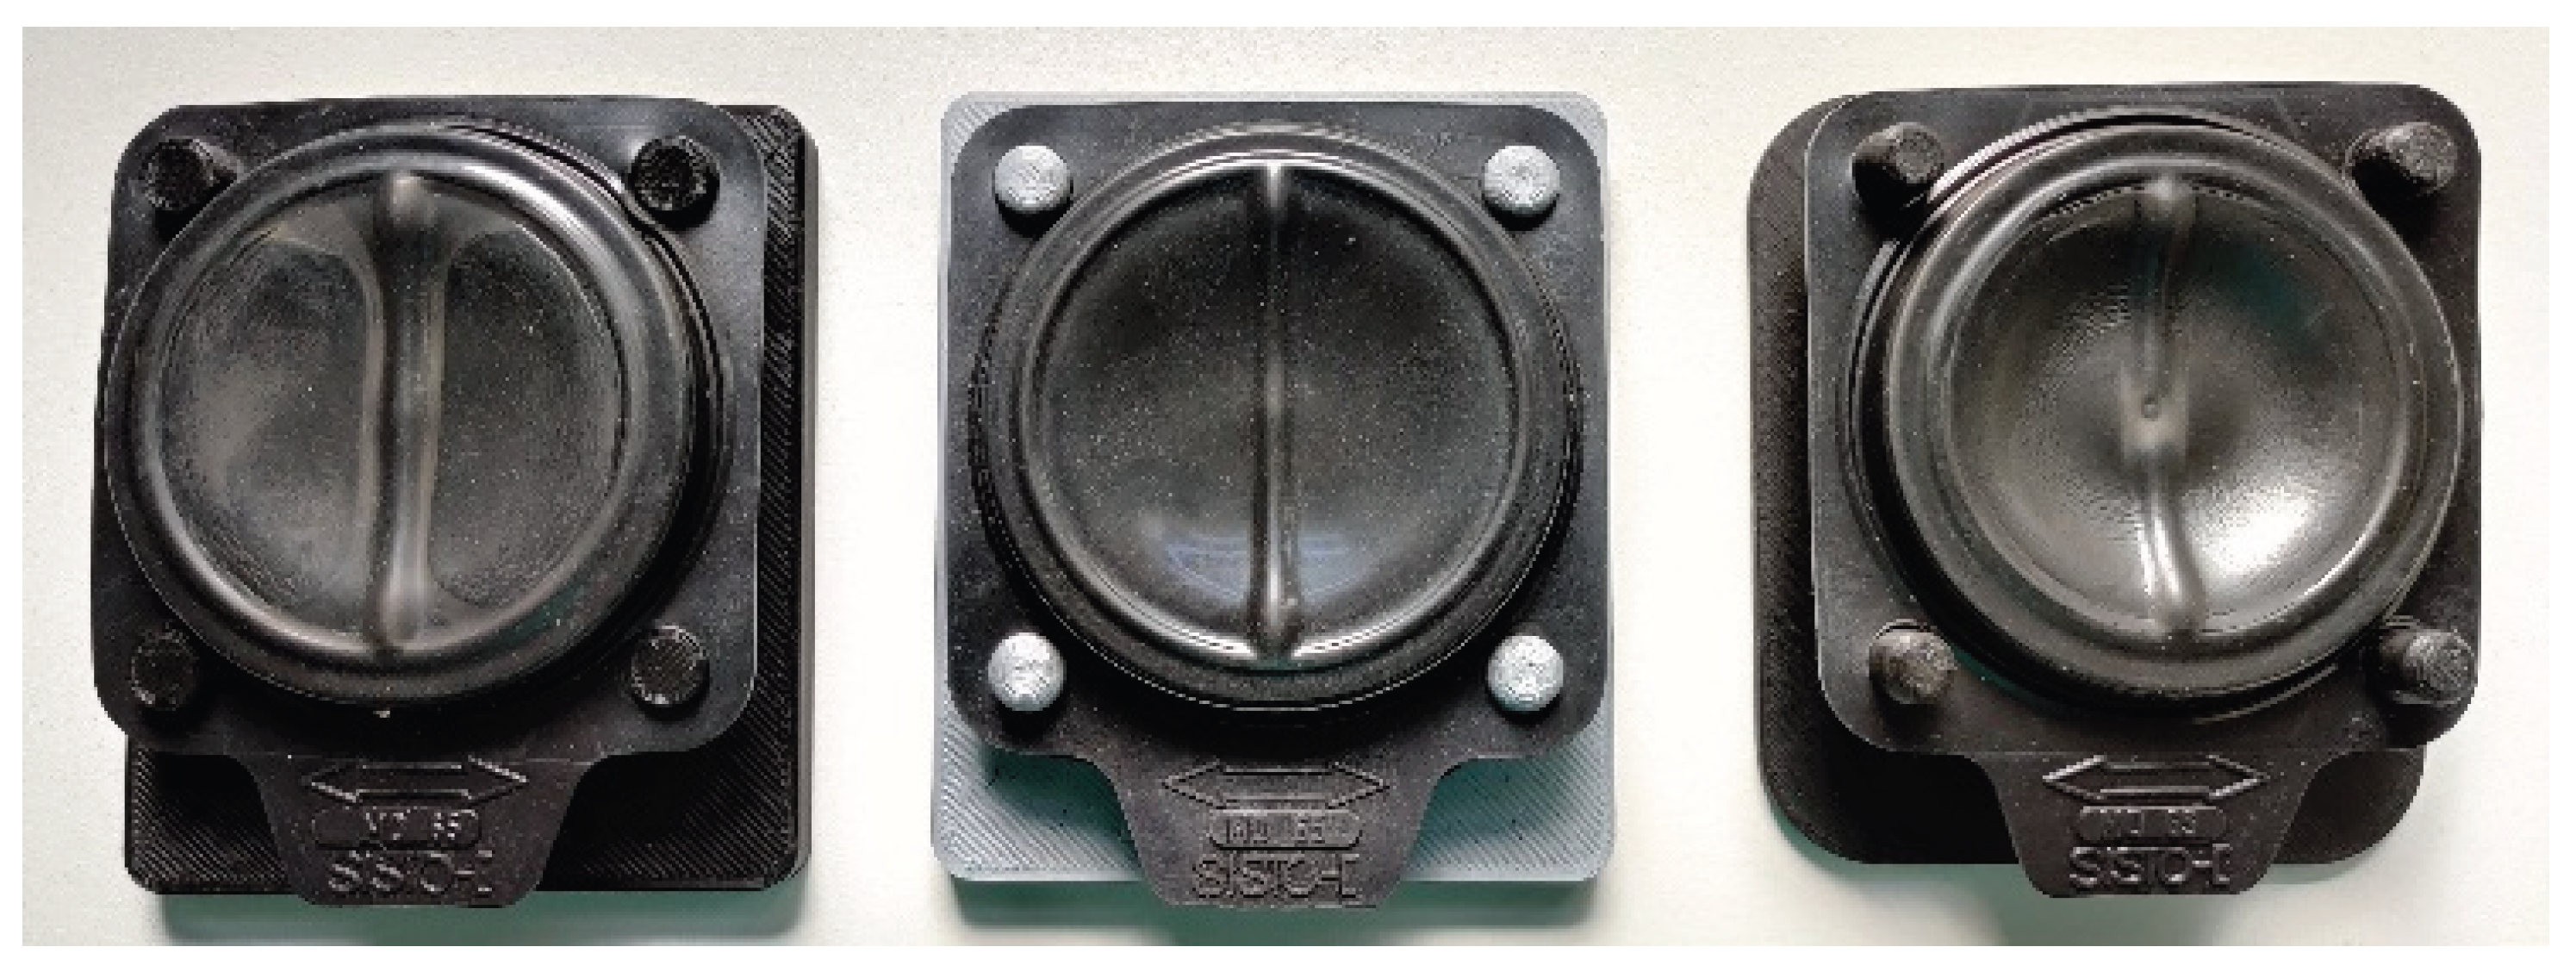
Figure 3.
Typical diaphragm defects (specimens marked in red in the images). (a) deep wrinkle. (b) pronounced kidney deformation. (c) initial kidney with area-wide wrinkles. (d) single radial crack. (e) multiple cracks with accompanying wrinkles.
Figure 3.
Typical diaphragm defects (specimens marked in red in the images). (a) deep wrinkle. (b) pronounced kidney deformation. (c) initial kidney with area-wide wrinkles. (d) single radial crack. (e) multiple cracks with accompanying wrinkles.
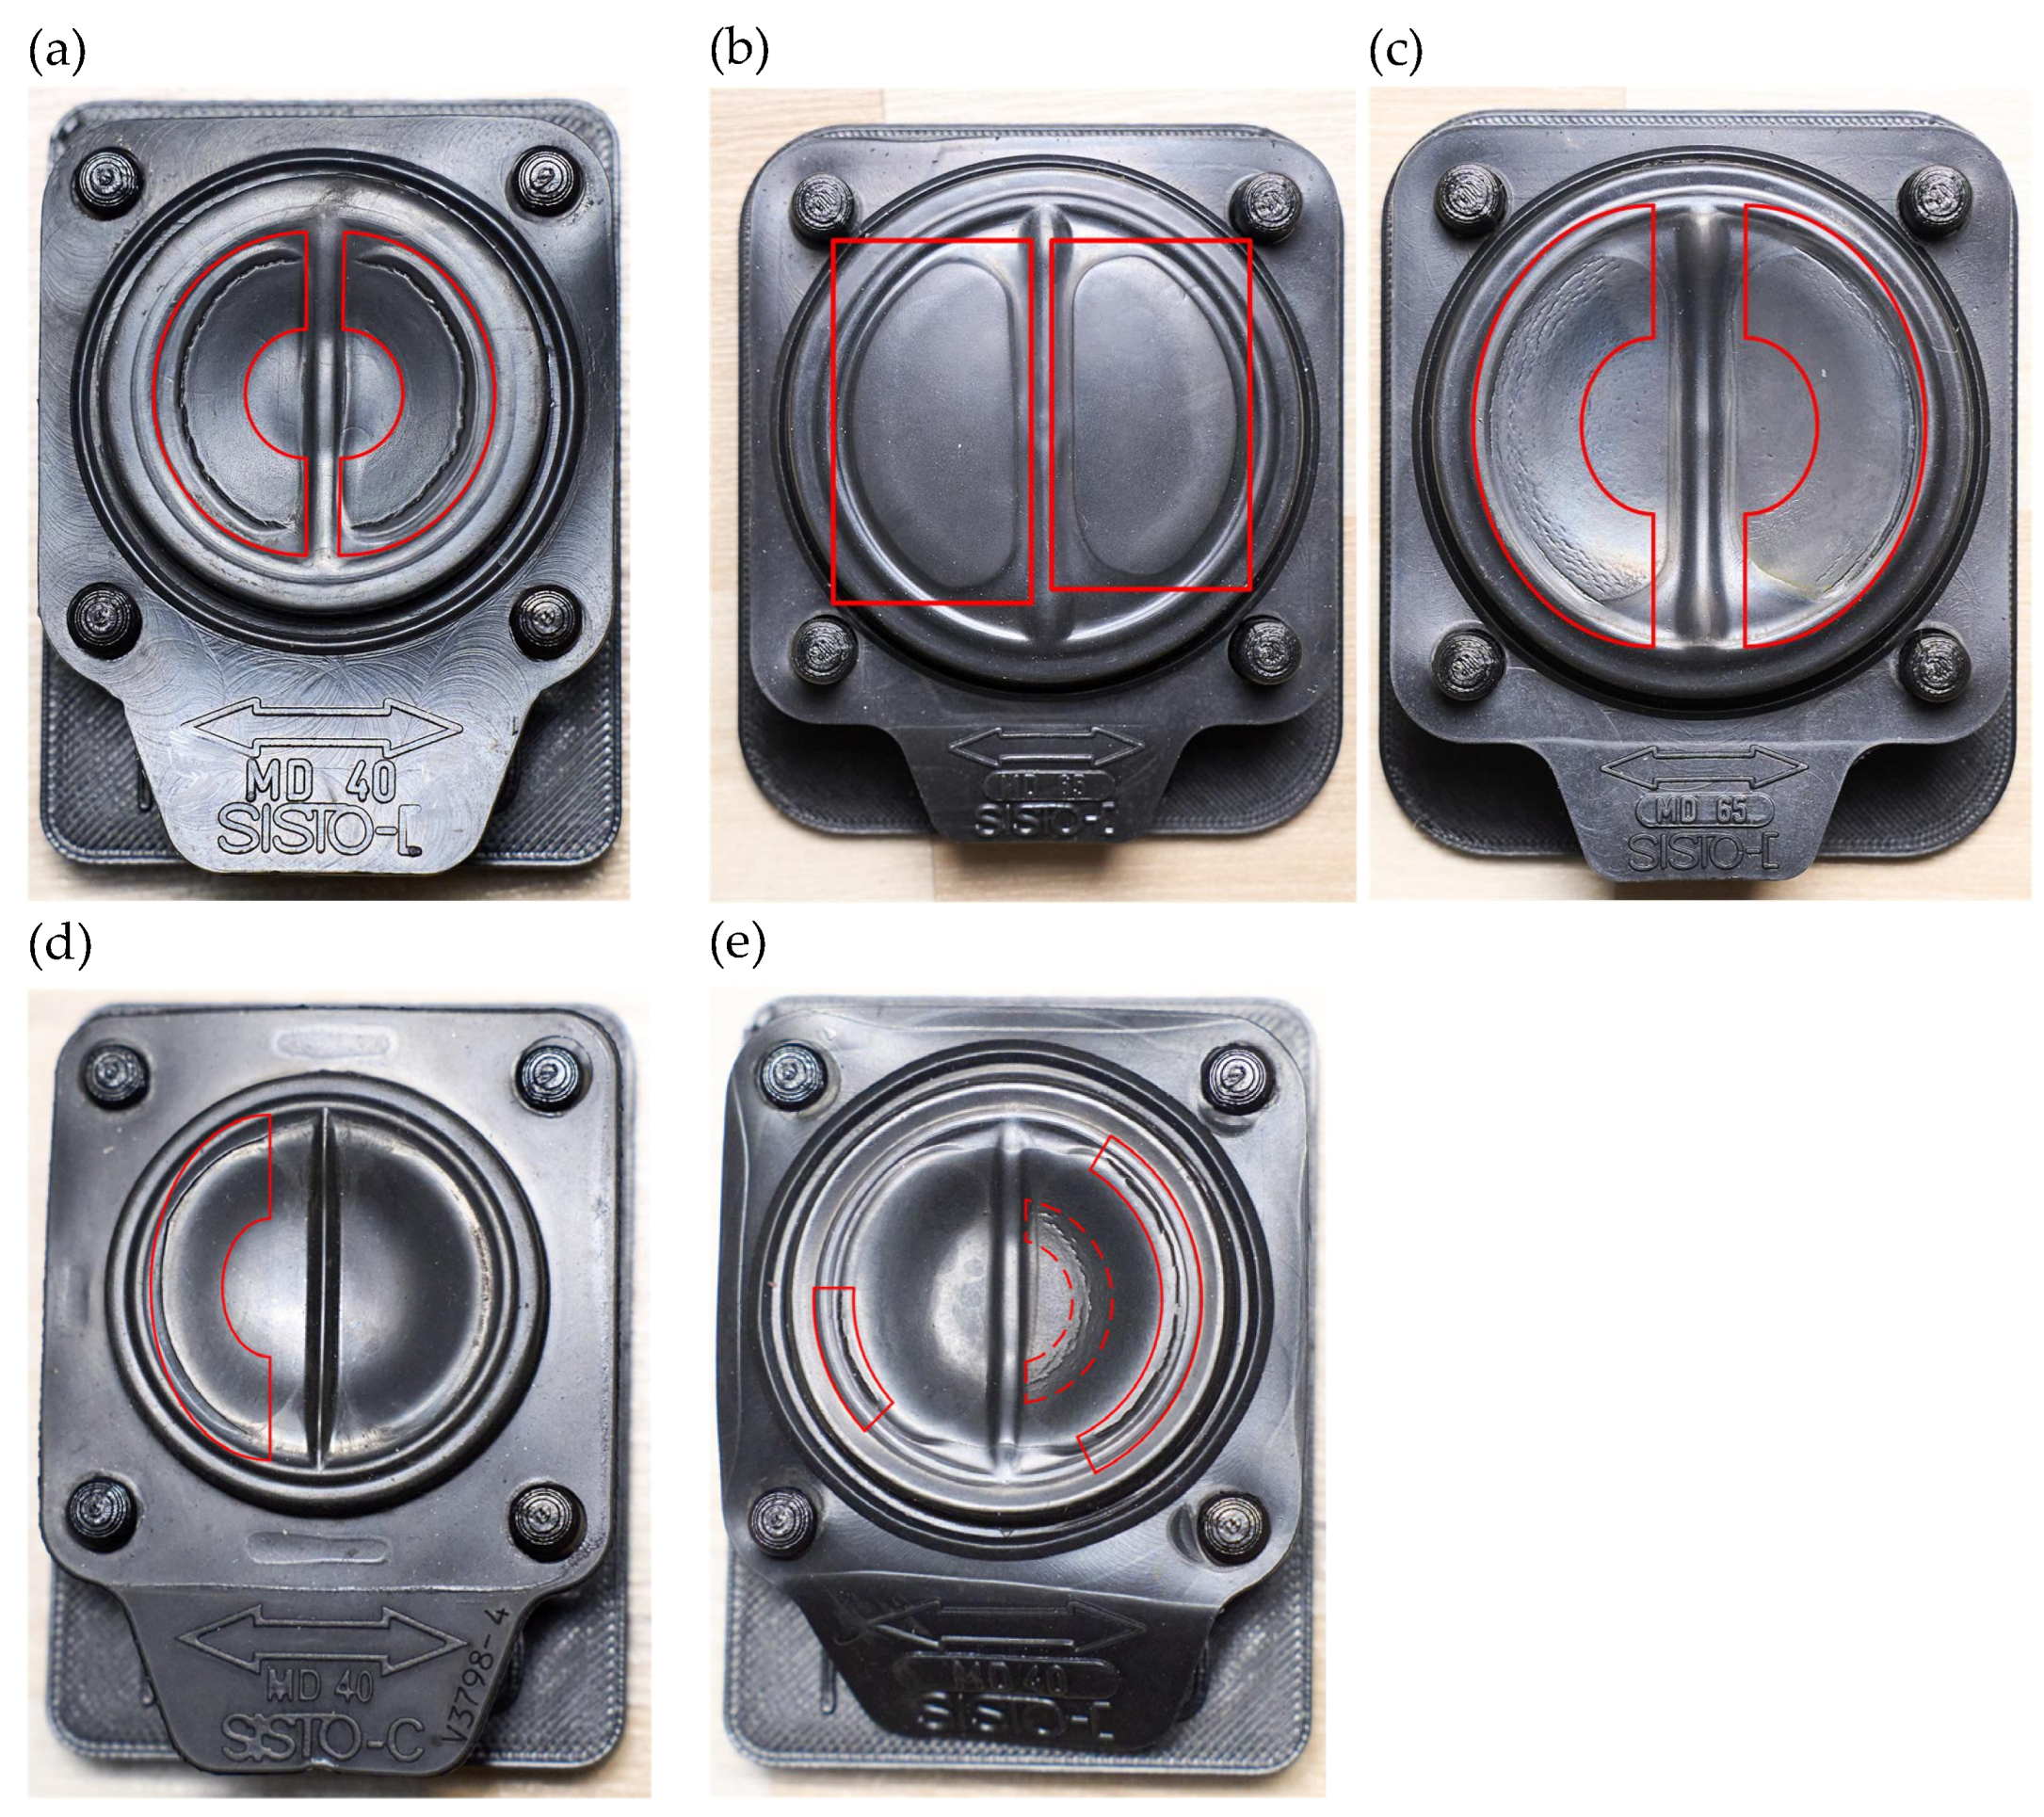
Figure 4.
Setup of the image processing station.
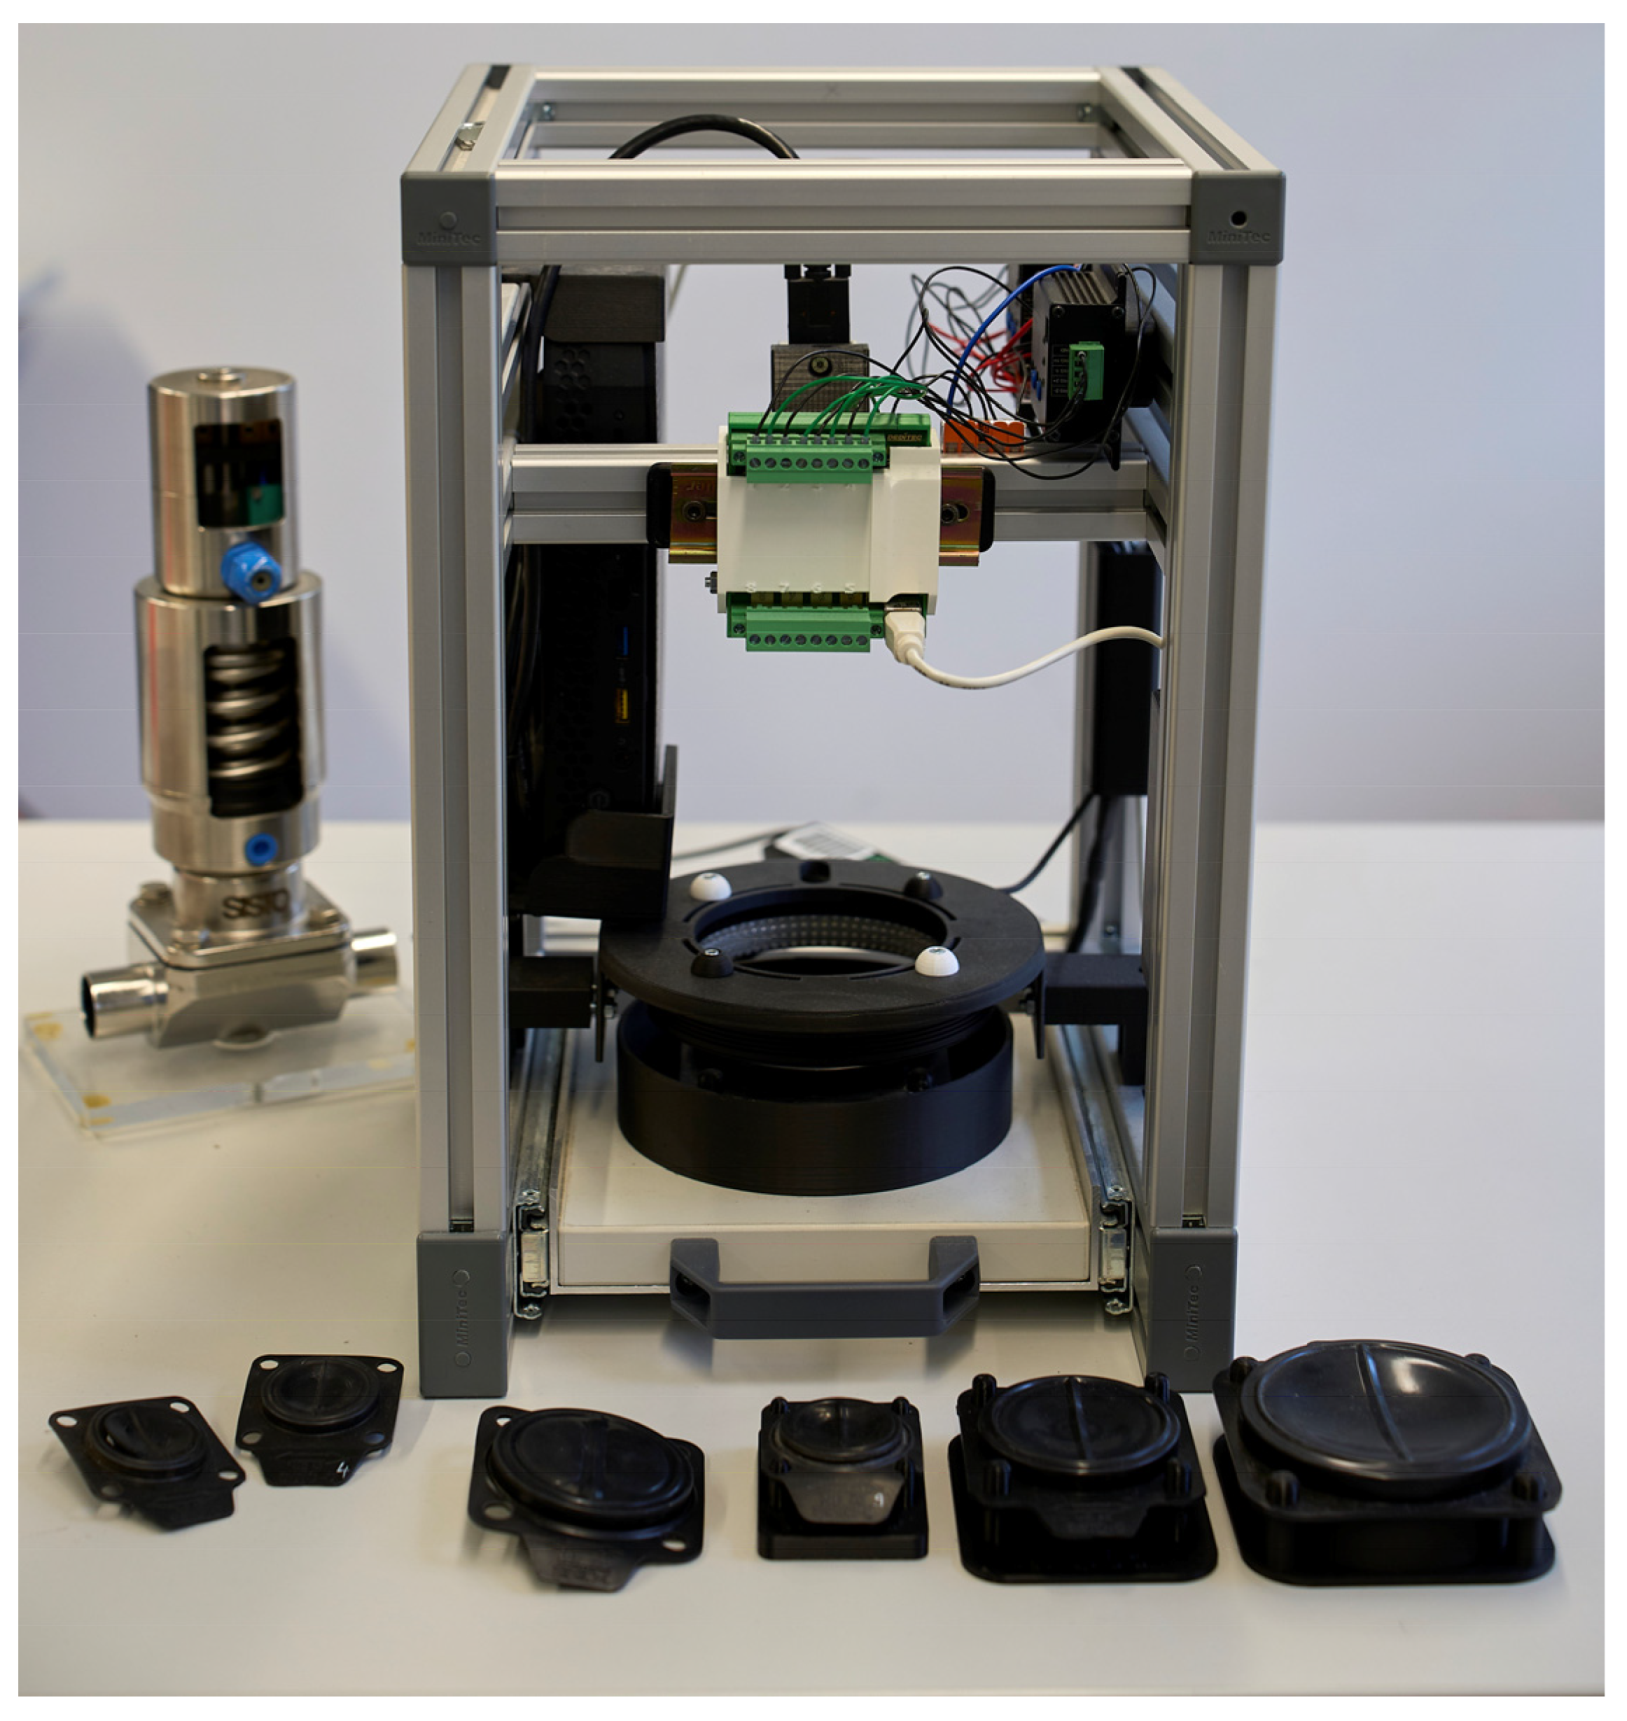
Figure 7.
Flow diagram depicting the execution of the algorithm.
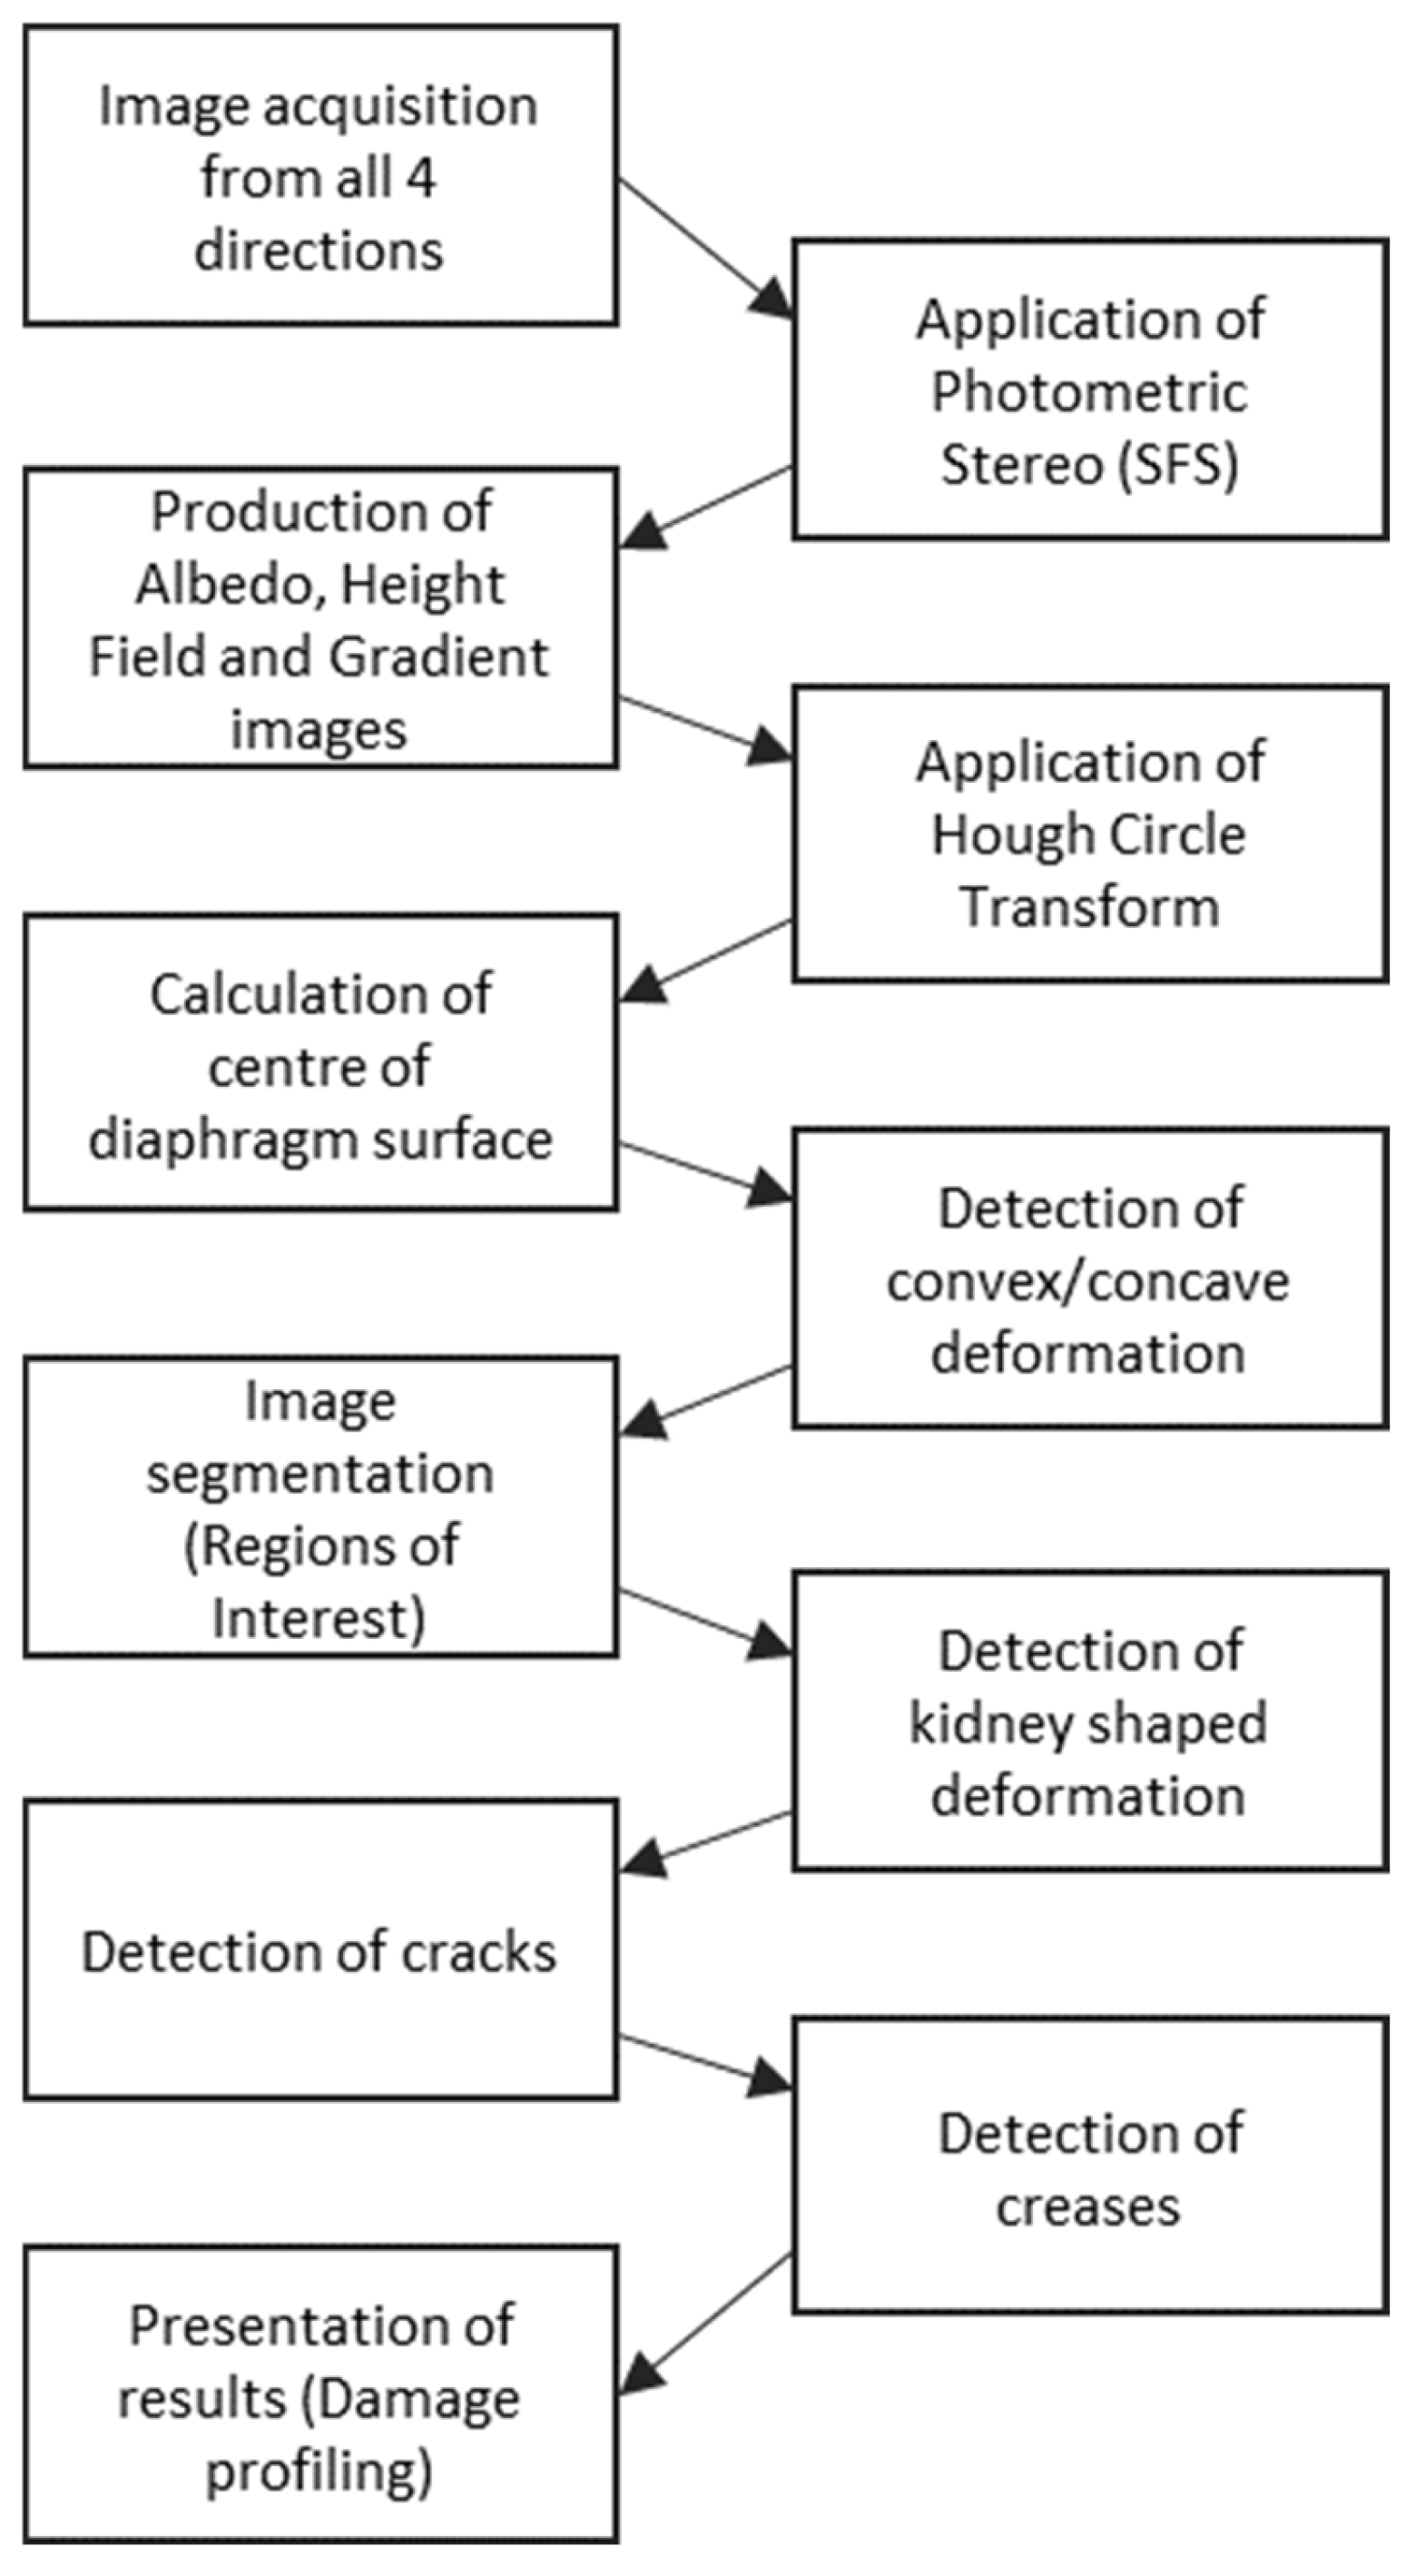
Figure 8.
An example of damage profiling of a diaphragm is seen on the right side, with the albedo image on the left side for reference.
Figure 8.
An example of damage profiling of a diaphragm is seen on the right side, with the albedo image on the left side for reference.
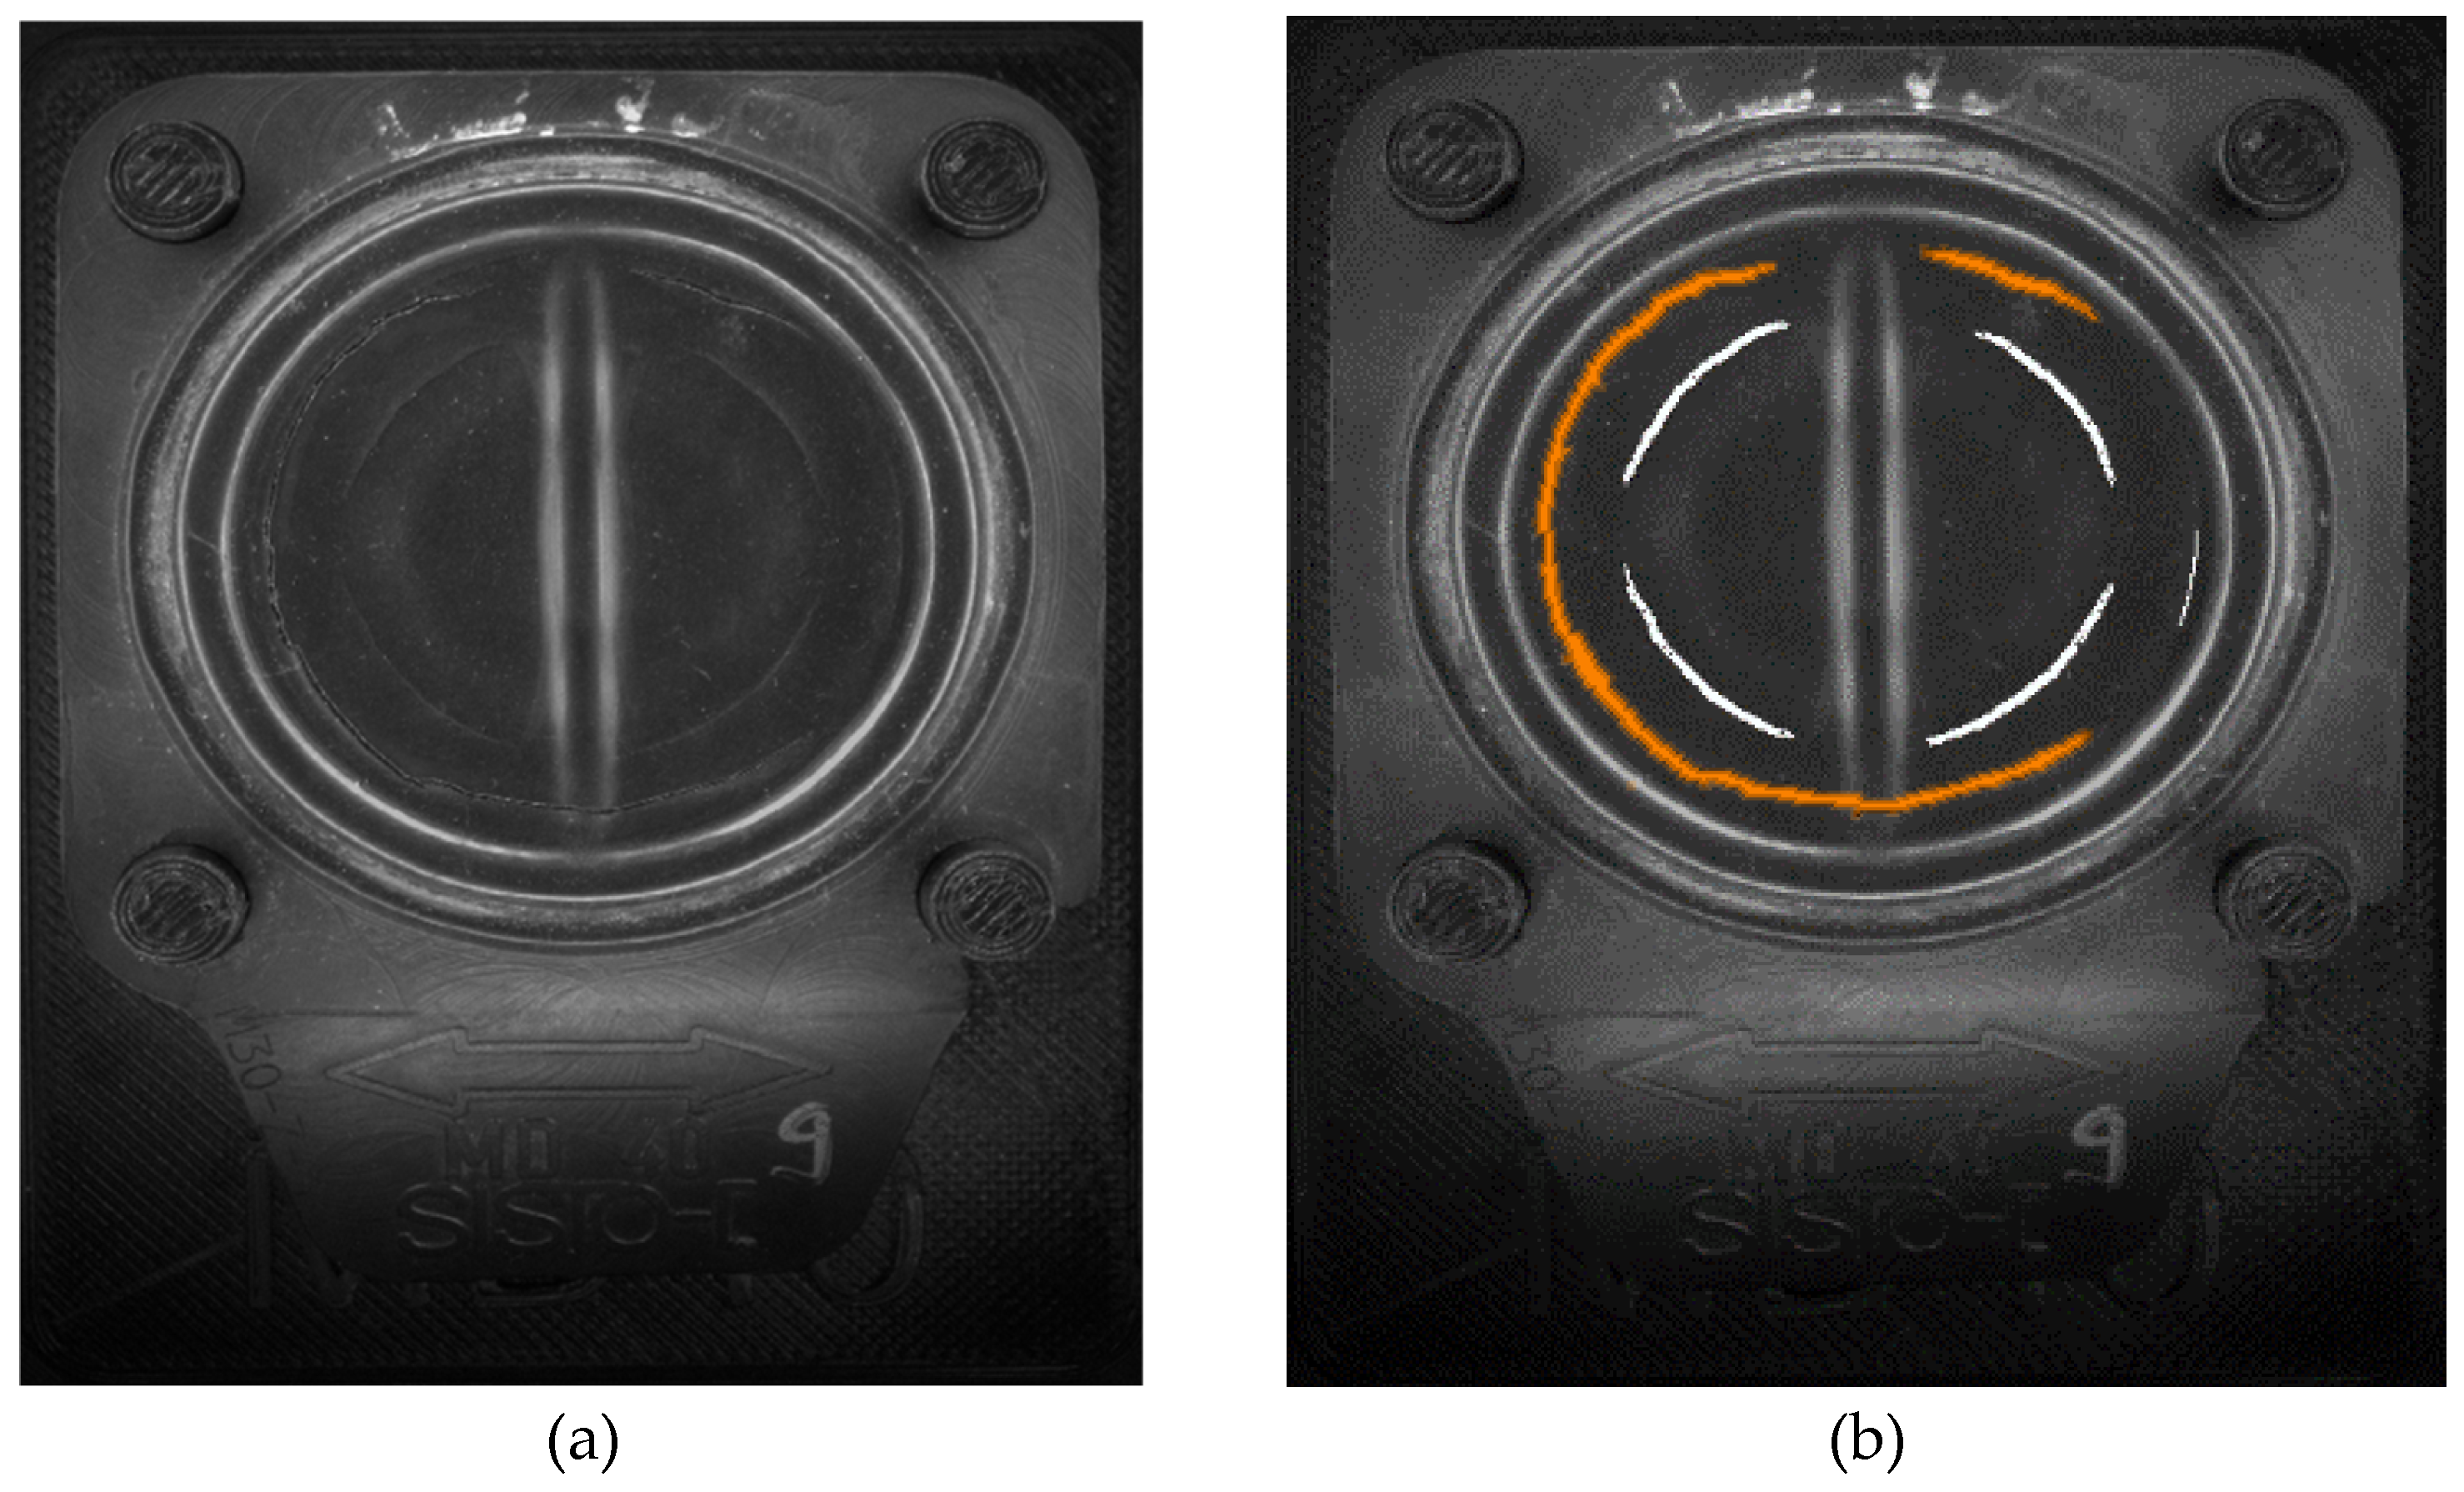
Figure 9.
An example of kidney-shaped bulge damage patterns is seen on the right side, with the albedo image on the left side for reference.
Figure 9.
An example of kidney-shaped bulge damage patterns is seen on the right side, with the albedo image on the left side for reference.
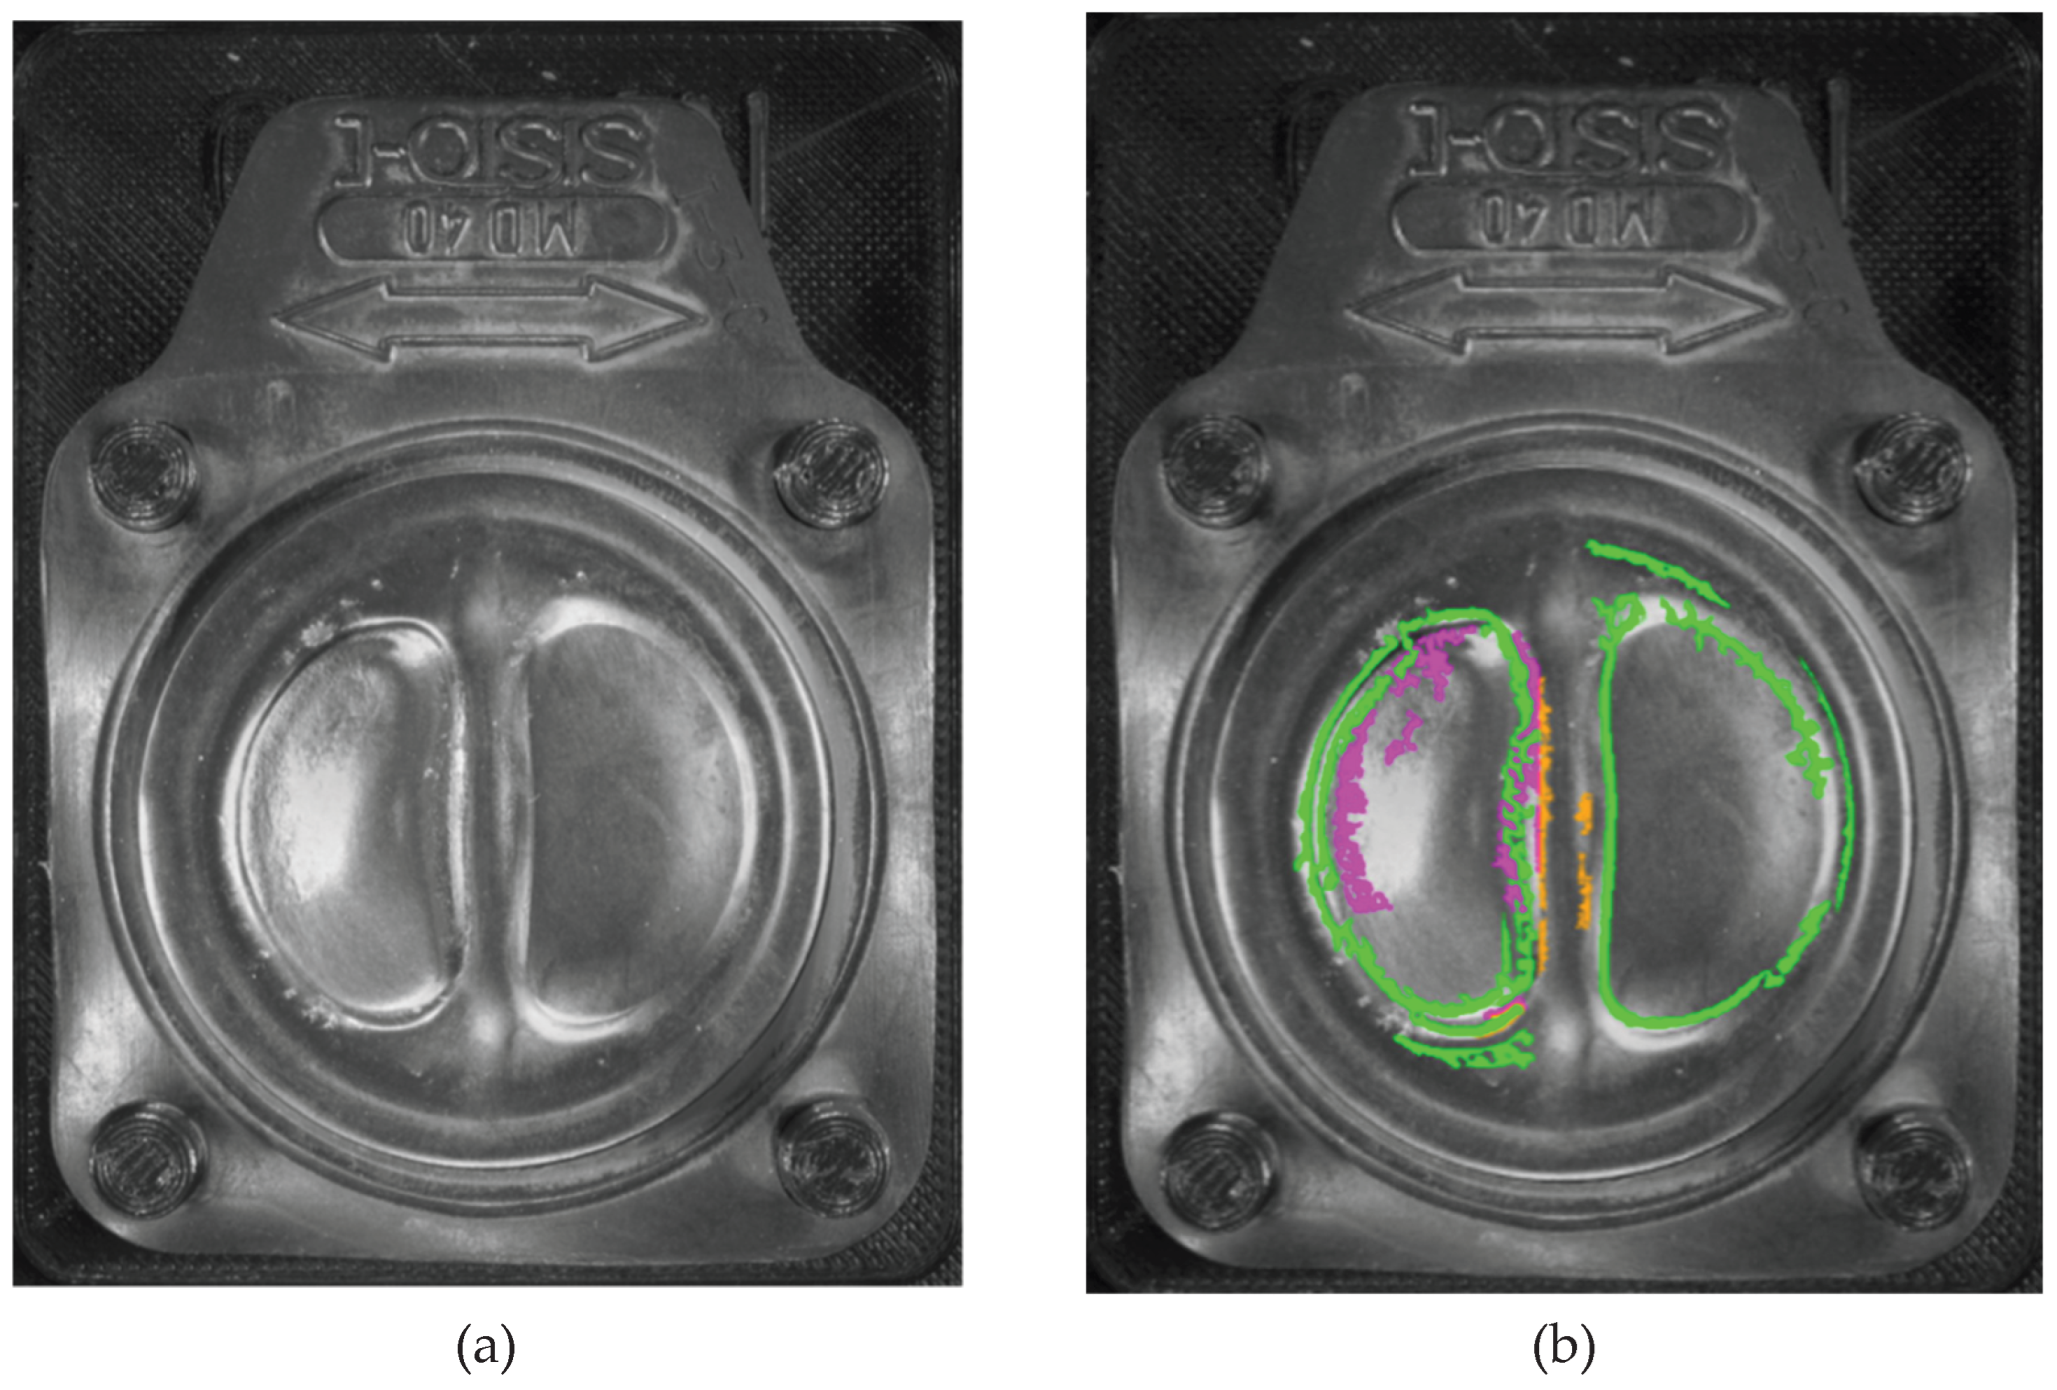
Figure 10.
Confusion matrices for (a) kidney defect detection and (b) warp out-of-tolerance detection.
Figure 10.
Confusion matrices for (a) kidney defect detection and (b) warp out-of-tolerance detection.
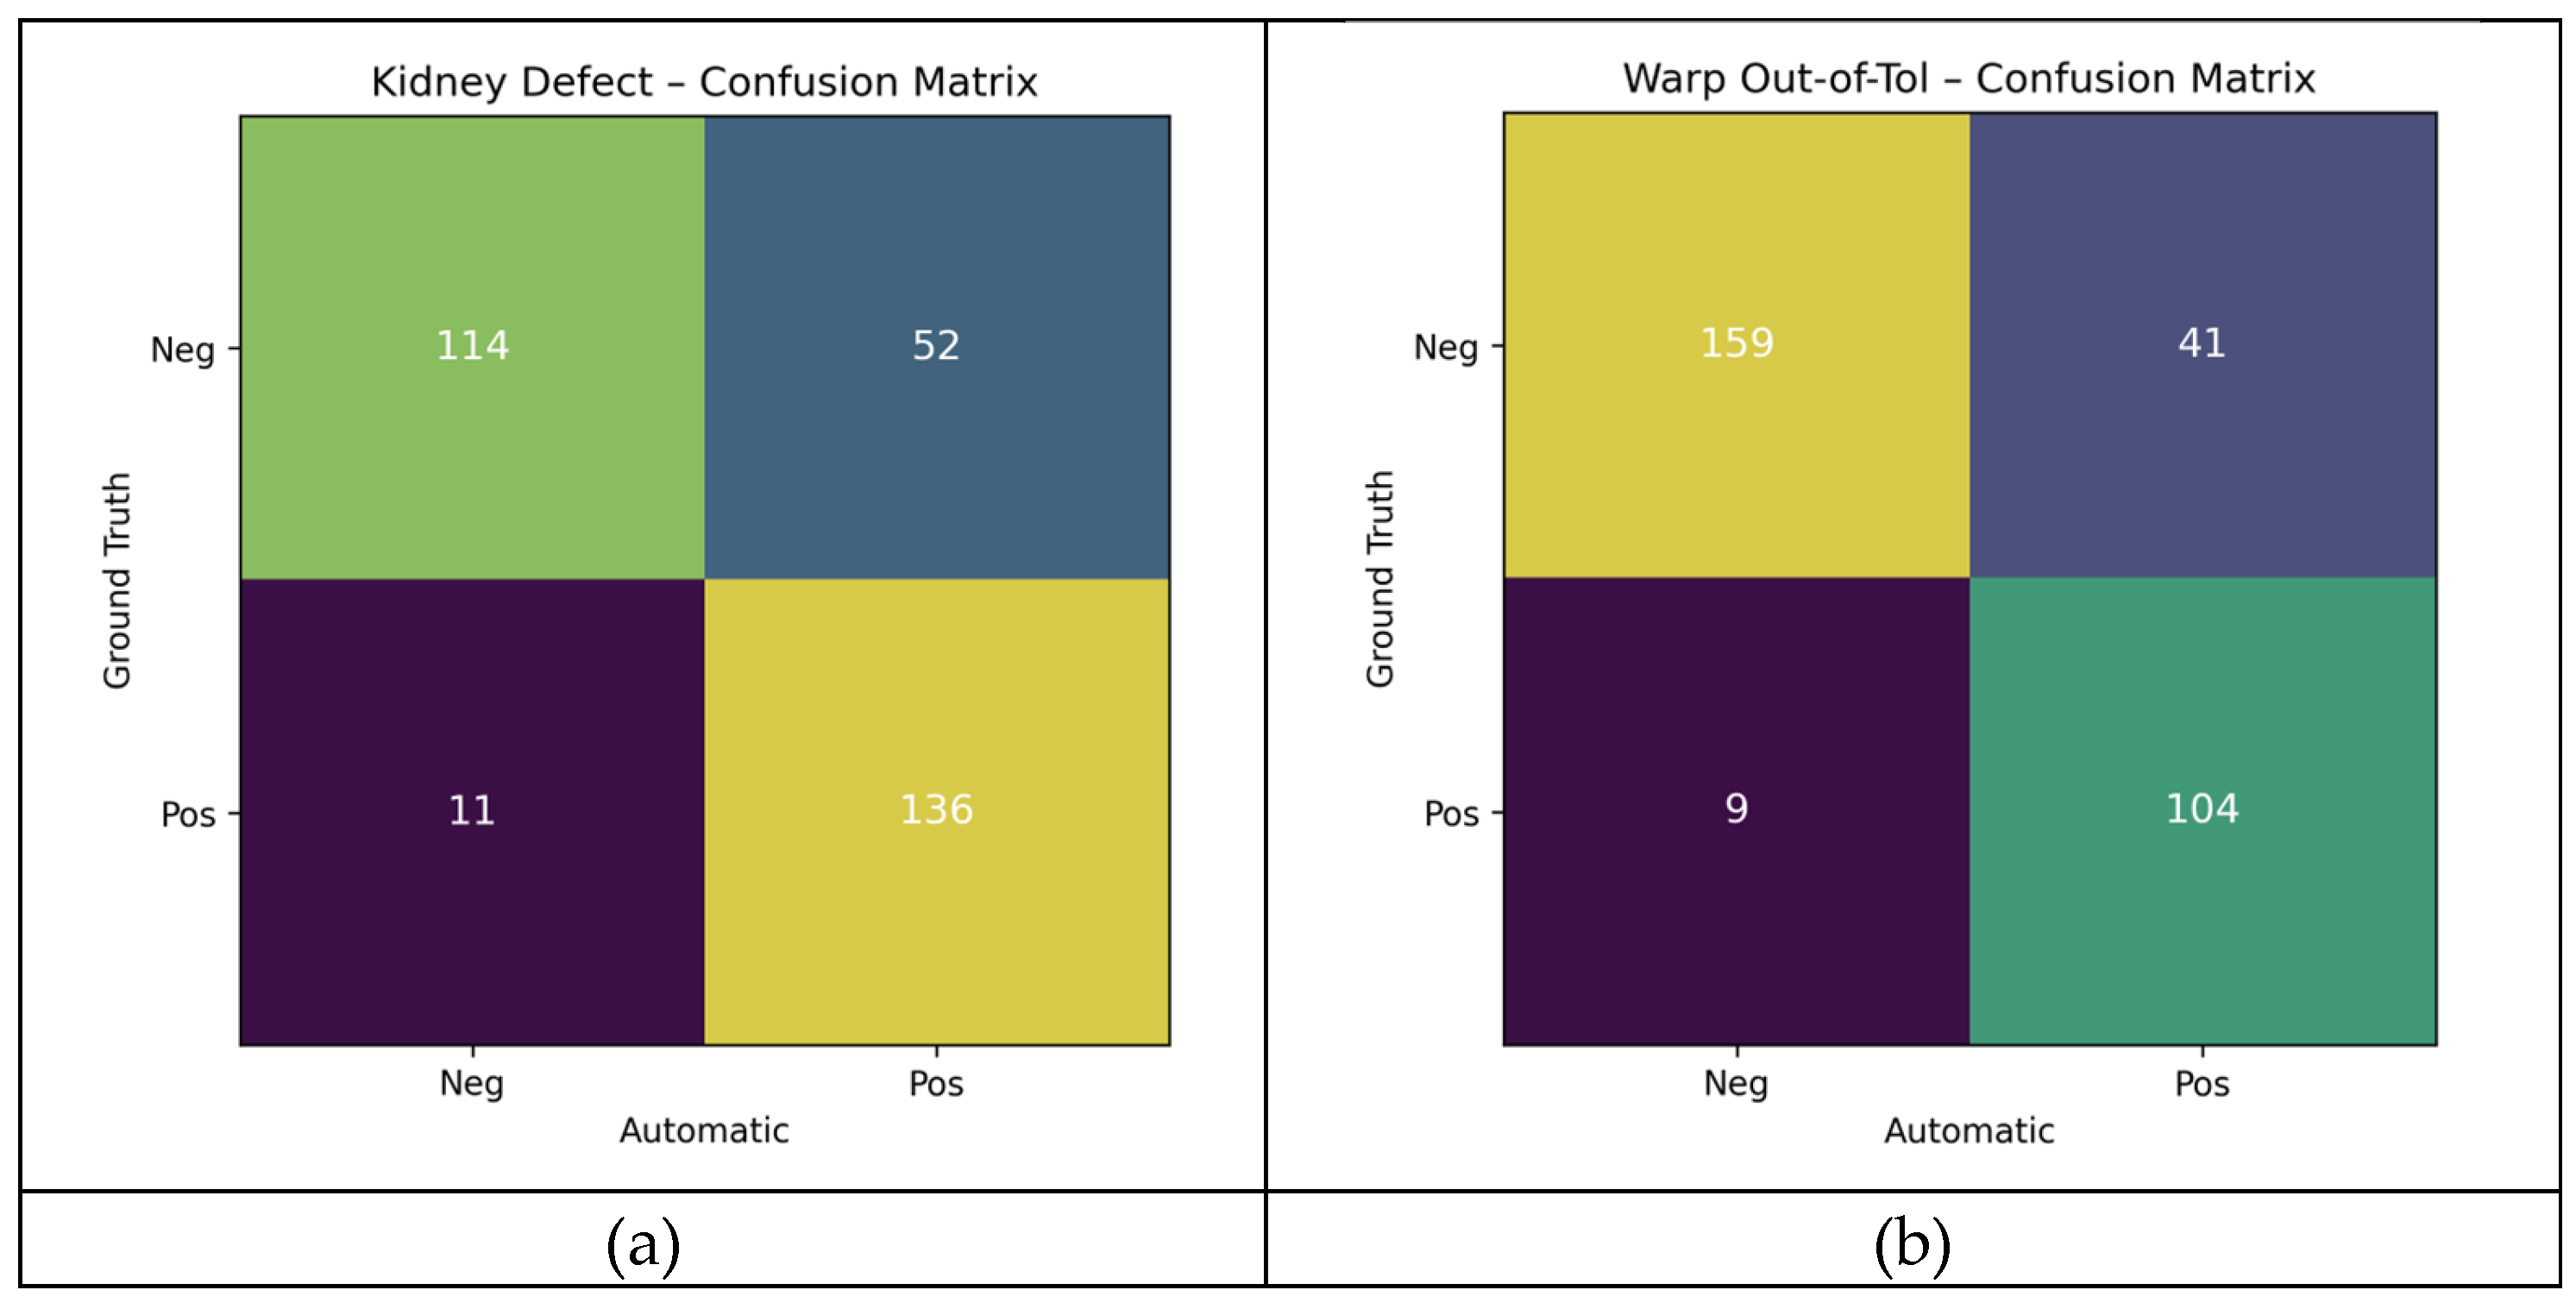
Figure 11.
Confusion matrices for (a) crack presence detection and (b) wrinkle presence detection.
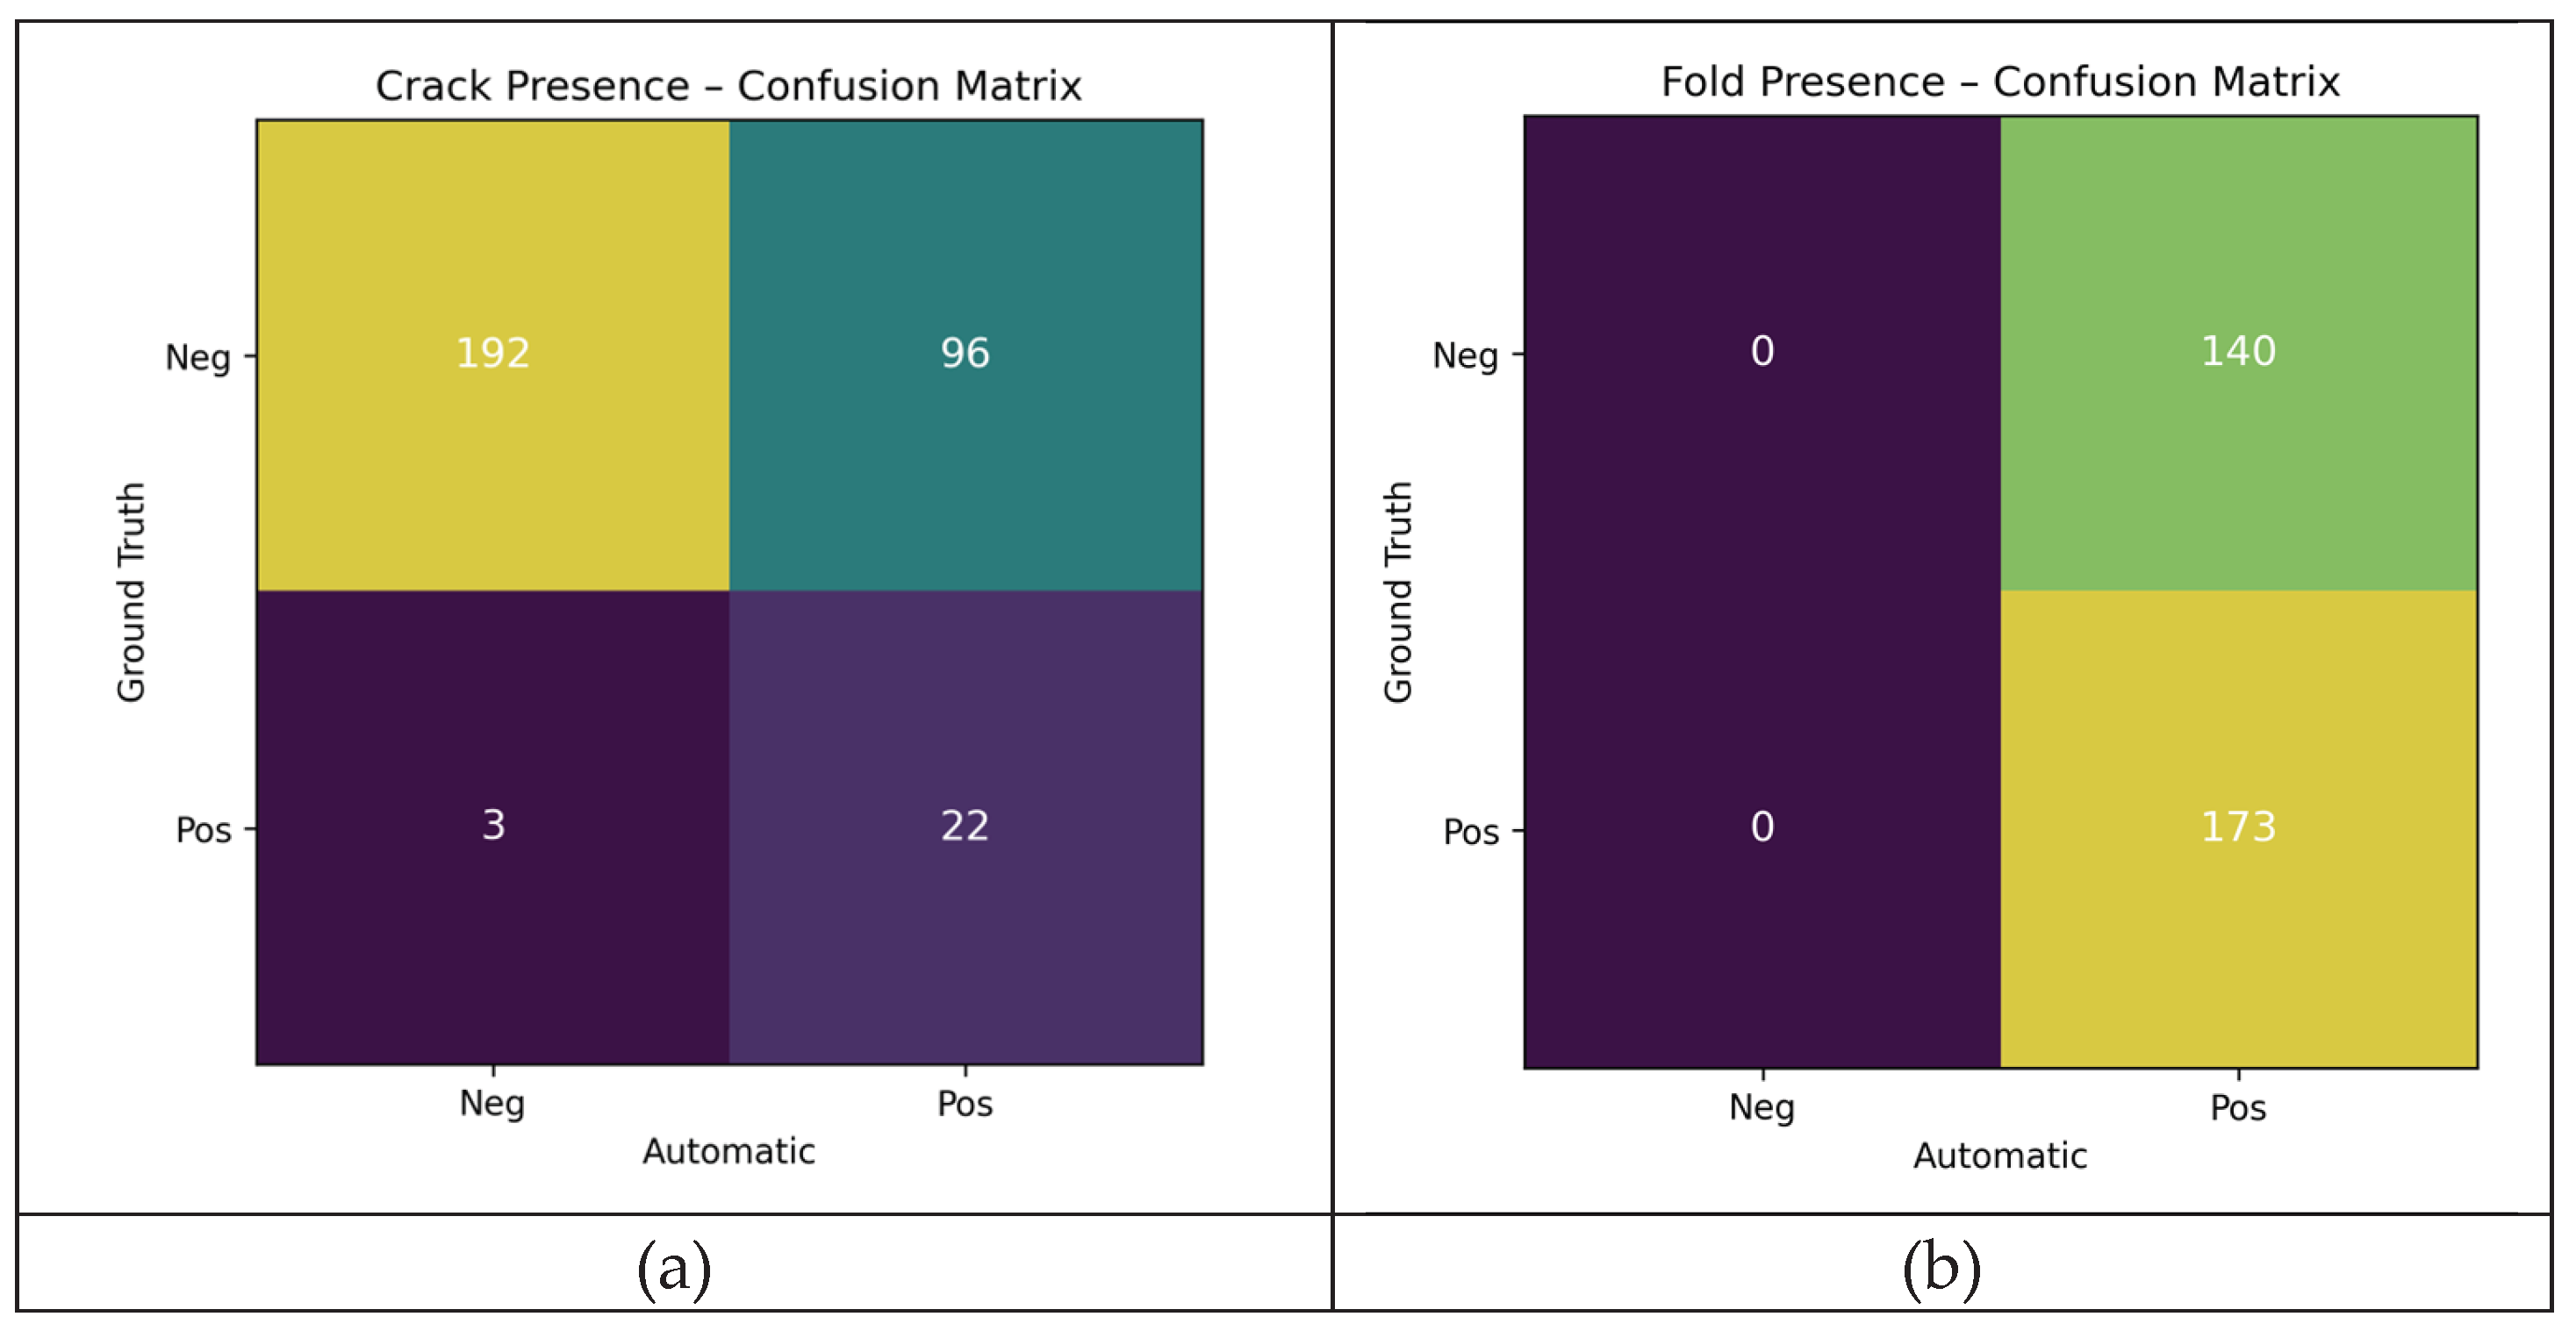

Table 1.
Illumination modes (summary of observations).
| Mode | Strengths | Limitations on used diaphragms | Outcome |
|---|---|---|---|
| Dome (diffuse) | Uniform shading; low specular glare | Flattens shape cues; weak sensitivity to shallow height changes; kidneys less pronounced | Good for near-flat parts; insufficient on warped parts |
| Coaxial (telecentric gloss rejection) | Enhances small albedo contrast; simple setup | Sensitive to tilt/warp; highlights move with curvature; crack cues unstable | Acceptable on flat samples; unstable with warping |
| Darkfield (segmented) | Emphasizes slopes/edges; robust shape cues; segments enable SFS | Requires careful geometry; segment balance critical | Selected: best trade-off and PS-compatible |
Table 2.
Statistical metrics for evaluating the analysed diaphragm.
| Type of Defect | TN | FP | FN | TP | Accuracy | Precision | Recall | F1 | Specificity | McNemar_p |
|---|---|---|---|---|---|---|---|---|---|---|
| Kidney Defect | 114 | 52 | 11 | 136 | 0.799 | 0.723 | 0.925 | 0.812 | 0.687 | 4.67E-07 |
| Warp Out-of-Tol | 159 | 41 | 9 | 104 | 0.840 | 0.717 | 0.920 | 0.806 | 0.795 | 1.16E-05 |
| Crack Presence | 192 | 96 | 3 | 22 | 0.684 | 0.186 | 0.880 | 0.308 | 0.667 | 2.32E-20 |
| Wrinkle Presence | 0 | 140 | 0 | 173 | 0.553 | 0.553 | 1.000 | 0.712 | 0.000 | 7.26E-32 |
Disclaimer/Publisher’s Note: The statements, opinions and data contained in all publications are solely those of the individual author(s) and contributor(s) and not of MDPI and/or the editor(s). MDPI and/or the editor(s) disclaim responsibility for any injury to people or property resulting from any ideas, methods, instructions or products referred to in the content. |
© 2025 by the authors. Licensee MDPI, Basel, Switzerland. This article is an open access article distributed under the terms and conditions of the Creative Commons Attribution (CC BY) license (http://creativecommons.org/licenses/by/4.0/).
Copyright: This open access article is published under a Creative Commons CC BY 4.0 license, which permit the free download, distribution, and reuse, provided that the author and preprint are cited in any reuse.


