

Submitted:
30 September 2025
Posted:
01 October 2025
You are already at the latest version
Abstract
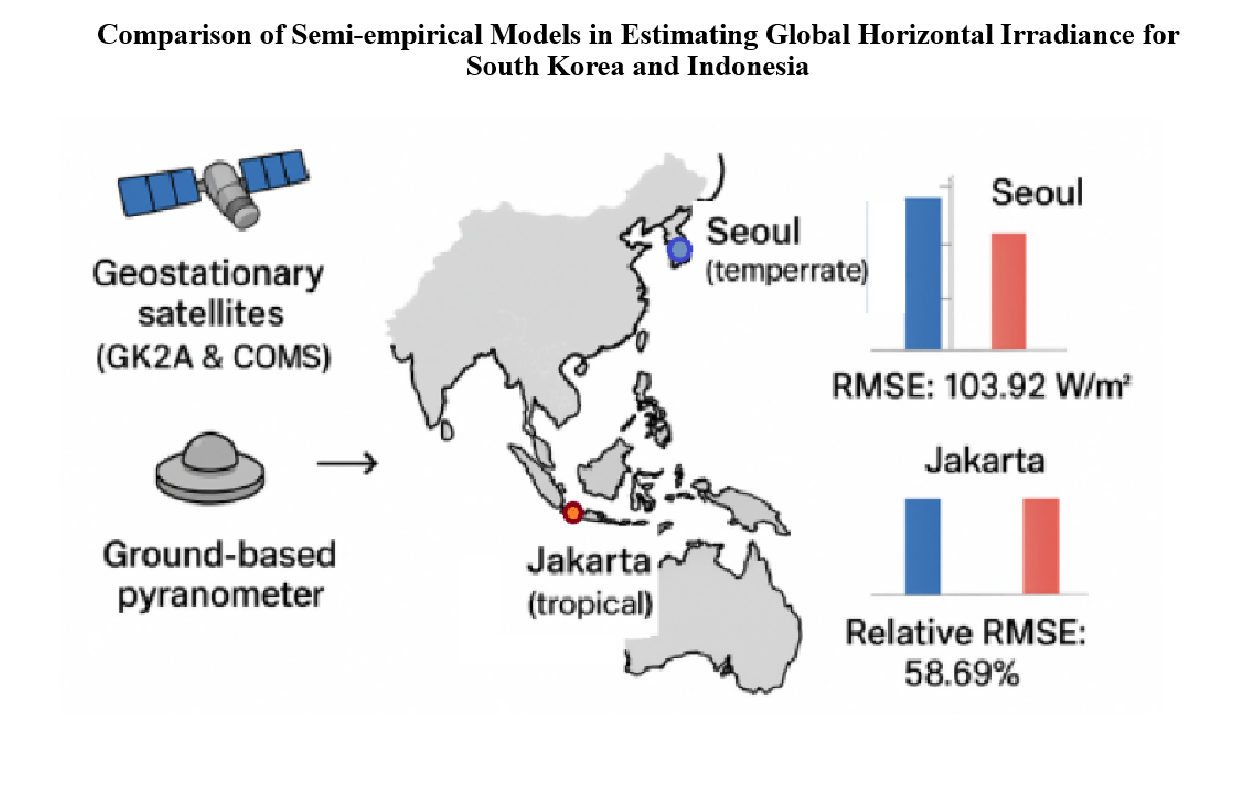
Accurate estimation of global horizontal irradiance (GHI) is essential for optimizing photovoltaic (PV) systems, particularly in regions with distinct climatic characteristics. Geostationary satellites, such as GK2A and COMS, provide consistent and spatially extensive data, offering a practical alternative to ground-based measurements. However, the performance of semi-empirical GHI models has been sparsely evaluated across diverse geographic zones. This study conducts a comparative analysis of four semi-empirical models—Beyer, Rigollier, Hammer, and Perez—applied to two contrasting locations: Seoul, South Korea (temperate) and Jakarta, Indonesia (tropical). Using satellite-derived cloud indices and ground-based pyranometer data, model performance was evaluated via RMSE, MBE, and their relative metrics. Results indicate that the Hammer model achieves the best performance in Seoul (RMSE: 103.92 W/m²; MBE: 0.09 W/m²), while the Perez model outperforms others in Jakarta with the lowest relative RMSE of 58.69%. The analysis highlights the limitations of transferring models calibrated in temperate climates to tropical settings without regional adaptation. This study provides critical insights for improving satellite-based GHI estimation and supports the development of region-specific forecasting tools essential for expanding solar infrastructure in Southeast Asia.
Keywords:
global horizontal irradiance
; photovoltaic
; satellite images
; semi-empirical models
; cloud index
; tropics
1. Introduction
The widespread adoption of solar photovoltaic (PV) energy represents a robust response to the challenges posed by global warming and climate change, primarily attributed to the combustion of fossil fuels. PV technology has gained recognition as a leading form of sustainable energy, attributed to its inherent versatility and cost-effective maintenance. However, the intermittent nature of solar irradiance presents a significant hurdle, leading to unpredictability and variability in power generation from PV systems. This intermittency is intricately linked to regional climatic variables, including cloud cover, aerosol levels, and solar orientation specific to geographic locations. Consequently, the acquisition of precise solar irradiance data holds paramount importance, which is maximizing solar PV power output and ensuring the efficient operation of PV systems. Recognizing the potential of solar energy, governments worldwide, including those of Korea and Indonesia, have implemented various initiatives to promote the adoption of PV technology. These efforts include incentive programs, subsidies, and policy frameworks aimed at encouraging investment in solar infrastructure and research and development, thereby advancing the transition to clean energy sources [1,2,3,4,5,6].
It is necessary to make consistent progress in the collection of accurate and up-to-date solar irradiance data to address the difficulty of intermittent solar irradiance. To evaluate the viability of PV installations in a variety of geographical areas, it is essential to have a solid understanding of the local climate conditions. This all-encompassing comprehension makes it possible to accomplish better planning and management of PV systems, which in turn maximizes the exploitation of solar resources. Furthermore, accurate measurements of solar irradiance offer several benefits, such as the ability to accurately anticipate the potential for energy generation, the optimization of system design and orientation, and the efficient operation of the system through real-time monitoring and adjustment. In addition, the incorporation of cutting-edge monitoring and forecasting technologies plays a significant part in minimizing the effects of intermittency, which ultimately results in an improvement in the dependability and consistency of solar energy consumption. The necessity of gathering and utilizing solar irradiance data is becoming more recognized by governments and research organizations all over the world, particularly in light of the ongoing improvements in solar photovoltaic technology [7,8,9].
The direct measurement of solar irradiance on the ground relies on specialized instruments such as pyranometers, which measure total solar radiation, and pyrheliometers, which measure direct solar radiation. These instruments are widely regarded as the most dependable and reliable sources of data. Significant advancements in irradiance measurement technology recently have facilitated the acquisition and automated monitoring of real-time data. However, ground measurement systems, while reliable, come with substantial costs and require meticulous maintenance. As a result, the spatial coverage area of ground measurements is limited, and the existing measurement database falls short of meeting the demands of the modern PV industry. Despite efforts by some researchers to mitigate the limitations of direct measurements’ spatial coverage through conventional methods such as interpolation, the accuracy of the interpolated data remains insufficient [7,10,11].
The utilization of satellite data is crucial in the precise monitoring of solar irradiance throughout the Earth’s surface. Zelenka et al. [7] highlight that the accuracy of data obtained from satellites is comparable to that gained through interpolation from a ground station located 25 kilometers away. The integration of satellite-driven information into the national database is credited with the efficacy of the comprehensive coverage of solar radiation data in the United States [12]. Geostationary satellites, which are strategically aligned with the Earth’s rotation, have exceptional capabilities in continually acquiring high-resolution imagery of precise regions on the Earth’s surface. The satellites in the most recent iteration have impressive spatial resolutions of 0.5 x 0.5 km for every visible channel image. For instance, Fengyun (Wind and Cloud)-4A and Geo-KOMPSAT-2A (GK2A) satellite systems can provide 0.5 x 0.5 km spatial resolution, while the time interval is 15 and 10 minutes, respectively [13,14,15]. This signifies that the utilization of solar irradiance data obtained from geostationary satellite photos is a powerful and cost-effective solution for meeting the increasing needs of the solar energy industry.
The incorporation of remote sensing methods has brought about substantial progress in both the time and location resolutions of data, hence facilitating the development of new and inventive methods for estimating solar irradiance. According to Kleissl [16], satellite-based solar irradiance models can be broadly classified into three primary categories: physical, empirical, and semi-empirical approaches. Physical methodologies primarily depend on radiative transfer models (RTMs) to thoroughly examine the transmission of radiation through different levels of the atmosphere. Comprehensive and precise data is necessary in order to provide reliable assessments of atmospheric constituents, including cloud optical properties, aerosol optical depth (AOD), and water vapor concentration [16]. In contrast, empirical models apply regression methods to create correlations between satellite measurements and ground-based records, relying exclusively on observable data [14]. Semi-empirical models provide a comprehensive integration of physical and empirical approaches, hence facilitating the connection between theoretical comprehension and practical observations [17].
Many studies have made significant advancements to extract satellite imagery for estimating global horizontal irradiance (GHI) [1,2,3,8,18,19,20,21,22,23]. As previously outlined, techniques for estimating GHI are typically categorized as physical or semi-empirical. Physical models utilize radiative transfer models (RTMs) to theoretically calculate the transmission of solar irradiance through the atmosphere. In contrast, semi-empirical models rely on empirical relationships between surface albedo and the clear-sky index, integrating key physical processes. Accurate simulation of these processes necessitates comprehensive atmospheric data, including aerosol optical depth, ozone concentration, and precipitable water content. However, local atmospheric data availability often lags ground measurement data for solar irradiation. Conversely, semi-empirical models rely on simplified assumptions and statistical analysis [24]. The input variables used in semi-empirical models are generally more accessible compared to those used in physical models. A distinguishing aspect of semi-empirical models is their capability to forecast GHI for future periods [25]. Due to their simplicity and ease of implementation, semi-empirical models are favored for solar irradiance forecasting over physical models, which require more complex input data [15].
The effectiveness of semi-empirical models used to estimate solar irradiation has been investigated in a number of research studies [2,3,8,18,21,22,26,27]. These studies have revealed a wide range of discrepancies between the expected and observed radiation levels. It’s noteworthy that a significant portion of the datasets used for developing and validating these models originate from countries situated within moderate latitudes, which share similarities with South Korea. Despite this, the application of semi-empirical models in South Korea remains rare. Moreover, when considering tropical environments, the scarcity of studies evaluating the efficacy of semi-empirical models is even more pronounced.
Numerous research studies conducted in Korea have aimed to extract GHI data from the Communication, Ocean, and Meteorological Satellite (COMS) and GK2A system in the country [25,26,27,28,29]. Since the development of COMS and GK2A, most studies have focused on physical models. Zo et al. [28] were the first to contribute to the field of GHI modeling of solar irradiance by utilizing COMS data as input. They also established the Gangneung-Wonju National University (GWNU) model, which is classified as a physical model. Kim et al. [29] estimate the solar irradiance over the Korean Peninsula by developing a physical model. The University of Arizona Solar Irradiance Based on the Korea Institute of Energy Research (KIER) satellite, called the UASIBS/KIER model. This model became the specific model to forecast solar irradiance in South Korea. Presently, Oh et al. [30] employed the UASIBS/KIER model to forecast solar irradiance a few hours ahead. To the best of our knowledge, there are only a few studies that apply a semi-empirical approach in the Korea region. There are Kamil et al. [25] and Choi et al. [27]. Kamil et al. [25] conducted a comparison study between machine learning, physical, and semi-empirical models. A preprocessing approach was integrated into the Rigollier model by Choi et al. [27] in order to distinguish between cloud cover and ground irradiance.
Several studies have been conducted in the tropical zone to quantify solar irradiance using semi-empirical methods and satellite systems [31,32,33,34]. Nevertheless, there is a limited amount of research conducted on the analysis and modeling of solar radiation data specifically for the Southeast Asia region, which encompasses Indonesia. As an example, Janjai [34] employed Multifunction Transport Satellite-1 Replacement or Himawari-6 (MTSAT-1R) satellite data to make estimations of direct normal irradiance (DNI) at four distinct stations in Thailand. The study successfully obtained a relative root mean square error (rRMSE) value of 16%. The diffuse solar irradiance was assessed by Janjai et al. [35] using the Himawari 6 satellite system, yielding an rRMSE of 16.7%. Furthermore, a two-layered atmospheric model was developed by Janjai et al. [31] in order to estimate GHI over Thailand. The model achieved an rRMSE of approximately 10%. Nevertheless, it is crucial to acknowledge the scarcity of research that specifically examines the estimation of solar irradiance in Indonesia using satellite-based techniques. So far, Sianturi et al. [36] examined the viability of employing ECMWF reanalysis datasets and MERRA2 satellite data for the purpose of estimating solar irradiance in Indonesia. The methodology employed in this study primarily consists of numerical weather prediction. Hence, the primary objective of this study is to perform a comparative examination of semi-empirical models pertaining to satellite-derived global irradiance in Indonesia and South Korea.
Given the growing importance of semi-empirical models and the scarcity of relevant studies, this study aims to identify suitable semi-empirical models applicable to both the temperate climate of South Korea and the tropical climate of Indonesia. The overarching goal is to enrich the regional solar radiation database and facilitate the integration of PV systems into the local grid infrastructure. The primary objective of this study is to conduct a comparative assessment of existing semi-empirical models for solar irradiance. The investigation will evaluate the accuracy of these models in estimating solar irradiance, specifically focusing on both South Korea and Indonesia. To achieve this, the Beyer [20], Rigollier [3], Hammer [18], and Perez [1] models have been chosen to generate hourly GHI data. These models will then be validated using ground measurements obtained from the Kookmin University station in Seoul and the Research and Development Center of the National Electricity State Corporation (Puslitbang PLN) station in Jakarta. The performance of each model will be evaluated using error metrics such as RMSE, rRMSE, mean bias error (MBE), and relative mean bias error (rMBE).
2. Geostationary Imagery, Surface Monitoring, and Atmospheric Parameters
South Korea’s advancement in geostationary satellite technology began with the launch of its first meteorological satellite, COMS, in 2011, followed by the operational deployment of GK2A in 2018. Both satellites orbit at 128.2°E and are tasked with delivering continuous atmospheric and meteorological observations over a wide domain, including the Korean Peninsula, Southeast Asia, parts of China, and the Australian landmass.
These satellite platforms were developed to strengthen early-warning capabilities for hazardous weather phenomena and to support long-term environmental monitoring. COMS is outfitted with multiple sensors, including a visible channel (0.67 µm), a water vapor channel (6.7 µm), and three thermal infrared bands (3.7 µm, 10.8 µm, and 12 µm), which are used for tracking cloud systems and surface characteristics. In contrast, GK2A incorporates a more advanced payload—the Advanced Meteorological Imager (AMI)—which captures data across 16 spectral bands, allowing for detailed observation of atmospheric dynamics and climatic variability.
The GK2A’s visible channel imagery can be generated using four reflectance channels at wavelengths of 0.47 µm, 0.51 µm, 0.64 µm, and 0.86 µm. Additionally, it offers two near-infrared channels at wavelengths of 1.3 µm and 1.6 µm. The spectral spectrum ranging from 3.8 µm to 13.3 µm is divided into ten distinct infrared channels, each with core wavelengths, enabling detailed analysis of infrared radiation emitted from the Earth’s surface.
The spatial resolution of the visible channels differs between COMS and GK2A satellites. COMS produces 16-bit visible images at 15-minute intervals, with a spatial resolution of 1 × 1 km2 for the visible sensor and 4 × 4 km2 for its three infrared channels. In contrast, GK2A offers a higher spatial resolution of 0.5 × 0.5 km2 specifically for the 0.64 µm wavelength in its visible channels. For all infrared channels, including both near-infrared and shortwave infrared wavelengths, a spatial resolution of 2 × 2 km2 grid cells is utilized. The temporal resolution of GK2A shows improvement over COMS, with a scanning duration of approximately 10 minutes for complete disk images. As depicted in Figure 1, the domain of GK2A encompasses the entire geographical area of the Asia-Pacific Region. In this study, the cloud index (CI) extraction process involved selecting a pixel from each image that closely matched the ground measurement for model validation. The datasets used comprise hourly visible channel images from the COMS satellite covering the period from January 1 to December 31, 2018 (1 year), for South Korea. Meanwhile, visible images from GK2A were utilized for estimating solar irradiance over Indonesia from 1st January 2022 to December 31, 2022 (1 year).
This study involved the measurement of GHI at two ground stations situated in distinct geographical regions: the northern part of Seoul (latitude: 37.612°N, longitude: 126.996°E, altitude: 141 m) and the central region of Jakarta (latitude: 6.254°N, longitude: 106.834°E, altitude: 24 m). GHI was quantified using a pyranometer (model MS-802), while direct normal irradiance (DNI) was gauged using a pyrheliometer (model MS-57). These instruments, manufactured by the EKO company in Japan, possess a sensitivity of approximately ± 7 µVm2/W for both DNI and GHI measurements [37,38]. Ground-level data, like satellite data, were stored locally at hourly intervals, encompassing the time frames of January 1 to December 31, 2018, for South Korea, and January 1, 2022, to December 31, 2022, for Indonesia.
Before validating the model, it is crucial to ensure that the ground measurement complies with the criteria for quality data. The study employed criteria from Gueymard and Ruiz-Arias (2016) [39] to incorporate the specific parameters outlined in order to achieve the most favorable and rational value for ground measurement. It is imperative that the data undergo the following conditions:
where , , and represent the sun zenith angle, site elevation, and extraterrestrial irradiance on a normal surface, respectively. was specifically designed to exclude GHI results at low solar elevation. Once all the necessary conditions have been met, we are permitted to estimate GHI using the nearest 1 x 1 km2 pixel to the ground measurement. Subsequently, we can assess the accuracy of the model.
The atmospheric data employed by NASA are obtained from ground-based measurements obtained through the Aerosol Robotic Network (AERONET). Specifically, the open-access dataset is advantageous for numerous studies in the fields of meteorology and solar energy. The large datasets were created to aggregate atmosphere and weather datasets from diverse institutional networks located worldwide. Next, these atmospheric data are made available to the public. The AERONET sun-sky radiometer system is tasked with collecting measurements of the solar spectrum across eight distinct spectral bands, namely 340, 380, 440, 500, 675, 870, 940, and 1020 nm. These bands cover a broad range of wavelengths. It is important to acknowledge that the calibration, post-processing, and standardization procedures were required for all datasets collected by AERONET. These large datasets encompass AOD, ozone, nitrogen concentration, precipitable water , optical thickness, Angstrom wavelength exponent , Angstrom turbidity , and well pressure . The AERONET data collection consists of three primary levels: level 1, which encompasses unprocessed data; level 1.5, which includes data that has been devoid of clouds; and level 2, which corresponds to quality-controlled data. This study employed and extrapolated AERONET level 1.5 data into hourly intervals. This study utilized only the AERONET dataset, which specifically spanned a 12-month period and included measurements of GHI, COMS, and GK2A satellite images.

Table 1.
List of datasets utilized in this work.
| Source | Parameter | Status | Time acquisition |
|---|---|---|---|
| AERONET | Atmospheric parameters |
|
|
| Jakarta Station | GHI | Ground measurement | |
| Seoul Station | GHI | Ground measurement | |
| COMS and GK2A | CI | Satellite images |
3. Methodology
This study employed several well-established semi-empirical models to estimate GHI in two distinct locations: Seoul and Jakarta. The selection of models—Beyer, Rigollier, Hammer, and Perez—was based on their historical use, documented accuracy, and adaptability across geographic contexts. Initially developed using Meteosat satellite data, these models have undergone validation primarily in European environments.
The Beyer model [20] evolved from the Heliosat-1 framework and incorporates refinements such as geometric corrections, backscatter adjustments, and clear-sky irradiance calculations. It delivers hourly GHI estimates with a root mean square error (RMSE) around 120 Wh/m2, translating to a relative RMSE (rRMSE) of approximately 16%. Rigollier [3] further advanced the Heliosat-1 approach by replacing raw digital values with calibrated radiance inputs, thereby enabling a more physically grounded estimation of irradiance. For validation, the model yielded RMSEs and rRMSEs of 62 Wh/m2 (45%) in January 1995, 96 Wh/m2 (27%) in April 1995, and 103 Wh/m2 (18%) in July 1994.
Hammer’s model [18] focuses on near-term forecasting by generating motion vector fields from consecutive satellite images to simulate cloud movement. These vectors are then projected forward in time—typically up to two hours, in 30-minute intervals—enabling short-range GHI predictions. The forecast rRMSE values are reported as 35% for 1-hour and 40% for 2-hour horizons. In contrast, the Perez model [1] was originally calibrated using data from the GOES satellite system over the Americas. It was validated using ten ground stations spread across diverse climate zones, yielding RMSEs in the range of 44 to 118 W/m2 depending on location.
In this study, four semi-empirical models—Beyer, Rigollier, Hammer, and Perez—were selected to estimate GHI due to their methodological diversity, historical validation, and relevance to both temperate and tropical contexts. The Beyer model offers a simplified approach with geometric and radiative adjustments, making it a reliable baseline for GHI estimation. The Rigollier model incorporates more physically informed inputs, such as atmospheric turbidity and calibrated radiance, which can enhance accuracy under varying aerosol and humidity conditions. In contrast, the Hammer model enables short-term irradiance forecasting by simulating cloud movement, providing additional insight into temporal variability—particularly useful in dynamic tropical environments. The Perez model, validated across diverse climates using GOES satellite data, includes explicit corrections for solar geometry and air mass, offering broader adaptability. Collectively, these models cover a spectrum of complexity and data requirements, enabling a comprehensive comparison of their performance across the contrasting climates of Seoul and Jakarta.
3.1. Satellite Radiance Correction and Cloud Index Derivation
GHI from satellite data involves a multistep process that integrates geometric correction, atmospheric adjustment, and cloud classification. An overview of this workflow is depicted in Figure 2, which outlines how raw satellite imagery and auxiliary atmospheric parameters are processed through normalization and cloud index estimation to produce surface-level irradiance estimates. This schematic reflects the shared foundation of the four semi-empirical models implemented in this study, despite their differing correction methodologies.
In satellite-based solar irradiance estimation, surface reflectance recorded by visible imagery must be adjusted to account for geometric and atmospheric distortion. Raw pixel values from satellite sensors are not directly comparable due to influences such as solar position, sensor viewing angle, and scattering effects. Therefore, normalization is a foundational preprocessing step, aligning image-derived values with physically interpretable metrics.
Semi-empirical models address these challenges using correction schemes tailored to each model’s assumptions and input requirements. As summarized in Table 2, raw reflectance values are converted into normalized pixel intensities using geometric and atmospheric corrections. These corrections ensure that satellite-derived brightness values are consistent with physical radiative transfer processes under clear-sky conditions.
One critical geometric factor affecting image brightness is air mass (AM), which describes the effective atmospheric path length traversed by incoming solar radiation. When the sun is low on the horizon, sunlight passes through a longer atmospheric column, increasing scattering and absorption. The backscattering effect further complicates reflectance measurements, especially when the satellite and solar viewing angles are closely aligned, producing an apparent enhancement in surface albedo—known as the “hot-spot” effect. These distortions are most pronounced near sunrise and sunset and must be accounted for to ensure reliable irradiance estimation.
To mitigate these influences, both the Beyer and Hammer models implement correction coefficients derived from satellite zenith angle , , and backscattering angle . The extraterrestrial irradiance , adjusted by the sun–Earth distance factor , is used to scale the normalized value. These inputs correct for solar geometry and variability in Earth–Sun distance throughout the year, which affect the irradiance reaching the top of the atmosphere.
In contrast, the Rigollier model integrates radiative transfer-based corrections using the European Solar Radiation Atlas (ESRA) methodology. It introduces transmittance terms for both downward and upward atmospheric paths—denoted as and , and accounts for atmospheric turbidity through the Linke turbidity factor (TL). The model also incorporates a correction term for clear-sky diffuse irradiance and sensor-specific irradiance response , calculated by integrating the radiometer’s spectral sensitivity function over the solar spectrum. These parameters enable the model to account for aerosol content and atmospheric scattering more precisely.
The Perez model employs a distinct approach by using Sun elevation angle and AM directly in its normalization formulation. Unlike other models that emphasize geometric corrections or empirical radiative fits, Perez integrates observational statistics from multi-year satellite archives to derive dynamic normalization bounds. While this offers greater generalizability across sites, this study confines the model to a single-year dataset and does not incorporate long-term tuning of the backscatter envelope.
Once pixel normalization is completed, cloud presence is quantified through the cloud index (CI), which expresses how much a given pixel deviates from its theoretical clear-sky value. The CI is computed as a linear transformation between the minimum called and maximum normalized reflectance thresholds, representing clear-sky and fully overcast conditions, respectively:
CI values typically range from 0 (no cloud) to 1 (full cloud cover), but values may exceed this range under conditions such as cloud edge enhancement or high-albedo surfaces like snow. The accuracy of CI classification is contingent upon the robustness of the pixel normalization process. Previous studies [2,3,18,26] have established empirically derived bounds for and , depending on satellite characteristics and regional atmospheric conditions.
In summary, each semi-empirical model employs its own pixel correction scheme based on distinct assumptions: geometric adjustment (Beyer, Hammer), transmittance and turbidity fitting (Rigollier), or empirical solar geometry calibration (Perez). These corrections are necessary to ensure that cloud index values, and by extension GHI estimates, are physically meaningful and regionally transferable.
Table 2.
Pixel normalization formula for obtaining an independent cloud index (step 2). Each ‘raw’ pixel is subjected to this normalization before extracting the CI.
Table 2.
Pixel normalization formula for obtaining an independent cloud index (step 2). Each ‘raw’ pixel is subjected to this normalization before extracting the CI.
| Model | Equation | |
|---|---|---|
| Beyer | (2) | |
| (3) | ||
| Rigollier | (4) | |
| (5) | ||
| Hammer | (6) | |
| (7) | ||
| (8) | ||
| Perez | (9) |
3.2. Clear-Sky Irradiance and Turbidity Factor
An essential aspect of semi-empirical models is the determination of the maximum level of solar irradiance, known as the clear-sky irradiance . The reduction in solar irradiance under clear skies is dependent on the abundance of absorbers and scatterers in the atmosphere, such as aerosols, gases, and water vapor. The primary emphasis of most clear-sky models lies in the mitigation of solar radiation caused by atmospheric components and the geometric alignment of the sun. The clear-sky irradiance model is less complex than the semi-empirical approach because it accounts for the rapid changes in aerosols, water vapor, and other molecules. A well-known turbidity index, known as Linke Turbidity , can be derived by combining various atmospheric variables [40,41,42]. The investigation of GHI in this study utilized established clear-sky irradiance models, as outlined in Table 3.
This study explores the application of four semi-empirical models, each model employing unique procedures for calculating GHIC. The Beyer model employs a straightforward clear-sky model based on geometric calculations. Specifically, the model utilized here, known as the Bourges clear-sky formula, exclusively uses the parameter to represent the reduction in extraterrestrial solar irradiance as it traverses through the Earth’s atmosphere. Derived from an empirical correlation between ground measurements, sun position, and site location, this model provides a simplified portrayal of clear-sky conditions.
Conversely, the Rigollier model, also referred to as the ESRA model, divides clear-sky irradiance into direct and diffuse components, incorporating and the Rayleigh scattering factor . The clear-sky irradiance formula of the Hammer model closely resembles that of the Rigollier model. While both models share identical formulations for clear-sky Direct Normal Irradiance (DNIC) equations, it’s noteworthy that the equations for clear-sky Diffuse Horizontal Irradiance (DHIC) differ between them.
The Linke turbidity is a crucial parameter in clear-sky modeling, capturing atmospheric conditions’ impact. serves as a vital measure for quantifying atmospheric attenuation due to absorption and scattering. TL can be evaluated using either a direct or indirect formula [43]. The direct formula, also known as the pyrheliometric formula, typically incorporates measurements of DNI, optical air mass (AM), and the . Conversely, the indirect, or parameterized formula, integrates atmospheric constituents such as AM, , angstrom turbidity factor , and Aerosol Optical Depth (AOD). Following extensive testing of various TL formulas, the model proposed by Remund et al. [44], particularly Equation (10), was identified as the most suitable and was thus employed for this study:
Table 3.
Clear-sky irradiance formulas based on semi-empirical model.
| Model | Equation | |
|---|---|---|
| Beyer | (11) | |
| Rigollier | (12) | |
| (13) | ||
| (14) | ||
| (15) | ||
| (16) | ||
| (17) | ||
| (18) | ||
| (19) | ||
| Hammer | (20) | |
| (21) | ||
| (22) | ||
| Perez | (23) | |
| (24) | ||
| (25) | ||
| (26) | ||
| (27) |
3.3. GHI Conversion and Error Metrics Formulation
After CI and GHIC are given, GHI is performed from GHIC by appropriately reducing according to CI. The reduction factor is called the clear sky index , and is expressed as a correlation function. Finally, the conversion equations were summarized in Table 4.
To evaluate the difference between projected values and observed measurements, it is imperative to establish metrics that measure accuracy. The metric known as the root mean square error (RMSE) can be employed to evaluate the degree of dispersion in forecasts compared to the actual measurements. The mean bias error (MBE) is commonly utilized as a method for evaluating whether a model demonstrates positive bias (overestimation) or negative bias (underestimation) in relation to a long-term average. When the values of RMSE, rRMSE, MBE, and rMBE approach zero, an estimation model is considered to be of high quality.
4. Results
The input parameters for all semi-empirical models in estimating solar irradiance over Jakarta and Seoul are represented in Table 5. Among the models, the Beyer model stands out for its simplicity and minimal reliance on the TL factor in atmospheric conditions. However, when assessing versatility and comprehensiveness, the Rigollier and Hammer models emerge as the preferred choices. These models allow for the simultaneous calculation of three components: GHI, DNI, and DHI under clear sky conditions. Notably, these findings have been validated across significant regions of Europe and Africa, which include regions with a similar climate to Korea. However, Rigollier and Hammer models were rare in tropical areas, and even fewer were in Indonesia. With its array of input variables, the Perez model appears promising for potential implementation in both South Korea and Indonesia. It’s worth mentioning that the Perez model incorporates an implicit variable, , which, according to Perez et al. [45], undergoes dynamic changes instead of remaining constant throughout the year. Consequently, the process of choosing can be considered an independent variable.
Figure 3 and Figure 4 display the graphical depiction of the variations in GHIC as a function of Sun elevation in both locations, Seoul and Jakarta. In general, it is evident that all of the models displayed similar trends, as the levels of GHIC demonstrated a positive correlation with Sun elevation . Nevertheless, each model yielded different dispersions due to their underlying formulas. The Beyer model does not include atmospheric conditions in the TL, as previously stated. The Beyer model results showed the lowest magnitude of dispersion compared to the other models. The Rigollier and Hammer models displayed a similar pattern, with the Hammer model showing slightly higher levels of dispersion. On the contrary, a significant level of dispersion was observed in both the Perez and the remaining three groups. It is important to acknowledge that the existence of either a minor or significant dispersion does not necessarily imply that the GHIC exhibits a noteworthy degree of precision. Nevertheless, it is clear that TL has a significant impact on both of these models. The models displayed variability in the upper and lower limits of GHIC values. For instance, the Beyer model yielded the smallest values in two locations. In Seoul Station, it showed GHIC between 70.22 W/m2 and 859.54 W/m2. Meanwhile, Jakarta stations present GHIC around 131.43 W/m2 and 997.54 W/m2. The Hammer model produced a broader range of values, 50.78–1092.52 W/m2 and 116.63–1032.90 W/m2 for Seoul and Jakarta, respectively. On the other hand, the Perez model can estimate GHIC between 5.86–998.23 W/m2 and 48.56–1048.80 W/m2 over Seoul and Jakarta, respectively. The Rigollier model demonstrated the most elevated GHIC values, which varied between 108.65 W/m2 and 1055 W/m2.
The normalization of pixels is a critical step in the computation of CI, as it allows for the consideration of backscatter and air mass effects, which often introduce bias in images. Hence, the procedure of normalization facilitates the precise assessment of the true luminosity of the Earth’s surface. The digital numerical range for COMS and GK2A pixels, respectively, spans from 0 to 1024 and 0 to 16000. Figure 5 and Figure 6 present scatterplots that visually represent the pixel values after the normalization process has been applied to each model. The expectation was that the normalized pixels would demonstrate a uniform dynamic range that includes both the upper and lower limits. In all of the models that were analyzed, the lower boundary demonstrated a relatively uniform pattern, except for cases where the backscatter angles were low. To provide further clarification, it is observed that as the backscatter angle approaches 0°, which signifies the satellite’s close proximity to the sun, there is a propensity for the lower boundary to display a marginal augmentation. The minimum value indicates that there has been no significant alteration in the Earth’s surface albedo. It was also expected that the upper limits, which are indicative of overcast weather conditions, would remain constant. The upper boundaries displayed a higher degree of variability in magnitude when compared to the lower boundaries. Moreover, there were occurrences of notably elevated values, encompassing a small number of outliers that surpassed the upper limit. Consequently, the process of establishing the upper limits is marked by heightened levels of uncertainty, resulting in a reduction in the precision of GHI estimation under overcast circumstances. The Beyer model exhibited notable disparities in both the interquartile range and the maximum value, distinguishing it from the other three models. The determination of the CI was derived from the range of the normalized pixel counts, as illustrated in Figure 4. The calculation was performed using Equation (1). Thus, the term “CI” refers to a measure of attenuation that is calculated based on the clear-sky global horizontal irradiance (GHIC).
The term “accuracy for all sky conditions” means the overall performance observed across the period 2018 and 2022 in Seoul and Jakarta, respectively. The models generated varied results, with none exceeding 62.93% for rRMSE and 14.88% for rMBE, as illustrated in Figure 7 and Figure 8 and summarized in Table 6 and Table 7.
The Hammer model demonstrated superior performance in Seoul compared to the other three semi-empirical models, achieving the highest agreement in terms of RMSE and MBE calculations, with values of 103.92 W/m2 and 0.09 W/m2, respectively. Although the Hammer model demonstrated superior performance in Seoul, the disparities in accuracy among the Hammer, Perez, and Beyer models were statistically insignificant. The difference in rRMSE between the Hammer and Perez models was a mere 2.1%, while the difference between the Hammer and Beyers models was a mere 2.64%. On the other hand, the Rigollier model demonstrated the highest level of error, as evidenced by an MBE value of −36.84 W/m2.
The study results indicated that the Perez model exhibited superior performance compared to the other three semi-empirical models in Jakarta. This was evident in the Perez model’s ability to achieve the highest level of agreement in terms of RMSE and MBE, with values of 212.08 W/m2 and 16.46 W/m2, respectively. Despite the Perez model’s superior performance, the differences in accuracy between the Rigollier, Hammer, and Beyer models were minimal. The variation in rRMSE between the Perez and Hammer models was a mere 3.24%, while the difference between the Perez and Beyer models was modest at 4.24%. In contrast, the Rigollier model demonstrated the highest level of error, with an MBE value of 53.77 W/m2.
When comparing GHI in Jakarta station to the Seoul location, there is a discernible discrepancy in the accuracy of semi-empirical models; the accuracy of these models is lower in Indonesia. There are several possible explanations for this disparity. First, the Beyer, Hammer, Perez, and Rigollier models were initially developed for climates in Europe and America. Because of this, the coefficients and linear regressions that are built into these models are largely consistent with areas that are like Europe and the USA, which is very different from Indonesia’s tropical climate. Second, a major factor affecting model accuracy is the geographical separation between the Jakarta Station and the AERONET station. The AERONET datasets may not accurately depict the ground-based global horizontal irradiance conditions at the Seoul Station, even though both stations are in Jakarta. Notably, there are significant differences in cloudiness, pollution, atmospheric density, and radiation between the AERONET station, which is close to the beach, and the Jakarta station, which is located in an urban area. These variations result in a decreased degree of accuracy. But instead of seeing these difficulties as failures, this work opens a range of possibilities for future research directions. Three interesting avenues for further research are identified.
5. Discussion
First and foremost, it is imperative to create a specific semi-empirical model for tropical areas. To ensure a more accurate representation of solar irradiance in these regions, the formulation of such a model should take into account the distinct climatic characteristics of Southeast Asia and Indonesia. In addition to modifying current models, this strategy investigates cutting-edge techniques that take into account the complex interactions between elements unique to tropical climates.
A second alternative is to strategically install a network of GHI and atmospheric measurement instruments throughout different parts of Indonesia. This wide-ranging network not only makes it easier to improve the accuracy of the model, but it also provides strong validation because it takes into consideration the various atmospheric conditions found in various parts of the nation. The creation of a network of such measurement sites can provide useful information for enhancing and verifying solar irradiance models, thus enhancing their capacity for prediction.
Thirdly, investigating cutting-edge machine learning methods is a viable option given the dynamic nature of atmospheric conditions and their influence on solar irradiance. Models that incorporate machine learning algorithms may be able to self-adjust in response to real-time atmospheric data, offering a more dynamic and responsive method of predicting solar irradiance. This methodology is in line with the growing body of research on data-driven approaches and creates new opportunities to improve forecasting accuracy for solar irradiance. Together, these three approaches essentially seek to tackle the complexities involved in modeling solar irradiance in Indonesia, making sure that future models are validated, adaptive, and robust to changing atmospheric conditions, in addition to being region-specific.
To complement the statistical evaluation of model accuracy, Figure 9 presents the spatial distribution of estimated GHI across South Korea and Indonesia during August 2022. This map was generated using the best-performing semi-empirical models identified for each region (Hammer for Seoul and Perez for Jakarta) applied to satellite imagery. August was selected as it represents a typical high-radiation month in both hemispheres, thereby illustrating the model’s ability to capture solar energy potential under favorable sky conditions.
The GHI map highlights notable spatial variability across both countries. In South Korea, irradiance levels generally range between 500–700 W/m2, with coastal and southern regions receiving higher solar input. Conversely, in Indonesia, particularly across West Java, spatial variability is more pronounced, with irradiance exceeding 800 W/m2 in many inland regions. These spatial patterns are influenced by cloud dynamics, elevation, aerosol concentrations, and land cover differences. The inclusion of this spatial product not only reinforces the model’s applicability but also underscores the necessity for high-resolution solar mapping in future infrastructure and grid integration planning.
6. Conclusions
This study conducted a comparative evaluation of four semi-empirical models—Perez, Hammer, Beyer, and Rigollier—for estimating Global Horizontal Irradiance (GHI), utilizing geostationary satellite data from COMS (2018) and GK2A (2022). The assessment was performed in two contrasting climatic zones: the tropical urban area of Jakarta and the temperate metropolitan region of Seoul. Across both locations, the models generally exhibited a tendency to overestimate GHI, particularly in Jakarta, where the Maximum Bias Error (MBE) remained below 53.77 W/m2. Among the models tested, the Beyer model demonstrated the highest Root Mean Square Error (RMSE) in Jakarta, indicating relatively poor performance under humid tropical atmospheric conditions. In contrast, the Rigollier model yielded the lowest predictive accuracy in Seoul, with RMSE values reaching a minimum of 35.09 W/m2.
Based on the error metrics used—namely RMSE, relative RMSE (rRMSE), MBE, and relative MBE (rMBE)—the Perez model emerged as the most reliable for temperate climates such as Seoul, whereas the Hammer model showed relatively better performance in Jakarta, suggesting its adaptability to tropical environments. These findings point to the geographically contingent performance of semi-empirical models, which are often calibrated using datasets and atmospheric assumptions derived from European or North American contexts.
Importantly, the study underscores the limitations of transferring models across climatic zones without proper revalidation or recalibration. The disparity in model performance between Jakarta and Seoul is a direct reflection of differences in cloud dynamics, humidity levels, aerosol concentration, and seasonal solar geometry. Consequently, there is an urgent need to develop or adapt semi-empirical models specifically tailored for tropical climates, where conventional models may fail to capture the high variability and convective cloud cover typical of equatorial regions.
To address these limitations, future research should prioritize the establishment and expansion of ground-based solar monitoring networks across Indonesia to support more robust validation efforts. Furthermore, integrating data-driven approaches—particularly machine learning algorithms—could enhance prediction accuracy by dynamically learning complex atmospheric interactions that static models may overlook. In the long term, a hybrid framework that combines semi-empirical modeling with machine learning optimization may offer a scalable solution for real-time solar forecasting in tropical environments, ultimately supporting the deployment of solar energy infrastructure under Indonesia’s diverse climatic conditions.
Author Contributions
P.M.P.G: Conceptualization, Formal Analysis, Investigation, Methodology, Project Administration, Resources, Software, Supervision, Validation, Visualization, Writing—Original Draft, and Editing. R.O.A: Data Curation, Formal Analysis, Investigation, Methodology, Software, Visualization, and Draft Writing. H.L: Conceptualization, Software, and Validation. I.A.A: Data Curation, Formal Analysis, Investigation, and Methodology. R.D.D: Writing—Review & Editing, Validation, Visualization, and Supervision. I.S.S: Writing—Review & Editing, and Validation. R: Data Curation, Formal Analysis, and Validation. I.G: Conceptualization, Supervision, Draft Writing—Review & Editing. J.T.S.S: Conceptualization, Validation, Writing—Review & Editing. M.D: Conceptualization, Funding Acquisition, Resources, Investigation, Methodology, Writing—Review & Editing, Visualization, and Supervision.
Funding
This research is supported by funds from HIBAH PUTI Q1 2024-2025 of DRPM UI University of Indonesia (NKB-420/UN2.RST/HKP.05.00/2024) and the National Research Foundation of Korea (NRF), Ministry of Science and ICT (2023R1A2C1004663).
Data Availability Statement
The data and other research materials that support the findings of this research are obtained from the internal repositories of the Department of Geography, Faculty of Mathematics and Natural Sciences, Universitas Indonesia, the Indonesian Agency for Meteorology, Climatology, and Geophysics (BMKG), and Department of Mechanical Engineering, Kookmin University, Seoul, Korea. The data are available to the public on request.
Acknowledgments
This research has been supported by HIBAH PUTI Q1 2024-2025 of DRPM UI University of Indonesia (NKB-420/UN2.RST/HKP.05.00/2024) and the National Research Foundation of Korea (NRF), Ministry of Science and ICT (2023R1A2C1004663). The authors also thank: (1) the Department of Geography, Faculty of Mathematics and Natural Sciences, Universitas Indonesia; (2) the Indonesian Agency for Meteorology, Climatology, and Geophysics (BMKG); (3) the Department of Mechanical Engineering, Kookmin University, Seoul, Korea, for providing data from the study’s inception to its conclusion; and (4) the editor and reviewers for their constructive feedback.
Conflicts of Interest
The authors declare no conflicts of interest.
Abbreviations
The following abbreviations are used in this manuscript:
| AERONET | Aerosol Robotic Networks |
| CI | Cloud index |
| COMS | Communication Ocean and Meteorological Satellite |
| DHI | All-sky diffuse horizontal irradiance, (W/m2) |
| DHIC | Clear-sky diffuse horizontal irradiance, (W/m2) |
| DNI | All-sky direct normal irradiance, (W/m2) |
| DNIC | Clear-sky direct normal irradiance, (W/m2) |
| GHI | All-sky global horizontal irradiance, (W/m2) |
| GHIC | Clear-sky global horizontal irradiance, (W/m2) |
| KMA | Korean Meteorological Administration |
| MBE | Mean bias error, (W/m2) |
| NASA | National Aeronautics and Space Administration |
| NMSC | National Meteorological Satellite Center |
| RMSE | Root mean square error, (W/m2) |
| rRMSE | Relative root mean square error, (W/m2) |
| rMBE | Relative mean bias error, % |
References
- P. Ineichen and R. Perez, “Derivation of cloud index from geostationary satellites and application to the production of solar irradiance and daylight illuminance data,” Theor. Appl. Climatol., vol. 64, no. 1–2, pp. 119–130, 1999. [CrossRef]
- R. Perez, P. Ineichen, K. Moore, M. Kmiecik, C. Chain, R. George, and F. Vignola, “A new operational model for satellite-derived irradiances: Description and validation,” Sol. Energy, vol. 73, no. 5, pp. 307–317, 2002. [CrossRef]
- C. Rigollier, M. Lefèvre, and L. Wald, “The method Heliosat-2 for deriving shortwave solar radiation from satellite images,” Sol. Energy, vol. 77, no. 2, pp. 159–169, 2004. [CrossRef]
- D. Yang, W. Wang, C. A. Gueymard, T. Hong, J. Kleissl, J. Huang, M. J. Perez, R. Perez, J. M. Bright, X. Xia, D. van der Meer, and I. M. Peters, “A review of solar forecasting, its dependence on atmospheric sciences and implications for grid integration: Towards carbon neutrality,” Renew. Sustain. Energy Rev., vol. 161, no. October 2021, p. 112348, 2022. [CrossRef]
- A. F. Madsuha, E. A. Setiawan, N. Wibowo, M. Habiburrahman, R. Nurcahyo, and S. Sumaedi, “Mapping 30 years of sustainability of solar energy research in developing countries: Indonesia case,” Sustain., vol. 13, no. 20, 2021. [CrossRef]
- S. F. Kennedy, “Indonesia’s energy transition and its contradictions: Emerging geographies of energy and finance,” Energy Res. Soc. Sci., vol. 41, no. April, pp. 230–237, 2018. [CrossRef]
- A. Zelenka, R. Perez, R. Seals, D. Renné, and D. Renne, “Effective accuracy of satellite-derived hourly irradiances,” Theor. Appl. Climatol., vol. 62, no. 3–4, pp. 199–207, 1999. [CrossRef]
- D. Mouhamet, A. Tommy, A. Primerose, and L. Laurent, “Improving the Heliosat-2 method for surface solar irradiation estimation under cloudy sky areas,” Sol. Energy, vol. 169, no. May, pp. 565–576, Jul. 2018. [CrossRef]
- R. Benbba, M. Barhdadi, A. Ficarella, G. Manente, M. P. Romano, N. El Hachemi, A. Barhdadi, A. Al-Salaymeh, and A. Outzourhit, “Solar Energy Resource and Power Generation in Morocco: Current Situation, Potential, and Future Perspective,” Resources, vol. 13, no. 10, pp. 1–38, 2024. [CrossRef]
- G. M. Yagli, D. Yang, O. Gandhi, and D. Srinivasan, “Can we justify producing univariate machine-learning forecasts with satellite-derived solar irradiance?,” Appl. Energy, vol. 259, no. October 2019, p. 114122, Feb. 2020. [CrossRef]
- M. Ŝúri and J. Hofierka, “A new GIS-based solar radiation model and its application to photovoltaic assessments,” Trans. GIS, vol. 8, no. 2, pp. 175–190, 2004. [CrossRef]
- National Renewable Energy Laboratory, “National Solar Radiation Database 1991 – 2005 Update: User’s Manual,” Task No. PVA7.6102, no. April, 2007. [CrossRef]
- J. Duan, H. Zuo, Y. Bai, M. Chang, X. Chen, W. Wang, L. Ma, and B. Chen, “A multistep short-term solar radiation forecasting model using fully convolutional neural networks and chaotic aquila optimization combining WRF-Solar model results,” Energy, vol. 271, no. February, 2023. [CrossRef]
- S. Chen, C. Li, Y. Xie, and M. Li, “Global and direct solar irradiance estimation using deep learning and selected spectral satellite images,” Appl. Energy, vol. 352, no. September 2022, 2023. [CrossRef]
- P. M. P. Garniwa, R. A. Rajagukguk, R. Kamil, and H. J. Lee, “Intraday forecast of global horizontal irradiance using optical flow method and long short-term memory model,” Sol. Energy, vol. 252, no. February, pp. 234–251, 2023. [CrossRef]
- J. Kleissl, Solar energy forecasting and resource assessment. Academic Press, 2013. [CrossRef]
- S. Chen, Z. Liang, S. Guo, and M. Li, “Estimation of high-resolution solar irradiance data using optimized semi-empirical satellite method and GOES-16 imagery,” Sol. Energy, vol. 241, no. June, pp. 404–415, 2022. [CrossRef]
- A. Hammer, D. Heinemann, C. Hoyer, R. Kuhlemann, E. Lorenz, R. Müller, and H. G. Beyer, “Solar energy assessment using remote sensing technologies,” Remote Sens. Environ., vol. 86, no. 3, pp. 423–432, Aug. 2003. [CrossRef]
- D. Cano, J. M. Monget, M. Albuisson, H. Guillard, N. Regas, and L. Wald, “A method for the determination of the global solar radiation from meteorological satellite data,” Sol. Energy, vol. 37, pp. 31–39, 1986. [CrossRef]
- H. G. Beyer, C. Costanzo, and D. Heinemann, “Modifications of the heliosat procedure for irradiance estimates from satellite images,” Sol. Energy, vol. 56, no. 3, pp. 207–212, 1996. [CrossRef]
- I. Moradi, R. Mueller, B. Alijani, and G. A. Kamali, “Evaluation of the Heliosat-II method using daily irradiation data for four stations in Iran,” Sol. Energy, vol. 83, no. 2, pp. 150–156, Feb. 2009. [CrossRef]
- Y. Eissa, M. Chiesa, and H. Ghedira, “Assessment and recalibration of the Heliosat-2 method in global horizontal irradiance modeling over the desert environment of the UAE,” Sol. Energy, vol. 86, no. 6, pp. 1816–1825, Jun. 2012. [CrossRef]
- A. Meflah, F. Chekired, N. Drir, and L. Canale, “Accurate Method for Solar Power Generation Estimation for Different PV (Photovoltaic Panels) Technologies,” Resources, vol. 13, no. 12, 2024. [CrossRef]
- P. M. P. Garniwa, R. A. A. Ramadhan, and H. J. Lee, “Application of semi-empirical models based on satellite images for estimating solar irradiance in Korea,” Appl. Sci., vol. 11, no. 8, p. 3445, Apr. 2021. [CrossRef]
- R. Kamil, P. M. Garniwa, and H. J. Lee, “Performance assessment of global horizontal irradiance models in all-sky conditions,” Energies, vol. 14, no. 23, p. 7939, Dec. 2021. [CrossRef]
- H. G. Beyerp, C. Costanzo, D. Heinemann, H. G. Beyer, C. Costanzo, and D. Heinemann, “Modifications of the Heliosat procedure for irradiance estimates from satellite images,” Sol. Energy, vol. 56, no. 3, pp. 207–212, 1996. [CrossRef]
- C. W. Seok, S. A. Ram, and K. Yong, “Solar irradiance estimation in Korea by using modified heliosat-II method and COMS-MI imagery,” J. Korean Soc. Surv. Geod. Photogramm. Cartogr., vol. 33, no. 5, pp. 463–472, Oct. 2015. [CrossRef]
- I. S. Zo, J. B. Jee, K. T. Lee, and B. Y. Kim, “Analysis of solar radiation on the surface estimated from GWNU solar radiation model with temporal resolution of satellite cloud fraction,” Asia-Pacific J. Atmos. Sci., vol. 52, no. 4, pp. 405–412, Aug. 2016. [CrossRef]
- C. K. Kim, H. G. Kim, Y. H. Kang, and C. Y. Yun, “Toward Improved Solar Irradiance Forecasts: Comparison of the Global Horizontal Irradiances Derived from the COMS Satellite Imagery Over the Korean Peninsula,” Pure Appl. Geophys., vol. 174, no. 7, pp. 2773–2792, Jul. 2017. [CrossRef]
- M. Oh, C. K. Kim, B. Kim, C. Yun, Y. H. Kang, and H. G. Kim, “Spatiotemporal optimization for short-term solar forecasting based on satellite imagery,” Energies, vol. 14, no. 8, p. 2216, Apr. 2021. [CrossRef]
- S. Janjai, P. Pankaew, and J. Laksanaboonsong, “A model for calculating hourly global solar radiation from satellite data in the tropics,” Appl. Energy, vol. 86, no. 9, pp. 1450–1457, 2009. [CrossRef]
- S. Janjai, K. Sricharoen, and S. Pattarapanitchai, “Semi-empirical models for the estimation of clear sky solar global and direct normal irradiances in the tropics,” Appl. Energy, vol. 88, no. 12, pp. 4749–4755, 2011. [CrossRef]
- S. Janjai, I. Masiri, and J. Laksanaboonsong, “Satellite-derived solar resource maps for Myanmar,” Renew. Energy, vol. 53, pp. 132–140, May 2013. [CrossRef]
- S. Janjai, “A method for estimating direct normal solar irradiation from satellite data for a tropical environment,” Sol. Energy, vol. 84, no. 9, pp. 1685–1695, 2010. [CrossRef]
- D. Charuchittipan, P. Choosri, S. Janjai, S. Buntoung, M. Nunez, and W. Thongrasmee, “A semi-empirical model for estimating diffuse solar near infrared radiation in Thailand using ground- and satellite-based data for mapping applications,” Renew. Energy, vol. 117, pp. 175–183, 2018. [CrossRef]
- Y. Sianturi, Marjuki, and K. Sartika, “Evaluation of ERA5 and MERRA2 reanalyses to estimate solar irradiance using ground observations over Indonesia region,” AIP Conf. Proc., vol. 2223, 2020. [CrossRef]
- EKO Instrument CO LTD, MS-802 Instruction Manual Pyranometer Ver. 3, Version 3. Tokyo, 2019.
- EKO Instrument CO LTD, MS-57 Instruction Manual Pyrheliometer Ver. 3, Version 3. Tokyo, 2019.
- C. A. Gueymard and J. A. Ruiz-Arias, “Extensive worldwide validation and climate sensitivity analysis of direct irradiance predictions from 1-min global irradiance,” Sol. Energy, vol. 128, pp. 1–30, Apr. 2016. [CrossRef]
- Y. A. Eltbaakh, M. H. Ruslan, M. A. Alghoul, M. Y. Othman, K. Sopian, and T. M. Razykov, “Solar attenuation by aerosols: An overview,” Renew. Sustain. Energy Rev., vol. 16, no. 6, pp. 4264–4276, 2012. [CrossRef]
- A. Song, K. Choi, M. Jung, and Y. Kim, “Estimation of the Linke turbidity factor and the solar irradiance under a clear sky over the Korean Peninsula using COMS MI,” New Renew. Energy, vol. 12, no. S2, p. 21, Oct. 2016. [CrossRef]
- Y. Marif, D. Bechki, M. Zerrouki, M. M. Belhadj, H. Bouguettaia, and H. Benmoussa, “Estimation of atmospheric turbidity over Adrar city in Algeria,” J. King Saud Univ., vol. 31, no. 2, pp. 143–149, Apr. 2019. [CrossRef]
- P. M. P. Garniwa and H. Lee, “Intercomparison of the parameterized Linke turbidity factor in deriving global horizontal irradiance,” Renew. Energy, vol. 212, no. December 2022, pp. 285–298, 2023. [CrossRef]
- J. Remund, L. Wald, M. Lefèvre, T. Ranchin, and J. Page, “Worldwide Linke turbidity information,” ISES Sol. World Congr. 2003, vol. 400, pp. 13-p, 2003. [CrossRef]
- N. Hanrieder, M. Sengupta, Y. Xie, S. Wilbert, and R. Pitz-Paal, “Modeling beam attenuation in solar tower plants using common DNI measurements,” Sol. Energy, vol. 129, pp. 244–255, 2016. [CrossRef]
Figure 1.
Sample of visible satellite images (0.64 µm) are one of the channels provided by the GK2A satellite, which is stationed at 36,000 km above the equator. The image is considered as Level-1B full-disk data.
Figure 1.
Sample of visible satellite images (0.64 µm) are one of the channels provided by the GK2A satellite, which is stationed at 36,000 km above the equator. The image is considered as Level-1B full-disk data.
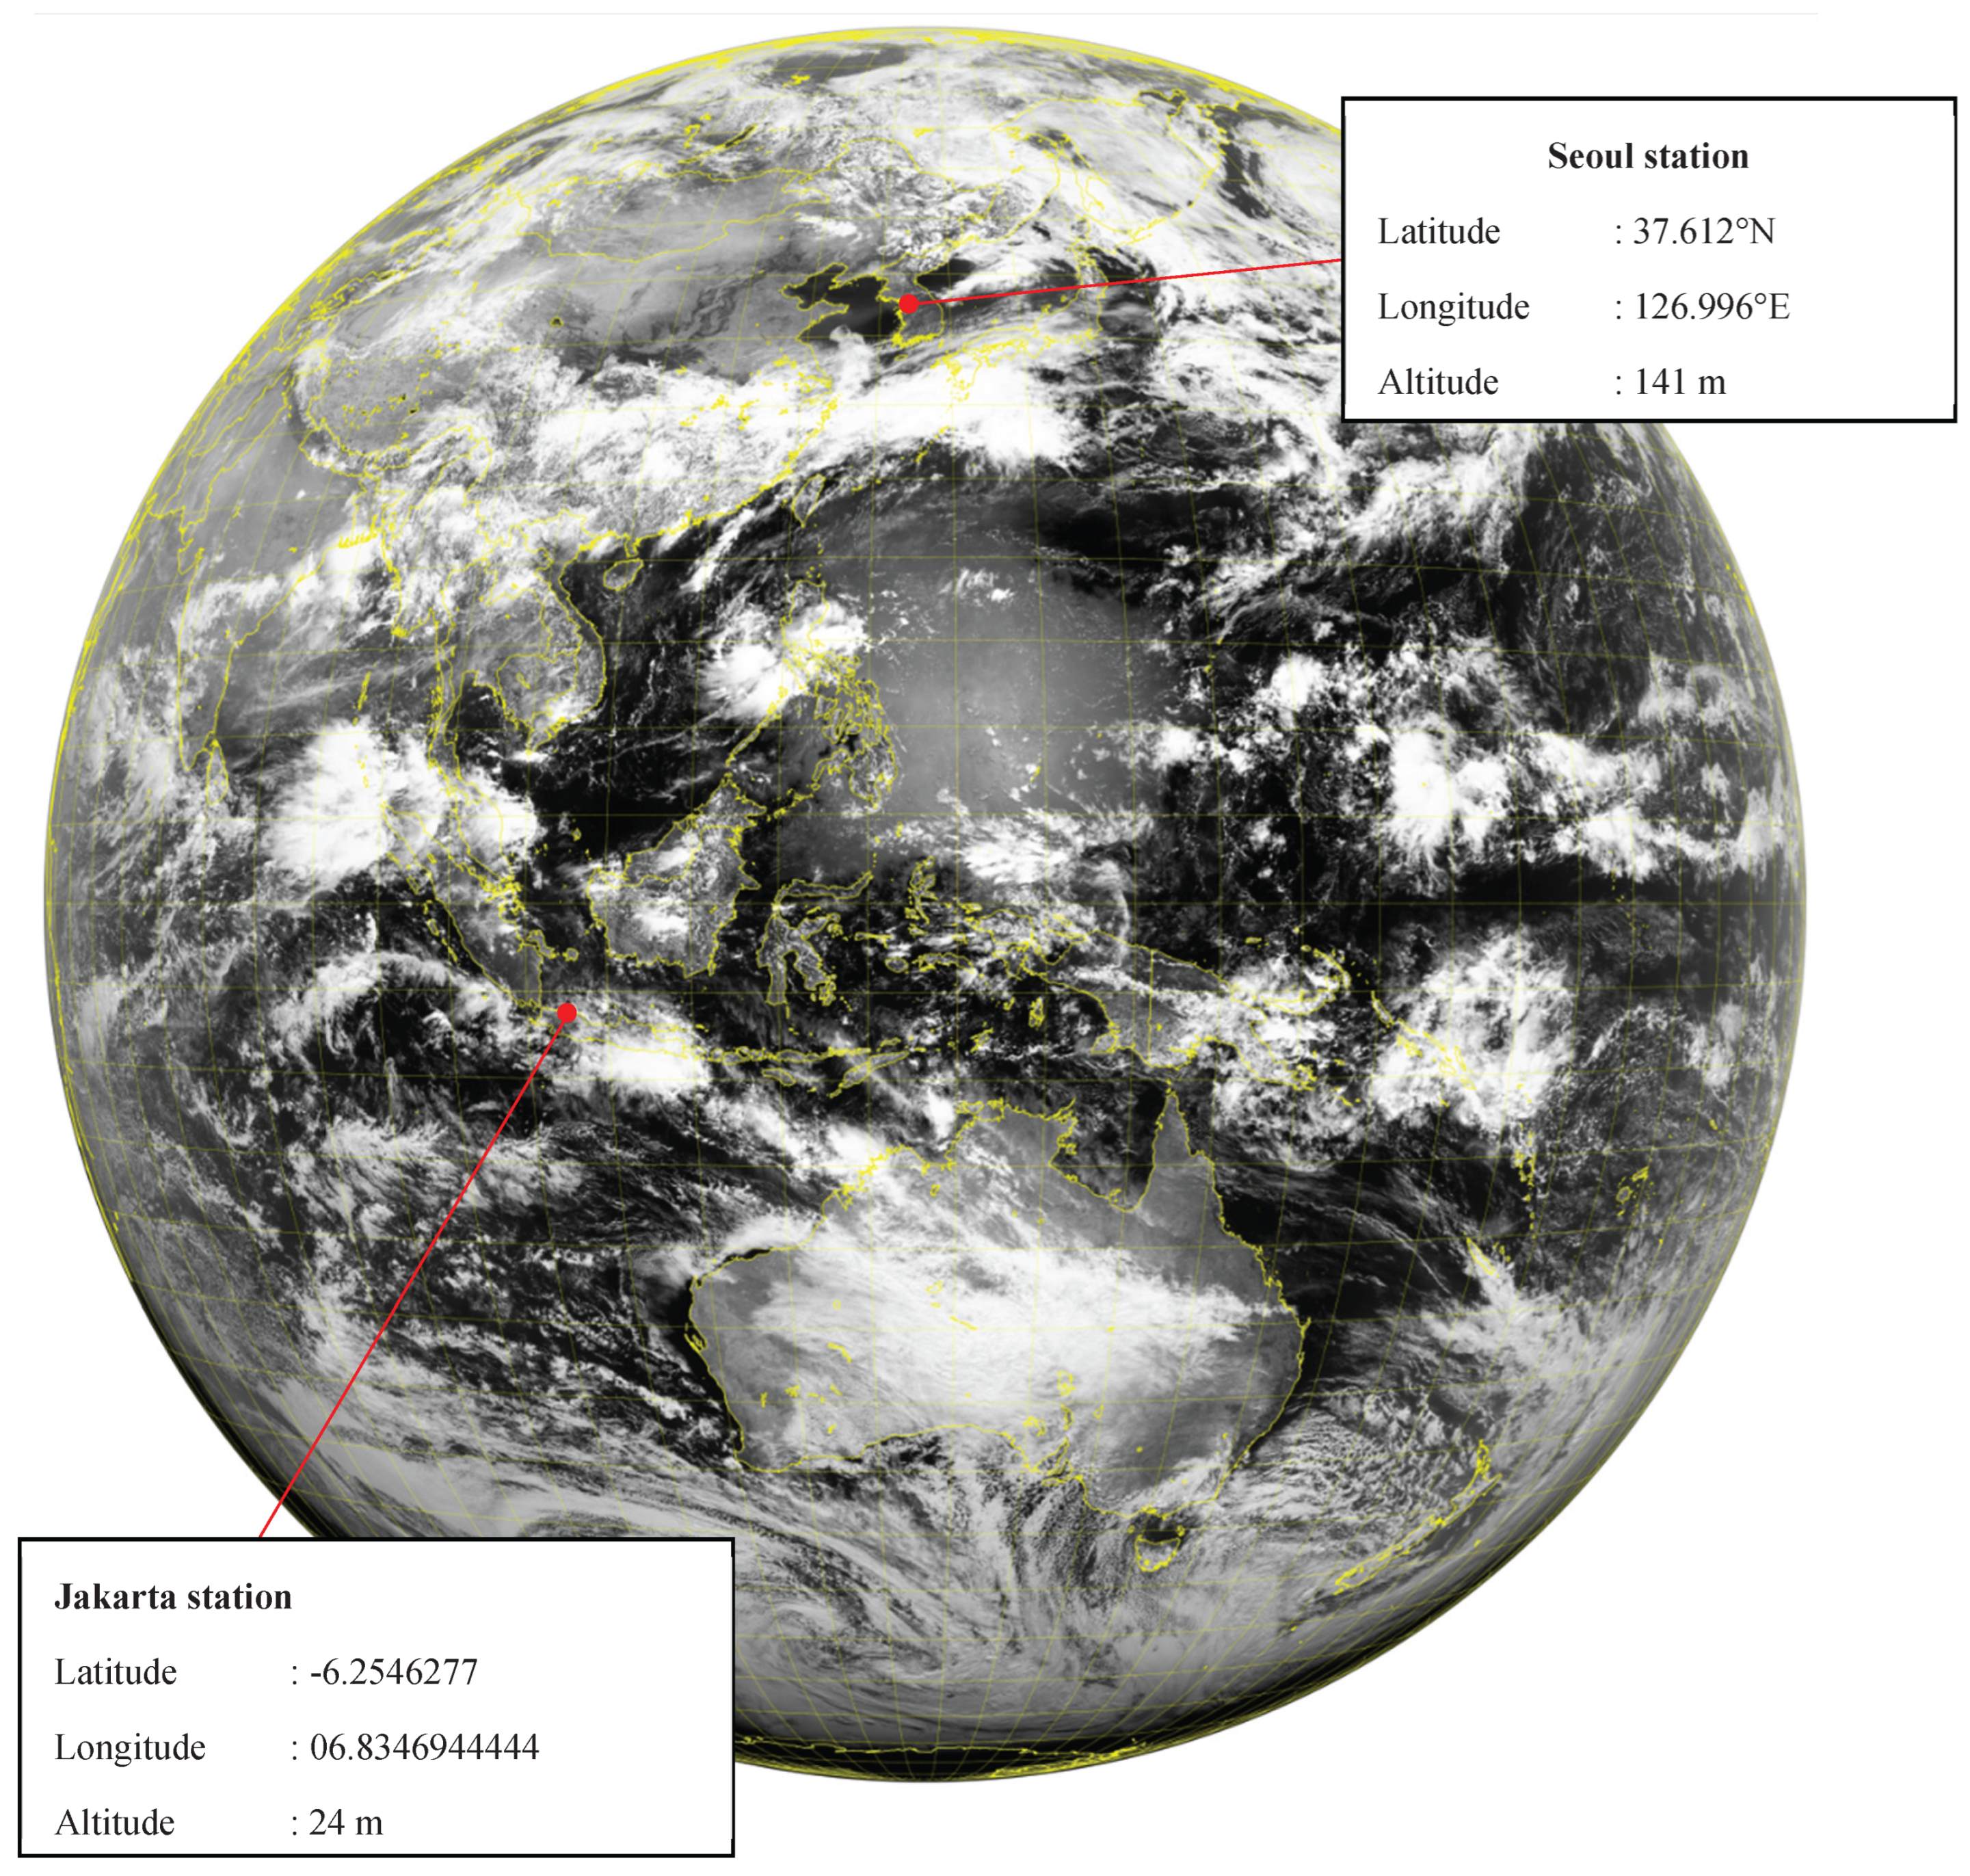
Figure 2.
Procedure to derive solar irradiance from GK2A satellite images.
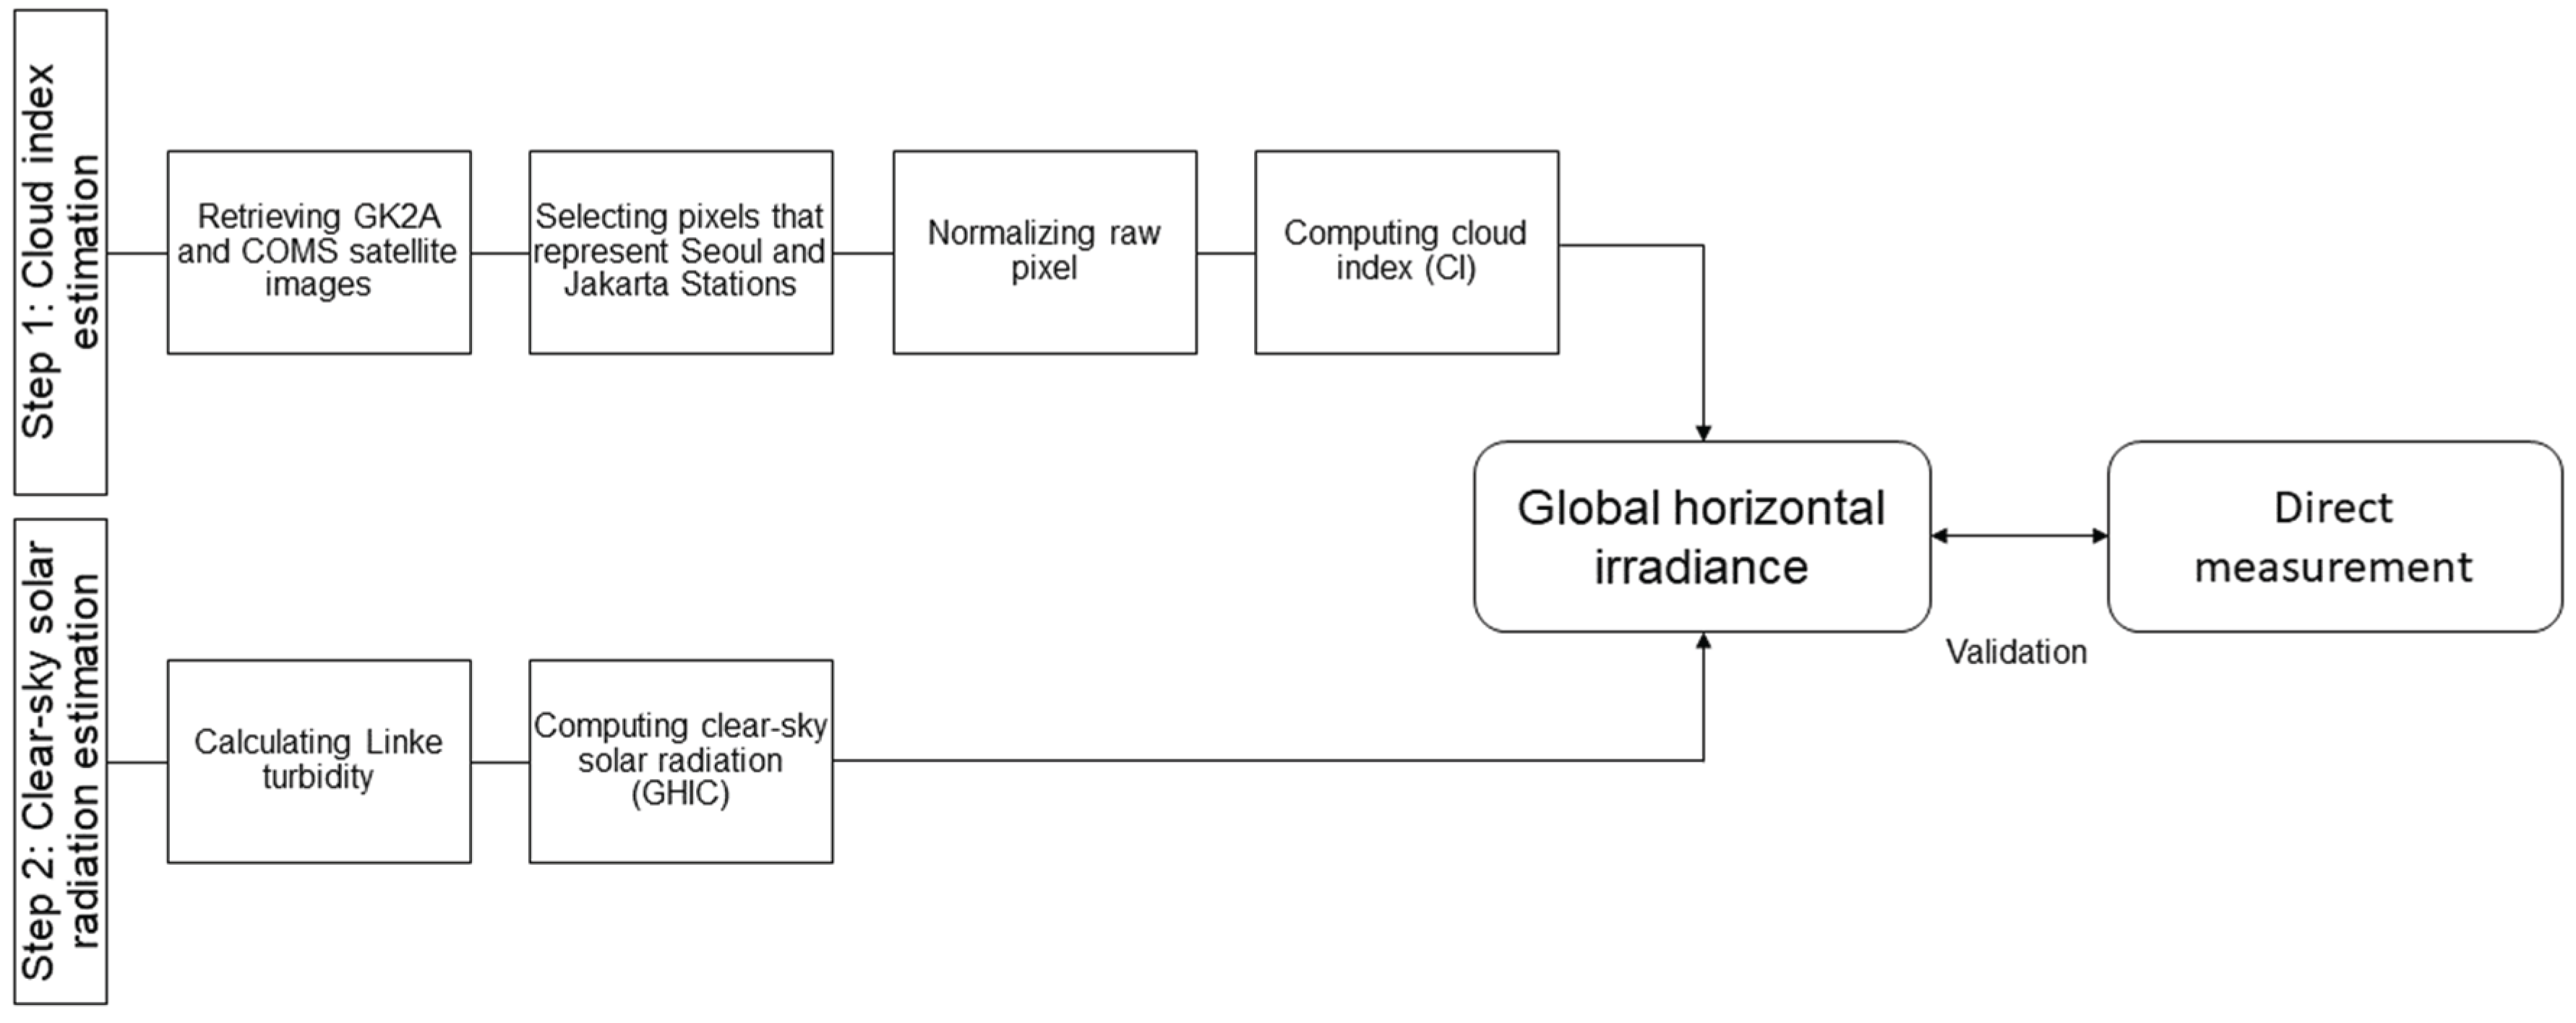
Figure 3.
Clear-sky irradiance against the sun elevation angle; A, B, C, and D are the Beyer, Hammer, Perez, and Rigollier models to estimate clear-sky solar irradiance at Seoul, South Korea.
Figure 3.
Clear-sky irradiance against the sun elevation angle; A, B, C, and D are the Beyer, Hammer, Perez, and Rigollier models to estimate clear-sky solar irradiance at Seoul, South Korea.
Figure 4.
Same as Figure 3, but for estimating clear-sky solar irradiance at Jakarta, Indonesia.
Figure 4.
Same as Figure 3, but for estimating clear-sky solar irradiance at Jakarta, Indonesia.
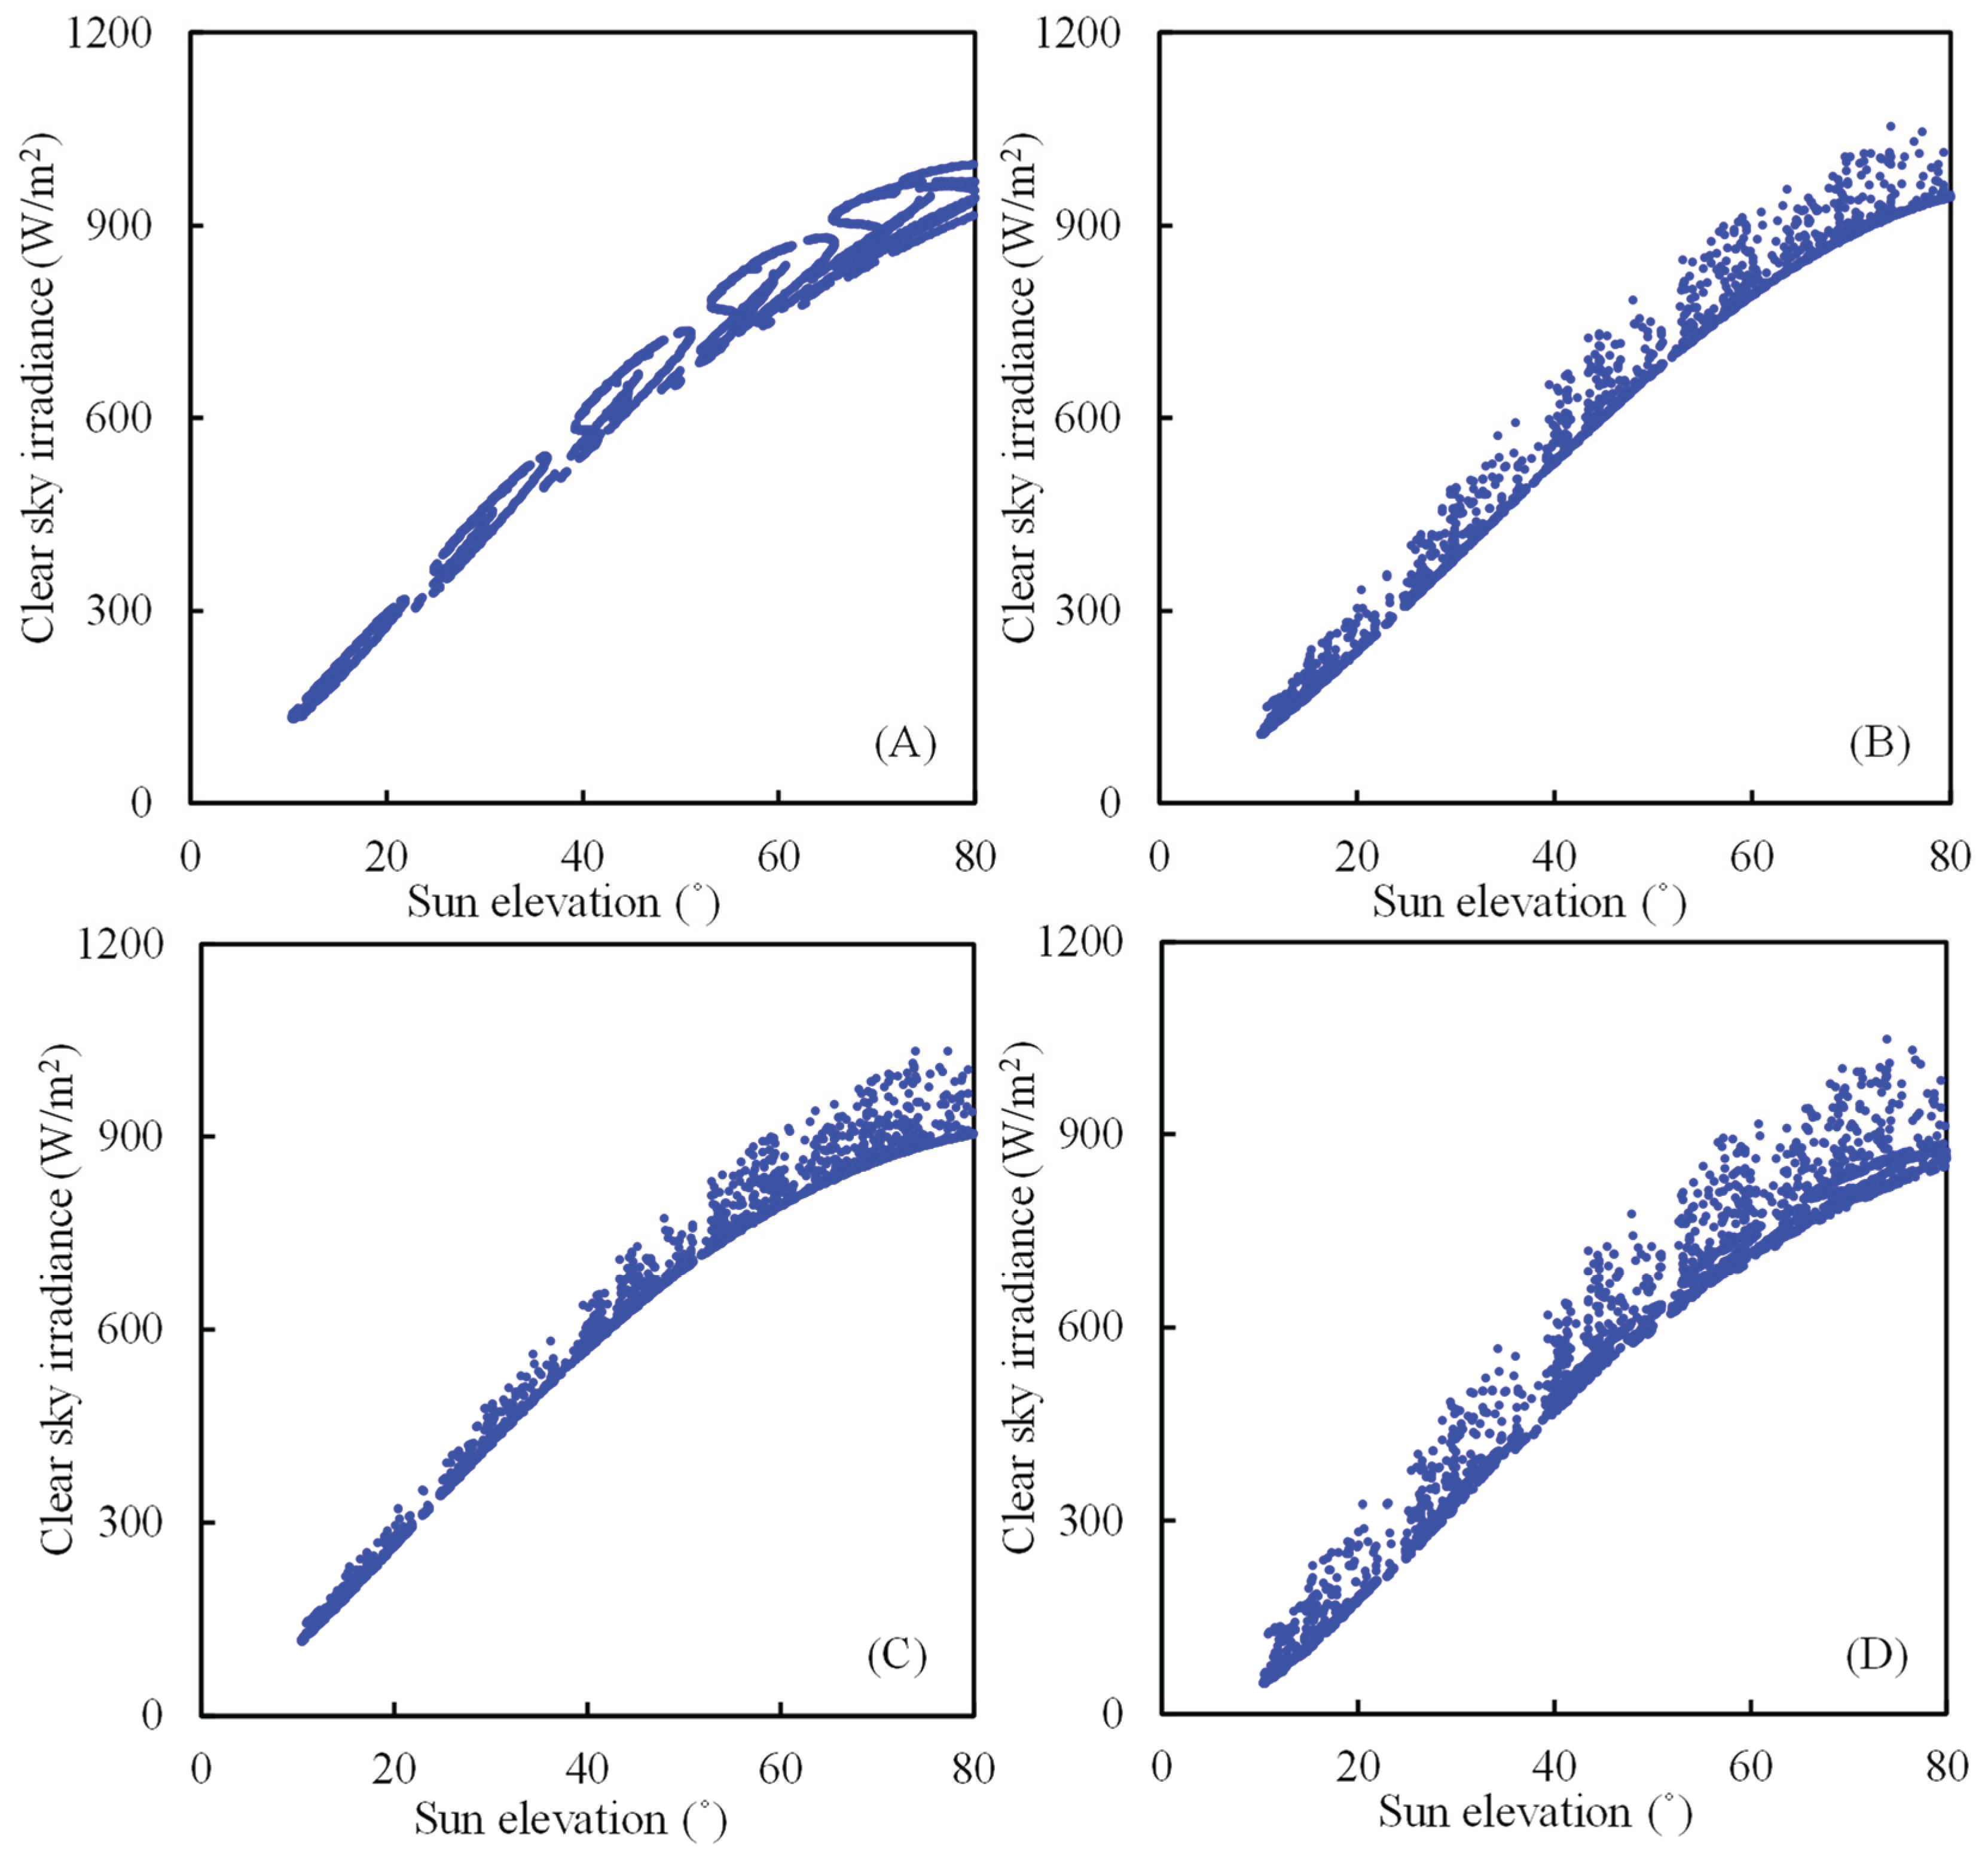
Figure 5.
Normalized COMS satellite pixel against backscatter angle. A, B, C, and D are Beyer, Hammer, Perez, and Rigollier models to estimate cloud index at Seoul, South Korea.
Figure 5.
Normalized COMS satellite pixel against backscatter angle. A, B, C, and D are Beyer, Hammer, Perez, and Rigollier models to estimate cloud index at Seoul, South Korea.
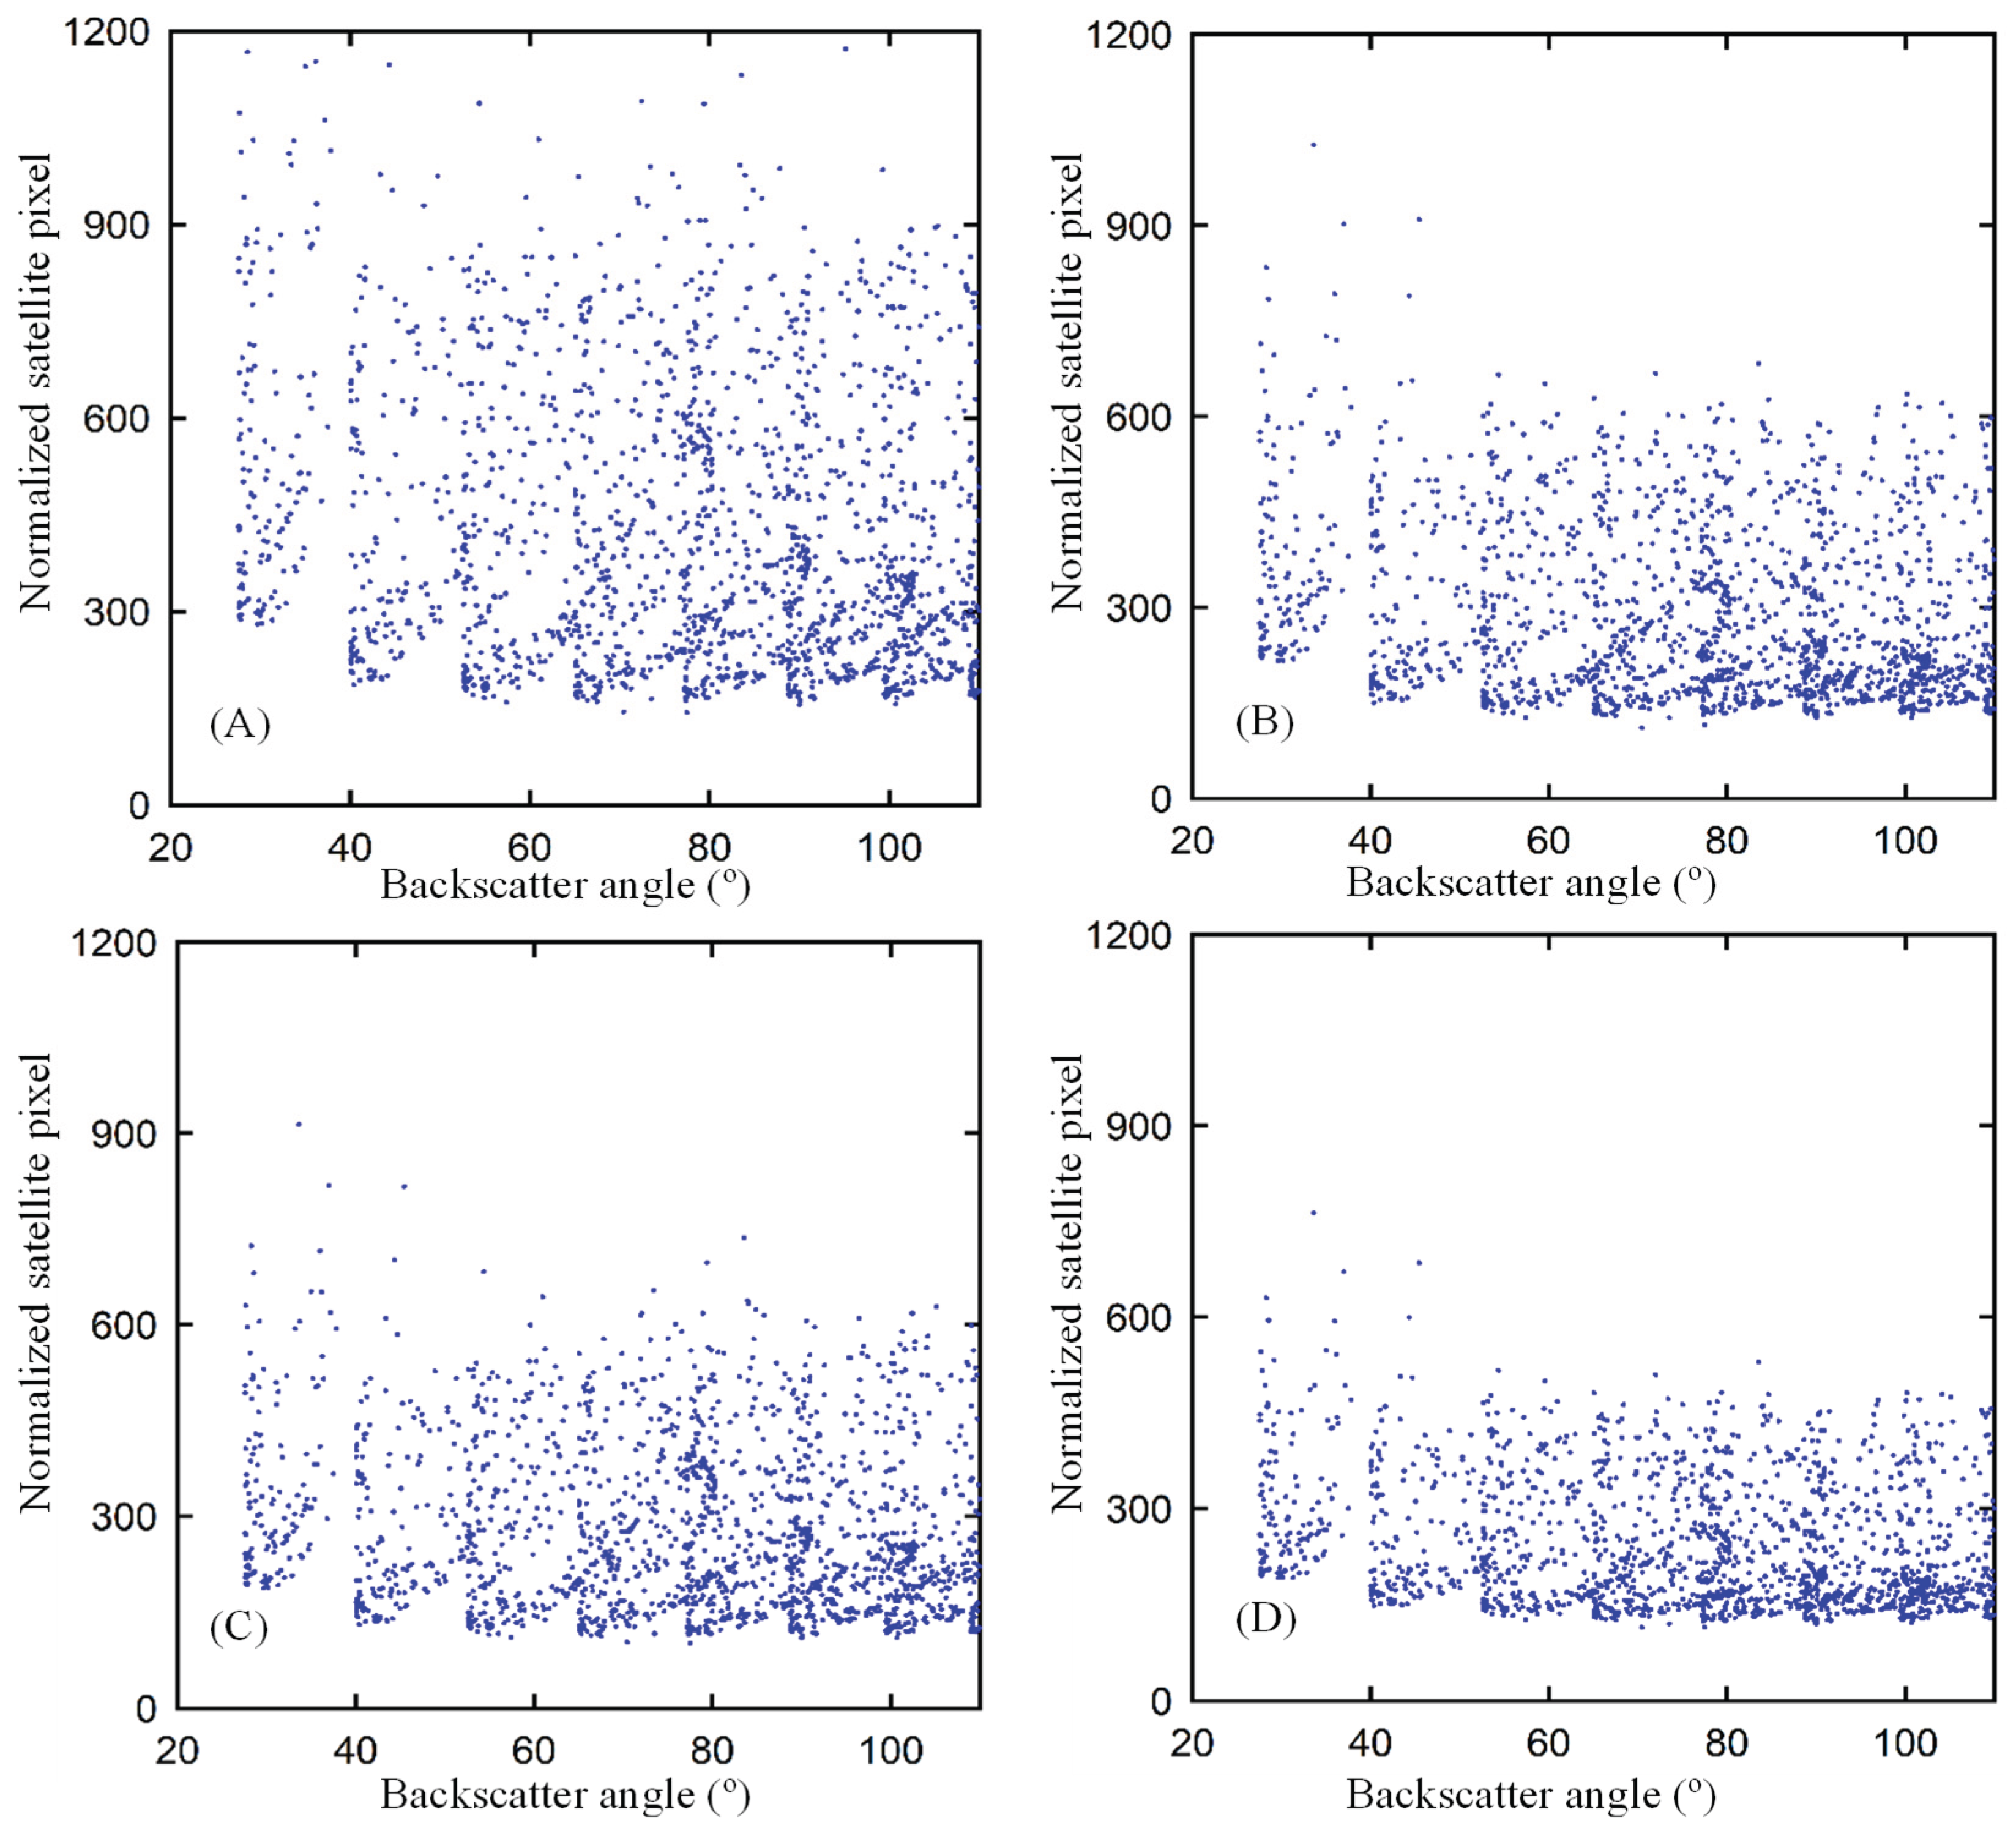
Figure 6.
Same as Figure 3, but for estimating CI based on GK2A pixels at Jakarta, Indonesia.
Figure 6.
Same as Figure 3, but for estimating CI based on GK2A pixels at Jakarta, Indonesia.
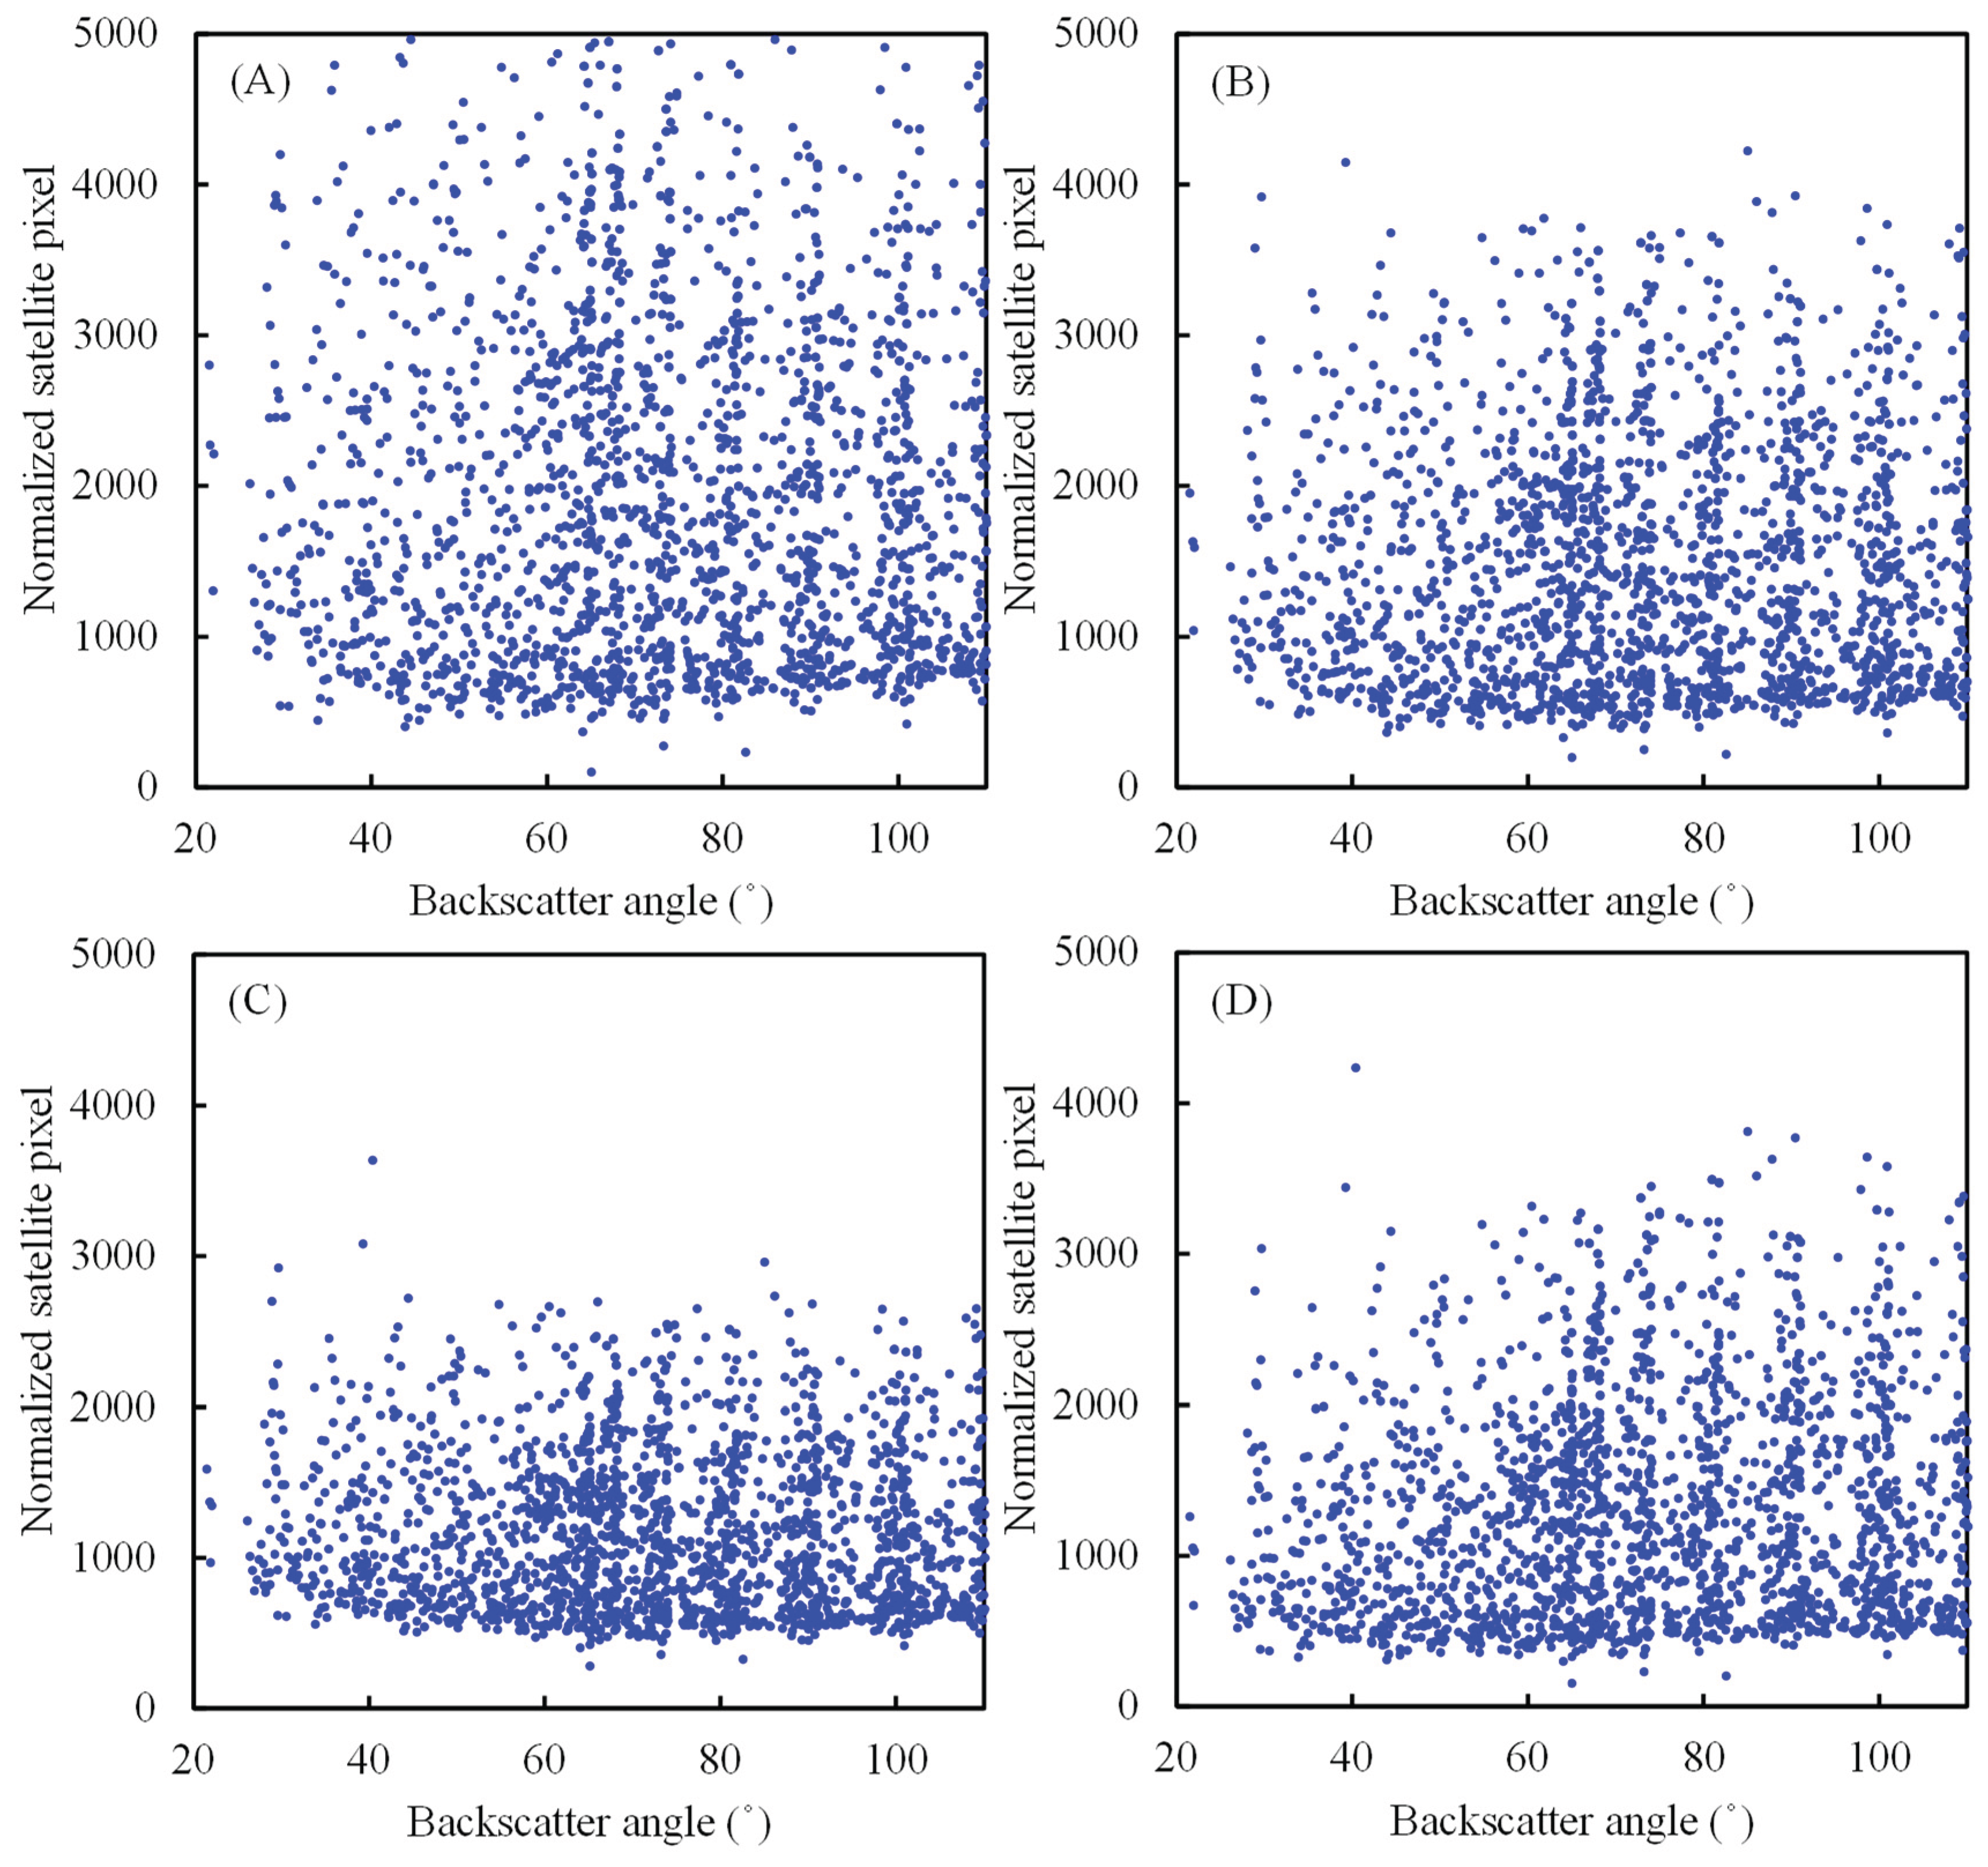
Figure 7.
Comparison of all-sky modeling results with measurement data; A, B, C, and D are the Beyer, Rigollier, Hammer, and Perez models to estimate GHI over the Korean Peninsula.
Figure 7.
Comparison of all-sky modeling results with measurement data; A, B, C, and D are the Beyer, Rigollier, Hammer, and Perez models to estimate GHI over the Korean Peninsula.
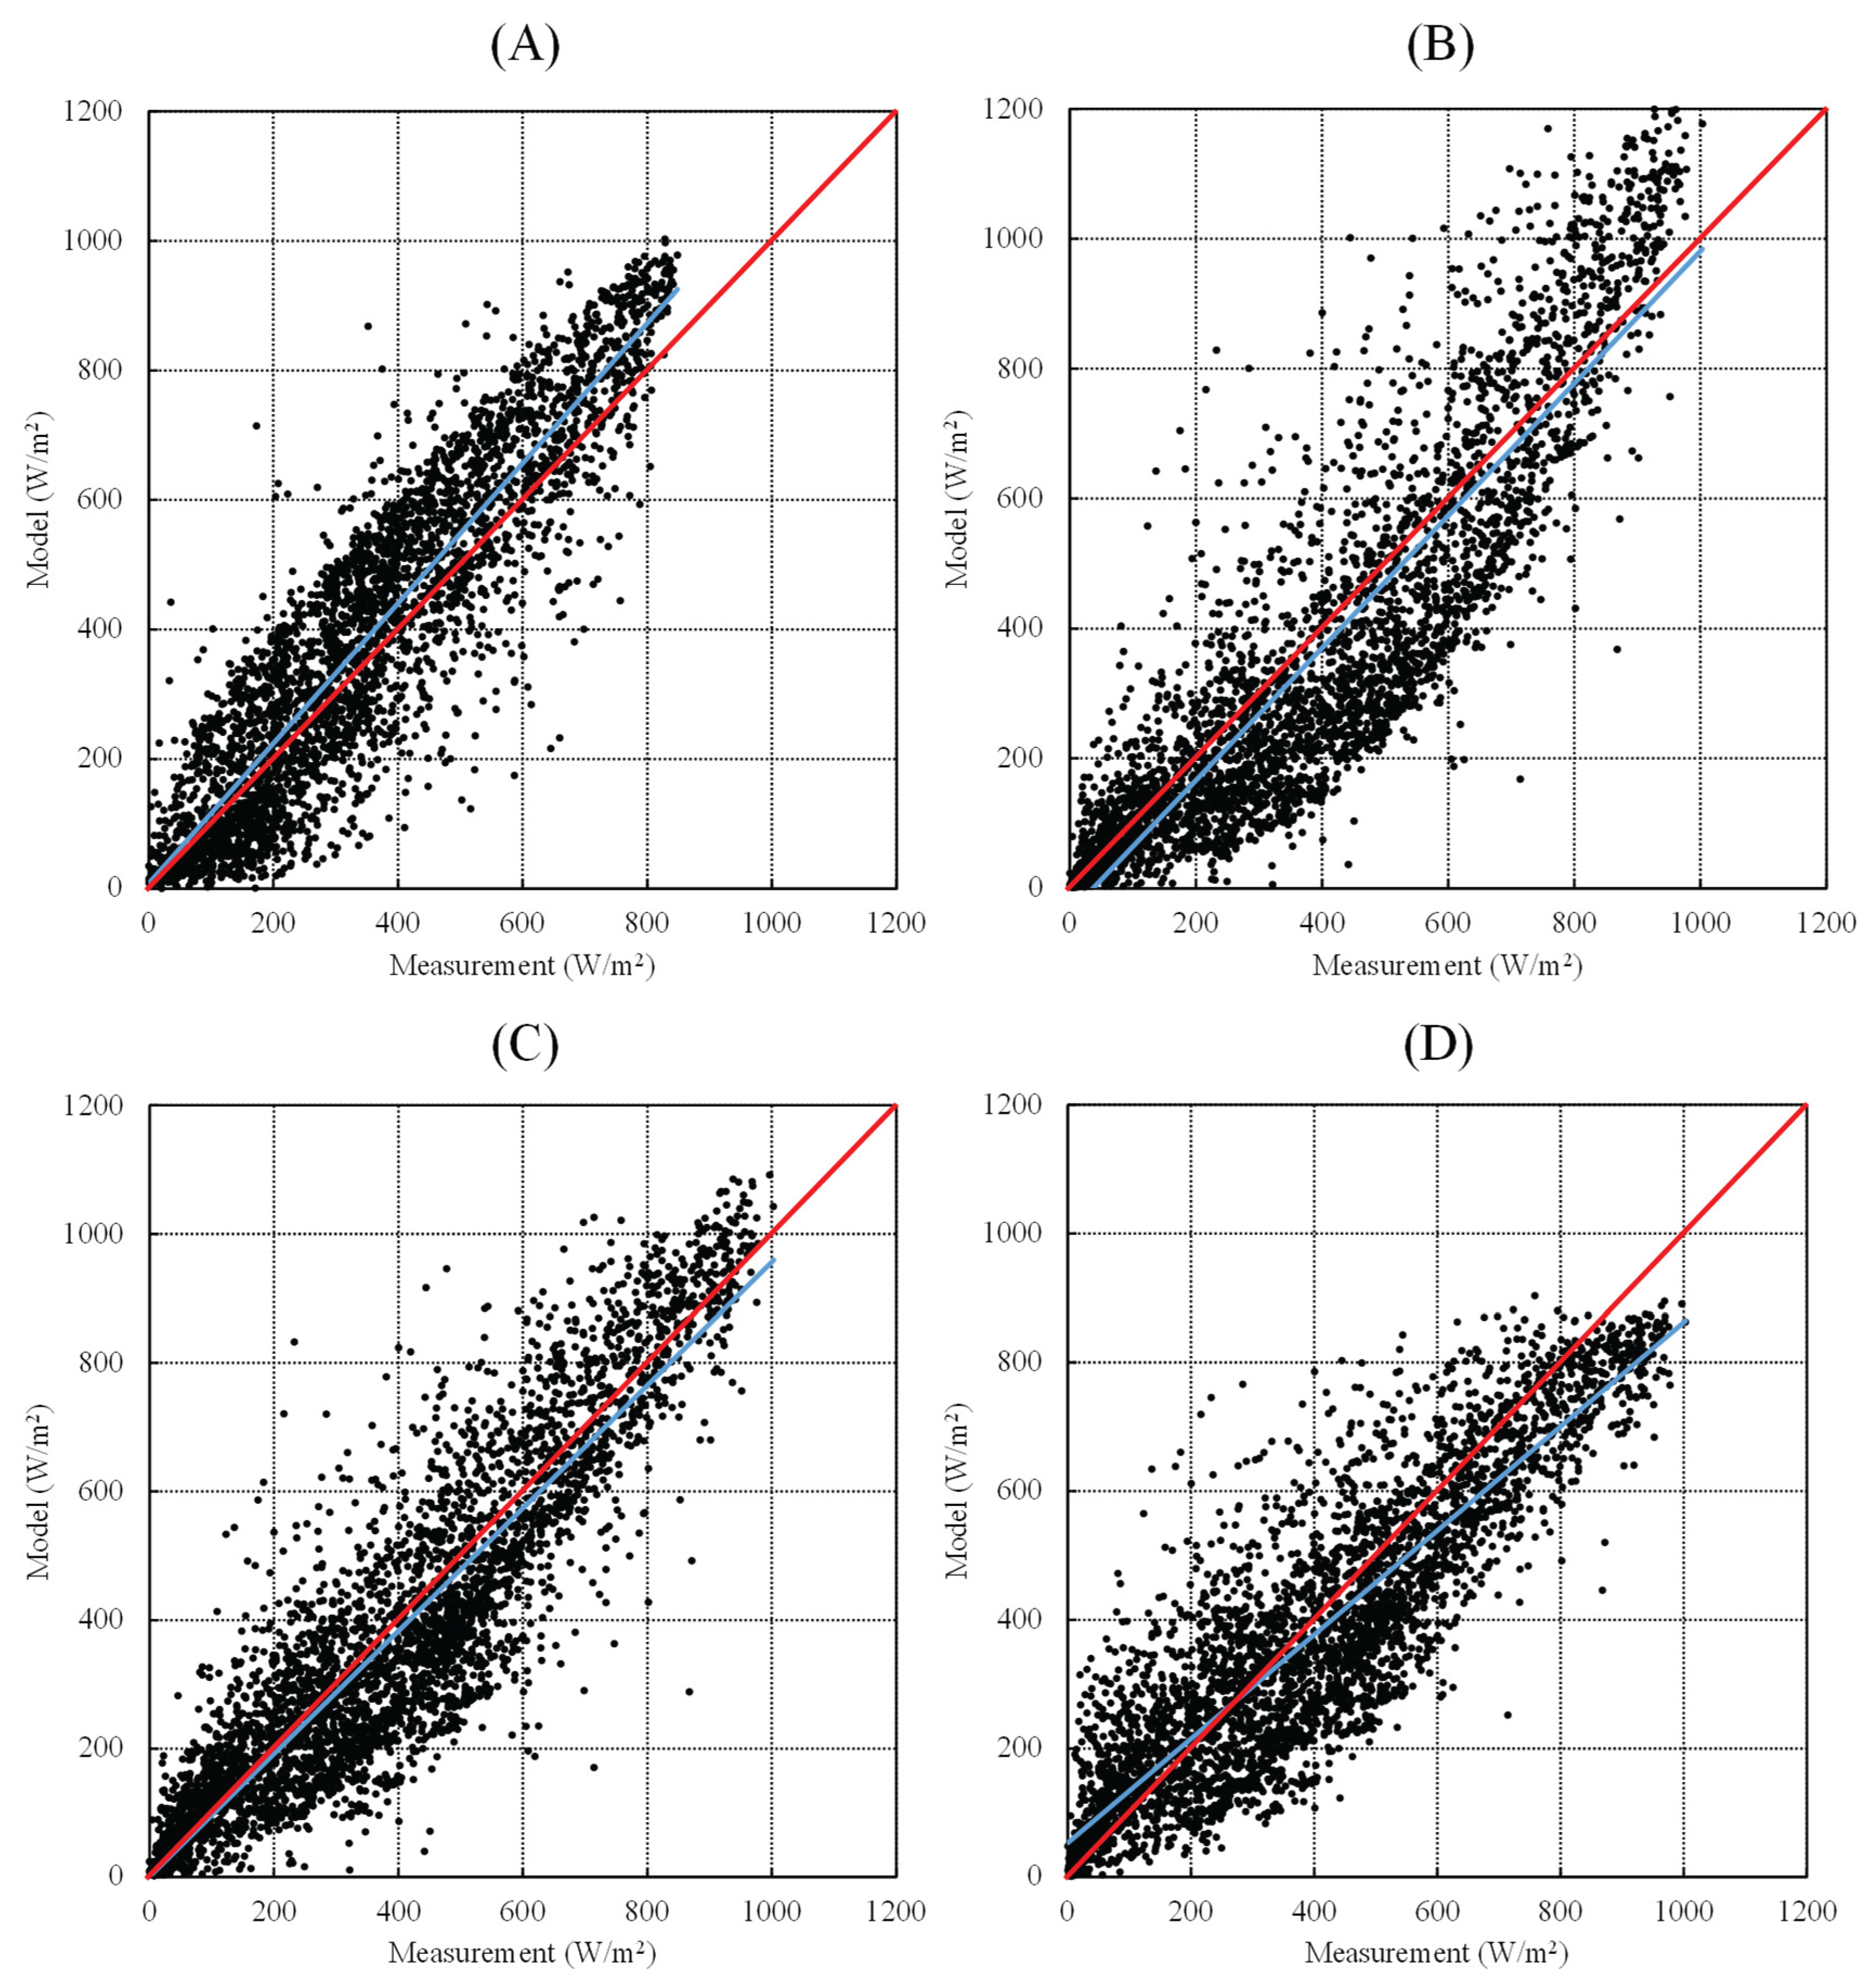
Figure 8.
Same as Figure 7, but to estimate GHI over the Jakarta, Indonesia.
Figure 8.
Same as Figure 7, but to estimate GHI over the Jakarta, Indonesia.
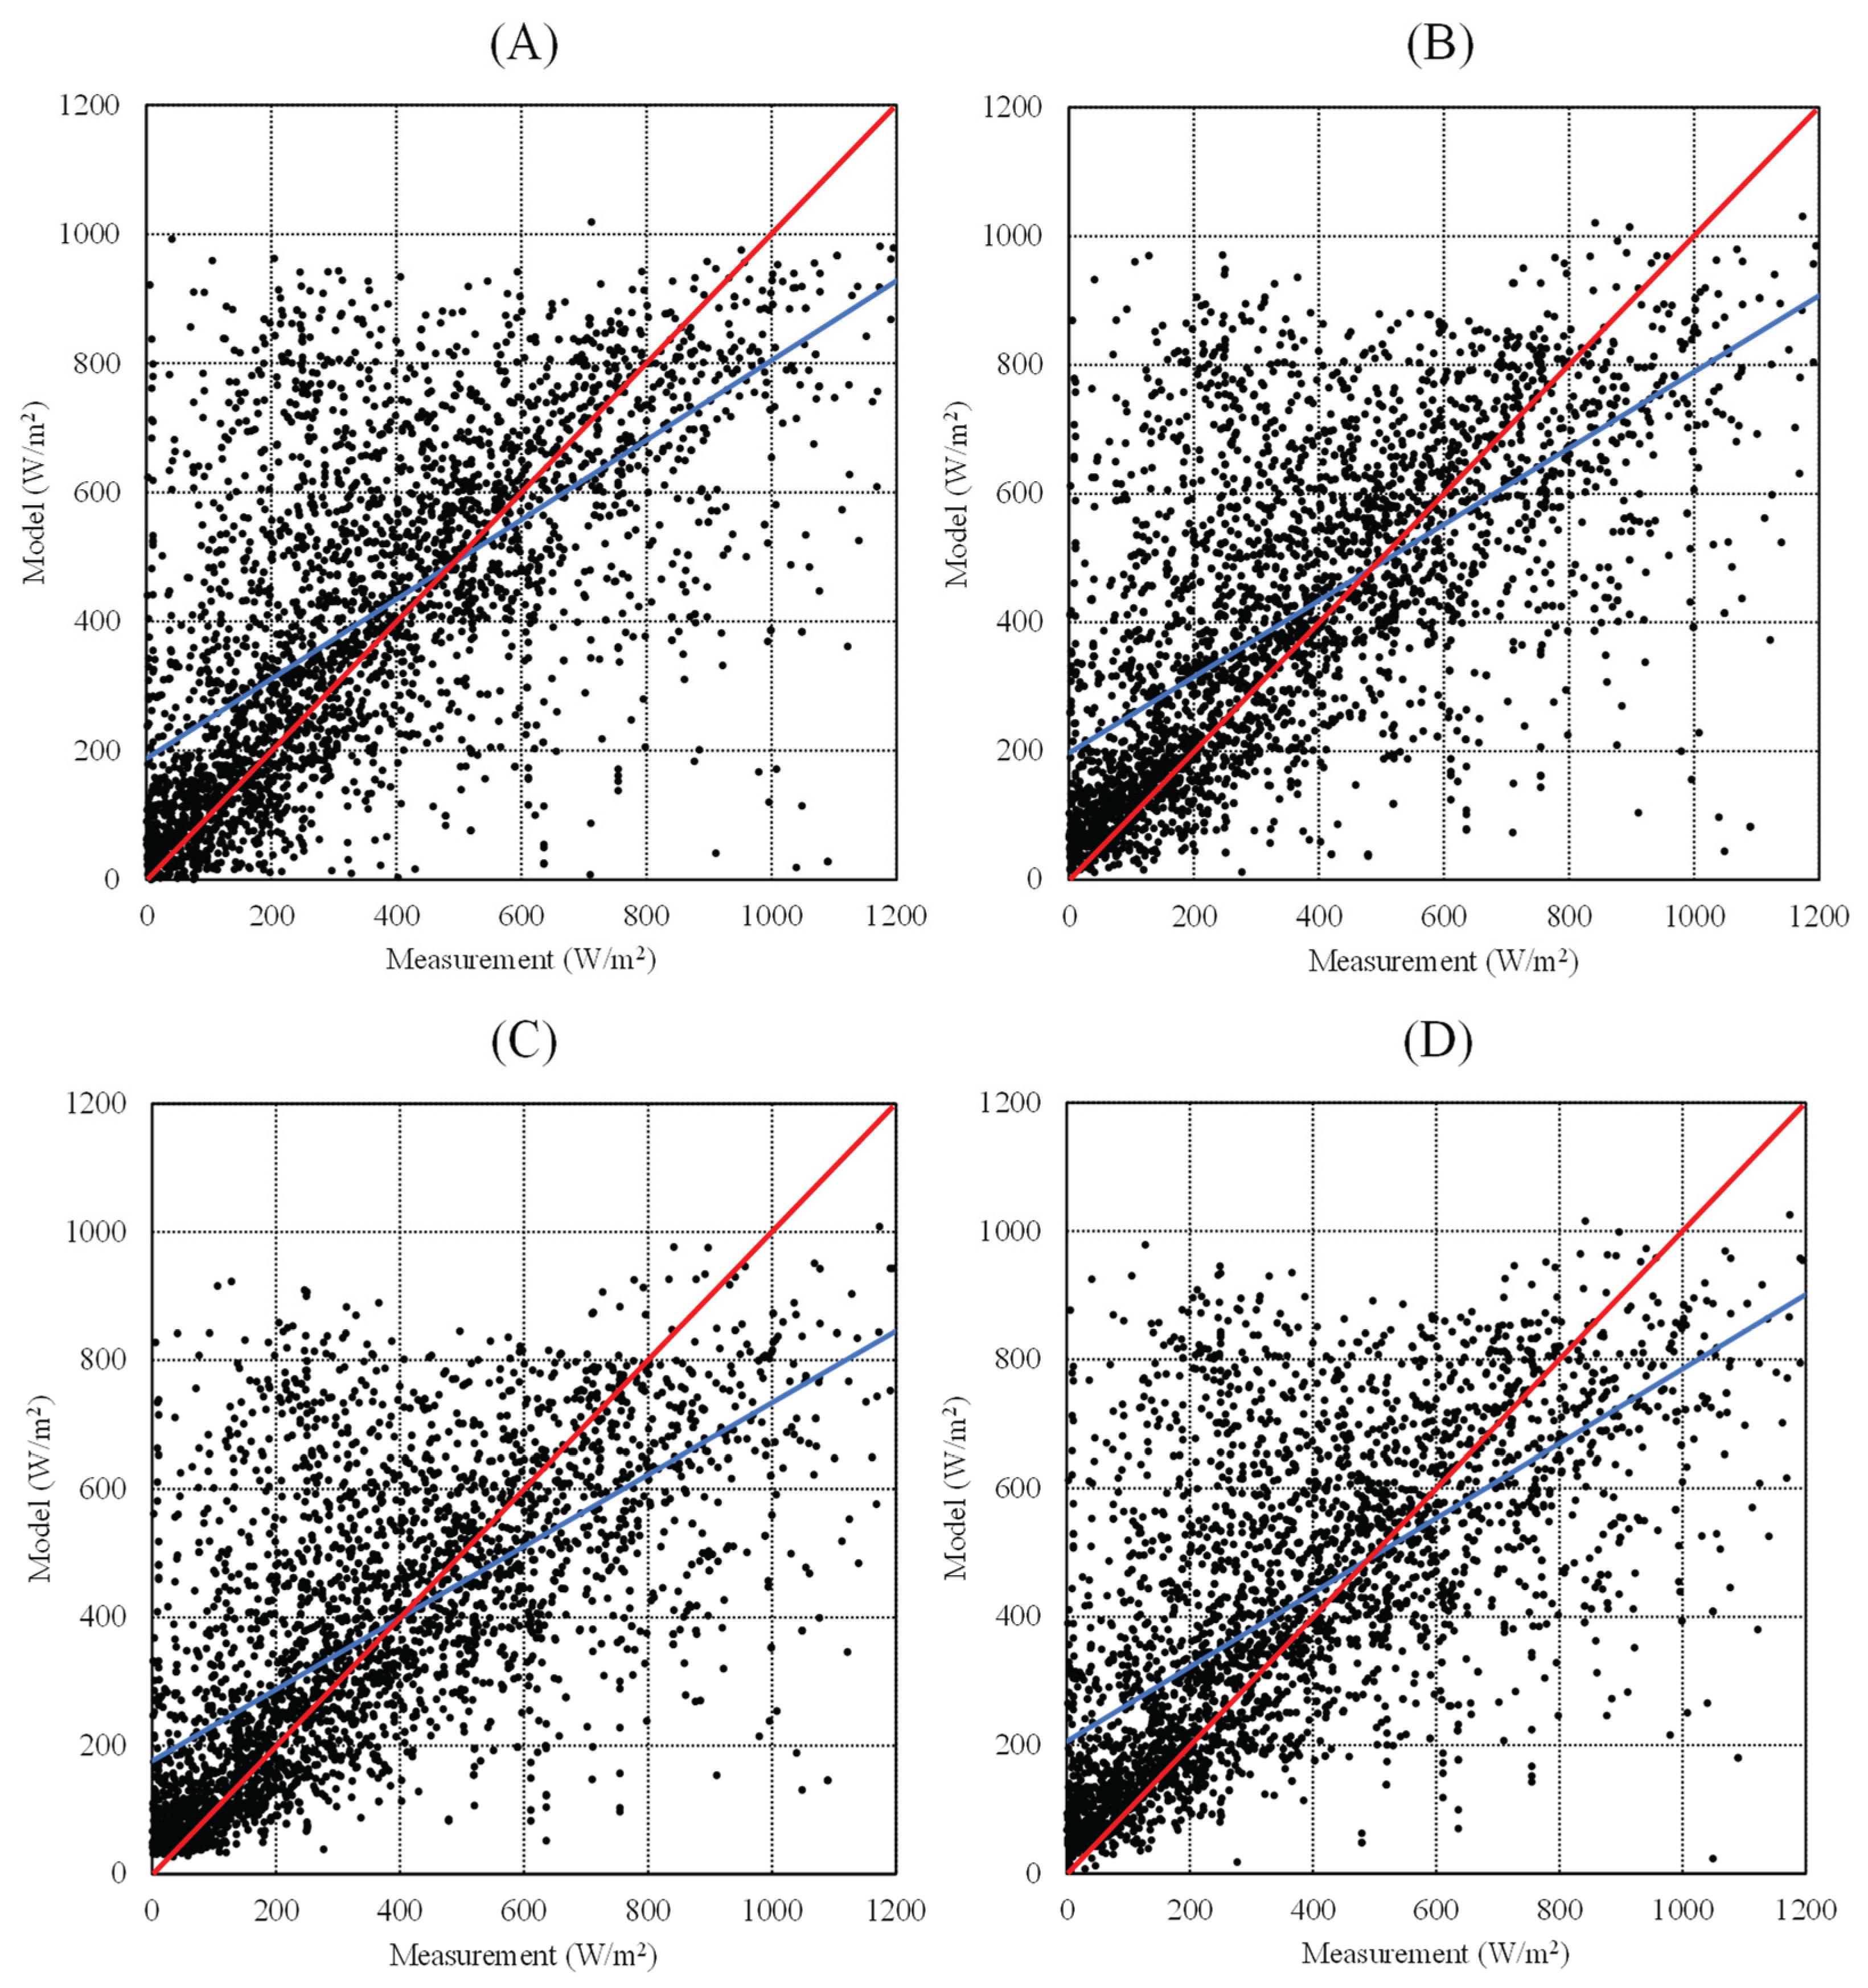
Figure 9.
Spatial distribution of estimated Global Horizontal Irradiance (GHI) in South Korea (left) and Indonesia, Jakarta and West Java Provinces (right) for August 2022 using satellite-derived semi-empirical modeling.
Figure 9.
Spatial distribution of estimated Global Horizontal Irradiance (GHI) in South Korea (left) and Indonesia, Jakarta and West Java Provinces (right) for August 2022 using satellite-derived semi-empirical modeling.
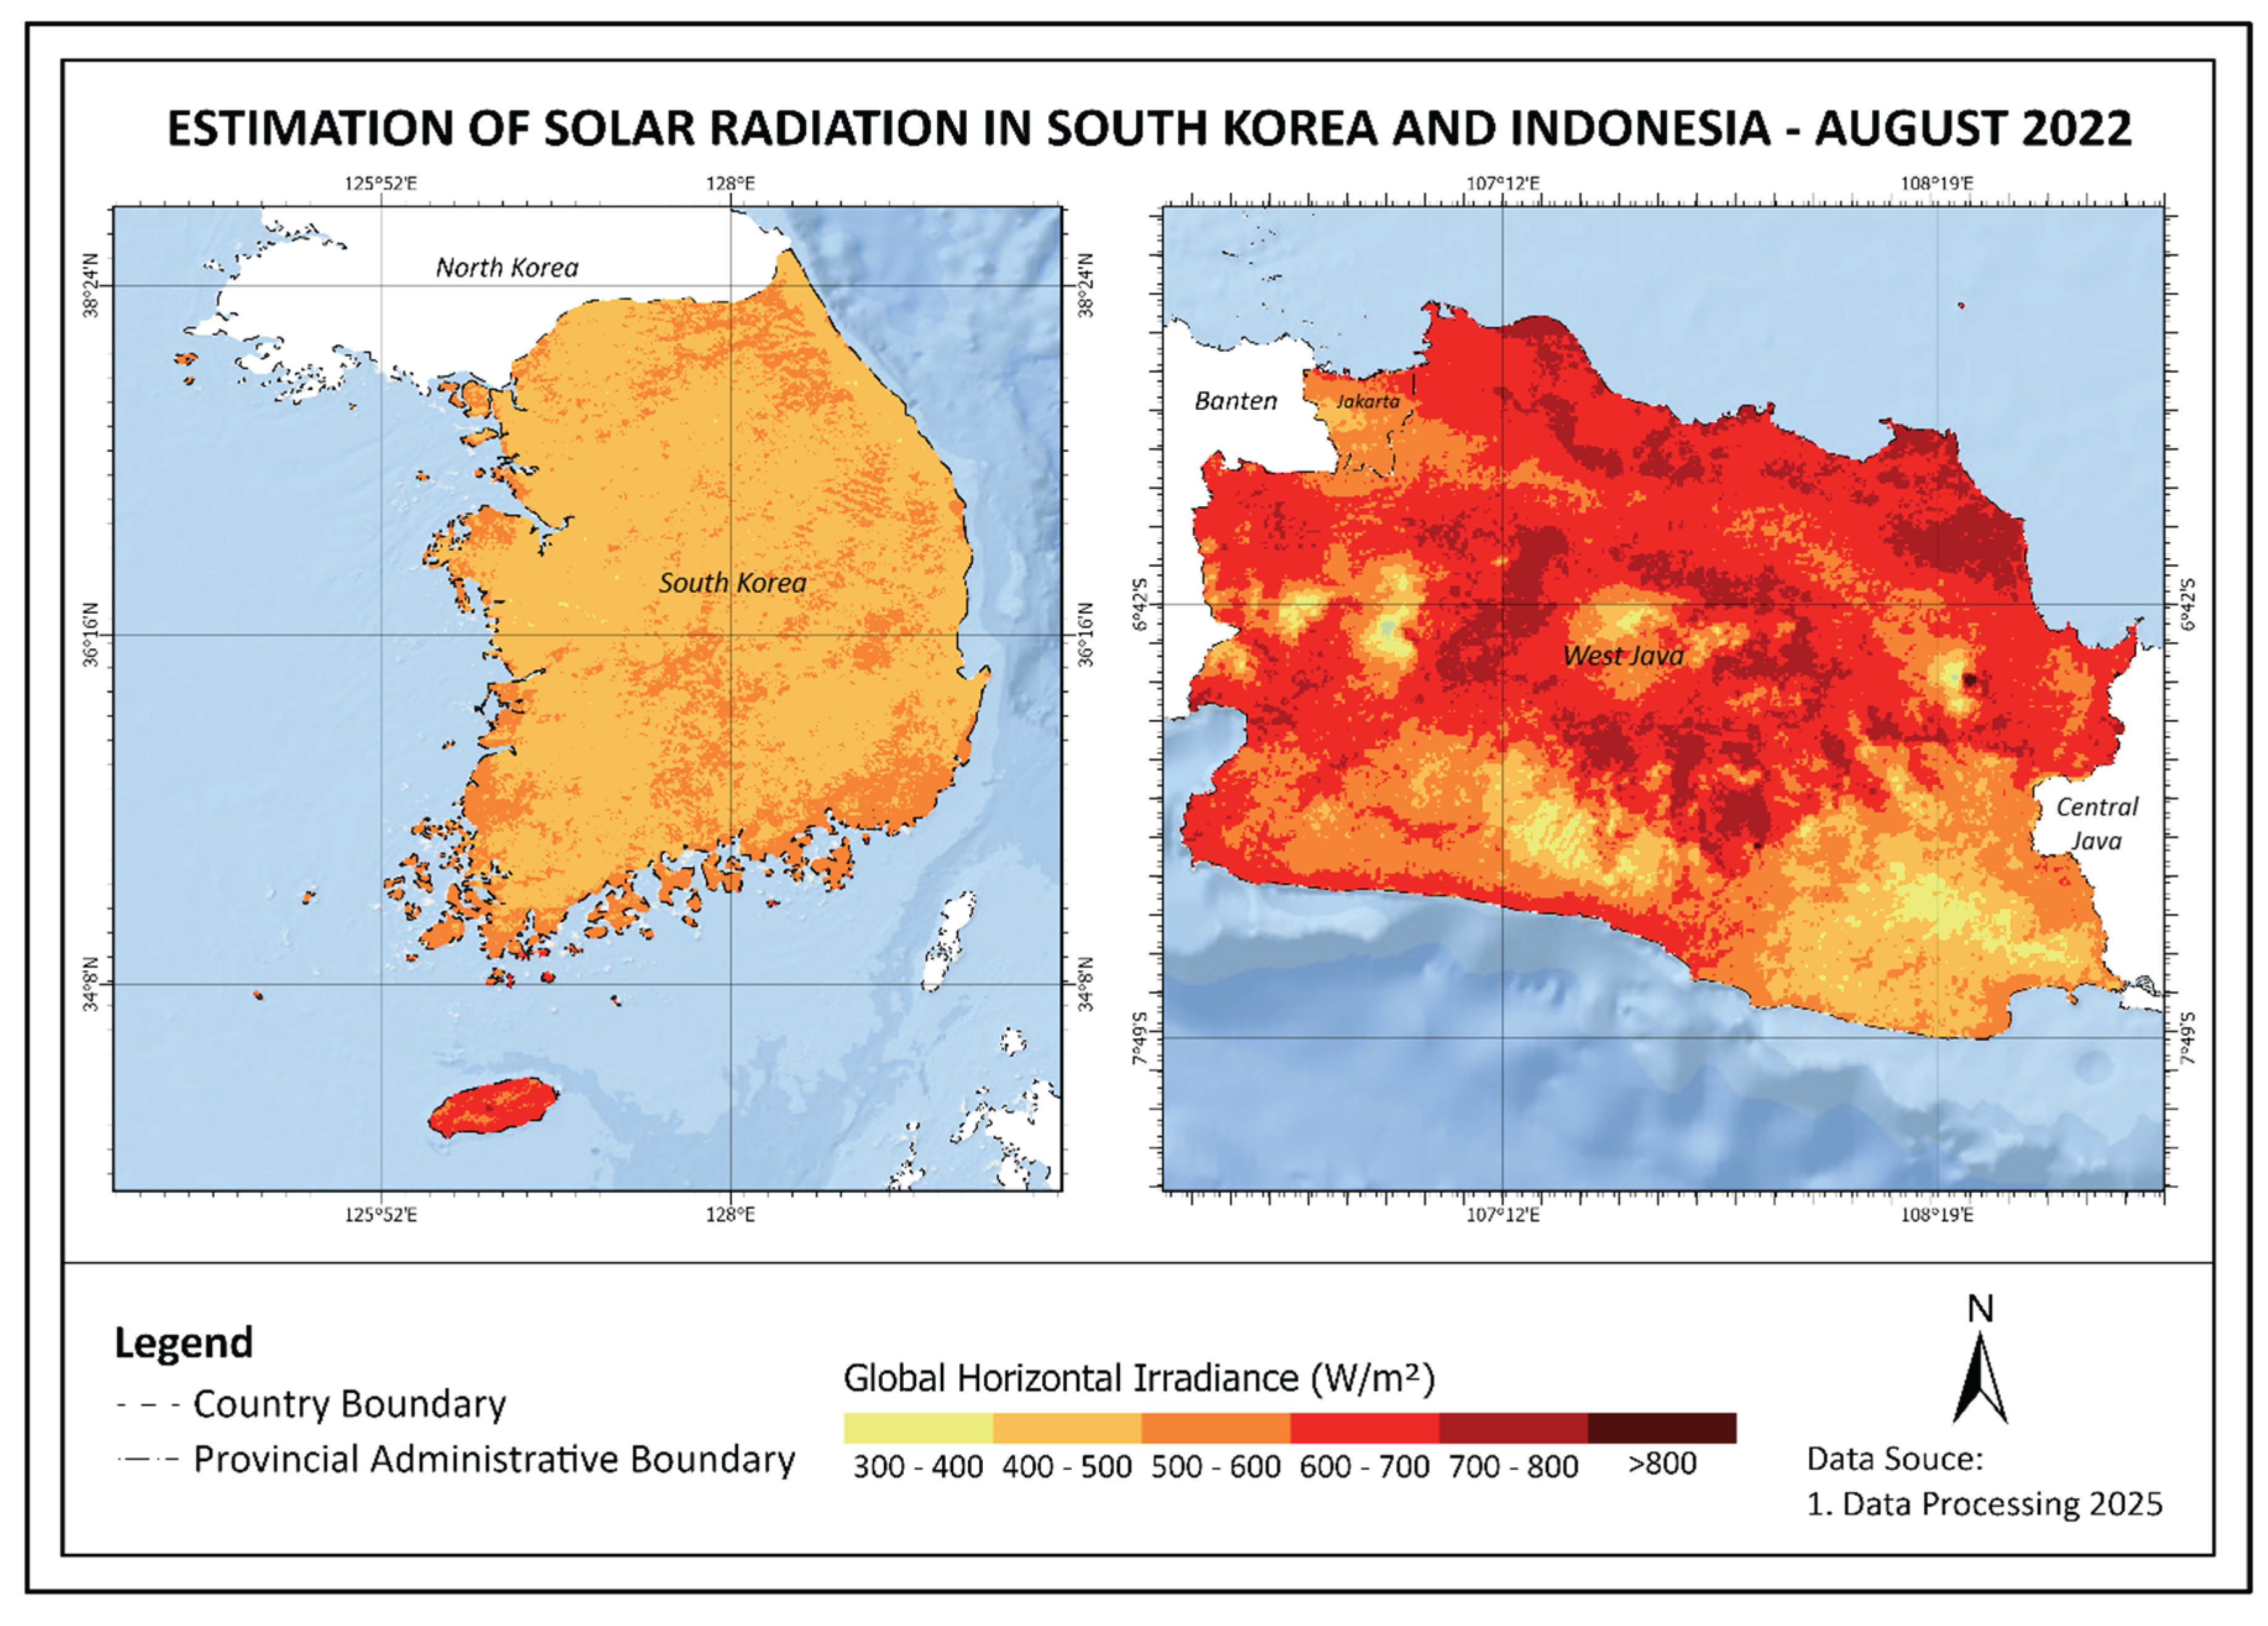
Table 4.
GHI conversion based on semi-empirical models, which consider , CI, and GHIC.
| Model | Equation | |
|---|---|---|
| Beyer | (28) | |
| (29) | ||
| Rigollier | (30) | |
| (31) | ||
| Hammer | (32) | |
| (33) | ||
| Perez | (34) | |
| (35) |
Table 5.
GHI conversion based on semi-empirical models, which consider , CI, and GHIC.
| Model | Input | Total | ||||
|---|---|---|---|---|---|---|
| Beyer | ✓ | ✓ | ✓ | 3 | ||
| Rigollier | ✓ | ✓ | ✓ | 3 | ||
| Hammer | ✓ | ✓ | ✓ | ✓ | 4 | |
| Perez | ✓ | ✓ | ✓ | 3 | ||
Table 6.
The validation of GHI models under all-sky conditions in the year 2018, Seoul, South Korea.
Table 6.
The validation of GHI models under all-sky conditions in the year 2018, Seoul, South Korea.
| Model | RMSE (W/m2) | rRMSE (%) | MBE (W/m2) | rMBE (%) | |
|---|---|---|---|---|---|
| Beyer | 113.74 | 29.18 | −36.84 | −9.45 | |
| Rigollier | 137.38 | 35.09 | −30.12 | −7.69 | |
| Hammer | 103.92 | 26.54 | 0.09 | 0.02 | |
| Perez | 112.57 | 28.64 | 14.53 | 3.7 |
Table 7.
The validation of GHI models under all-sky conditions in the year 2022, Jakarta, Indonesia.
Table 7.
The validation of GHI models under all-sky conditions in the year 2022, Jakarta, Indonesia.
| Model | RMSE (W/m2) | rRMSE (%) | MBE (W/m2) | rMBE (%) | |
|---|---|---|---|---|---|
| Beyer | 227.41 | 62.93 | 48.99 | 13.56 | |
| Rigollier | 222.54 | 61.58 | 53.77 | 14.88 | |
| Hammer | 223.79 | 61.93 | 49.83 | 13.79 | |
| Perez | 212.08 | 58.69 | 16.46 | 4.55 |
Disclaimer/Publisher’s Note: The statements, opinions and data contained in all publications are solely those of the individual author(s) and contributor(s) and not of MDPI and/or the editor(s). MDPI and/or the editor(s) disclaim responsibility for any injury to people or property resulting from any ideas, methods, instructions or products referred to in the content. |
© 2025 by the authors. Licensee MDPI, Basel, Switzerland. This article is an open access article distributed under the terms and conditions of the Creative Commons Attribution (CC BY) license (http://creativecommons.org/licenses/by/4.0/).
Copyright: This open access article is published under a Creative Commons CC BY 4.0 license, which permit the free download, distribution, and reuse, provided that the author and preprint are cited in any reuse.


