1. Introduction
Diabetes mellitus (DM), a chronic metabolic disorder characterized by persistently high blood glucose levels, is a growing health concern. Projections indicate that by 2045, the global prevalence of DM will reach 783.2 million cases, a significant increase from the 537 million in 2021 [
1]. Regrettably, this substantial rise is not expected to correspond with a proportional growth in healthcare expenditure. The majority of new cases are expected in developing countries with medium to low incomes, where DM-related healthcare costs are typically moderate [
1]. For this reason, it is crucial to expand research on and improve knowledge about antidiabetic medicinal plants. These resources can provide more cost-effective treatment options, requiring less processing and infrastructure compared to synthetic or, moreover, biotechnological drugs, making plant-derived products particularly valuable in resource-limited conditions [
2].
The genus
Polyalthia includes 120 species, primarily found in Africa, Asia, and Australia. Native to southern India and Sri Lanka,
P. longifolia has been subsequently introduced to various parts of Asia, and in West and Central Africa [
3]. The species
P. longifolia var.
pendula (Sonn.) Thwaites, a member of the Annonaceae family, is a columnar tree that can reach a height of 20 meters, characterized by lanceolate leaves with curvy margins and an acuminate apex, measuring between 12 to 30 cm in length (
Figure S1).
P. longifolia holds a significant place in Indian traditional medicine, where it is commonly employed for several medicinal purposes including treatment of hypertension, management of intestinal parasites, regulation of glycemia, and as anti-inflammatory remedy [
4,
5,
6]. Phytochemical investigations reported the presence of various constituents, mainly terpenes (clerodane diterpenes), tannins, polyphenols, and aporphine alkaloids [
5,
6,
7,
8,
9,
10].
The literature reports few investigations regarding the antidiabetic activities of
P. longifolia. Firstly, Nair et al. (2007) reported the capacity of
P. longifolia leaf extracts to counteract hyperglycemia in alloxan-induced diabetic rats [
11]. Successively, Sivashanmugam and Chatterjee (2013) described that ethanol and chloroform leaf extracts progressively reduced fasting blood glucose levels during a 28-week treatment, with effects comparable to metformin [
12]. Furthermore, the authors reported that the extracts were able to moderately reduce the activity of α-glucosidase and α-amylase enzymes in vitro [
12,
13]. However, the available data are limited and still require further investigation.
Hyperglycemia-induced damage is associated with various mechanisms; among these are insulin resistance, formation of radical species, and Advanced Glycation End Products (AGEs) [
14]. These reactive compounds originate from non-enzymatic reactions between reducing sugars and macromolecules such as proteins, nucleic acids, or lipids. The process begins with the Maillard reaction, where an aldehyde or ketone carbonyl group of a reducing sugar (e.g., glucose, fructose, ribose) reacts with lysine and arginine amino acid residues [
15]. Through various rearrangements and consequent reactions, this leads to the formation of AGEs, a heterogeneous class of irreversible compounds responsible for permanent cellular and tissue damage [
16].
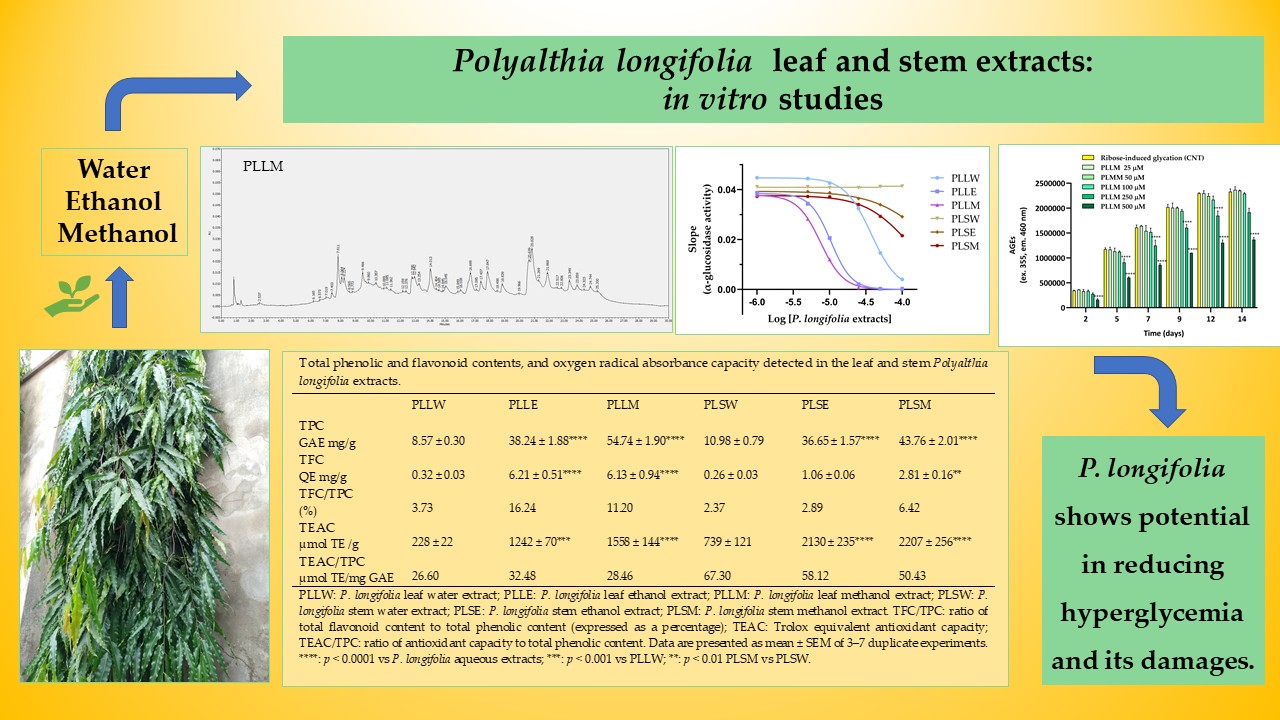
To evaluate the antidiabetic potential of P. longifolia, this research examined six different extracts using various solvents and plant parts. The extracts were prepared using aqueous (W), ethanol (E), and methanol (M) as solvents, derived from either leaves (L) or stems (S) of P. longifolia (PL). The resulting abbreviations are: PLLW, PLLE, and PLLM for leaf extracts, and PLSW, PLSE, and PLSM for stem extracts. Their hypoglycemic potential was evaluated with the α-glucosidase assay, while antiglycation activity was estimated using the ribose-induced BSA (Bovine Serum Albumin) assay. Antioxidant capacity was determined by the ORAC (Oxygen Radical Absorbance Capacity) assay. Phytochemical composition was characterized through the detection of TPC (Total Phenol Content) and TFC (Total Flavonoid Content), as well as HPLC-DAD analysis. Furthermore, the safety of the extracts was explored through the MTT assay, detecting the cell viability on HT-29 cells. This approach aimed to provide an in-depth understanding of P. longifolia extracts for their potential medicinal use.
3. Discussion
Various botanical products are widely proposed for therapy in medicine and as food supplements in many countries for DM management. However, only a fraction of these herbal remedies has undergone rigorous scientific study. This gap underscores the critical need for targeted research in this field. In fact, in vitro and in vivo studies have identified numerous plant-derived products with potential hypoglycemic activity. For example,
Momordica charantia L. (bitter melon) and
Gymnema sylvestre (Retz.) Schult. have shown promising results [
36]. Particularly,
Galega officinalis L. led to the discovery of metformin, a cornerstone of antidiabetic treatment [
37]. The exploration of traditional medicinal plants, therefore, represents a valuable approach in the search for DM therapy.
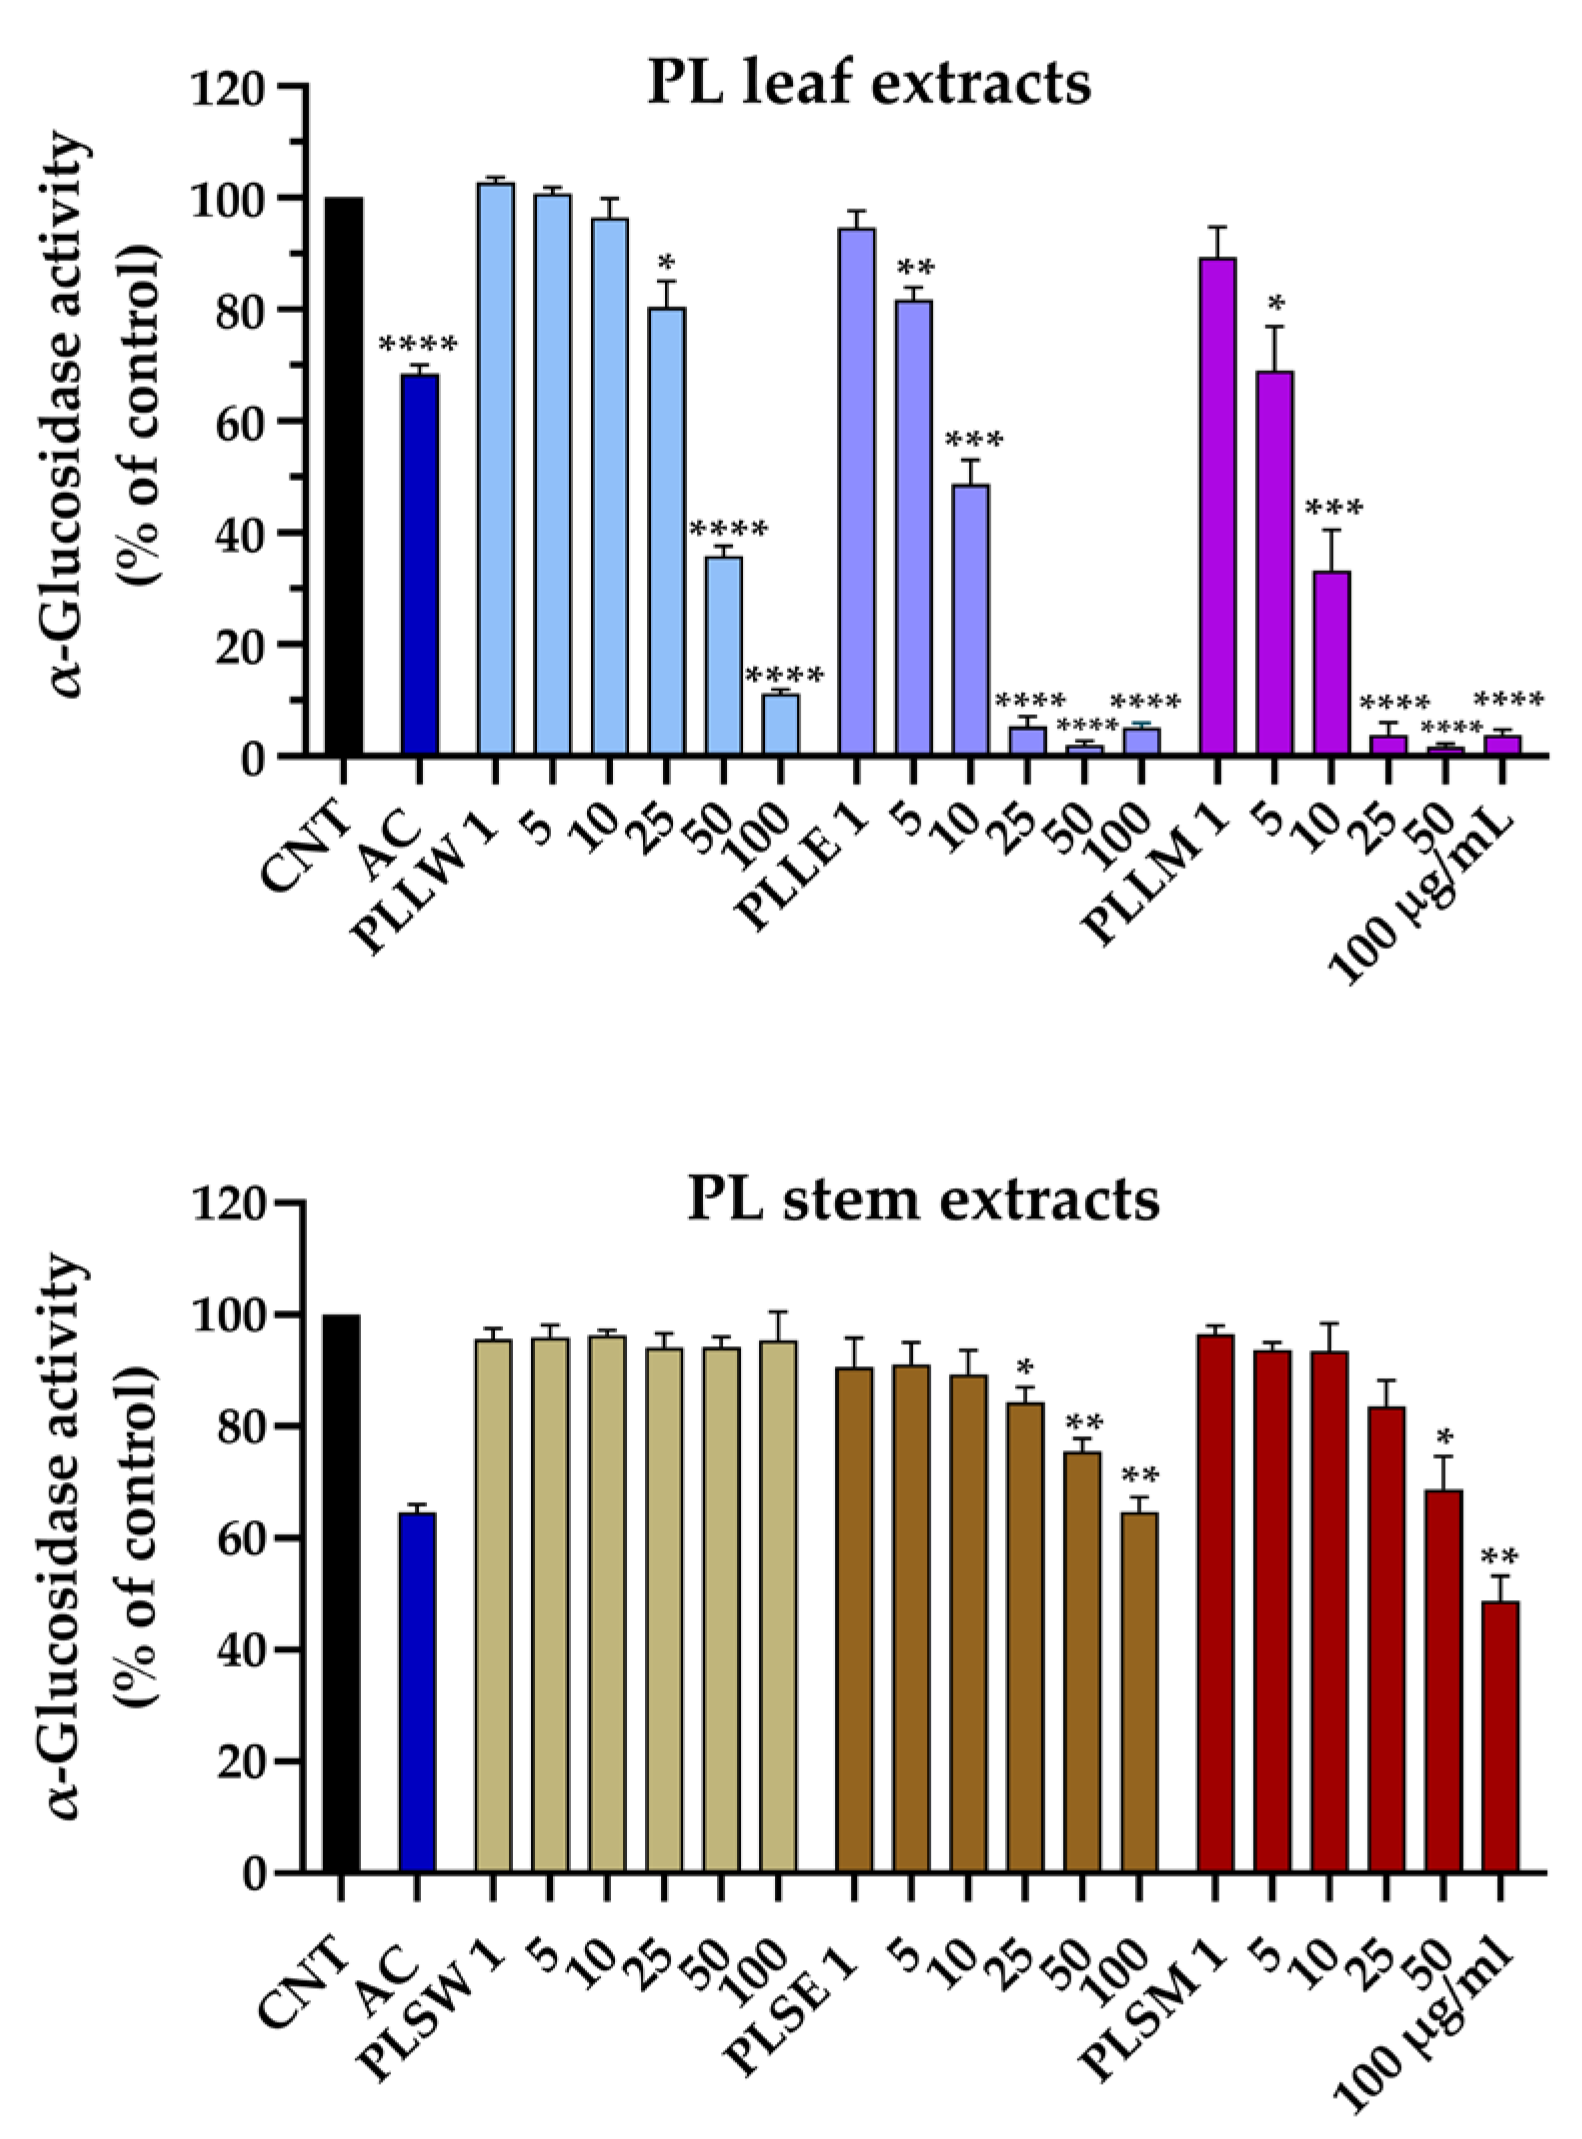
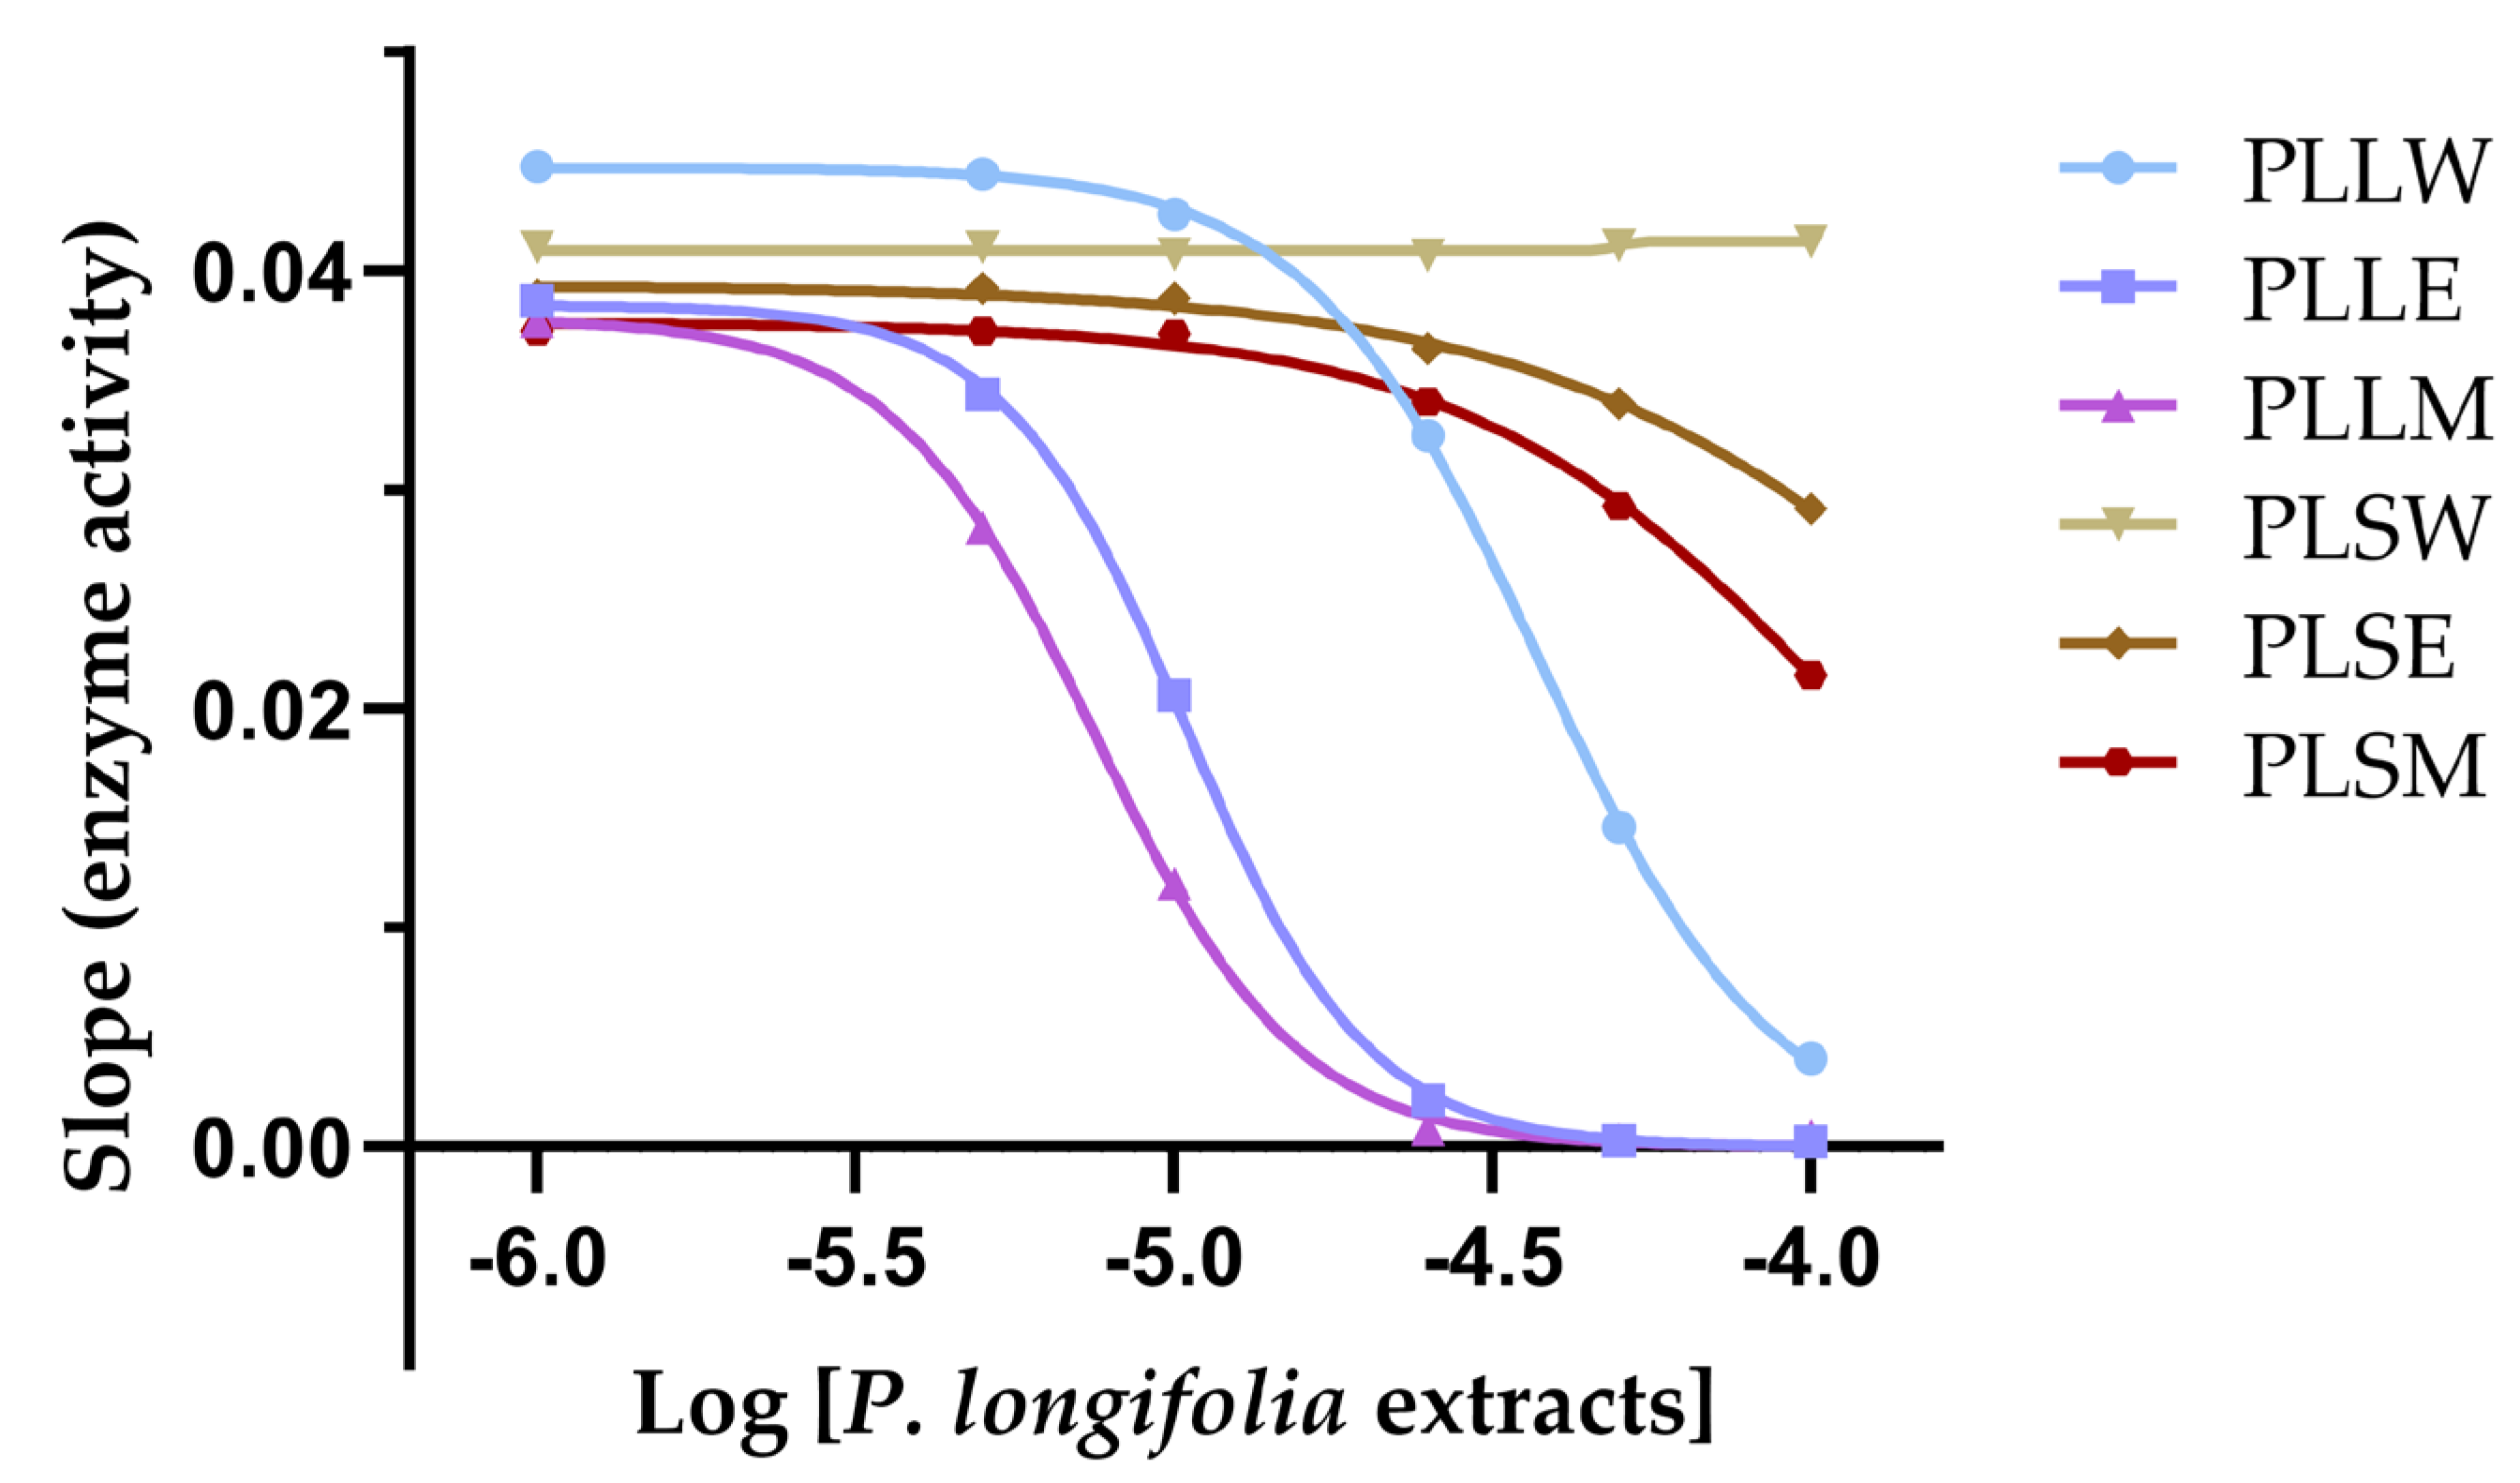
In this study, yeast α-glucosidase served as a model assay for screening the potential of
P. longifolia extracts as inhibitors of the enzyme activity, potentially helping to reduce glucose absorption from dietary carbohydrates. The leaf extracts exhibited significant concentration-dependent inhibition across all three solvents used for extraction. Specifically, the aqueous extract (PLLW) demonstrated significant inhibitory effects from the concentration of 25 µg/mL, while both ethanol (PLLE) and methanol (PLLM) extracts inhibited at concentrations as low as 5 µg/mL, indicating their higher potency. The respective EC
50 values were: 36.87, 10.44, and 7.31 µg/mL (
Table 1). Conversely, the stem extracts displayed substantially reduced potency. The aqueous stem extract (PLSW) showed no discernible inhibitory activity, while the ethanol (PLSE) and methanol (PLSM) stem extracts elicited only moderate inhibition at 50 µg/mL and above. Thus, PLLM extract emerged as the most potent inhibitor of α-glucosidase (IC
50 = 7.31 µg/mL), exhibiting a positive cooperative interaction with the enzyme, as evidenced by a Hill slope greater than 1, suggesting potential allosteric modulation. Similar effects were shown by the ethanol and aqueous leaf extracts, but with lower potency.
Very few investigations have examined the inhibitory effects of
P. longifolia preparations on α-glucosidase and α-amylase activities [
12,
13]. These studies utilized ethanol and chloroform [
12] or methanol and petroleum ether leaf extracts [
13], showing that alcohol extracts had superior inhibitory potency, in agreement with current results. Moreover, these extracts exhibited concentration-dependent inhibition of α-glucosidase at concentrations similar to those employed in the present investigation, but with lower potency. Thus, present results not only support the potential of
P. longifolia as a source of α-glucosidase inhibitors, but also allow to compare the efficacy of different solvents and tissues used for the extractions. Methanol and ethanol extracts of
P. longifolia leaves promote significant concentration-dependent inhibition of α-glucosidase activity. Moreover, the leaf aqueous extract, important also for its traditional use, showed detectable inhibition. To date, no investigations related to the effects of aqueous and ethanol extracts of
P. longifolia on α-glucosidase activity have been found in previous literature. Indeed, also few previous in vivo studies have reported the antihyperglycemic effects of
P. longifolia extracts. In one study, hyperglycemic rats with blood glucose levels ranging from 250 to 550 mg/dL showed an antihyperglycemic response after a 7-day treatment with methanol leaf extracts (300 mg/kg) [
11]. Additionally, in a study using streptozotocin-induced diabetic rats, administration of ethanol and chloroform extracts (100 and 200 mg/kg) caused a significant reduction of fasting blood glucose levels, with effects observed from day 7 to day 28 of treatment [
12].
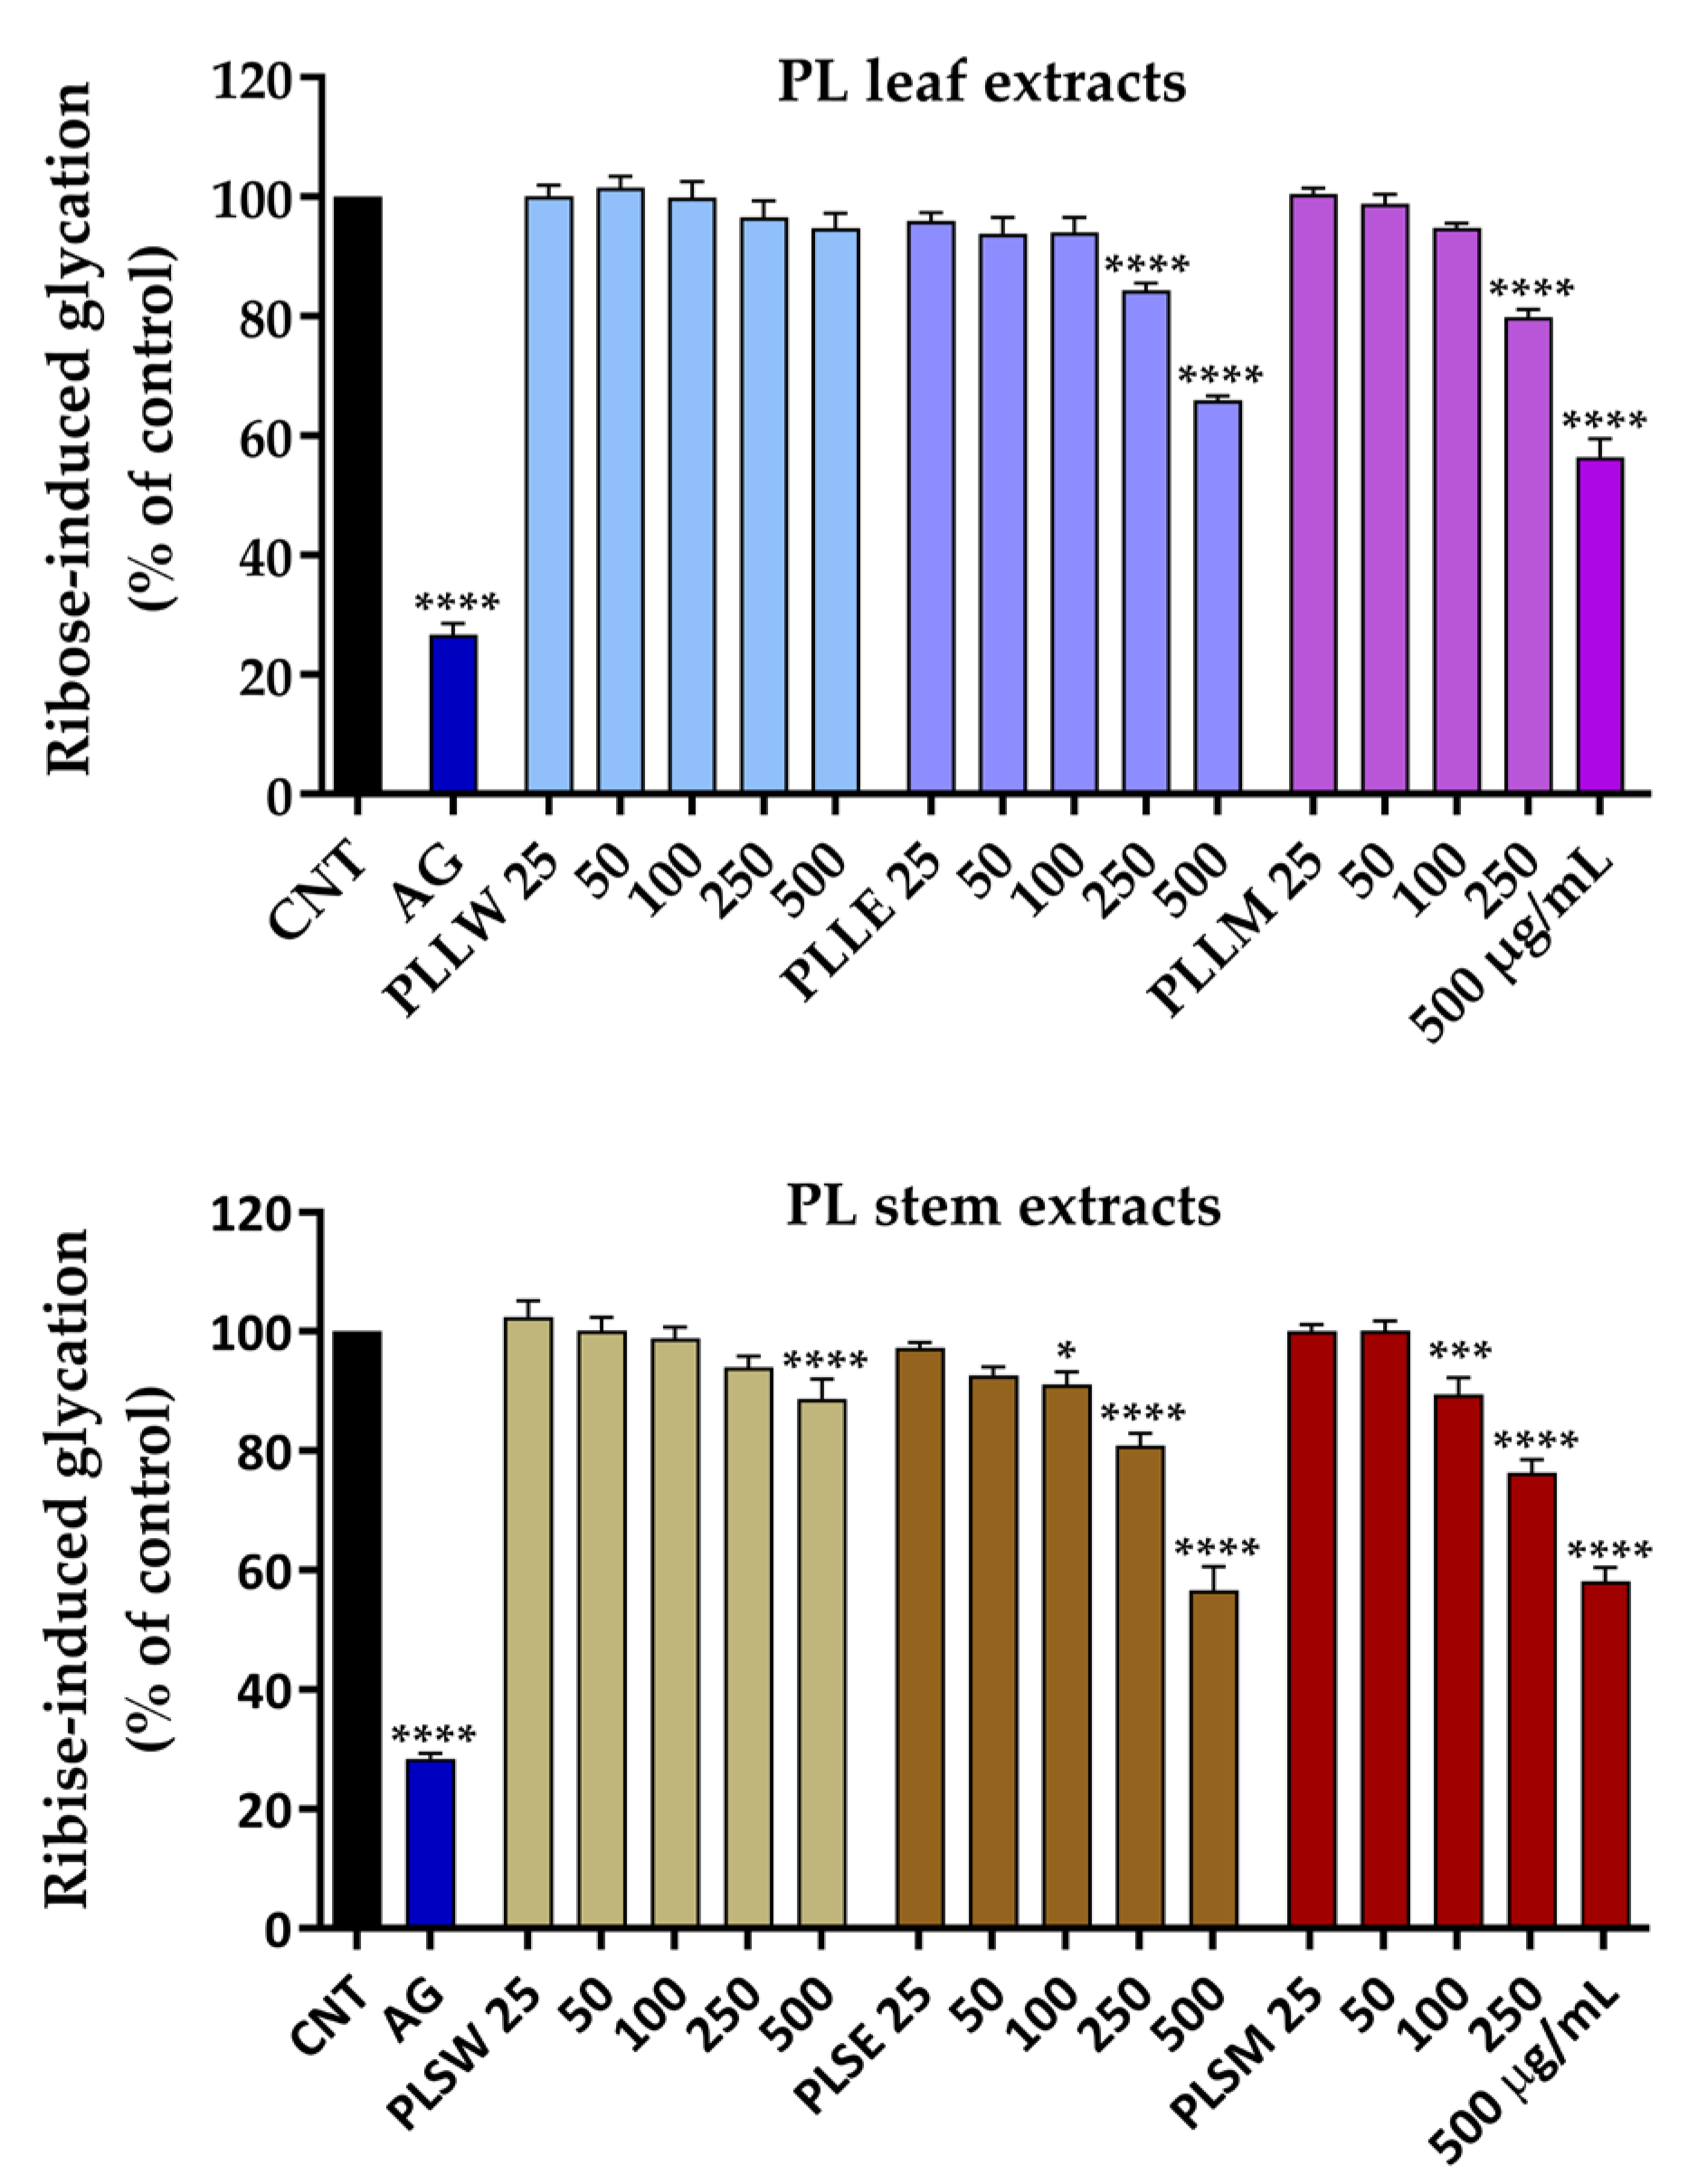
Persistent hyperglycemia and oxidative stress promote non-enzymatic glycation reactions, leading to the formation of AGEs. These processes significantly alter the structures and functions of plasma proteins, particularly serum albumin, which plays a crucial role in the pathogenesis of diabetic vascular complications [
19]. In the present study, a ribose-induced BSA glycation assay was employed to evaluate the antiglycation potential of
P. longifolia extracts, tested in a concentration range of 25-500 µg/mL. Both leaf and stem extracts demonstrated moderate antiglycation activity, which was sustained throughout the 14-day incubation period. Among the leaf extracts, the aqueous preparation (PLLW) showed no inhibitory activity. In contrast, the ethanol (PLLE) and methanol (PLLM) leaf extracts exhibited comparable glycation inhibition at the higher concentrations, with PLLM achieving a maximum inhibition of 44% while PLLE reached 35%. Interestingly, the stem extracts displayed unexpectedly higher potency; both PLSE and PLSM extracts demonstrated significant antiglycation activity starting from 100 µg/mL, reaching a maximum inhibition of 44% at the higher concentrations. This level of inhibition was comparable to that observed with the leaf extracts, suggesting that
P. longifolia stems may be an equally valuable source of antiglycation compounds. Previous studies have reported the antiglycation activity of various flavonoid fractions obtained from
P. longifolia leaves using fructose-BSA and methylglyoxal-BSA assays, showing significant inhibition of AGE formation from 5 to 25 mg/mL [
34].
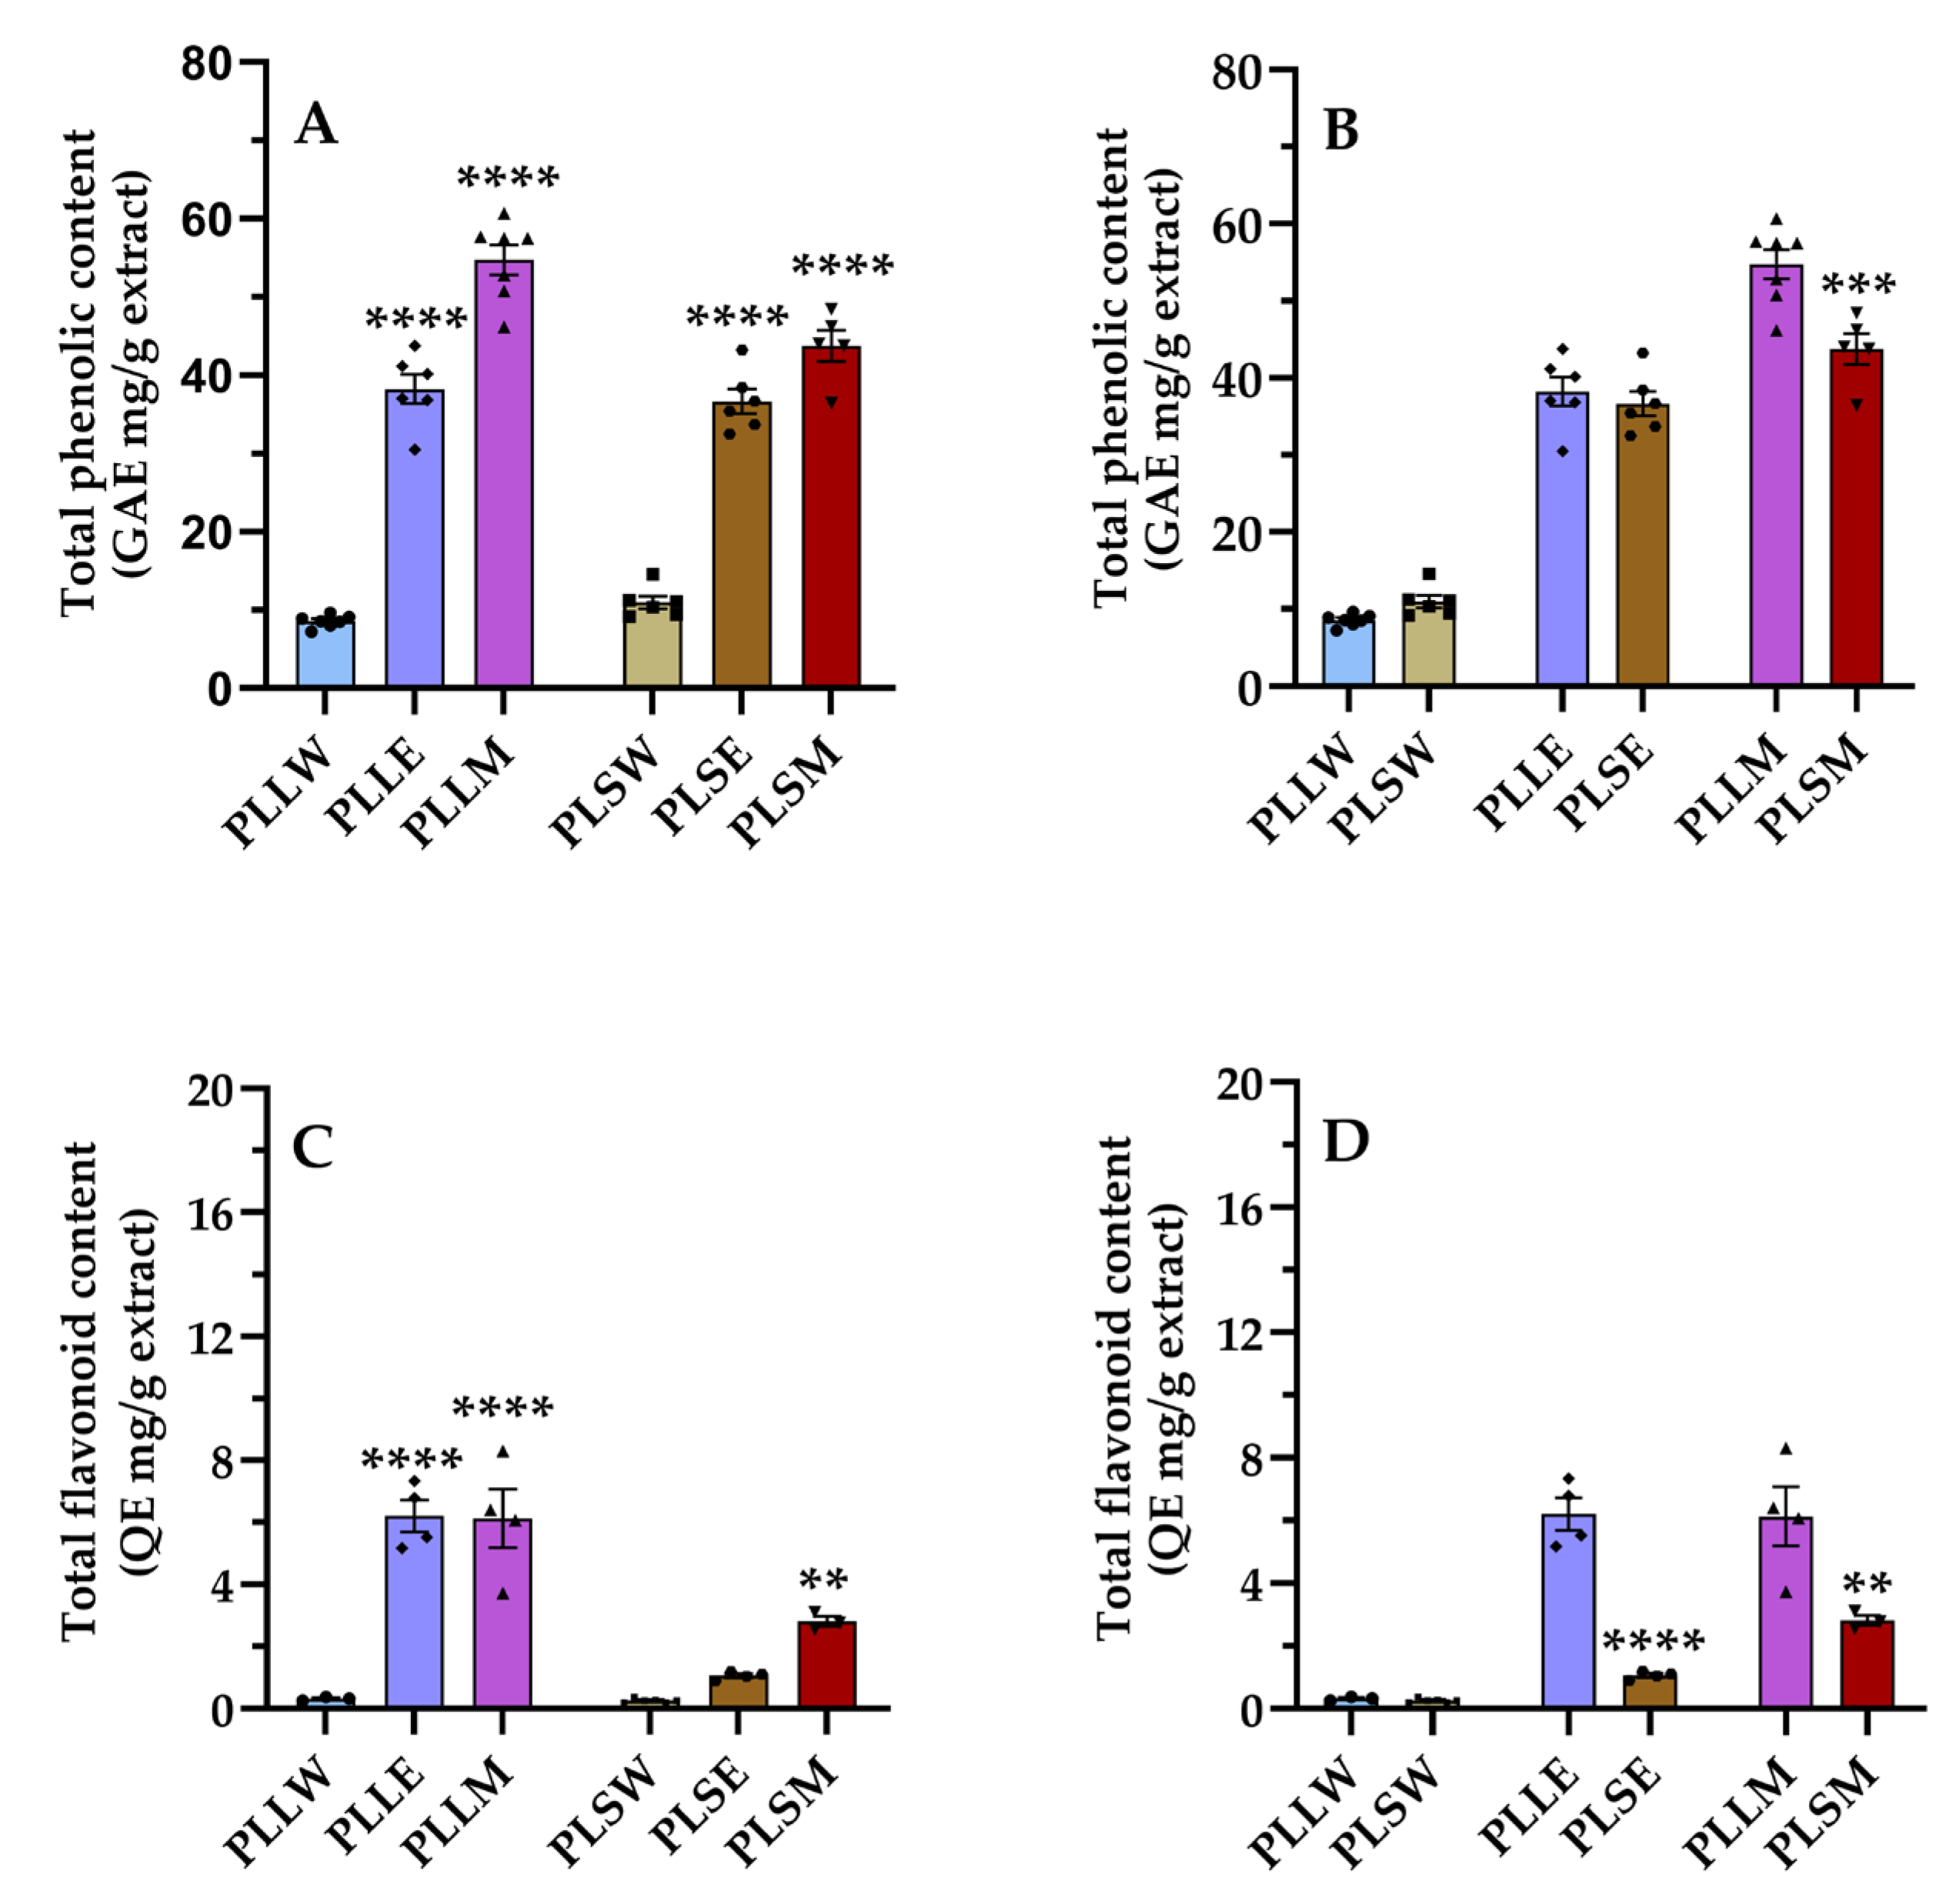
Indeed, the TPC and TFC assays revealed a substantial presence of phenols and flavonoids in the
P. longifolia extracts. The methanol leaf extract exhibited the highest TPC value (54.74 ± 1.90 mg GAE/g), while the flavonoid content was relatively low in all extracts. In PLLE and PLLM, the flavonoid content was 16.24% and 11.20% lower than the phenol content, respectively. A previous study reported the presence of phenols and flavonoids in methanolic extracts of
P. longifolia leaves, with values of TPC = 87.43 ± 1.23 mg GAE/g and TFC = 70.25 ± 3.12 mg catechin equivalent/g [
38]. The differences observed could be attributed to different extraction protocols.
In the current investigation, a consistent correlation between phenolic content and extraction solvent was observed for both leaf and stem extracts. Specifically, aqueous extracts (PLLW and PLSW) exhibited lower phenolic content, while methanolic extracts (PLLM and PLSM) exhibited higher levels. This can be explained by the fact that methanol can effectively extract both moderately polar and some less polar compounds, whereas highly polar water will primarily extract highly polar compounds. In general, the higher amount of phenolic and flavonoid compounds in methanol and ethanol extracts suggests that these solvents may be more effective in extracting these bioactive compounds from P. longifolia tissues. This information is valuable for optimizing extraction procedures in future studies and potential therapeutic applications.
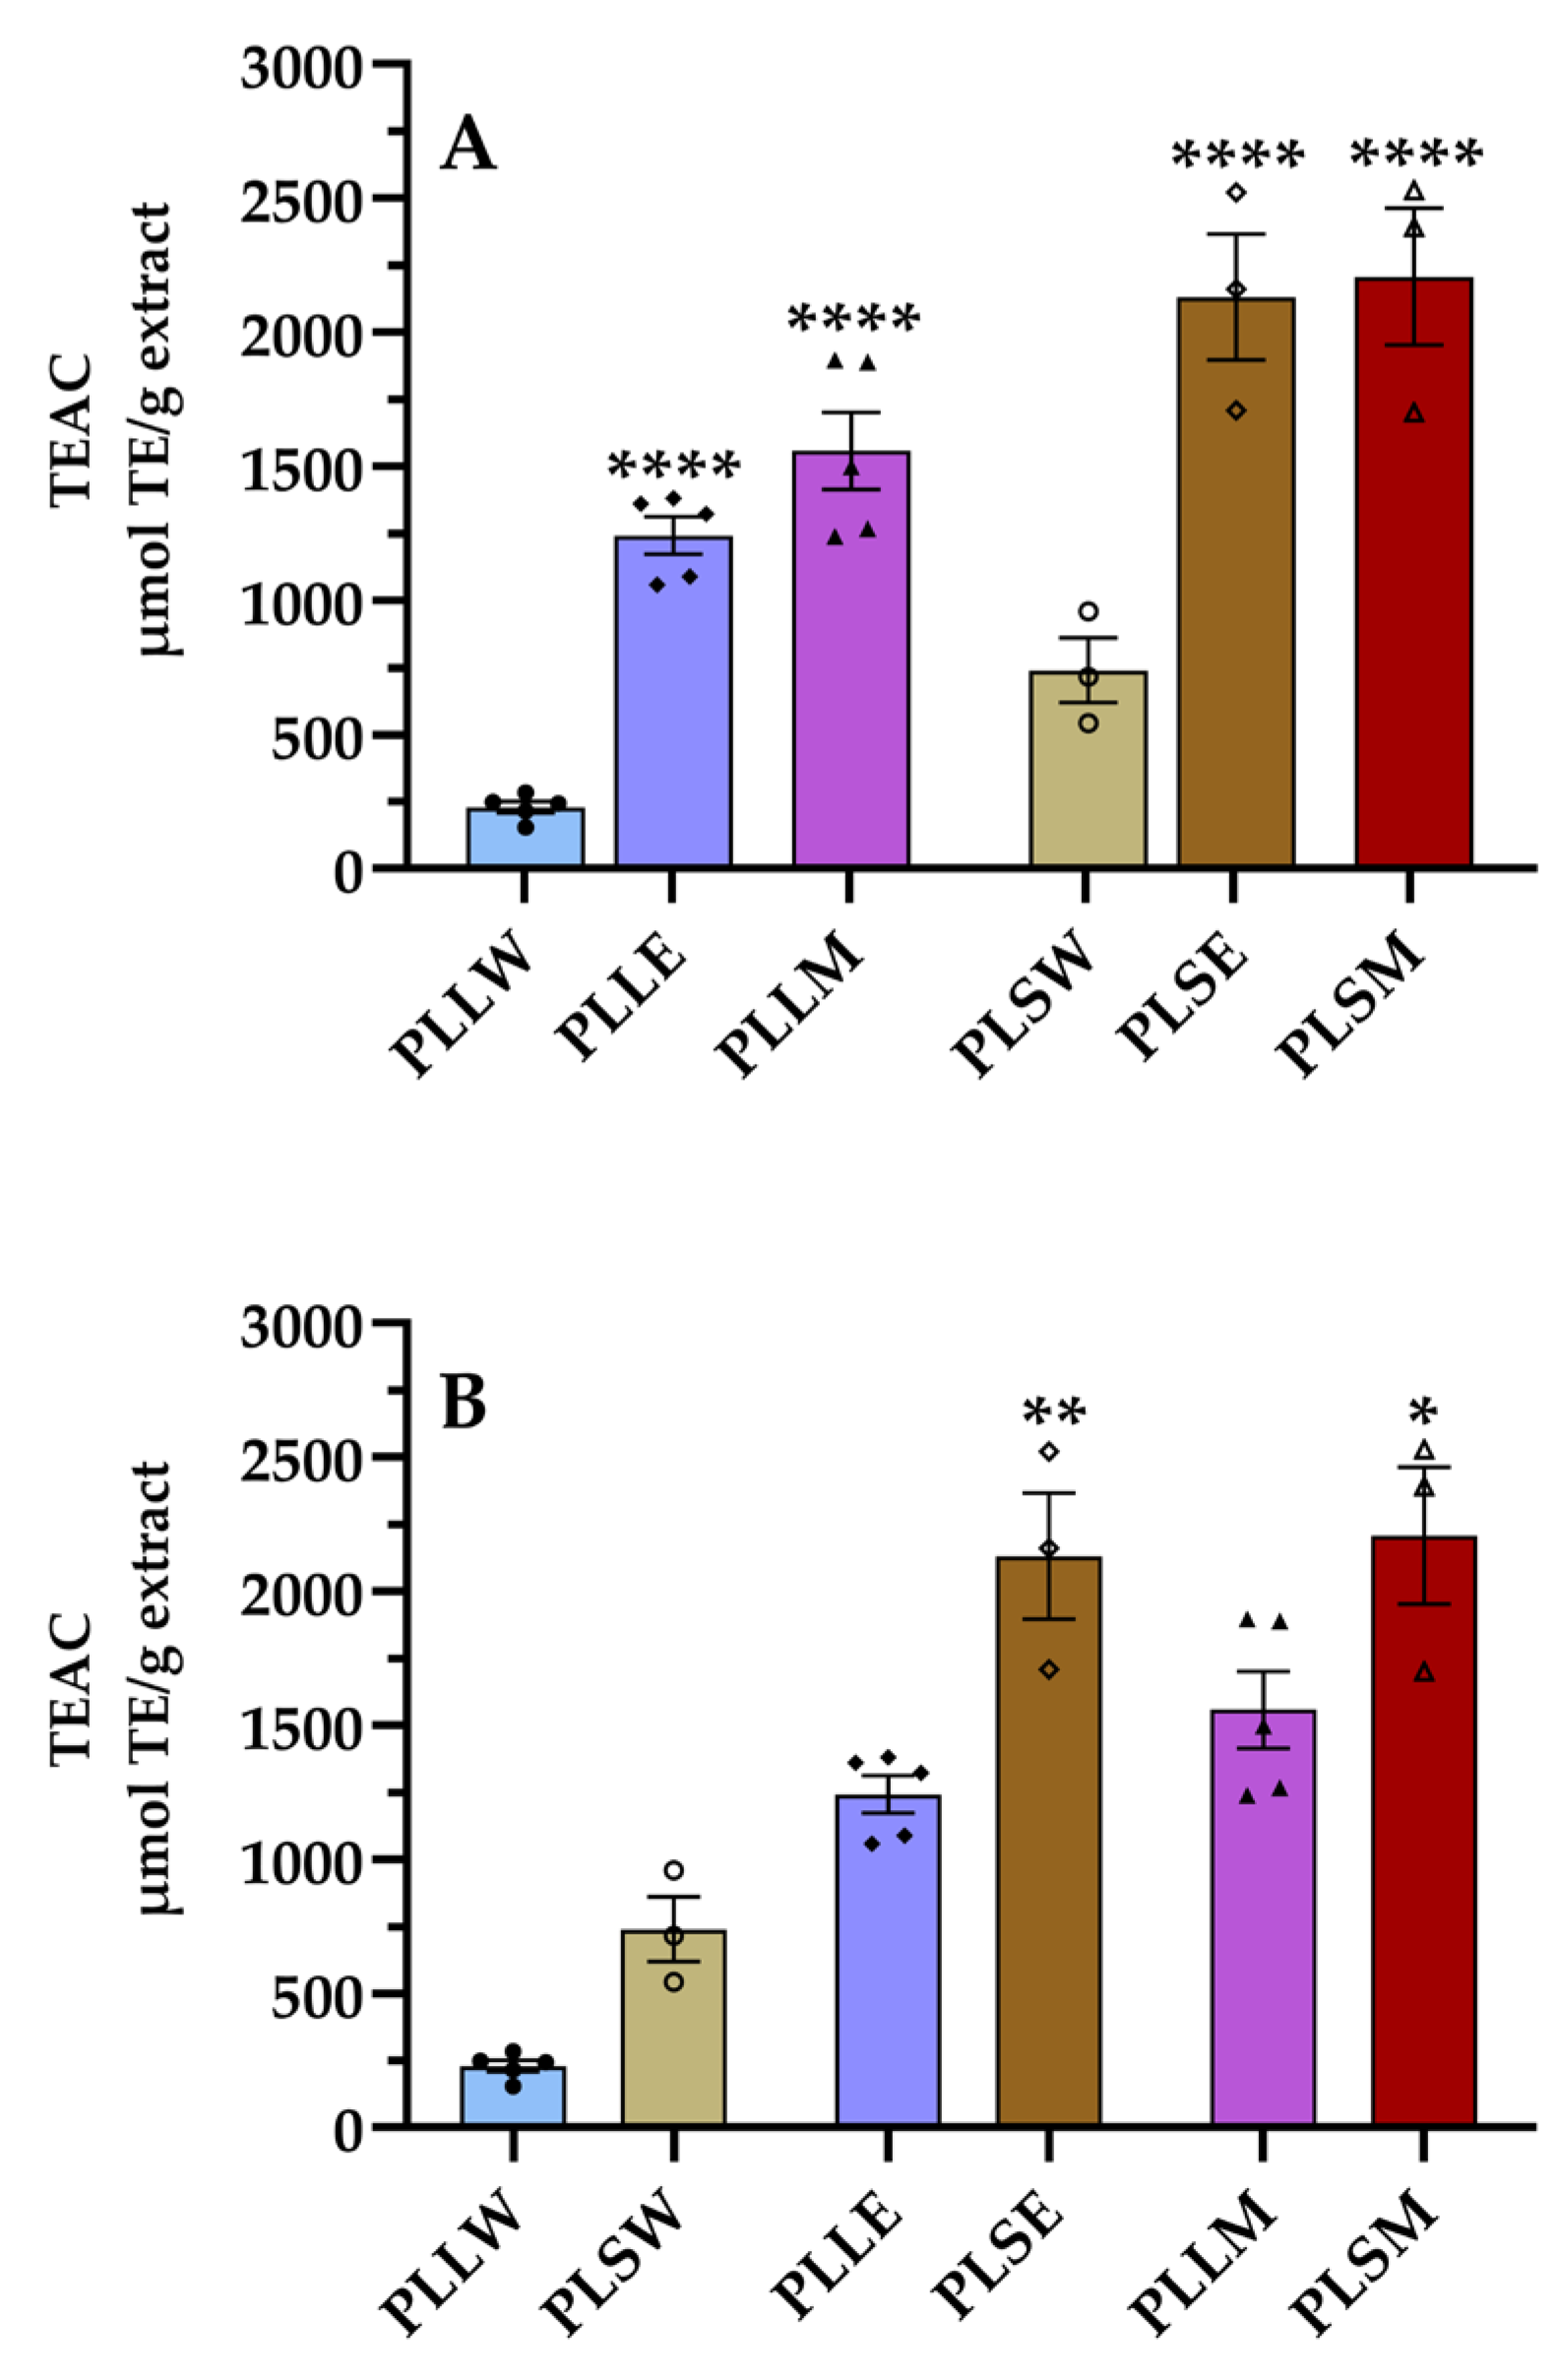
Moreover, the significant presence of phenolics and flavonoids in
P. longifolia extracts correlates with their antioxidant properties, as quantified by ORAC assay. This analysis revealed consistently higher TEAC values for stem extracts compared to leaf extracts across all the extraction solvents employed. Particularly, the TEAC/TPC ratios were markedly higher for stem extracts (50-67) than for leaf extracts (26-32,
Table 2), suggesting that the phenolic compounds in stem extracts have the highest antioxidant capacity. These findings expand previous research, which reported good antiradical activity of a methanol leaf extract using the DPPH assay [
38].
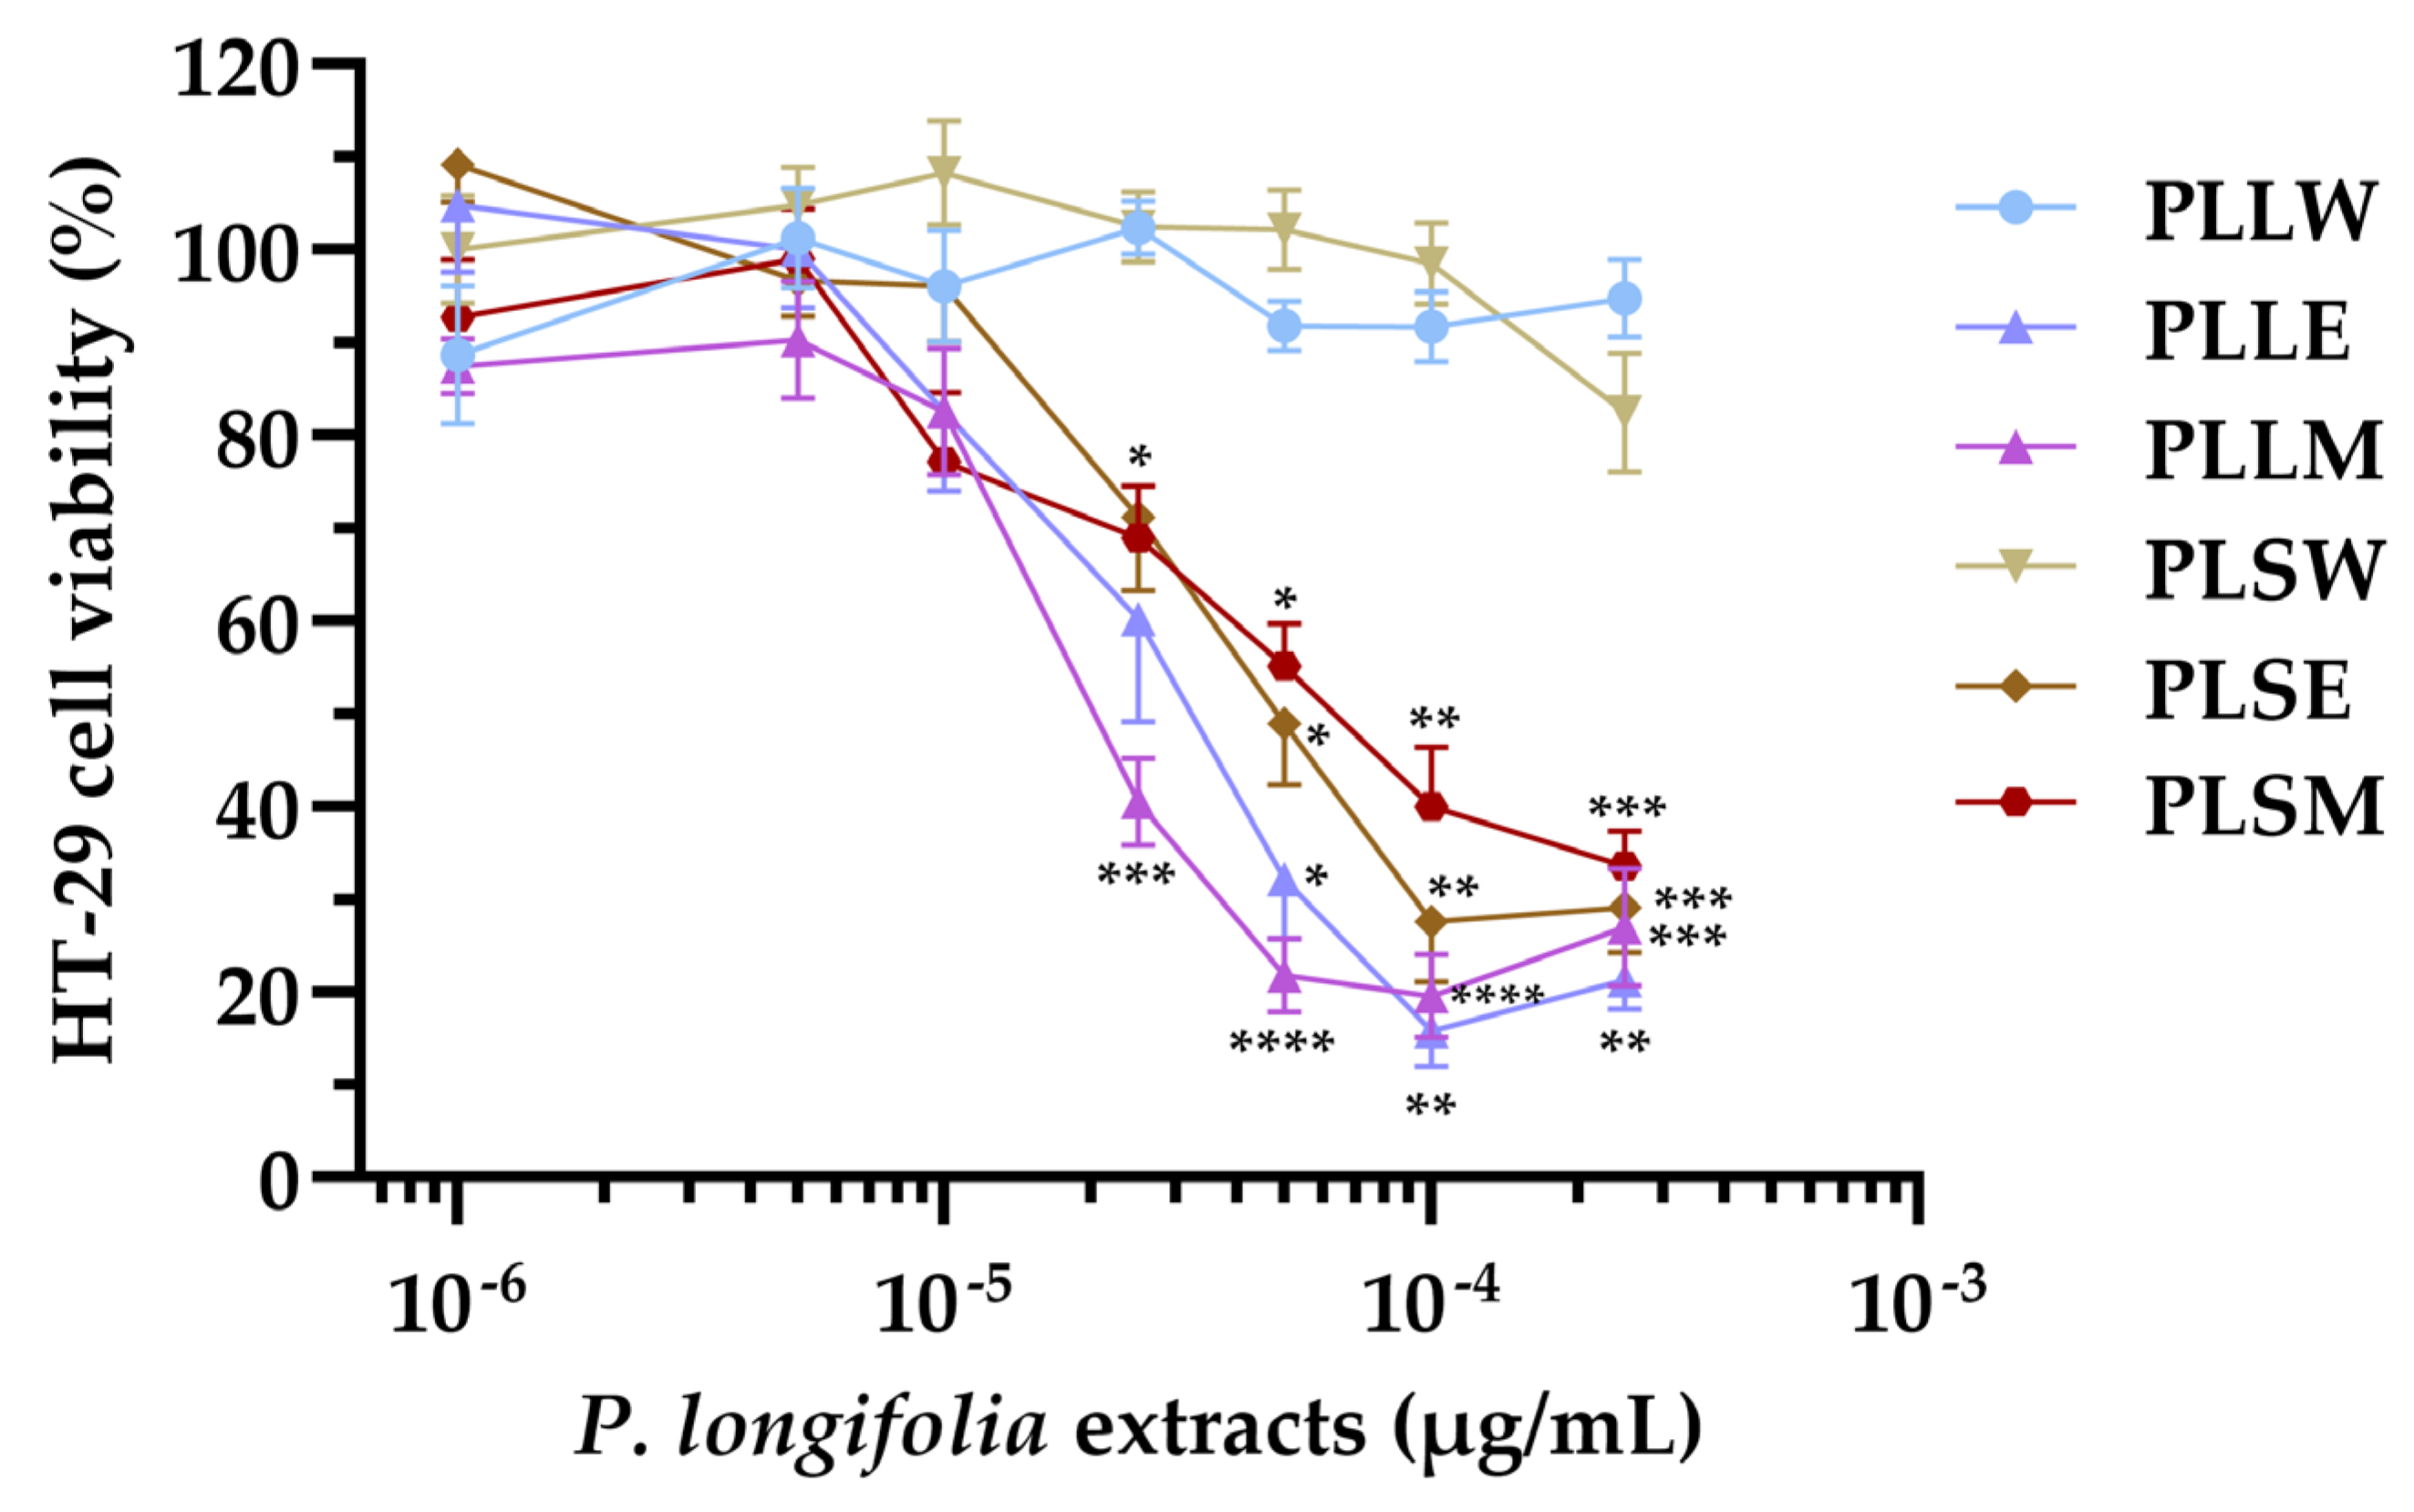
In this study, the cytotoxicity of P. longifolia extracts (1 to 250 µg/mL) on HT-29 cell viability was investigated using the MTT assay. The aqueous extracts of both leaves and stems (PLLW and PLSW) showed no significant effects on cell growth. However, the ethanol and methanol extracts caused moderate cytotoxicity at concentrations ≥ 25 µg/mL. The potency order of cell proliferation inhibition based on IC50 values was: PLLM ≥ PLLE > PLSE > PLSM >> PLLW ≥ PLSW. The extracts PLLE, PLSE, and PLLM exhibited absolute nH values slightly higher than 1 (ranging from 1.11 to 1.36), indicating a response proximal to a standard interaction between a compound and its cellular target. Otherwise, PLSM demonstrated a more gradual curve (|nH| = 0.76), suggesting a potentially more complex interaction with the cells. Based on the current results, the aqueous extracts of P. longifolia appear to have a very favorable safety profile, showing no significant cytotoxicity. Differently, the ethanol and methanol extracts had moderate cytotoxicity suggesting they may be used at lower doses. While these in vitro results provide initial insights, comprehensive toxicological studies, including in vivo experiments, are necessary to establish the safety of these extracts for potential phytotherapeutic applications.
Previous phytochemical studies on
P. longifolia have identified various constituents, including alkaloids (particularly clerodane diterpenes), terpenoids, steroids (β-sitosterol and stigmasterol) [
39,
40,
41,
42], flavonoids [
32,
33,
43], tannins, saponins, phenolic compounds, as gallic acid [
33,
44,
45]. Flavonoids like quercetin, rutin, and chrysin are known for their antioxidant and anti-inflammatory properties, while the isoflavone daidzein exhibits estrogenic and antidiabetic effects [
33,
43,
46]. In the current investigation, HPLC analysis revealed distinct chromatographic profiles for leaf and stem extracts. The aqueous extracts showed fewer constituents, while the ethanol and methanol extracts demonstrated a richer phytochemical composition. The analysis identified various phenolic compounds, and some flavonoids, with distribution varying by solvent and plant part. Gallic acid was exclusive to leaf methanol extract, while (+)-catechin and epicatechin were present in all alcoholic extracts. Caffeic and ellagic acids showed selective distribution, and baicalein was ubiquitous among extracts. The results emphasize the critical influence of extraction methods and plant tissue selection on phytochemical profiles, highlighting the importance of solvent choice in extracting bioactive compounds from
P. longifolia. The presence of these phenolic compounds and flavonoids, particularly catechins, epicatechins, and baicalein, may contribute to the observed α-glucosidase inhibition, antiglycation effects, and antioxidant activity of
P. longifolia extracts, as these compounds have been previously associated with such beneficial properties [
30,
47,
48].
The comparison between α-glucosidase inhibition and cytotoxicity data reveals that P. longifolia leaf extracts, particularly the methanol (PLLM) and ethanol (PLLE) extracts, show the most promise for potential applications. These extracts demonstrate high α-glucosidase inhibitory activity at concentrations below cytotoxic levels, indicating a favorable therapeutic window. PLLM exhibits the best balance of high inhibitory potency (IC50 = 7.31 µg/mL) and low cytotoxicity (observed at ≥ 25 µg/mL), making it the most promising candidate for further investigation. The aqueous leaf extract (PLLW) shows a good safety profile but lower potency, which might be suitable for applications requiring milder effects and in phytotherapy. In contrast, stem extracts appear less promising due to their lower inhibitory activity occurring at potentially cytotoxic concentrations. These findings suggest that future research should focus on leaf extracts, particularly PLLM and PLLE, to identify specific compounds responsible for the high α-glucosidase inhibitory activity. Additionally, extending these studies to in vivo models could provide valuable insights into the efficacy and safety of these extracts in more complex biological systems, potentially leading to the development of new plant-derived antidiabetic agents.
4. Materials and Methods
4.1. Chemical Reagents
Acarbose, aluminum chloride hexahydrate, aminoguanidine (AG), 2,2′-azobis(2-amidinopropane) dihydrochloride (AAPH), bovine serum albumin (BSA), fluorescein, Folin & Ciocalteu's phenol reagent, gallic acid, 3-(4,5-dimethylthiazol-2-yl)-2,5-diphenyl-2H-tetrazolium bromide (MTT), fetal bovine serum (FBS), α-glucosidase (EC 3.2.1.20, Saccharomyces cerevisiae type I, 10 U/mg protein), 6-hydroxy-2,5,7,8-tetramethylchroman-2-carboxylic acid (Trolox), p-nitrophenyl-α-D-glucopyranoside (p-NPG), quercetin, ribose, sodium azide, and sodium carbonate were purchased from Merck Life Science (Milano, Italy). HPLC standards, all other chemicals and solvents were of analytical grade or higher purity (≥ 95% for reference standards, Merck Life Science, Milano, Italy). Purified water was obtained using a Milli-Q water purification system (Millipore, Burlington, MA, USA).
4.2. Plant Extract Preparations
Leaves and stems of P. longifolia var. pendula were collected in June and September 2023 in Yaoundé (Centre Region, Cameroon). The plant material was identified at the National Herbarium of Cameroon by comparison with existing specimens and recorded under the code number 67475HNC.
The leaves and stems were dried at room temperature away from light, then ground into powder. For each extraction, 30 g of powder was used. Three solvents were employed: distilled water, ethanol, and methanol. Each powder sample was macerated in 0.5 L of solvent for 72 h at room temperature. This process was repeated three times to ensure a broad extraction of plant constituents. The resulting mixtures were filtered through Whatman No. 3 filter paper. Alcoholic extracts (methanol and ethanol) were rotary evaporated at 40 °C until complete solvent evaporation. The aqueous extracts were dried in an oven at 40 °C. Successively, the dried extracts were codified as PLLW, PLLE, PLLM (leaf extracts) and PLSW, PLSE, PLSM (stem extracts) for water, ethanol, and methanol, respectively. All extracts were stored at 4°C.
The final yields were as follows: leaf extracts: 6.40% (water), 9.40% (ethanol), and 11.48% (methanol); stem extracts: 1.27% (water), 2.64% (ethanol), and 2.44% (methanol). Samples of the dried extracts from leaves (PLL1-3) and stems (PLS5-7) are deposited at the Department of Pharmaceutical and Pharmacological Sciences, Laboratory of Pharmacognosy, University of Padova (Italy).
4.3. HPLC-DAD Analysis
The chromatographic analysis was performed using a Waters system (Milan, Italy) equipped with a 1525 binary pump and a 2998 photodiode array detector. Separation was achieved on a Symmetry C18 column (4.6 x 75 mm, 3.5 µm, Waters). The mobile phase consisted of (A) 0.1% v/v acetic acid in water, and (B) 0.1% v/v acetic acid in acetonitrile, delivered at 1 mL/min. The gradient elution profile was as follows: 0-1 min: 95% A; 1-7 min: 95-75% A; 7-9 min: 75-60% A; 9-12 min: 60-55% A; 12-14 min: 55-50% A; 14-18 min: 50-40% A; 18-23 min: 40-20% A; 23-28 min: 20-95% A; 28-30 min: 95% A.
P. longifolia ethanol and methanol extracts were dissolved in methanol (2 mg/mL), while P. longifolia water extracts were solubilized in 50:50 water-methanol. The samples were filtered through a 0.22 µm filter before injecting a volume of 20 µL. Chromatograms were recorded from 210-400 nm, with specific analysis at 254 nm (phenolic compounds) and 340 nm (flavonoids). The compound identification was based on retention time and spectral matching with standards.
Eleven reference compounds were used for identification: baicalein, caffeic acid, (+)-catechin, chlorogenic acid, ellagic acid, epicatechin, gallic acid, kaempferol, luteolin, quercetin, and rosmarinic acid. Data acquisition and analysis were performed using Breeze 2 software.
4.4. Yeast α-Glucosidase Inhibition Assay
The α-glucosidase inhibitory activity was assessed using a modified previously reported method [
49]. The assay was performed in triplicate in 96-well plates. Each well contained: 80 μL of sample solution or acarbose (positive control at 1.24 mM), 20 μL of α-glucosidase solution (0.5 U/mL). Extracts were tested at concentrations of 1, 5, 10, 25, 50 and 100 µg/mL. After 10 min of incubation at 37 °C, 100 μL of 4 mM
p-NPG substrate was added to start the reaction. Enzyme activity was monitored at 405 nm for 70 min using a PerkinElmer Victor Nivo microplate reader (Waltham, MA, USA). Results were expressed as a percentage of the maximum enzyme activity observed without inhibitors.
4.5. BSA Glycation Inhibition Assay
The antiglycation activity of
P. longifolia extracts was assessed using a ribose-induced BSA glycation assay [
50,
51]. BSA (10 mg/mL, pH 7.4) was incubated with 0.05 M ribose at 37 °C for 14 days in the dark, with or without the extracts at concentrations of 25, 50, 100, 250 and 500 µg/mL. Fluorescence intensity, indicative of AGE formation, was measured at excitation/emission wavelengths of 355/460 nm using a PerkinElmer Victor Nivo microplate reader (Waltham, MA, USA). Aminoguanidine (2.5 mM) served as positive control. Readings were taken on days 2, 5, 7, 9, 12, and 14 to monitor the glycation reaction over time. Results were expressed as a percentage of the maximum BSA fluorescence induced by ribose alone.
4.6. TPC and TFC Assays
The TPC assay, a colorimetric test for quantifying phenolic compounds in
P. longifolia extracts, was performed using transparent 24-well plates [
52]. Gallic acid solutions (25-500 µg/mL) and the extract solutions were prepared. Each well contained 1400 µL deionized water, 100 µL Folin-Ciocalteu reagent, and 20 µL of sample or gallic acid. After 8 min incubation, 300 µL saturated Na
2CO
3 solution was added to obtain an alkaline environment [
53]. After 2 h of incubation at room temperature, absorbance was measured at 760 nm using a PerkinElmer Victor Nivo™ plate reader (Waltham, MA, USA). Total phenolic content was determined using a gallic acid calibration curve and expressed as mg gallic acid equivalents (GAE) per g of dry extract.
The TFC assay was performed in 24-well plates using a quercetin calibration series (6.25-100 µg/mL). Each well contained 250 µL of quercetin standard or the sample extract solution, 1130 µL methanol, and 120 µL AlCl3 (25% w/v). After 15 min incubation at room temperature, absorbance was measured at 410 nm using a PerkinElmer Victor Nivo™ plate reader (Waltham, MA, USA). Blank-subtracted absorbance values were plotted against quercetin concentrations to create a calibration curve. Total flavonoid content was determined by interpolation and expressed as mg quercetin equivalents (QE) per g of extract.
4.7. ORAC Assay
The ORAC assay was used to evaluate the ability of the extracts to counteract the peroxyl radical-induced oxidative reactions [
54]. Fluorescein (0.08 µM) was mixed with the sample solutions, PBS (blank), and Trolox (6.25-50 µM, reference standard). Samples were incubated at 37 °C for 10 minutes. The oxidative reaction was initiated by adding 0.15 M AAPH. Fluorescence decay was monitored for 70 min at 37 °C using a PerkinElmer Victor Nivo microplate reader (Waltham, MA, USA). ORAC values were expressed as Trolox Equivalent Antioxidant Capacity (TEAC, µmol TE/g of extract).
4.8. HT-29 Cell Viability Assay
Cell viability was determined using the MTT assay [
55]. Human Caucasian colon adenocarcinoma (HT-29) cells were cultured in RPMI 1640 medium supplemented with 10% FBS and maintained in an incubator at 37 °C (5% CO
2) until reaching confluence in Petri dishes (
Figure S3). Following trypsinization for detachment, the HT-29 cells were seeded in 96-well plates (5,000 cells per well) and allowed to adhere overnight. The cultures were then treated with each
P. longifolia extract at 1, 5, 10, 25, 50, 100, and 250 µg/mL, or with medium alone (control). After 24 h, the cells were washed with RPMI 1640 medium and subsequently treated with 0.05 mg/mL MTT for 4 hours. During this period, viable cells reduce the tetrazolium reagent to produce purple formazan crystals, which were then solubilized with 2-propanol (
Figure S4). Finally, absorbance was measured using a PerkinElmer Victor Nivo microplate reader (Waltham, MA, USA) at a wavelength of 570 nm. The mean absorbance (Abs) was calculated for each sample concentration and for the controls. The percentage of cell viability in the presence of various sample concentrations was calculated relative to the control.
4.9. Data Analysis and Statistical Methods
Data are presented as mean ± standard error of the mean (SEM) from 3-7 independent experiments. Sigmoid curve fitting and statistical evaluations were performed using GraphPad Prism 10.2.3 (San Diego, CA, USA). The half-maximum inhibitory concentration (IC
50), minimum effective concentration (MEC, the lowest concentration showing significant inhibition,
p<0.05), and Hill slope coefficient (nH) were calculated by nonlinear regression [
18,
56,
57]. The statistical significance between the control and each treatment was evaluated using the Student's t-test, while comparisons among three or more groups were performed with one-way ANOVA, followed by Tukey's multiple comparison test. Statistical significance was set at
p < 0.05.
Figure 1.
Effects of aqueous (W), ethanol (E), and methanol (M) extracts obtained from leaves and stems of Polyalthia longifolia, tested at concentrations ranging from 1 to 100 µg/mL, on α-glucosidase activity after 70 min of incubation. AC: acarbose (800 µg/mL, positive control). Data are presented as mean ± SEM of 5 triplicate experiments. *: p < 0.05; **: p < 0.01; ***: p < 0.001; ****: p < 0.0001 vs control (CNT). PLLW: P. longifolia leaf water extract; PLLE: P. longifolia leaf ethanol extract; PLLM: P. longifolia leaf methanol extract; PLSW: P. longifolia stem water extract; PLSE: P. longifolia stem ethanol extract; PLSM: P. longifolia stem methanol extract.
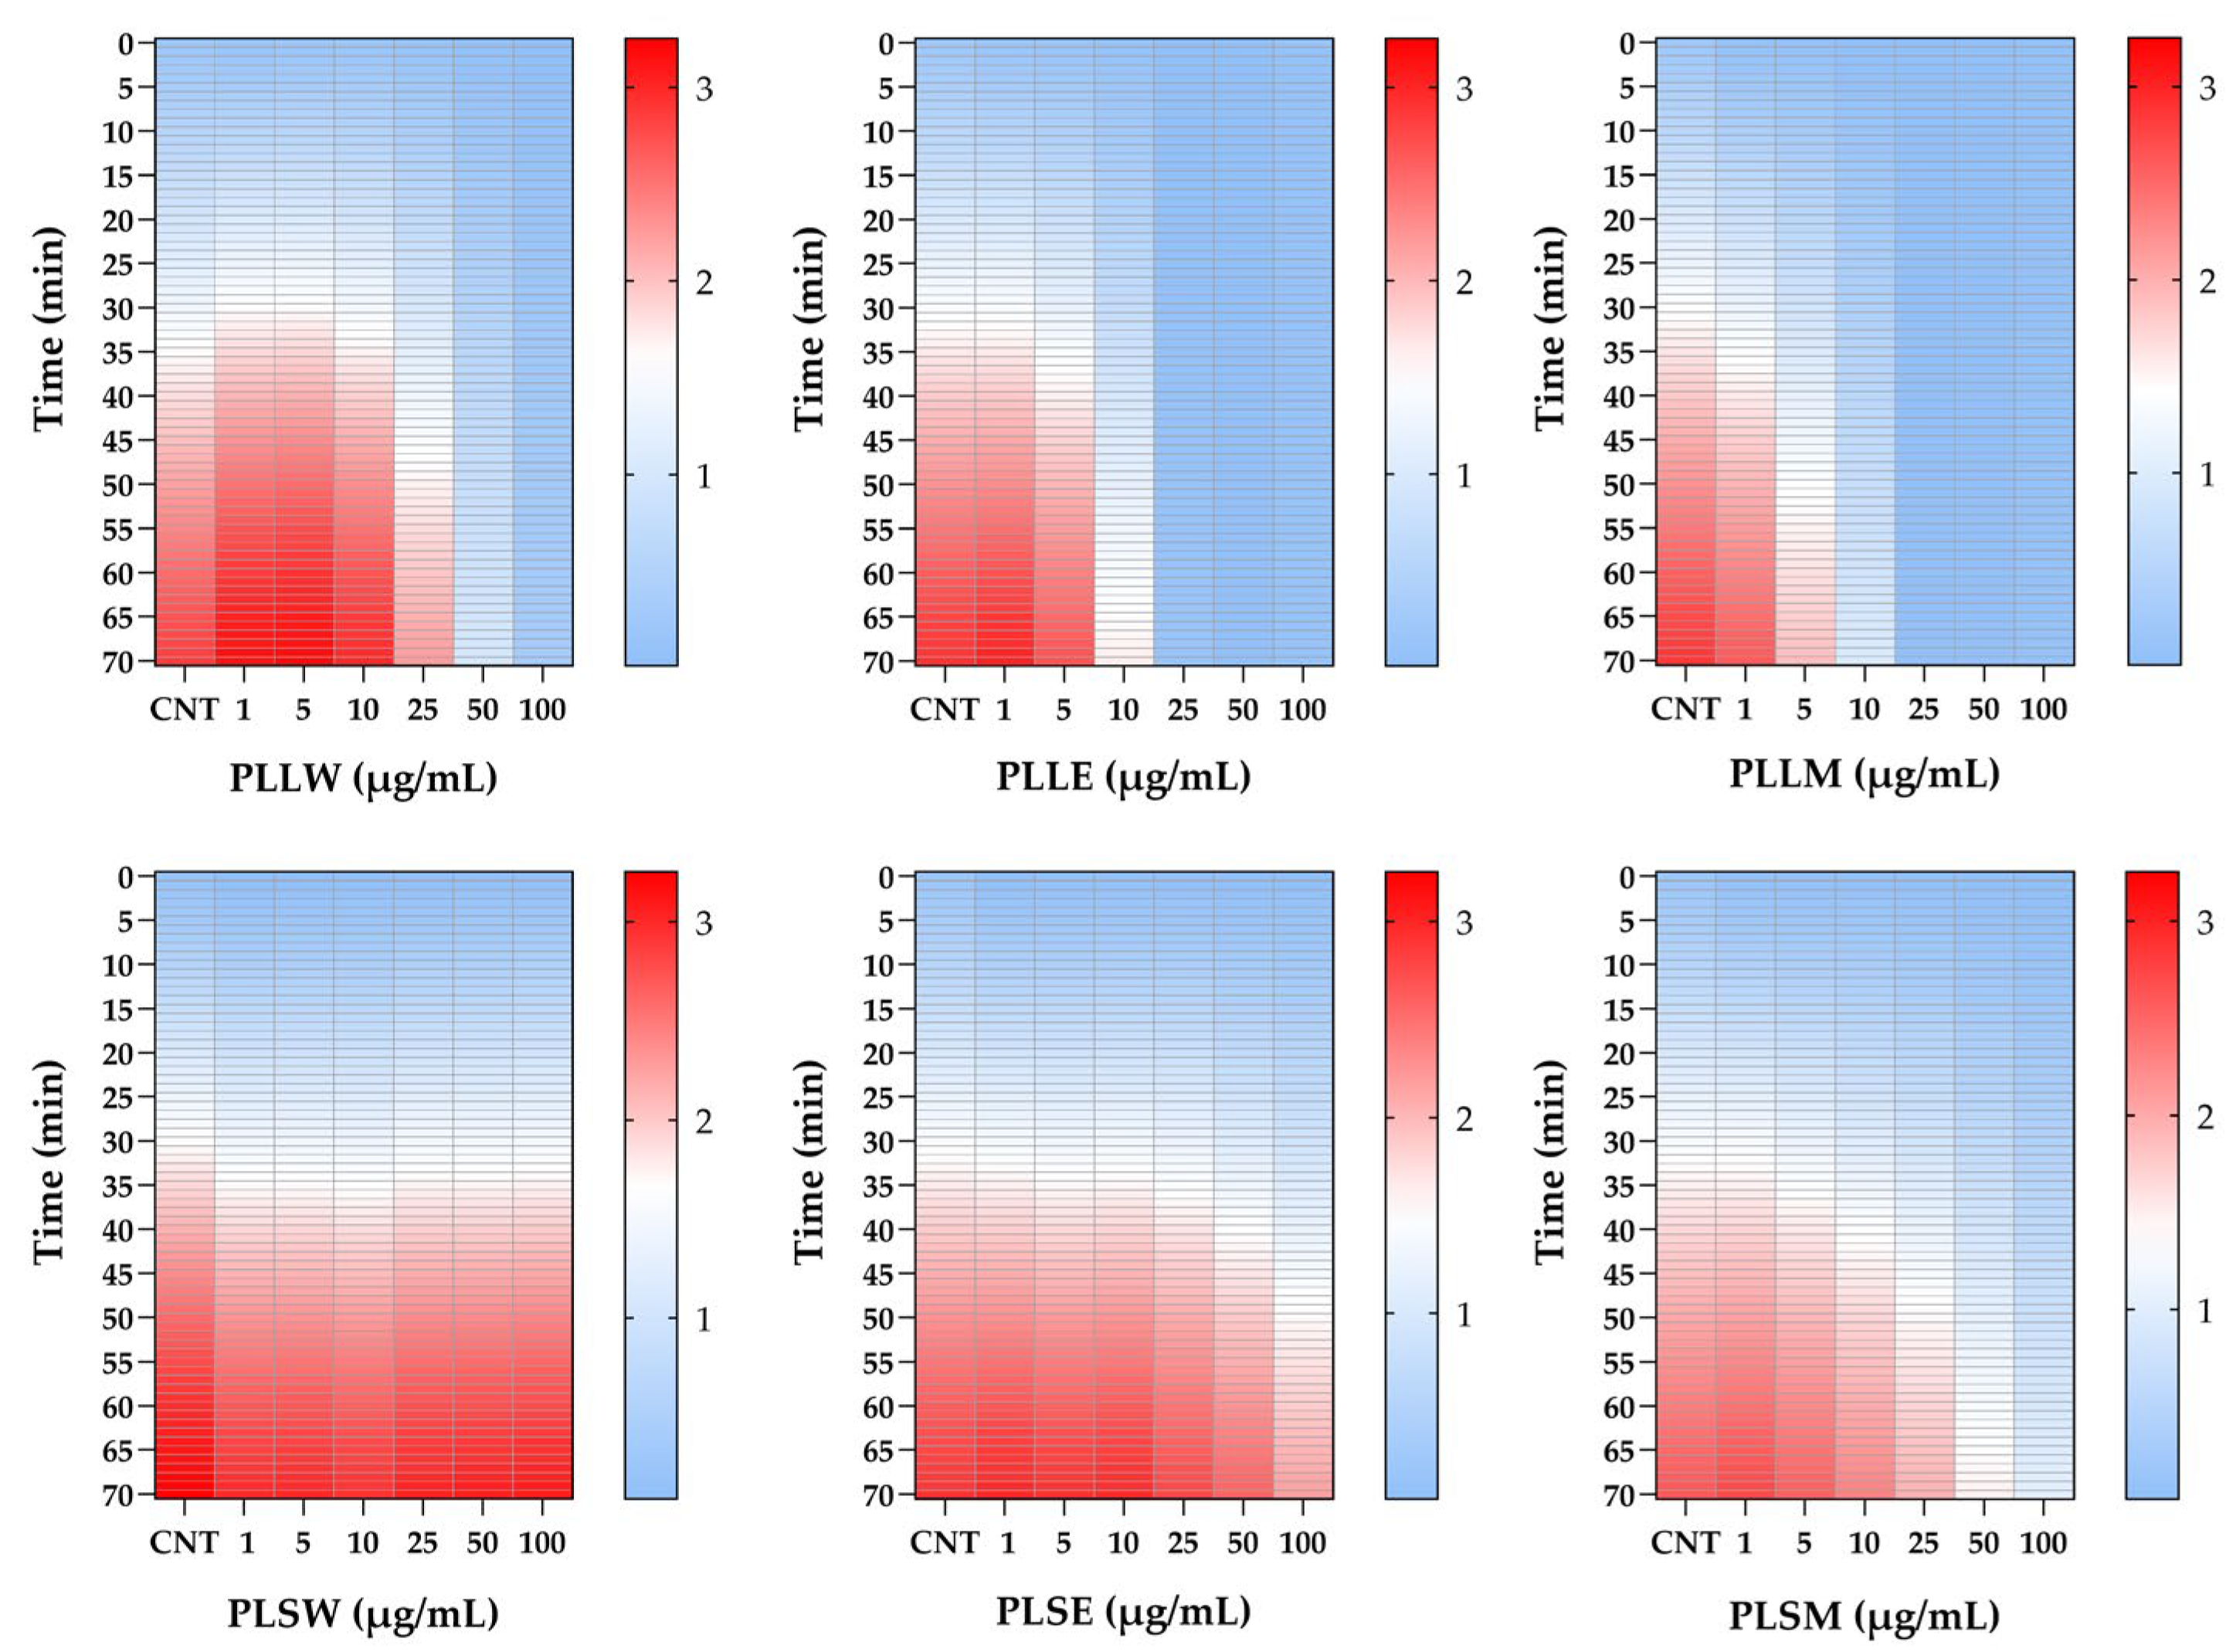
Figure 2.
Heatmap analysis of α-glucosidase activity inhibited by Polyalthia longifolia extracts over a 70-minute period, in the absence (CNT) and in the presence of leaf and stem extracts, at concentrations from 1 to 100 μg/mL. Color intensity represents enzyme activity levels: red indicates higher enzyme activity, white represents very low activity, while lighter blue shows no activity. The heatmap demonstrates the superior inhibitory potency of leaf extracts compared to stem extracts and allows for comparison of inhibitory effects across different extracts, concentrations, and time points. PLLW: P. longifolia leaf water extract; PLLE: P. longifolia leaf ethanol extract; PLLM: P. longifolia leaf methanol extract; PLSW: P. longifolia stem water extract; PLSE: P. longifolia stem ethanol extract. PLSM: P. longifolia stem methanol extract.
Figure 3.
The slope of inhibition vs the logarithmic concentrations of each extract (Hill plot) allows determination of the Hill coefficient (nH) and provides insights into the cooperativity of enzyme inhibition. PLLW: P. longifolia leaf water extract; PLLE: P. longifolia leaf ethanol extract; PLLM: P. longifolia leaf methanol extract; PLSW: P. longifolia stem water extract; PLSE: P. longifolia stem ethanol extract; PLSM: P. longifolia stem methanol extract.
Figure 4.
Effects of aqueous (W), ethanol (E), and methanol (M) extracts obtained from leaves and stems of Polyalthia longifolia, tested at concentrations ranging from 25 to 500 µg/mL, on ribose-induced BSA glycation after 7-day incubation at 37 °C. Data are presented as mean ± SEM of 3 triplicate experiments. *: p < 0.05; ***: p < 0.001; ****: p < 0.0001 vs control (CNT). AG: aminoguanidine (2.5 mM, positive control). PLLW: P. longifolia leaf water extract; PLLE: P. longifolia leaf ethanol extract; PLLM: P. longifolia leaf methanol extract; PLSW: P. longifolia stem water extract; PLSE: P. longifolia stem ethanol extract; PLSM: P. longifolia stem methanol extract.
Figure 5.
Phenolic (A and B) and flavonoid (C and D) contents of Polyalthia longifolia extracts. Panels A and C show the total phenolic content (TPC) and total flavonoid content (TFC) grouped by plant tissue type (leaf and stem). Panels B and D show TPC and TFC, grouped by solvent type (water, ethanol, methanol). Data are presented as mean ± SEM of 5–7 duplicate experiments. GAE: gallic acid equivalents; QE: quercetin equivalents. ****: p < 0.0001 vs P. longifolia aqueous extracts (A, C); **: p < 0.01 PLSM vs PLSW (C); ****: p < 0.0001 PLSE vs PLLE (D); **: p < 0.01 PLSM vs PLLM (D). PLLW: P. longifolia leaf water extract; PLLE: P. longifolia leaf ethanol extract; PLLM: P. longifolia leaf methanol extract; PLSW: P. longifolia stem water extract; PLSE: P. longifolia stem ethanol extract; PLSM: P. longifolia stem methanol extract.
Figure 6.
Antiradical activity of aqueous (W), ethanol (E), and methanol (M) extracts obtained from leaves and stems of Polyalthia longifolia determined using the oxygen radical absorbance capacity (ORAC) assay. Panel A shows a comparison based on tissue types, while Panel B compares extraction solvents. PLLW: P. longifolia leaf water extract; PLLE: P. longifolia leaf ethanol extract; PLLM: P. longifolia leaf methanol extract; PLSW: P. longifolia stem water extract; PLSE: P. longifolia stem ethanol extract; PLSM: P. longifolia stem methanol extract. TEAC: Trolox equivalent antioxidant capacity. Data are presented as mean ± SEM of 3–5 duplicate experiments. ****: p < 0.0001 vs P. longifolia aqueous extracts; **: p < 0.01 vs PLLE; *: p < 0.05 vs PLLM.
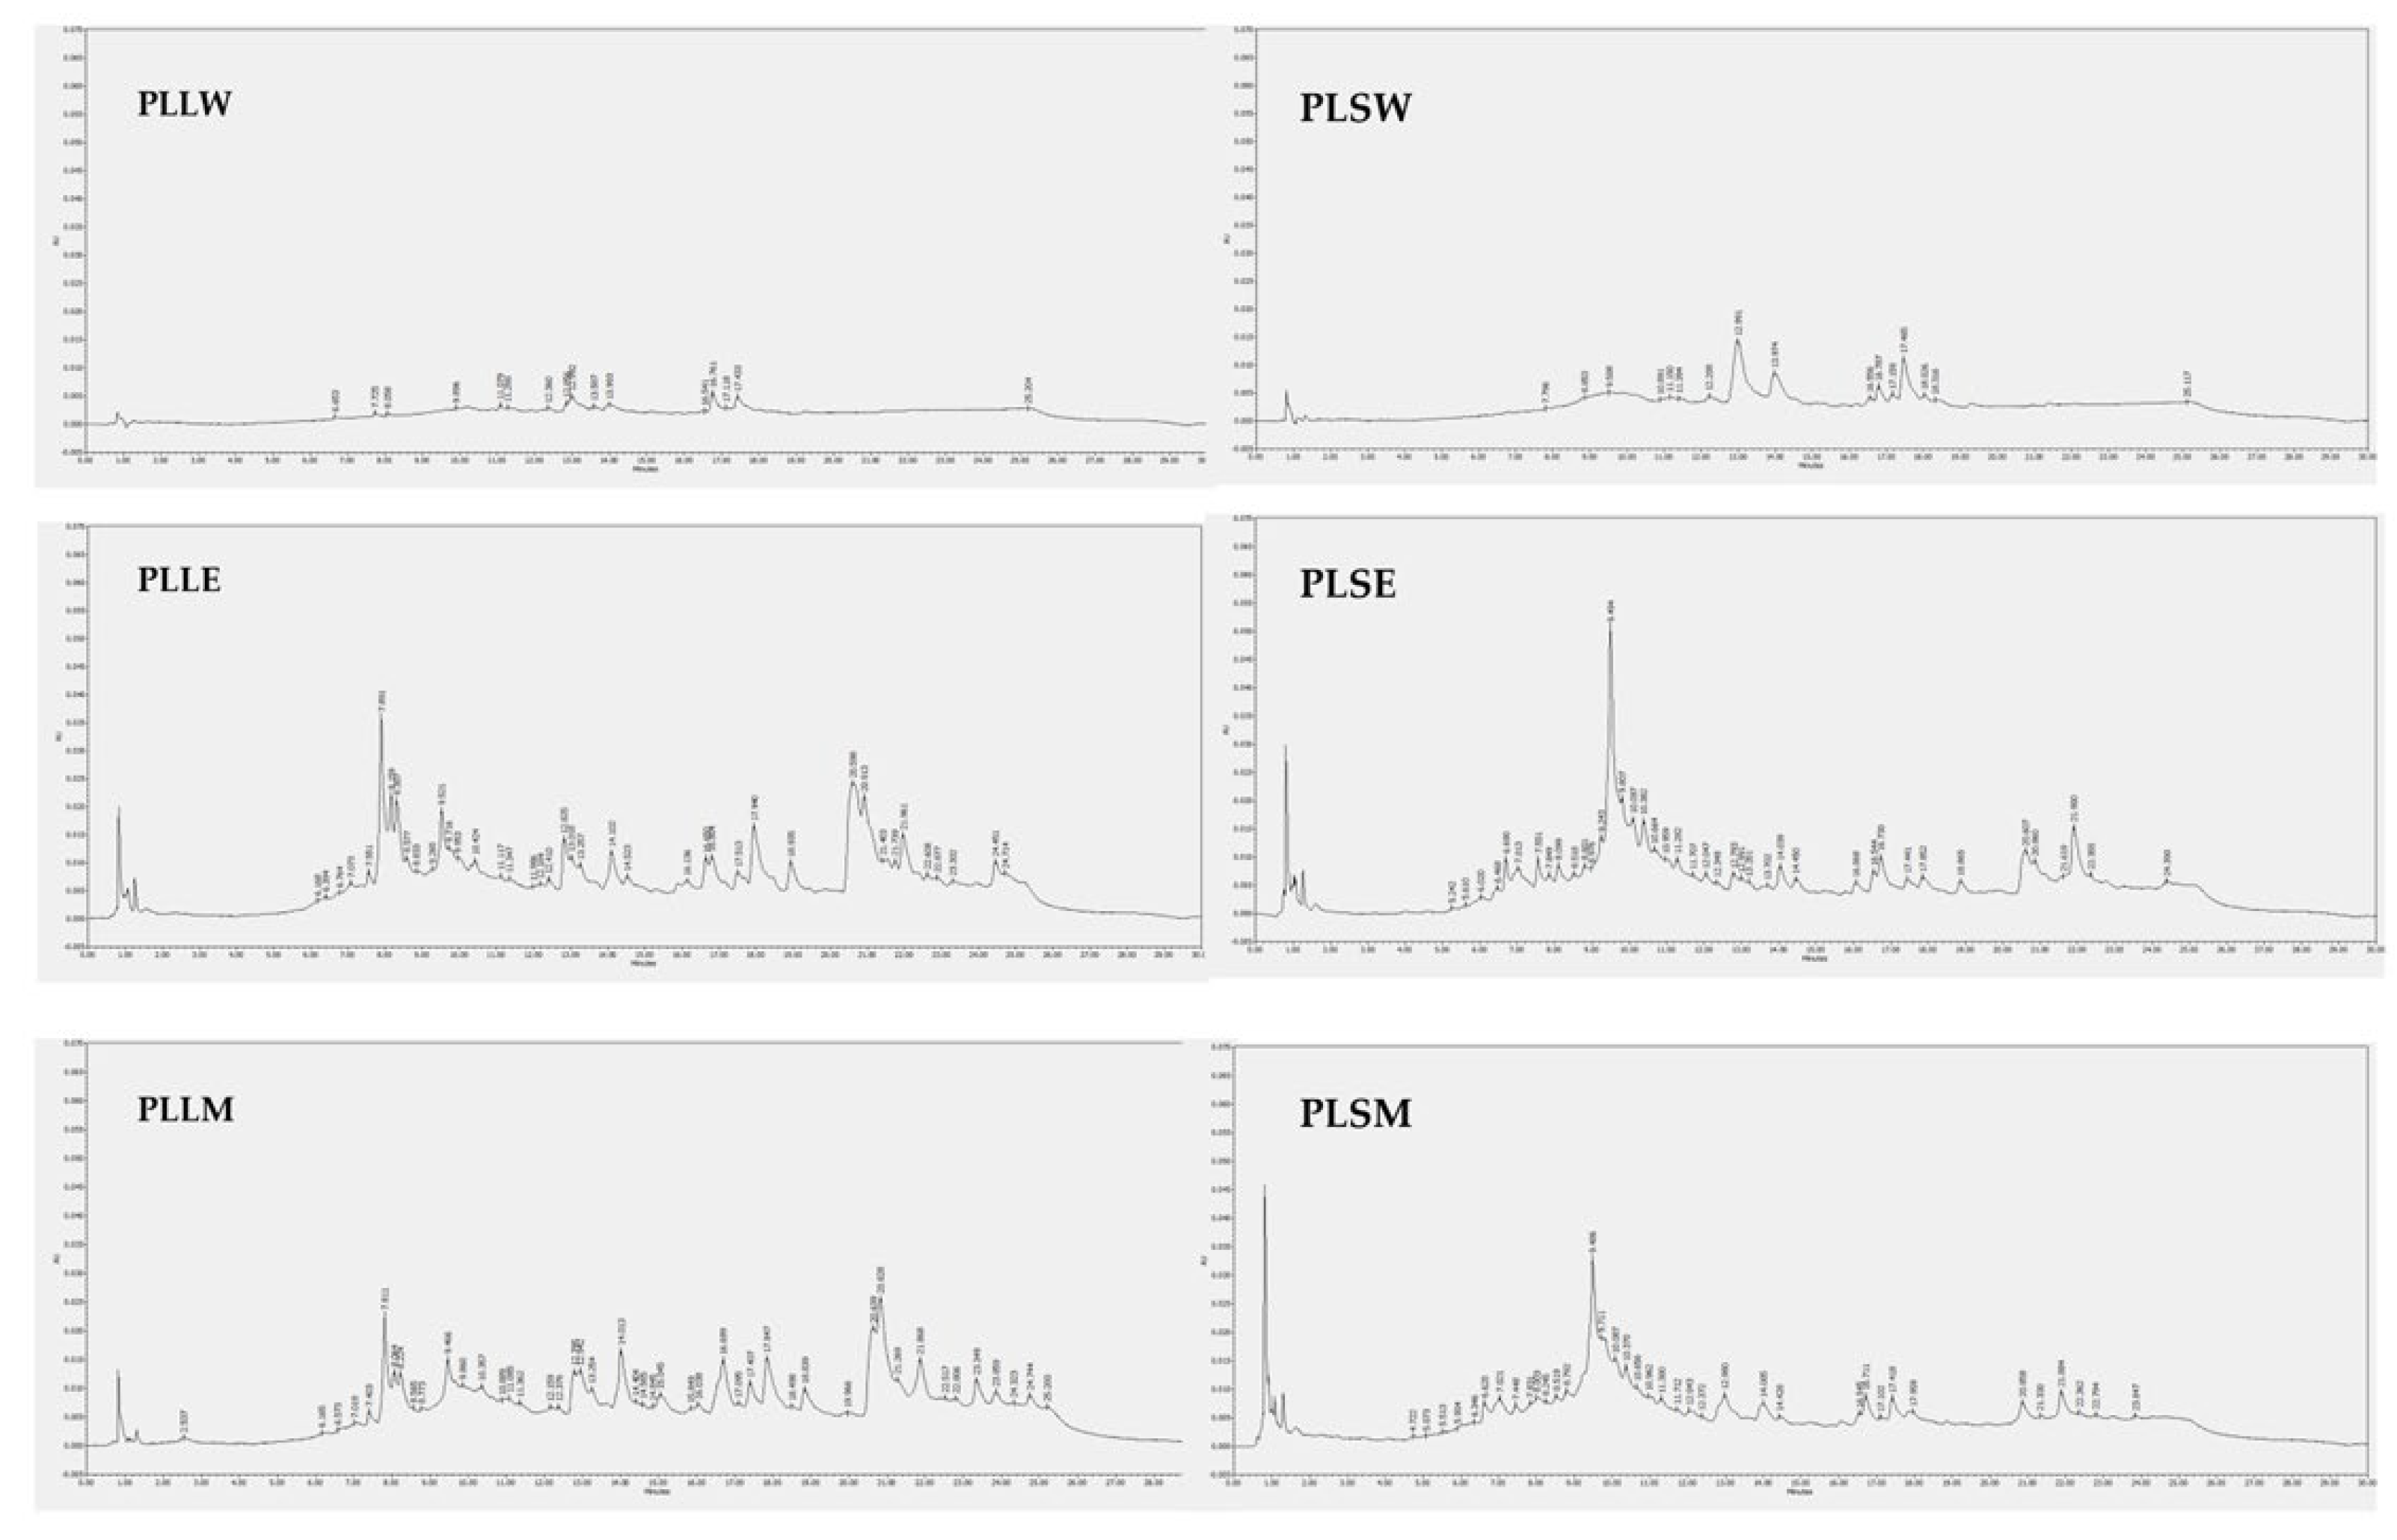
Figure 8.
HPLC-DAD chromatograms of Polyalthia longifolia extracts. The chromatograms were obtained from the injection of 20 μg/mL of each extract dissolved in methanol, except for the water extracts of leaves and stems, which were solubilized in 50:50 water-methanol. Detection is reported at 254 nm. PLLW: P. longifolia leaf water extract; PLLE: P. longifolia leaf ethanol extract; PLLM: P. longifolia leaf methanol extract; PLSW: P. longifolia stem water extract; PLSE: P. longifolia stem ethanol extract; PLSM: P. longifolia stem methanol extract.
Table 1.
α-Glucosidase inhibition obtained with P. longifolia leaf and stem extracts.
Table 1.
α-Glucosidase inhibition obtained with P. longifolia leaf and stem extracts.
|
P. longifolia extract |
α-Glucosidase inhibition
IC50 µg/mL (95% CI) |
α-Glucosidase inhibition
nH |
Primary Effect |
| PLLW |
36.87 (34.72-39.52) |
2.44 |
Weak inhibition |
| PLLE |
10.44 (9.66-11.32) |
3.02 |
Potent inhibition |
| PLLM |
7.31 (6.61-8.21) |
2.65 |
Most potent inhibition |
| PLSW |
-- |
-- |
No inhibition |
| PLSE |
≥100 |
-- |
Very weak inhibition |
| PLSM |
≥100 |
-- |
Very weak inhibition |
Table 2.
Total phenolic and flavonoid contents, and oxygen radical absorbance capacity detected in the leaf and stem Polyalthia longifolia extracts.
Table 2.
Total phenolic and flavonoid contents, and oxygen radical absorbance capacity detected in the leaf and stem Polyalthia longifolia extracts.
| |
PLLW |
PLLE |
PLLM |
PLSW |
PLSE |
PLSM |
TPC
GAE mg/g |
8.57 ± 0.30 |
38.24 ± 1.88**** |
54.74 ± 1.90**** |
10.98 ± 0.79 |
36.65 ± 1.57**** |
43.76 ± 2.01**** |
TFC
QE mg/g |
0.32 ± 0.03 |
6.21 ± 0.51**** |
6.13 ± 0.94**** |
0.26 ± 0.03 |
1.06 ± 0.06 |
2.81 ± 0.16** |
TFC/TPC
(%) |
3.73 |
16.24 |
11.20 |
2.37 |
2.89 |
6.42 |
TEAC
µmol TE /g |
228 ± 22 |
1242 ± 70*** |
1558 ± 144**** |
739 ± 121 |
2130 ± 235**** |
2207 ± 256**** |
TEAC/TPC
µmol TE/mg GAE |
26.60 |
32.48 |
28.46 |
67.30 |
58.12 |
50.43 |
Table 4.
Identification of compounds in Polyalthia longifolia leaf and stem extracts detected by HPLC-DAD.
Table 4.
Identification of compounds in Polyalthia longifolia leaf and stem extracts detected by HPLC-DAD.
| Compound |
Class |
Rt
(min) |
UV-Vis λmax (nm) |
PLLW |
PLLE |
PLLM |
| Gallic ac. |
Phenolic ac. |
2.537 |
270 |
-- |
-- |
+ |
| Chlorogenic ac. |
Phenolic ac. |
5.509 |
322 |
-- |
-- |
-- |
| (+)-Catechin |
Flavan-3-ol |
6.573 |
280 |
-- |
+ |
+ |
| Epicatechin |
Flavan-3-ol |
7.019 |
278 |
-- |
+ |
+ |
| Caffeic ac. |
Hydroxycinnamic ac. |
7.796 |
325 |
+ |
+ |
-- |
| Ellagic ac. |
Phenolic ac. |
7.891 |
256 |
+ |
+++ |
++ |
| Rosmarinic ac. |
Phenolic ac. |
9.521 |
330 |
-- |
++ |
-- |
| Luteolin |
Flavonoid |
9.813 |
348 |
-- |
+ |
+ |
| Quercetin |
Flavonoid |
9.981 |
257; 376 |
-- |
-- |
-- |
| Kaempferol |
Flavonoid |
10.753 |
265; 364 |
-- |
-- |
-- |
| Baicalein |
Flavonoid |
10.918 |
277 |
+ |
+ |
+ |