Submitted:
29 September 2025
Posted:
30 September 2025
You are already at the latest version
Abstract
Microplastics (MPs) are synthetic environmental pollutants increasingly linked to adverse human health effects. To study their biological impact, researchers require access to environmentally relevant MPs that can be accurately tracked in biological systems. However, most ambient MPs are composed of non-conjugated polymers that lack intrinsic fluorescence, limiting their utility in live-cell or in vivo imaging. To address this challenge, we present two alternative labeling approaches that enable visualization, distribution tracking, and quantification of MPs. First, we stained nylon and polypropylene MPs with Rhodamine 6G, a fluorescent dye known for its stability and compatibility with in vivo applications. These labeled MPs retained strong fluorescence in murine lung tissue for up to one week, as confirmed by fluorescent microscopy. Second, we conjugated aminated polystyrene microspheres with IRDye 800CW, a near-infrared fluorophore that reduces tissue autofluorescence and enables high-resolution imaging via IVIS and confocal microscopy. In vivo experiments revealed organ-specific accumulation of IRDye-labeled MPs, with a 2.8-fold increase in the liver and a 5-fold increase in the spleen compared to controls, detectable up to 72 hours post-injection. These labeling strategies provide re-searchers with practical tools to visualize and study the biodistribution of MPs in biological systems, advancing efforts to understand their health implications.
Keywords:
microplastics
; fluorescence
; in vivo imaging
; microscopy
; nylon
; polypropylene
; polystyrene
1. Introduction
Microplastics (MPs) are particles smaller than 5mm (as defined by US Environmental protection agency[1], and are pervasive in our environment[2,3,4,5,6,7,8]. The impact of MPs on human health is now drawing greater attention, and in 2022 the World Health Organization published a report outlining the potential implications of exposure[9]. However, the field of research into the physiologic effects of exposures is burgeoning and there is an urgent need for plastic particles that: (1) accurately represent environmental exposures, and (2) can be visualized with commonly available scientific equipment. Currently, the most readily available MP (and often used) are polystyrene nanospheres which are expensive and challenging to visualize in human and animal tissues. Crucially, nanospheres are morphologically not representative of environmental pollutant MPs, which typically have rough edges and heterogeneous size distributions. In addition, polystyrene is only one type of plastic typically found in the environment (mostly originating from food packaging). The other common pollutants, e.g., polypropylene (bottles, packaging) and polyamide (nylon, clothing) lack commercially available fluorescent variants [10,11,12].
Currently available techniques for identifying plastic in tissue primarily distinguish synthetic particles from organic and mineral matter while providing some insight into their morphology. Among these, electron microscopy and spectroscopy are commonly used. While spectroscopy, particularly Raman and Fournier transmitted infrared spectroscopy, have been partially effective in identifying MPs in human tissue [13,14], several challenges make generalizing these methods impractical and poorly reproducible, significantly hampering progress in the research community[15].
Fluorescence microscopy has proven useful for visualizing MP uptake and localization in biological systems[16]. For example, the use of Nile Red dye staining, classically used as a lipid droplet stain[17], when combined with fluorescence microscopy enhances MP detection because the dye selectively binds hydrophobic polymer surfaces and to some degree allows quantification[18]. Unfortunately, since Nile Red binds to MPs with hydrophobic interactions, it can unbind from MPs in vivo and transfer to lipids due to a stronger affinity. This leads to inaccurate data when using lipid-rich in vitro and in vivo models to investigate the distribution and physiological effects of MPs. Other commonly available fluorescent particles can wash out over time, are not readily quantifiable, or do not transmit at a wavelength that is picked up with commonly available equipment (e.g., In-Vitro Imaging System, or IVIS Lumina). Finally, Nile Red is not readily detectable in deep tissues, making in vivo studies that localize or track distribution of MPs difficult.
Here, we present methods that use Rhodamine 6G and IRDye 300 to stain polypropylene, nylon, and polystyrene, addressing some of these limitations. This approach enables long-lasting staining and reliable detection of MPs in biological tissues using fluorescence microscopy and in vivo imaging platforms.
2. Materials and Methods
2.1. Aims
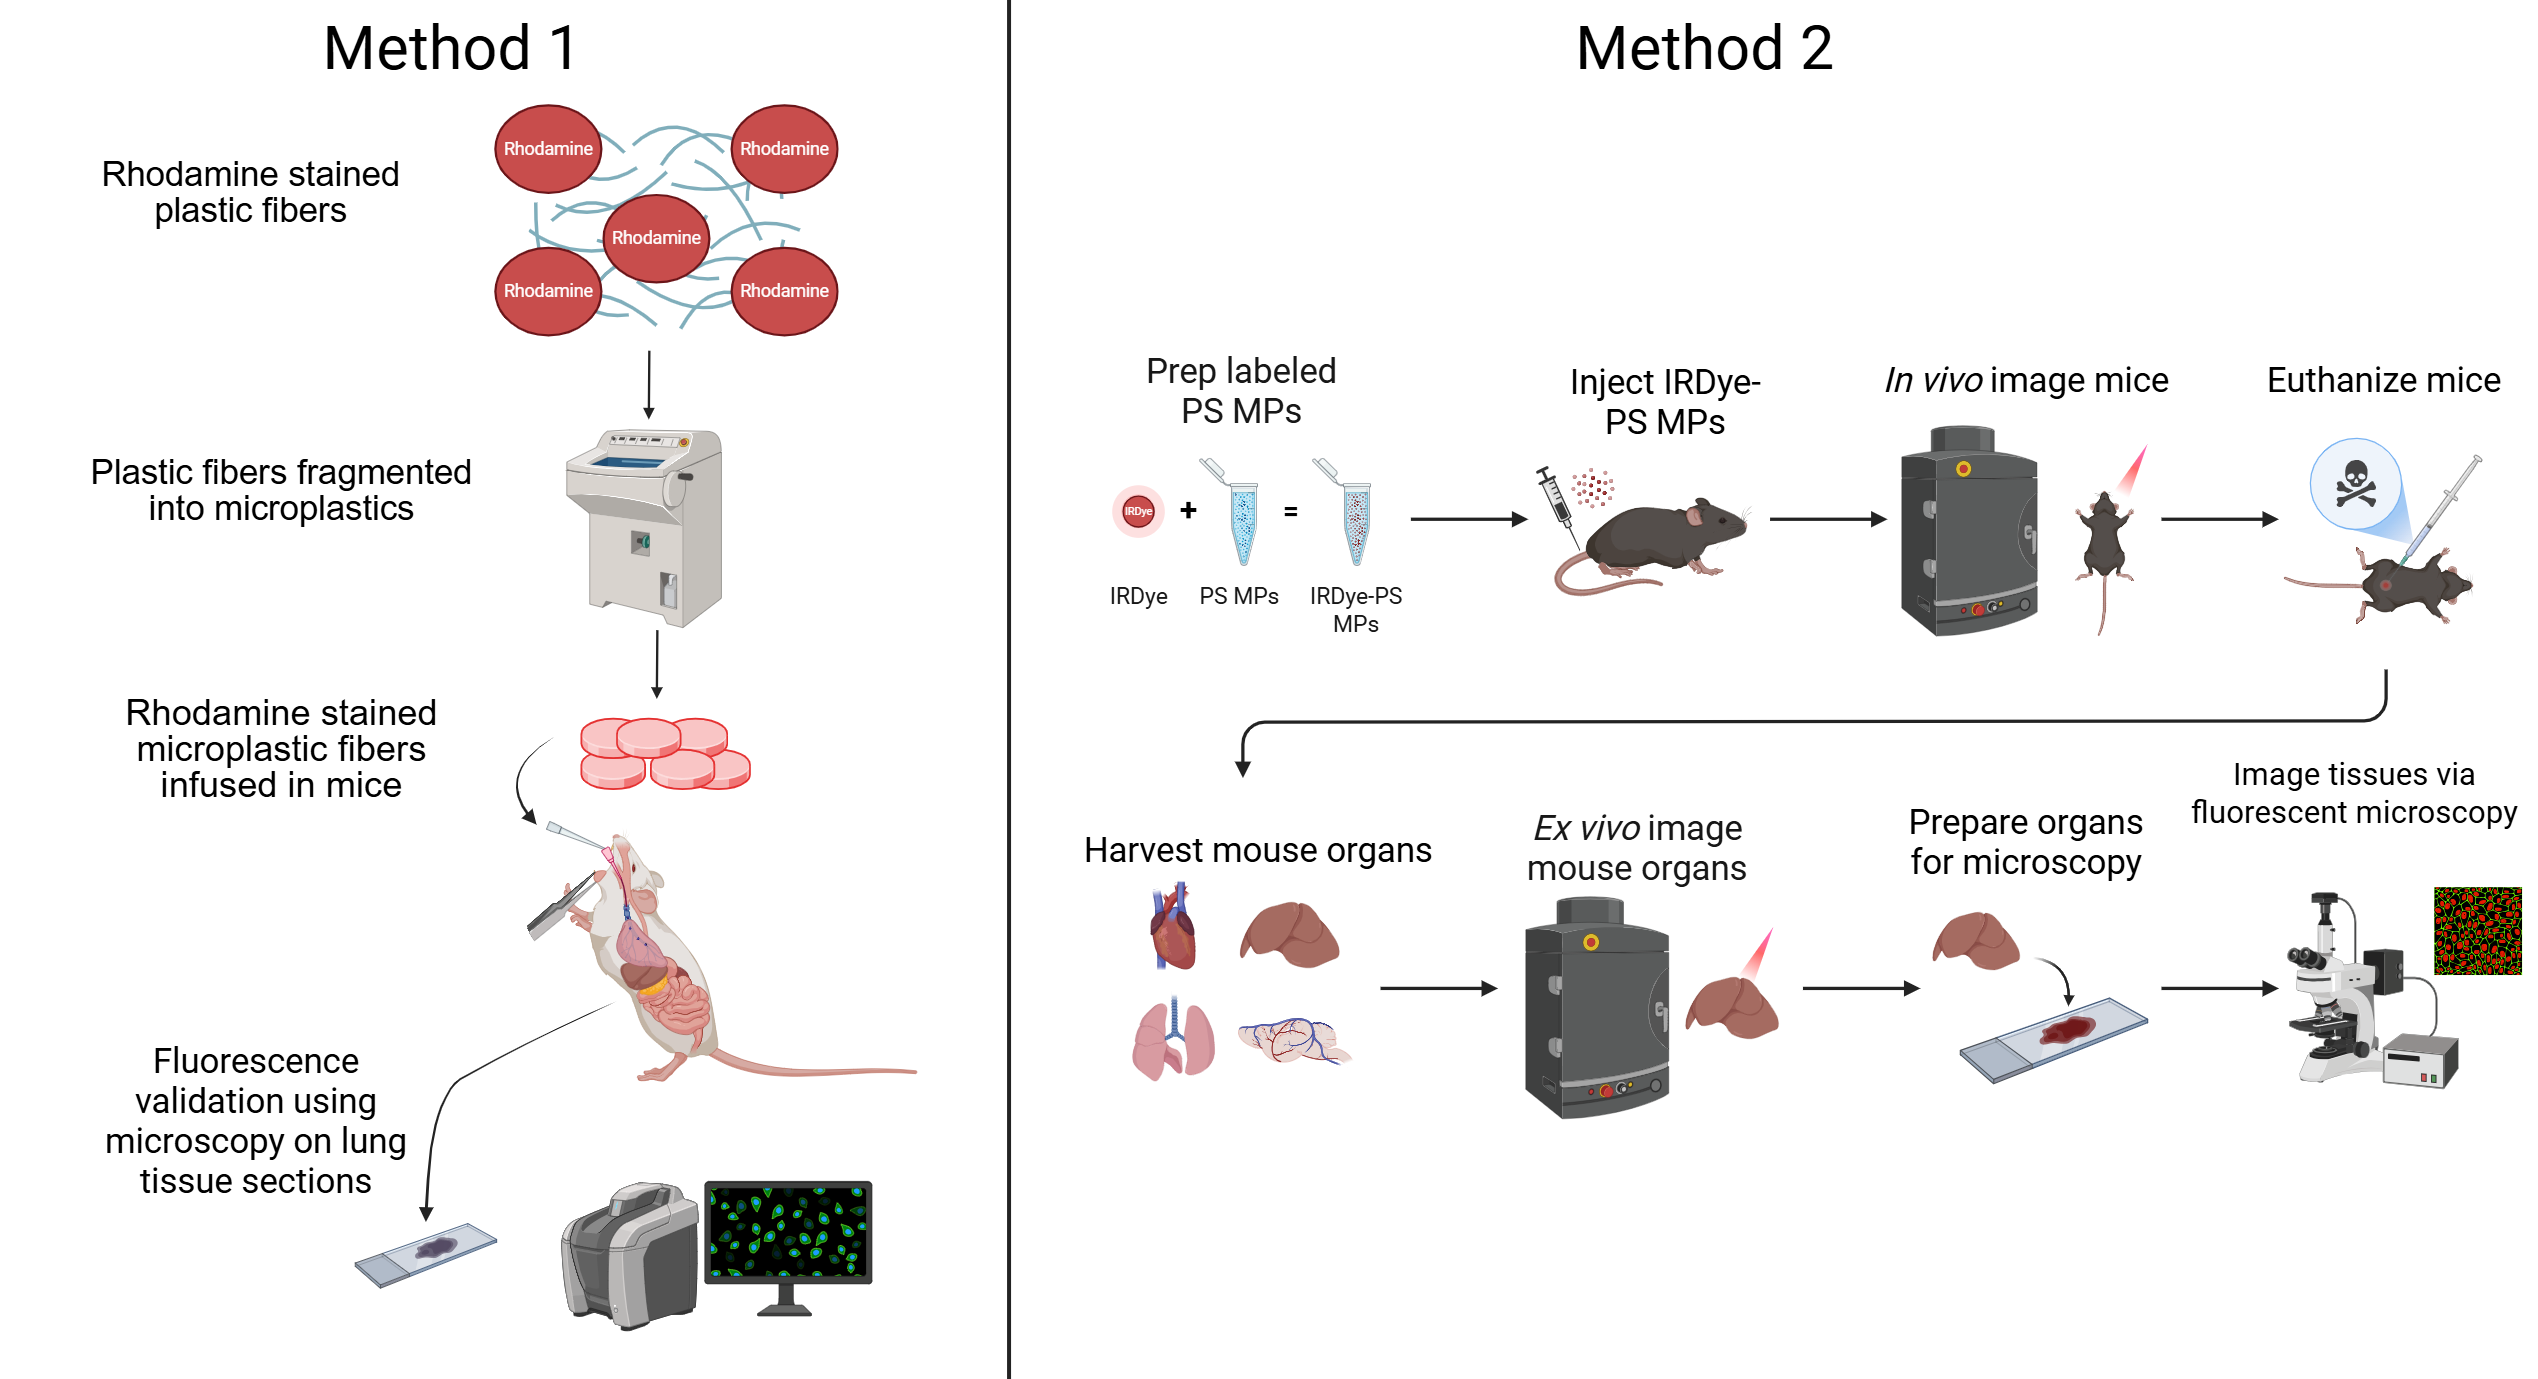
This study aims to address critical limitations in the visualization and tracking of MPs in laboratory settings in biological systems by developing novel fluorescent labeling methods. Specifically, we seek to develop and optimize fluorescent staining protocols using Rhodamine 6G (Millipore Sigma, St. Louis, MO, USA) for polypropylene and nylon MPs and IRDye® 800CW NHS Ester (LI-COR Biosciences, Lincoln, NE, USA; Cat. #929-70020) conjugated to polystyrene MPs. We aimed to validate the fluorescent staining of labeled MPs using in vivo models and detecting them using accessible imaging platforms.
2.2. Plastics
Nylon (polyamide 66; 19µm diameter, AM32-FB-000120) and polypropylene fibers (28µm diameter, PP30-FB-000147) were purchased from Goodfellow Corporation (Pittsburgh, PA, USA). Aminated polystyrene (PS) microspheres (Spherotech Inc. Lake Forest, IL, USA) were obtained in sizes ranging from 1-1.4µm diameter and were supplied in a 5.0% w/v suspension.
2.3. Rhodamine 6G Staining and Microplastic Preparation
Rhodamine 6G (Millipore Sigma, St. Louis, MO, USA) was selected as the fluorescent stain for nylon and polypropylene fiber labeling due to its optimal combination of spectroscopic and practical properties for biological applications, as previously reported[19]. When excited at 488 nm the dye emits red light (λem ~ 548 nm), well outside the typical cellular autofluorescence range (200-450 nm). Rhodamine 6G possesses a remarkably high fluorescence quantum yield (0.95) and exceptional photostability, ensuring bright and consistent fluorescence signals without significant photobleaching or endogenous fluorescence interference. The dye demonstrates fluorescent stability under physiological pH, and is widely known for its excellent biocompatibility, making Rhodamine 6G suitable for studies involving biological systems[20].
For fluorescent visualization, plastic fibers were stained using a standardized Rhodamine 6G protocol. Cutting the polypropylene and nylon to micron size was by a method adapted from Cole, which has proven to be straightforward and reproducible[21]. In this approach, commercially available plastic fibers on a spool are wrapped around a platform with two rust-proof metal posts (all steps are shown in Supplementary Figure 1). This is submerged in an acetone dye bath containing 10g/L Rhodamine 6G for 24 hours at room temperature to ensure sufficient dye penetration. Following staining, samples undergo thorough rinsing with acetone followed by deionized water to remove surface-bound dye. The freshly dyed fibers are then submerged in water for 72 hours with daily water changes to allow excess dye to leach out, ensuring that only dye incorporated into the polymer matrix remains.
The fibers are then imbedded in Optimal Cutting Temperature (OCT) compound (Scigen US, Paramount, CA, USA), frozen at -80 °C, and then cut into smaller segments before being assembled into a single block. This block is subsequently sectioned into microparticles using a cryotome, allowing control over particle size. This technique has been successfully applied in several publications and has consistently yielded reliable results in our own work[22,23,24]. Size analysis using Scanning Electron Microscopy (Hitachi SU1000 Flex SEM 490-1) indicates variation in size that should be accounted for experimentally if choosing the 1-, 5- or 10-micron thickness settings (Figure 1, Supplementary Figure 2 and Table 1). Size analysis was performed by measuring the dimensions of 50 microplastic particles from high resolution scanning electron microscopy images. Measurements from two independent observers were averaged to yield a consensus value. The resulting dataset was then subjected to descriptive statistical analysis, including median, percentiles and range. Size measurements were calculated using imageJ software (National Institutes of Health, Bethesda, MD, USA) and descriptive statistical analysis was conducted and graphed using GraphPad Prism version 10.4.1 (GraphPad Software, San Diego, CA, USA). Rhodamine-stained MPs were visualized using fluorescent microscopy (Keyence BZ-X700).
IRDye conjugation with polystyrene
We conjugated IRDye® 800CW NHS Ester (LI-COR Biosciences, Lincoln, NE, USA; Cat. #929-70020) to 1 µm amine-functionalized polystyrene spheres. IRDye 800CW is a near-infrared dye classically used to label antibodies for Western blotting, protein assays, and molecular activity measurements. IRDye 800CW contains a reactive N-hydroxysuccinimide (NHS) ester group which allows it to be conjugated to primary or secondary amines.
The amine-functionalized beads were first washed and buffer-exchanged into a bicarbonate buffer (pH 8.3). The IRDye 800CW was then added to the washed beads and incubated at room temperature for two hours. Following incubation, the excess dye was removed, and the beads were washed three times with PBS using 100kDa spin columns (centrifuged at 10,000 x g for 10 minutes). The dyed beads can be stored at 4°C for up to two weeks, after which there is significant degradation of the fluorescent signal. IRDye conjugated PS-MPs were visualized using Confocal microscopy (Olympus Evident FV4000).
2.4. Visualizing MPs In-Vivo
Nylon and Polypropylene MPs were placed in a 5 mL Eppendorf tube and sterilized in in a Stericycle autoclave at 121°C for 30 minutes, followed by a 30-minute drying cycle. All animal procedures were approved by the Institutional Animal Care and Use Committee under protocol #A24-146. To evaluate Rhodamine 6G labeling in-vivo, Rhodamine-stained polypropylene and nylon MP fibers were instilled intratracheally into C57BL/6 mice (Charles River Laboratories, Wilmington, MA, USA). One-week post-instillation, animals were sacrificed, lungs were harvested, and tissue sections were prepared for microscopy to assess the presence of microplastics via fluorescent microscopy. To evaluate IRDye labeling in-vivo, IRDye® 800CW–labeled aminated PS microspheres were injected into the tail vein of C57BL/6 mice (3×10⁸ particles, approximately 6 mg/kg; n=6, in 100µL solution). Control groups received 100µL of 17.2 µM IRDye-saline solution (n=2) or 100µL saline (n=2). The concentration of free IRDye used in control groups (17.2 µM) was selected to approximate the amount of dye conjugated to polystyrene beads in experimental formulations, based on an estimated 10% conjugation efficiency. Whole-body imaging was performed using an in vivo imaging system (IVIS; PerkinElmer, Waltham, MA, USA) at 0-, 24-, 48-, and 72-hours post-injection. Fluorescent signals were acquired and analyzed using Living Image software (version 4.1 PerkinElmer). After 72 hours, mice were then euthanized, organs harvested, and ex-vivo imaging and histological analyses were conducted. Statistical comparisons of ex vivo fluorescent signal and organ flux were performed using two-way ANOVA followed by Tukey’s post hoc test, conducted using GraphPad Prism version 10.4.1 (GraphPad Software, San Diego, CA, USA). A p-value < 0.05 was considered statistically significant.
All tissues were fixed in 10% neutral buffered formalin for 24–48 hours, flash frozen, and embedded in OCT compound. Sections were prepared using a cryostat and visualized using confocal (Olympus Evident FV4000), fluorescent, brightfield, or polarized light microscopy. IRDye-labeled polystyrene beads were imaged using the confocal microscope under the IRDye 800CW channel, while Rhodamine 6G–stained polypropylene and nylon MPs were visualized using a Keyence BZ-X700 microscope under the TRITC channel. A board-certified veterinary pathologist performed blinded histopathologic evaluation of the lung tissue.
2.5. Flow Cytometry
Unstained and Rhodamine 6G–stained nylon fibers (10µm) were mixed and suspended in phosphate-buffered saline. The suspension was filtered through a 40µm membrane to remove larger particulate and prevent instrument clogging. Data was acquired using a BD FACSCanto II flow cytometer. Rhodamine 6G fluorescence was detected using the PE channel, as its excitation and emission spectra closely align with the spectral parameters of this filter. This alignment enables optimal signal detection and minimizes spectral overlap. Gating and analysis were performed using Floreada.io.
3. Results
3.1. Nylon and Polypropylene with Rhodamine 6G
Under fluorescent microscopy Rhodamine 6G-stained nylon (Figure 2) and polypropylene MPs (Supplementary Figure 3) exhibited strong fluorescence in the TRITC channel. Notably, the fluorescent signal remained strong even after 4 weeks of storage at 4 °C in the dark, allowing for the preparation of MPs well in advance of in-vitro or in-vivo experiments. Since there are no in-vitro replicas of the complex environment that MPs encounter in live biological systems, the definitive assessment of fluorescence stability requires in-vivo testing. Therefore, we evaluated fluorescence persistence in live mice. Rhodamine-stained nylon MPs exhibited robust fluorescence one week after intratracheal instillation (Figure 3). Rhodamine-stained polypropylene demonstrated robust fluorescence similarly one day after intratracheal instillation (Supplementary Figure 4). These results confirm that the rhodamine dye remains encapsulated within the polymer matrix and does not leach into the surrounding tissue.
To explore complementary detection methods, we evaluated polarized light microscopy for identifying nylon MPs in tissue sections. In hematoxylin and eosin stained sections of mouse lungs, we observed bright, birefringent particles of nylon MPs under polarized illumination (Figure 4).
For quantitative analysis, we evaluated the rhodamine-labeled nylon MPs using flow cytometry. Rhodamine-stained MPs showed dramatically enhanced fluorescence compared to unstained nylon fibers (Figure 5), with 84% of particles detected as fluorescence-positive versus 0.84% in unstained controls. This 100-fold improvement demonstrates the effectiveness rhodamine staining for cytometric quantification of MP exposure and systemic distribution.
3.2. Polystyrene with IRDye 800CW
The polystyrene MPs were successfully conjugated to the IRDye, resulting in strong fluorescent signals with the IVIS and confocal microscopy (Figure 6). When the dyed particles were injected intravenously into mice, the IVIS showed consistently higher fluorescence in the experimental mice compared to saline controls, and increased abdominal localization compared to free dye controls. Notably, abdominal accumulation in experimental mice was detected as early as 15 minutes post-injection with fluorescence remaining strong for the full 72-hour period (Figure 7). Ex-vivo imaging of mouse organs revealed a 2.8-fold increase in liver fluorescence (p = 0.0006) compared to saline control when measuring total flux through the organs. There was a 5-fold increase in spleen fluorescence (p = 0.045) compared to saline control when the flux was normalized to organ weight (Figure 8). Confocal microscopy of organ sections (Figure 9) confirmed the IVIS findings of MPs in both the liver and spleen of experimental animals while also being located in the lungs, highlighting the ability to use near-infrared dyes to label MPs for detection and tracking in vivo.
4. Discussion
We demonstrate that Rhodamine 6G is a highly effective fluorescent label for nylon and polypropylene MPs, exhibiting strong and stable fluorescence in aqueous environments and under relevant biological conditions. By using acetone as a swelling agent, we enable rhodamine molecules to penetrate and become physically entrapped within the polymer matrix rather than merely coating the surface. This intercalation mechanism provides several critical advantages: (1) the dye cannot readily dissociate in biological environments since it's sterically trapped within the polymer network, (2) the fluorophore is protected from enzymatic degradation and pH fluctuations that would affect surface-bound dyes, and (3) the labeling is permanent for the experimental timeframe, as demonstrated by our week-long in vivo stability. The dye’s quantum yield of 0.8-1 in water and ethanol, and exceptional photostability enabled reliable visualization of MPs both in-vitro and in-vivo, with detectable signals persisting 1-week post-instillation [25,26,27]. In contrast, Nile Red, while showing respectable quantum yields around 0.7 in nonpolar environments, experiences a dramatic drop to as low as 0.02 in water-based solutions[28]. This quenching effect significantly reduces its fluorescent capabilities in aqueous environments. Given that cellular and organ systems are water-based, the superior performance of rhodamine dyes in such polar environments makes them more suitable for biological imaging applications and correlate positively with our findings.
The cryosectioning approach maintains the irregular morphology characteristic of environmental MPs. Unlike commercial spherical particles or chemical synthesis methods that produce uniform shapes, our method generates fragments with rough edges and varied aspect ratios (as shown in our SEM data) that better simulate real-world MP particles. This morphological authenticity is essential for accurately studying cellular uptake mechanisms, tissue penetration, and inflammatory responses, as particle shape significantly influences biological interactions. Meanwhile, quantitative reliability is essential for dose-response studies, biodistribution analyses, and risk assessment models.
We also demonstrated the feasibility of using polarized light to detect MPs under microscopy. This is beneficial as polarized light is a readily available feature on most pathology microscopes and has been used in environmental and biomedical studies to identify birefringent polymer particles[29,30]. Several in vivo mice studies have demonstrated the utility of this technique for visualizing ingested and inhaled MPs within tissues[31,32], although confirmation with chemical identification methods is generally recommended to ensure specificity. These findings suggest that polarized light microscopy may serve as a rapid, low-cost adjunctive method for initial screening of tissue sections, particularly in laboratories without immediate access to advanced imaging or spectroscopy platforms.
While Nile Red has been widely used in flow cytometry for microplastic quantification with appreciable efficiency[33], its poor water solubility and tendency to form aggregates presented significant analytical challenges. These aggregates often overlap with the signal from dispersed MPs, creating a continuum of background noise that complicates gating and reduces quantification accuracy. Even with methodological improvements, studies have reported persistent background signals from Nile Red aggregates in blank samples, highlighting the limitations of Nile Red in aqueous systems[34]. Our findings of 84% of nylon microplastics being stained and detected using flow cytometry confirm the robustness of Rhodamine 6G labeling, offering an additional reproducible and analytically sound method for MP exposure analysis.
The In Vivo Imaging System (IVIS) is an optical imaging system that uses a highly sensitive camera to detect bioluminescent and fluorescent signals, enabling non-invasive visualization and quantification of biological activity inside animals. This system is commonly used to track disease progression, gene expression, and therapeutic efficacy in the same animal over time. Despite its high sensitivity, several challenges exist with using the IVIS for in-vivo tracking of MPs. First, fluorophores that emit at visible wavelengths (400-550 nm) tend to overlap with autofluorescence signals from skin, fur, blood, liver, and the gastrointestinal tract. Autofluorescence drops off at wavelengths greater than 650 nm[35]. As such, using the IVIS for in vivo fluorescence detection requires fluorophores that emit outside of this range. A second challenge is that tissues tend to absorb and scatter fluorescent signals, preventing them from being detected with the IVIS camera. To minimize tissue absorbance and scattering, fluorophores with longer excitation and emission wavelengths are ideal. Near-infrared dyes are especially useful for IVIS applications because they have high tissue penetrance and reduced overlap with autofluorescence signals[35,36,37].
Considering these limitations, IRDye 800CW was chosen for our experiments due to its near-infrared excitation/emission spectrum and ease of conjugation to particles containing free amine groups. The conjugated IRDye 800CW-PS MPs exhibited robust fluorescent signal in the IVIS, overcoming the challenges described above. The IRDye labeled polystyrene facilitated deep tissue imaging and revealed organ-specific accumulation. This has major benefits as a non-invasive method to longitudinally monitor MP distribution in live animals. We believe this is the first report of successful conjugation of IRDye 800CW to MPs for in-vivo imaging. More importantly, the conjugation process is straightforward and can be performed using cheap, readily available instruments, making this approach highly accessible for in vivo imaging studies.
5. Conclusions
The principle of solvent-induced swelling for dye incorporation can be adapted to virtually any synthetic polymer by selecting appropriate swelling solvents. This versatility enables researchers to create fluorescent versions of specific MPs relevant to their local environmental contamination profiles or exposure scenarios. The simplicity and low cost of our protocol democratizes MP research. The entire rhodamine labeling process requires only basic laboratory equipment (cryostat, standard solvents, and rhodamine dye) while allowing it to be expanded to other plastic subtypes. Similarly, the IRDye conjugation method can technically be done in any lab setting and applied to any plastics that have a free amine group. Laboratories with basic histological capabilities can complete the labeling process within several days, enabling rapid production of customized MPs. These methods unlock previously inaccessible research avenues such as chronic exposure studies, translocation tracking across biological barriers, multiplexed polymer-specific biodistribution studies, and high-throughput screening of interventions. All in all, Our approach combines robust fluorescent labeling, near-infrared imaging, and simple optical techniques which provides standardized, reproducible, and inexpensive methods that could facilitate inter-laboratory comparisons and meta-analyses, ultimately contributing to evidence-based policy decisions regarding plastic pollution.
Supplementary Materials
The following supporting information can be downloaded at the website of this paper posted on Preprints.org.
Author Contributions
Conceptualization, C.E.B., J.D., C.S., R.D.; Methodology, C.E.B., J.D., S.L, C.S., S.C., J.S.; Software, C.E.B., J.D.; Validation, C.E.B., J.D.; Formal Analysis, C.E.B., J.D., G.M.; Investigation, S.L., S.C., J.S., G.M.; Resources, R.D.; Data Curation, C.E.B., J.D.; Writing – Original Draft Preparation, C.E.B., J.D., C.S., G.M., R.D.; Writing – Review & Editing, C.E.B., J.D., G.M., C.S., R.D.; Visualization, C.E.B., J.D.; Supervision, R.D.; Project Administration, R.D.; Funding Acquisition, R.D.
Funding
RD was supported by funding from Department of Veteran’s Affairs merit awards (VA Merit BX006358-01A2, VA Merit CX002558-01A1)
Institutional Review Board Statement
All animal procedures were approved by the Institutional Animal Care and Use Committee under protocol #A24-146
Data Availability Statement
Data sharing is not applicable to this article as no datasets were generated or analyzed during the current study.
Acknowledgments
No acknowledgements
Conflicts of Interest
The authors declare no conflicts of interest
Abbreviations
The following abbreviations are used in this manuscript:
| IVIS | In vivo imaging system |
| MP | Microplastic |
| PS | Polystyrene |
| OCT | Optimal cutting temperature |
References
- US EPA, O. Microplastics Research. Available online: https://www.epa.gov/water-research/microplastics-research (accessed on 3 April 2025).
- 2Du, F.; Cai, H.; Zhang, Q.; Chen, Q.; Shi, H. Microplastics in Take-out Food Containers. J. Hazard. Mater. 2020, 399, 122969. [Google Scholar] [CrossRef]
- Fang, C.; Awoyemi, O.S.; Saianand, G.; Xu, L.; Niu, J.; Naidu, R. Characterising Microplastics in Indoor Air: Insights from Raman Imaging Analysis of Air Filter Samples. J. Hazard. Mater. 2024, 464, 132969. [Google Scholar] [CrossRef]
- 4Li, C.; Busquets, R.; Campos, L.C. Assessment of Microplastics in Freshwater Systems: A Review. Sci. Total Environ. 2020, 707, 135578. [Google Scholar] [CrossRef]
- Pivokonsky, M.; Cermakova, L.; Novotna, K.; Peer, P.; Cajthaml, T.; Janda, V. Occurrence of Microplastics in Raw and Treated Drinking Water. Sci. Total Environ. 2018, 643, 1644–1651. [Google Scholar] [CrossRef]
- Thompson, R.C.; Olsen, Y.; Mitchell, R.P.; Davis, A.; Rowland, S.J.; John, A.W.G.; McGonigle, D.; Russell, A.E. Lost at Sea: Where Is All the Plastic? Science 2004, 304, 838–838. [Google Scholar] [CrossRef]
- Torres-Agullo, A.; Karanasiou, A.; Moreno, T.; Lacorte, S. Airborne Microplastic Particle Concentrations and Characterization in Indoor Urban Microenvironments. Environ. Pollut. 2022, 308, 119707. [Google Scholar] [CrossRef] [PubMed]
- Young, N. Microplastics Are in the Air We Breathe and in Earth’s Atmosphere, and They Affect the Climate. Available online: https://www.greenpeace.org/aotearoa/story/microplastics-are-in-the-air-we-breathe-and-in-earths-atmosphere-and-they-affect-the-climate/ (accessed on 28 March 2025).
- World Health Organization Dietary and Inhalation Exposure to Nano-and Microplastic Particles and Potential Implications for Human Health; World Health Organization: Geneva, 2022; p. 154;
- Khalid Ageel, H.; Harrad, S.; Abou-Elwafa Abdallah, M. Occurrence, Human Exposure, and Risk of Microplastics in the Indoor Environment. Environ. Sci. Process. Impacts 2022, 24, 17–31. [Google Scholar] [CrossRef] [PubMed]
- O’Brien, S.; Rauert, C.; Ribeiro, F.; Okoffo, E.D.; Burrows, S.D.; O’Brien, J.W.; Wang, X.; Wright, S.L.; Thomas, K.V. There’s Something in the Air: A Review of Sources, Prevalence and Behaviour of Microplastics in the Atmosphere. Sci. Total Environ. 2023, 874, 162193–162193. [Google Scholar] [CrossRef] [PubMed]
- Zulauf, N.; Dröge, J.; Klingelhöfer, D.; Braun, M.; Oremek, G.M.; Groneberg, D.A. Indoor Air Pollution in Cars: An Update on Novel Insights. Int. J. Environ. Res. Public. Health 2019, 16, 2441. [Google Scholar] [CrossRef]
- Amato-Lourenço, L.F.; Carvalho-Oliveira, R.; Júnior, G.R.; dos Santos Galvão, L.; Ando, R.A.; Mauad, T. Presence of Airborne Microplastics in Human Lung Tissue. J. Hazard. Mater. 2021, 416, 126124–126124. [Google Scholar] [CrossRef] [PubMed]
- Jenner, L.C.; Rotchell, J.M.; Bennett, R.T.; Cowen, M.; Tentzeris, V.; Sadofsky, L.R. Detection of Microplastics in Human Lung Tissue Using μFTIR Spectroscopy. Sci. Total Environ. 2022, 831, 154907–154907. [Google Scholar] [CrossRef] [PubMed]
- Xu, J.-L.; Thomas, K.V.; Luo, Z.; Gowen, A.A. FTIR and Raman Imaging for Microplastics Analysis: State of the Art, Challenges and Prospects. TrAC Trends Anal. Chem. 2019, 119, 115629. [Google Scholar] [CrossRef]
- Dawson, A.L.; Kawaguchi, S.; King, C.K.; Townsend, K.A.; King, R.; Huston, W.M.; Bengtson Nash, S.M. Turning Microplastics into Nanoplastics through Digestive Fragmentation by Antarctic Krill. Nat. Commun. 2018, 9, 1001. [Google Scholar] [CrossRef]
- Greenspan, P.; Mayer, E.P.; Fowler, S.D. Nile Red: A Selective Fluorescent Stain for Intracellular Lipid Droplets. J. Cell Biol. 1985, 100, 965–973. [Google Scholar] [CrossRef]
- Shim, W.J.; Song, Y.K.; Hong, S.H.; Jang, M. Identification and Quantification of Microplastics Using Nile Red Staining. Mar. Pollut. Bull. 2016, 113, 469–476. [Google Scholar] [CrossRef]
- Tong, H.; Jiang, Q.; Zhong, X.; Hu, X. Rhodamine B Dye Staining for Visualizing Microplastics in Laboratory-Based Studies. Environ. Sci. Pollut. Res. 2021, 28, 4209–4215. [Google Scholar] [CrossRef]
- Bucevičius, J.; Kostiuk, G.; Gerasimaitė, R.; Gilat, T.; Lukinavičius, G. Enhancing the Biocompatibility of Rhodamine Fluorescent Probes by a Neighbouring Group Effect. Chem. Sci. 2020, 11, 7313–7323. [Google Scholar] [CrossRef] [PubMed]
- Cole, M. A Novel Method for Preparing Microplastic Fibers. Sci. Rep. 2016, 6, 34519–34519. [Google Scholar] [CrossRef]
- Song, S.; van Dijk, F.; Vasse, G.F.; Liu, Q.; Gosselink, I.F.; Weltjens, E.; Remels, A.H.V.; de Jager, M.H.; Bos, S.; Li, C.; et al. Inhalable Textile Microplastic Fibers Impair Airway Epithelial Differentiation. Am. J. Respir. Crit. Care Med. 2024, 209, 427–443. [Google Scholar] [CrossRef]
- O’Connor, A.; Villalobos Santeli, A.; Nannu Shankar, S.; Shirkhani, A.; Baker, T.R.; Wu, C.-Y.; Mehrad, B.; Ferguson, P.L.; Sabo-Attwood, T. Toxicity of Microplastic Fibers Containing Azobenzene Disperse Dyes to Human Lung Epithelial Cells Cultured at an Air-Liquid Interface. J. Hazard. Mater. 2024, 480, 136280–136280. [Google Scholar] [CrossRef]
- Paplińska-Goryca, M.; Misiukiewicz-Stępień, P.; Wróbel, M.; Mycroft-Rzeszotarska, K.; Adamska, D.; Rachowka, J.; Królikowska, M.; Goryca, K.; Krenke, R. The Impaired Response of Nasal Epithelial Cells to Microplastic Stimulation in Asthma and COPD. Sci. Rep. 2025, 15, 4242–4242. [Google Scholar] [CrossRef]
- Würth, C.; González, M.G.; Niessner, R.; Panne, U.; Haisch, C.; Genger, U.R. Determination of the Absolute Fluorescence Quantum Yield of Rhodamine 6G with Optical and Photoacoustic Methods – Providing the Basis for Fluorescence Quantum Yield Standards. Talanta 2012, 90, 30–37. [Google Scholar] [CrossRef]
- Savarese, M.; Aliberti, A.; De Santo, I.; Battista, E.; Causa, F.; Netti, P.A.; Rega, N. Fluorescence Lifetimes and Quantum Yields of Rhodamine Derivatives: New Insights from Theory and Experiment. J. Phys. Chem. A 2012, 116, 7491–7497. [Google Scholar] [CrossRef]
- Würth, C.; Grabolle, M.; Pauli, J.; Spieles, M.; Resch-Genger, U. Relative and Absolute Determination of Fluorescence Quantum Yields of Transparent Samples. Nat. Protoc. 2013, 8, 1535–1550. [Google Scholar] [CrossRef]
- Samsonova, L.G.; Selivanov, N.I.; Kopylova, T.N. Spectral Properties of Nile Red in Solutions and Thin Films. Opt. Spectrosc. 2014, 116, 72–76. [Google Scholar] [CrossRef]
- Sierra, I.; Chialanza, M.R.; Faccio, R.; Carrizo, D.; Fornaro, L.; Pérez-Parada, A. Identification of Microplastics in Wastewater Samples by Means of Polarized Light Optical Microscopy. Environ. Sci. Pollut. Res. 2020, 27, 7409–7419. [Google Scholar] [CrossRef]
- Labbe, A.B.; Bagshaw, C.R.; Uttal, L. Inexpensive Adaptations of Basic Microscopes for the Identification of Microplastic Contamination Using Polarization and Nile Red Fluorescence Detection. J. Chem. Educ. 2020, 97, 4026–4032. [Google Scholar] [CrossRef]
- Deng, Y.; Yan, Z.; Shen, R.; Wang, M.; Huang, Y.; Ren, H.; Zhang, Y.; Lemos, B. Microplastics Release Phthalate Esters and Cause Aggravated Adverse Effects in the Mouse Gut. Environ. Int. 2020, 143, 105916. [Google Scholar] [CrossRef] [PubMed]
- Tomonaga, T.; Higashi, H.; Izumi, H.; Nishida, C.; Kawai, N.; Sato, K.; Morimoto, T.; Higashi, Y.; Yatera, K.; Morimoto, Y. Investigation of Pulmonary Inflammatory Responses Following Intratracheal Instillation of and Inhalation Exposure to Polypropylene Microplastics. Part. Fibre Toxicol. 2024, 21, 29. [Google Scholar] [CrossRef]
- Bianco, A.; Carena, L.; Peitsaro, N.; Sordello, F.; Vione, D.; Passananti, M. Rapid Detection of Nanoplastics and Small Microplastics by Nile-Red Staining and Flow Cytometry. Environ. Chem. Lett. 2023, 21, 647–653. [Google Scholar] [CrossRef]
- Ainé, L.; Jacquin, J.; Breysse, C.; Colin, C.; Andanson, J.-M.; Delor-Jestin, F. Microplastics and Nanoplastics Detection Using Flow Cytometry: Challenges and Methodological Advances with Fluorescent Dye Application. MethodsX 2025, 14, 103200. [Google Scholar] [CrossRef]
- Sun, Y.; Zhong, X.; Dennis, A.M. Minimizing Near-Infrared Autofluorescence in Preclinical Imaging with Diet and Wavelength Selection. J. Biomed. Opt. 2023, 28, 094805. [Google Scholar] [CrossRef] [PubMed]
- Frangioni, J.V. In Vivo near-Infrared Fluorescence Imaging. Curr. Opin. Chem. Biol. 2003, 7, 626–634. [Google Scholar] [CrossRef] [PubMed]
- Kovar, J.L.; Simpson, M.A.; Schutz-Geschwender, A.; Olive, D.M. A Systematic Approach to the Development of Fluorescent Contrast Agents for Optical Imaging of Mouse Cancer Models. Anal. Biochem. 2007, 367, 1–12. [Google Scholar] [CrossRef] [PubMed]
Figure 1.
(A) Scanning electron micrographs (SEM) of nylon microplastic fibers sectioned with a cryotome at a 10µm setting. (B) Whisker plot showing size distribution of plastics cut in the 10, 5, and 1µm settings.
Figure 1.
(A) Scanning electron micrographs (SEM) of nylon microplastic fibers sectioned with a cryotome at a 10µm setting. (B) Whisker plot showing size distribution of plastics cut in the 10, 5, and 1µm settings.
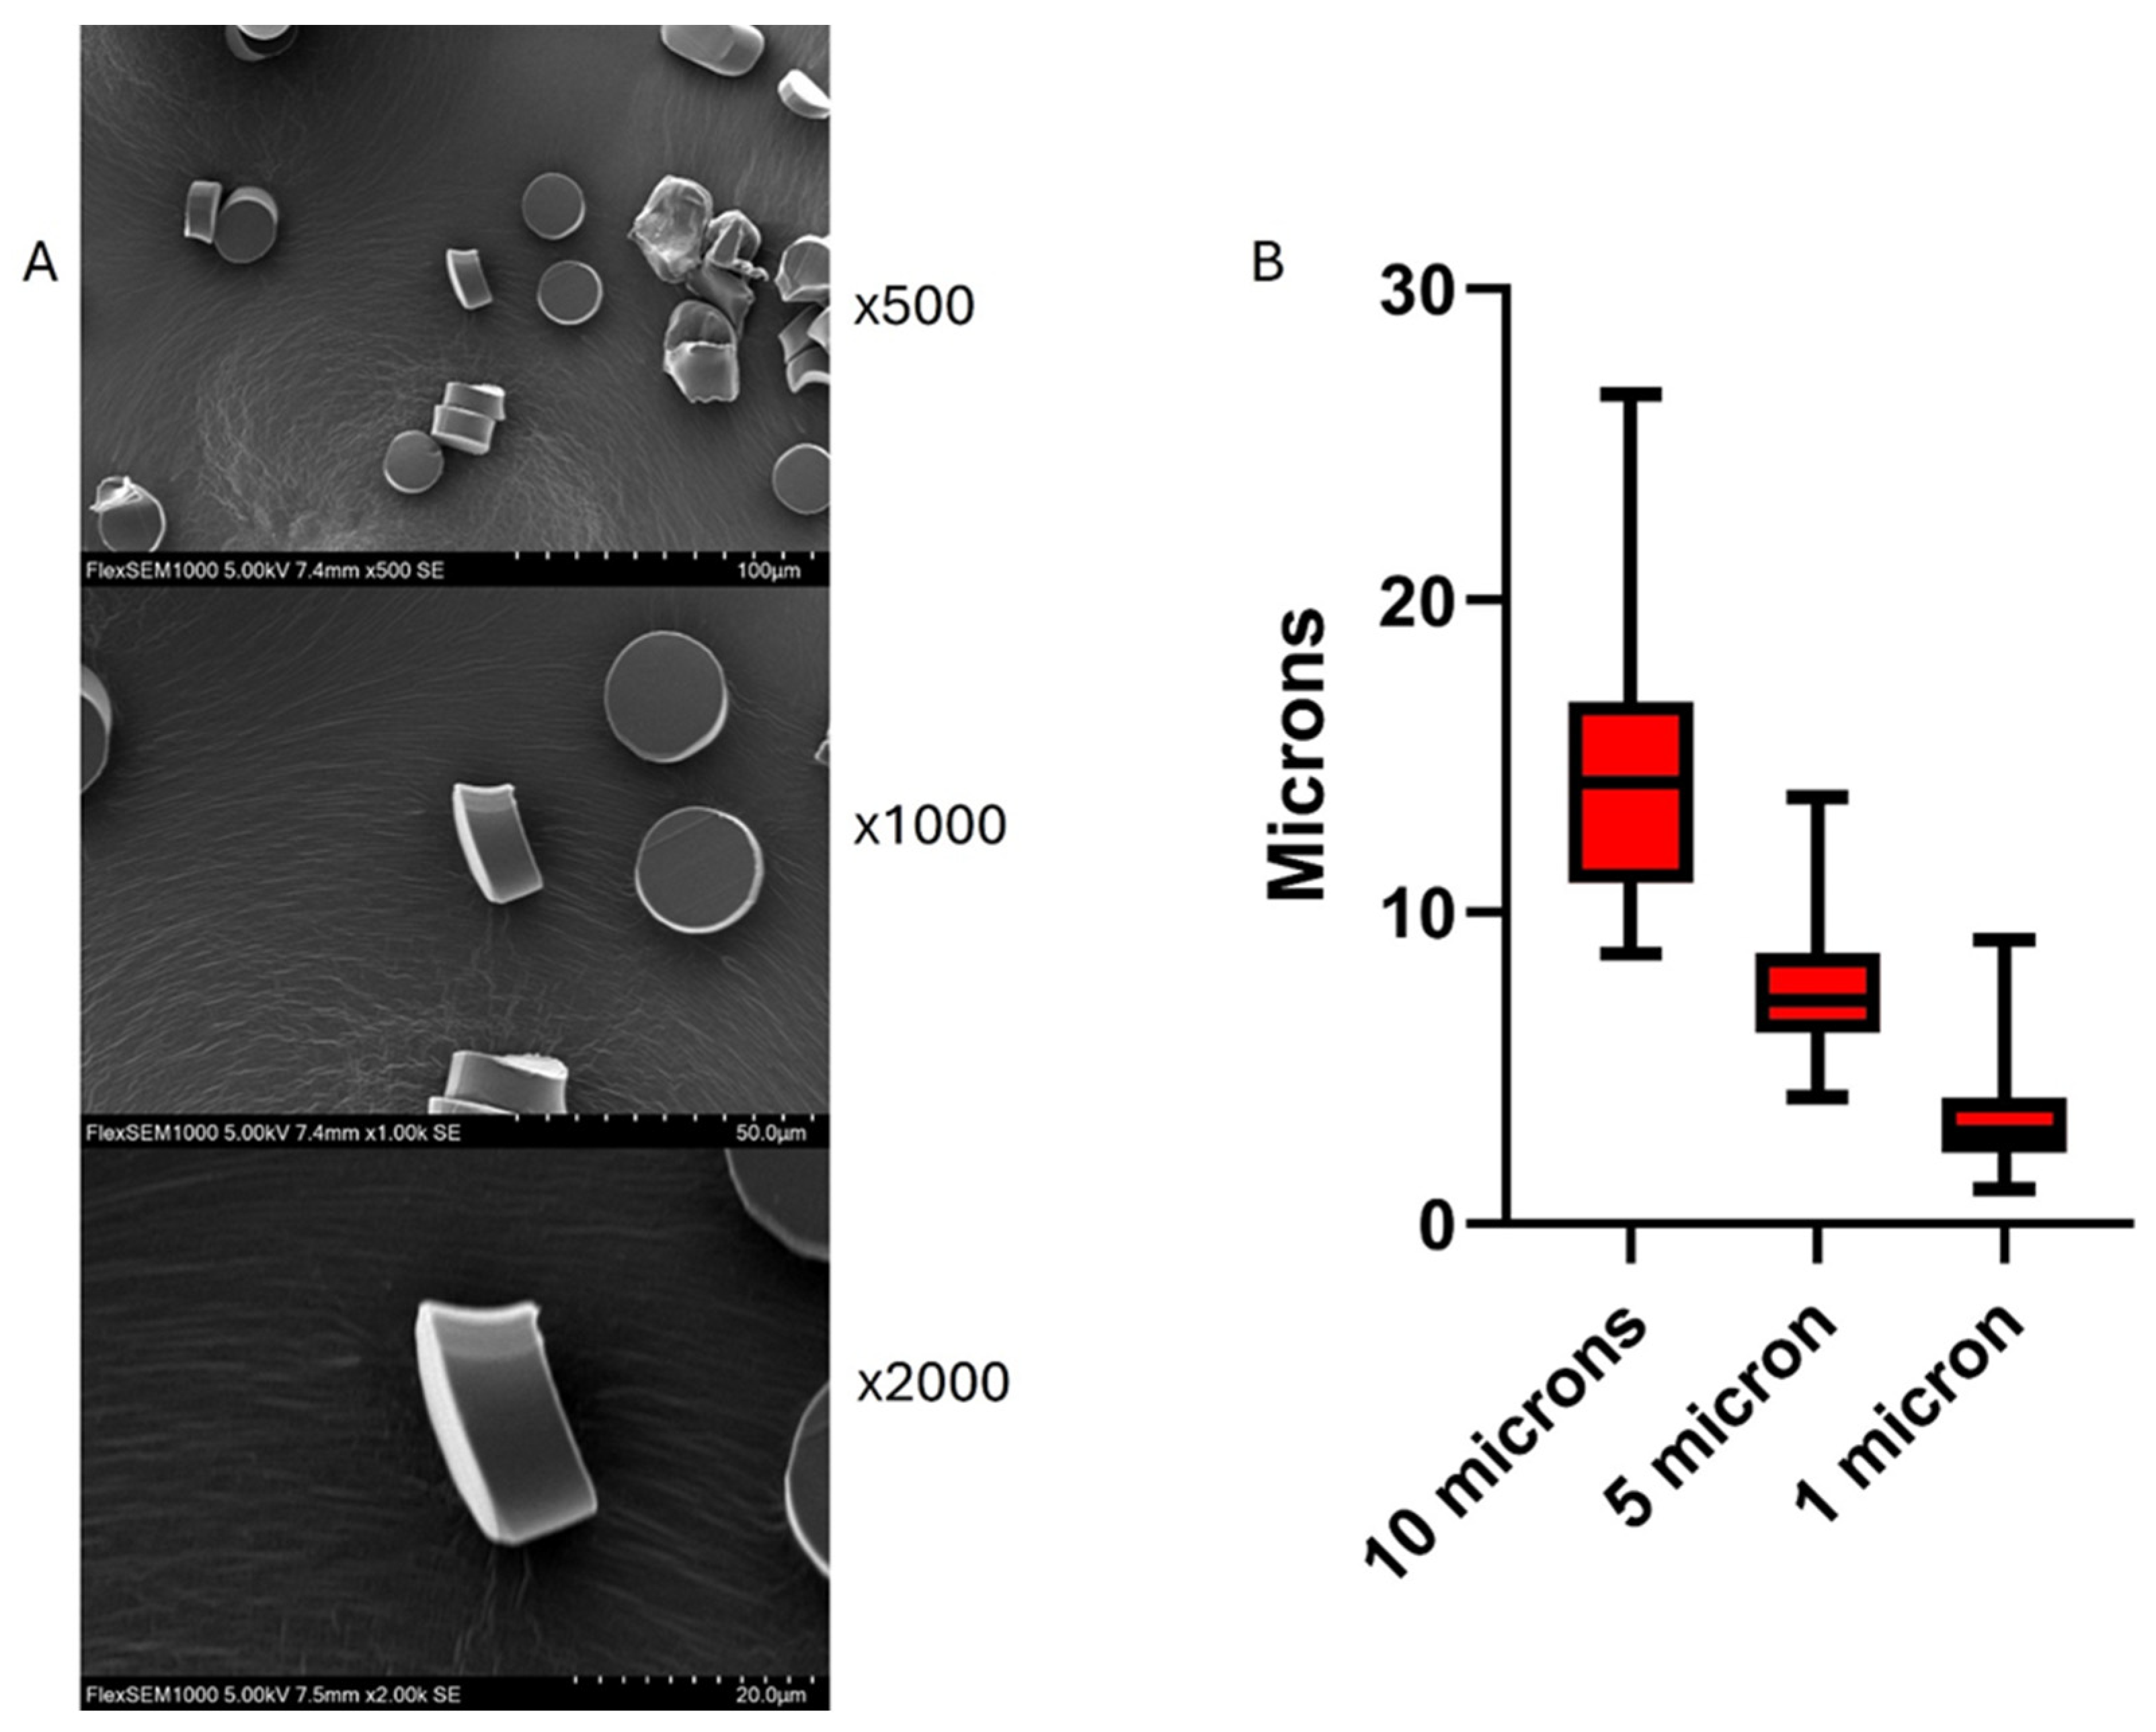
Figure 2.
Representative images of Rhodamine 6G–stained nylon microplastic fibers sectioned at 5µm thickness and visualized under different magnifications. Panels A, B, and C correspond to 4×, 10×, and 40× magnification, respectively. Each row displays brightfield (left), fluorescence (middle), and overlay (right) images. Fluorescence imaging was performed using the TRITC channel on a Keyence BZ-X700 microscope.
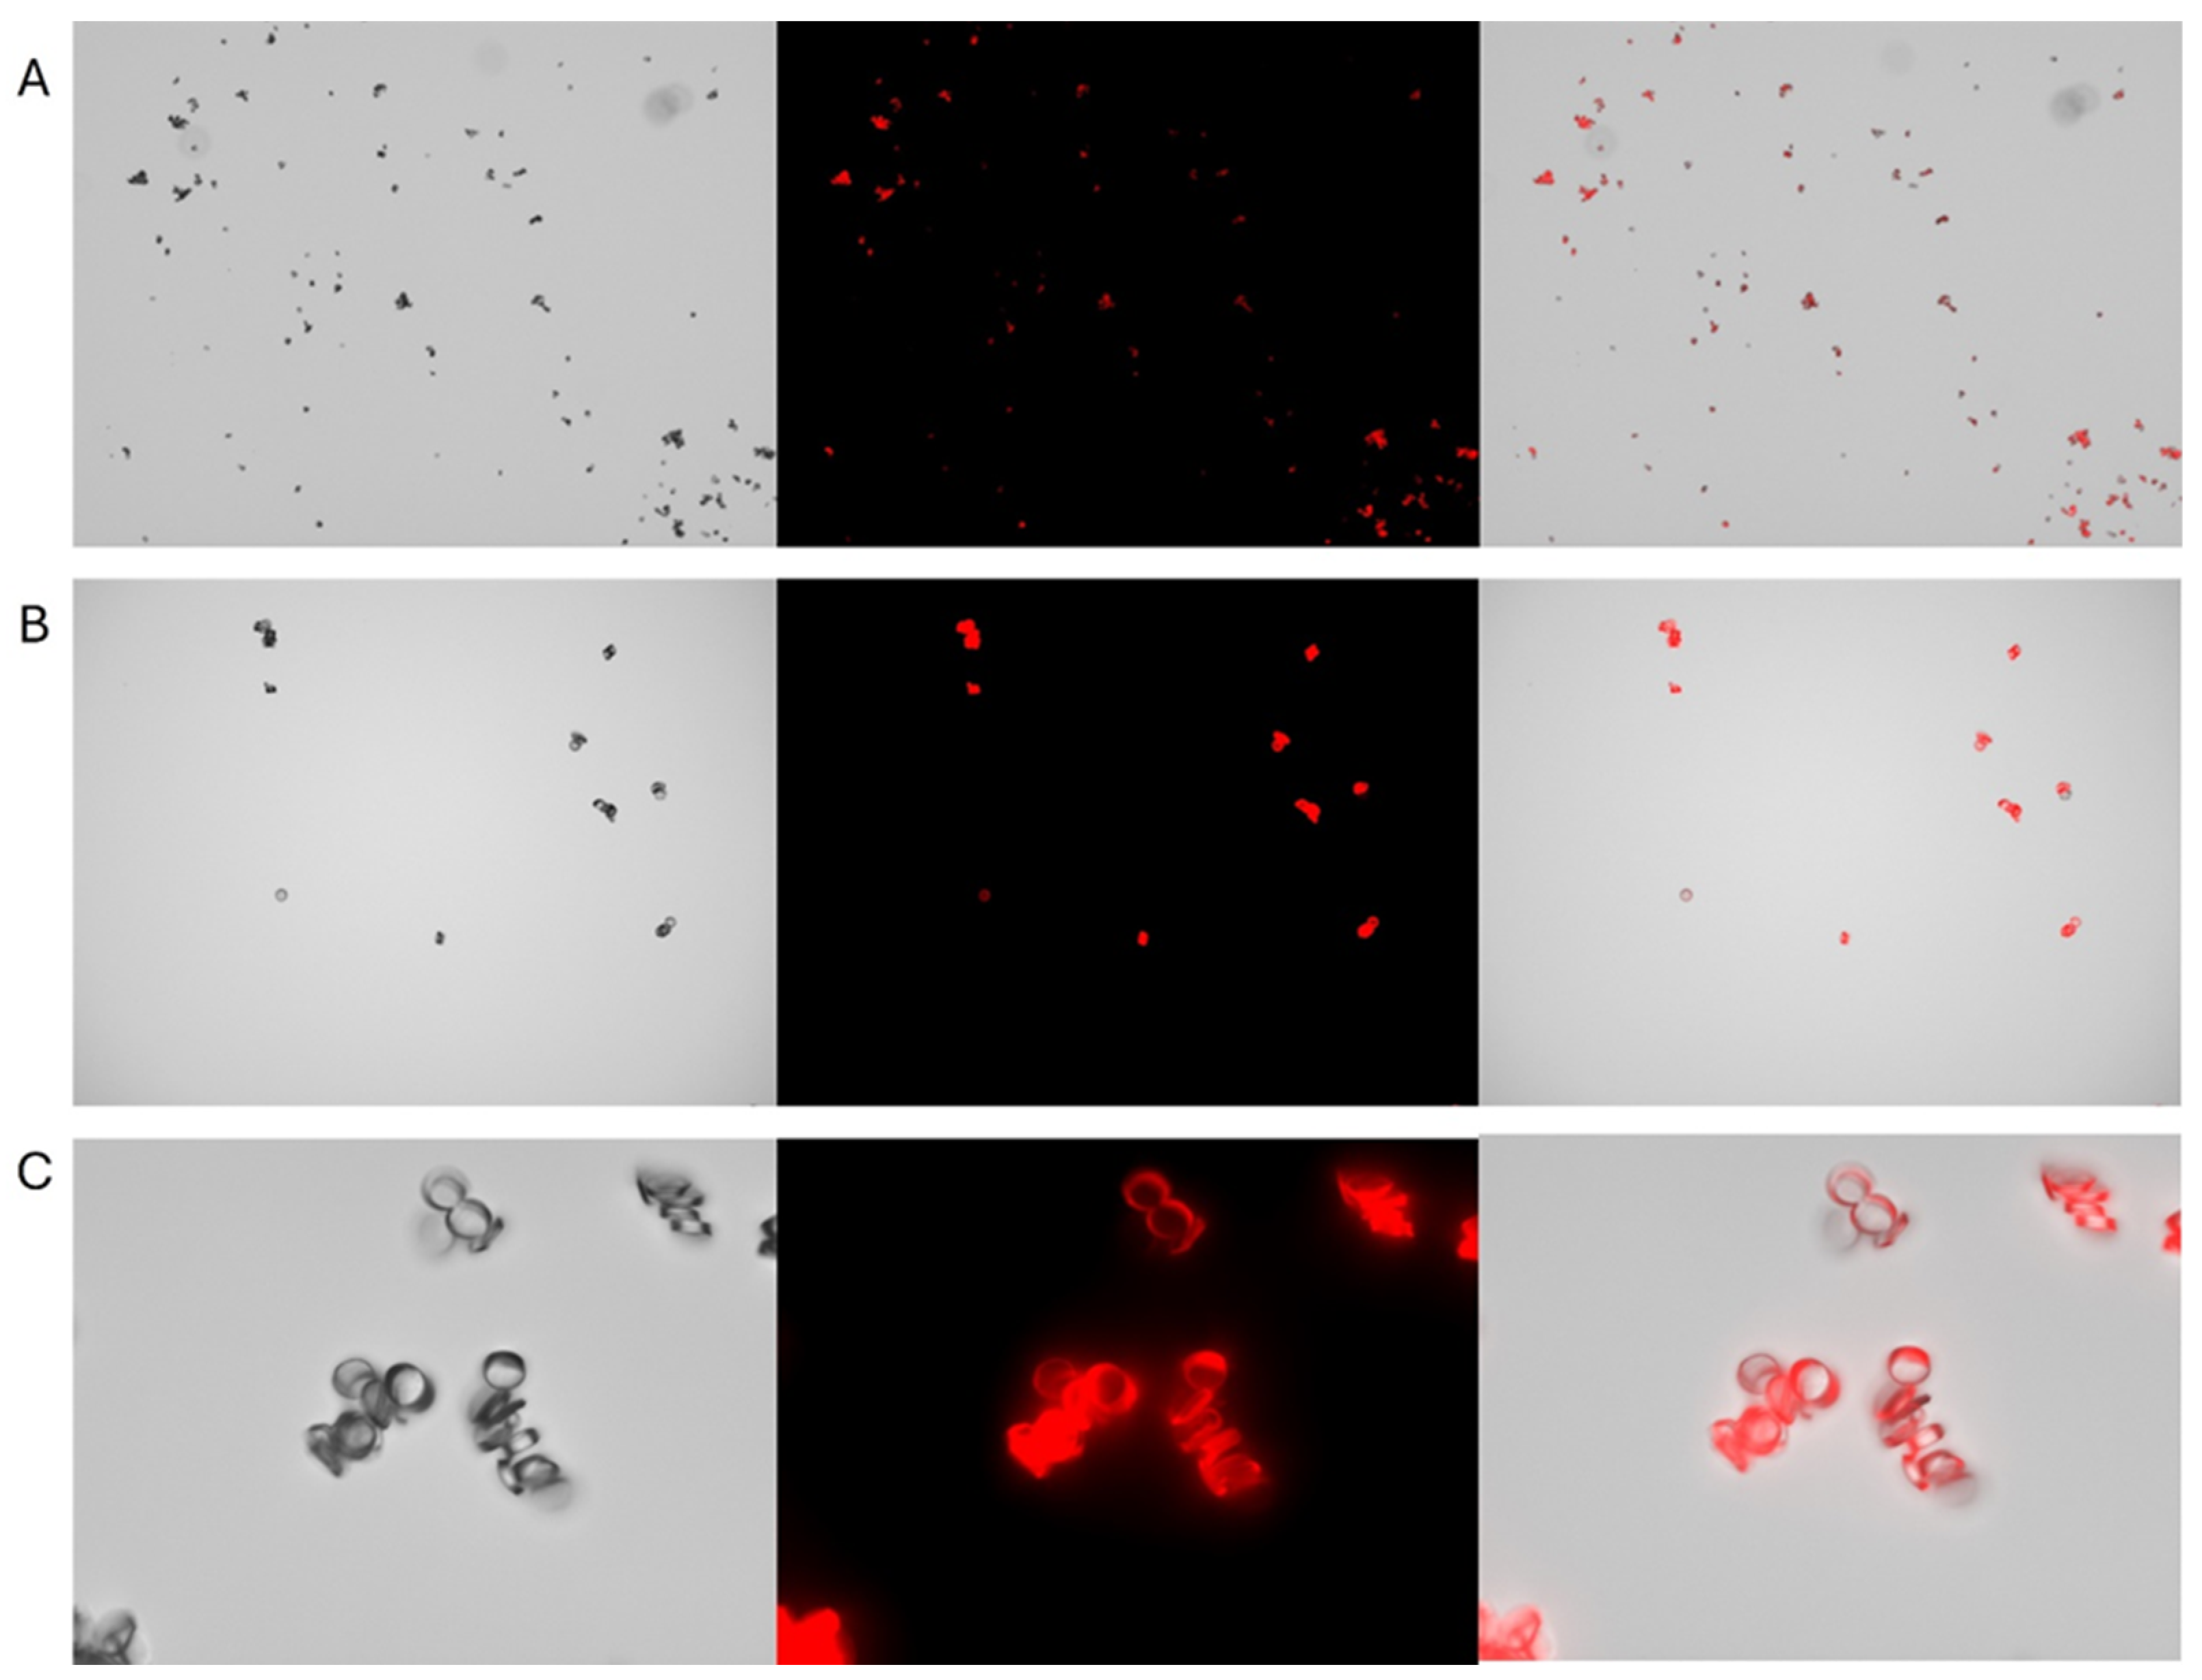
Figure 3.
Representative micrographs illustrating the distribution of 5μm rhodamine nylon fibers in mouse lung tissue post intratracheal administration. Panels A, B, and C correspond to 4×, 10×, and 40× magnification, respectively. Each row displays brightfield (left), fluorescence (middle), and merged (right) images. Fluorescence imaging was performed using the TRITC channel on a Keyence BZ-X700 microscope, confirming strong and stable Rhodamine 6G signal after 1 week in a live mouse.
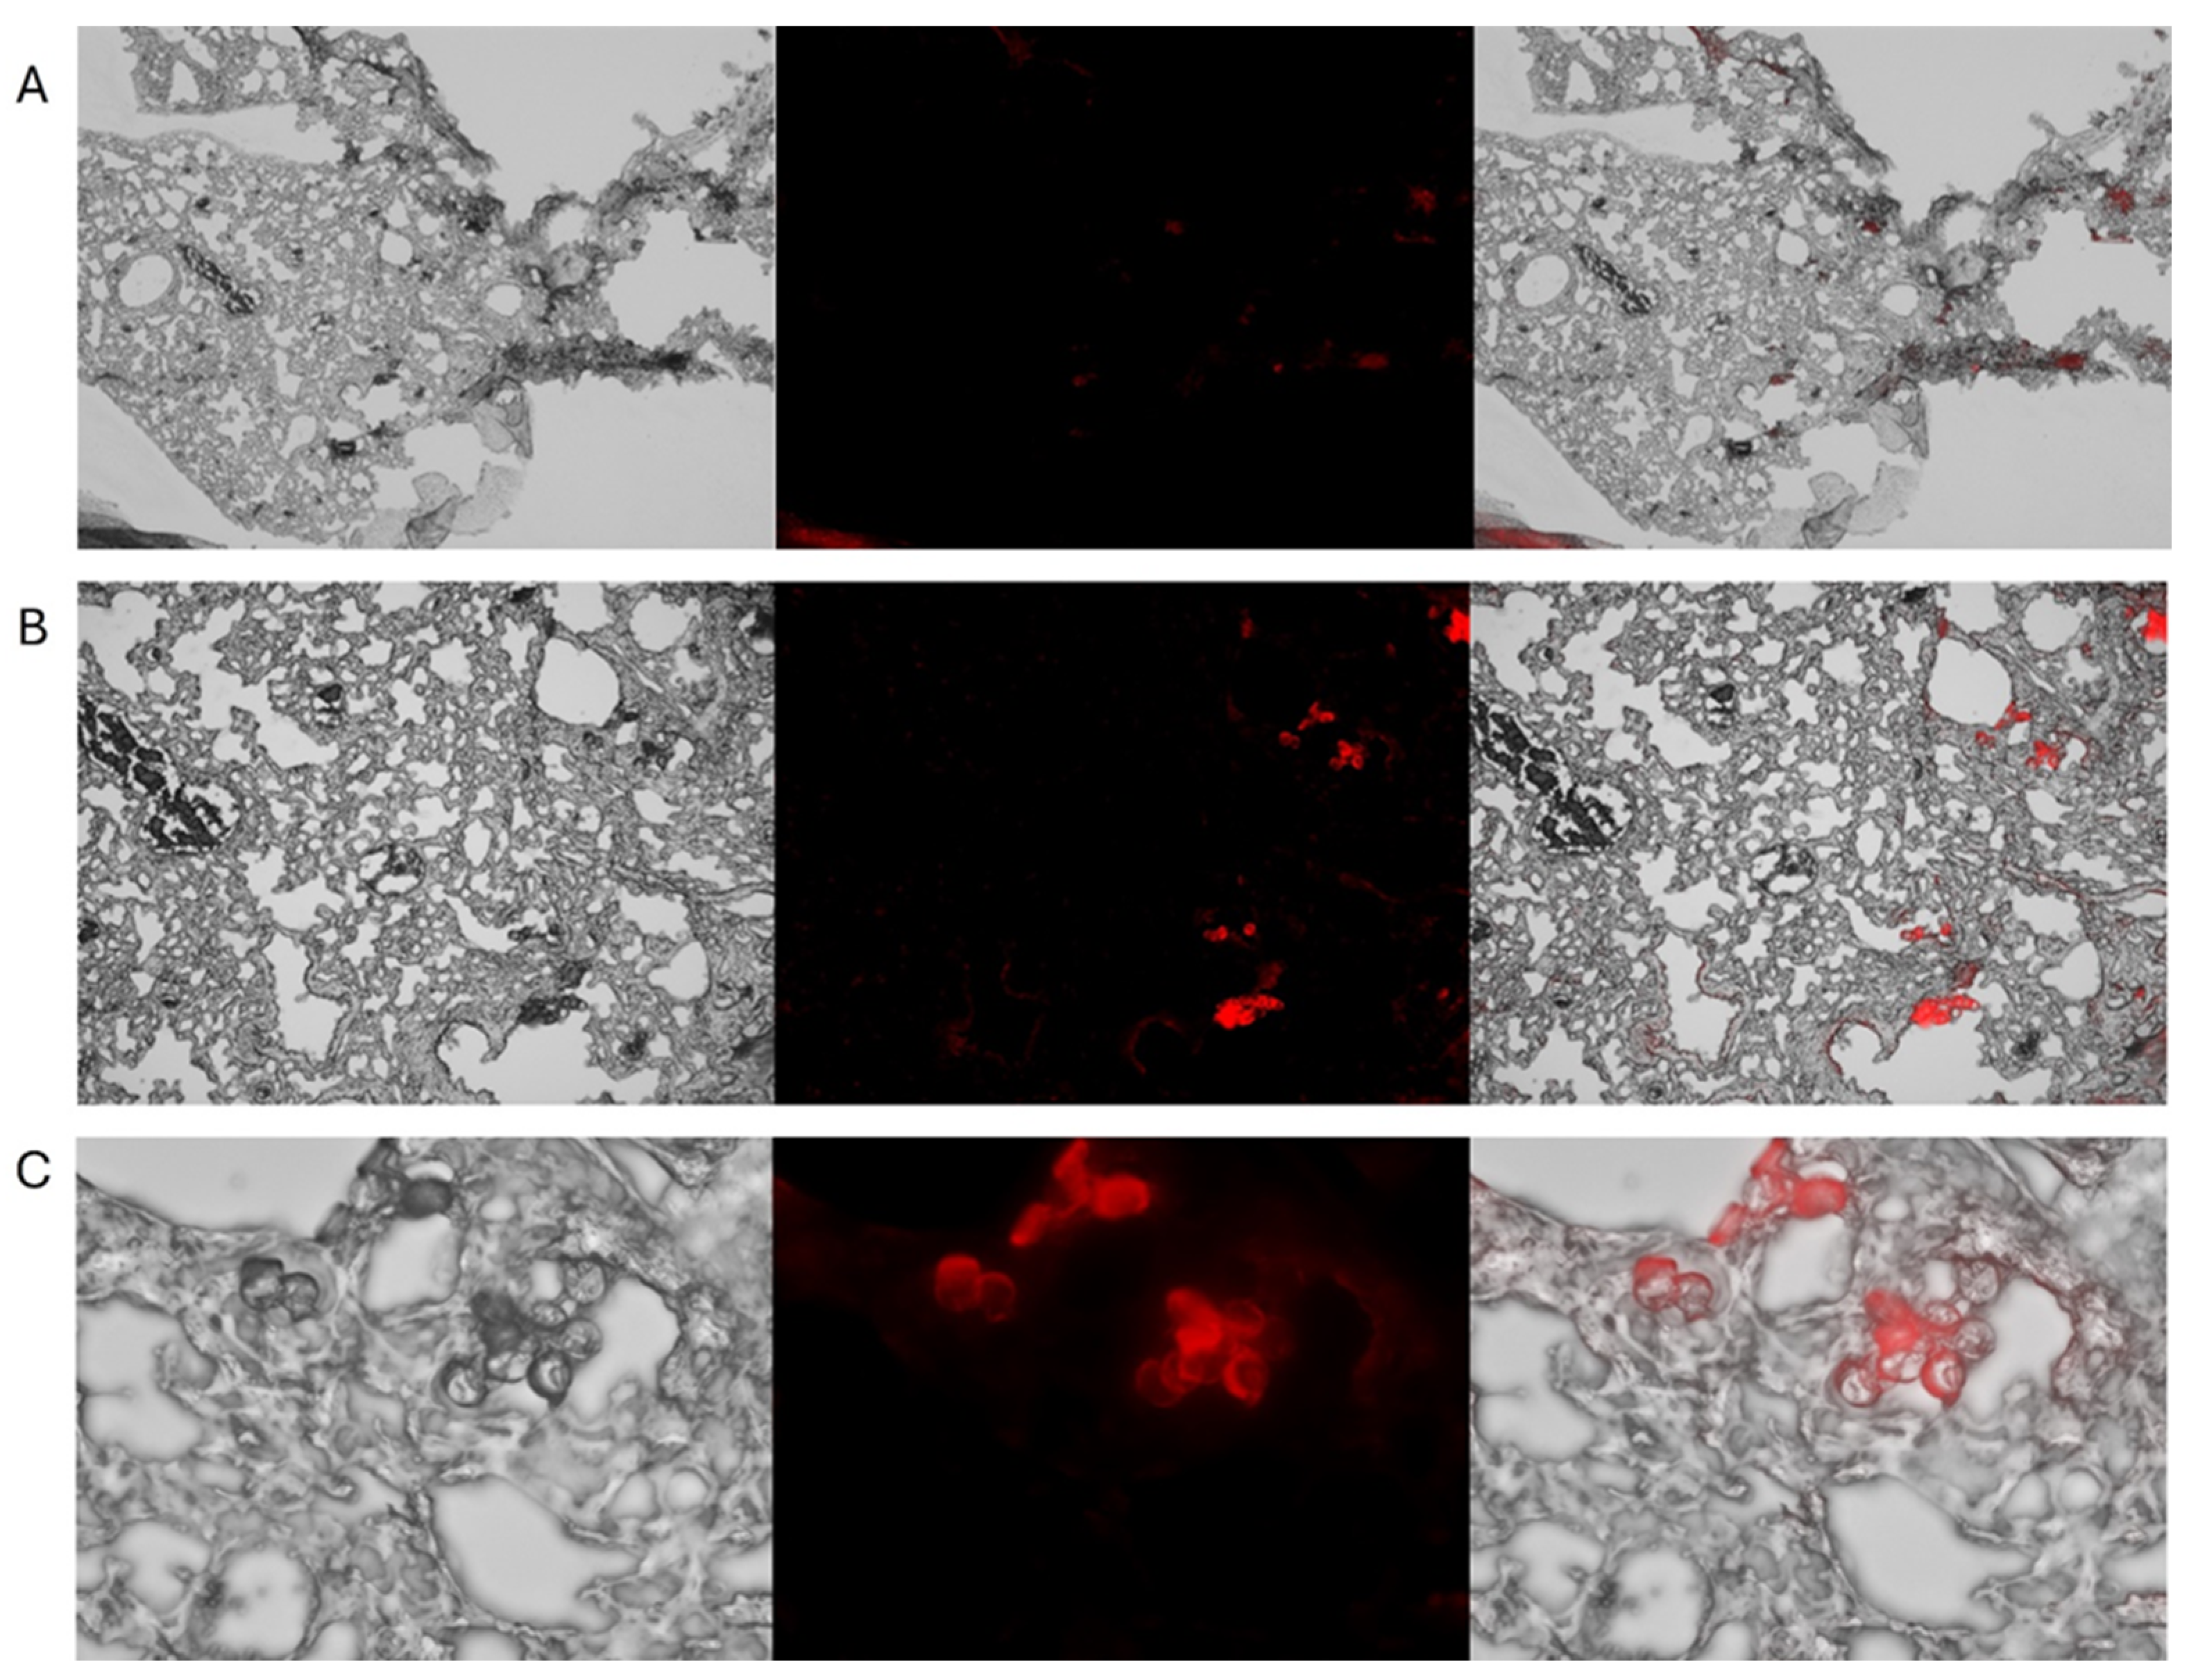
Figure 4.
Hematoxylin and eosin stained lung section captured at 20x magnification, showing birefringent particles under polarized light in different settings.
Figure 4.
Hematoxylin and eosin stained lung section captured at 20x magnification, showing birefringent particles under polarized light in different settings.
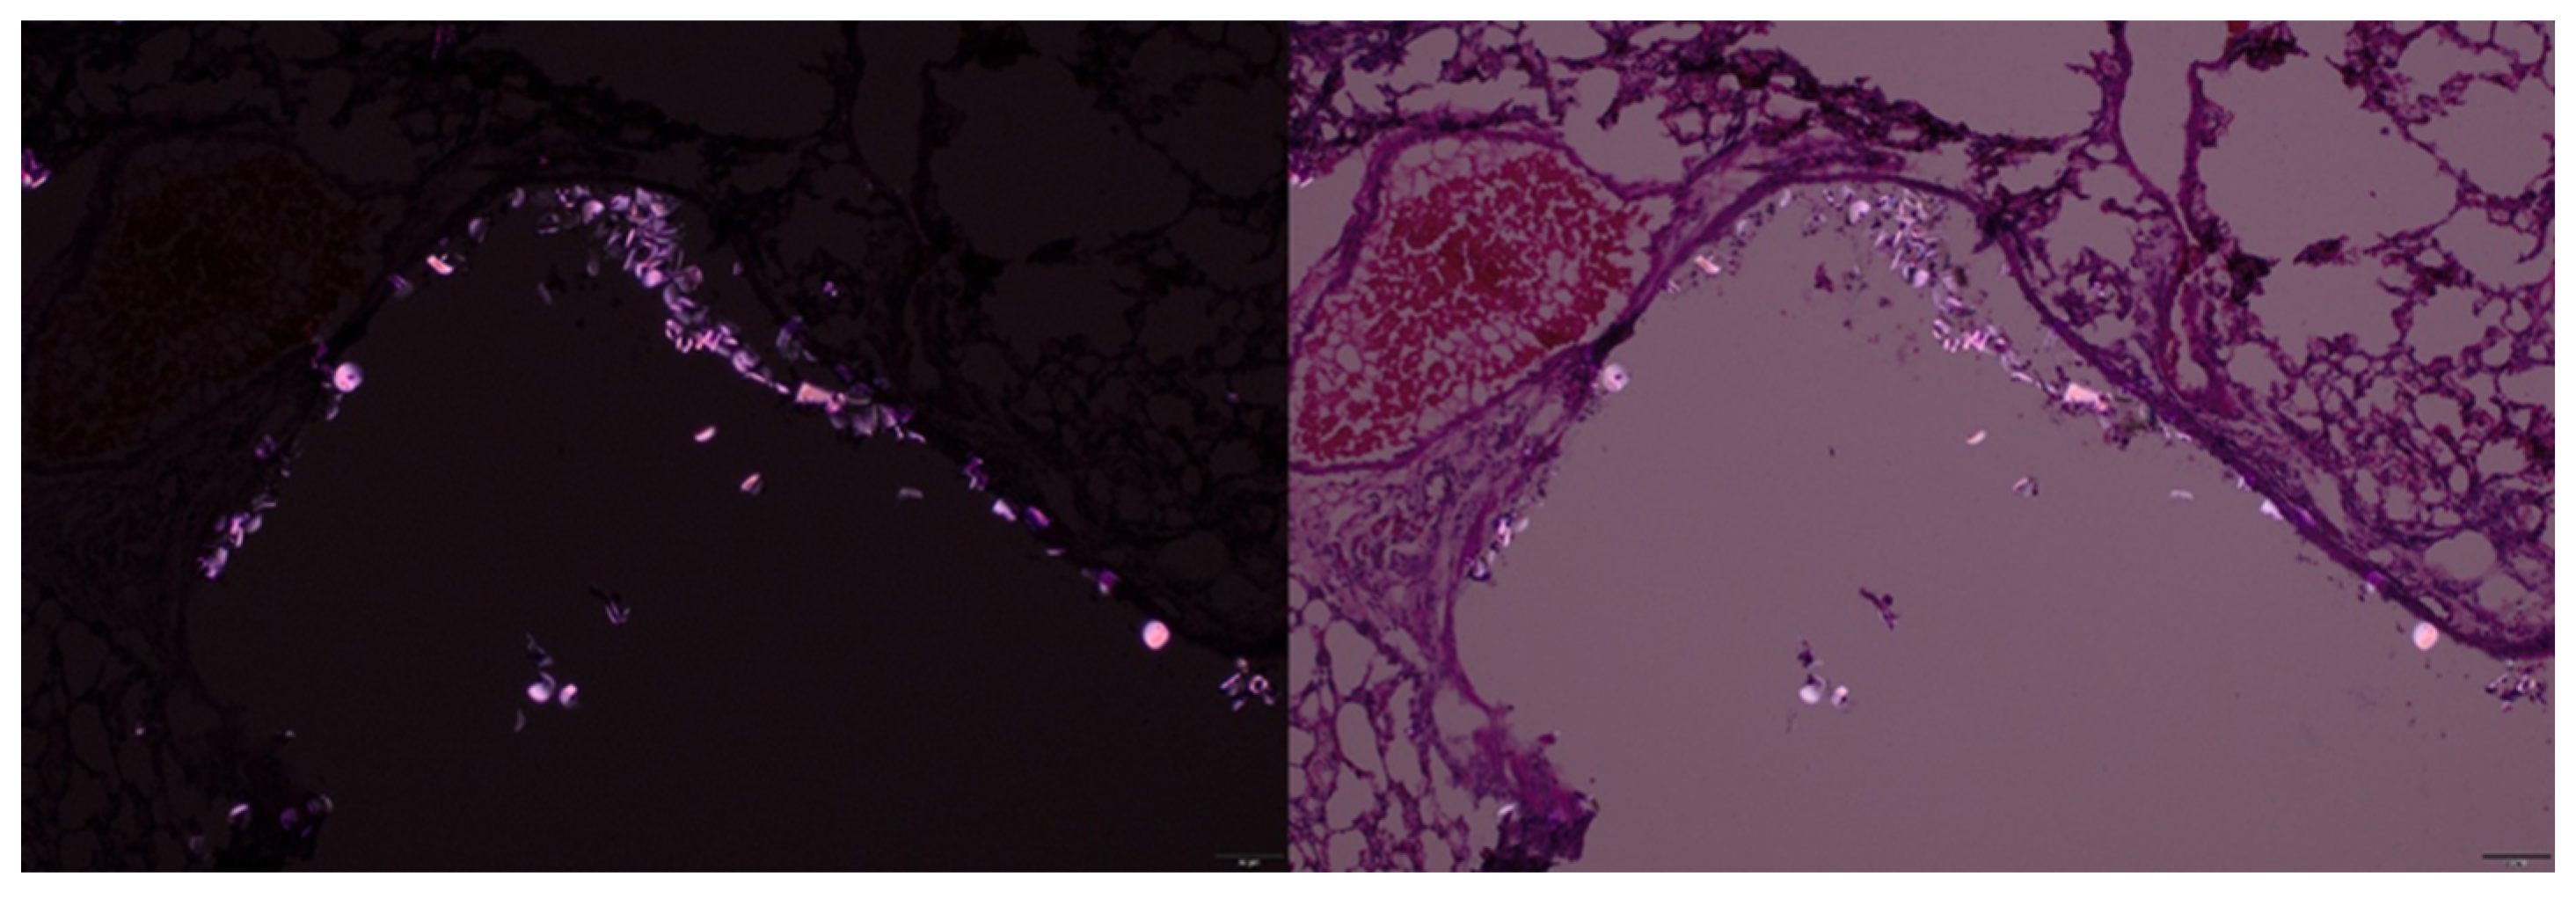
Figure 5.
Flow cytometry was used to assess fluorescence intensity in 5µm nylon MPs with and without Rhodamine staining. Left panels (A,C) show FSC-A vs SSC-A plots used to define the particle population. Right panels (B, D) display SSC-A vs PE-A fluorescence plots, with gated regions indicating fluorescent particles. Rhodamine staining resulted in a marked increase in PE+ particles (84%) (D) compared to unstained controls (C, 0.84%).
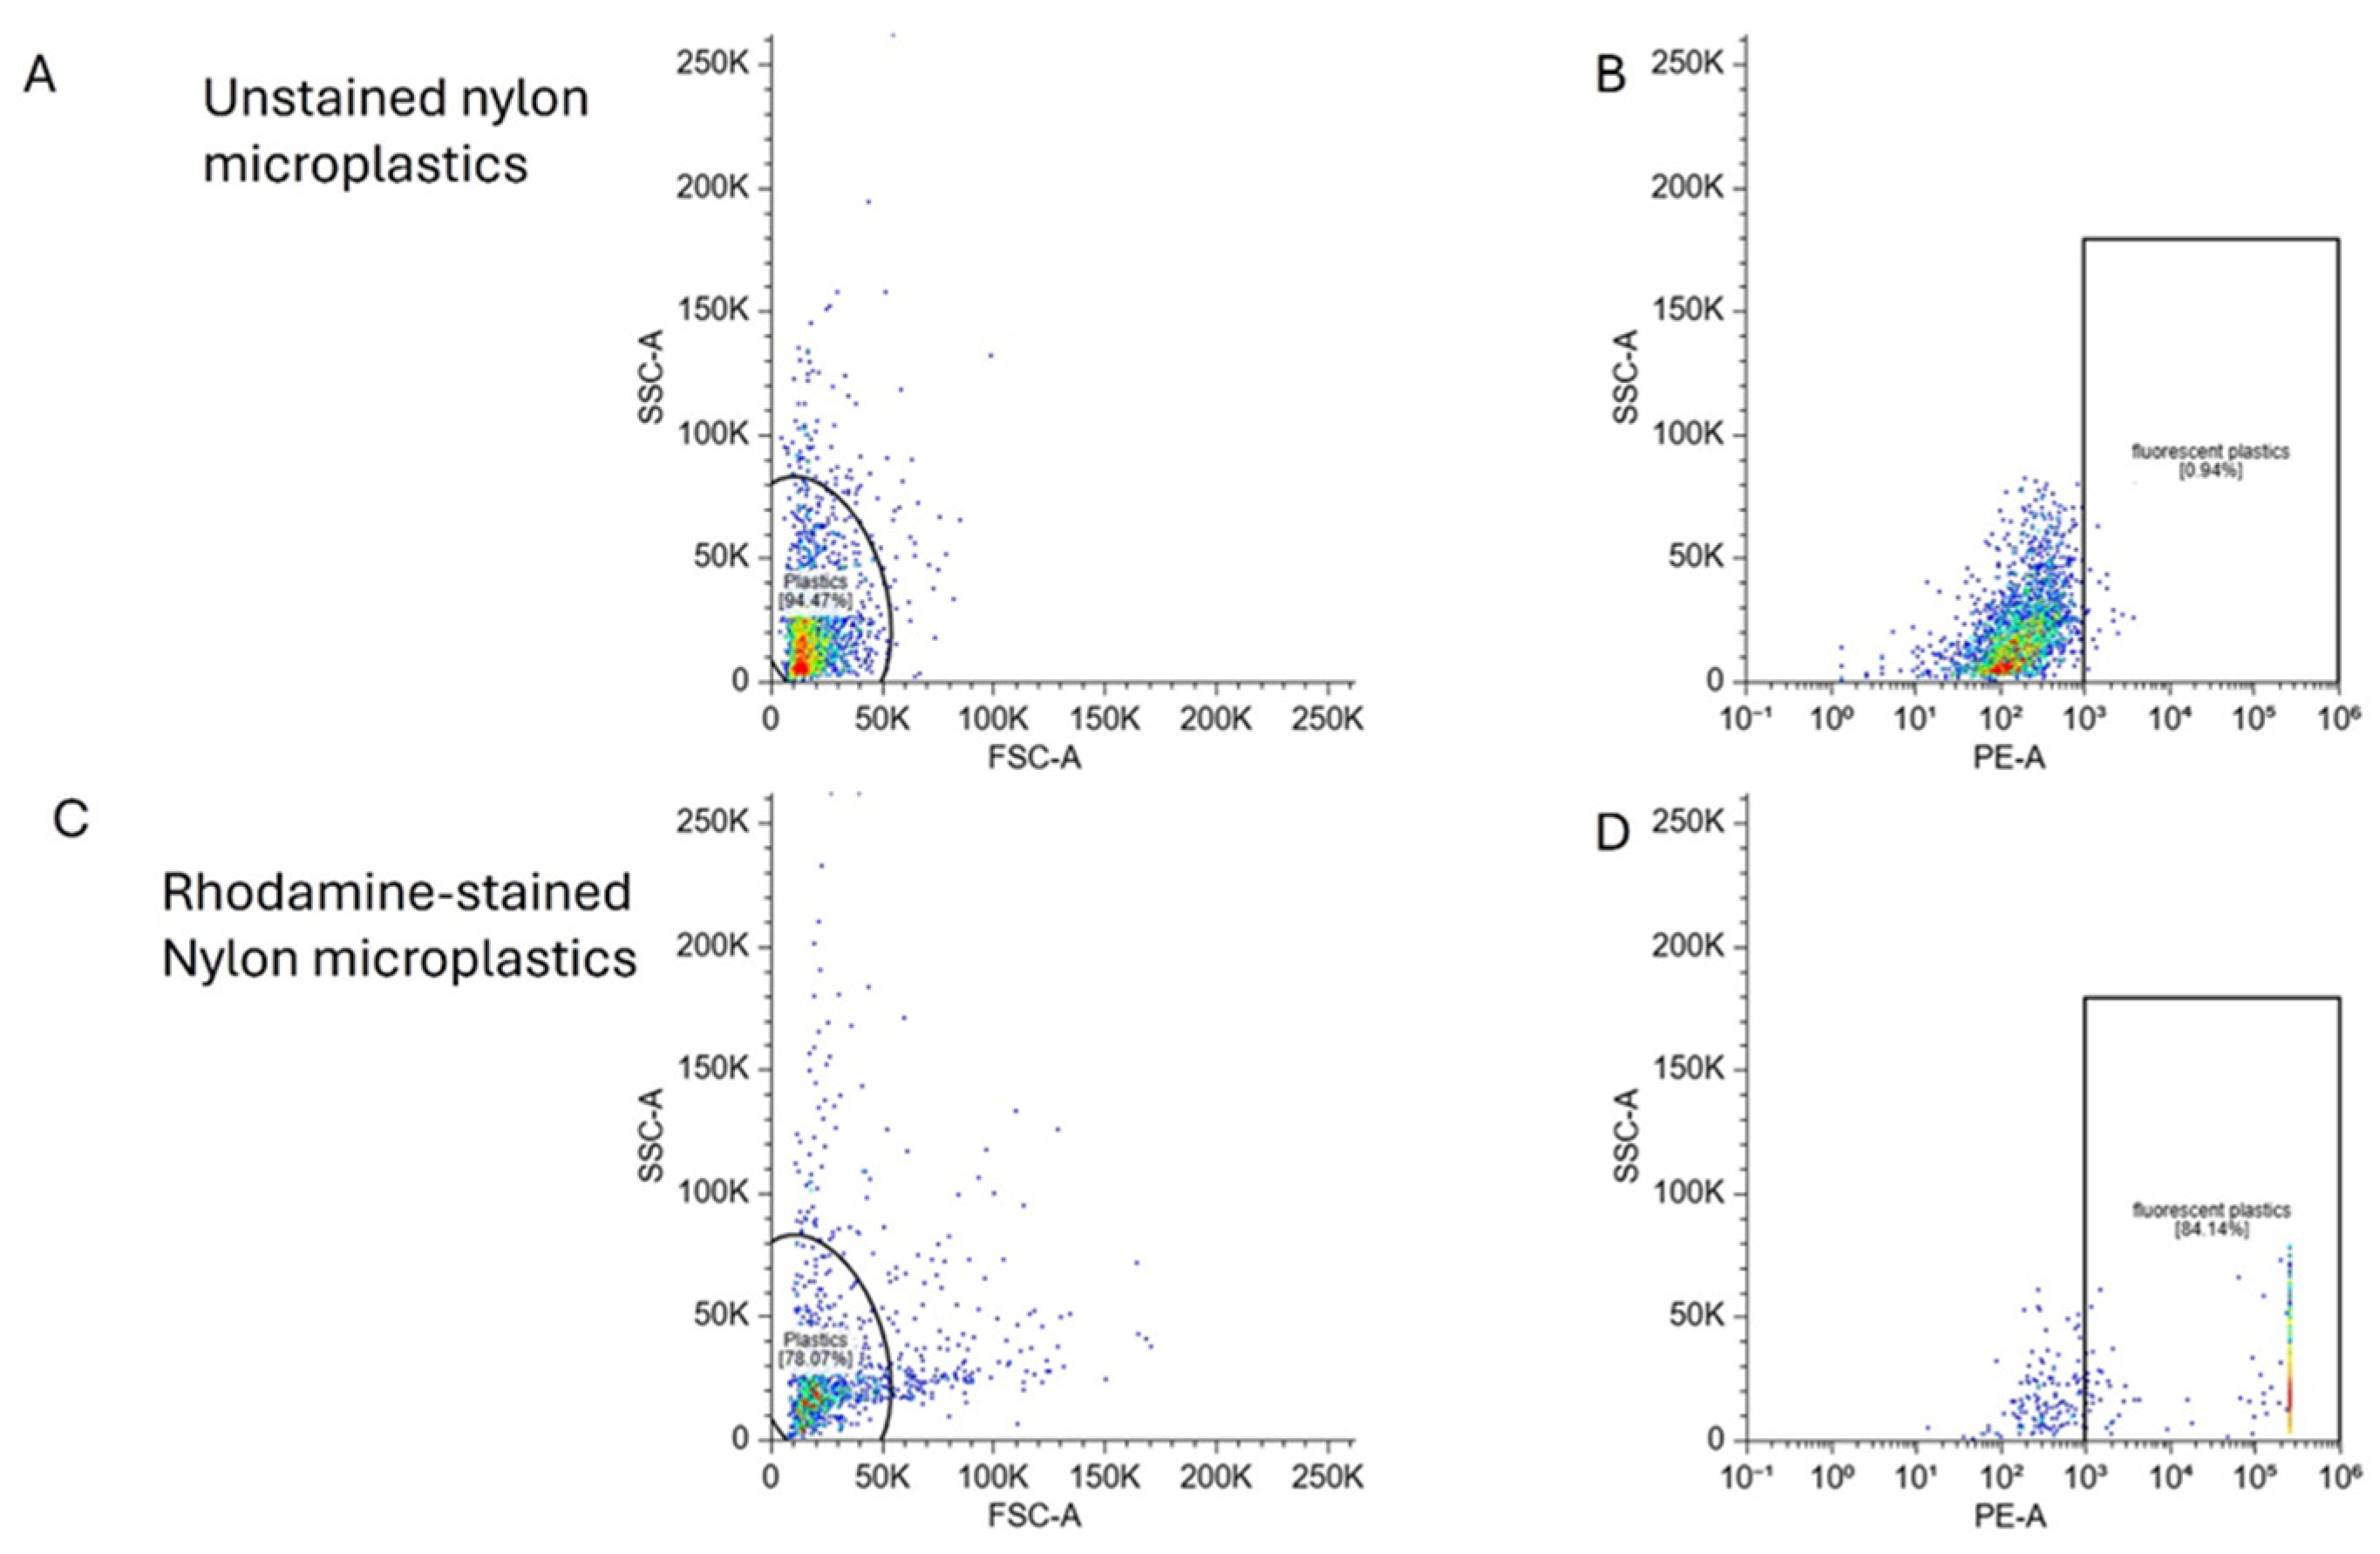
Figure 6.
The left panel (A) shows 40× confocal microscopy images of 1µm IRDye-labeled polystyrene spheres. The right panel (B) demonstrates strong signal from the IRDye labeled spheres in IVIS system using 745 and excitation in the ICG channel.
Figure 6.
The left panel (A) shows 40× confocal microscopy images of 1µm IRDye-labeled polystyrene spheres. The right panel (B) demonstrates strong signal from the IRDye labeled spheres in IVIS system using 745 and excitation in the ICG channel.
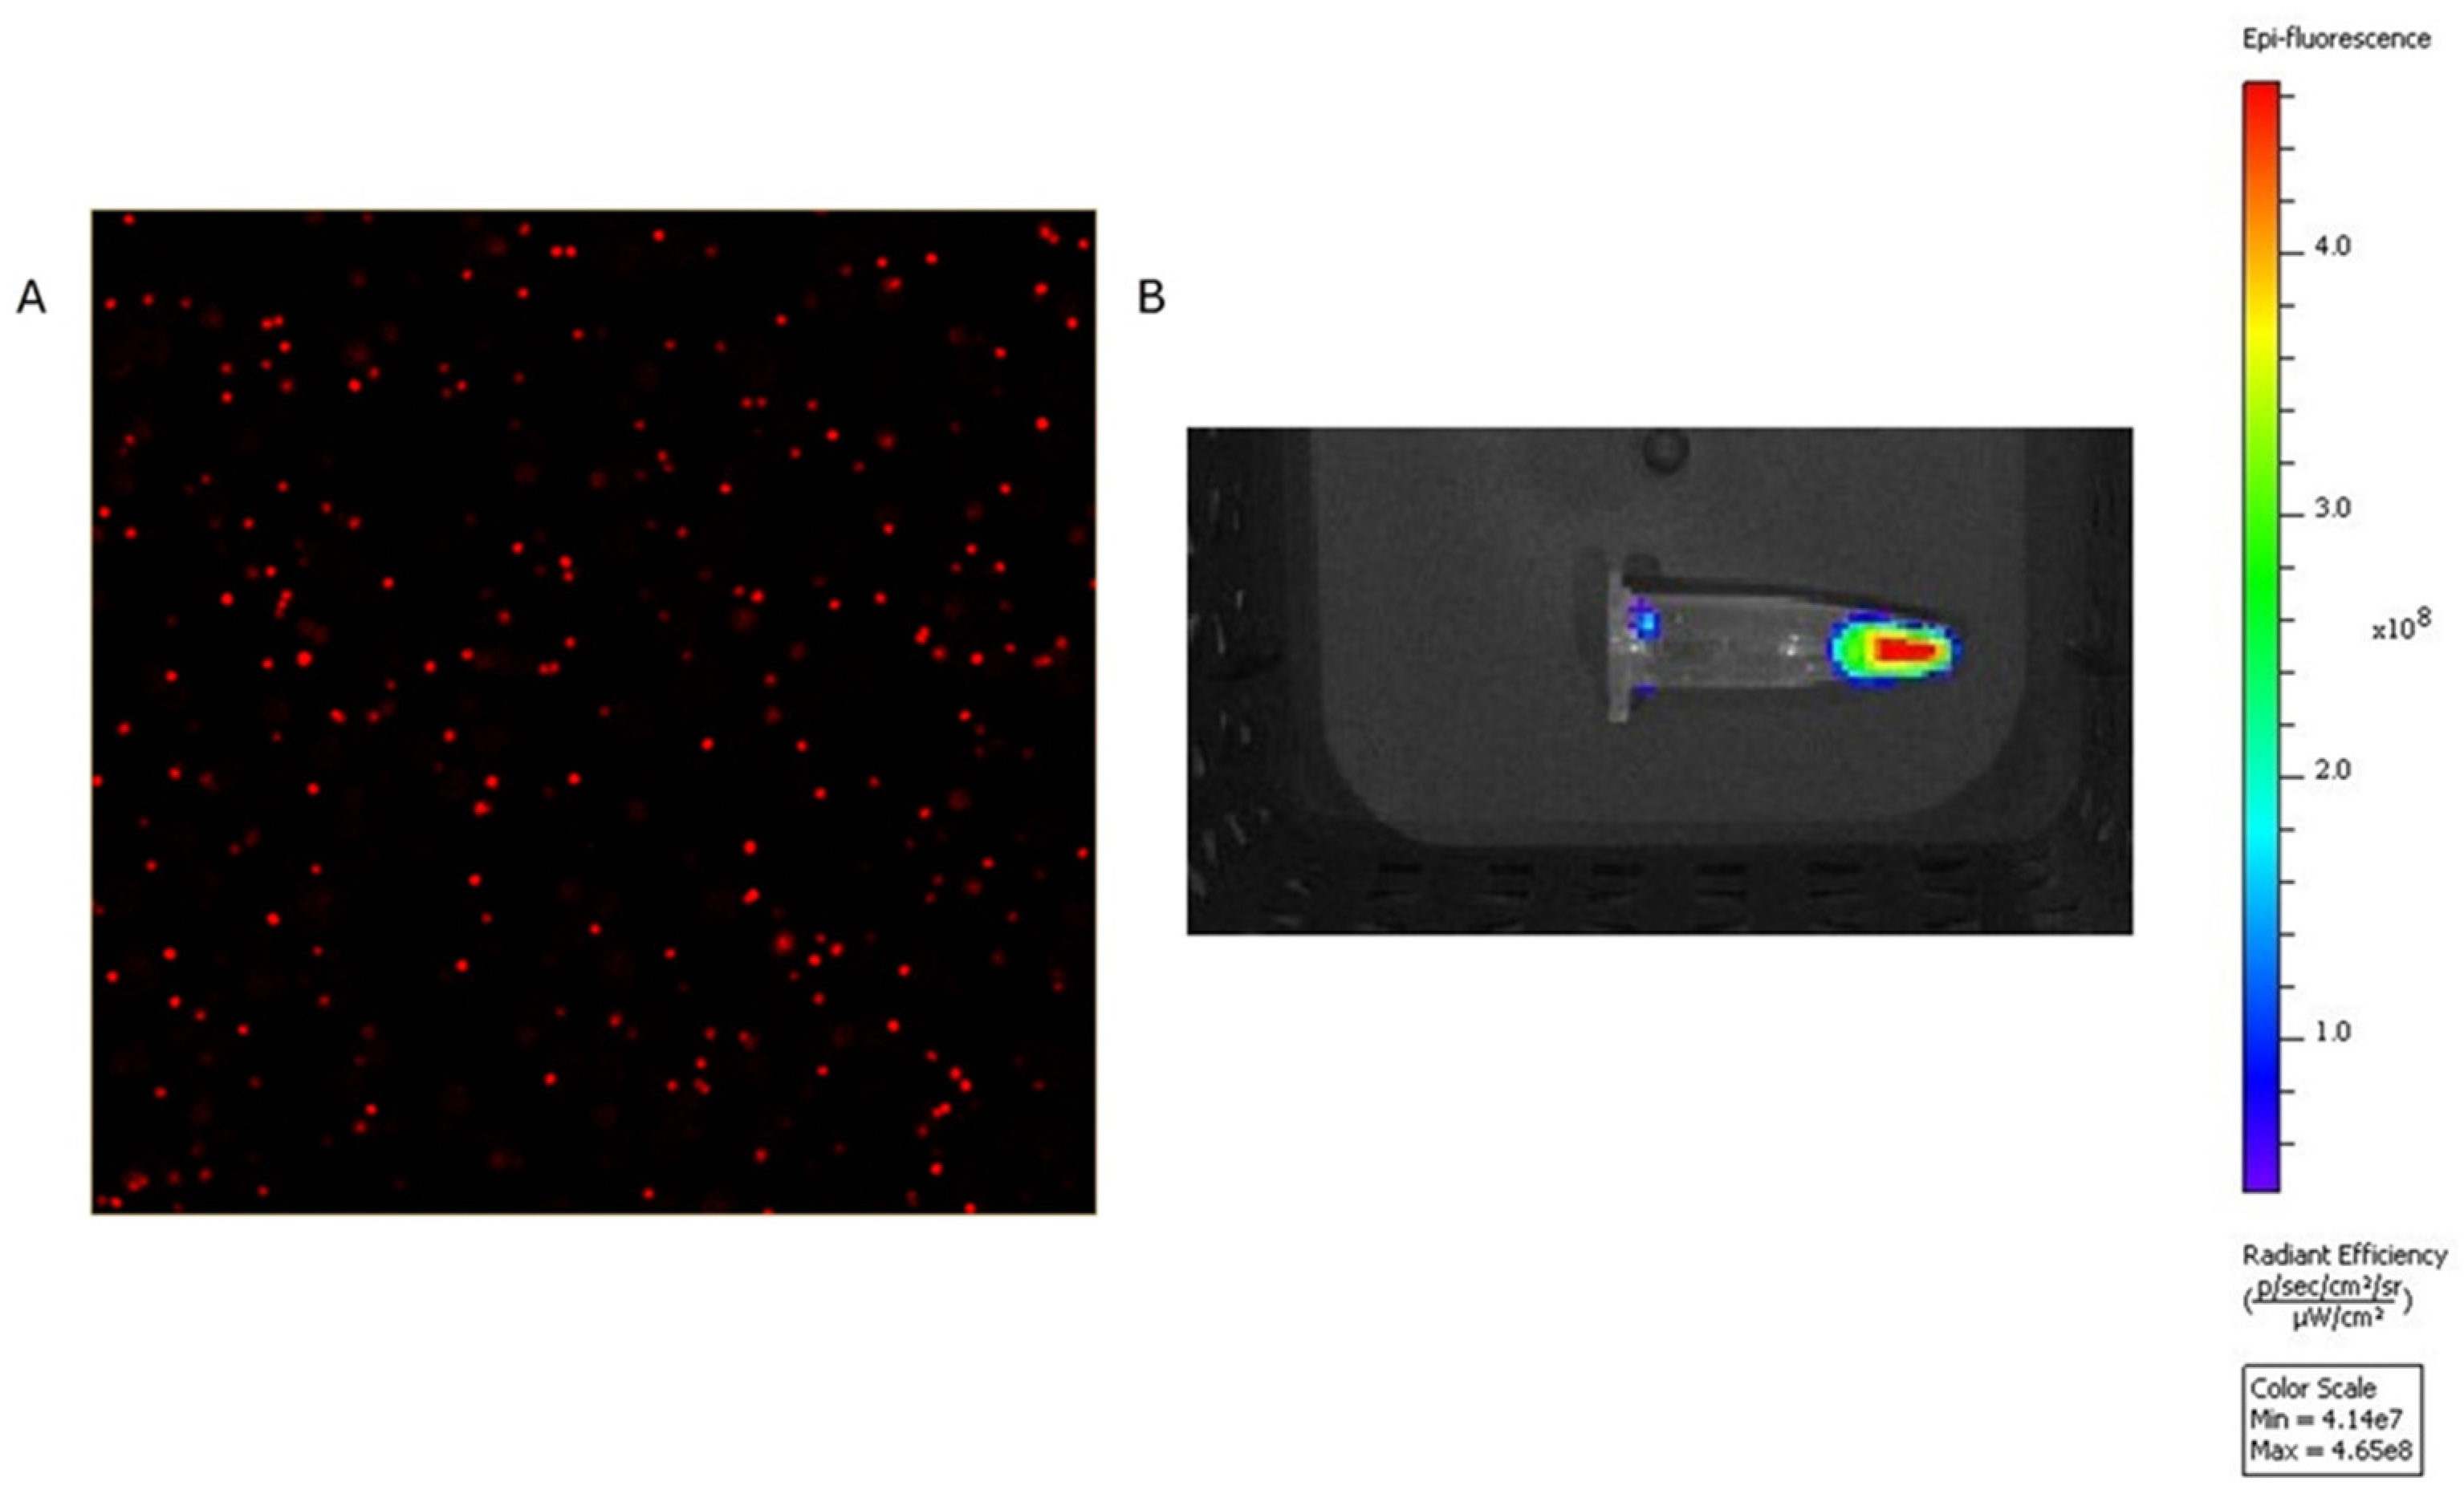
Figure 7.
Representative images acquired using the IVIS Spectrum system (ICR 745 channel) following tail vein injection showing (A) live in vivo imaging of mice infused with (n=6) 3 × 10⁸ IRDye-labeled polystyrene (PS) microplastics (MPs), free dye (n=6), or saline control (n=2) on the left panel and (B) Fluorescent imaging of Ex-vivo extracted whole organs with representative color scale. Free dye control exhibited diffuse whole-body fluorescence on day 0 followed by a rapid decrease on day 1 and 2 indicating excretion of free dye. Mice injected with PS-MPs exhibited robust signal corresponding to the abdominal region compared to saline control and remained strong even on day 3 indicating successful IRDye-PS MP capture and fluorescence. Ex-vivo liver demonstrates the highest signal in the PS-MP group.
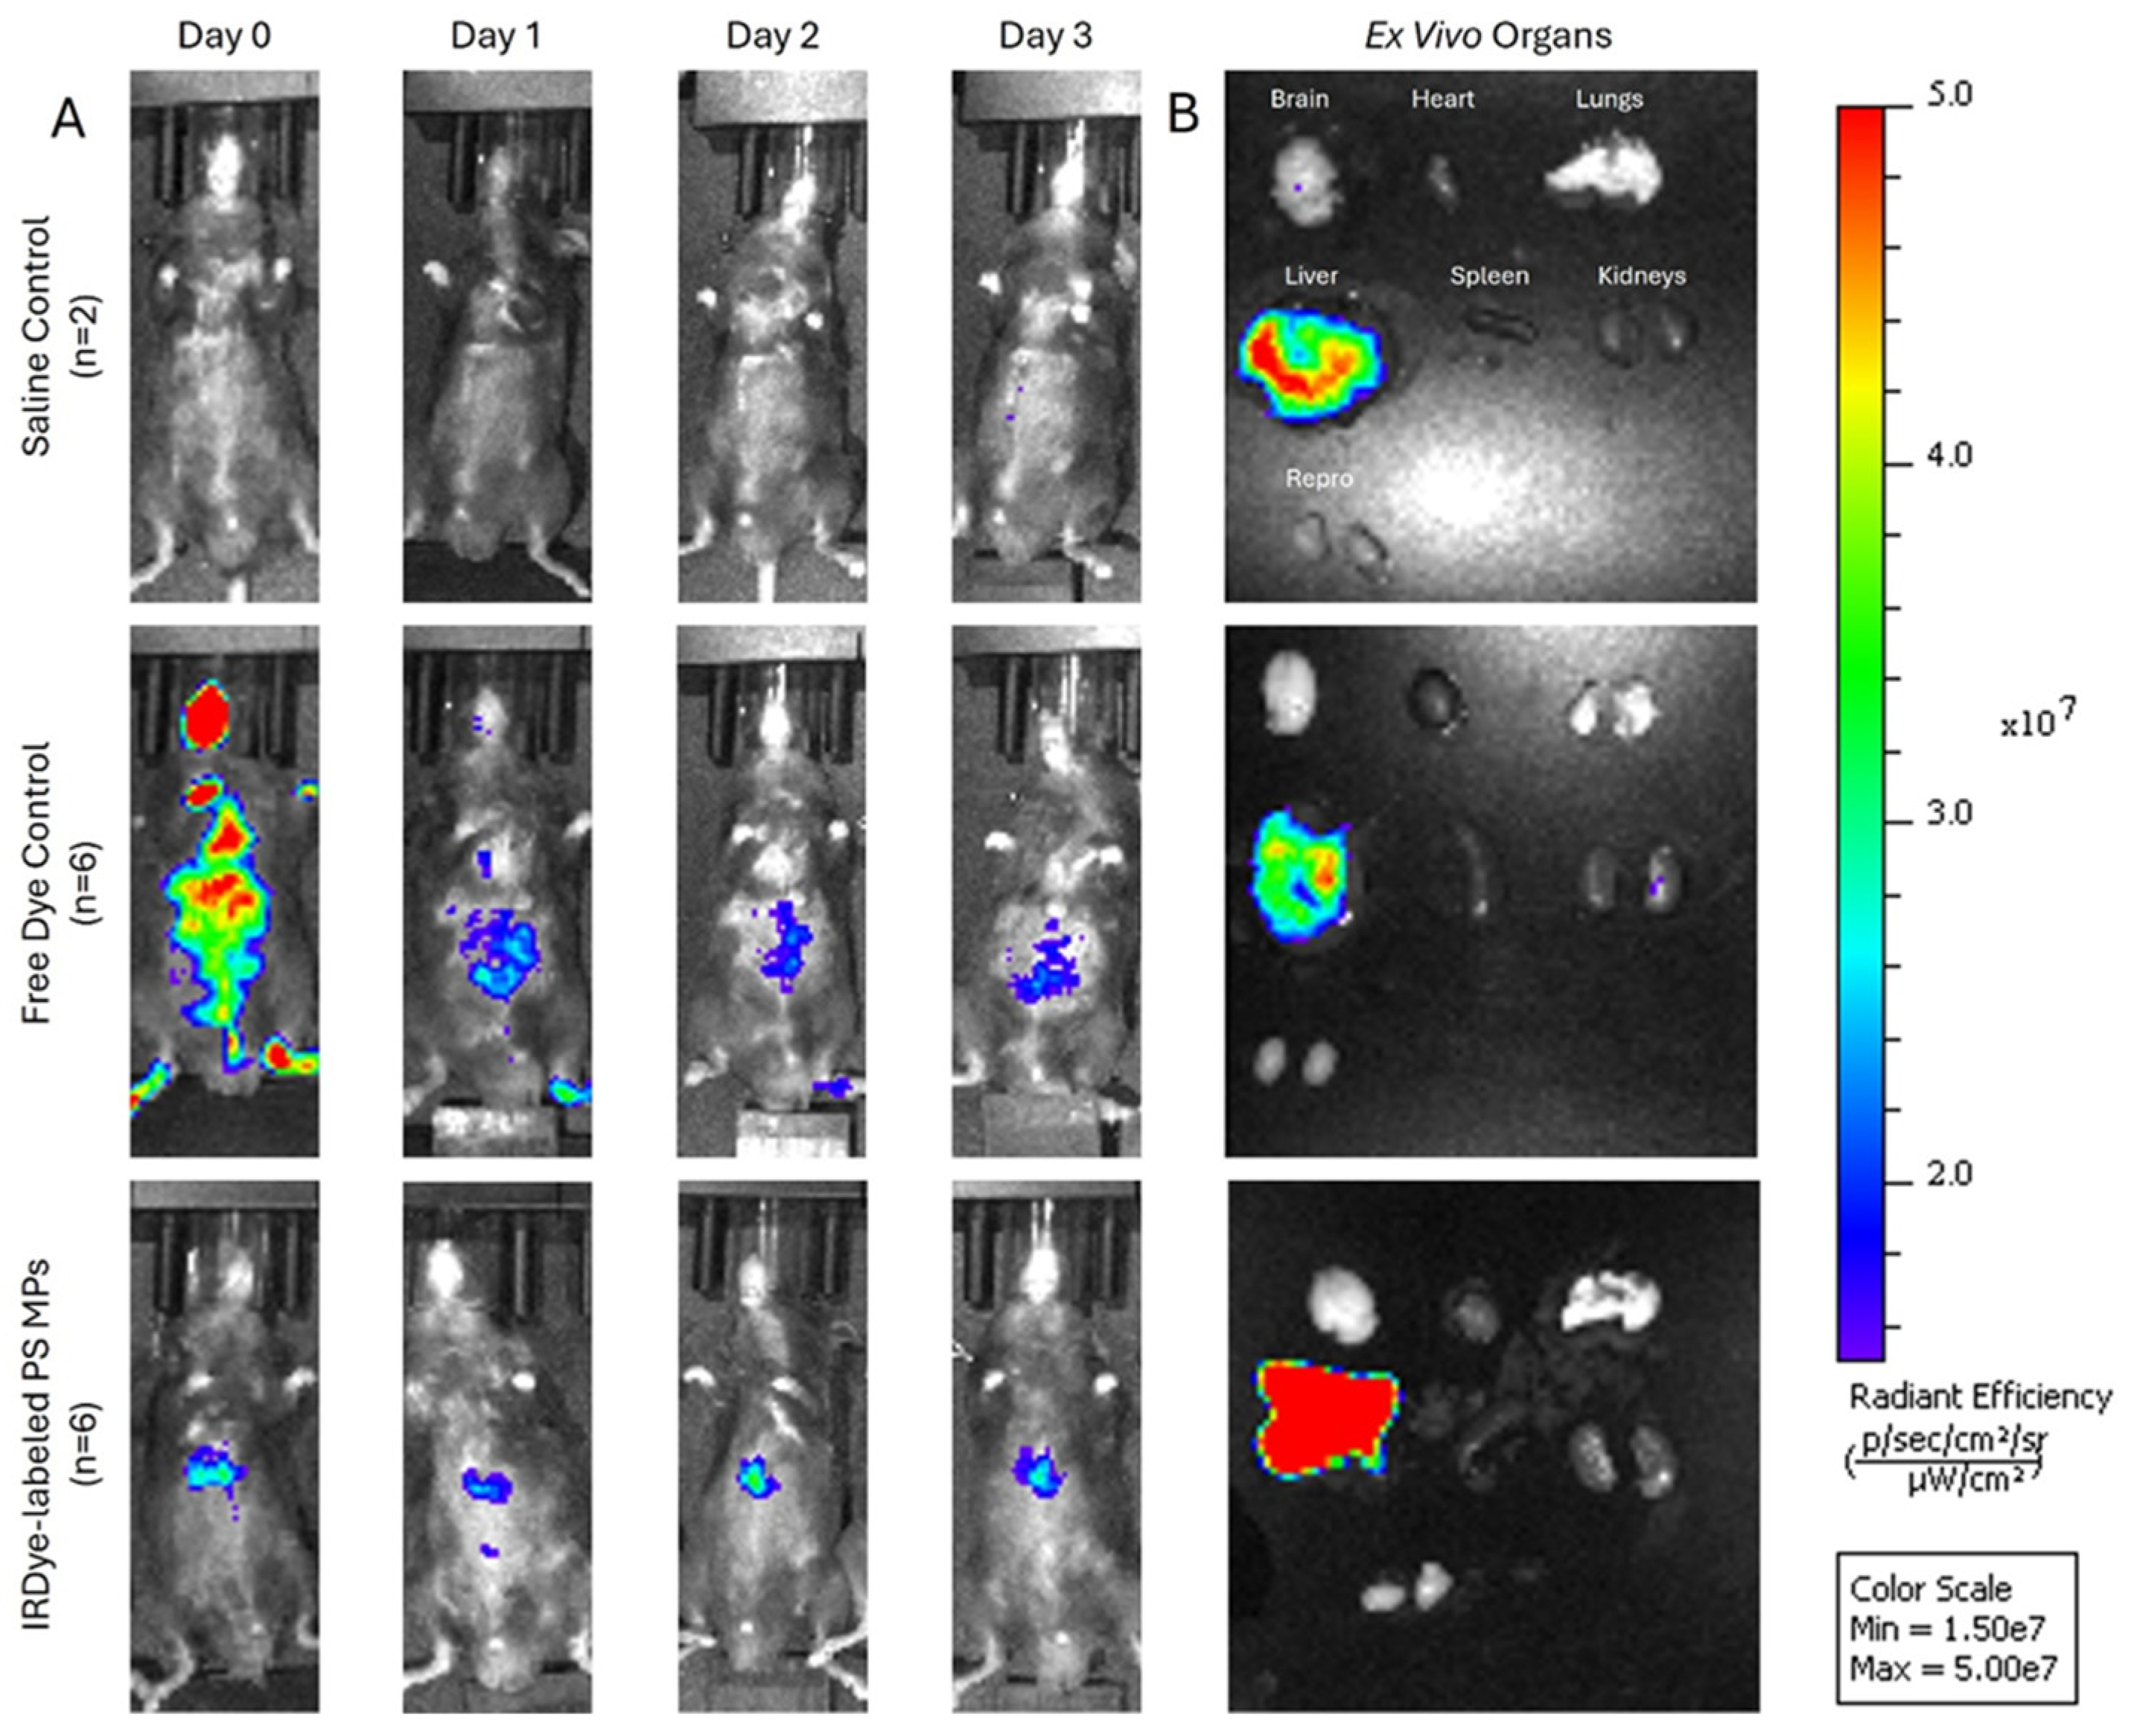
Figure 8.
Bar graphs summarizing (A) ex-vivo fluorescence signal intensity in major organs collected on post-injection day 3. (B) When normalized by weight, the spleen demonstrated statistically significant signal in the IRDye labelled MPs compared to saline control.
Figure 8.
Bar graphs summarizing (A) ex-vivo fluorescence signal intensity in major organs collected on post-injection day 3. (B) When normalized by weight, the spleen demonstrated statistically significant signal in the IRDye labelled MPs compared to saline control.
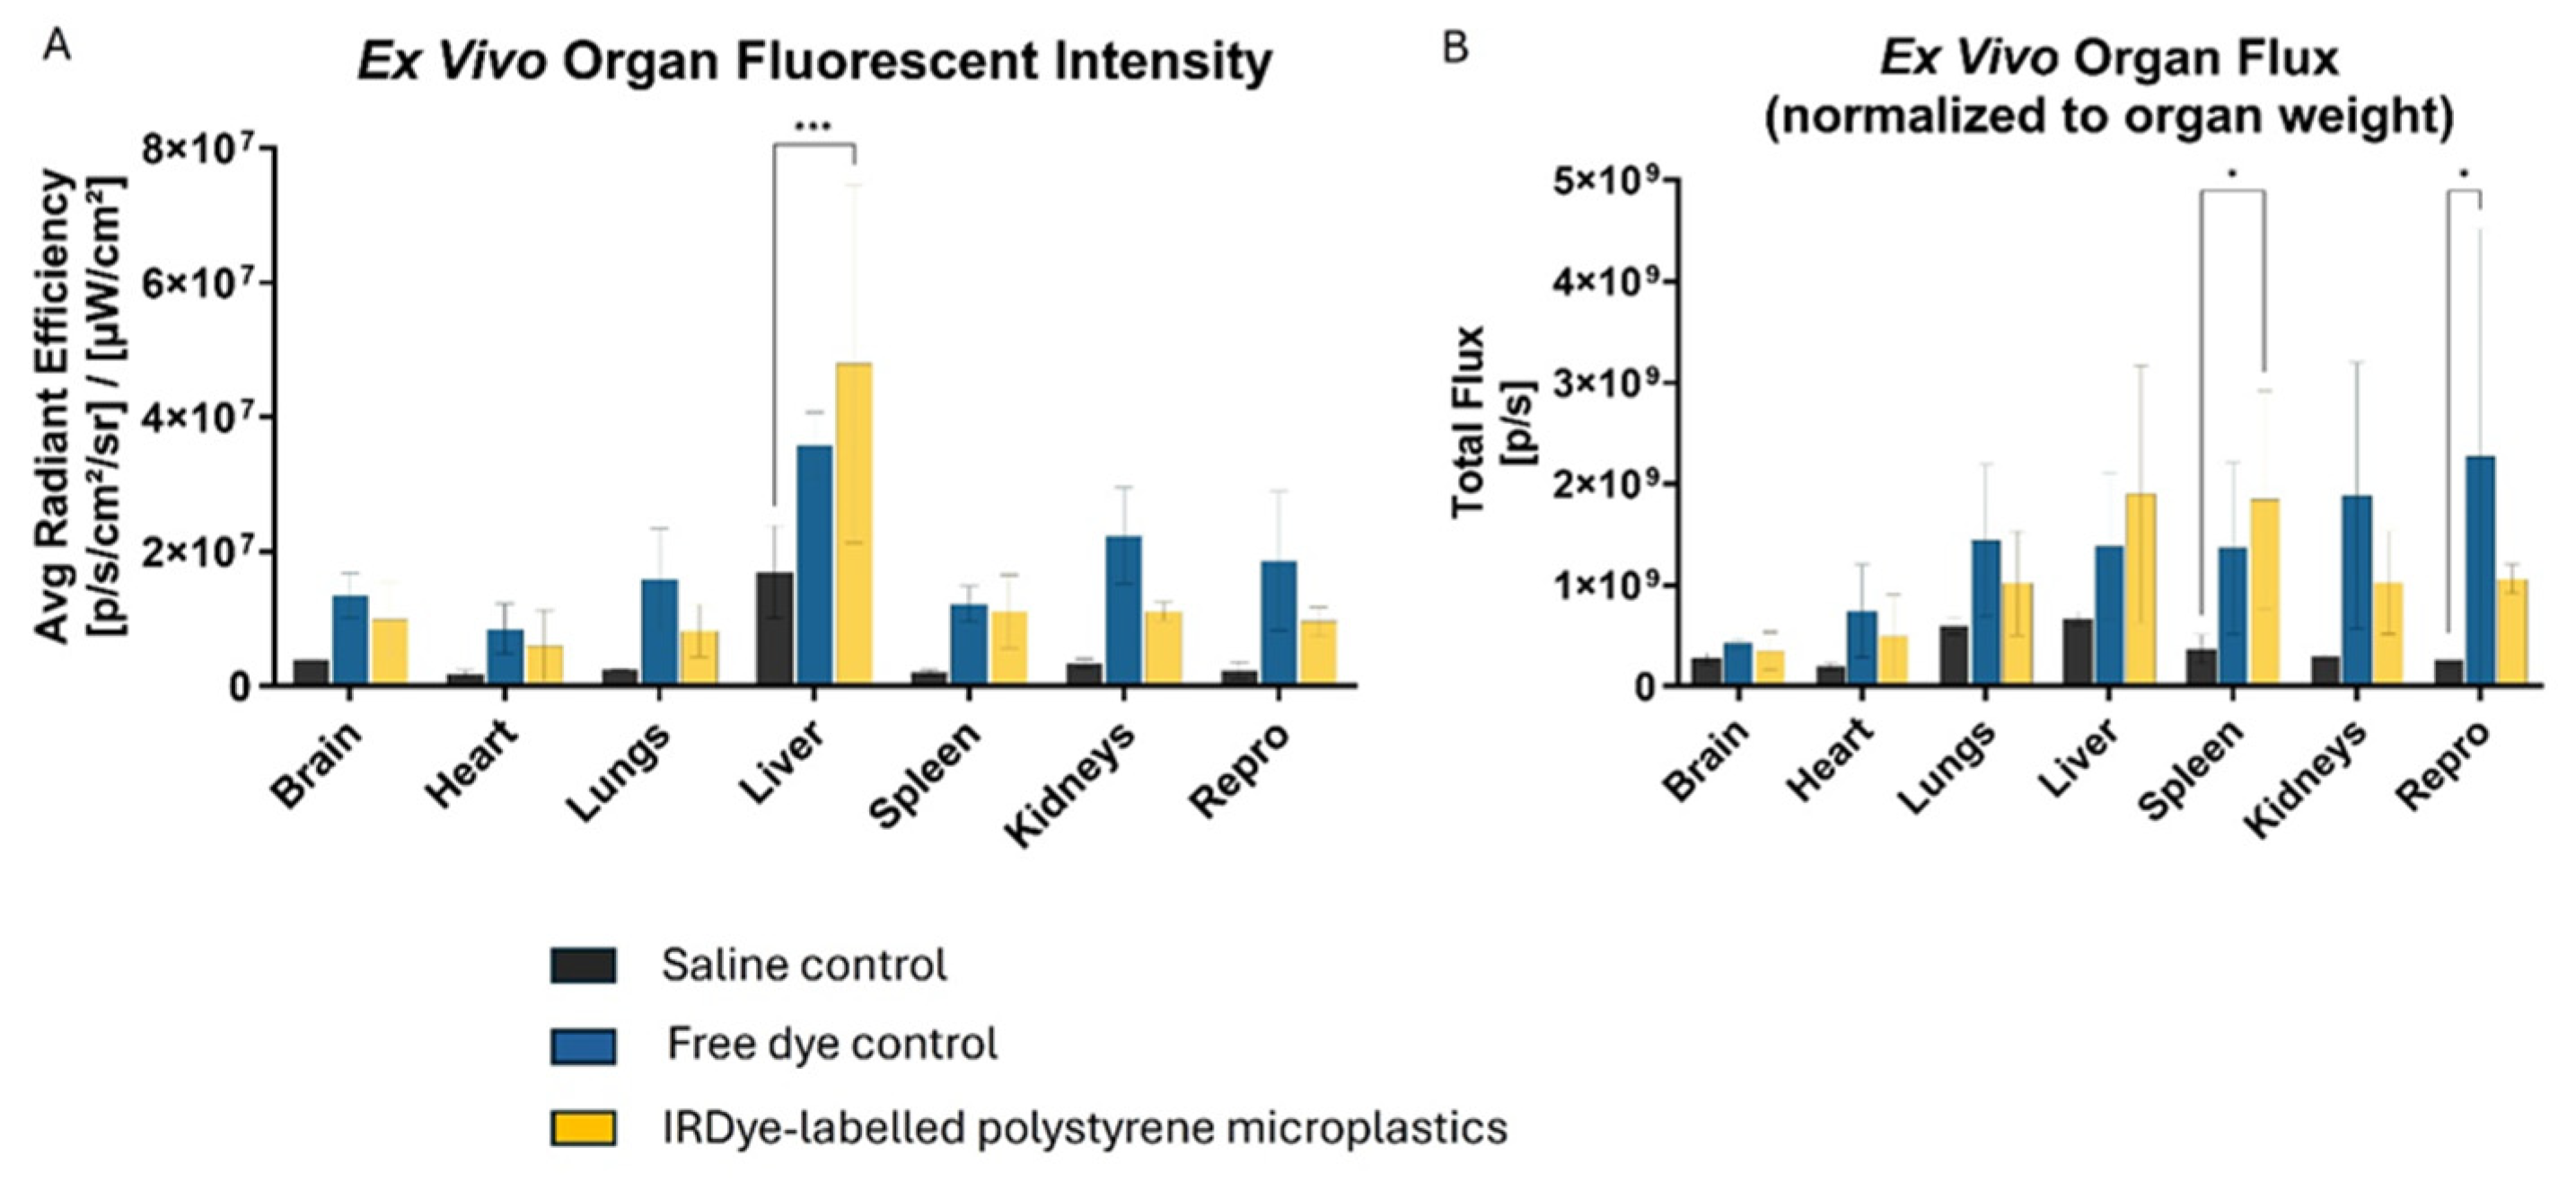
Figure 9.
Confocal fluorescence microscopy (40×) showing IRDye-labeled Microplastics (red) within mouse (A) liver, (B) spleen, and (C) lung tissue. Green autofluorescence highlights native tissue architecture. Corresponding hematoxylin and eosin-stained sections (D-F) are shown below each confocal image. To note these sections do not correspond to the same tissue section above (red arrows denote Microplastics).
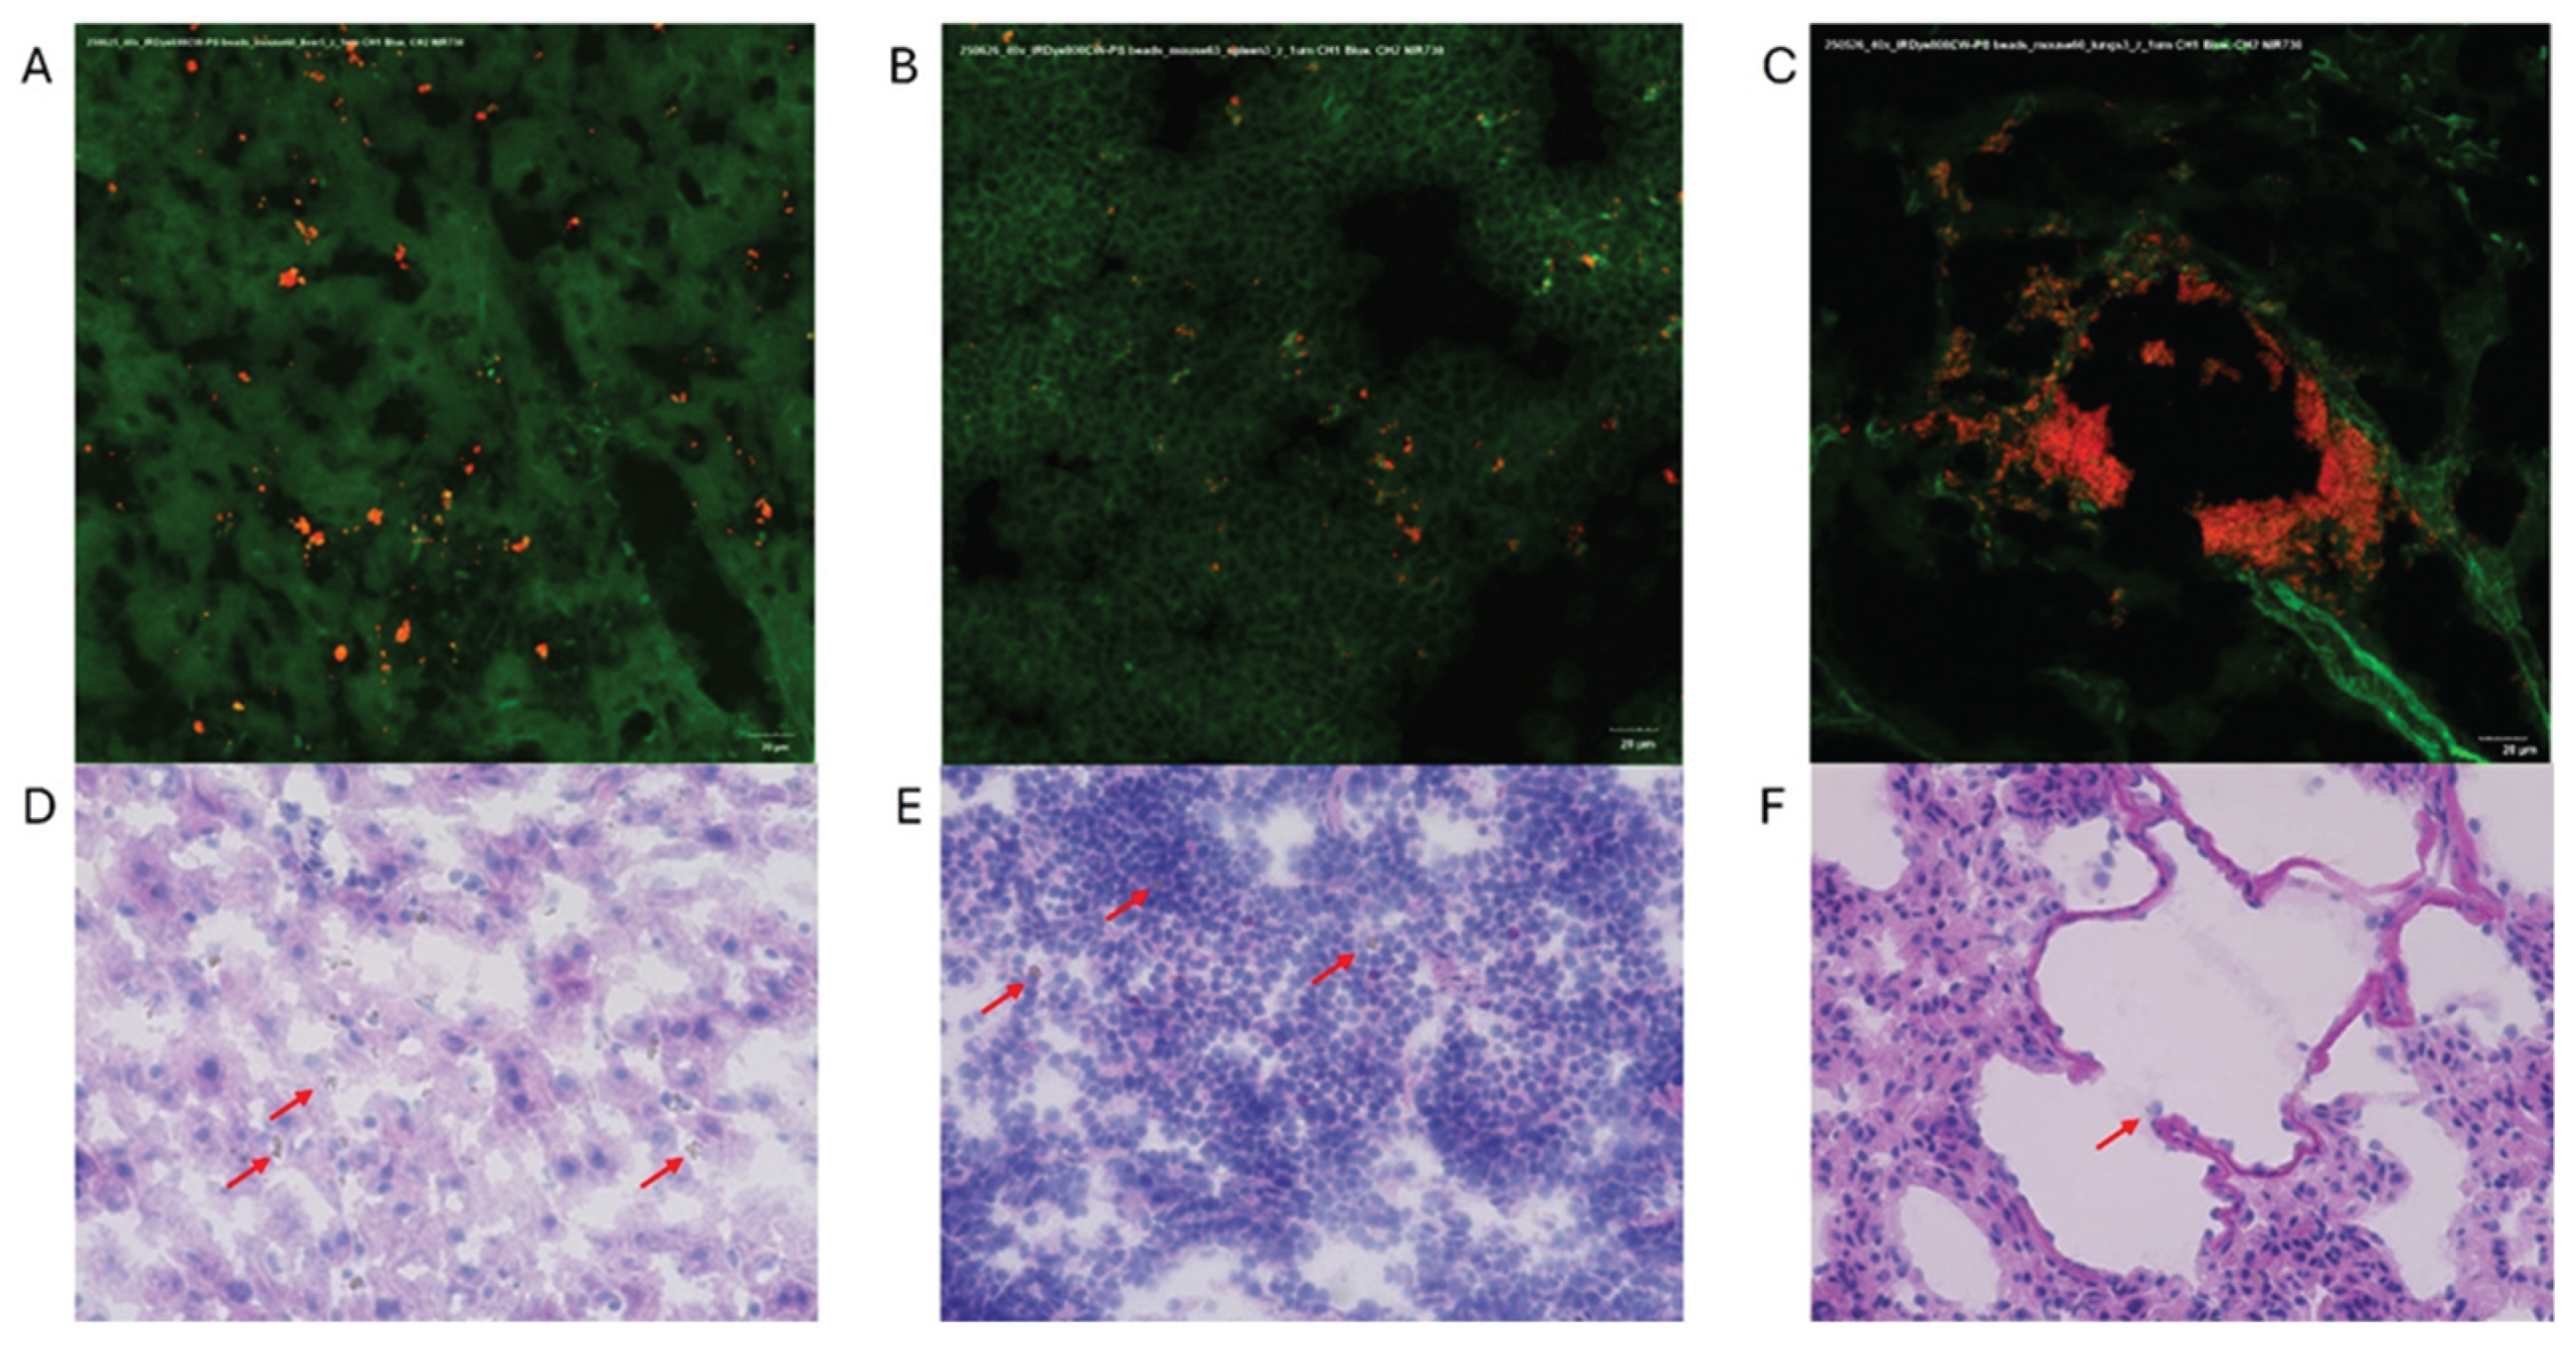

Table 1.
Size Distribution of Cryotome-Sectioned Microplastic Particles at Different Thickness Settings.
Table 1.
Size Distribution of Cryotome-Sectioned Microplastic Particles at Different Thickness Settings.
| Microtome setting | 10 µm | 5 µm | 1 µm |
| Minimum (μm) | 8.66 | 4.06 | 1.12 |
| 25% percentile (μm) | 10.93 | 6.13 | 2.28 |
| Median (μm) | 14.16 | 7.16 | 2.95 |
| 75% percentile (μm) | 16.77 | 8.68 | 4.04 |
| Maximum (μm) | 26.62 | 13.68 | 9.12 |
| Range (μm) | 17.97 | 9.61 | 8.00 |
Disclaimer/Publisher’s Note: The statements, opinions and data contained in all publications are solely those of the individual author(s) and contributor(s) and not of MDPI and/or the editor(s). MDPI and/or the editor(s) disclaim responsibility for any injury to people or property resulting from any ideas, methods, instructions or products referred to in the content. |
© 2025 by the authors. Licensee MDPI, Basel, Switzerland. This article is an open access article distributed under the terms and conditions of the Creative Commons Attribution (CC BY) license (https://creativecommons.org/licenses/by/4.0/).
Copyright: This open access article is published under a Creative Commons CC BY 4.0 license, which permit the free download, distribution, and reuse, provided that the author and preprint are cited in any reuse.


