Submitted:
29 September 2025
Posted:
30 September 2025
You are already at the latest version
Abstract
We investigate the long-term magnetic variability of OP And, a magnetically active single K giant, between 1993 and 2025. To track magnetic activity, we analyze the variability of the Hα line and two lines of the calcium infrared triplet. The variability of the Hα line reveals that the activity level of OP And is higher in the period 1993 – 2000, while during the period 2010 – 2016 it is lower, possibly close to an eventual minimum. Recent data (2020 – 2025) indicate an increase of the activity level again. The flare frequency rate and the calcium infrared triplet data (when available) follow the same behavior. In addition, the structure of the Hα line also changes with the activity level: when the activity is higher, we observe a blue-shifted component of this line, interpreted as an expanding hot area above the photosphere, but during the lower activity interval it is almost absent. Our results are in a good agreement with the idea that the magnetic field influences the mass outflow in this giant. Additionally, we examine how flare frequency correlates with overall activity. Our findings confirm that the magnetic activity level of OP And varies over time, with a steady increase observed in recent years (2020 – 2025) following a prior dip. While a complete activity cycle remains undetermined, the recent upward trend suggests that the eventual activity cycle of OP And seems to be slightly longer than 30 years. More years of observations are necessary to reach the next maximum and to determine the exact duration of the cycle.of OP And seems to be slightly longer than 30 years. More years of observations are necessary to reach the next maximum and to determine the exact duration of the cycle.
Keywords:
cool giant star
; magnetic activtiy
; activity cycle
1. Introduction
OP And (HD 9746) is a K1 III single active giant. The rotational period is d [1,2] and a projected rotational velocity of 8.7 km/s is determined [3]. The mass of this star is about 2.0 , the effective temperature is , the surface gravity [4] and the metallicity [Fe/H] = 0.0 [5]. From an evolutionary point of view, the star is situated at the end of the first dredge-up phase, just beginning to climb the red giant branch (RGB). Only one giant with fast rotation and high magnetic activity is known at this position on the Hertzsprung-Russel diagram (HRD): V1192 Ori [4]. The Rossby number of OP And is estimated at 0.47 [6] and is in agreement with its observed high activity level. Its value below unity presumes that the dynamo operates there. The star also follows the magnetic field - rotation relation for single cool giants [4].
This giant is also known for its high lithium abundance, [7]. This means that OP And is among the giants with the highest lithium abundance known. Taking into account that it deviates from the majority of fast rotating and active stars on the so-called "first magnetic strip" on the HRD, shown in [4] and in [6], a planet engulfment episode is not excluded for this cool giant.
No radial velocity variations were observed by [3], down to a measurement accuracy of 0.33 . Similar result is reported earlier by [8] and [9], and so it seems that OP And is a single star. Further studies [10,11,12] also confirm this conclusion. In any case, no evidence for a close companion to contaminate the rotation and activity of the giant is found. Also, our spectral studies covering more than 30 years found no long-term radial velocity variation, excluding a distant secondary.
The spectrum of OP And is characterized by significant variability in H, the lines of the CaII infrared triplet (hereafter CaIRT) and the CaII H&K lines, all of which are well-known indicators of magnetic activity. The spectral profiles of these lines in OP And are those of absorption lines but with an emission component in their cores, which fills the absorption to a variable degree in time [2,11,12,13]. In addition, the profile of the H line also displays a blue-shifted (at 79 km/s) emission component of variable intensity [10], which is considered to be caused by a hot expanding area located above the photosphere, linked to mass loss [14]. Sometimes during flare events, H also displays a red-shifted emission component [10]. In the literature, examples of the profiles of the mentioned activity indicators in the spectrum of OP And can be seen in [10,12] both in regular state and during flares.
[15] suggested the presence of circumstellar material around this giant on the basis of IR data. Later, [2] found the position of OP And regarding the MgII Dividing line [16]. It illustrates that on the RGB, OP And has just crossed the MgII Dividing line, with being at the onset of chromospheric outflow. How the magnetic field contaminates the outflow during the eventual activity cycle is a topic of interest for our study.
Our spectral dataset covers the time interval 1993 – 2025, more than 30 years. The length of this dataset presents a unique possibility to study the long-term activity behavior of this unusual magnetic K giant and to look for an eventual cycle.
2. Observations and Methods
In this work, we present previously unpublished observations of OP And in high resolution spectroscopy which correspond to 38 observations that span over 6 years. These new observations were obtained with the high-resolution spectrograph ESpeRo [17] at the 2-m telescope of the Rozhen National Astronomical Obsrvatory (NAO), Bulgaria. In order to study the long-term magnetic variability of the star, we also use data from previous studies, which together with our new measurements compound to 110 individual dates of observations taken over the course of 31 years. These observations are presented in [12]. For our analysis, we use three spectral lines which are known indicators of flare activity: H ( 6562 Å) and two lines of the CaII infrared triplet (CaIRT): 8498 Å and 8662 Å. In the previous studies of OP And we refer to in this work, other spectral lines were used as well: the calcium H&K lines (at 3968 Åand 3933 Å, respectively) and the remaining middle line of the CaIRT (at 8542 Å). These lines are widely used as indicators of stellar chromospheric activity; however, we do use them in our present study due to instrumental limitations. The Ca H&K lines are at the very end of the spectral range of ESpeRo, where the signal-to-noise ratio is too low in the case of the relatively cool OP And. The middle line of the CaIRT, on the other hand, is located in an overlapping region of the echelle orders: at the very end of one and also at the very beginning of the next. This introduces a significant error to the spectral line’s measured intensity due to its being at the very edge of the CCD matrix. In principle, the line profile can be obtained by averaging the profiles obtained from both echelle orders, but it is unclear how reliable the result would be. To avoid working with such uncertain measurements, and since the behavior of this line is not expected to differ significantly from that of the two other lines of the CaIRT (since all three of them form under very similar conditions), we decided not to include the 8542 Å line in our analysis. Indeed, as it will be seen in the paper, the two other lines of the CaIRT show very similar variability through all the observational dataset, so it is likely that the third line would also have the same behavior. Since H is the only spectral line for which measurements are available over the entire time span of the observational dataset, we will primarily focus on this line in our analysis, and the measurements of the CaIRT lines, when they are available, will be used mainly as confirmation of the overall behavior of the activity level inferred from the variability of H.
The newly presented observations were reduced using DESpeRo [18], a fully automated data reduction software (DRS) written specifically for the ESpeRo instrument. The DRS is written in python and extracts high-resolution stellar spectra from raw .fits images. From the resulting spectra, the Image Reduction and Analysis Facility (IRAF) was used to measure the relative intensity of the spectral lines - the intensity at the core of the spectral line divided by the intensity of the adjacent continuum, following the procedure described in [19].
The full log of observations is shown in Table A1 in the Appendix. The first column of the table lists the calendar dates of observations, as well as the instrument used to obtain them, denoted as follows:
- C - the Coude spectrograph at the 2-meter telescope of the Rozhen NAO, data presented in [20];
- N - the Narval spectropolarimeter at the 2-meter telescope Bernard-Lyot, France, data presented in [11];
- E - the ESpeRo spectrograph at the 2-meter telescope of the Rozhen NAO, previously published data presented in [12].
All data up to and including 7 March 2018 have been previously presented in [12] (as discussed in this paper, the observations obtained with Narval in 2008 and 2010 had their spectral resolution lowered in order to enable comparison of the relative intensities measured from them to those in the rest of the dataset). The last 38 observations spanning over 6 years have not been previously published and were all obtained with ESpeRo. Many of the observations consist of more than a single exposure. In these cases, all the spectra obtained in the same night were examined individually to check if the profiles of the selected three spectral lines show noticeable differences in their depth and/or shape between the individual exposures. Such differences could occur in the event of a flare, observed in a state with significant short-term variability. For most observations, this was not the case and these spectra were combined into a median spectra in order to reduce noise. In some cases, however (the dates 18 August 1994, 9 June 1996), the spectral lines show clear differences in individual spectra obtained during the same night. These exposures were not combined into a median one, but instead were measured separately and so appear in the Table A1 as two separate observations. The second column shows the Julian date (JD) of the observations. Columns number 3 to 8 show the relative intensities and their error of measurement of the three spectral lines studied in this paper: H, CaII 8498 Åand CaII 8662 Å. The last column lists whether the observation shows a flare. We consider an observation to be a certain flare if: a) several activity indicators show significantly higher values than those measured in proximate dates, caused by increased emission at the line core (i.e. we observe the flare in several indicators); b) different spectra taken during the same night show differences which are typical for a flare event (i.e. we observe the temporal evolution of the flare). An observation is considered a suspected flare if only a single spectral indicator shows an increased emission component. These are the same criteria that are used in [12]. In the last column, observations that are considered a certain flare are noted with a "C", and those that are considered a suspected flare are noted with an "S", and next to this notation, the reason for this classification is also noted: "H" or "CaIRT" means that the flare is observed in the respective indicator, "SI" means it has been observed in several indicators, and "SS" means it has been observed in several consecutive spectra obtained during the same night or during consecutive nights. The horizontal line at 7 March 2018 indicates where data from previous studies end and where the previously unpublished observations begin.
3. Results
3.1. The H line
Figure 1 shows the temporal evolution of the relative intensity of H (top panel) and its blue-shifted component (bottom panel) between 1993 and 2025. In the figure, judging from the relative intensity at the core of H, it can be seen that the activity of OP And is at a relatively high level between 1993 and 2000. The activity level is significantly lower between 2010 and 2016, indicating a possible minimum. After that, it appears to be steadily increasing again. If we exclude the points which show flares, either certain or suspected, we can evaluate the activity level of the star in the quiescent state (not perturbed by flares) by fitting the remaining points (which are represented by black circles in Figure 1) with a function (represented by the black curve in the top panel of Figure 1). To fit the data, a polynomial of the fifth degree was picked, because it describes the general trends in the dataset without overfitting. We point out that this fit is not intended to be used as a strict measurement of the activity level, but is only a rough quantitative evaluation of it.
The blue-shifted component of H (whose evolution is shown in the bottom panel of Figure 1) shifted by about 79 km/s with respect to the restframe velocity of the star [10], shows significant variability throughout the studied time window. During the perceived maximum of 1993-2000, this component is mostly present and in emission, being significantly above the level of the pseudo-continuum (shown with a dashed horizontal line), and during flares it is visibly higher than during the quiescent state. During the lower activity phase (2005-2016), this blue-shifted component is almost never present - its relative intensity is at or below unity. From 2016 on, the emission component is again occasionally present, however, in contrast with the interval 1993-2000, it is not stronger during flares. Since the blue-shifted component is linked to mass loss [12], this suggests that mass loss is not as strong in recent times as it was in 1993-2000. A possible reason for the difference in the emission level of the blue-shifted component of H during flares between the previous (1993-2000) and current (2016-2025) higher activity states might be a difference in the height of the magnetic loops. If the magnetic loops were, on average, higher during the 1993-2000 active state than they are during the present one, this might explain the stronger emission in the blue-shifted component of H, provided that this component indeed traces mass loss.
Figure 2 gives an illustration of the temporal variability of the spectrum of OP And in the region of the H line. In the figure, spectra of the star are shown both during the quiescent state and during flares for six different observational seasons. It can be seen that the spectrum of OP And evolves significantly with time. The H line is much more shallow in the beginning of the dataset and begins to deepen as time advances up to around 2016, from which point on it starts to slowly become more shallow again. In the early seasons, a blue-shifted emission component of H, which is most likely linked to mass loss [12], is sometimes visible, while it is not present in the spectrum of the star between 2010 and 2016, and then appears again from 2016 on.
3.2. The Calcium infrared triplet
Figure 3 shows the temporal evolution of the activity indicators H and the two lines of the CaIRT between 2008 and 2025. Measurements of the CaIRT lines are only available from 2008 on and are used as a confirmation of the long-term activity level estimated from the profile of H, as well as to confirm the presence of a flare, as described in Section 2. In Figure 3, it can be seen that the behavior of the CaIRT lines generally follows that of , with some particular flares (in 2020 and 2021) being more pronounced in the CaIRT lines. The behavior of these two lines helps identify possible flares in the dataset.
3.3. Flare frequency
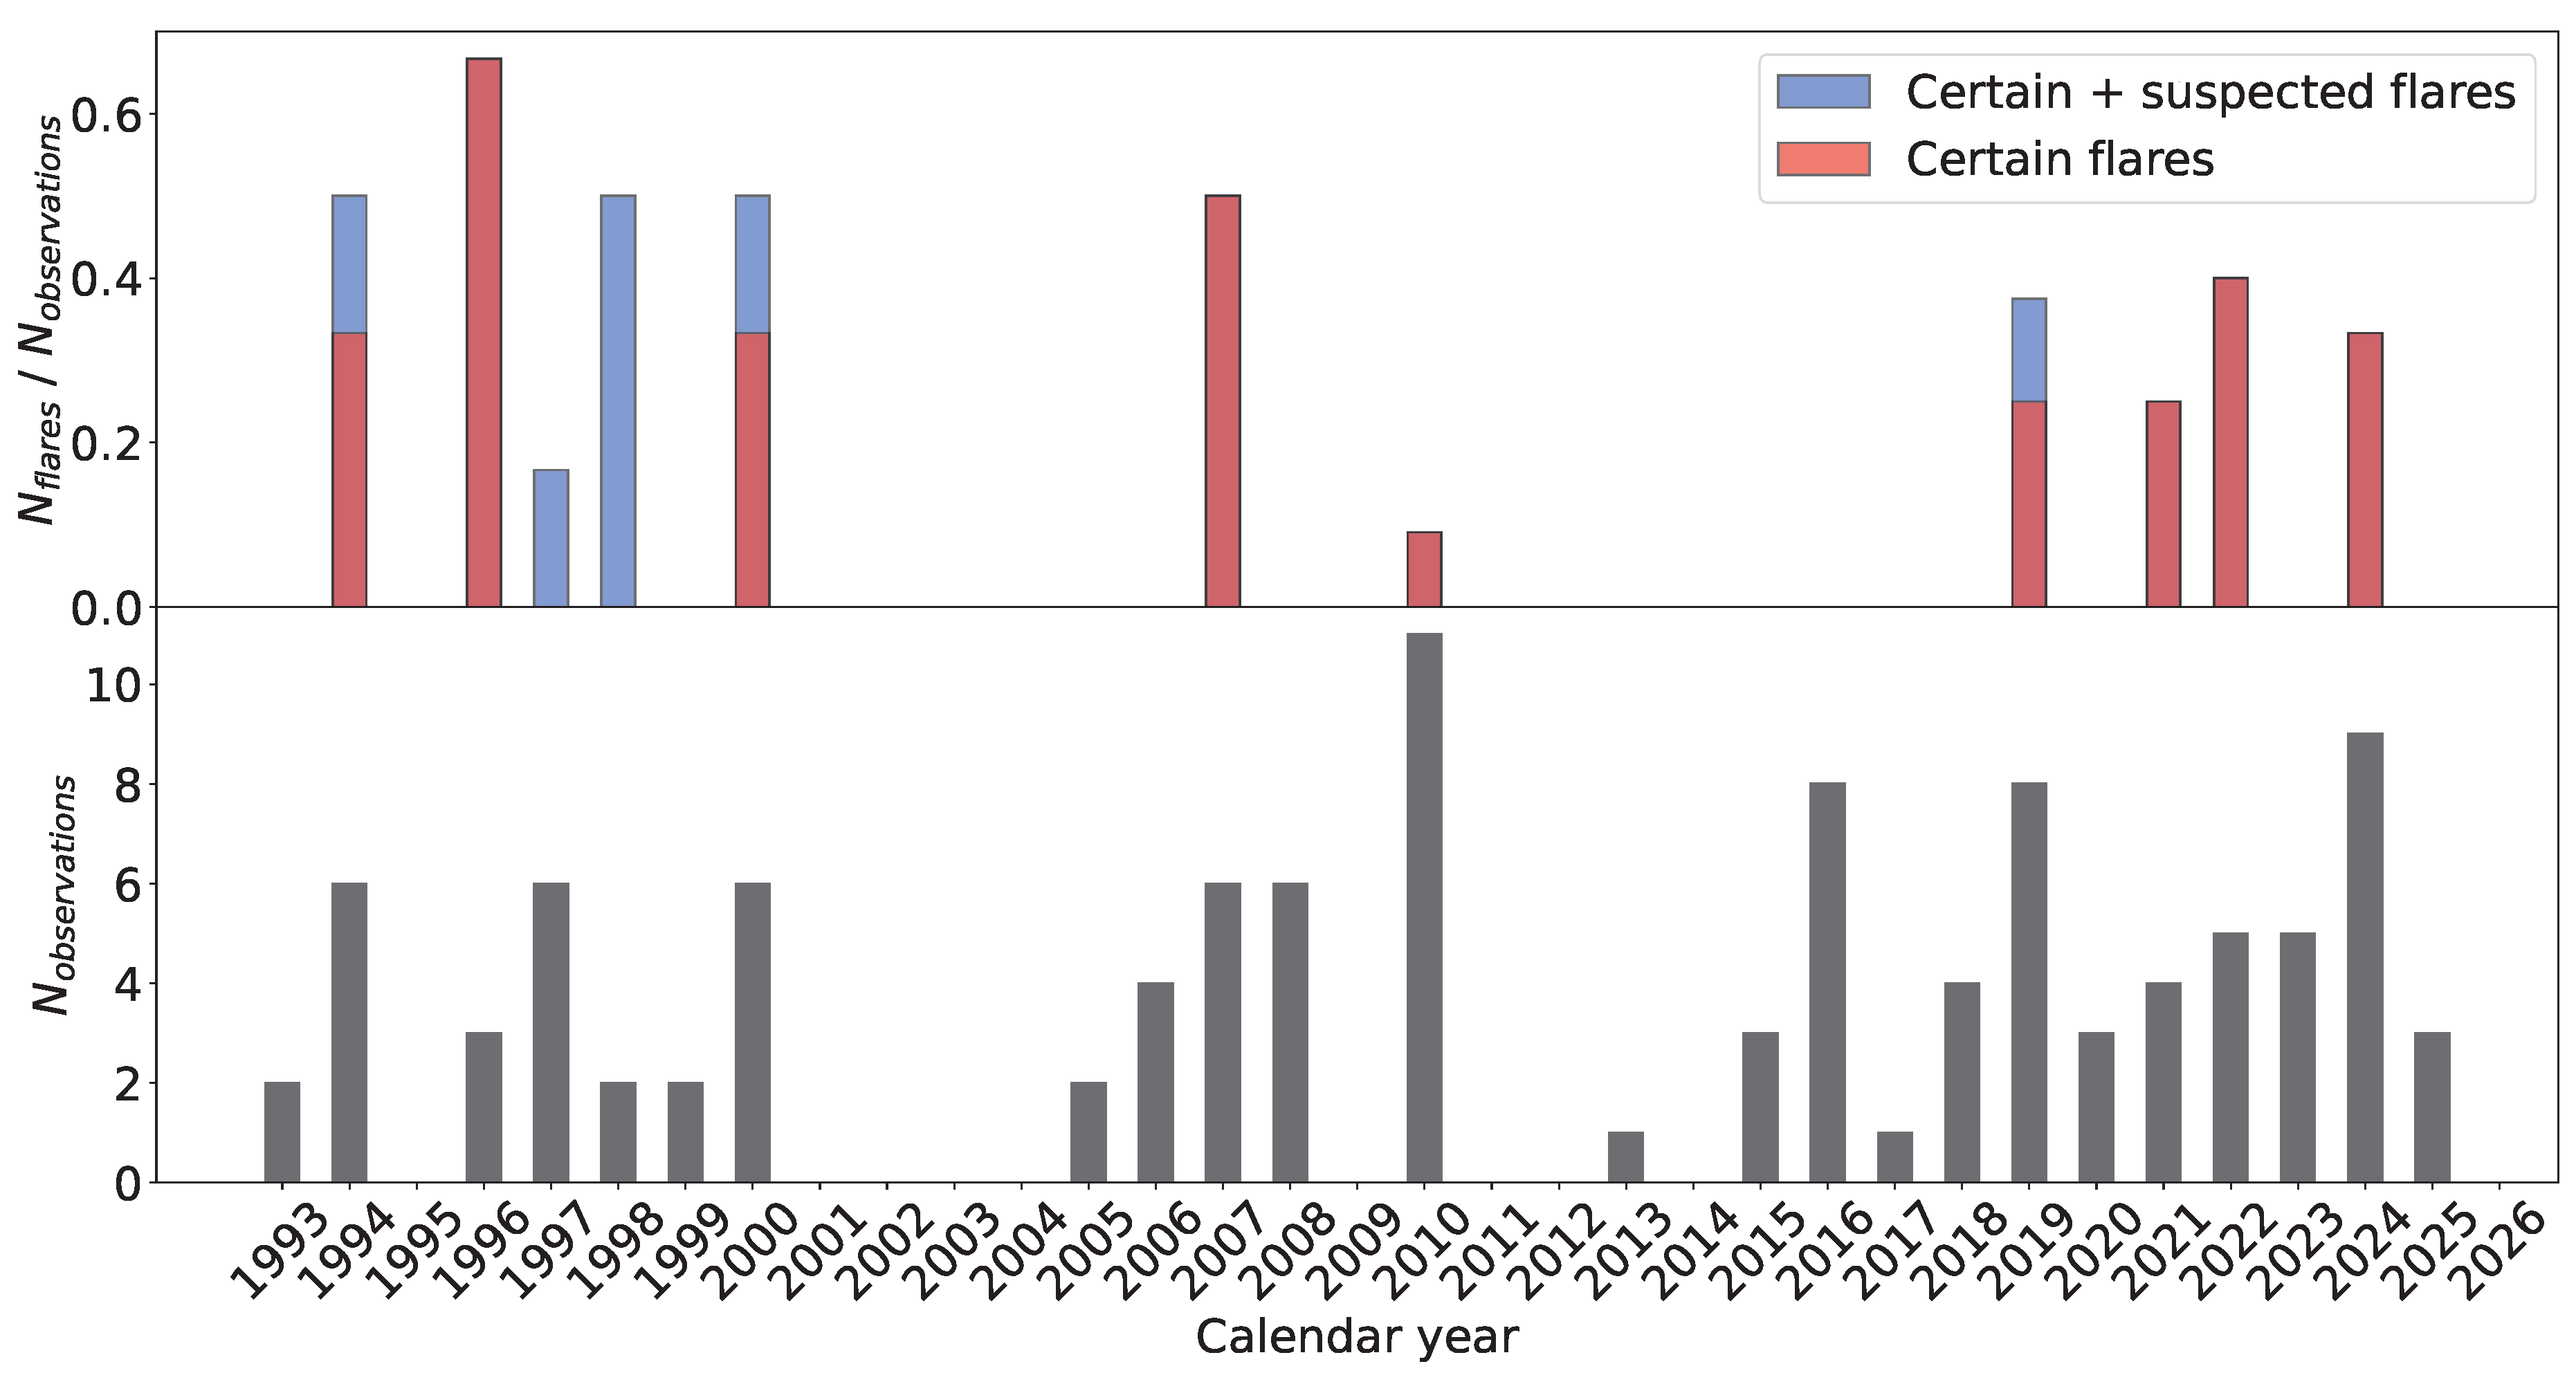
Our dataset consists of a total of 110 different dates of observations, of which 23 show the presence of a flare (18 with certainty, while the remaining 5 are suspected - see Table A1 for details). However, flares do not seem to occur at the same rate over the course of time. The observed ratio of flares to the total number of observations for each calendar year over the course of the dataset is shown graphically in Figure 4. When comparing these results with the estimation of the quiescent activity level shown in Figure 1, it appears that the observed flare rate has a close correlation with the activity level: considering that the suspected flares are indeed such, the flare rate appears highest during 1996, which roughly coincides with the maximum of the estimated quiescent activity level; conversely, between 2008 and 2018 there is only a single registered flare in 34 observations, which in turn coincides with the observed plateau in the activity level. In the last few years of the dataset, flares are observed more often than during the perceived minimum. However, as we have previously seen in Figure 1 and Figure 2, their intensity during the 2020s is clearly below the level registered in the 1990s.
4. Discussion
From the available data, it can be seen that the activity level of OP And was much higher between 1993 and 2000 than at any other time the star was observed. The higher activity is characterized by:
- a higher quiescent activity level;
- stronger flares;
- more frequent flares;
- presence of a blue-shifted emission component of H that is likely associated with mass loss [12].
Since this period, the activity level has been steadily decreasing until it reached a perceived minimum around 2010 - 2016, which all the studied indicators of flare activity in this work point to. After this time, the activity level has been steadily increasing, and although the quiescent level of H in 2024 and 2025 approaches that of the previous perceived maximum around the year 1996 (see Figure 1), it does not match it completely. It seems that the activity level of the star is increasing gradually, but the eventual period must be more than 30 years (the length of our dataset). The H blue-shifted emission component also follows this variability behavior. During the minimum it completely disappears and only reappears after 2016. Since this component is linked to mass loss, this means that mass outflow depends on the activity level in OP And. The blue-shifted emission component of H shows greater intensity during the 1993-2000 high activity state than during the 2016-2025 one. A possible reason for this difference might be a difference in the height of the magnetic loops. We suspect that the magnetic loops during the 1993-2000 active state were, on average, much higher above the photosphere of the star than they are during the present one. At higher altitudes r, the escape velocity is lower (). During a flare, the magnetic loops reconnect and the plasma is no longer bound to them, and if its velocity is greater than , mass loss may occur. Thus, a greater height of the magnetic loops during the 1993-2000 period than during the 2016-2025 one may explain the stronger emission in the blue-shifted component of H if this emission indeed traces mass loss. Furthermore, magnetic loops that reach higher altitudes can lead to flares that last longer, due to the fact that more mass is trapped inside the loops. This supports the hypothesis that the magnetic loops were larger in the 1990s than at present times, because long flares (lasting more than one day) are observed on three occasions during the 1993-2000 period (18-19 August 1994, 8-9 June 1996 and 24-25 June 2000) but never during the 2016-2025 one.
[21] studied the long-term variability (from mid-1983 to mid-1995) of the calcium H&K chromospheric lines of cool giants and found different cases of activity variability – variable, long-term trend, cyclic and flat. The authors conclude that about 40 % of the 175 giants studied by them show possible cyclic activity. Another nearly 40 % of their sample show variable records. This means that either not all giants go through magnetic activity cycles, or that part of the cycles might be much longer than 12 years - the length of their dataset.
In addition, [22] reported a 13-yr cycle of the G giant 37 Com from photometric measurements. The rotational period of this giant is 110 days [4]. [23] use datasets from the "HK project" at Mount Wilson Observatory [24,25] to search for chromospheric activity cycles through the variations of the S-index. Their sample consists mostly of dwarf stars, but it also includes three giants. Their rotational periods are 43, 35 and 42 days and the length of their cycles is 6, 9 and 8 years, respectively. Hence, from the scanty information known for the activity cycles in cool giants, we find no clear correlation between the cycle length and the rotational period. More studies in this direction could clarify the picture.
5. Conclusions
Our spectral study of the activity indicator H in the period 1993 – 2025 revealed that the activity level of OP And varies smoothly in time. In the period 1993-1999 it was near maximum, and in the period 2008 – 2016 the activity reached its minimum. Later on, it begins to increase gradually and in 2025 it is approaching the maximum level detected in the 1990s. The behavior of the two lines of the CaII infrared triplet (CaIRT): 8498 Å and 8662 Å(when observed) is similar to that of the core of H. 23 flares were detected and the flare frequency follows the maximum and minimum determined by the activity indicator H.
We also studied the long-term behavior of the blue-shifted emission component of H that is interpreted as a hot expanding area located above the photosphere, linked to mass outflow. We found that during the minimum the emission is absent, but appeared again with the increase of the activity level after it. This is an indication that the magnetic activity also controls the mass loss in OP And. We suspect that the lower level of the intensity of this emission component between 2016 and 2025 with respect to the 1990s could be due to a smaller on average height of the magnetic loops in the more recent high activity period.
It seems that the suspected activity cycle of this cool giant is longer than 30 years. To date, it appears to be the longest one known in such an evolved star. More observations are necessary to determine its exact length.
Acknowledgments
The Narval observations in 2008 are granted under OPTICON program. The observations in 2010 are funded under Bulgarian NSF contract DSAB 02/3. S.G., R.K.A., M.B. and H.M. acknowledge partial financial support under Bulgarian NSF contract DN 08/1. H.M. and A.K. acknowledge partial financial support under Bulgarian NSF contract DN 18/13. The ESpeRo observations from 2017 on were obtained under the RACIO project supported by the Ministry of Education and Science of Bulgaria (Bulgarian National Roadmap for Research Infrastructure).
Appendix A. Log of observations

Table A1.
Log of observations of OP And. The columns show the calendar date of the observation and the instrument with which it was obtained (see Section 2), the Julian date (JD) starting from 2449228, relative intensities of the H line, its blue-shifted emission component ("HB" for short) and the 8498 Å and 8662 Å lines of the calcium infrared triplet, along with their respective error of measurement, and, in the last column, whether the observation is considered a flare ("C" for "Certain" or "S" for "Suspected") together with the justification for this ("SS" means the flare is seen in several spectra, and "SI" means it is seen in several indicators). See Section 2 for a detailed explanation.
| Date, instrument |
JD | H | (H) | HB | (HB) | CaIRT 8498 Å |
(8498) | CaIRT 8662 Å |
(8662) | Flare, reason |
| 1993/08/29 C | 0 | 0.630 | 0.010 | 1.110 | 0.010 | – | – | – | – | – |
| 1993/11/02 C | 65 | 0.670 | 0.010 | 1.080 | 0.010 | – | – | – | – | – |
| 1994/02/01 C | 157 | 0.620 | 0.010 | 1.050 | 0.010 | – | – | – | – | – |
| 1994/02/02 C | 158 | 0.630 | 0.010 | 1.050 | 0.010 | – | – | – | – | – |
| 1994/08/17 C | 353 | 0.690 | 0.010 | 1.050 | 0.010 | – | – | – | – | – |
| 1994/08/18 C | 354 | 0.640 | 0.010 | 1.050 | 0.010 | – | – | – | – | C, SS |
| 1994/08/18 C | 355 | 0.740 | 0.010 | 1.080 | 0.010 | – | – | – | – | C, SS |
| 1994/08/19 C | 355 | 0.790 | 0.010 | 1.080 | 0.010 | – | – | – | – | C, SS |
| 1994/08/23 C | 359 | 0.760 | 0.010 | 1.060 | 0.010 | – | – | – | – | S, H |
| 1996/02/02 C | 888 | 0.890 | 0.010 | 1.150 | 0.010 | – | – | – | – | S, H |
| 1996/04/08 C | 954 | 0.700 | 0.010 | 1.100 | 0.010 | – | – | – | – | – |
| 1996/06/08 C | 1015 | 0.890 | 0.010 | 1.170 | 0.010 | – | – | – | – | C, SS |
| 1996/06/09 C | 1015 | 0.830 | 0.010 | 1.150 | 0.010 | – | – | – | – | C, SS |
| 1996/06/09 C | 1016 | 0.790 | 0.010 | 1.130 | 0.010 | – | – | – | – | C, SS |
| 1997/01/23 C | 1244 | 0.711 | 0.009 | 0.984 | 0.007 | – | – | – | – | – |
| 1997/01/24 C | 1245 | 0.689 | 0.002 | 0.966 | 0.004 | – | – | – | – | – |
| 1997/01/25 C | 1246 | 0.694 | 0.002 | 0.972 | 0.003 | – | – | – | – | – |
| 1997/08/14 C | 1447 | 0.676 | 0.005 | 0.920 | 0.002 | – | – | – | – | – |
| 1997/08/15 C | 1448 | 0.673 | 0.002 | 0.955 | 0.002 | – | – | – | – | – |
| 1997/10/16 C | 1510 | 0.823 | 0.004 | 1.009 | 0.004 | – | – | – | – | S, H |
| 1998/09/30 C | 1859 | 0.656 | 0.008 | 1.090 | 0.008 | – | – | – | – | – |
| 1998/10/28 C | 1887 | 0.771 | 0.002 | 1.072 | 0.003 | – | – | – | – | S, H |
| 1999/01/10 C | 1961 | 0.599 | 0.006 | 1.053 | 0.002 | – | – | – | – | – |
| 1999/03/03 C | 2013 | 0.587 | 0.005 | 1.021 | 0.000 | – | – | – | – | – |
| 2000/06/24 C | 2492 | 0.748 | 0.011 | 1.166 | 0.003 | – | – | – | – | C, SS |
| 2000/06/25 C | 2493 | 0.767 | 0.011 | 1.194 | 0.010 | – | – | – | – | C, SS |
| 2000/07/11 C | 2509 | 0.777 | 0.006 | 1.211 | 0.001 | – | – | – | – | S, H |
| 2000/08/15 C | 2544 | 0.620 | 0.004 | 1.050 | 0.002 | – | – | – | – | – |
| 2000/09/09 C | 2569 | 0.632 | 0.010 | 1.065 | 0.003 | – | – | – | – | – |
| 2000/10/22 C | 2612 | 0.640 | 0.001 | 1.043 | 0.005 | – | – | – | – | – |
| 2005/11/10 C | 4457 | 0.319 | 0.008 | 1.017 | 0.008 | – | – | – | – | – |
| 2006/08/09 C | 4729 | 0.320 | 0.004 | 1.044 | 0.002 | – | – | – | – | – |
| 2006/08/12 C | 4732 | 0.426 | 0.003 | 1.038 | 0.001 | – | – | – | – | – |
| 2006/10/03 C | 4784 | 0.416 | 0.001 | 0.968 | 0.002 | – | – | – | – | – |
| 2006/12/01 C | 4843 | 0.428 | 0.001 | 0.973 | 0.002 | – | – | – | – | – |
| 2007/07/01 C | 5055 | 0.413 | 0.004 | 0.960 | 0.008 | – | – | – | – | – |
| 2007/07/30 C | 5083 | 0.571 | 0.010 | 1.018 | 0.006 | – | – | – | – | C, SS |
| 2007/08/02 C | 5086 | 0.498 | 0.007 | 1.003 | 0.001 | – | – | – | – | C, SS |
| 2007/08/03 C | 5088 | 0.475 | 0.004 | 1.009 | 0.008 | – | – | – | – | C, SS |
| 2007/11/27 C | 5204 | 0.371 | 0.004 | 0.976 | 0.005 | – | – | – | – | – |
| 2008/09/15 N | 5496 | 0.362 | 0.003 | 0.943 | 0.002 | 0.356 | 0.015 | 0.252 | 0.011 | – |
| 2008/09/20 N | 5501 | 0.349 | 0.004 | 0.929 | 0.008 | 0.367 | 0.021 | 0.248 | 0.012 | – |
| 2008/09/25 N | 5506 | 0.385 | 0.003 | 0.993 | 0.005 | 0.376 | 0.021 | 0.260 | 0.013 | – |
| 2008/09/27 N | 5508 | 0.378 | 0.004 | 0.975 | 0.006 | 0.353 | 0.007 | 0.264 | 0.021 | – |
| 2008/09/29 N | 5510 | 0.392 | 0.003 | 0.992 | 0.006 | 0.352 | 0.011 | 0.248 | 0.010 | – |
| 2008/12/21 N | 5593 | 0.361 | 0.001 | 1.003 | 0.005 | 0.332 | 0.022 | 0.246 | 0.022 | – |
| 2010/06/21 N | 6140 | 0.340 | 0.005 | 1.004 | 0.005 | 0.349 | 0.027 | 0.231 | 0.003 | – |
| 2010/06/22 N | 6141 | 0.333 | 0.005 | 0.980 | 0.006 | 0.334 | 0.018 | 0.233 | 0.009 | – |
| 2010/07/14 N | 6163 | 0.313 | 0.001 | 0.995 | 0.007 | 0.331 | 0.002 | 0.232 | 0.022 | – |
| 2010/07/23 N | 6172 | 0.356 | 0.003 | 0.984 | 0.003 | 0.333 | 0.022 | 0.233 | 0.007 | – |
| 2010/08/02 N | 6182 | 0.424 | 0.004 | 0.920 | 0.007 | 0.414 | 0.009 | 0.317 | 0.019 | C, SI |
| 2010/08/12 N | 6192 | 0.364 | 0.003 | 0.920 | 0.004 | 0.380 | 0.015 | 0.269 | 0.009 | – |
| 2010/08/20 N | 6200 | 0.323 | 0.003 | 0.964 | 0.004 | 0.351 | 0.010 | 0.251 | 0.014 | – |
| 2010/09/03 N | 6214 | 0.303 | 0.006 | 0.989 | 0.006 | 0.324 | 0.018 | 0.222 | 0.016 | – |
| 2010/09/15 N | 6226 | 0.316 | 0.004 | 0.916 | 0.000 | 0.323 | 0.015 | 0.233 | 0.005 | – |
| 2010/09/26 N | 6237 | 0.346 | 0.004 | 0.934 | 0.010 | 0.345 | 0.018 | 0.246 | 0.022 | – |
| 2010/10/13 N | 6254 | 0.365 | 0.004 | 1.014 | 0.006 | 0.334 | 0.027 | 0.221 | 0.006 | – |
| 2013/08/17 C | 7294 | 0.346 | 0.006 | 0.967 | 0.005 | – | – | – | – | – |
| 2015/09/02 E | 8039 | 0.375 | 0.015 | 1.052 | 0.004 | 0.309 | 0.012 | 0.224 | 0.009 | – |
| 2015/10/04 E | 8072 | 0.323 | 0.010 | 1.016 | 0.013 | 0.317 | 0.030 | 0.196 | 0.016 | – |
| 2015/12/28 E | 8157 | 0.387 | 0.011 | 1.044 | 0.015 | 0.324 | 0.024 | 0.235 | 0.023 | – |
| 2016/01/27 E | 8187 | 0.346 | 0.009 | 1.016 | 0.005 | 0.300 | 0.028 | 0.214 | 0.018 | – |
| 2016/07/26 E | 8367 | 0.305 | 0.006 | 0.981 | 0.005 | 0.312 | 0.013 | 0.228 | 0.012 | – |
| 2016/09/18 E | 8422 | 0.327 | 0.009 | 1.001 | 0.005 | 0.299 | 0.015 | 0.202 | 0.007 | – |
| 2016/10/10 E | 8443 | 0.337 | 0.010 | 1.041 | 0.011 | 0.290 | 0.019 | 0.204 | 0.011 | – |
| 2016/11/13 E | 8478 | 0.233 | 0.002 | -1.000 | -1.000 | 0.285 | 0.002 | 0.180 | 0.001 | – |
| 2016/11/19 E | 8484 | 0.357 | 0.001 | -1.000 | -1.000 | 0.290 | 0.001 | 0.178 | 0.001 | – |
| 2016/11/20 E | 8485 | 0.363 | 0.002 | -1.000 | -1.000 | 0.298 | 0.002 | 0.179 | 0.002 | – |
| 2016/12/09 E | 8504 | 0.377 | 0.011 | 1.006 | 0.008 | 0.301 | 0.002 | 0.207 | 0.007 | – |
| 2017/06/30 E | 8707 | 0.367 | 0.008 | 1.018 | 0.008 | 0.302 | 0.017 | 0.187 | 0.008 | – |
| 2018/01/06 E | 8897 | 0.375 | 0.003 | 0.962 | 0.007 | 0.377 | 0.004 | 0.260 | 0.001 | – |
| 2018/03/07 E | 8957 | 0.377 | 0.001 | 1.060 | 0.015 | 0.369 | 0.000 | 0.245 | 0.002 | – |
| 2018/09/24 E | 9158 | 0.391 | 0.005 | 1.052 | 0.003 | 0.381 | 0.007 | 0.315 | 0.003 | – |
| 2018/09/25 E | 9159 | 0.396 | 0.005 | 1.068 | 0.003 | 0.434 | 0.002 | 0.379 | 0.006 | – |
| 2019/03/22 E | 9337 | 0.364 | 0.001 | 0.965 | 0.004 | 0.479 | 0.008 | 0.371 | 0.010 | – |
| 2019/08/14 E | 9482 | 0.411 | 0.002 | 1.052 | 0.007 | 0.406 | 0.002 | 0.318 | 0.005 | – |
| 2019/10/14 E | 9543 | 0.464 | 0.002 | 0.992 | 0.004 | 0.585 | 0.003 | 0.547 | 0.002 | C, SI, SS |
| 2019/10/15 E | 9544 | 0.425 | 0.002 | 0.964 | 0.000 | 0.560 | 0.001 | 0.505 | 0.004 | C, SI, SS |
| 2019/10/16 E | 9545 | 0.386 | 0.004 | 1.039 | 0.000 | 0.431 | 0.003 | 0.329 | 0.001 | – |
| 2019/10/18 E | 9547 | 0.444 | 0.001 | 0.997 | 0.008 | 0.552 | 0.003 | 0.516 | 0.001 | S, CaI |
| 2019/10/19 E | 9548 | 0.379 | 0.002 | 0.983 | 0.004 | 0.413 | 0.003 | 0.323 | 0.002 | – |
| 2019/12/05 E | 9595 | 0.407 | 0.002 | 0.994 | 0.000 | 0.363 | 0.003 | 0.266 | 0.001 | – |
| 2020/01/13 E | 9634 | 0.360 | 0.002 | 1.035 | 0.002 | 0.325 | 0.009 | 0.249 | 0.011 | – |
| 2020/08/04 E | 9838 | 0.310 | 0.002 | 1.005 | 0.000 | 0.310 | 0.003 | 0.232 | 0.004 | – |
| 2020/12/02 E | 9958 | 0.312 | 0.002 | 0.970 | 0.001 | 0.351 | 0.003 | 0.284 | 0.002 | – |
| 2021/02/03 E | 10021 | 0.435 | 0.003 | 0.899 | 0.006 | 0.555 | 0.001 | 0.539 | 0.002 | C, SI |
| 2021/02/26 E | 10044 | 0.366 | 0.003 | 1.008 | 0.003 | 0.368 | 0.004 | 0.305 | 0.003 | – |
| 2021/06/22 E | 10160 | 0.355 | 0.005 | 1.005 | 0.003 | 0.383 | 0.004 | 0.308 | 0.001 | – |
| 2021/07/27 E | 10195 | 0.318 | 0.003 | 0.966 | 0.005 | 0.377 | 0.006 | 0.277 | 0.004 | – |
| 2022/06/20 E | 10523 | 0.419 | 0.008 | 1.001 | 0.012 | 0.451 | 0.003 | 0.364 | 0.003 | – |
| 2022/07/11 E | 10544 | 0.478 | 0.005 | 0.943 | 0.016 | 0.570 | 0.005 | 0.525 | 0.022 | C, SI |
| 2022/09/15 E | 10610 | 0.402 | 0.004 | 0.958 | 0.012 | 0.449 | 0.007 | 0.390 | 0.006 | – |
| 2022/10/16 E | 10641 | 0.524 | 0.021 | 0.990 | 0.008 | 0.491 | 0.008 | 0.449 | 0.008 | C, SI |
| 2023/01/08 E | 10725 | 0.509 | 0.006 | 0.964 | 0.008 | 0.469 | 0.003 | – | – | – |
| 2023/08/02 E | 10931 | 0.424 | 0.003 | 1.027 | 0.001 | 0.479 | 0.004 | 0.402 | 0.007 | – |
| 2023/08/03 E | 10932 | 0.502 | 0.005 | 1.039 | 0.007 | 0.531 | 0.005 | 0.451 | 0.004 | – |
| 2023/09/29 E | 10989 | 0.436 | 0.003 | 0.983 | 0.001 | 0.524 | 0.005 | 0.439 | 0.006 | – |
| 2023/09/30 E | 10990 | 0.397 | 0.003 | 0.989 | 0.002 | 0.458 | 0.004 | 0.379 | 0.007 | – |
| 2024/01/23 E | 11105 | 0.594 | 0.014 | 1.031 | 0.005 | 0.578 | 0.004 | 0.505 | 0.005 | C, SI |
| 2024/01/24 E | 11106 | 0.596 | 0.019 | 0.996 | 0.014 | 0.592 | 0.007 | 0.543 | 0.019 | C, SI |
| 2024/06/15 E | 11249 | 0.512 | 0.009 | 1.081 | 0.004 | 0.502 | 0.004 | 0.441 | 0.004 | – |
| 2024/07/17 E | 11281 | 0.500 | 0.008 | 0.911 | 0.005 | 0.603 | 0.004 | 0.526 | 0.002 | C, SI |
| 2024/08/17 E | 11312 | 0.499 | 0.006 | 1.045 | 0.001 | 0.545 | 0.007 | 0.475 | 0.001 | – |
| 2024/08/18 E | 11313 | 0.506 | 0.006 | 1.066 | 0.001 | 0.513 | 0.005 | 0.431 | 0.002 | – |
| 2024/10/14 E | 11370 | 0.536 | 0.004 | 1.020 | 0.015 | 0.567 | 0.004 | 0.469 | 0.005 | – |
| 2024/10/15 E | 11371 | 0.526 | 0.004 | 1.031 | 0.002 | 0.551 | 0.005 | 0.455 | 0.017 | – |
| 2024/12/19 E | 11436 | 0.537 | 0.003 | -1.000 | -1.000 | 0.601 | 0.008 | 0.553 | 0.020 | – |
| 2025/06/03 E | 11602 | 0.521 | 0.011 | 1.081 | 0.008 | 0.522 | 0.004 | 0.442 | 0.001 | – |
| 2025/06/04 E | 11603 | 0.545 | 0.005 | 1.063 | 0.014 | 0.563 | 0.008 | 0.449 | 0.003 | – |
| 2025/07/06 E | 11635 | 0.439 | 0.005 | 1.039 | 0.030 | 0.514 | 0.007 | 0.432 | 0.001 | – |
References
- Strassmeier, K.G.; Hall, D.S. Photometric Variability in Chromospherically Active Stars. II. The Rapidly Rotating Single Stars. ApJS 1988, 67, 453. [CrossRef]
- Konstantinova-Antova, R.K.; Schröder, K.P.; Ivanov, M.M.; Antov, A.P.; Kolev, D.Z. OP And - an active single giant with evidence for mass loss? In Proceedings of the 13th Cambridge Workshop on Cool Stars, Stellar Systems and the Sun; Favata, F.; Hussain, G.A.J.; Battrick, B., Eds., 2005, Vol. 560, ESA Special Publication, p. 715.
- de Medeiros, J.R.; Mayor, M. VizieR Online Data Catalog: RV and vsini of evolved stars (de Medeiros+ 1999) 1999.
- Aurière, M.; Konstantinova-Antova, R.; Charbonnel, C.; Wade, G.A.; Tsvetkova, S.; Petit, P.; Dintrans, B.; Drake, N.A.; Decressin, T.; Lagarde, N.; et al. The magnetic fields at the surface of active single G-K giants. A&A 2015, 574, A90. [CrossRef]
- Balachandran, S.C.; Fekel, F.C.; Henry, G.W.; Uitenbroek, H. Two K Giants with Supermeteoritic Lithium Abundances: HDE 233517 and HD 9746. ApJ 2000, 542, 978–988. [CrossRef]
- Charbonnel, C.; Decressin, T.; Lagarde, N.; Gallet, F.; Palacios, A.; Aurière, M.; Konstantinova-Antova, R.; Mathis, S.; Anderson, R.I.; Dintrans, B. The magnetic strip(s) in the advanced phases of stellar evolution. Theoretical convective turnover timescale and Rossby number for low- and intermediate-mass stars up to the AGB at various metallicities. A&A 2017, 605, A102. [CrossRef]
- Drake, N.A.; de la Reza, R.; da Silva, L.; Lambert, D.L. Rapidly Rotating Lithium-rich K Giants: The New Case of the Giant PDS 365. AJ 2002, 123, 2703–2714. [CrossRef]
- Abt, H.A.; Biggs, E.S. Bibliography of stellar radial velocities; 1972.
- Fekel, F.C.; Moffett, T.J.; Henry, G.W. A Survey of Chromospherically Active Stars. ApJS 1986, 60, 551. [CrossRef]
- Konstantinova-Antova, R.K.; Ivanov, M.M.; Antov, A.P. OP And - an interesting chromospherically active K giant. In Proceedings of the IAU Symposium; Strassmeier, K.G., Ed., jan 1995, Vol. 176, IAU Symposium, p. 178.
- Borisova, A.; Konstantinova-Antova, R.; Aurière, M.; Petit, P.; Tsvetkova, S. A spectral study of the active giant OP And in the period 1979 - 2010. Bulgarian Astronomical Journal 2012, 18, 27.
- Georgiev, S.; Konstantinova-Antova, R.; Borisova, A.; Kolev, D.; Auruière, M.; Petit, P.; Belcheva, M.; Markov, H.; Bogdanovski, R.; Spassov, B.; et al. A long-term spectral study of the single active giant OP andromedae. In Proceedings of the 10th Jubilee International Conference of the Balkan Physical Union. AIP, feb 2019, Vol. 2075, American Institute of Physics Conference Series, p. 090003. [CrossRef]
- Strassmeier, K.G.; Fekel, F.C.; Bopp, B.W.; Dempsey, R.C.; Henry, G.W. Chromospheric CA II H and K and H alpha Emission in Single and Binary Stars of Spectra Types F6–M2. The Astrophysical Journal Series 1990, 72, 191. [CrossRef]
- Mihalas, D. Stellar atmospheres; 1978.
- de la Reza, R.; Drake, N.A.; da Silva, L.; Torres, C.A.O.; Martin, E.L. On a Rapid Lithium Enrichment and Depletion of K Giant Stars. ApJ 1997, 482, L77–L80. [CrossRef]
- Stencel, R.E.; Mullan, D.J.; Linsky, J.L.; Basri, G.S.; Worden, S.P. The outher atmospheres of cool stars. VII. High resolution, absolute flux profiles of the MG II H and K lines in stars of spectral types F8 to M5. ApJS 1980, 44, 383–402. [CrossRef]
- Bonev, T.; Markov, H.; Tomov, T.; Bogdanovski, R.; Markishki, P.; Belcheva, M.; Dimitrov, W.; Kamiński, K.; Milushev, I.; Musaev, F.; et al. ESpeRo: Echelle Spectrograph Rozhen. Bulgarian Astronomical Journal 2017, 26, 67. [CrossRef]
- Georgiev, S.; Moyseev, M.; Stoyanov, K.; Konstantinova-Antova, R.; Galabova, M. DESpeRo: Data reduction software for the Echelle Spectrograph Rozhen. Bulgarian Astronomical Journal 2025, 43, 98.
- Eaton, J.A. Hα Measurements for Cool Giants. The Astronomical Journal 1995, 109, 1797. [CrossRef]
- Konstantinova-Antova, R. PhD thesis, 2001.
- Baliunas, S.L.; Donahue, R.A.; Soon, W.; Henry, G.W. Activity Cycles in Lower Main Sequence and POST Main Sequence Stars: The HK Project. In Proceedings of the Cool Stars, Stellar Systems, and the Sun; Donahue, R.A.; Bookbinder, J.A., Eds., 1998, Vol. 154, Astronomical Society of the Pacific Conference Series, p. 153.
- Donahue, R.A. Long-term stellar activity: three decades of observations. In Proceedings of the Stellar Surface Structure; Strassmeier, K.G.; Linsky, J.L., Eds., 1996, Vol. 176, IAU Symposium, p. 261.
- Willamo, T.; Hackman, T.; Lehtinen, J.J.; Käpylä, M.J.; Olspert, N.; Viviani, M.; Warnecke, J. Shapes of stellar activity cycles. AA2020, 638, A69. [CrossRef]
- Wilson, O.C. Flux Measurements at the Centers of Stellar H- and K-Lines. ApJ 1968, 153, 221. [CrossRef]
- Wilson, O.C. Chromospheric variations in main-sequence stars. ApJ 1978, 226, 379–396. [CrossRef]
Figure 1.
Variability of the relative intensity of H (top panel) and its blue-shifted emission component (bottom panel) in the spectrum of OP And between 1993 and 2025. The x-axes show time in Julian dates (JD, bottom) and calendar year (top). The different symbols of the scatter plot represent whether the observation shows a flare or not, as described in Section 2. Error bars are present for all points, but in some cases are smaller than the point marker. The black curve in the top panel represents the quiescent activity level (see the text), and the dashed horizontal line represents the level of the continuum.
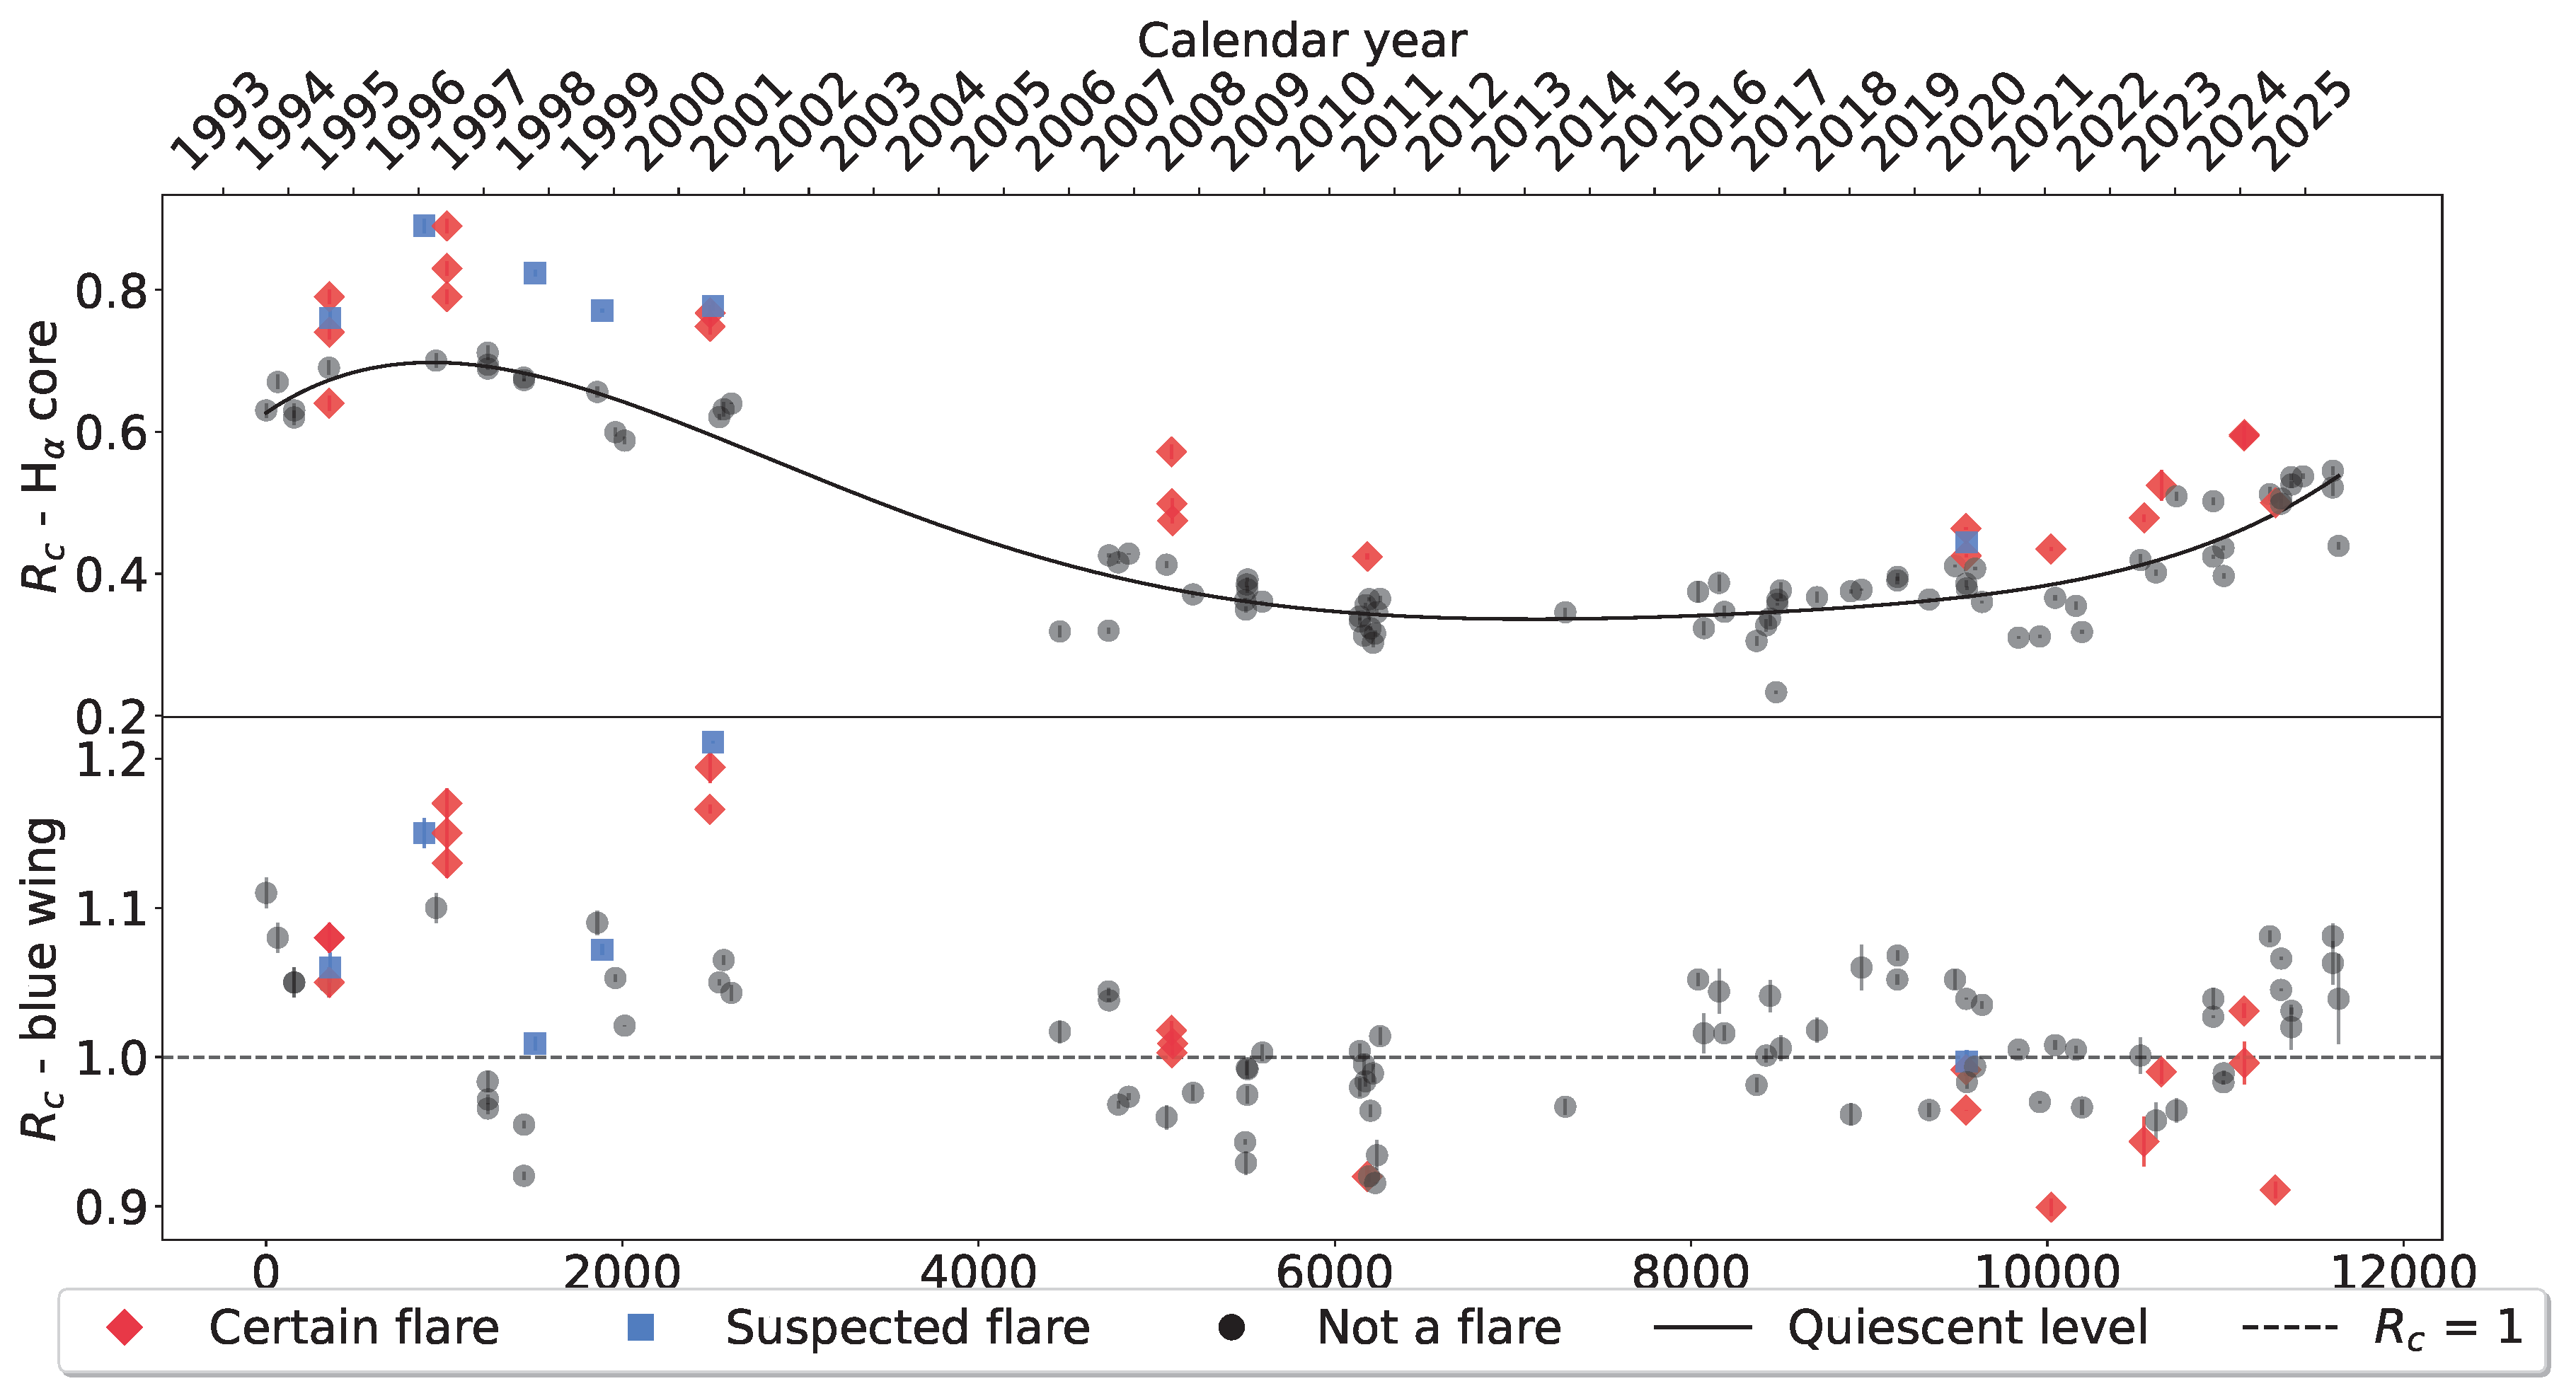
Figure 2.
Temporal variability of the profile of the H line in the spectrum of OP And. Spectra taken during the same calendar year are shown using the same vertical shift, and the year itself is noted next to the relevant spectra, on the right. For each season, a spectrum obtained during the quiescent state (solid line) and during a flare event (dashed line) are displayed, except for the 2017 season which is close to the perceived activity minimum and for which no flares are observed.
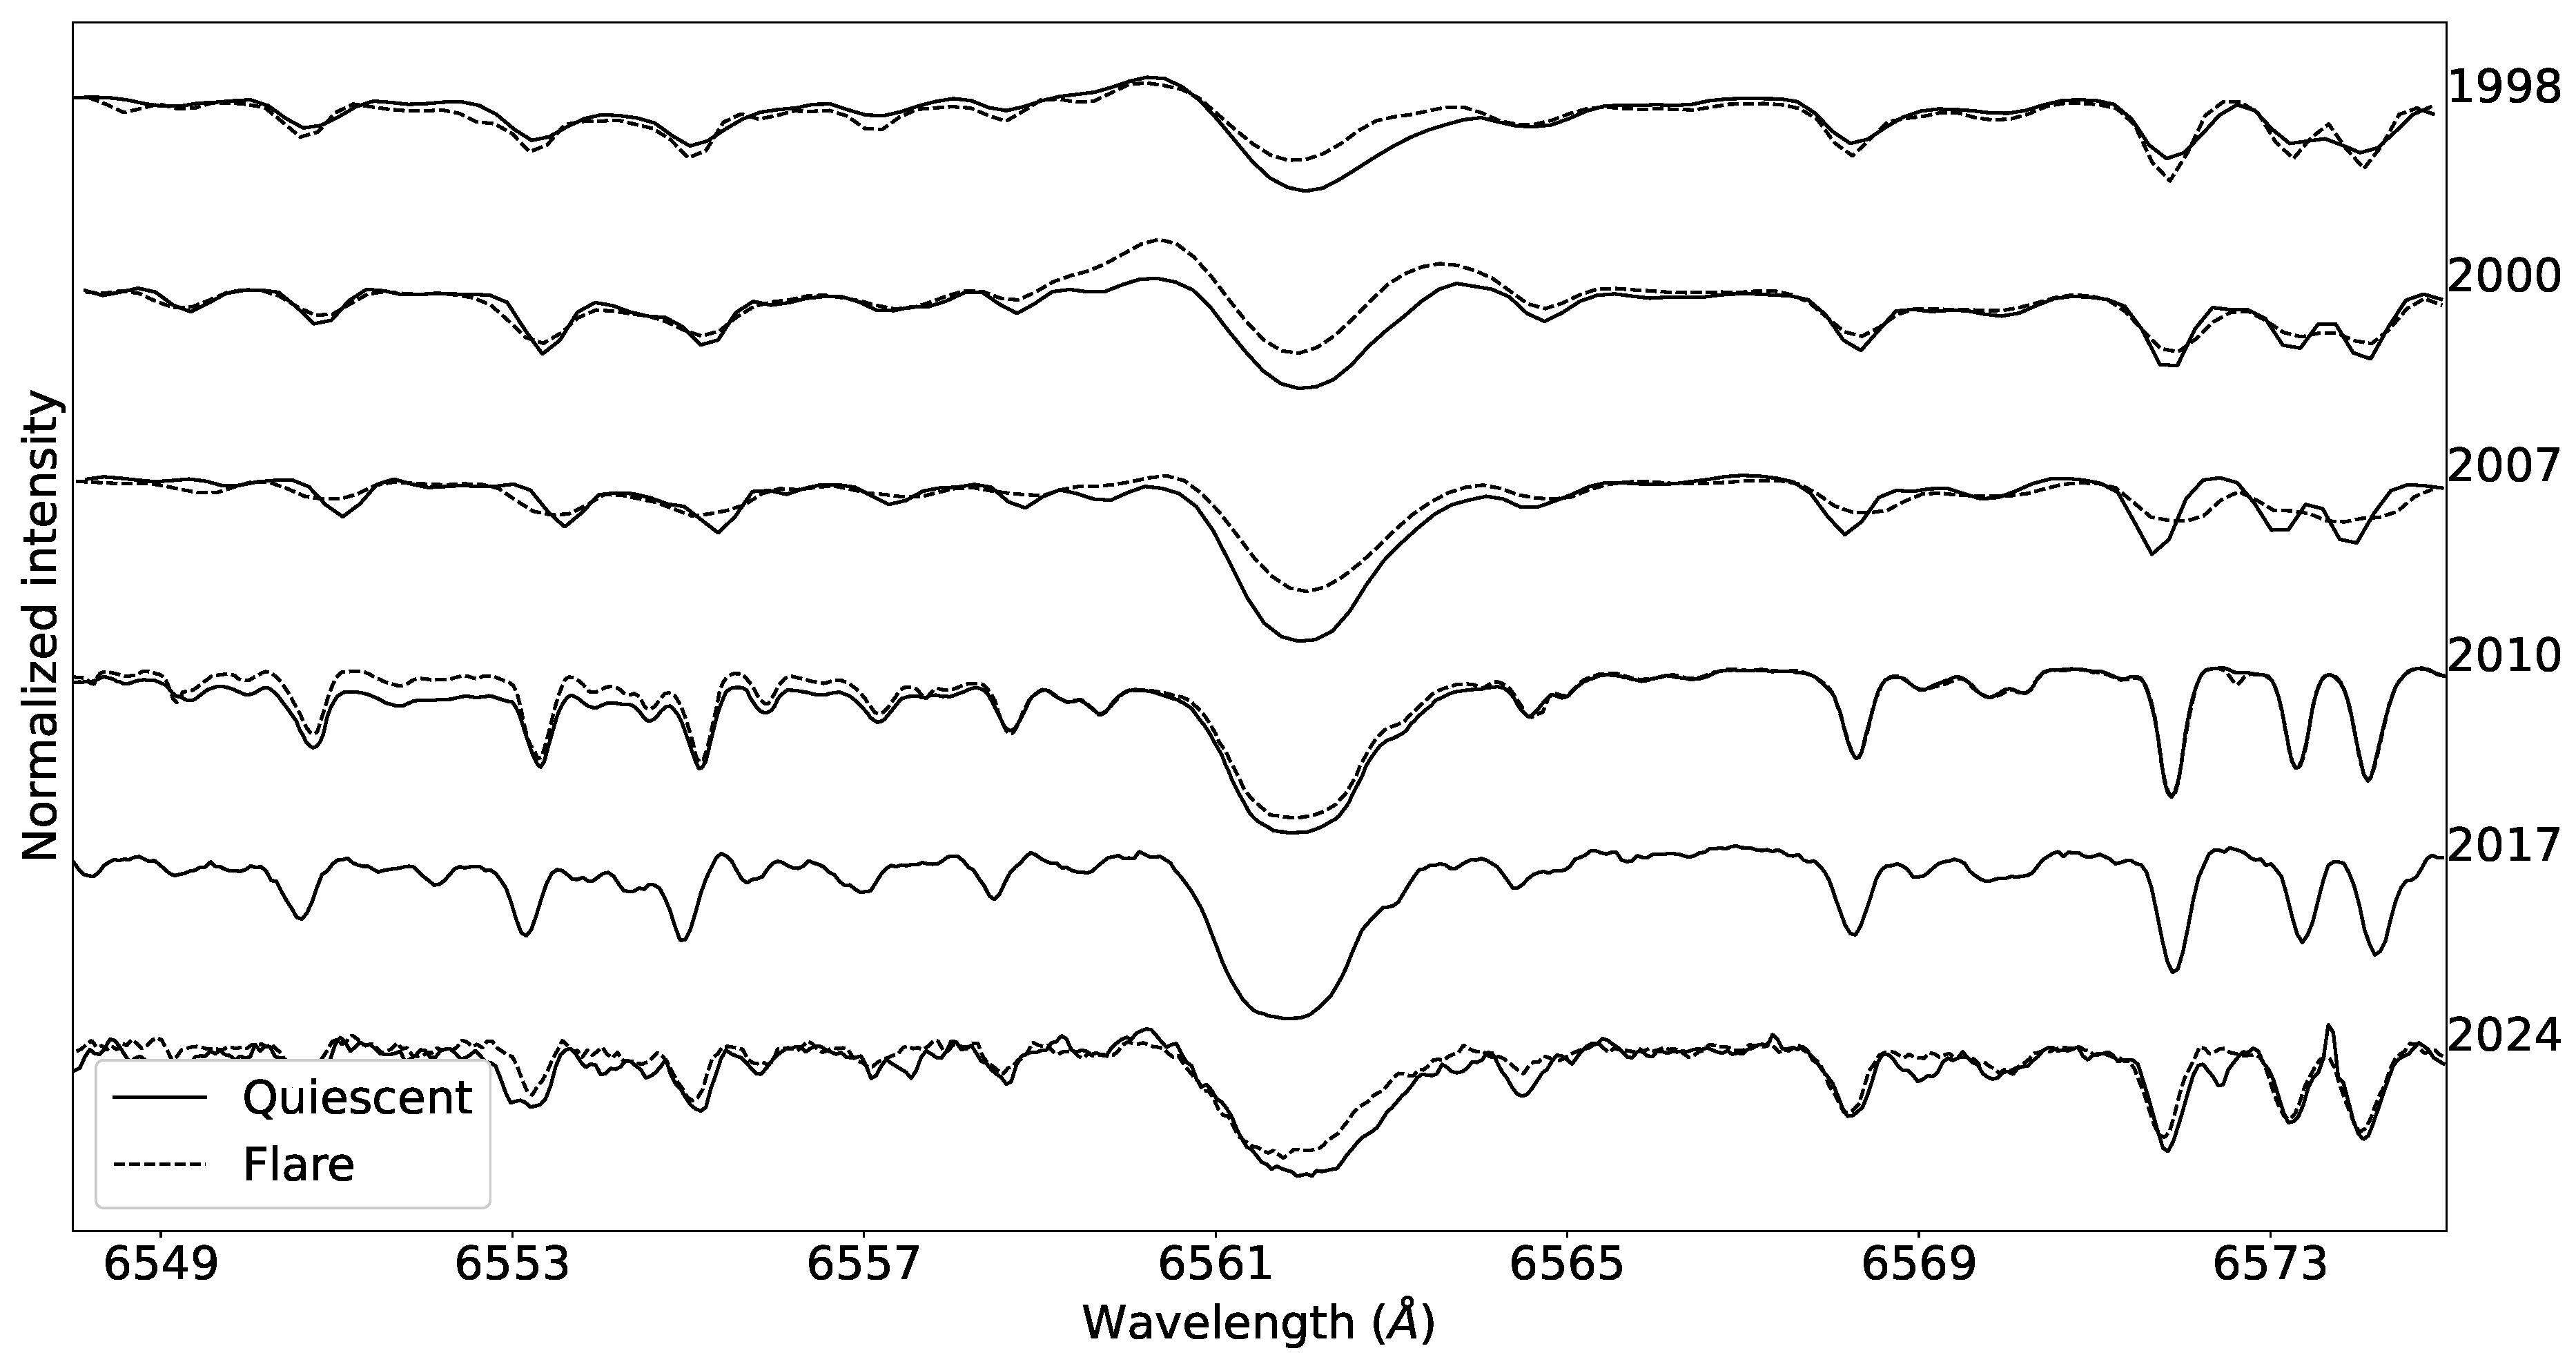
Figure 3.
Variability of the relative intensity of H and the two lines of the CaIRT (at 8498 and 8662 Å) in the spectrum of OP And between 2008 and 2025. See the legend of Figure 1.
Figure 3.
Variability of the relative intensity of H and the two lines of the CaIRT (at 8498 and 8662 Å) in the spectrum of OP And between 2008 and 2025. See the legend of Figure 1.
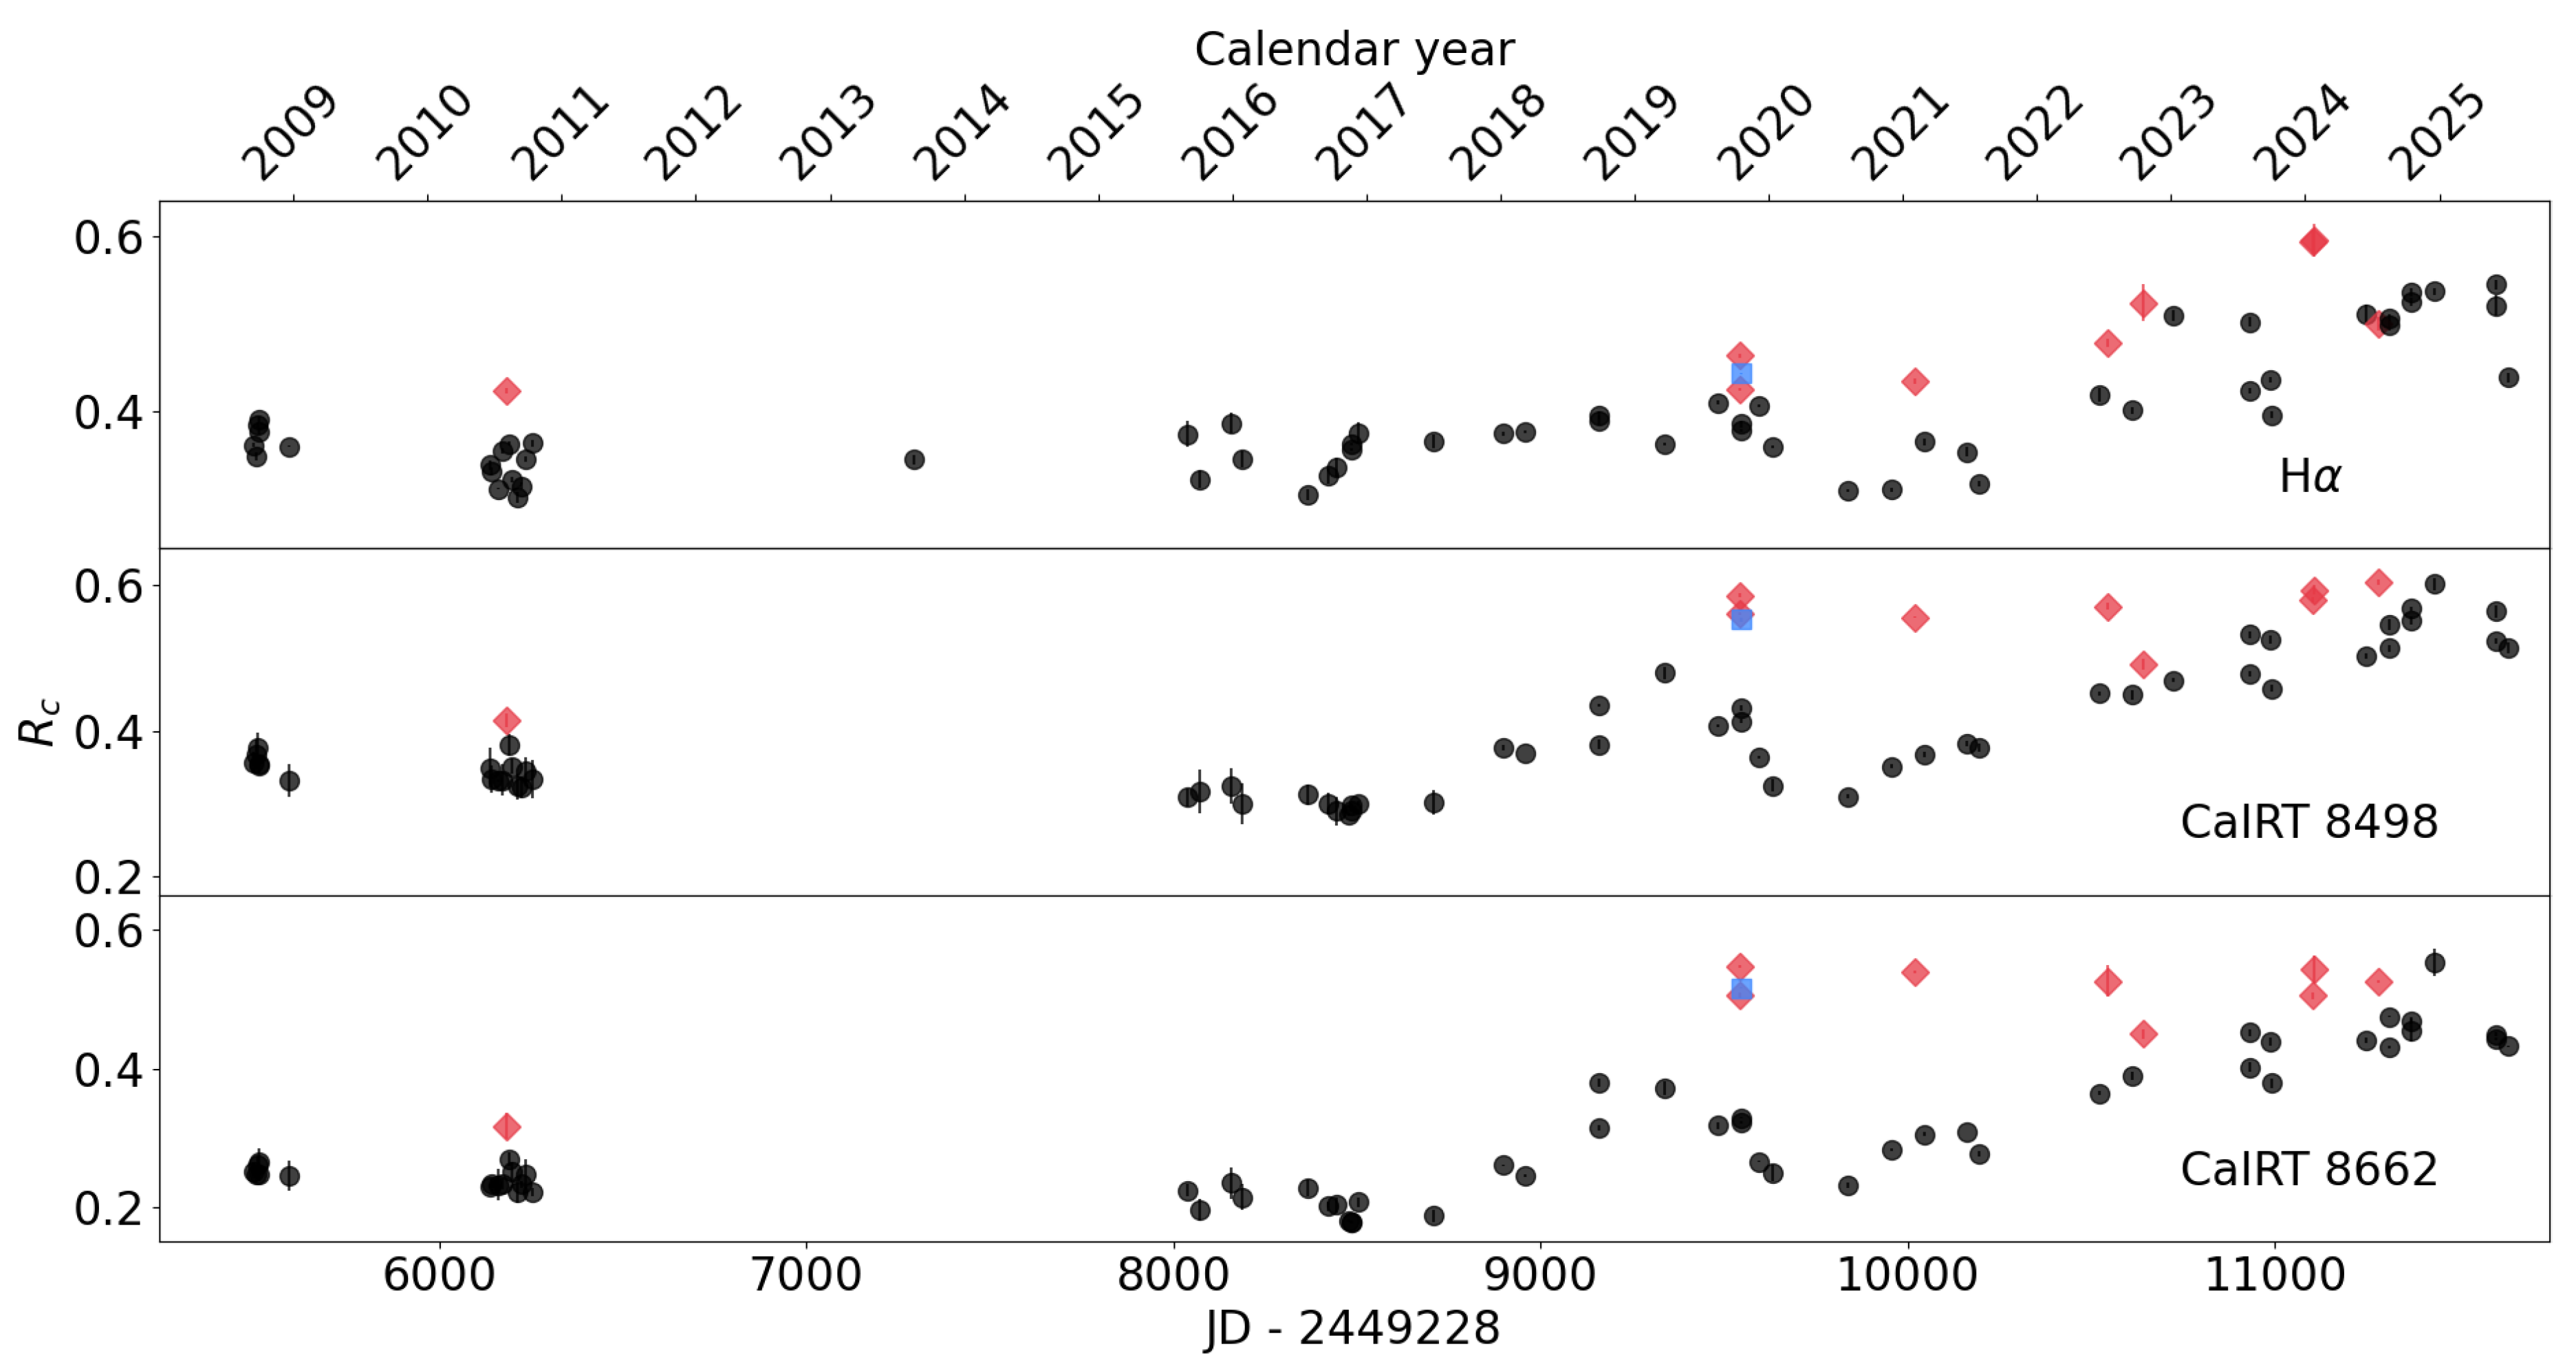
Figure 4.
Top panel: the ratio of the number of detected flares to the total number of observations per calendar year. Bottom panel: the total number of observations per calendar year.
Figure 4.
Top panel: the ratio of the number of detected flares to the total number of observations per calendar year. Bottom panel: the total number of observations per calendar year.
Disclaimer/Publisher’s Note: The statements, opinions and data contained in all publications are solely those of the individual author(s) and contributor(s) and not of MDPI and/or the editor(s). MDPI and/or the editor(s) disclaim responsibility for any injury to people or property resulting from any ideas, methods, instructions or products referred to in the content. |
© 2025 by the authors. Licensee MDPI, Basel, Switzerland. This article is an open access article distributed under the terms and conditions of the Creative Commons Attribution (CC BY) license (http://creativecommons.org/licenses/by/4.0/).
Copyright: This open access article is published under a Creative Commons CC BY 4.0 license, which permit the free download, distribution, and reuse, provided that the author and preprint are cited in any reuse.


