
Submitted:
26 September 2025
Posted:
29 September 2025
You are already at the latest version
Abstract
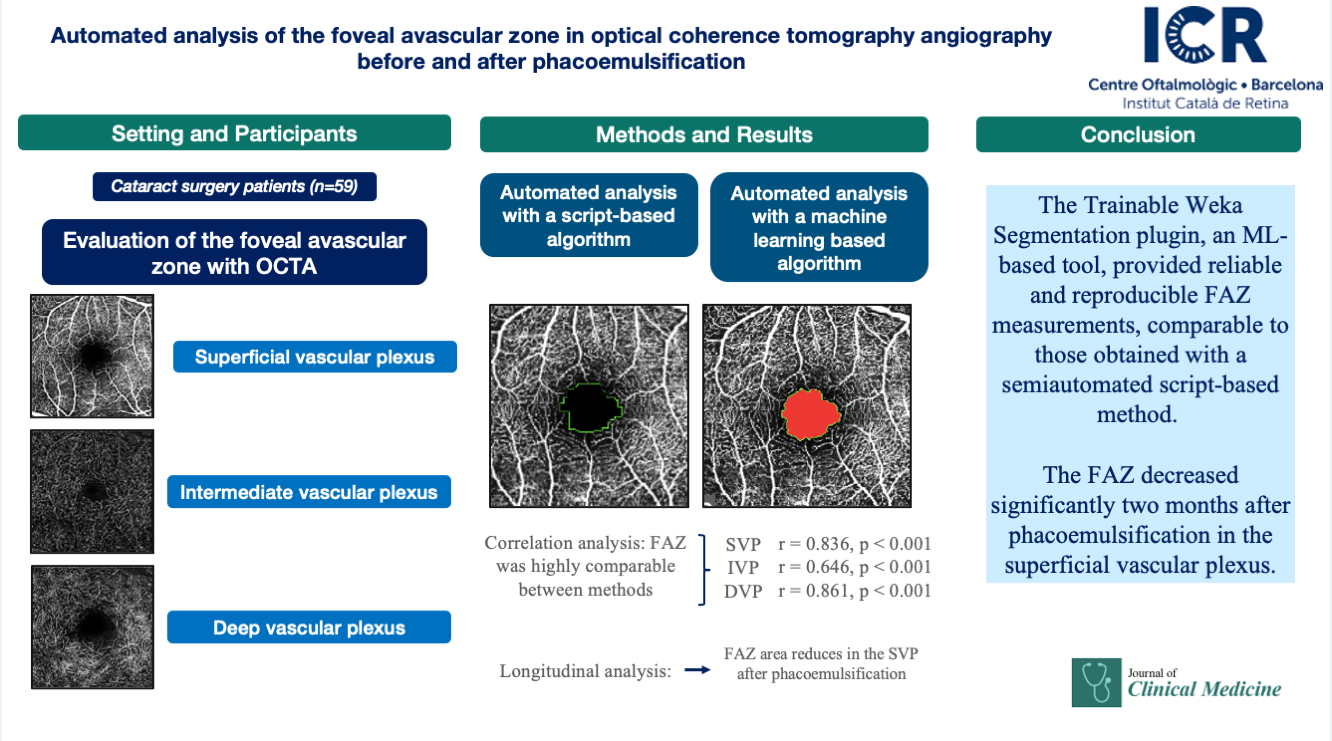
Objective: This study aimed to compare two methods for measuring the foveal avascular zone (FAZ) before and after phacoemulsification: a script-based semiautomated algorithm and a machine learning (ML)-based semiautomated algorithm. Methods: Optical coherence tomography angiography (OCTA) images were obtained with a Spectralis OCTA system (Heidelberg Engineering, Germany) preoperatively and in three postoperative visits. The FAZ was measured using both methods. Results: The study analyzed 708 OCTA scans from 59 eyes. Correlation analyses showed strong agreement between the semiautomated script-based and ML-based methods in the three plexuses, with Pearson correlation coefficients of r = 0.836 (95% CI: 0.74–0.89), r = 0.646 (95% CI: 0.45–0.78), and r = 0.861 (95% CI: 0.78–0.92), respectively (p < 0.0001 for all). In longitudinal analysis, the FAZ in the SVP decreased significantly after phacoemulsification at 1 and 2 months postoperatively with both the script-based method (p = 0.017 and p = 0.039) and the ML-based method (p < 0.0001 and p = 0.004). Conclusion: Our findings suggest that the ML-based approach is a reliable method for measuring the FAZ on OCTA, comparable to the semiautomated script-based algorithm, and may serve as a practical alternative. Moreover, a significant reduction in FAZ within the SVP was observed two months after phacoemulsification.
Keywords:
Retinal Imaging
; Foveal Avascular Zone
; Machine Learning
; Optical Coherence Tomography Angiography
; Quantitative Analysis
; Waikato Environment for Knowledge Analysis (WEKA)
1. Introduction
Optical coherence tomography (OCT) has become a standard diagnostic tool for monitoring therapeutic efficacy in patients with macular pathology. More recently, optical coherence tomography angiography (OCTA) has gained increasing use in clinical practice, providing a noninvasive evaluation of retinal and choroidal microvasculature. In contrast to fluorescein angiography, OCTA is dye-free and enables depth-resolved visualization of vascular plexuses [1]. Fluorescein angiography, by comparison, provides only two-dimensional images with overlapping plexuses and requires intravenous dye administration, which may be associated with adverse events [2].
Although quantitative analysis of OCTA images is limited to specific commercial devices [3], open-source software such as Fiji (ImageJ2) can reproduce these analyses in a reproducible and comparable manner. This platform is an image-processing package specifically designed for scientific applications and is widely adopted in biomedical research [4]. Although foveal avascular zone (FAZ) characterization using OCTA has been extensively studied, no standardized approach has yet been established [5]. OCTA devices lacking built-in quantification tools may benefit from third-party software solutions, including artificial intelligence, to achieve accurate FAZ measurements. Such strategies could contribute to the standardization of OCTA parameters. In this study, we trained the Trainable Weka Segmentation plugin, a Fiji-based machine learning (ML) tool [6], and compared its performance with a script specifically designed for FAZ analysis in Spectralis OCTA images.
2. Materials and Methods
This study included human participants and was approved by the local Ethics Committee (Idcsalud Catalunya; ID 2017/62-OFT-ICR) and adhered to the tenets of the Declaration of Helsinki. Written informed consent was obtained from all participants. Patients undergoing phacoemulsification between January 2018 and January 2020 were enrolled. OCTA images were acquired with the Spectralis OCTA system (Heidelberg Engineering, Heidelberg, Germany) at baseline and at 1, 4, and 8 weeks postoperatively. The acquisition protocol consisted of 512 high-resolution B-scans covering a 3 × 3 mm area centered on the fovea. Sample size was calculated as described by Brizzi [7].
The Spectralis default segmentation software automatically identified three vascular plexuses: the superficial vascular plexus (SVP), extending from the nerve fiber layer to the inner plexiform layer; the intermediate vascular plexus (IVP), from the inner plexiform layer to the inner nuclear layer; and the deep vascular plexus (DVP), from the inner nuclear layer to the outer plexiform layer. OCT images were classified according to Huang [8], and poor-quality scans (quality index ≤15) were excluded. Images with motion artifacts, such as horizontal lines across the central field, were also excluded. Data were adjusted according to the methods of Sampson and Linderman [9,10]. In total, 708 OCTA images were obtained and converted into Tag Image File (.tif) format for analysis in Fiji software.
The FAZ was measured using a script adapted from Ishii [11]. Minor modifications were introduced, including adjustment of image size and the application of Otsu binarization [12], a local/global thresholding method that reduces artifacts compared with other binarization algorithms (Figure 1).
The script was set as follows:
run("8-bit");
makeRectangle (127, 127, 512, 512)
run("Crop");
run("Size...", "width=270 height=270 constrain average interpolation=Bilinear");
run("Auto Threshold", "method=Otsu white");
setOption("BlackBackground", true); run("Skeletonize");
run("Dilate");
run("Dilate");
run("Dilate");
run("Dilate");
run("Dilate");
run("Dilate");
run("Dilate");
run("Dilate");
run("Erode");
run("Erode");
run("Erode");
run("Erode");
run("Size...", "width=512 height=512 constrain average interpolation=Bilinear");
doWand(255, 255);
roiManager("Add");
In addition, FAZ measurements were obtained using the Trainable Weka Segmentation plugin, an ML-based technique within Fiji. The Weka segmentation parameters focused on image texture features, including mean, median, entropy, and variance. Pixel intensity values in each region (vascular/avascular) ranged from 0 to 255. Three linear regions of interest were drawn in representative areas to train the classifier with the correct boundaries. This trained model was then applied to analyze all images (Figure 2).
To evaluate agreement between methods, we assessed the correlation between the semiautomated script-based approach and the ML-based approach for FAZ quantification. For each vascular plexus, the mean and standard deviation (SD) of the FAZ area were calculated. Pearson correlation coefficients were obtained by comparing both methods across the three plexuses and the four visits.
3. Results
The study included 59 patients, with a mean axial length of 23.79 ± 1.7 mm and a mean refraction of −0.50 ± 2.64 D. FAZ measurements across the three vascular plexuses and four visits are summarized in Table 1.
1 SVP= superficial vascular plexus, IVP= intermediate vascular plexus, DVP= deep vascular plexus, Script= plexus measured with ImageJ script, Weka= plexus measured with the ML plugin.
The FAZ area in the superficial vascular plexus (SVP) was similar between the script-based and ML-based methods [0.44 mm² vs. 0.40 mm²; r = 0.836 (95% CI: 0.74–0.89), p < 0.0001]. Similar agreement was found for the intermediate vascular plexus (IVP) [0.15 mm² vs. 0.19 mm²; r = 0.646 (95% CI: 0.45–0.78), p < 0.0001] and the deep vascular plexus (DVP) [0.39 mm² vs. 0.44 mm²; r = 0.861 (95% CI: 0.78–0.92), p < 0.0001]. Overall, correspondence between methods was strong across all three vascular plexuses. The correlations for each individual visit are illustrated in Figure 3, Figure 4 and Figure 5.
Longitudinal analysis revealed a significant reduction in FAZ area within the SVP when comparing the preoperative visit with the 1- and 2-month postoperative visits, both with the script-based method (p = 0.017 and p = 0.039, repeated-measures linear regression with Tukey adjustment) and the ML-based method (p < 0.001 and p = 0.004). No significant changes were detected in the IVP using either method. In the DVP, no significant difference was observed across visits with the script-based method; however, the ML-based approach identified a significant decrease in FAZ area between the preoperative and 1-month postoperative visits (p = 0.012). The changes in FAZ measurements in the different plexuses are illustrated in Figure 6.
4. Discussion
Quantitative analysis of OCTA images is not yet standardized; each manufacturer relies on proprietary software, while non-commercial platforms apply different algorithms to obtain similar outcomes [4]. For example, some OCTA devices incorporate built-in analysis modules, such as the AngioAnalytics™ module in the Optovue RTVue-XR Avanti (Optovue Inc., Fremont, CA), the Angioplex module in the Zeiss Cirrus HD-OCT 5000 (Zeiss Meditec, Inc.), and the DRI Triton module from Topcon (Topcon, Japan) [3]. In contrast, other devices either lack quantitative analysis modules or only offer beta versions that are not widely accessible to the ophthalmic community.
The Spectralis device provides high-resolution images but does not include native tools for quantitative FAZ assessment. In contrast, Fiji software and its available plugins offer versatile solutions for analyzing two-dimensional images. As an open-source image-processing platform specifically designed for scientific applications, Fiji enables reproducible and comparable quantitative analyses through customizable plugins or user-developed scripts. In scientific image analysis, the choice of functions depends on the feature of interest; borders and textures are critical in histologic images and equally relevant in OCTA images.
Both manual and automated approaches to FAZ measurement have been described. Manual delineation requires multiple observers to ensure reproducibility and to account for interobserver variability. However, previous studies have demonstrated substantial inconsistency in manual FAZ measurements, underscoring the need for standardized methods [4].
Several semiautomated scripts have been developed to quantify the FAZ, often implemented in ImageJ macros, Python, or other programming languages [13]. Ishii employed the Li threshold for binarization and applied dilation and erosion masks to refine pixel boundaries [11]. Díaz used the Canny edge detector to establish borders, combined with similar morphological masks to obtain the final segmentation [13]. Gutiérrez-Benítez applied the Ishii script with contrast modifications in a cohort of 29 healthy subjects [14]. In our study, we applied the Otsu threshold for binarization, as it reduces image noise compared with other algorithms [12,15], and used dilation and erosion masks following the approach described by Ishii [11].
Weka, an ML-based plugin developed to differentiate borders and regions by analyzing pixel patterns, has previously been applied to quantify the foveal ellipsoid zone after vascular occlusion [16]. In the present study, we used this Fiji plugin to quantify the FAZ.
FAZ characterization following phacoemulsification has been scarcely reported. Perente investigated changes in macular thickness on OCT after phacoemulsification [17], while Oh described hyperreflective dots in OCT images of patients with macular edema after surgery [18]. Chetrit reported vascular density in OCTA images of eight patients with macular edema post-phacoemulsification [19]. More recently, Liu demonstrated a decrease in FAZ area after phacoemulsification in a cohort of 58 patients, consistent with our findings [20]. Experimental data also support these observations, as increased levels of pro-inflammatory proteins such as chemokine 2 and interleukin-1β have been reported in the neurosensory retina of mice following lens extraction. These molecular changes increase macular capillary permeability and reduce the barrier function of retinal pigment epithelial cells, leading to retinal thickening [21].
Automated FAZ quantification, including the use of artificial intelligence software, is increasingly implemented to improve OCTA analysis. Survey-based studies have attempted to establish normative values for quantitative parameters to facilitate future standardization [4]. In our study, we compared an ImageJ script with the Trainable Weka Segmentation plugin and found that both methods yielded highly correlated results, consistent with prior publications. To our knowledge, this is the first study to apply Trainable Weka Segmentation, an ML-based Fiji plugin, for FAZ quantification in OCTA images.
5. Conclusions
The FAZ decreased significantly two months after phacoemulsification in the superficial vascular plexus. The Trainable Weka Segmentation plugin, an ML-based tool, provided reliable and reproducible FAZ measurements, comparable to those obtained with a semiautomated script-based method. These findings support the feasibility of incorporating open-source, AI-based approaches into OCTA analysis to advance the standardization of quantitative retinal imaging.
Author Contributions
Conceptualization, M.S.P. and I.J.; methodology, M.S.P and I.J.; software, M.S.P. and E.T.; validation, M.S.P, E.T., A.A.D and I.J.; formal analysis, M.S.P and I.J.; investigation, M.S.P.; resources, M.S.P. and I.J.; data curation, M.S.P and I.J.; writing—original draft preparation, M.S.P.; writing—review and editing, M.S.P, E.T., A.A.D and I.J.; visualization, M.S.P.; supervision, I.J.; project administration, M.S.P. and I.J. All authors have read and agreed to the published version of the manuscript.
Funding
This research received no external funding.
Institutional Review Board Statement
local Ethics Committee (Idcsalud Catalunya; ID 2017/62-OFT-ICR, 02 Jan 2018)
Informed Consent Statement
Informed consent was obtained from all subjects involved in the study.
Data Availability Statement
The original contributions presented in this study are included in the article. Further inquiries can be directed to the corresponding authors.
Acknowledgments
Declaration of Generative AI and AI-assisted technologies in the writing process: During the preparation of this work the authors used ChatGPT in order to improve readability and language. After using this tool, the authors reviewed and edited the content as needed and take full responsibility for the content of the publication.
Conflicts of Interest
The authors declare no conflicts of interest.
Abbreviations
The following abbreviations are used in this manuscript:
| Abbreviation | Meaning |
| AI | Artificial Intelligence |
| DVP | Deep Vascular Plexus |
| FA | Fluorescein Angiography |
| FAZ | Foveal Avascular Zone |
| IVP | Intermediate Vascular Plexus |
| ML | Machine Learning |
| OCT | Optical Coherence Tomography |
| OCTA | Optical Coherence Tomography Angiography |
| SD | Standard Deviation |
| SVP | Superficial Vascular Plexus |
References
- A. Agüero, C; Ramón, N; Arzabe, C; Lávaque, “Angiografía de retina por tomografía de coherencia óptica,” Oft Cli y Exp, vol. 9, 2016.
- A. C. S. Tan et al., “An overview of the clinical applications of optical coherence tomography angiography,” Eye (Basingstoke), vol. 32, no. 2, pp. 2018. [CrossRef]
- M. R. Munk et al., “OCT-angiography: A qualitative and quantitative comparison,” PLoS One, vol. 12, no. 5, pp. 2017; 14. [CrossRef]
- M. R. Munk et al., “Standardization of OCT Angiography Nomenclature in Retinal Vascular Diseases : First Survey Results,” Ophthalmol Retina, pp. 2020; 10. [CrossRef]
- M. R. Munk et al., “Recommendations for OCT Angiography Reporting in Retinal Vascular Disease: A Delphi Approach by International Experts,” Ophthalmol Retina, vol. 6, no. 9, pp. 2022. [CrossRef]
- I. Arganda-Carreras et al., “Trainable Weka Segmentation: A machine learning tool for microscopy pixel classification,” Bioinformatics, vol. 33, no. 15, pp. 2424– 2426, 2017. [CrossRef]
- M. T. Brizzi Chizzoti Bonanomi et al., “Retinal thickness assessed by optical coherence tomography (OCT) in pseudophakic macular edema,” Arq Bras Oftalmol, vol. 69, no. 4, pp. 2006. [CrossRef]
- I. Huang et al., “Signal Quality Assessment of Retinal Optical Coherence Tomography Images,” vol. 1000, pp. 2133– 2141, 2012. [CrossRef]
- D. M. Sampson et al., “Axial length variation impacts on superficial retinal vessel density and foveal avascular zone area measurements using optical coherence tomography angiography,” Invest Ophthalmol Vis Sci, vol. 58, no. 7, pp. 3065– 3072, 2017. [CrossRef]
- R. E. Linderman et al., “Variability of foveal avascular zone metrics derived from optical coherence tomography angiography images,” Transl Vis Sci Technol, vol. 7, no. 6, pp. 2018; 17. [CrossRef]
- H. Ishii, T. H. Ishii, T. Shoji, Y. Yoshikawa, J. Kanno, H. Ibuki, and K. Shinoda, “Automated measurement of the foveal avascular zone in swept-source optical coherence tomography angiography images,” Transl Vis Sci Technol, vol. 8, no. 2019; 3. [Google Scholar] [CrossRef]
- Nobuyuki Otsu, “A Threshold Selection Method from Gray-Level Histograms,” IEEE Trans. Syst. Man Cybern, vol. 9, no. 1, pp. 62–66, 1979.
- M. Díaz, J. M. Díaz, J. Novo, P. Cutrín, F. Gómez-Ulla, M. G. Penedo, and M. Ortega, “Automatic segmentation of the Foveal Avascular Zone in ophthalmological OCT-A images,” ArXiv, pp. 1–22, 2018.
- L. Gutierrez-Benitez, Y. L. Gutierrez-Benitez, Y. Palomino, N. Casas, and M. Asaad, “Automated measurement of the foveal avascular zone in healthy eyes on Heidelberg spectralis optical coherence tomography angiography,” Arch Soc Esp Oftalmol, vol. 97, no. 8, pp. 2022. [Google Scholar] [CrossRef]
- J. H. Terheyden, M. W. M. J. H. Terheyden, M. W. M. Wintergerst, P. Falahat, M. Berger, F. G. Holz, and R. P. Finger, “Automated thresholding algorithms outperform manual thresholding in macular optical coherence tomography angiography image analysis,” PLoS One, vol. 15, no. 3, pp. 2020; 12. [Google Scholar] [CrossRef]
- T. Etheridge et al., “A semi-automated machine-learning based workflow for ellipsoid zone analysis in eyes with macular edema: SCORE2 pilot study,” PLoS One, vol. 15, no. 4, pp. 2020; 12. [CrossRef]
- I. Perente et al., “Evaluation of macular changes after uncomplicated phacoemulsification surgery by optical coherence tomography,” Curr Eye Res, vol. 32, no. 3, pp. 2007. [CrossRef]
- J. -H. Oh, R. S. Chuck, J. R. Do, and C. Y. Park, “Vitreous Hyper-Reflective Dots in Optical Coherence Tomography and Cystoid Macular Edema after Uneventful Phacoemulsification Surgery,” PLoS One, vol. 9, no. 4, p. e9 5066, 2014. [CrossRef]
- M. Chetrit et al., “Acute pseudophakic cystoid macular edema imaged by optical coherence tomography angiography,” Retina, vol. 38, no. 10, pp. 2073– 2080, 2018. [CrossRef]
- J. Liu et al., “Microvascular changes in macular area after phacoemulsification and its influencing factors assessed by optical coherence tomography angiography,” Ther Clin Risk Manag, vol. 17, pp. 2021. [CrossRef]
- H. Xu, M. H. Xu, M. Chen, J. V. Forrester, and N. Lois, “Cataract surgery induces retinal pro-inflammatory gene expression and protein secretion,” Invest Ophthalmol Vis Sci, vol. 52, no. 1, pp. 2011. [Google Scholar] [CrossRef]
Figure 1.
A. Otsu binarization of the SVP. B. The results of the ImageJ script. C. Fit of the result of the script in the 8-bit former image.
Figure 1.
A. Otsu binarization of the SVP. B. The results of the ImageJ script. C. Fit of the result of the script in the 8-bit former image.
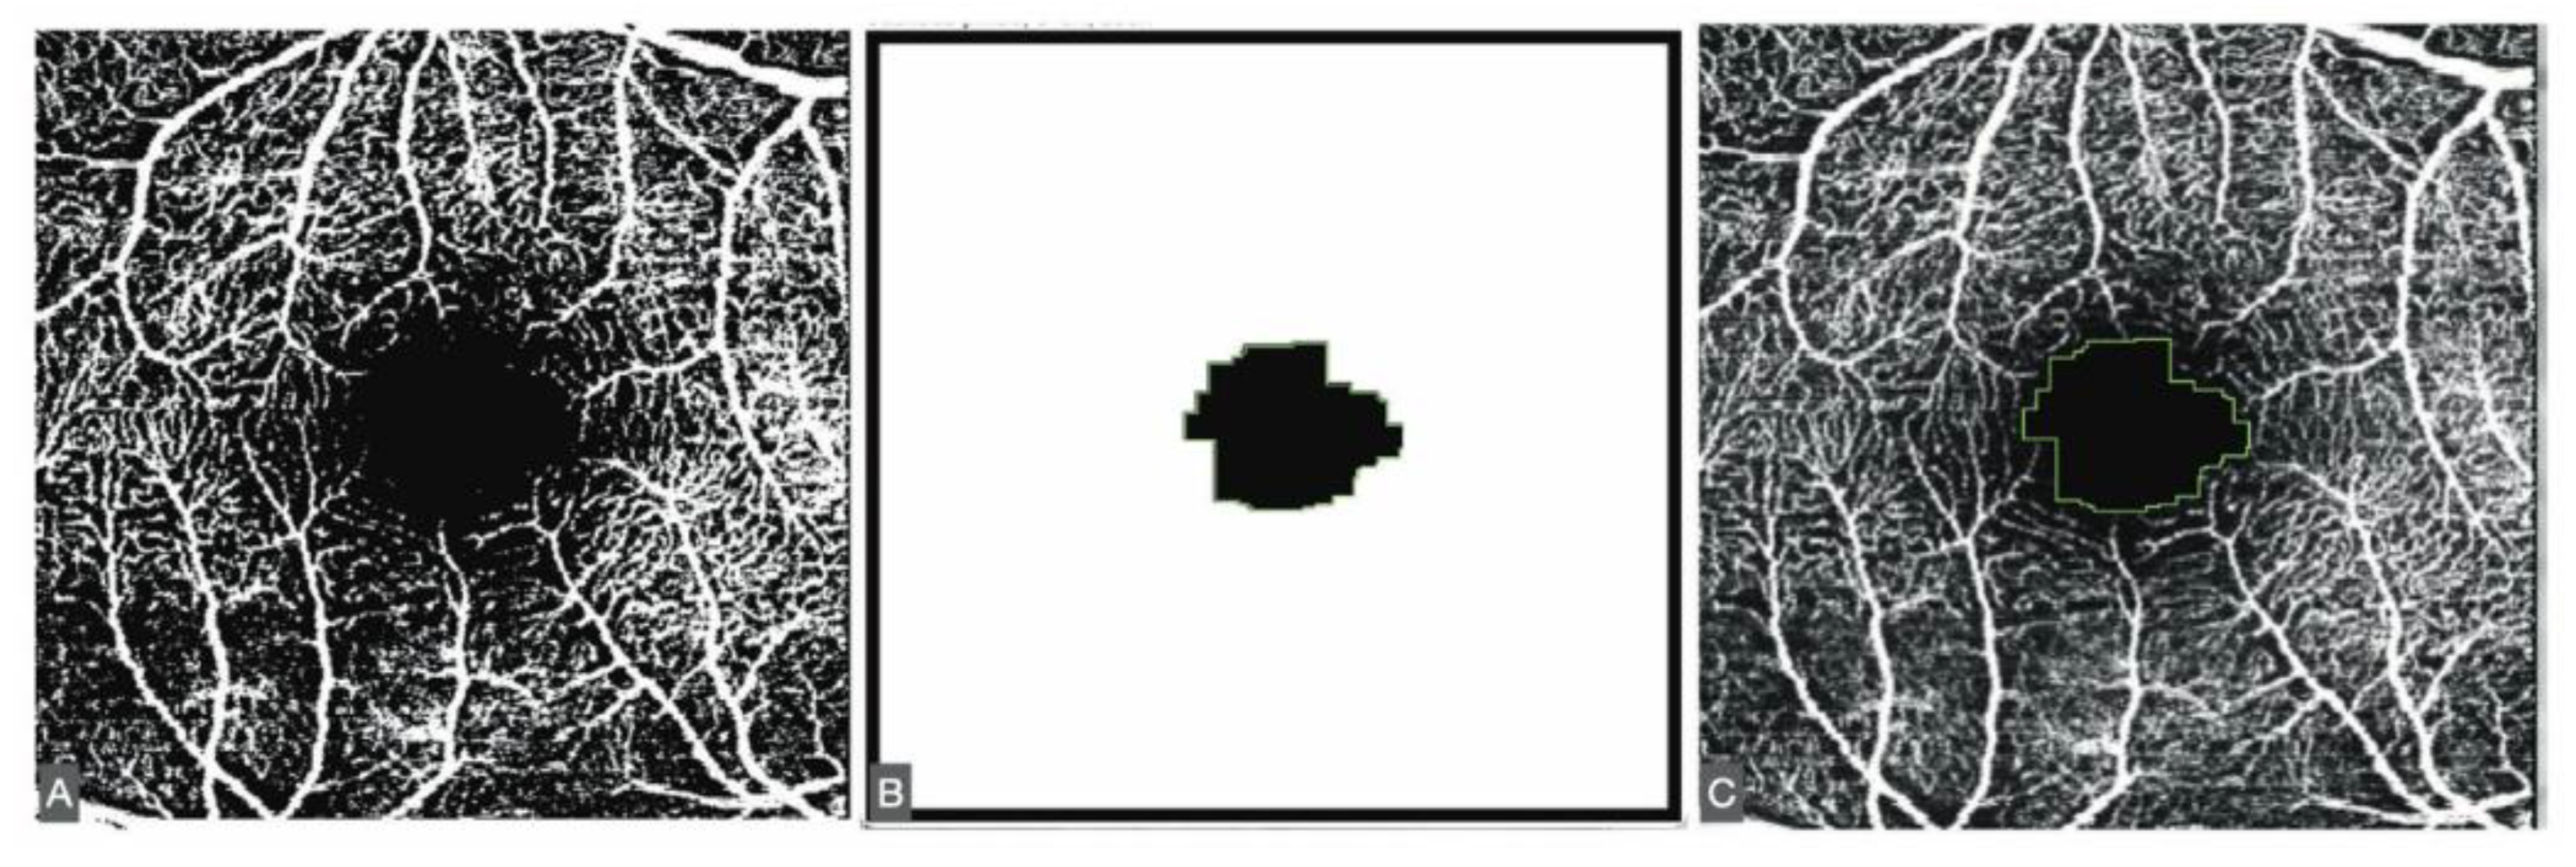
Figure 2.
A. Sequences drawn freehand to teach the ML plugin to differentiate zones. B. The results of the ML plugin. C. Fit of the result in the 8-bit former image.
Figure 2.
A. Sequences drawn freehand to teach the ML plugin to differentiate zones. B. The results of the ML plugin. C. Fit of the result in the 8-bit former image.
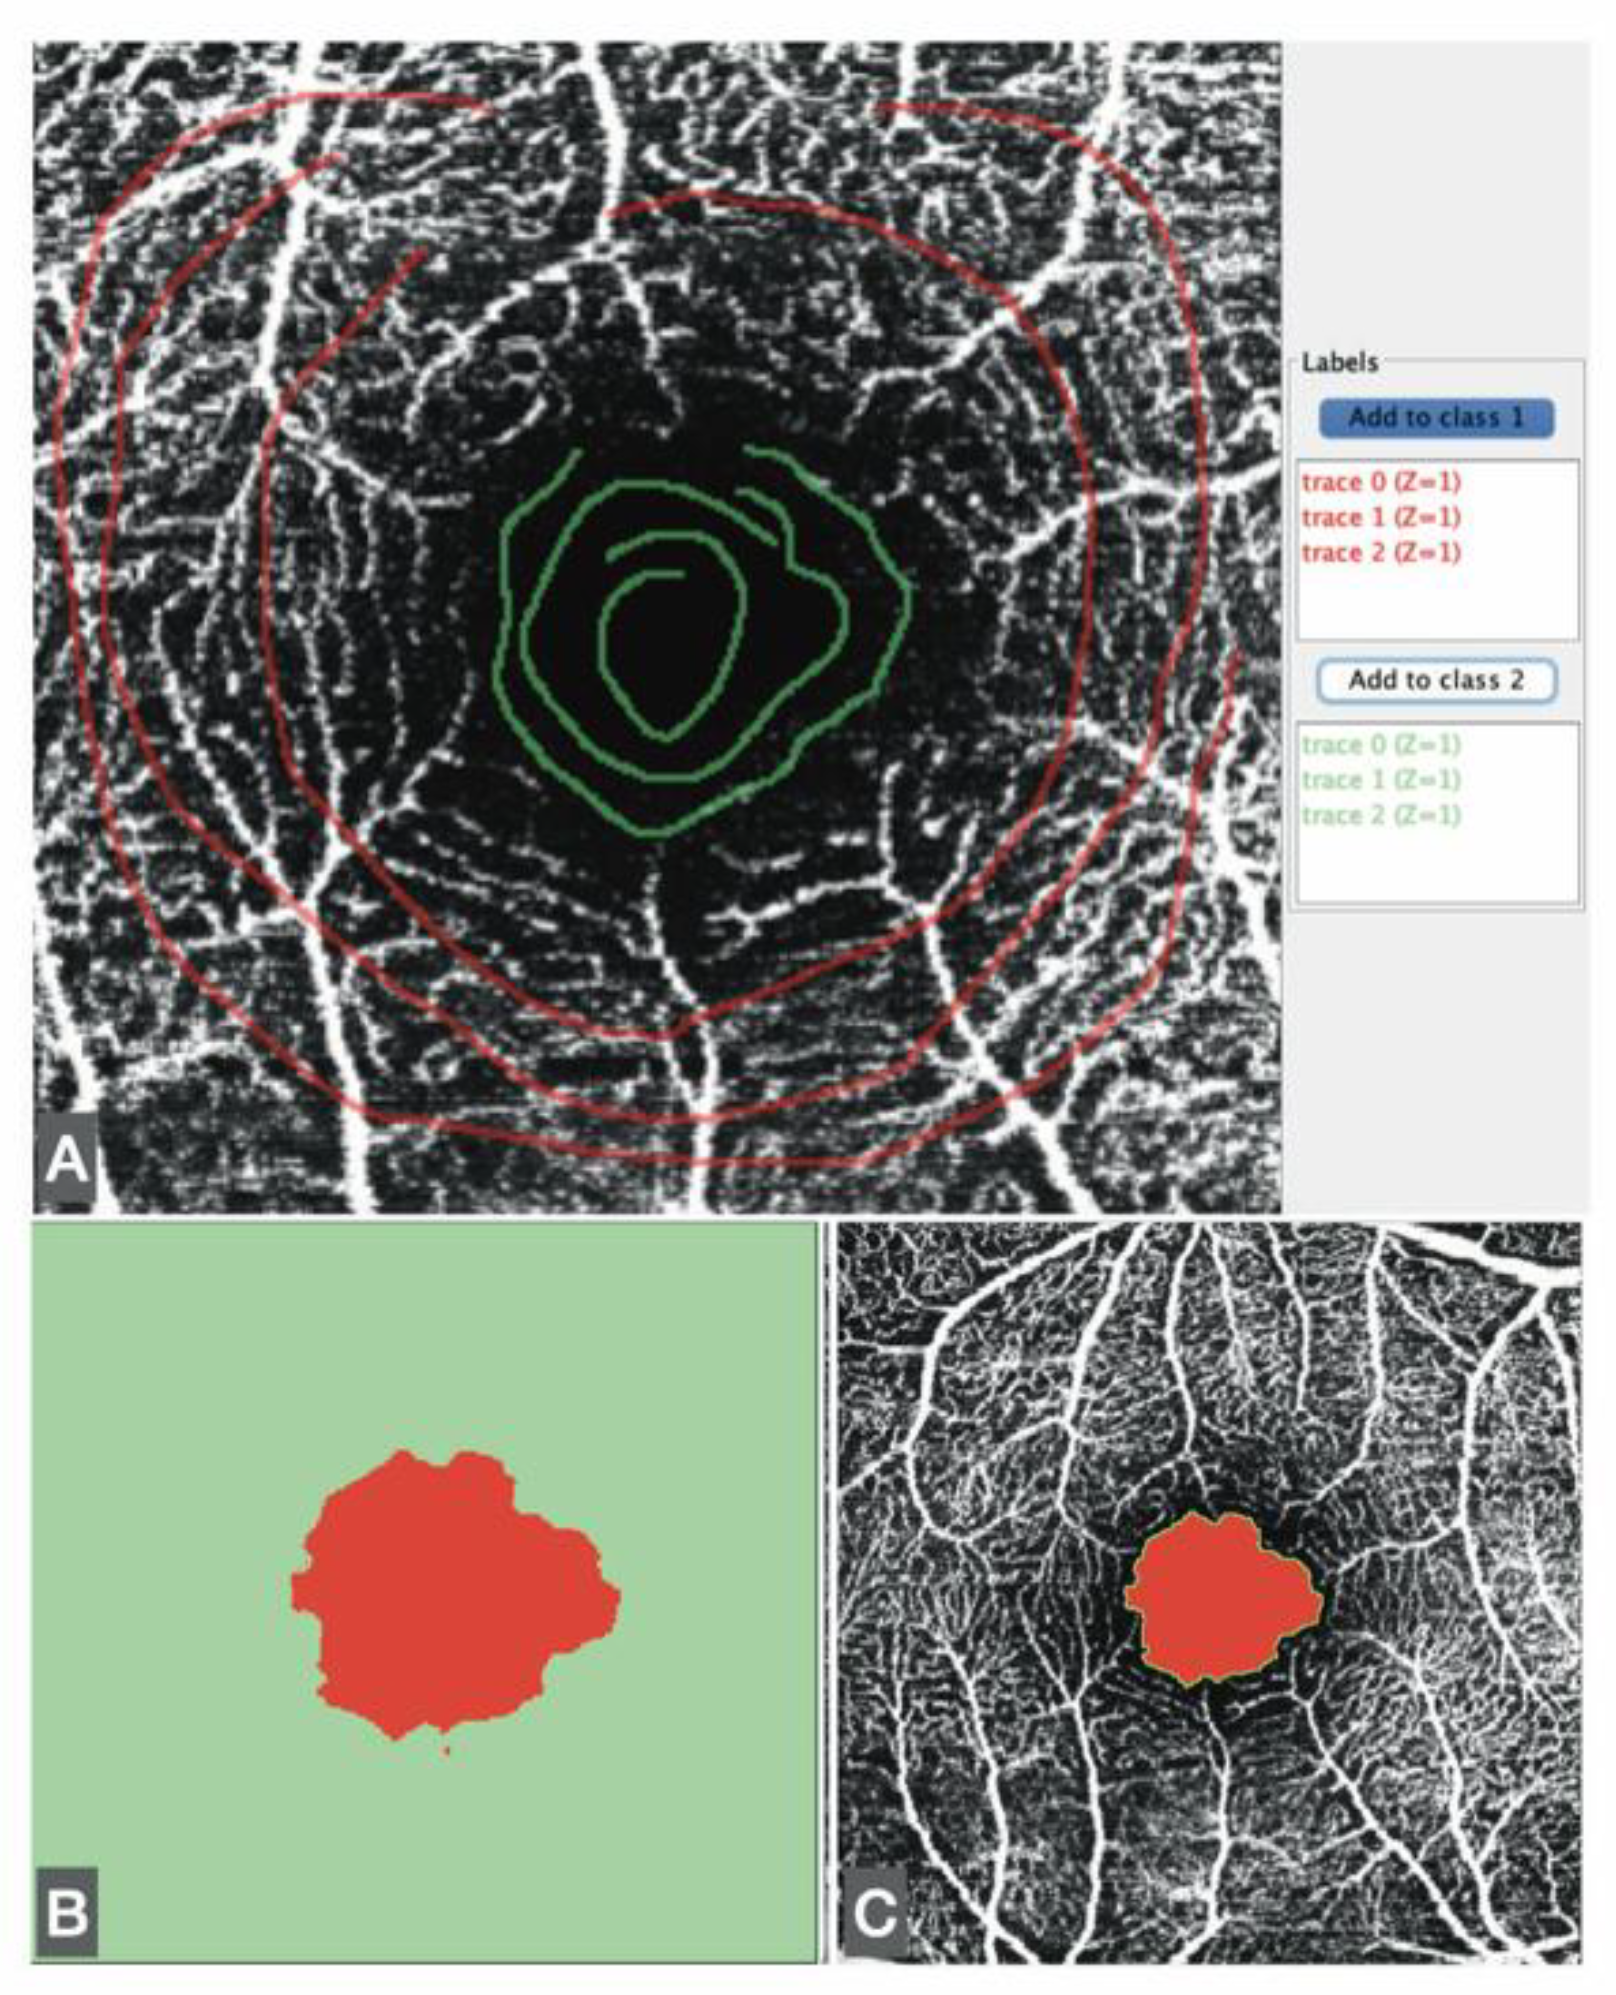
Figure 3.
Correlations between ImageJ scripts and ML measurements at the four visits to the SVP (from A to D, first to fourth visits).
Figure 3.
Correlations between ImageJ scripts and ML measurements at the four visits to the SVP (from A to D, first to fourth visits).
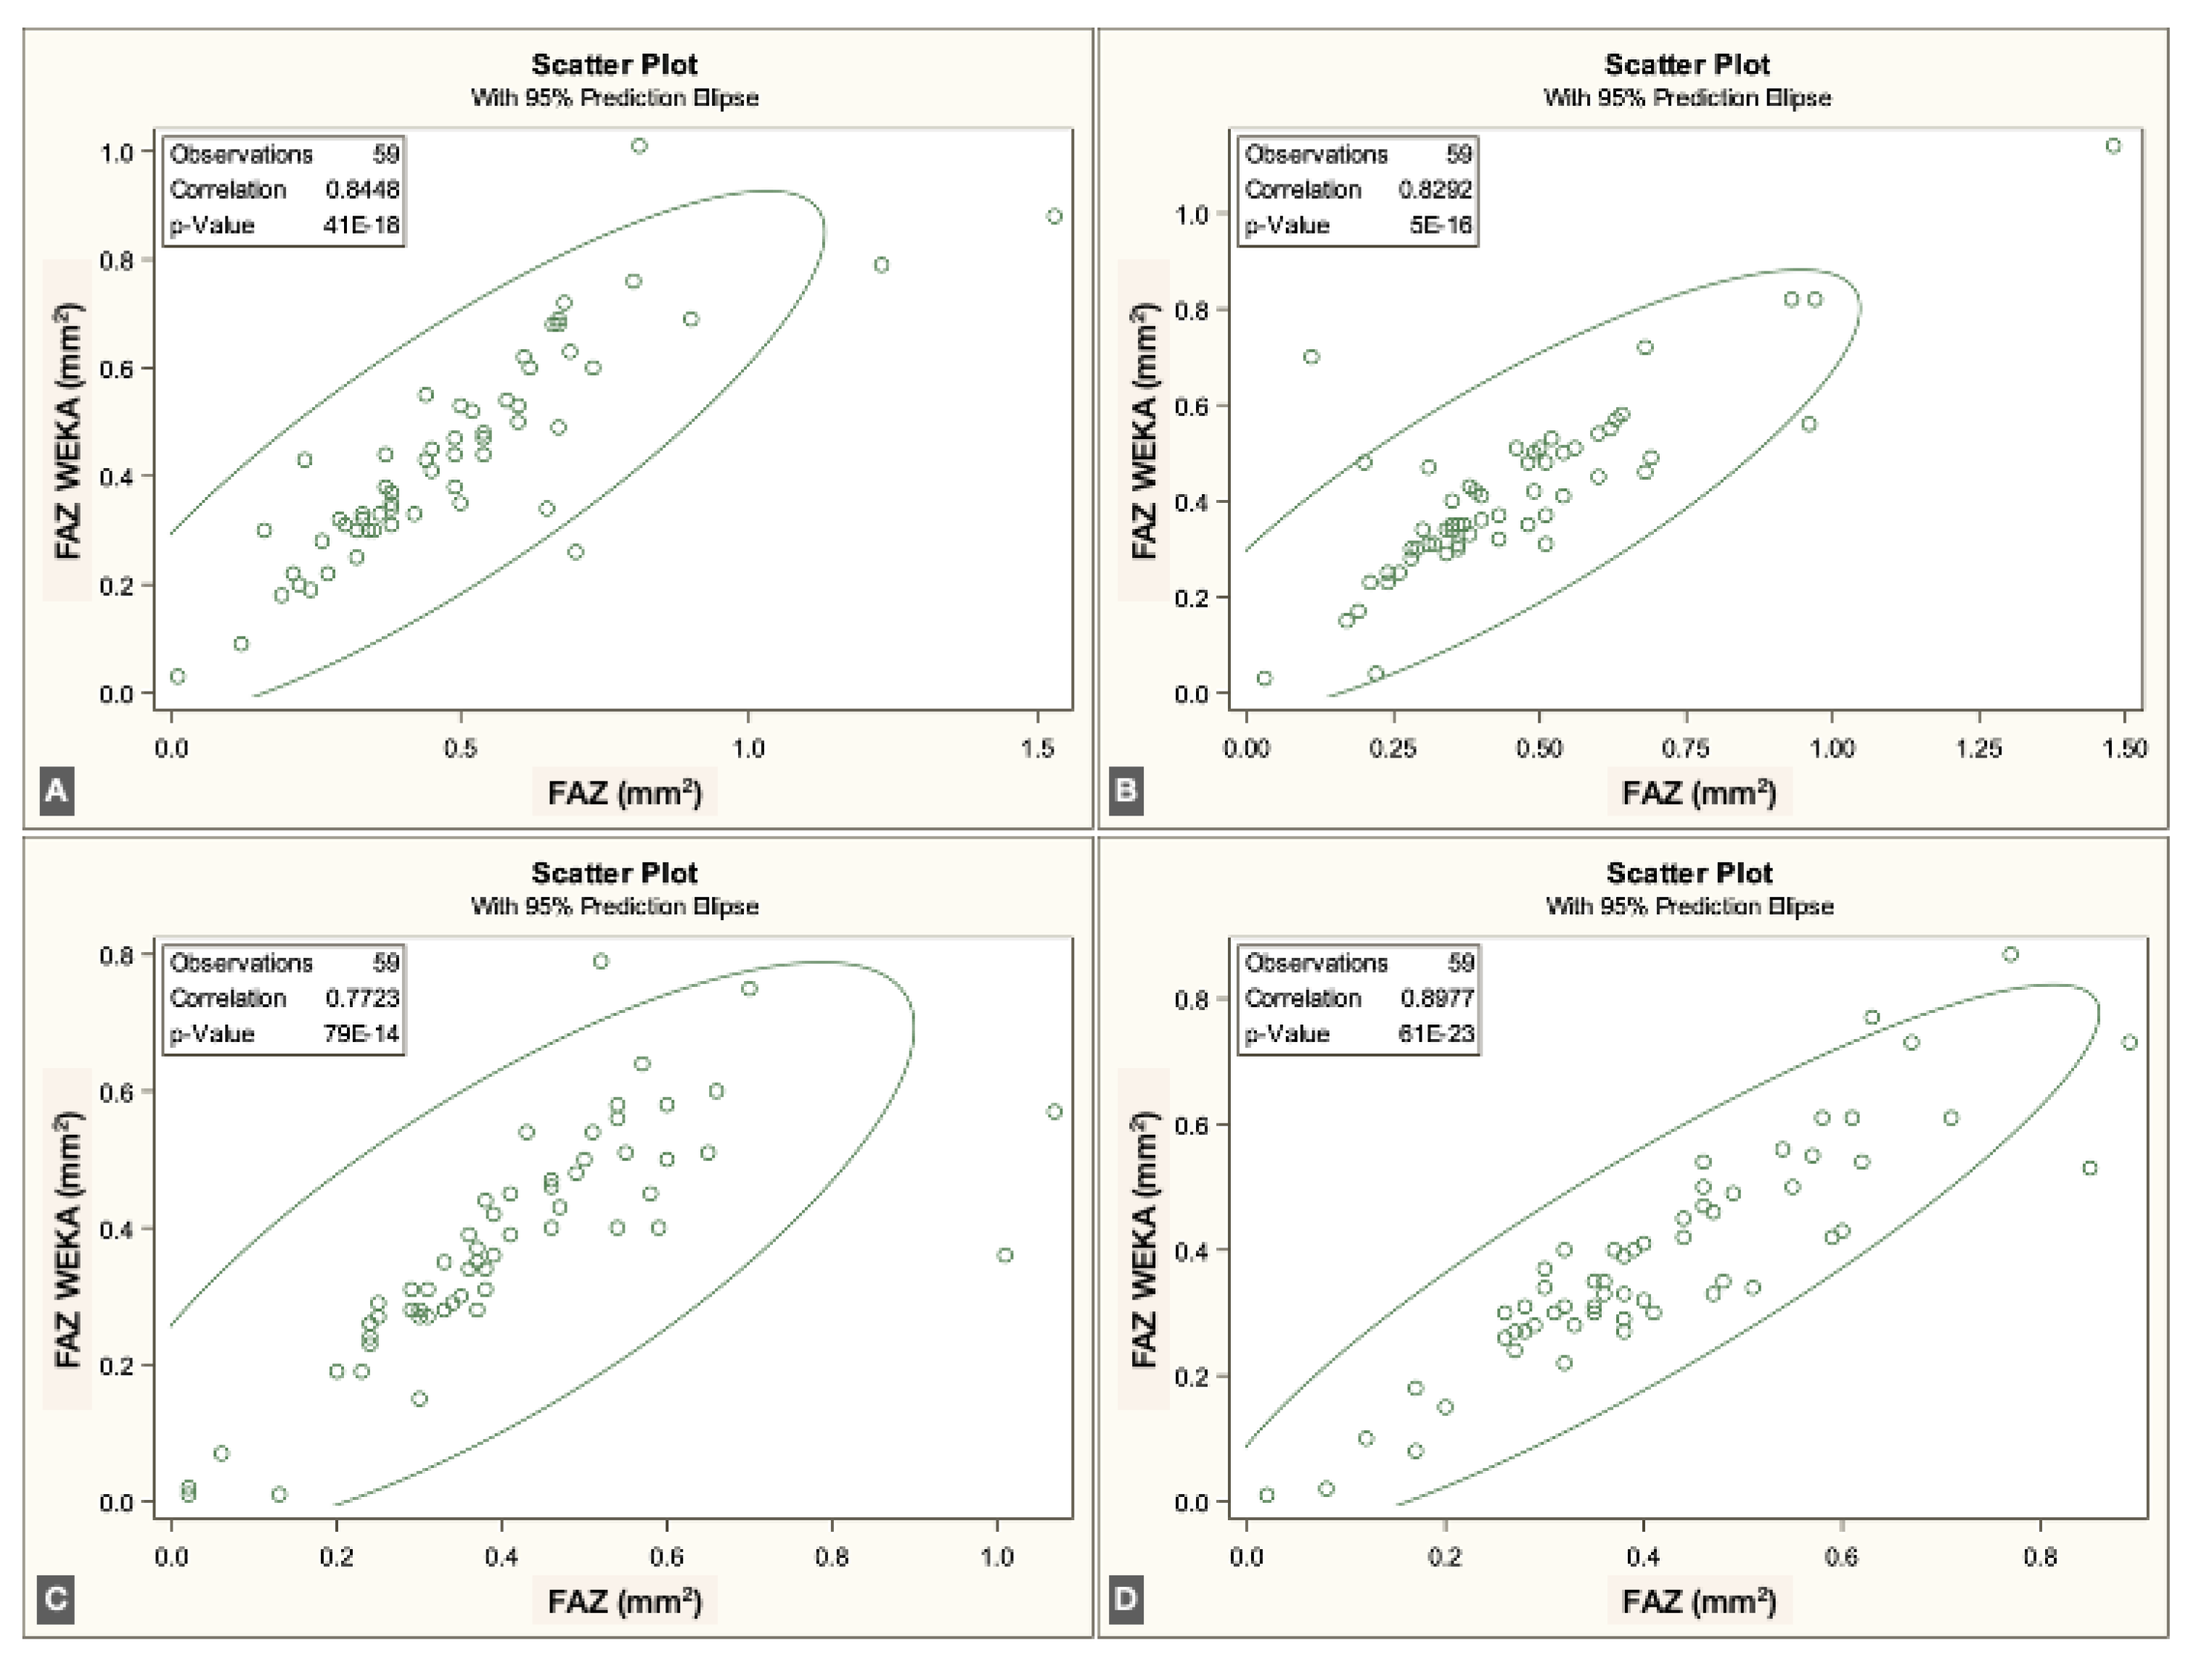
Figure 4.
Correlations between ImageJ scripts and ML measurements at the four visits to the IVP (from A to D, first to fourth visits).
Figure 4.
Correlations between ImageJ scripts and ML measurements at the four visits to the IVP (from A to D, first to fourth visits).
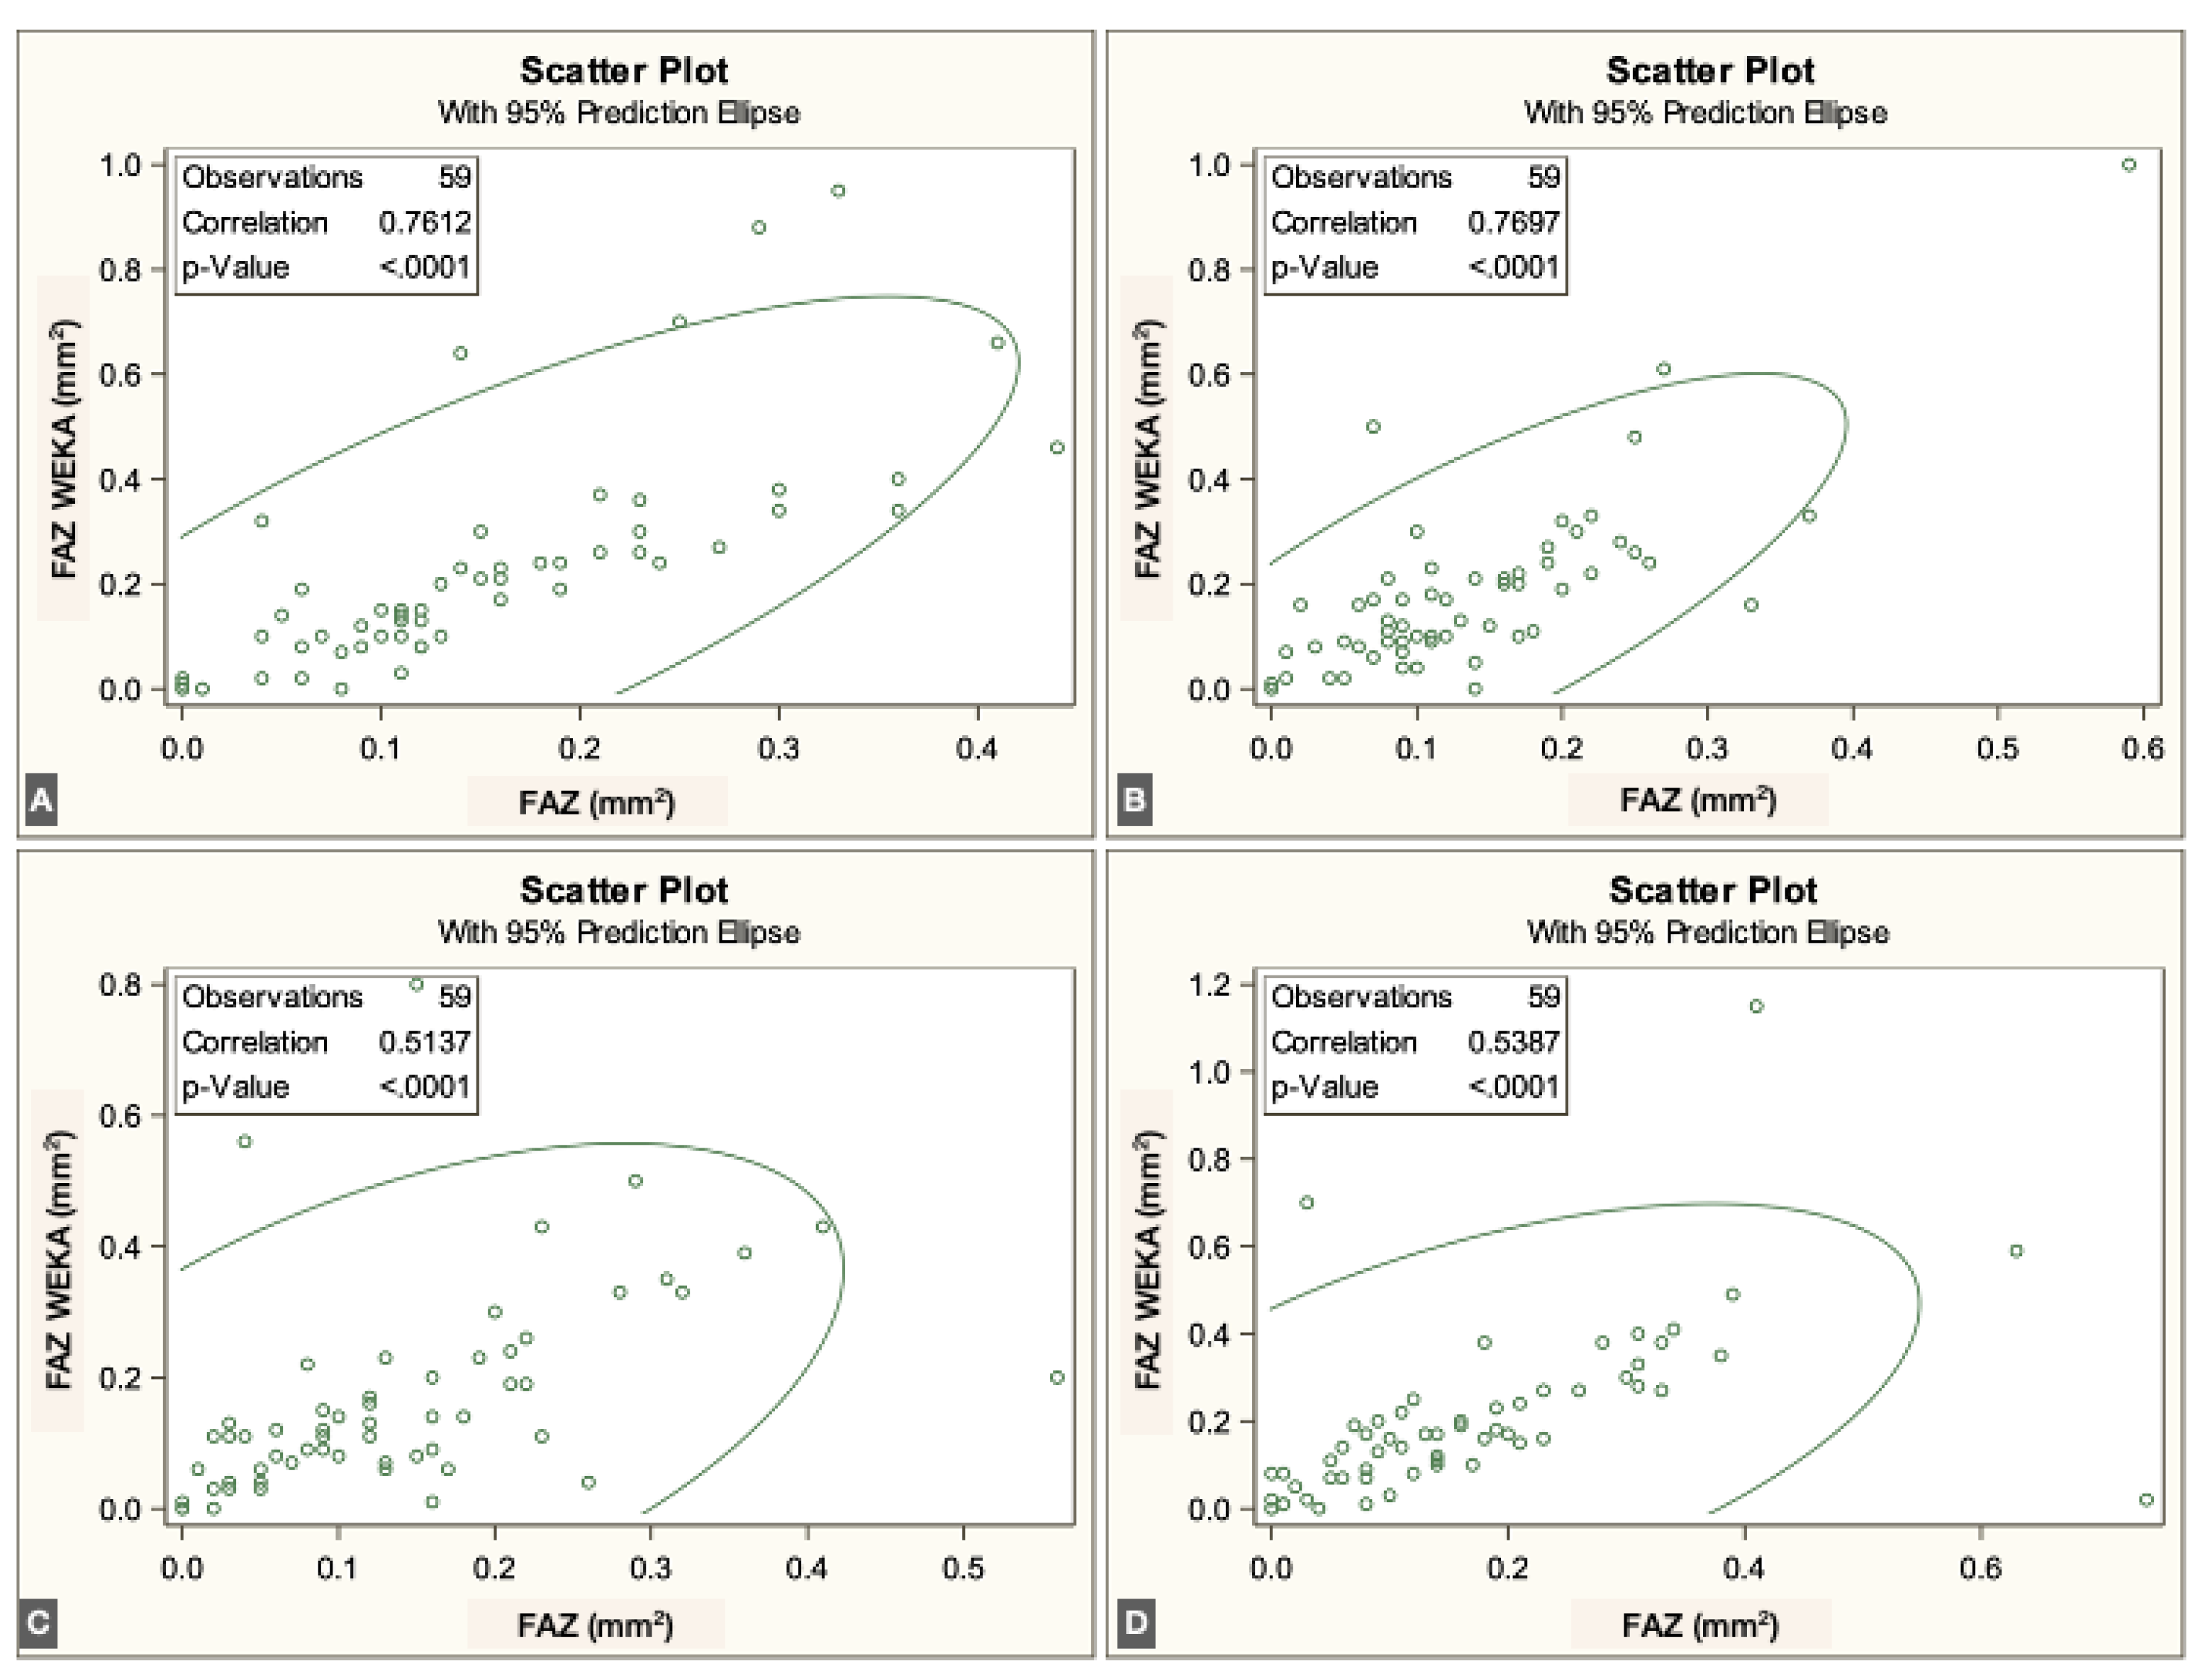
Figure 5.
Correlations between ImageJ scripts and ML measurements at the four visits to the DVP (from A to D, first to fourth visits).
Figure 5.
Correlations between ImageJ scripts and ML measurements at the four visits to the DVP (from A to D, first to fourth visits).
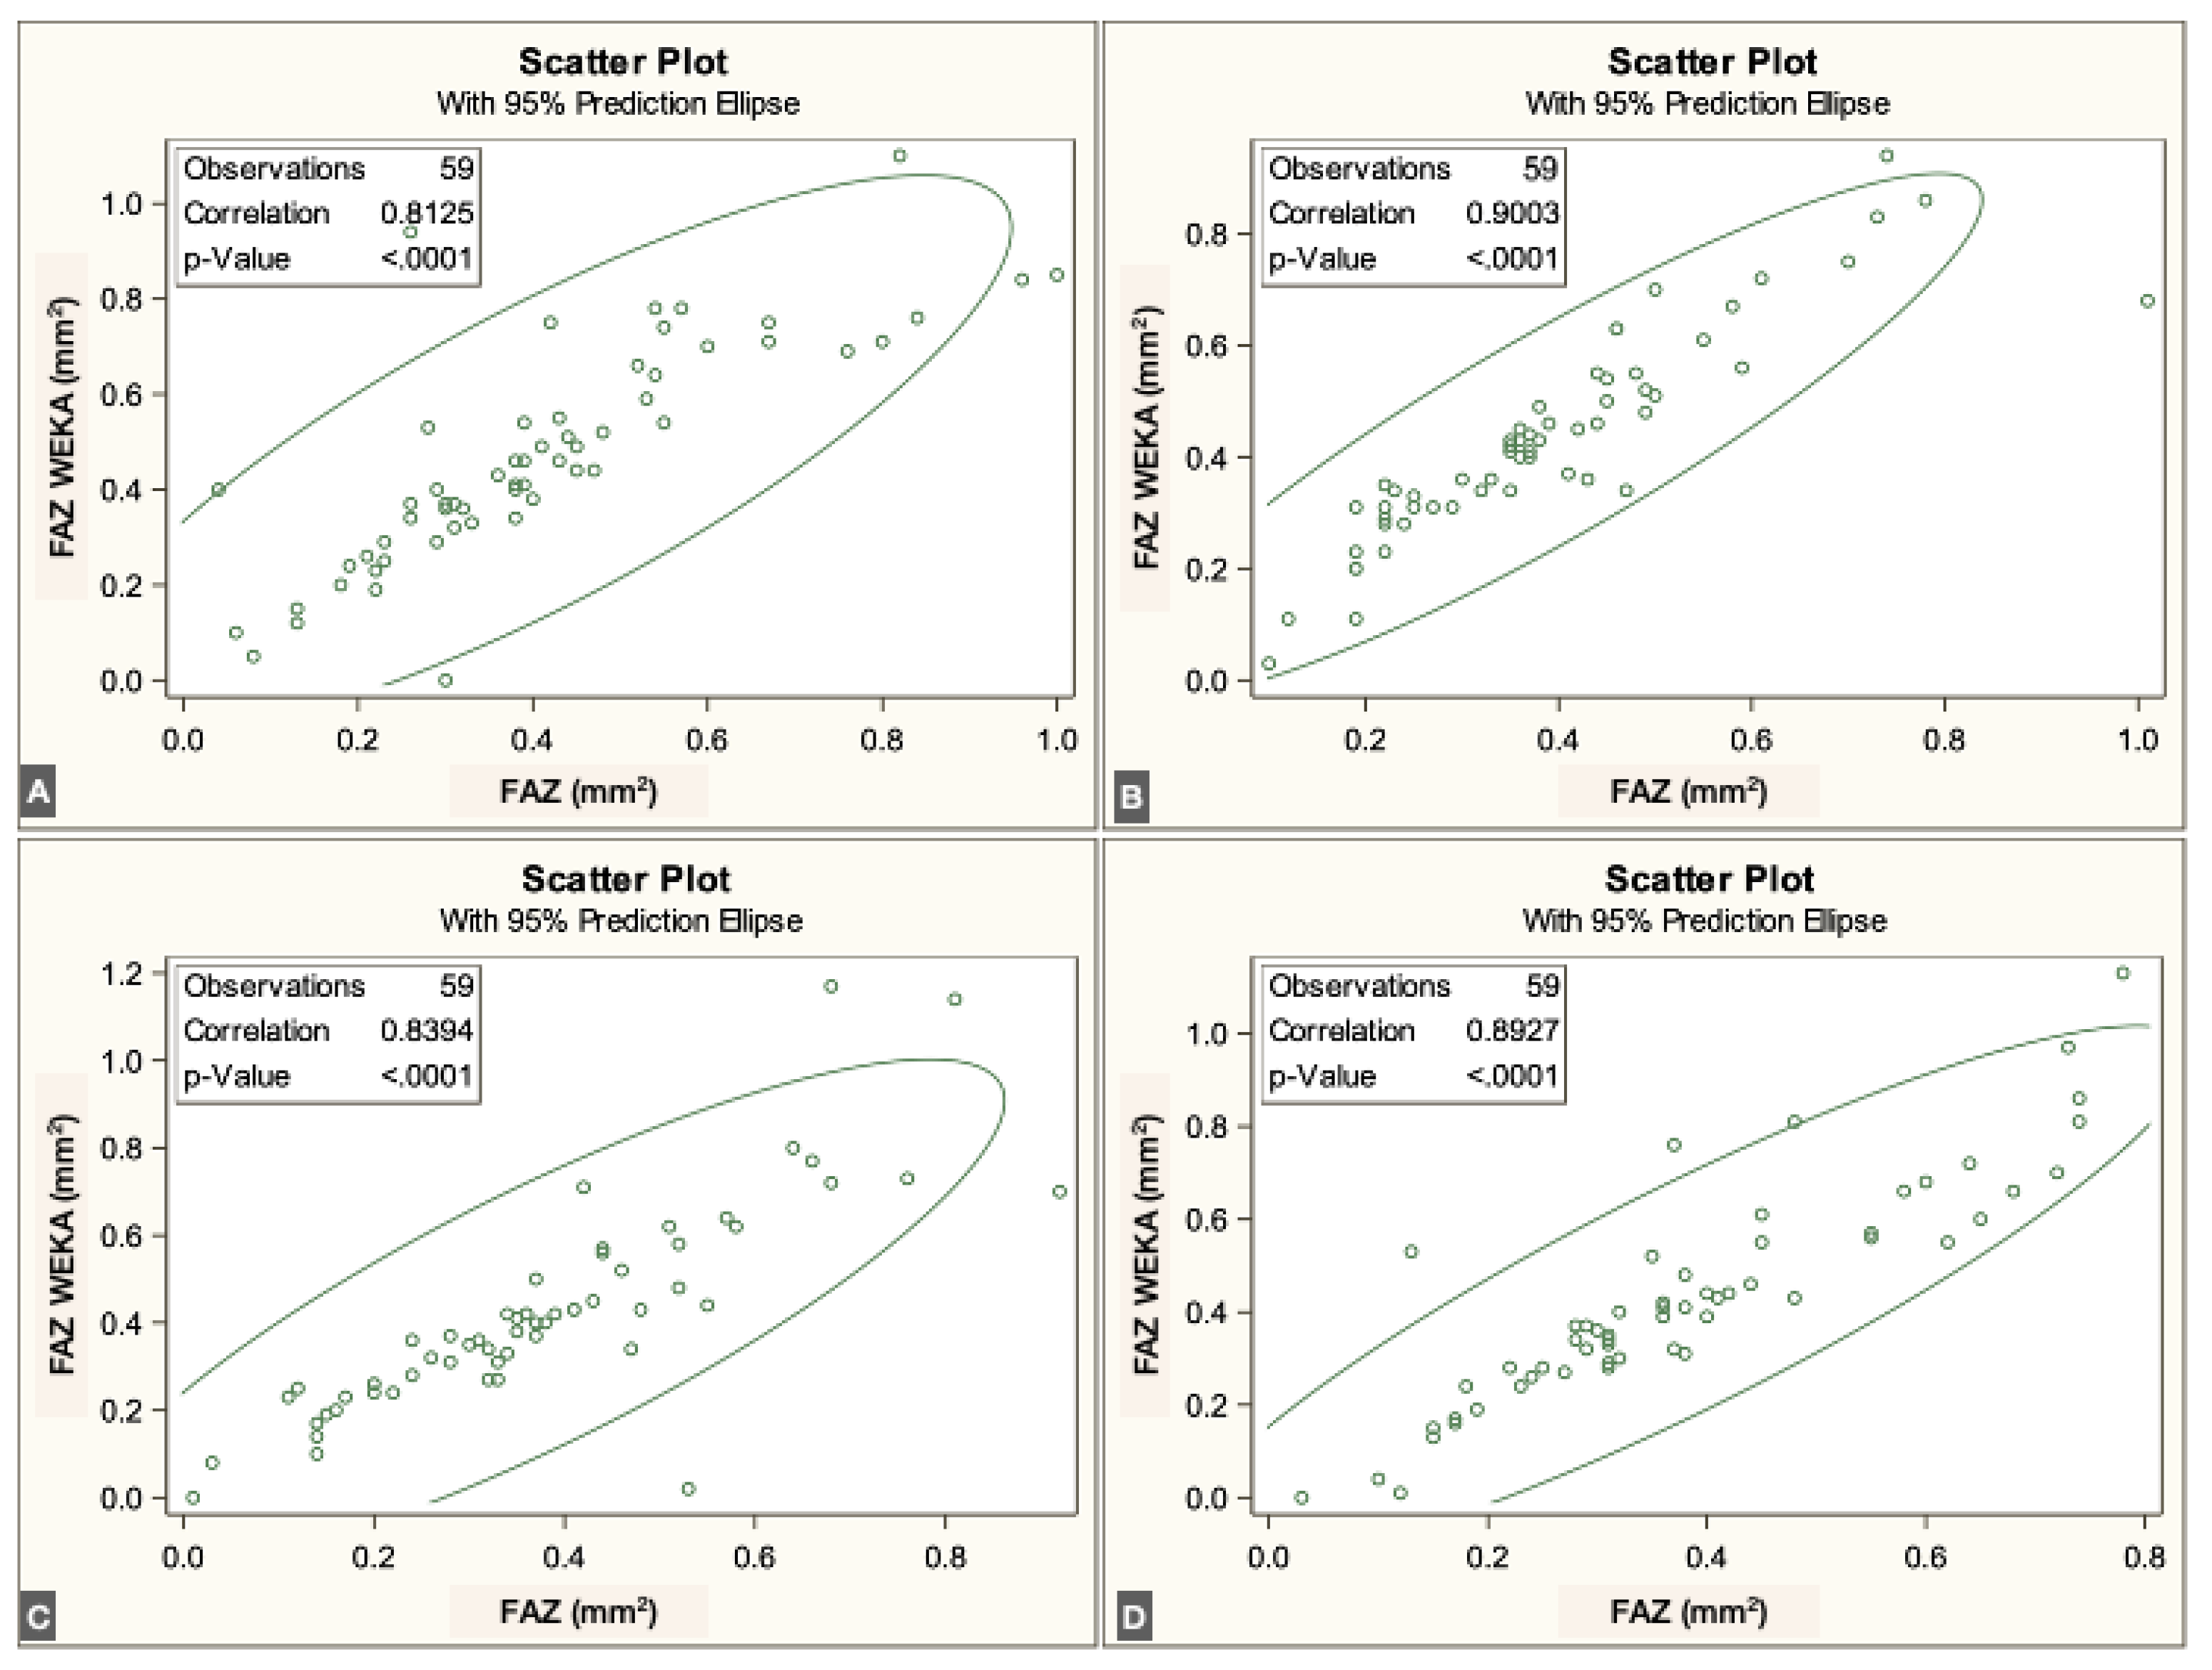
Figure 6.
Pre- and postoperative measurements of the FAZ at the four visits in the SVP in ImageJ script (A) and ML mode (B), in the IVP in ImageJ script (C) and ML mode (D) and in the DVP in ImageJ script (E) and ML mode (F).
Figure 6.
Pre- and postoperative measurements of the FAZ at the four visits in the SVP in ImageJ script (A) and ML mode (B), in the IVP in ImageJ script (C) and ML mode (D) and in the DVP in ImageJ script (E) and ML mode (F).
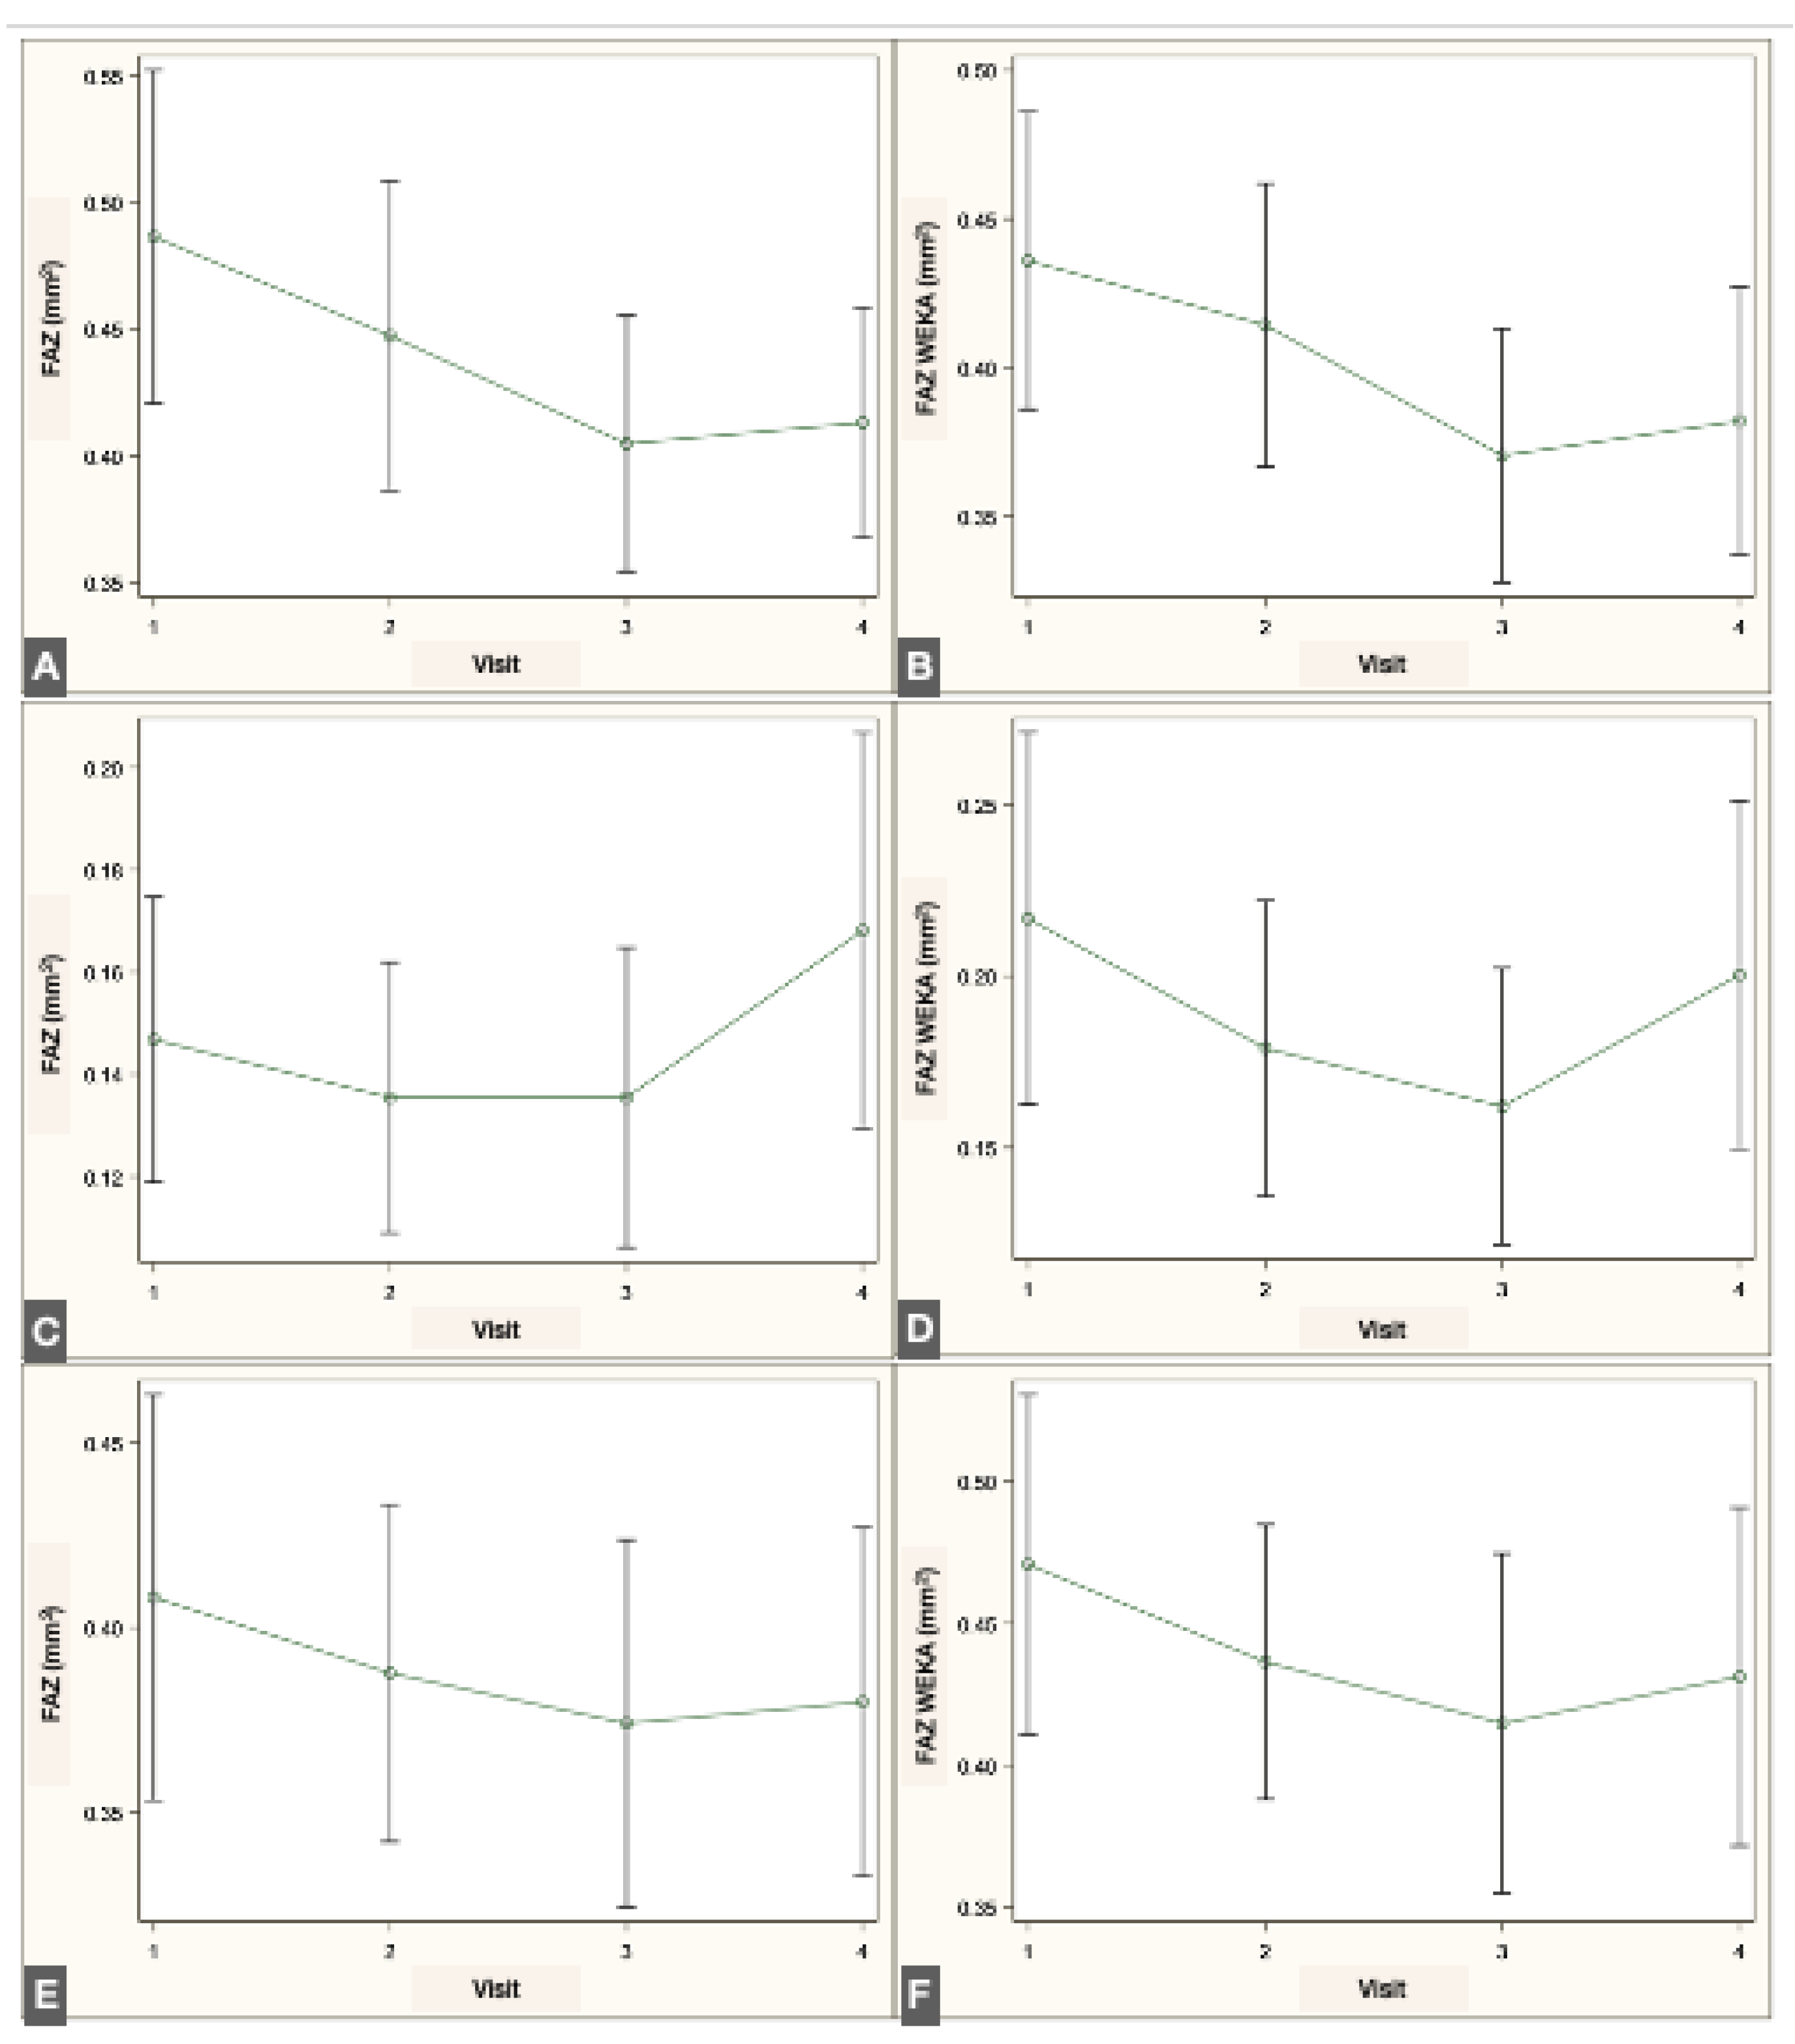

Table 1.
Area of the FAZ (mm2) in the three vascular plexuses, comparing the script-based and ML. Methods.
Table 1.
Area of the FAZ (mm2) in the three vascular plexuses, comparing the script-based and ML. Methods.
| Visit | SVP script | SVP Weka | IVP script | IVP Weka | DVP script | DVP Weka |
| Visit 1 | 0.49±0.25 | 0.44±0.19 | 0.15±0.11 | 0.22±0.21 | 0.41±0.21 | 0.47±0.23 |
| Visit 2 | 0.45±0.23 | 0.41±0.18 | 0.14±0.10 | 0.18±0.17 | 0.39±0.18 | 0.44±0.18 |
| Visit 3 | 0.41±0.19 | 0.37±0.16 | 0.14±0.11 | 0.16±0.16 | 0.37±0.19 | 0.42±0.23 |
| Visit 4 | 0.41±0.17 | 0.38±0.17 | 0.17±0.15 | 0.16±0.20 | 0.38±0.18 | 0.43±0.23 |
Disclaimer/Publisher’s Note: The statements, opinions and data contained in all publications are solely those of the individual author(s) and contributor(s) and not of MDPI and/or the editor(s). MDPI and/or the editor(s) disclaim responsibility for any injury to people or property resulting from any ideas, methods, instructions or products referred to in the content. |
© 2025 by the authors. Licensee MDPI, Basel, Switzerland. This article is an open access article distributed under the terms and conditions of the Creative Commons Attribution (CC BY) license (http://creativecommons.org/licenses/by/4.0/).
Copyright: This open access article is published under a Creative Commons CC BY 4.0 license, which permit the free download, distribution, and reuse, provided that the author and preprint are cited in any reuse.


