Submitted:
27 September 2025
Posted:
30 September 2025
You are already at the latest version
Abstract
Climate change remains one of the greatest crucial challenges worldwide; with uni-versity students playing a critical role in determining future sustainability. This study investigated the awareness; perceptions; and engagement of female students at Qatar University (N = 890) regarding global climate change and governmental improvement efforts. Using a cross-sectional quantitative design and Confirmatory Factor Analysis (CFA); findings revealed significantly high awareness levels (M = 3.65; SD = 0.76; t(889) = 25.52; p < .001); with 56.5% of respondents showing high awareness. Aware-ness of government initiatives was also elevated (M = 3.77; SD = 0.88; t(889) = 25.96; p < .001). Regression analysis showed that digital media (TV/Internet; social media/AI) and governmental campaigns (Kahramaa; ministries) significantly shaped awareness (R2 = 0.624). Age was the only significant demographic factor. The results emphasize the pivotal role of digital and institutional communication in shaping student climate literacy; while highlighting the need for curriculum integration; media literacy; and campus sustainability structures to bridge the awareness–action gap.
Keywords:
climate change
; student awareness
; government efforts
; digital media
; sustainability
; Qatar
Introduction
Climate change stands as one of the most urgent and complex challenges confronting contemporary society, necessitating immediate and coordinated responses across sectors [1]. University students are a particularly pivotal demographic in this context, not only because they represent future leaders and policymakers but also due to their capacity to influence societal norms and sustainability trajectories in the present [2,3]. Their engagement with climate change—through knowledge, attitudes, and behaviors—serves as a barometer for the effectiveness of educational interventions aimed at fostering environmental responsibility [4,5].
While climate literacy is increasingly integrated into curricula, substantial knowledge gaps persist among students, particularly in understanding scientific processes such as the greenhouse effect, the carbon cycle, and systems-level feedback mechanisms [6]. Studies show that although students express general concern over climate change, their grasp of its root causes and mitigation strategies remains limited [7,8]. Moreover, the rise of misinformation and cognitive biases—such as optimism bias and confirmation bias—further impedes accurate climate understanding and delays behavioral responses [9,10].
Engagement in climate-positive behavior among students is influenced by both internal and external variables. Internal factors include perceived self-efficacy, emotional response to environmental degradation, and moral responsibility [11,12]. Externally, the presence of supportive institutional frameworks, peer influence, and the visibility of campus sustainability initiatives play crucial roles [13,14,15]. Despite growing awareness, students often encounter psychological barriers such as environmental numbness or a sense of powerlessness, which limit proactive participation [16,17].
Universities have a multifaceted role in addressing these challenges. Beyond curriculum development, they must foster a campus culture that models and reinforces sustainable practices. Faculty engagement, research opportunities, student-led initiatives, and visible institutional policies contribute to this ecosystem of support [18]. Furthermore, cross-disciplinary approaches that blend science, social studies, and ethics have shown promise in cultivating holistic climate competencies [19].
This study explores the breadth and depth of university students' awareness of climate change and their active participation in societal improvement efforts. By examining students' conceptual understanding, psychological readiness, and institutional context, it aims to identify the enablers and inhibitors of meaningful climate action. The insights generated will contribute to refining educational strategies that not only raise awareness but also translate knowledge into sustained engagement and societal impact [20].
Literature Review
Societal improvement is always bonded to the new generations in many sectors. Climate change has impacted the people’s lives in several aspects, which prompted scholars around the world to study university students’ awareness towards climate change and their role in addressing environmental challenges [21]. This level of student is crucial in this circle which has had highly impact on climate change interventions for the future.
This chapter will focus on three core themes which are, knowledge and perception of climate change, behavioral engagement in climate change and institutional influence on climate awareness and action, which are the main themes of this study. By analyzing these themes, this review highlights key gaps, educational interventions, and potential solutions to enhance student engagement in climate action.
Knowledge and Perception of Climate Change
A study was carried out by [22] this study was implemented in Sri Lanka among university students to investigate the awareness level of climate change. The study findings discover that the students are aware and understand that climate change is urgent issue globally, but they don’t understand the underlaying reasons such as greenhouse gas emission or carbon cycle and their understanding is weak. The researchers’ recommendations were to include the clime science education in the curriculum.
Another study assessed how national educational policies regarding climate change can impact the universities students’ awareness. Findings showed that the countries that have compulsory policy on environmental education have a higher level of knowledge on climate change among the students. This study advocates that incorporating climate courses with a good structure into higher education can radically improve climate understanding [23].
Moreover, [24] investigated the climate formal education on university level students, to find out the level of their understating of climate science. The study found that the formed organized modules enhanced the students’ capacity to understand issues that are related to climate in a critical method, which eventually improve their awareness and understanding by thirty percent. In summery this study stated that formal education is essential for enhancing climate change understanding and improving environmental activities.
Another study studied the correlation between climate awareness among university students and digital literacy; the study results show that students using digital research are better in understanding climate change and dismiss misinformation. The researcher recommends including media literacy training in various programs among university level students [25]. Additionally, [26] stated that social media can have a great impact on the perceptions of students. And it can enhance their misinformation of proliferation.
Other studies focused on the cognitive biases and climate perception, for example, [27] in their study supposed that believes from communities, family or friends can formulate climate issues perception, the study suggests including the climate science and eliminate the climate misinformation. Furthermore, [28] found that there is a link between awareness of climate change and climate stress and anxiety among students, due to feeling helpless, which leads to reduce their motivation to initiate. The study recommends mental health support when educating students about climate change in university levels.
Behavioral Engagement in Climate Action there are some initiatives by students in relation to climate change globally. Additionally, [30] explores the social accountability among university students. They stated that students who believe that climate change is a social responsibility are more involved in climate change actions to adopt sustainable behaviors.
The COVID-19 pandemic has provided a unique lens through which individuals reconsider the links between environmental degradation and public health. Evidence suggests that the crisis heightened awareness of how ecological disruption contributes to epidemiological risks, thereby encouraging more sustainable lifestyles. For instance, a large survey in the United Kingdom found that the pandemic prompted individuals to re-evaluate their daily practices, recognize the human role in climate change, and express a stronger willingness to engage in green behaviors [31] This indicates that global crises can act as turning points in climate understanding, fostering both personal commitment and broader advocacy for climate policies.
Effective climate actions can sometimes be hindered by a psychological barrier, when understating the barriers, effective strategies can be promoted for environmental initiatives. Study was carried out by According to [16] to recognize thirty-three psychological barriers and named them “dragons of inaction” then he classified them in seven groups limited cognition, ideologies, social comparison, sunk costs, discordance, perceived risks, and limited behavior. Thes were classified as barriers that deter people from being involved in climate change moderation efforts.
Researchers examined the contextual elements restricting ecological actions, for instance resources lack, time limitations, and social context. The study emphasizes how these causes act together with psychological barriers to Shape environmental practices [32].
Institutional Influence on Climate Awareness
Another study about the role of the university and institutional support for climate change education interventions in two universities in Africa, reported that there is a need fir climate awareness education in the universities and how support and promoting for climate change in the education can ensure sustaining environmental actions [33]. In a wider scope, [34] study presents theoretical framework for incorporating climate change in the university’s education programs, drawn from a international study. The research implies that university can play a good role in change the people’s behavior and start acting regarding the climate issues in various topics.
In [35] extended on their previous research and examined the application of climate change education across multiple fields within universities. They study reveals that educating the climate change should be and essential module for all programs which can prepare students for broad knowledge regarding the climate change variable challenges.
Faculty members in the universities can be an important in raising awareness about climate change. The influence of faculty members in some cases can pass the university’s classrooms and help in shaping more sustainable communities. When faculty members include climate change and sustainability themes in their teaching, students tend to develop stronger environmental awareness and responsibility. A researcher found that integrating mindfulness and sustainability into university education helps students connect their personal values with global climate challenges, thereby encouraging more meaningful climate engagement [36].
A recent study was carried out by [6] claimed that faculty who gives space for talks on economic, social and political consequences of climate change help students to think about climate change in a broader perspective. Drawing upon the existing literature, the research methods employed in this study are as follows:
- Assess the extent of awareness and perception of global climate change issues and challenges among Qatari youth.
- Identify the primary sources that shape the awareness and perception of global climate change issues and challenges among Qatari youth.
- Evaluate the level of awareness and perception of environmental and climate improvement initiatives within Qatari society among its youth.
- Examine the relationship between demographic variables and the level of awareness and perception of global climate change issues and challenges among Qatari youth.
Methodology
Research Design
This study is exploratory quantitative research. We employed quantitative design due to the need to provide objective measurement and validation of the constructs examined using Confirmatory Factor Analysis (CFA). Moreover, the research design is cross-sectional as data were collected at one point in time to assess the measurement model's factor structure and reliability.
Sample and Data Collection
This study's sample consisted of 890 female students at Qatar University who voluntarily participated in a questionnaire distributed by email on an anonymous basis. Study participants were recruited via their university email. An online survey was the best method for collecting data to identify the target population. This participation was voluntary, and respondents were explained the purpose of the study as well as the confidential nature of their answers. To ensure, no personally identifiable data were collected, and all ethical considerations were in accordance with standard research guidelines.
Data Analysis Approach
SPSS was used for Descriptive statistics and other hypothesis testing, whereas CFA and validation of the measurement model were done through SmartPLS. Lastly, hypothesis testing was implemented using a significance level of p < 0.05 [3738].
CFA were performed to assess the construct validity of the measurement model. The fit was measured by the RMSEA, the SRMR and the Chi-Square/df. For this model, RMSEA values ≤ 0.08 indicate an adequate fit, while SRMR values ≤ 0.08 demonstrate a good-fitting model. The Chi-Square/df ratio, reported when a model is fit, has an acceptable value ≤ 5 (and if ≤ 3 is a good fit) [39].
Cronbach’s Alpha and Composite Reliability (CR) were used to confirm the reliability of constructs, which indicate internal consistency when CR ≥ 0.7. Convergent validity was assessed by computing Average Variance Extracted (AVE) values greater than 0.5 indicating that more variance in the construct is explained by the construct than by measurement error. Discriminant validity was assessed using the Heterotrait-Monotrait Ratio of Correlations (HTMT), indicating that the constructs measured were distinct [40].
The reliability of the indicators was estimated by standardized factor loadings and were considered reliable when the value was ≥ 0.5 due to uniqueness of the measurement model. The measurement model was also tested for its robustness prior to performing additional statistical tests [41].
Analysis and Results
Descriptive Statistics
Table 1 presents the demographic characteristics of the sample, including age distribution, marital status, employment status, and income levels.
The majority of participants (75.1%) were aged between 18 and 24 years, with 12.1% in the 25–29 age group and 12.8% aged 30 and above. Most respondents were single (81.5%), while 18.5% were married. Regarding employment status, 88.9% of participants were unemployed and 11.1% were employed. Concerning education level, 67.2% had completed college, whereas 32.8% had a high-school education. In terms of income level, 37.0% reported low income, 35.7% reported average income, and 27.3% reported high income.
Confirmatory Factor Analysis (CFA) Results
Table 2 presents the standardized factor loadings (SFL) for all observed variables within their respective latent constructs. The standardized loadings for all items exceed the minimum threshold of 0.50, indicating that each item adequately represents the underlying construct. The majority of the factor loadings are above 0.70, which is considered an acceptable indicator of item reliability.
Model Fit Indices
The results indicate that the model achieves an acceptable fit based on widely recognized fit criteria. The Chi-square/df ratio (4.082) falls within the acceptable range (≤ 5), suggesting a reasonable model fit. The RMSEA value (0.059) is below the 0.08 threshold, indicating good model fit, while the SRMR value (0.045) also falls below the 0.08 threshold, further supporting model adequacy. These indices suggest that the proposed measurement model sufficiently explains the relationships among the observed variables.
Reliability and Validity Assessment
The reliability and validity of the measurement model were evaluated using Cronbach’s Alpha, Composite Reliability (CR), and Average Variance Extracted (AVE). Cronbach’s Alpha and Composite Reliability values exceed the threshold of 0.70, confirming the internal consistency of all constructs. The AVE values are greater than 0.50, establishing convergent validity by demonstrating that each construct explains a sufficient proportion of the variance in its observed variables.

Table 3.
Internal Consistency and Validity.
| Construct | Cronbach’s Alpha | CR | AVE |
|---|---|---|---|
| Awareness of Global and Local Climate Change | 0.96 | 0.96 | 0.51 |
| Government Efforts in Addressing Climate Change | 0.98 | 0.98 | 0.72 |
| Source of Information on Climate Change | 0.94 | 0.94 | 0.53 |
Discriminant Validity Assessment
Discriminant validity was assessed using the Heterotrait-Monotrait Ratio (HTMT) to ensure that each construct is empirically distinct. All HTMT values are below the recommended threshold of 0.85, confirming that the constructs are adequately differentiated.
Table 4.
HTMT Discriminant Validity Assessment.
| Construct | (1) | (2) | (3) |
|---|---|---|---|
| Awareness of Global and Local Climate Change (1) | - | 0.82 | 0.75 |
| Government Efforts in Addressing Climate Change (2) | 0.82 | - | 0.77 |
| Source of Information on Climate Change (3) | 0.75 | 0.77 | - |
Awareness and Perception of Global Climate Change Among Qatari Youth
As shown in Table 5 below, a one-sample t-test was conducted to evaluate the level of awareness and perception of global climate change among Qatari youth, comparing the mean awareness score to a neutral reference point of 3.0. This value represents an indifferent stance on the awareness scale.
The results revealed a significantly higher awareness level among participants (M = 3.65, SD = 0.76, N = 890) compared to the neutral benchmark, t(889) = 25.52, p < .001. This indicates that, on average, participants demonstrated a significantly elevated awareness and perception of global climate change issues.
To provide further insight, awareness scores were categorized into three levels based on predetermined cutoffs: low awareness (mean of 1.00 – 2.33), moderate awareness (mean of 2.34 – 3.66), and high awareness (mean of 3.67 – 5.00). A total of 6.6% of participants exhibited low awareness (N = 59), while 36.9% demonstrated moderate awareness (N = 328). The majority, 56.5% (N = 503), reported high awareness, suggesting that climate change awareness among Qatari youth is relatively strong. These findings highlight a generally positive awareness trend regarding climate change challenges.
Sources Shaping Awareness of Climate Change
Understanding the sources that contribute to climate change awareness is essential in identifying the most effective channels for information dissemination. Figure 1 illustrates the Relative Importance Index (RII) of various sources that shape climate change awareness among Qatari youth.
TV programs and the Internet (RII = 74.54), social media, and AI (RII = 72.67) were considered the most influential among the options provided, followed by government climate initiatives (RII = 73.17), and the Ministry of Environment (RII = 72.13). This indicates that those are at the forefront of shaping awareness, possibly demonstrating that much of climate communication is happening through digital platforms and initiatives led by the government.
To determine the effects of the different sources of information on climate change knowledge of Qatari youth, a multiple linear regression analysis with a stepwise approach was performed. The dependent variable was the awareness score, while the independent variables were the various sources of information. Predictors were included in the model from radioactive best fit stepwise regression which parsimony excluded non-significant predictors.
The final regression model demonstrated strong explanatory power, with an R2 value of 0.624, indicating that the included sources collectively explained 62.4% of the variance in climate change awareness. The ANOVA results confirmed the statistical significance of the model, F(9, 880) = 162.23, p < .001, suggesting that the retained independent variables had a meaningful influence on awareness. Table 6 presents a summary of the final regression model, listing only the retained significant predictors.
Examining the unstandardized regression coefficients, the results indicate that TV programs and the Internet had the strongest impact on awareness (B = 0.20, p < .001), followed by Kahramaa (B = 0.16, p < .001), suggesting that government-led sustainability campaigns significantly shape awareness. Social media and AI (B = 0.11, p < .001) and the Ministry of Transport (B = 0.09, p < .001) also had significant positive effects, highlighting the role of digital platforms and transportation-related environmental policies in shaping perceptions. Environmental institutions (B = 0.06, p = .012) and the Ministry of Environment (B = 0.07, p = .004) contributed positively, underscoring the importance of institutional efforts in climate education. Friends and family (B = 0.05, p = .003), government climate initiatives (B = 0.05, p = .039), and conferences (B = 0.04, p = .034) had relatively smaller but still significant effects on awareness.
Awareness of Government Efforts in Addressing Climate Change
To assess the extent to which Qatari youth are aware of governmental efforts in addressing climate change, a one-sample t-test was conducted to compare the mean awareness score against a neutral reference point of 3.0, which represents an indifferent stance on the awareness scale. Table 3 presents the results of the one-sample t-test for awareness of government efforts in addressing climate change.
The results indicate that the mean awareness score for government efforts was 3.767 (SD = 0.882), which is significantly higher than the neutral benchmark, t(889) = 25.962, p < .001. This suggests that, on average, participants demonstrate a significantly higher level of awareness and perception of the climate-related initiatives undertaken by the government.
Table 7.
One-Sample t-Test for Awareness of Government Efforts in Addressing Climate Change.
| Factor | Mean | SD | t | df | p-value |
|---|---|---|---|---|---|
| Awareness of Global and Local Climate Change | 3.65 | 0.76 | 25.52 | 889 | < 0.001 |
Relationship Between Demographic Variables and Awareness of Climate Change
To examine the relationship between demographic characteristics and the level of global and local climate change awareness among Qatari youth, a series of chi-square tests were conducted. The results are summarized in Table 8.
A significant association was found between age group and awareness level (χ2(4) = 17.79, p = 0.001). The 18-24 age group exhibited the highest awareness levels, with 58.1% classified as having high awareness, while only 5.5% had low awareness. In contrast, the 25-29 age group showed a higher proportion of individuals with low awareness (15.7%), and only 47.2% were categorized as having high awareness. The 30+ age group had a similar awareness distribution to the youngest group, with 56.1% showing high awareness, but with a slightly larger proportion in the moderate category (39.5%) compared to the 18-24 group.
The relationship between marital status and awareness level was not statistically significant (χ2(2) = 1.77, p = 0.412). Both married and single individuals showed similar awareness distributions, with a majority in the high awareness category (52.7% of married respondents and 57.4% of single respondents). The proportion of individuals with low awareness remained low for both groups, suggesting that marital status does not significantly impact climate change awareness.
Similarly, no significant relationship was found between employment status and awareness (χ2(2) = 0.326, p = 0.85). The distribution of awareness levels among employed and unemployed respondents was nearly identical, with around 55-57% of both groups exhibiting high awareness. The lack of a significant difference suggests that employment status does not influence perceptions or knowledge of climate change.
Education level was not significantly associated with awareness (χ2 (2) = 3.28, p = 0.194). High-school and college respondents displayed comparable awareness profiles, with 54.5 % and 57.5 % respectively falling in the high-awareness category, and similarly low proportions reporting low awareness (5.1 % vs. 7.4 %). The near-identical distributions suggest that formal educational attainment, at least at these two levels, does not markedly influence climate-change awareness in this sample.
The relationship between income level and awareness was not statistically significant but approached significance (χ2(4) = 8.45, p = 0.076). Participants with higher income showed slightly lower proportions of high awareness (51%) compared to the low and average-income groups (58.4% and 58.8%, respectively). Conversely, low-income participants had the highest proportion of low awareness (8.5%), while the average-income group had the lowest proportion of low awareness (5%). Although not statistically significant at the conventional p < 0.05 threshold, this trend suggests that financial status may have some influence on climate change awareness, warranting further investigation.
Discussion
Principal Findings
This study of 890 female students at Qatar University shows substantively high climate-change awareness: the mean awareness score was 3.65 ± 0.76, well above neutrality (t(889)=25.52, p<.001), with 56.5% classified as high awareness and 36.9% moderate. Awareness of government efforts was likewise elevated (M=3.77 ± 0.88; t(889)=25.96, p<.001). A stepwise model explained 62.4% of variance in awareness (R2=0.624), with the strongest positive predictors being TV/Internet (B=0.20, p<.001), Kahramaa campaigns (B=0.16, p<.001), and social media/AI (B=0.11, p<.001), followed by contributions from transport and environmental institutions. Of the demographic variables, only age related to awareness (χ2(4)=17.79, p=.001), with 18–24-year-olds most likely to report high awareness. The measurement model showed acceptable fit (χ2/df=4.082, RMSEA=0.059, SRMR=0.045) and strong reliability/validity (all α and CR ≥ .94, AVE ≥ .51, HTMT < .85), supporting robustness of inferences.
Interpretation in Light of Prior Work
The high average awareness aligns with research showing strong concern among university students, alongside uneven depth of scientific understanding [e.g 7, 6]. The outsized role of digital channels (TV/Internet; social media/AI) mirrors evidence that online exposure is now the primary gateway to climate information for youth—amplifying both learning opportunities and risks of misinformation [9,10]. The salience of government-linked communication—Kahramaa and relevant ministries—converges with findings that national frameworks and consistent public campaigns lift climate literacy [23]. That said, the non-significant education-level differences in awareness diverge from studies reporting gains from structured climate curricula [42]. In our context, this pattern suggests students may be learning around the curriculum—via governmental outreach and digital media—more than through formal coursework.
Age effects (higher awareness among 18–24) are consistent with research on younger cohorts’ greater digital embeddedness and information exposure [25]. However, awareness does not automatically translate to behavior; as Gifford’s “dragons of inaction” underscore, psychological and situational barriers can blunt engagement even among informed groups [16]. The elevated recognition of government efforts in our sample is promising, yet the intention–action gap remains a live concern without institutional scaffolds that convert awareness into repeated, low-friction behaviors.
Policy and Practice Implications (Qatar and Higher Education)
- Institutionalize climate across curricula. The absence of education-level effects points to a need for course-embedded climate learning beyond electives—short concept modules on greenhouse mechanisms, mitigation/adaptation, and systems feedbacks across disciplines, paired with assessment to consolidate gains.
- Leverage trusted public campaigns. Given the strong coefficients for TV/Internet and Kahramaa, universities can co-brand micro-campaigns with these actors (e.g.; semester challenges on energy/water use), translating national messages into course and campus actions.
- Strengthen media and AI literacy. Because social media/AI is a major predictor and a vector for misinformation, build media literacy workshops into first-year seminars and require brief fact-checking assignments tied to climate topics.
- From awareness to action: make behaviors easy. Establish “living lab” projects (energy dashboards, waste audits), student-led clubs with micro-grants, and default green nudges (printer defaults, bottle-refill infrastructure). These reduce friction and normalize action.
- Address climate emotions. Integrate brief eco-anxiety coping resources (reflection spaces, counseling links) within climate programming to sustain engagement rather than overwhelm [28].
- Targeted messaging by age segment. Maintain broad youth-oriented digital outreach while developing bridge programs for older students (25–29), who showed comparatively lower high-awareness shares.
Theoretical Contribution
Findings highlight a state–media–university nexus in which governmental communication and mass/digital media can outweigh formal coursework in shaping awareness. This suggests revising common models of student climate literacy to include public-institutional campaigns as proximal determinants, with curricula acting as moderators that deepen and stabilize knowledge rather than the sole drivers.
Strengths and Limitations
Key strengths include a large sample (N=890), validated measurement (excellent reliability; acceptable global fit), and multivariate modeling explaining a substantial share of variance. Limitations include the single-institution, female-only design and a cross-sectional approach that precludes causal claims or observation of behavior change. Self-report measures may also inflate awareness estimates relative to demonstrated knowledge or action.
Future Research
- Broaden the frame to multiple universities and include male students to test generalizability within Qatar and the region.
- Link awareness to behavior using longitudinal or experimental designs (e.g.; randomized access to media-literacy modules, co-branded campaigns) to quantify awareness → intention → behavior pathways.
- Curriculum experiments that embed short climate-science packets across non-STEM courses to test whether formal instruction raises awareness beyond what public/media channels achieve.
- Mechanisms of influence: disentangle the relative effects of message trust, source credibility (government vs. peers), and algorithmic curation on student understanding.
Author Contributions
Conceptualization, Magdy Abita; methodology, Yousif Mahdi and Chdeli.; formal analysis, Yousif Mahdi; investigation, Abedulaziz Al-Mannai; writing—original draft, Mousa Jawasreh; writing—review & editing, Mousa Jawasreh; supervision, Magdy and Mousa. All authors have read and agreed to the published version of the manuscript.
Funding
This research received no external funding.
Institutional Review Board Statement
The study was conducted in accordance with the Declaration of Helsinki and approved by the Institutional Review Board of Qatar University (approval code XXXX, date).
Informed Consent Statement
Informed consent was obtained from all subjects involved in the study.
Data Availability Statement
Data is available from the corresponding author upon reasonable request.
Acknowledgments
The authors thank Qatar University for support and the students for participation.
Conflicts of Interest
The authors declare no conflict of interest.
References
- IPCC. Climate Change 2023: Synthesis Report. Contribution of Working Groups I, II and III to the Sixth Assessment Report of the Intergovernmental Panel on Climate Change; Core Writing Team, Lee, H.; Romero, J. (Eds.); IPCC: Geneva, Switzerland, 2023.
- UNEP. Emissions Gap Report 2020; United Nations Environment Programme: Nairobi, Kenya, 2020; Available online: https://www.unep.org/emissions-gap-report-2020.
- Ojala, M. Regulating worry, promoting hope: How do children, adolescents, and young adults cope with climate change? Int. J. Environ. Sci. Educ. 2012, 7, 537–561. [Google Scholar]
- Anderson, A. Climate Change Education for Mitigation and Adaptation. J. Educ. Sustain. Dev. 2012, 6, 191–206. [Google Scholar] [CrossRef]
- UNESCO. Education for Sustainable Development: A Roadmap; United Nations Educational, Scientific and Cultural Organization: Paris, France, 2019. [Google Scholar]
- Lee, T.; Markowitz, E.M.; Howe, P.D.; Ko, C.Y.; Leiserowitz, A.A. Predictors of public climate change awareness and risk perception around the world. Nat. Clim. Chang. 2015, 5, 1014–1020. [Google Scholar] [CrossRef]
- Stevenson, K.T.; Peterson, M.N.; Bradshaw, A. How climate change beliefs among U.S. teachers do and do not translate to students. PLoS ONE 2014, 9, e106406. [Google Scholar] [CrossRef]
- McNeill, K.L.; Vaughn, M.H. Urban high school students’ critical science agency: Conceptual understandings and environmental actions around climate change. Res. Sci. Educ. 2012, 42, 373–399. [Google Scholar] [CrossRef]
- van der Linden, S.; Leiserowitz, A.; Rosenthal, S.; Maibach, E. Inoculating the public against misinformation about climate change. Global Challenges 2017, 1, 1600008. [Google Scholar] [CrossRef]
- Lewandowsky, S.; Ecker, U.K.H.; Cook, J. Beyond misinformation: Understanding and coping with the “post-truth” era. Journal of Applied Research in Memory and Cognition 2013, 6, 353–369. [Google Scholar] [CrossRef]
- Kollmuss, A.; Agyeman, J. Mind the Gap: Why do people act environmentally and what are the barriers to pro-environmental behavior? Environmental Education Research 2002, 8, 239–260. [Google Scholar] [CrossRef]
- Moser, Susanne, C.; Dilling, Lisa. (2011). Communicating Climate Change: Closing the Science-Action Gap. In J. S. Dryzek, R. Norgaard, & D. Schlosberg (Eds.), The Oxford Handbook of Climate Change and Society. Oxford University Press.
- Lozano, R.; Lukman, R.; Lozano, F.J.; Huisingh, D.; Lambrechts, W. Declarations for Sustainability in Higher Education: Becoming Better Leaders, through Addressing the University System. Journal of Cleaner Production 2013, 48, 10–19. [Google Scholar] [CrossRef]
- Brundiers, K.; Wiek, A.; Redman, C.L. Real-world learning opportunities in sustainability: From classroom into the real world. International Journal of Sustainability in Higher Education 2010, 11, 308–324. [Google Scholar] [CrossRef]
- Velazquez, L.; Munguia, N.; Platt, A.; Taddei, J. Sustainable university: What can be the matter? Journal of Cleaner Production 2006, 14, 810–819. [Google Scholar] [CrossRef]
- Gifford, R. The dragons of inaction: Psychological barriers that limit climate change mitigation and adaptation. American Psychologist 2011, 66, 290–302. [Google Scholar] [CrossRef]
- Cianconi, P.; Betrò, S.; Janiri, L. The Impact of Climate Change on Mental Health: A Systematic Descriptive Review. Frontiers in Psychiatry 2020, 11, 74. [Google Scholar] [CrossRef] [PubMed]
- Leal Filho, W.; Vargas, V.R.; Salvia, A.L.; Brandli, L.L.; Pallant, E.; Klavins, M.; et al. The Role of Higher Education Institutions in Sustainability Initiatives at the Local Level. Journal of Cleaner Production 2019, 233, 1004–1015. [Google Scholar] [CrossRef]
- Gifford, R. The dragons of inaction: Psychological barriers that limit climate change mitigation and adaptation. American Psychologist 2011, 66, 290–302. [Google Scholar] [CrossRef] [PubMed]
- Gifford, R. Barriers to pro-environmental behavior: A review of the literature. Global Environmental Change 2013, 23, 1527–1534. [Google Scholar]
- K Ghazy, H.; M Fathy, D. Effect of awareness program regarding climate change on knowledge, attitudes and practices of university students. International Egyptian Journal of Nursing Sciences and Research 2023, 3, 186–203. [Google Scholar] [CrossRef]
- Munasinghe, K. Understanding University Students’ Knowledge of Climate Change: A Case Study in Sri Lanka. Journal of Environmental Studies 2025, 12, 45–60. [Google Scholar]
- Tang, K.H.D.; et al. Climate change education in Indonesia’s formal education: a policy analysis. npj Climate Action 2024, 3, 57. [Google Scholar] [CrossRef]
- Rogers, J.; MacCormac, R. Enhancing Climate Science Education in Higher Learning Institutions. ScienceDirect: Environmental Education Research 2025, 34, 78–92. [Google Scholar]
- Boshnjaku, A.; Krasniqi, E.; Kamberi, F. The Impact of Digital Literacy on Climate Awareness Among Health-Related Students. Frontiers in Public Health 2025, 13, 1534139. [Google Scholar] [CrossRef]
- Bowen, C.D.; Coscia, K.A.; Aadnes, M.G.; Summersill, A.R.; Barnes, M.E. “Undergraduate Biology Students’ Climate Change Communication Experiences Indicate a Need for Discipline-Based Education Research on Science Communication Education about Culturally Controversial Science Topics. ” CBE — Life Sciences Education 2025, 24, ar24. [Google Scholar] [CrossRef]
- Nöth, L.; Zander, L. How epistemic beliefs about climate change predict climate change conspiracy beliefs. Frontiers in Psychology 2025, 16, 1523143. [Google Scholar] [CrossRef] [PubMed]
- Fornell, C.; Larcker, D.F. Evaluating structural equation models with unobservable variables and measurement error. Journal of Marketing Research 1981, 18, 39–50. [Google Scholar] [CrossRef]
- Carasso Romano, G.H.; Sippori, R.; Soroker, S. Examining the relationship between ecological anxiety and pro-environmental behavior: personal and collective actions. Frontiers in Psychology 2025, 16, 1505564. [Google Scholar] [CrossRef]
- Ferrari, E.; Whitmarsh, L.; Haggar, P.; Mitev, K.; Lowe, A. Who is taking climate action in university? Drivers of personal and professional climate action in higher education. International Journal of Sustainability in Higher Education 2025, 26, 18–35. [Google Scholar] [CrossRef]
- Ruiu, M.L. Mismanagement of Covid-19: Lessons learned for climate change crisis management. Frontiers in Sociology 2022, 7, 897786. [Google Scholar]
- De Carvalho, R.G.; Palma-Oliveira, J.M.; Corral-Verdugo, V. (2013). Why do people fail to act? Situational barriers and constraints on pro-ecological behaviour. In Psychological Approaches to Sustainability: Current Trends in Research, Theory and Practice (pp. 295–315). Nova Science Publishers.
- Ssekamatte, D. The role of the university and institutional support for climate change education interventions at two African universities. Higher Education 2023, 85, 187–201. [Google Scholar] [CrossRef]
- Molthan-Hill, P.; et al. Climate change education for universities: A conceptual framework from an international study. Journal of Cleaner Production 2019, 226, 1092–1101. [Google Scholar] [CrossRef]
- Molthan-Hill, P.; Blaj-Ward, L.; Mbah, M.F.; Ledley, T.S. (2022). “Climate Change Education at Universities: Relevance and Strategies for Every Discipline.” In Handbook of Climate Change Mitigation and Adaptation, edited by Maximilian Lackner, Baharak Sajjadi, & Wei-Yin Chen (pp. 3395–3457). Cham: Springer Nature. [CrossRef]
- Wamsler, C. Mindfulness in sustainability science, practice, and teaching. Sustainability Science 2017, 13, 143–162. [Google Scholar] [CrossRef]
- IBM Corp. (2020). IBM SPSS Statistics for Windows (Version 27.0) [Computer software]. IBM Corp.
- Ringle, C.M.; Wende, S.; Becker, J.-M. (2024). SmartPLS 4 [Computer software]. SmartPLS GmbH.
- Tang et al.; L. T.; Bentler, P.M. Cutoff criteria for fit indexes in covariance structure analysis: Conventional criteria versus new alternatives. Structural Equation Modeling 1999, 6, 1–55. [CrossRef]
- Henseler, J.; Ringle, C.M.; Sarstedt, M. A new criterion for assessing discriminant validity in variance-based structural equation modeling. Journal of the Academy of Marketing Science 2015, 43, 115–135. [Google Scholar] [CrossRef]
- Hair, J.F.; Black, W.C.; Babin, B.J.; Anderson, R.E. (2010). Multivariate data analysis (7th ed.). Pearson.
- Aeschbach, V.M.-J.; Schwichow, M.; Rieß, W. Effectiveness of climate change education — A meta-analysis. Frontiers in Education 2025, 10, 1563816. [Google Scholar] [CrossRef]
Figure 1.
RII of Information Sources on Climate Change Awareness.
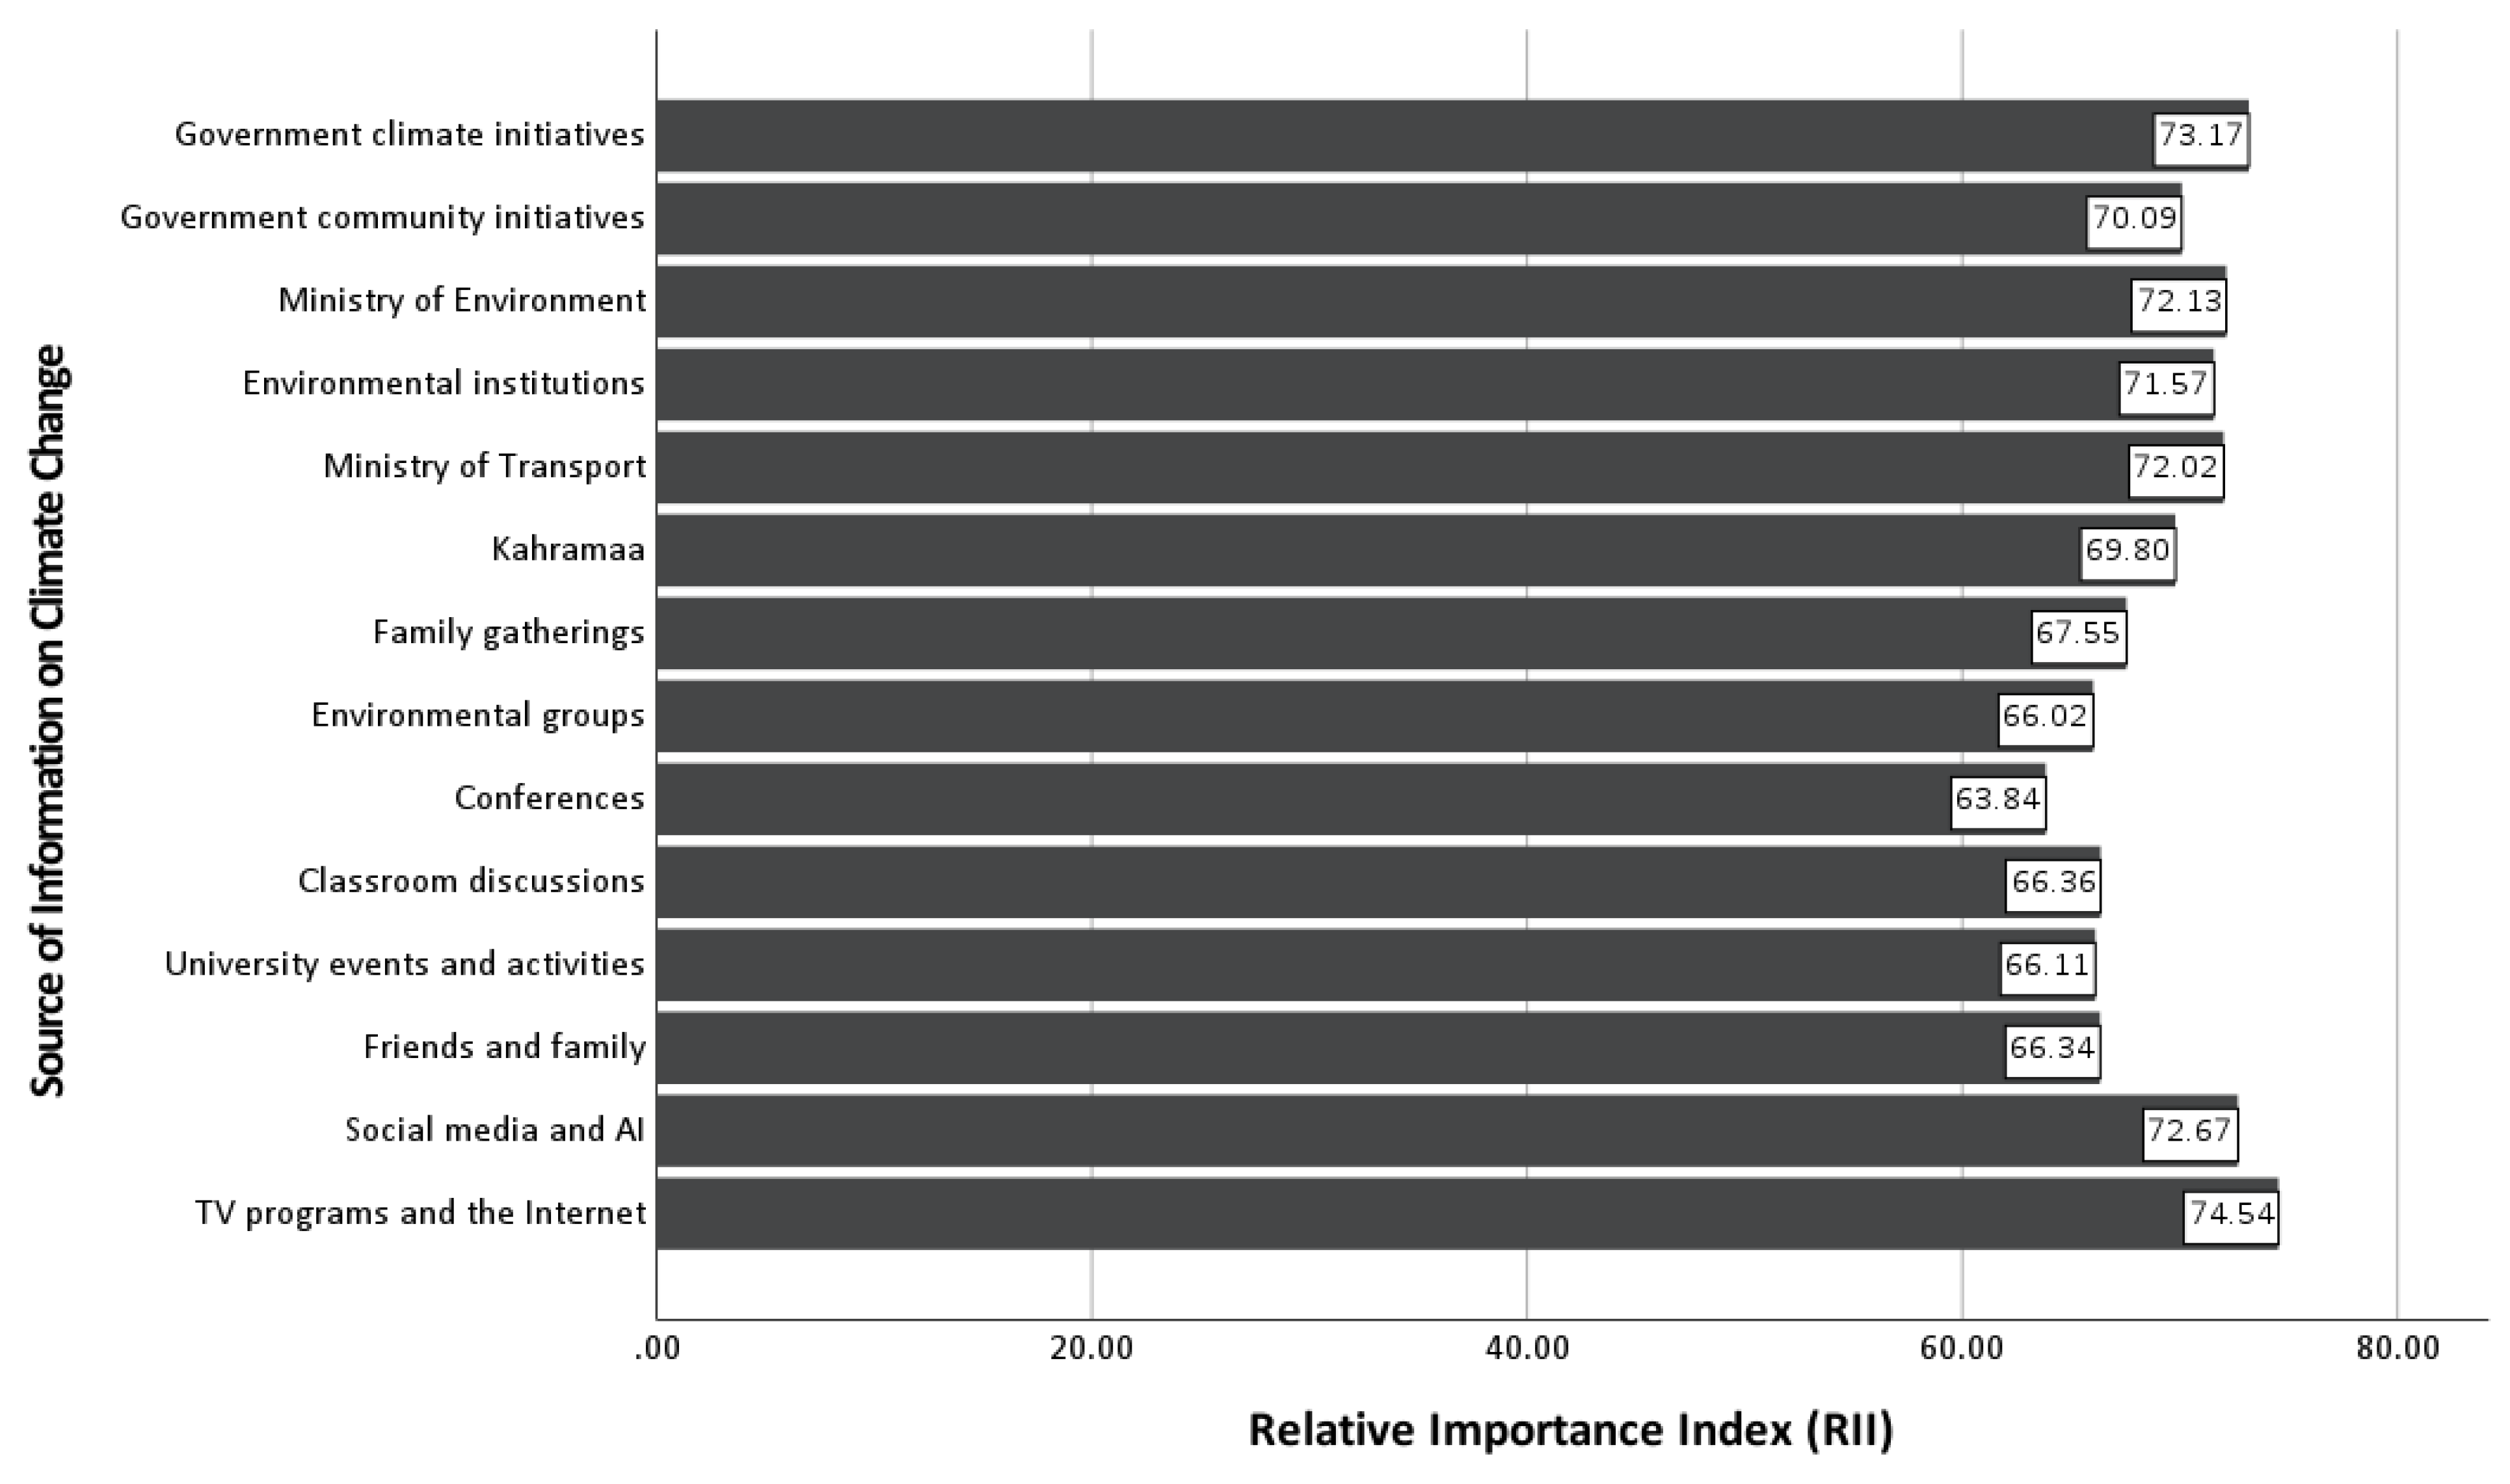
Table 1.
Demographic Characteristics of the Sample (N = 890).
| Variable | Category | N | % |
|---|---|---|---|
| Age | 18 – 24 | 668 | 75.1 |
| 25 – 29 | 108 | 12.1 | |
| 30+ | 114 | 12.8 | |
| Marital Status | Single | 725 | 81.5 |
| Married | 165 | 18.5 | |
| Employment Status | Unemployed | 791 | 88.9 |
| Employed | 99 | 11.1 | |
| Education level | High school | 292 | 32.8 |
| College | 598 | 67.2 | |
| Income Level | Low | 329 | 37 |
| Average | 318 | 35.7 | |
| High | 243 | 27.3 |
Table 2.
Standardized Factor Loadings.
| Factor | Items | SFL | Factor | Items | SFL | Factor | Items | SFL |
|---|---|---|---|---|---|---|---|---|
| Factor Awareness of Global and Local Climate Change | Q1 | 0.74 | Source of Information on Climate Change | Q25 | 0.75 | Government Efforts in Addressing Climate Change | Q39 | 0.82 |
| Q2 | 0.78 | Q26 | 0.74 | Q40 | 0.85 | |||
| Q3 | 0.74 | Q27 | 0.60 | Q41 | 0.84 | |||
| Q4 | 0.68 | Q28 | 0.66 | Q42 | 0.84 | |||
| Q5 | 0.63 | Q29 | 0.62 | Q43 | 0.79 | |||
| Q6 | 0.61 | Q30 | 0.61 | Q44 | 0.84 | |||
| Q7 | 0.79 | Q31 | 0.70 | Q45 | 0.84 | |||
| Q8 | 0.66 | Q32 | 0.63 | Q46 | 0.89 | |||
| Q9 | 0.74 | Q33 | 0.72 | Q47 | 0.87 | |||
| Q10 | 0.72 | Q34 | 0.78 | Q48 | 0.83 | |||
| Q11 | 0.71 | Q35 | 0.81 | Q49 | 0.88 | |||
| Q12 | 0.80 | Q36 | 0.82 | Q50 | 0.83 | |||
| Q13 | 0.78 | Q37 | 0.82 | Q51 | 0.90 | |||
| Q14 | 0.73 | Q38 | 0.84 | Q52 | 0.89 | |||
| Q15 | 0.71 | Q53 | 0.87 | |||||
| Q16 | 0.74 | Q54 | 0.83 | |||||
| Q17 | 0.58 | Q55 | 0.87 | |||||
| Q18 | 0.56 | Q56 | 0.86 | |||||
| Q19 | 0.66 | Q57 | 0.84 | |||||
| Q20 | 0.76 | Q58 | 0.82 | |||||
| Q21 | 0.79 | |||||||
| Q22 | 0.77 | |||||||
| Q23 | 0.70 | |||||||
| Q24 | 0.67 |
Table 5.
One-Sample t-Test Results for Awareness of Global and Local Climate Change.
| Factor | Level | N | % | Mean | SD | t | df | p-value |
|---|---|---|---|---|---|---|---|---|
| Awareness of Global and Local Climate Change | Low | 59 | 6.6 | 3.65 | 0.76 | 25.52 | 889 | < 0.001 |
| Moderate | 328 | 36.9 | ||||||
| High | 503 | 56.5 |
Table 6.
Stepwise Regression Analysis.
| Predictor | Unstandardized B | SE | Standardized B | t | p-value |
|---|---|---|---|---|---|
| (Constant) | 0.92 | 0.08 | — | 12.32 | < .001 |
| TV programs and the Internet | 0.20 | 0.02 | 0.28 | 9.87 | < .001 |
| Kahramaa | 0.16 | 0.02 | 0.21 | 7.41 | < .001 |
| Ministry of Transport | 0.09 | 0.02 | 0.12 | 3.65 | < .001 |
| Social media and AI | 0.11 | 0.02 | 0.15 | 5.21 | < .001 |
| Environmental institutions | 0.06 | 0.03 | 0.08 | 2.50 | 0.012 |
| Ministry of Environment | 0.07 | 0.03 | 0.10 | 2.89 | 0.004 |
| Friends and family | 0.05 | 0.02 | 0.07 | 2.93 | 0.003 |
| Government climate initiatives | 0.05 | 0.02 | 0.07 | 2.07 | 0.039 |
| Conferences | 0.04 | 0.02 | 0.06 | 2.12 | 0.034 |
Table 8.
Chi-square analysis of demographic factors and climate change awareness levels.
| Variables | Level of Global and Local Climate Change Awareness | Chi-square | df | p-value | |||
|---|---|---|---|---|---|---|---|
| Low | Moderate | High | |||||
| Age Group | 18-24 | 37 (5.5%) | 243 (36.4%) | 388 (58.1%) | 17.79 | 4 | 0.001 |
| 25 - 29 | 17 (15.7%) | 40 (37%) | 51 (47.2%) | ||||
| 30+ | 5 (4.4%) | 45 (39.5%) | 64 (56.1%) | ||||
| Marital Status | Married | 14 (8.5%) | 64 (38.8%) | 87 (52.7%) | 1.77 | 2 | 0.412 |
| Single | 45 (6.2%) | 264 (36.4%) | 416 (57.4%) | ||||
| Employment Status | Unemployed | 53 (6.7%) | 289 (36.5%) | 449 (56.8) | 0.326 | 2 | 0.85 |
| Employed | 6 (6.1%) | 39 (39.4%) | 54 (54.5%) | ||||
| Education level | High school | 15 (5.1%) | 118 (40.4%) | 159 (54.5%) | 3.28 | 2 | 0.194 |
| College | 44 (7.4%) | 210 (35.1%) | 344 (57.5%) | ||||
| Monthly Income | Low | 28 (8.5%) | 109 (33.1%) | 192 (58.4%) | 8.45 | 4 | 0.076 |
| Average | 16 (5%) | 115 (36.2%) | 187 (58.8%) | ||||
| High | 15 (6.2%) | 104 (42.8%) | 124 (51%) | ||||
Disclaimer/Publisher’s Note: The statements, opinions and data contained in all publications are solely those of the individual author(s) and contributor(s) and not of MDPI and/or the editor(s). MDPI and/or the editor(s) disclaim responsibility for any injury to people or property resulting from any ideas, methods, instructions or products referred to in the content. |
© 2025 by the authors. Licensee MDPI, Basel, Switzerland. This article is an open access article distributed under the terms and conditions of the Creative Commons Attribution (CC BY) license (http://creativecommons.org/licenses/by/4.0/).
Copyright: This open access article is published under a Creative Commons CC BY 4.0 license, which permit the free download, distribution, and reuse, provided that the author and preprint are cited in any reuse.


