Submitted:
26 September 2025
Posted:
26 September 2025
You are already at the latest version
Abstract
Based on the data of the 5th, the 6th and the 7th censuses, this paper measures the population shrinkage of 121 counties in Heilongjiang province from 2000 to 2020, and analyzes the spatial characteristics on population shrinkage, explores the influencing factors of population shrinkage. The results show that: (1) population shrinkage of counties in Heilongjiang province are significant during the study period, particularly from 2010 to 2020. Population shrinkage of counties in Qiqihar, Yichun, Jixi accounts for a higher proportion in Heilongjiang province from 2000 to 2010.Population shrinkage of counties in Qitaihe, Suihua and Daxing’anling is very serious from 2010 to 2020.(2) During the study period, the counties which transfer growth type to shrinkage type are most in all counties, accounting for 47.11%. They locate in the middle of Heilongjiang province; the continuous shrinkage type of counties account for 44.63%, which locate in the north and in the southeast of Heilongjiang province; A few counties aren’t shrinkage type and several counties change from shrinkage to growth. (3) The population shrinkage counties form four agglomeration patterns, the scope of "high-high" agglomeration area reduced, and the scope of "low-low" agglomeration area expanded from 2000 to 2020. (4) Population shrinkage in Heilongjiang province is affected by the economic development level.
Keywords:
population shrinkage
; shrinkage type
; spatio-temporal pattern
; influencing factors
; Heilongjiang province
1. Introduction
With the decline in fertility rates and population migration in some cities, urban population shrinkage has emerged. There is no universally accepted definition of population shrinkage; the immediate definition refers to a decline in the total population. Population size is often utilized as a measure of population shrinkage. Additionally, indirect indicators such as birth rate, fertility rate, growth rate, and migration rate are also used to measure population shrinkage (Liu, 2019).
Population contraction leads to the emergence of shrinking cities. Since the concept of "shrinking city" was proposed by German scholar Hau βermann (1988), the study of shrinking city has received much attention from scholars. Western scholars have conducted in-depth studies on urban shrinkage in Europe (Gert,2013; Wolff,2018) and the United States(Nefedova,2020; Ehrenfeucht,2022; Karp,2022). It is worth noting that urban shrinkage is not limited to developed nations but also affects developing countries. Now, scholars have shown great interest in examining the specific case of urban shrinkage in China. It's important to note that cities in western developed countries are different from cities in China. If the research method of urban shrinkage in western countries is directly borrowed, the research conclusion of urban shrinkage in China will not agree with the true, and "localization" thinking should be emphasized in urban shrinkage (Sun,2021).It should be acknowledged that the nature of urban shrinkage in China differs from that observed in Western countries (Li, 2018).Moreover, Chinese characteristics are evident when considering both urban shrinkage trends in some inner cities(He, 2023) and the particular challenges faced by resource-based cities experiencing population decline (Li, 2020 ;Hu, 2020).
When it comes to measuring indicators of urban shrinkage, most scholars rely on the total population indicator, while some also consider the labor force indicator (Liu, 2021). In terms of research methods for urban shrinkage, mathematical models are commonly used to calculate the extent of urban shrinkage. Geographical models are employed to analyze temporal and spatial characteristics associated with urban shrinkage. Furthermore, multiple regression models are used to examine factors influencing urban shrinkage.The research content of urban shrinkage which geographical scholars pay more attention to includes the spatio-temporal process, evolutionary characteristics and laws, driving mechanism, urban shrinkage path(Wang,2022), and urban shrinkage significantly impacts on land use efficiency (Xie, 2024) and economic development.
Existing research primarily focuses on studying urban shrinkage; however, there are certain limitations when it comes to investigating population shrinkage at the city level in China. Under the system framework which the administrative jurisdiction of the county belongs to the city, it fails to accurately reflect internal differences in cities or even account for population shrinkage in counties under city jurisdiction. From a perspective around population statistics and censuses compared with cities, population shrinkage becomes more apparent at the county level. Nevertheless,the shrinking of counties has not been thoroughly studied yet despite their role as intermediaries between rural areas and cities. The study of population shrinkage based on counties holds unique scientific value that can promote coordinated development between urban and rural areas.
Population shrinkage has a wide impact on the sustainable development of counties in China, which has become a major challenge for the high-quality development of China. In the new era, in the process of high-quality development, we must pay attention to the problem of population shrinkage in counties. More attention should be paid to the study of county shrinkage. County scale population loss is serious (Deng,2018; Liu, 2020), mainly manifested in a large loss of population in towns and villages within the county. The counties in Guizhou province (Ying,2022), eastern Inner Mongolia (Han,2022) and Northeast China (Ma,2021) experienced severe population loss. There are more counties in Northeast China with population loss (Qi,2017). Chinese scholars have conducted in-depth studies on population shrinkage in Northeast China (Liu,2023). The population shrinkage is mainly affected by the level of regional economic development (Liu,2020), and less employment opportunities are also one of the reasons.
The study of population shrinkage in counties is an important research topic under the background of high-quality development in China, which has important theoretical and practical significance. High-quality development in the Chinese new era requires high-quality population development, and the current population loss in some counties in Heilongjiang province has seriously affected regional economic development, which does not meet the requirements of high-quality development. The fifth, sixth and seventh population censuses show that the population of Heilongjiang province has been shrinking since 2000, which is the most serious province in China. The report of the 20th National Congress of the Communist Party of China clearly stated that "promoting urbanization construction in the county as an important carrier", the serious population loss in Heilongjiang province is not conducive to urbanization construction. If the development of the county is good, then it can promote local urbanization of farmers, can alleviate the population shrinkage of the county, and then promote the population growth of the county. As the stabilizer of regional economic growth, the protector of land resources, the builder of ecological environment, and the guarantor of food security, counties in Heilongjiang province are important forces for regional sustainable development and high-quality development. The emergence of shrinking counties in Heilongjiang province is a phenomenon that cannot be ignored. Shrinking counties in Heilongjiang province are related to food security, ecological security and national defense security. It is unique scientific value for the study of shrinking population of shrinking counties, which can promote local urbanization and rural revitalization, and provide decision-making support for urbanization construction and rural revitalization in Heilongjiang province.
2. Data and Methods
2.1. Research Area
This paper takes the population shrinkage in Heilongjiang province as the research object, and takes county-level administrative regions (city districts, counties, county-level cities) as the research unit to study the spatiotemporal pattern and influencing factors of population shrinkage in Heilongjiang province from 2000 to 2020. Due to the adjustment of administrative divisions in some areas of Heilongjiang province during the research period, this paper unifies the statistical data based on the administrative divisions of the latest seventh population census in China. Among them, the research area includes 54 municipal districts, 21 county-level cities, 45 counties, and 1 autonomous county in Heilongjiang province. There are 121 county-level administrative regions in Heilongjiang province.
2.2. Data Sources
China's population can be divided into permanent residence and registered residence. In order to more accurately reveal the regional population shrinkage, this paper chooses to use the fifth, the sixth and the seventh census data in China. Population shrinkage is influenced by socio-economic factors, natural factors, and other factors. The data on these factors are from the China Statistical Yearbook, Heilongjiang Statistical Yearbook, China County Statistical Yearbook, and National Economic and Social Development Statistical Bulletin. The temperature and precipitation data are from the ERA5-Land dataset, while the DEM data for Heilongjiang Province is from the NASA Earth Science Data website. The research period is from 2000 to 2020, which is the node year of the fifth and the seventh population censuses.
2.3. Methods
- Population shrinkage measurement model
Many scholars tend to use the permanent population for calculation, or identify the population shrinkage situation in a region using the average annual population change rate, with a relatively single indicator selection. In order to measure population shrinkage more accurately, this paper selects representative total population and labor force as the measurement indicators of population shrinkage, with labor force being the population aged 15-59 in the population census. The formula for calculating population shrinkage is as follows:
Among them, St is the population shrinkage index of a region in year t, Pt+1 and Pt are the total population in years t and t+1 respectively, Lt+1 and Lt are the labor force in years t and t+1 respectively, Wa and Wb are the weight values of the total population and labor force respectively, and the entropy weight method is used to determine the weight values.
Based on the results of the population shrinkag measure( Li Xiuxia,2023), the paper divides the population contraction of Heilongjiang County into three types: mild shrinkage type (<0,->0), moderate shrinkage type (>0,-<0), and significant shrinkage type(<0,-<0). If >0,->0, then it isn’t shrinkage type. In order to further study the characteristics of population changes (shrinkage, growth, and mutual transformation) in Heilongjiang province, mild shrinkage, moderate shrinkage and significant shrinkage are all classified as population shrinkage. Population changes are divided into four types: continuous shrinkage, growth turns to shrinkage, shrinkage turns to growth, and continuous growth.
- 2.
- Spatial autocorrelation
Spatial autocorrelation includes global autocorrelation and local autocorrelation, commonly measured by Moran's index. The global Moran index is used to test the agglomeration and dependence of county-level population shrinkage at the provincial level; The local Moran index is used to test whether the shrinkage of each county and adjacent areas has similar characteristics. Local autocorrelation can be divided into four modes: high-high clustering (H-H), high-low clustering (H-L), low-low clustering (L-L), and low-high clustering (L-H). Among them, high- high agglomeration (H-H) indicates that counties with higher degree of shrinkage are surrounded by counties with the same degree of shrinkage, while high-low agglomeration (H-L) indicates that counties with higher degree of shrinkage are surrounded by counties with lower degree of shrinkage. The same applies to the rest. The formula is as follows:
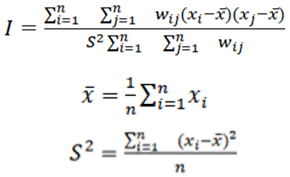
Among them, n is the number of samples in the study area. In this paper, n=121, wij is the boundary of the (i, j) adjacency space weight matrix, and S2 is the sample variance. The global Moran index I has a value of [-1,1], and when I>0, it is spatially positively correlated, indicating that population shrinkage space tends to be agglomerative; When I<0, it is a negative spatial correlation, indicating that the population shrinkage space tends to be discrete; When I approaches 0, it indicates that population shrinkage space is uncorrelated and belongs to a random distribution.
3. The Spatiotemporal Pattern of Population Shrinkage
3.1. Overall Characteristics of Population Shrinkage
There are a total of 121 counties in Heilongjiang province, China. From 2000 to 2010, there were 64 non-shrinking counties and 57 shrinking counties in Heilongjiang province, respectively (Table 1), with a relatively small difference in quantity of two types. Shrinkage counties account for 47.11% of Heilongjiang province, which means that nearly half of the counties in Heilongjiang province have experienced population shrinkage. Among them, there are up to 43 significant shrinkage types of counties, accounting for 35.54% of Heilongjiang province. More than one-third of the counties in Heilongjiang province have experienced significant population shrinkage, which indicated population shrinkage is severe in the counties. There are 14 moderate shrinkage types of counties, with a relatively small quantity, accounting for 11.57% of Heilongjiang province. There is no mild shrinkage type of county. From the perspective of spatial distribution, significant shrinkage counties are mainly concentrated in the northern and southeastern parts of Heilongjiang province; Non-shrinkage counties are mainly concentrated in the central part of Heilongjiang province (left in Figure 1).
As shown in Table 1, mild shrinkage type of counties increased from 0 during the first period to 8 during the second period and the percent increased from 0% to 6.61%. Moderate shrinkage type of counties decreased from 14 during the first period to 0 during the second period and it decreased by 11.57 percentage points.
From Table 1, it can be seen that there has been a significant increase in the number of significant shrinkage counties, which increased from 43 during the first period to 103 during the second period, when the percent of significant shrinkage counties accounted for 85.12% of Heilongjiang province. It indicates that from 2010 to 2020, most counties in Heilongjiang province were significant shrinkage, and most areas in Heilongjiang province were distributed with significant shrinkage counties (right of Figure 1). It can be concluded that the population shrinkage in Heilongjiang province was very serious from 2010 to 2020.
The number of shrinkage counties has increased from 57 during the first period to 111 during the second period, accounting for an increase from 47.11% to 91.74%. During the first period, the shrinkage counties were less than half of Heilongjiang province's total, while during the second period, the percent of shrinkage counties exceeded 90%. It indicates that population shrinkage intensified and became more severe from 2010 to 2020 in Heilongjiang province.
The number of non-shrinkage counties in Heilongjiang province decreased significantly from 64 during the first period to 10 during the second period (Table 1), and the percent of non-shrinkage counties decreased significantly from 52.89% to 8.27%.It indicates that some non-shrinkage counties in Heilongjiang province have turned into shrinkage counties. During the second period, the number of non-shrinkage counties is less than 10%, and the population shrinkage in Heilongjiang province has intensified.
From 2000 to 2010, nearly half of the counties in Heilongjiang province faced the problem of population shrinkage. However, from 2010 to 2020, many counties in Heilongjiang province turned from non-shrinkage to shrinkage, with an increase in the number and proportion of shrinkage counties. Over 80% of the counties in Heilongjiang province belonged to population shrinkage type. Compared with the first period, the population shrinkage in Heilongjiang province intensified during the second period, and the phenomenon of population shrinkage was more significant. Overall, the problem of population shrinkage in counties of Heilongjiang province was prominent from 2000 to 2020, and the phenomenon of population shrinkage became more significant after 2010.
From Figure 1, it can be seen that from 2000 to 2010, the proportion of shrinkage counties in Jiamusi city was the smallest, followed by Daqing city, which indicated that most counties in these two cities have not shrank. The proportion of shrinkage counties in Harbin city, Qitaihe city, Mudanjiang city, and Suihua city is less than 50%, so more than half of the counties have not shrank.
However, the number of the shrinkage counties in Qiqihar city, Jixi city, Hegang city, Shuangyashan city, Yichun city, Heihe city, and Daxing’anling region is more than half of the total in these cities, which indicated that the population shrinkage in these cities has been obvious from 2000 to 2010. Among them, Yichun city has the highest proportion of shrinkage counties, and the shrinkage problem is more obvious than other cities.
From 2010 to 2020, the population shrinkage in various cities in Heilongjiang province intensified, with most non-shrinkage counties transferred to shrinkage counties. Among them, the number of non-shrinkage counties in Shuangyashan city, Daqing city, Qitaihe city, Suihua city, and Daxing’anling region has even decreased to 0, so all counties in these cities have turned to population shrinkage type. It means that these five cities belong to a shrinkage type, while Qitaihe city, Suihua city, and Daxing’anling region are more severe, all of which have turned into a significant shrinkage type. It can be seen that the population shrinkage problem in these three cities is very severe.
3.2. Population Shrinkage Characteristics of Various Cities
To explore the population shrinkage situation of various cities in Heilongjiang Province, counties were merged into their subordinate cities according to administrative affiliation, and population shrinkage was analyzed at the city level (Table 2).
According to Table 2, there were 10 shrinkage counties in Qiqihar city from 2000 to 2010, with the highest number in Heilongjiang province. Yichun city and Jixi city are followed, with 9 and 7 shrinkage counties respectively, accounting for a relatively large proportion. There are 5-6 shrinkage counties in Hegang city, Shuangyashan city, and Harbin city, with a relatively large number. There are 2-4 shrinkage counties in Daxing’anling region, Suihua city, Heihe city, and Mudanjiang city, which are relatively rare. Daqing city, Jiamusi city, and Qitaihe city have the least number of shrinkage counties, all of which are 1. It should be noted that Qitaihe is a city with the least number of counties under its jurisdiction in Heilongjiang province. Qitaihe city has three municipal districts and one county, and although the number of shrinkage counties in Qitaihe city is small, it accounts for 25% of the city's total.
From 2010 to 2020, the number of shrinkage counties in Harbin city increased by 10, with the largest increase in all cities in Heilongjiang province. Compared with the first period, the proportion increased 8.27 percentage points during the second period in Harbin city. The number of the shrinkage counties in Daqing city, Jiamusi city, and Suihua city has all increased by 8 during the second period, and the total percent of the shrinkage counties in the three cities have increased by 19.83 percent points compared to the first period.
The number of the shrinkage counties in Shuangyashan city and Qitaihe city has increased by 3, which is relatively small. It is particularly noted that the number of the shrinkage counties in Qitaihe city has reached 4. It means that all 4 counties under the jurisdiction of Qitaih city have shrank, which indicated that the entire Qitaihe city has shrank. The shrinkage counties in Jixi city, Hegang city, Heihe city, and Daxing’anling region have all increased by 1. Jixi city and Hegang city have more shrinkage counties during the first period, so the increase number is less; Heihe city and Daxing’anling region have fewer counties under their jurisdiction, so the increase of shrinkage counties is less. Although the number of shrinkage counties in Yichun city during the second period remains the same as during the first period, the shrinkage degree of counties has intensified, with two counties changed from moderate shrinkage to significant shrinkage.
Overall, as shown in Figure 2, the number of non-shrinkage counties in Heilongjiang province has decreased significantly, while the number of shrinkage counties has increased significantly, accounting for a large increase in the proportion of the counties in Heilongjiang province. Now, over 90% of the counties in Heilongjiang province are shrinkage counties.
3.3. Characteristics of Population Change
In order to further explore the temporal change characteristics of population shrinkage, the population changes in two periods (2000-2010 and 2010-2020) were analyzed based on counties as the basic unit. If there is shrinkage in both periods, the county belongs to a continuous shrinkage type. If population in a county increase during the first period and it turns into shrinkage during the second period, the county belongs to a growth-shrinkage type. If a county belongs to the shrinkage type during the first period and it transfers to growth type during the second period, the county belongs to a shrinkage-growth type. If both periods show growth, the county belongs to a continuous growth type. It can be seen that among the 121 counties in Heilongjiang province, the number of growth-shrinkage types is the largest, followed by continuous shrinkage types, with fewer continuous growth types and the least shrinkage-growth types.
54 counties, including Bayan county in Harbin city and Tailai county in Qiqihar city, belong to a continuous shrinkage type, accounting for 44.63% of total counties in Heilongjiang province. It indicates that over 40% of the counties in Heilongjiang province have continued to shrink over the past 20 years, and also indicates that the population shrinkage in Heilongjiang province has lasted for a long time and the shrinkage is severe. If the counties and the cities continue to shrink in the future, the population of some counties and cities may be lower than the standards set for counties and cities, which may lead to administrative division adjustments, and this has already been a precedent. In July 2019, the 15 municipal districts of Yichun city were adjusted to 8 counties (districts). Before the adjustment, Yichun had 15 districts, 1 county-level city, and 1 county under its jurisdiction. After the adjustment, Yichun had 4 districts, 1 county-level city, and 5 counties under its jurisdiction, reducing 7 county-level administrative regions.
57 counties, including Yilan county in Harbin city and Baiquan county in Qiqihar city, belong to the growth-shrinkage type, accounting for 47.11% of total counties in Heilongjiang province, which is close to half of the total. It indicates that nearly half of the counties in Heilongjiang province have turned from population growth type to population shrinkage type from 2000 to 2020. In the past 20 years, there have been significant changes in the population of counties, with many counties experiencing population loss and population shrinkage counties increasing in the number and proportion. As a result, the area of population shrinkage in Heilongjiang province has expanded.
There are three counties(districts) that have turned from shrinkage to growth, namely Nangang district in Harbin city, Xing'an district in Hegang city, and Daqingshan county in Yichun city, accounting for 2.48% of Heilongjiang province's total, which is very low. It also indicates that once a county begins to shrink, it will be difficult to transfer to growth. The growth of Daqingshan county in Yichun city is mainly due to the adjustment of administrative divisions.
Seven regions, including Daoli district in Harbin city and Jianhua district in Qiqihar city, belong to the continuous growth type, accounting for 5.78% of the total. All seven regions of continuous growth type are the district under the jurisdiction of the city and not the counties, which indicate that the core areas of these cities still maintain a growth trend and have a strong agglomeration effect on the population in peripheral areas. In the future, we should draw on the development experience of urban areas with continuous population growth, enhance the economic development momentum of counties, promote urbanization development with counties as important carriers, and have important implications for alleviating the problem of population shrinkage in counties in Heilongjiang province.
From Figure 3, it can be seen that from 2000 to 2020, the counties with continuous population shrinkage were mainly concentrated in the northern and southeastern parts of Heilongjiang province; The growth-shrinkage type is mainly concentrated in the central part of Heilongjiang province; There are few counties which belong to the type of shrinkage turned to growth, and they are scattered; The continuous growth type is mainly distributed in some districts with strong urban functions, which are the core areas of the city and have strong attraction to the population of other counties.
3.4. Spatial Distribution Characteristics of Population Shrinkage in Counties
- 3.
- Global shrinkage counties
Based on the population shrinkage index, use GeoDa software to calculate the global Moran index I of population shrinkage in counties in Heilongjiang province from 2000 to 2010 and from 2010 to 2020. The Moran index I was -0.038 from 2000 to 2010, and I<0, which indicated a negative spatial correlation. It concluded that the population shrinkage counties tend to be discrete from 2000 to 2010 in Heilongjiang province.
From 2010 to 2020, the Moran index I was 0.014, which showed a positive spatial correlation. This indicates that the population shrinkage of the counties during this period is in the agglomerative state, which means that the shrinkage of a county is positively influenced by neighbor counties. It also indicates that if a large number of people flow out of a county, the surrounding counties will also experience population outflow.
Compared to the first period, the global Moran index during the second period showed an upward trend, and the value changed from negative to positive. The spatial pattern of county shrinkage evolved from discrete distribution to agglomerative distribution, and the agglomeration and dependence of county shrinkage in space increased. This also indicates that the problem of population shrinkage in Heilongjiang province is becoming more serious.
- 4.
- Change of local agglomerative areas
From 2000 to 2010, the "H-H"(high-high) agglomeration areas mainly distributed in Shuangcheng district and Nangang district of Harbin city, as well as Qianjin district of Jiamusi city (Figure 4), which indicated that the population shrinkage trend in these areas was weak during the first period. The H-L (high-low) agglomeration areas located in Tangyuan county in Jiamusi City. It indicated that Tangyuan County, which has a higher degree of shrinkage, is surrounded by counties with a lower degree of shrinkage.
The L-H (low-high) agglomeration areas distributed in Acheng district and Xiangfang district of Harbin City, as well as Dongning county of Mudanjiang city, which indicated that the degree of shrinkage in these counties(districts) is low, but the degree of shrinkage in the surrounding counties is high. The "L-L" (low-low) agglomeration area mainly located in Didao district, Lishu district, and Mashan district of Jixi City, Xunke county of Heihe city, Fenglin county and Yimei district of Yichun city, and Yilan county of Harbin city. The shrinkage degree of these counties (districts) and their surrounding counties is relatively low.
From 2010 to 2020, the spatial pattern of population shrinkage in counties in Heilongjiang province changed and the main agglomeration pattern is the type of L-L agglomeration. Compared with the first period, the scope of the "L-L" agglomeration area during the second period has expanded. The L-L agglomeration area distributed in Baiquan county, Keshan county, and Yi'an county of Qiqihar City; Didao district, Jidong county, Lishu district, and Mashan district of Jixi City; Bei'an city and Wudalianchi city of Heihe city; Hailun city, Mingshui county, and Qinggang county of Suihua city, and Xingshan district of Hegang city, mainly located in the central, western, and southeastern parts of Heilongjiang province.
From 2010 to 2020, the "H-H" agglomeration areas distributed in Nangang district and Daowai district of Harbin City. Compared to the first period, the scope of this type of agglomeration has narrowed. The H-L agglomeration areas located in Jiguan district of Jixi City, where the shrinkage degree is relatively high, but it is surrounded by counties with lower shrinkage degrees. The L-H agglomeration areas located in Pingfang district of Harbin city. Although the shrinkage degree is relatively low, the surrounding counties have a higher shrinkage degree.
Overall, compared with the first period, the scope of the "H-H" agglomeration area in Heilongjiang province decreased during the second period, and the scope of the "H-L" and "L-H" agglomeration areas also decreased. However, the scope of the "L-L" agglomeration areas expanded and the expansion trend strengthened, which indicated that the population shrinkage in counties in Heilongjiang province became more severe.
4. Analysis of Factors Influencing Population Shrinkage
4.1. Qualitative Analysis
It is benefit to study population shrinkage in Heilongjiang province based on county-level administrative regions. It was found that over 90% of counties (districts, county-level cities) in Heilongjiang province have experienced shrinkage, which is not caused by one or two factors, but rather the result of the combination of multiple factors.
The level of economic development is one of the important influencing factors of population shrinkage. From a national perspective, the economic development level of Heilongjiang province is relatively low. People are migrating from developing areas to developed areas in pursuit of higher income and better life, which result in population decrease in developing areas, especially a significant decrease in labor force. In 2000, GDP of Heilongjiang province was 0.29 trillion yuan, which ranked 15th in all provincial administration regions in China and the rank was in the middle position; Per capita GDP of Heilongjiang province is 7515.5 yuan, ranking 10th and in the top 1/3. In 2010, GDP and per capita GDP of Heilongjiang province ranked 16th and 23rd respectively. GDP of Heilongjiang province still was in the middle position, but the rank of per capita GDP significantly declined, and the level of economic development in Heilongjiang province declined significantly. In 2020, GDP rank of Heilongjiang province declined to 25th, and per capita GDP rank continued to decline, which ranked 30th and already located in the end. It can be concluded that the economic development level of Heilongjiang province has seriously declined from 2000 to 2020, and the trend of population shrinkage is similar to the downward trend of economic development level.
Changes in population structure and aging issues can also have an impact on population shrinkage. With the decline in fertility rates and the increase in young people migrating from Heilongjiang province, the proportion of young people is relatively decreasing, while the proportion of elderly people is relatively increasing. On the whole, the total population of Heilongjiang province decreased. Specifically, the birth rate of permanent residents in Heilongjiang province showed a gradually decreasing trend from 2000 to 2020. In 2000, the birth rate of permanent residents in Heilongjiang province was 9.4 ‰, which was significantly lower than the national level of 14.03 ‰. In 2010, the birth rates of permanent residents in Heilongjiang province and that in the whole country decreased to 7.4 ‰ and 11.9 ‰ respectively, and there was still a significant gap between Heilongjiang province and the whole country. In 2020, the rates in Heilongjiang province and in the whole country were 3.8 ‰ and 8.52 ‰ respectively, and the gap was still significant. Moreover, the birth rate in Heilongjiang province is very low. If the downward trend continues, there may be negative growth in the next decade in Heilongjiang province, which will inevitably aggravate the population shrinkage trend in Heilongjiang province.
The transformation of urban and rural development affects population shrinkage. Heilongjiang province is rich in natural resources such as land, forests, and minerals, but it also faces the large responsibility of protecting basic farmland and ecological environment, as well as the problems of resource depletion and urban transformation. With the mechanization, intelligence and scaling of agricultural production in Heilongjiang province, the demand for rural labors is decreasing, and there will inevitably be a portion of labor outflow. The depletion of coal resources and the shrinkage of related industries have led to the loss of industrial workers. Urban transformation has led to the decrease or the change in job positions, and employment inertia leads to maladaptation, So some people in Heilongjiang province can only go to cities in other provinces for employment.
4.2. Quantitative Analysis
Referring to the research results of relevant scholars, 17 factors were selected as independent variables from four aspects: economy, society, location and nature (Table 2), and population was used as the dependent variable. The influencing factors were analyzed using the multiple linear regression method of SPSS software. Through the variance test, it was found that the adjusted R2 values of the regression model were all bigger than 0.9, which indicates that the regression model has significant statistical significance. The points in the corresponding graphs of 2000, 2010, and 2020 followed a normal distribution, which indicates that the regression model has a high degree of fit and has eliminated collinearity issues. It can be used to explain the factors that affect population size.
According to the regression results, the added value of the primary industry in 2000 passed the significance test, and the standardized regression coefficient was positive, indicating that this factor had a significant impact on the population of counties in Heilongjiang province in 2000. In 2010, the general budget expenditure of local finance had a significant impact on the population of counties in Heilongjiang province, which was positively correlated with the population of counties. In 2020, GDP, the added value of the primary industry, the added value of the secondary industry, and the added value of the tertiary industry all passed the significance test and showed a positive correlation with the county population. The added value of the tertiary industry has a greater impact on the total population. The larger the added value of the tertiary industry, the better the economic development, and thus the more obvious population growth; On the contrary, if the added value of the tertiary industry is low and the growth rate is small, then the total population will decrease and population shrinkage will occur.
Overall, the variables that are significantly positively correlated with the total population are all economic variables, which indicate that the main factors affecting the population shrinkage in counties are economic factors. Social factors, location factors, and natural factors have no significant impact on population shrinkage in Heilongjiang province.

Table 2.
Regression model analysis results.
| Dependent variable | Factors type |
Independent variable |
2000 2010 2020 Beta Sig. Beta Sig. Beta Sig. |
|||||
|---|---|---|---|---|---|---|---|---|
| Population | Economic factors | GDP | -0.044 | 0.852 | -0.166 | 0.766 | 0.791 | 0.000*** |
| Added value of primary industry | 0.491 | 0.000 *** |
0.400 | 0.015 | 0.403 | 0.000*** | ||
| Added value of secondary industry | -0.236 | 0.125 | 0.330 | 0.169 | 0.231 | 0.000*** | ||
| Added value of tertiary industry | 0.187 | 0.103 | 0.361 | 0.207 | 0.336 | 0.000*** | ||
| General budgets revenues of local finance | 0.018 | 0.879 | -0.201 | 0.114 | -0.458 | 0.016 | ||
| General budgetary expenditures of local finance | 0.061 | 0.695 | 0.269 | 0.000*** | -0.142 | 0.046 | ||
| Balance of savings deposits of urban and rural residents | 0.328 | 0.012 | 0.288 | 0.002 | 0.128 | 0.127 | ||
| Per capita rural disposable income | 0.070 | 0.402 | 0.003 | 0.965 | 0.134 | 0.197 | ||
| Social factors | Employees per 10,000 people | -0.058 | 0.387 | -0.017 | 0.708 | 0.064 | 0.779 | |
| Employment in industrial enterprises of above scale | 0.244 | 0.008 | -0.078 | 0.309 | -0.010 | 0.023 | ||
| Beds per 10,000 medical and health institutions | -0.104 | 0.112 | -0.083 | 0.164 | -0.128 | 0.026 | ||
| Beds per 10,000 social welfare nstitutions | 0.019 | 0.784 | 0.059 | 0.230 | -0.092 | 0.178 | ||
| Location factors | Distance to the nearest administrative region center | 0.175 | 0.027 | -0.071 | 0.171 | -0.291 | 0.699 | |
| Distance to the provincial capital | -0.204 | 0.030 | -0.083 | 0.323 | 0.019 | 0.353 | ||
| Natural factors | Average slope | 0.067 | 0.477 | 0.163 | 0.013 | -0.060 | 0.648 | |
| Average annual temperature | 0.038 | 0.602 | 0.000 | 0.997 | 0.026 | 0.082 | ||
| Average annual precipitation | -0.164 | 0.050 | -0.208 | 0.002 | 0.116 | 0.870 | ||
| Adjusted R2 | 0.905 | 0.940 | 0.955 | |||||
Note: * * * indicates that the results pass the significance test.
5. Conclusion and Discussion
5.1. Conclusion
Based on the data from the fifth, the sixth and the seventh population censuses, and using county-level administrative regions as units, this study analyzes the spatiotemporal characteristics and influencing factors of population shrinkage in Heilongjiang province. The main conclusions are as follows:
- (1)
- From 2000 to 2010, the proportion of population shrinkage of county-level administrative regions in Qiqihar city, Yichun city, and Jixi city was high in Heilongjiang province. From 2010 to 2020, the population of county-level administrative regions in Qitaihe city, Suihua city, and Daxing'anling region shrank more severely than in other cities. From 2000 to 2020, the phenomenon of population shrinkage in Heilongjiang province became increasingly apparent, and the degree of shrinkage became more and more severe. The vast majority of county-level regions were shrinkage in Heilongjiang province.
- (2)
- During the research period, the number of county-level administrative regions with growth turning to shrinkage was the largest, that is to say, county-level administrative regions that did not shrink during the first period turned to shrinkage regions during the second period. These regions mainly concentrate in the central part of Heilongjiang province. The proportion of continuous shrinkage of county-level administrative regions in Heilongjiang province is large and these regions concentrate in the northern and southeastern parts of Heilongjiang province. County-level administrative regions with continuous growth are very few, so are county-level administrative regions with shrinkage turning to growth.
- (3)
- The distribution of shrinkage regions has strong spatial correlation which forms four characteristics: high-high agglomeration, high-low agglomeration, low-high agglomeration, and low-low agglomeration. During the research period, the scope of high-high agglomeration regions in Heilongjiang province reduced, while the scope of low-low agglomeration regions expanded.
- (4)
- The factors that affect population shrinkage in Heilongjiang province are various, but population shrinkage mainly affected by economic factors. The added value of the tertiary industry has a significant impact on the total population. Due to the decrease in economic development level in Heilongjiang province during the research period, population shrinkage has intensified.
5.2. Discuss
Since 2000, many county-level administrative regions in Northeast China have experienced population shrinkage, and county-level administrative regions in Heilongjiang province is the most severe region with population shrinkage in Northeast China. The formation of population shrinkage is a complex issue that draws high attention from the government and the academia. Effective response to population shrinkage and achieving high-quality regional development require joint efforts from all sectors of society.
This paper takes county-level administrative regions as units to study the spatiotemporal pattern and influencing factors of population shrinkage in Heilongjiang province. The process and characteristics of population shrinkage of county-level administrative regions are deeply analyzed. The influencing factors are analyzed from both qualitative and quantitative analysis. But there are also certain shortcomings, and the research region needs to be expanded. Although Heilongjiang province is a serious region of population shrinkage, population shrinkage has a certain universality in three provinces of Northeast China. In the future, research on population shrinkage in three provinces of Northeast China should be focused on exploring the formation mechanism of population shrinkage. Based on the research results of relevant scholars, this paper explores the influencing factors of population shrinkage from four aspects: economy, society, location, and nature. Although economic factors are the main factors, the impact of policies on population change needs to be considered in the future, but the quantification of policies is difficult.
References
- Peiyong, Deng; Yihua, Liu. Spatial pattern and influence factors analysis of population shrinkage in county unit in China; Modern City Research, 2018; pp. 31–38. (in Chinese) [Google Scholar]
- Renia, Ehrenfeucht. Quietly shrinking cities: Canadian urban population loss in an age of growth, by Maxwell Hartt[J]. Journal of Urban Affairs 2022, 44(7), 1–2. [Google Scholar]
- Gert, J.H. Coping with shrinkage in Europe’s cities and towns. Urban Design International 2012, 18, 78–89. [Google Scholar]
- Lei, Han; Xiaoming, Qi; Jun, Hao. Spatiotemporal pattern of county population shrinkage in eastern Inner Mongolia and driving force analysis. Journal of Arid Resources and Enviromment 2022, 36(8), 60–67. [Google Scholar]
- Qingsong, He; Miao, Yan; Jiayu, Wu. Characteristics of Population Shrinkage in Inner Urban China and Correlations with Urban Growth Patterns. Applied Spatial Analysis and Policy 2023, 16, 1317–1343. [Google Scholar] [CrossRef]
- Yuchen, Hu; Yanjun, Liu; Hongri, Sun. Process and factors of urban growth and shrinkage: A case study of mining cities in Heilongjiang Province. Scientia Geographica Sinica 2020, 40(9), 1450–1459. (in Chinese). [Google Scholar]
- Karp, D. N.; Bagchi-Sen, S.; Rogerson, P. Not all shrinking places are similar: The variegated nature of population decline in the United States. Applied Geography 2021, 138. [Google Scholar] [CrossRef]
- Li, H; Mykhnenko, V. Urban shrinkage with Chinese characteristics. The Geographical Journal 2018, 184(4), 398–412. [Google Scholar] [CrossRef]
- He, Li; Kevin LO; Pingyu, Zhang. Population Shrinkage in Resource-dependent Cities in China: Processes, Patterns and Drivers. Chinese Geographical Science 2020, 30(1), 1–15. [Google Scholar]
- Xiuxia, Li; Yongjing, Cui; Qi, Chen; et al. The economic effect of population contraction in Northeast China and its countermeasures. Population and the Economy 2023, 2018(1), 71–86. (in Chinese). [Google Scholar]
- Qianqian, Liu; Xiangli, Wu. The measurement and driving mechanism of the coordinated development of regional economy and basic public services in the three northeast provinces under the background of population shrinkage. Economic Geography 2023, 43(6), 22–32. [Google Scholar]
- Zhen, Liu; Honggan, Qi; Shenghe, Liu. Labor Shrinkage and its Driving Forces in China from 1990 to 2015: A Geographical Analysis. Applied Spatial Analysis and Policy 2021, 15, 339–364. [Google Scholar] [CrossRef]
- Zhen, Liu; Honggang, Qi; Wei, Qi; et al. The evolution of spatial-temporal pattern of population shrinkage region distribution in China from 1990 to 2010: An analysis based on different measures. Geosciences 2019, 39(10), 1525–1536. (in Chinese). [Google Scholar]
- Zhen, Liu; Wei, QI; Honggang, QI; et al. The evolution of regional population decline and its driving factors at the county level in China from 1990 to 2015. Geographical Research 2020, 39(7), 1565–1579. (in Chinese). [Google Scholar]
- Zuopeng, Ma; Chenggu, Li; Pingyu, Zhang. Characteristics, mechanism and response of urban shrinkage in the three provinces of Northeast China. Acta Geographica Sinica 2021, 76(4), 767–780. (in Chinese). [Google Scholar]
- Nefedova, T. G.; Medvedev, A. A. Shrinkage of the Developed Space in Central Russia: Population Dynamics and Land Use in Rural Areas. Rural Studies 2020, 10, 549–561. [Google Scholar] [CrossRef]
- Wei, Qi; Shenghe, Liu; Fengjun, Jin. Calculation and spatial evolution of population loss in Northeast China. Scientia Geographica Sinica 2017, 37(12), 1795–1804. (in Chinese). [Google Scholar]
- Pingjun, Sun; Kewen, Wang. Identification and stage division of urban shrinkage in them three provinces of Northeast China. Acta Geographica Sinica 2021, 76(6), 1366–1379. (in Chinese). [Google Scholar]
- Tingting, Wang; Kang, Wu; Cuiyou, Yao; et al. Complex pathways to population shrinkage: case study of Hegang city, China. Chinese Geographical Science 2022, 32(3), 418–437. [Google Scholar] [CrossRef]
- Wolff, M.; Wiechmann, T. Urban growth and decline: Europe’s shrinkage cities in a comparative perspective 1990–2010. European Urban and Regional Studies 2018, 25(2), 122–139. [Google Scholar] [CrossRef]
- Mingke, Xie; Zhangxian, Feng; Yang, Song; et al. How Does Urban Shrinkage Affect Land Use Efficiency? A Case Study of Shrinking Cities in Northeast China. Chinese Geographical Science 2024, 34(1), 34–51. [Google Scholar] [CrossRef]
- Kui, Ying; Jinhong, Ding; Yihao, Chen; et al. Spatial characteristics of population shrinkage and influencing factors detected by MGWR model in Guizhou county. World Regional Studies 2023, 32(12), 172–184. (in Chinese). [Google Scholar]
Figure 1.
Distribution of population shrinkage types in Heilongjiang province.
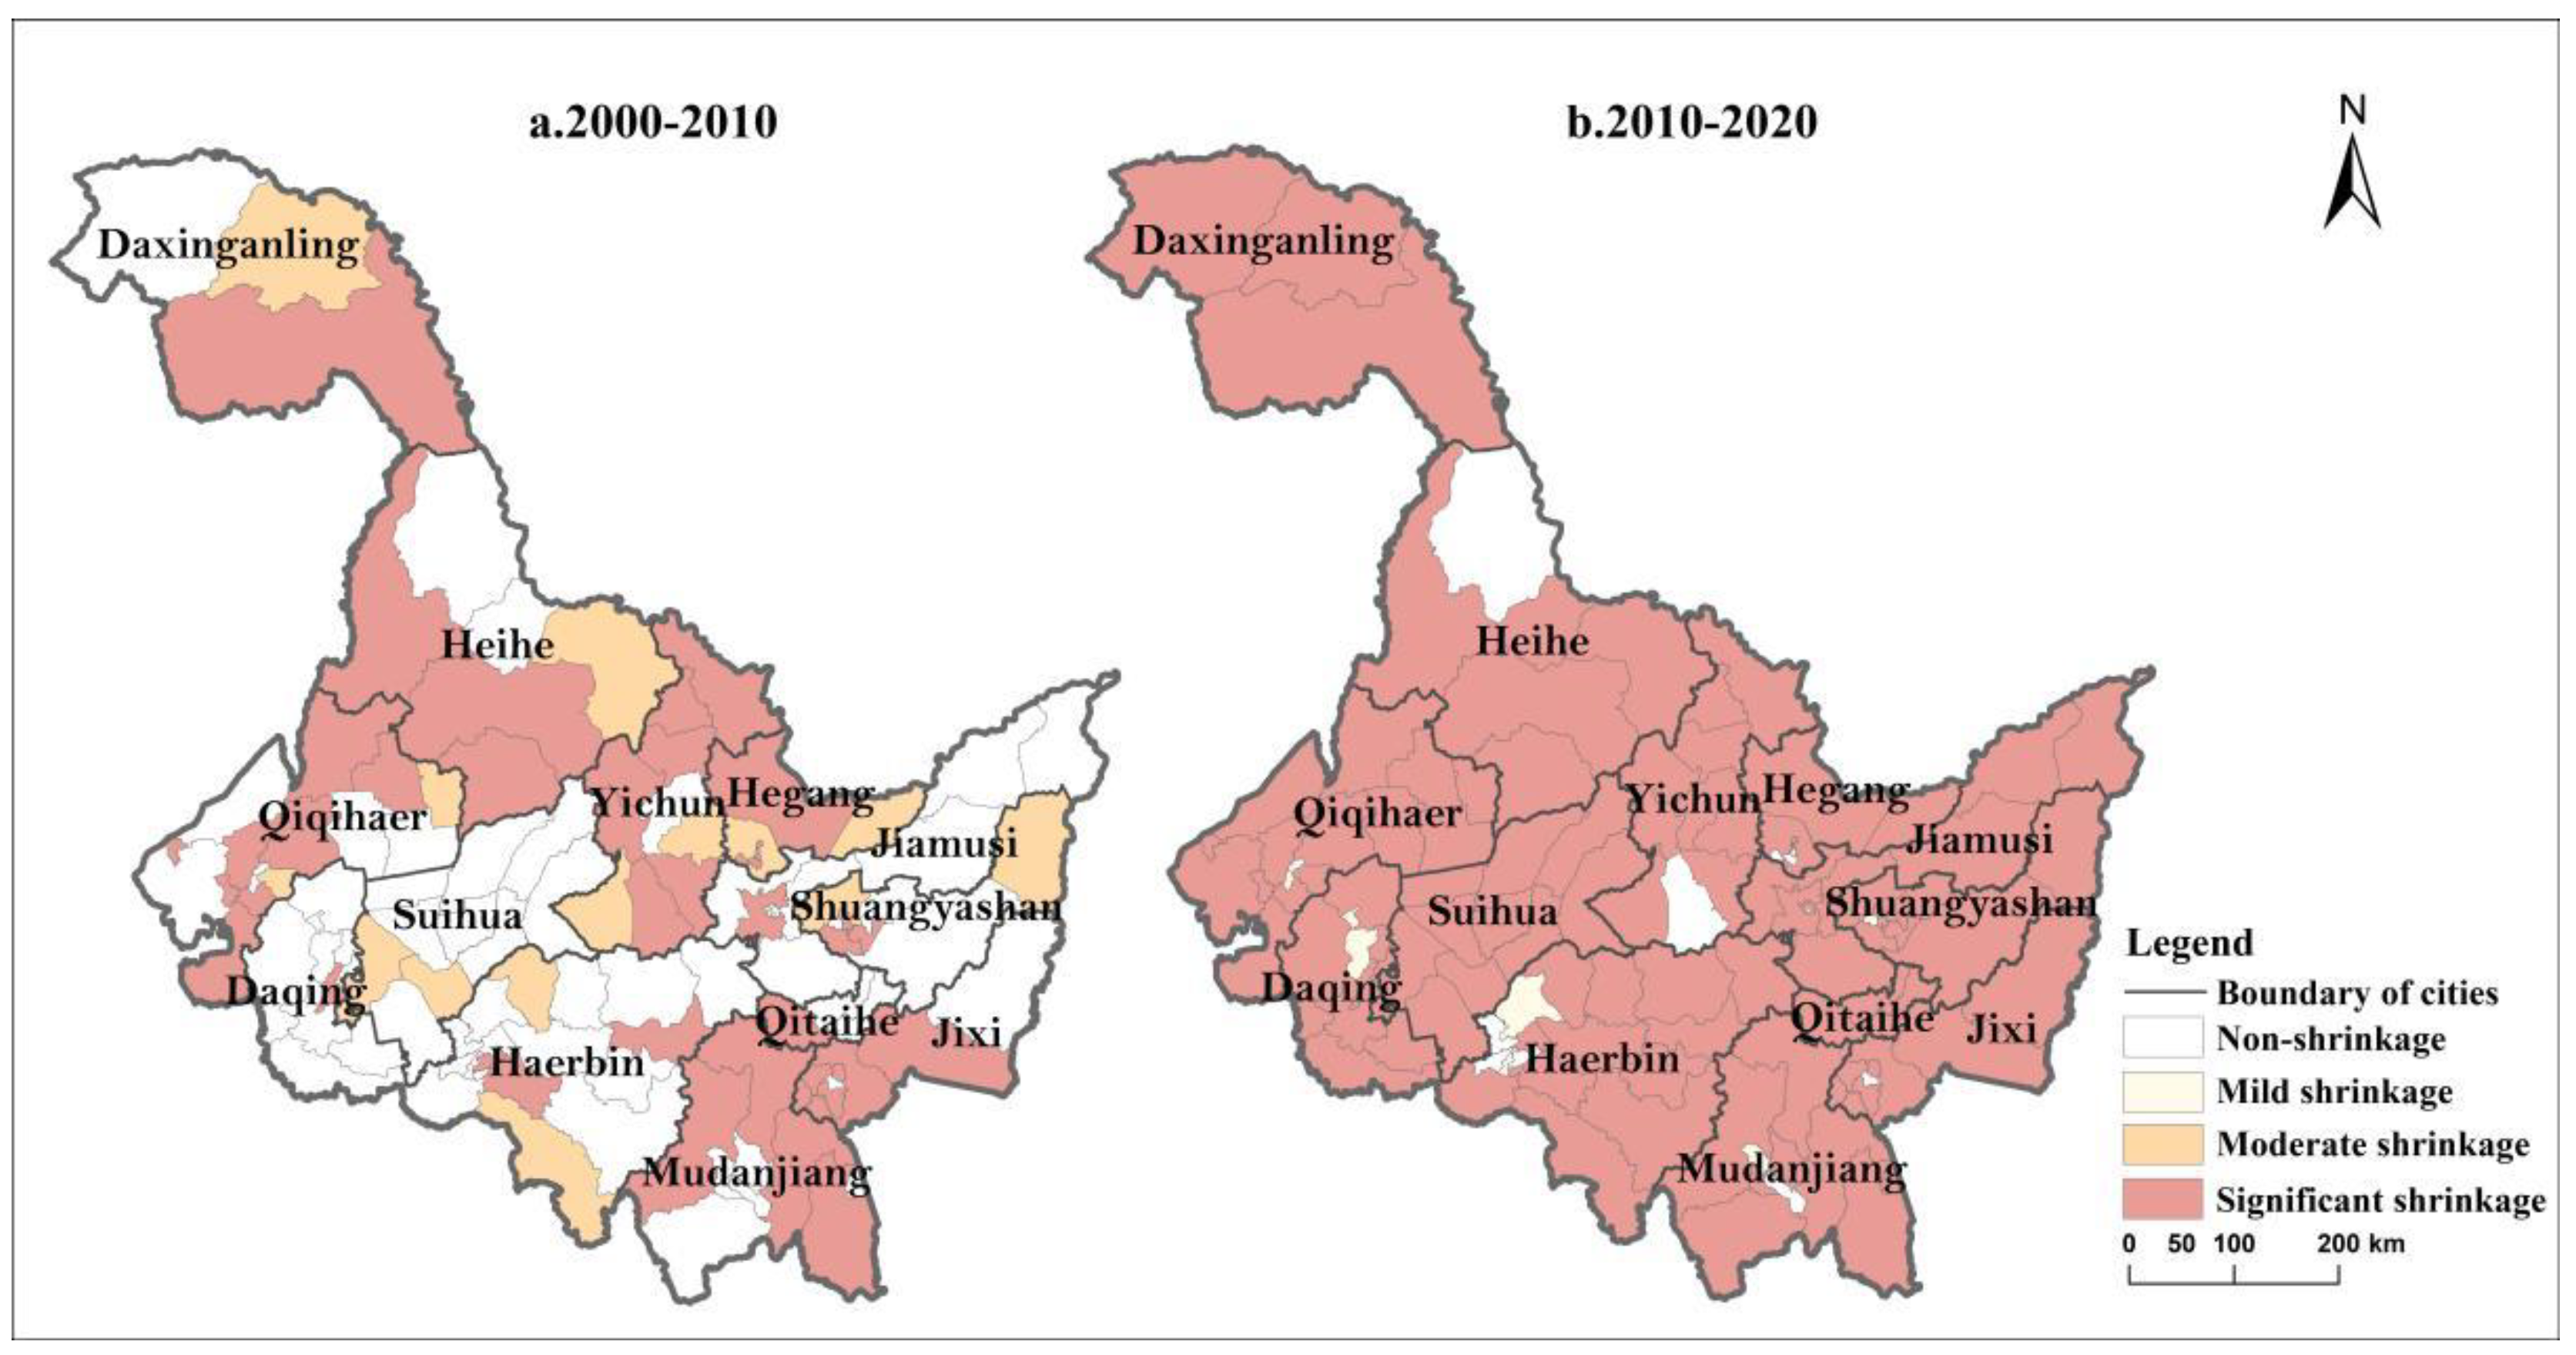
Figure 2.
Shrinkage counties and non-shrinkage counties in Heilongjiang province.
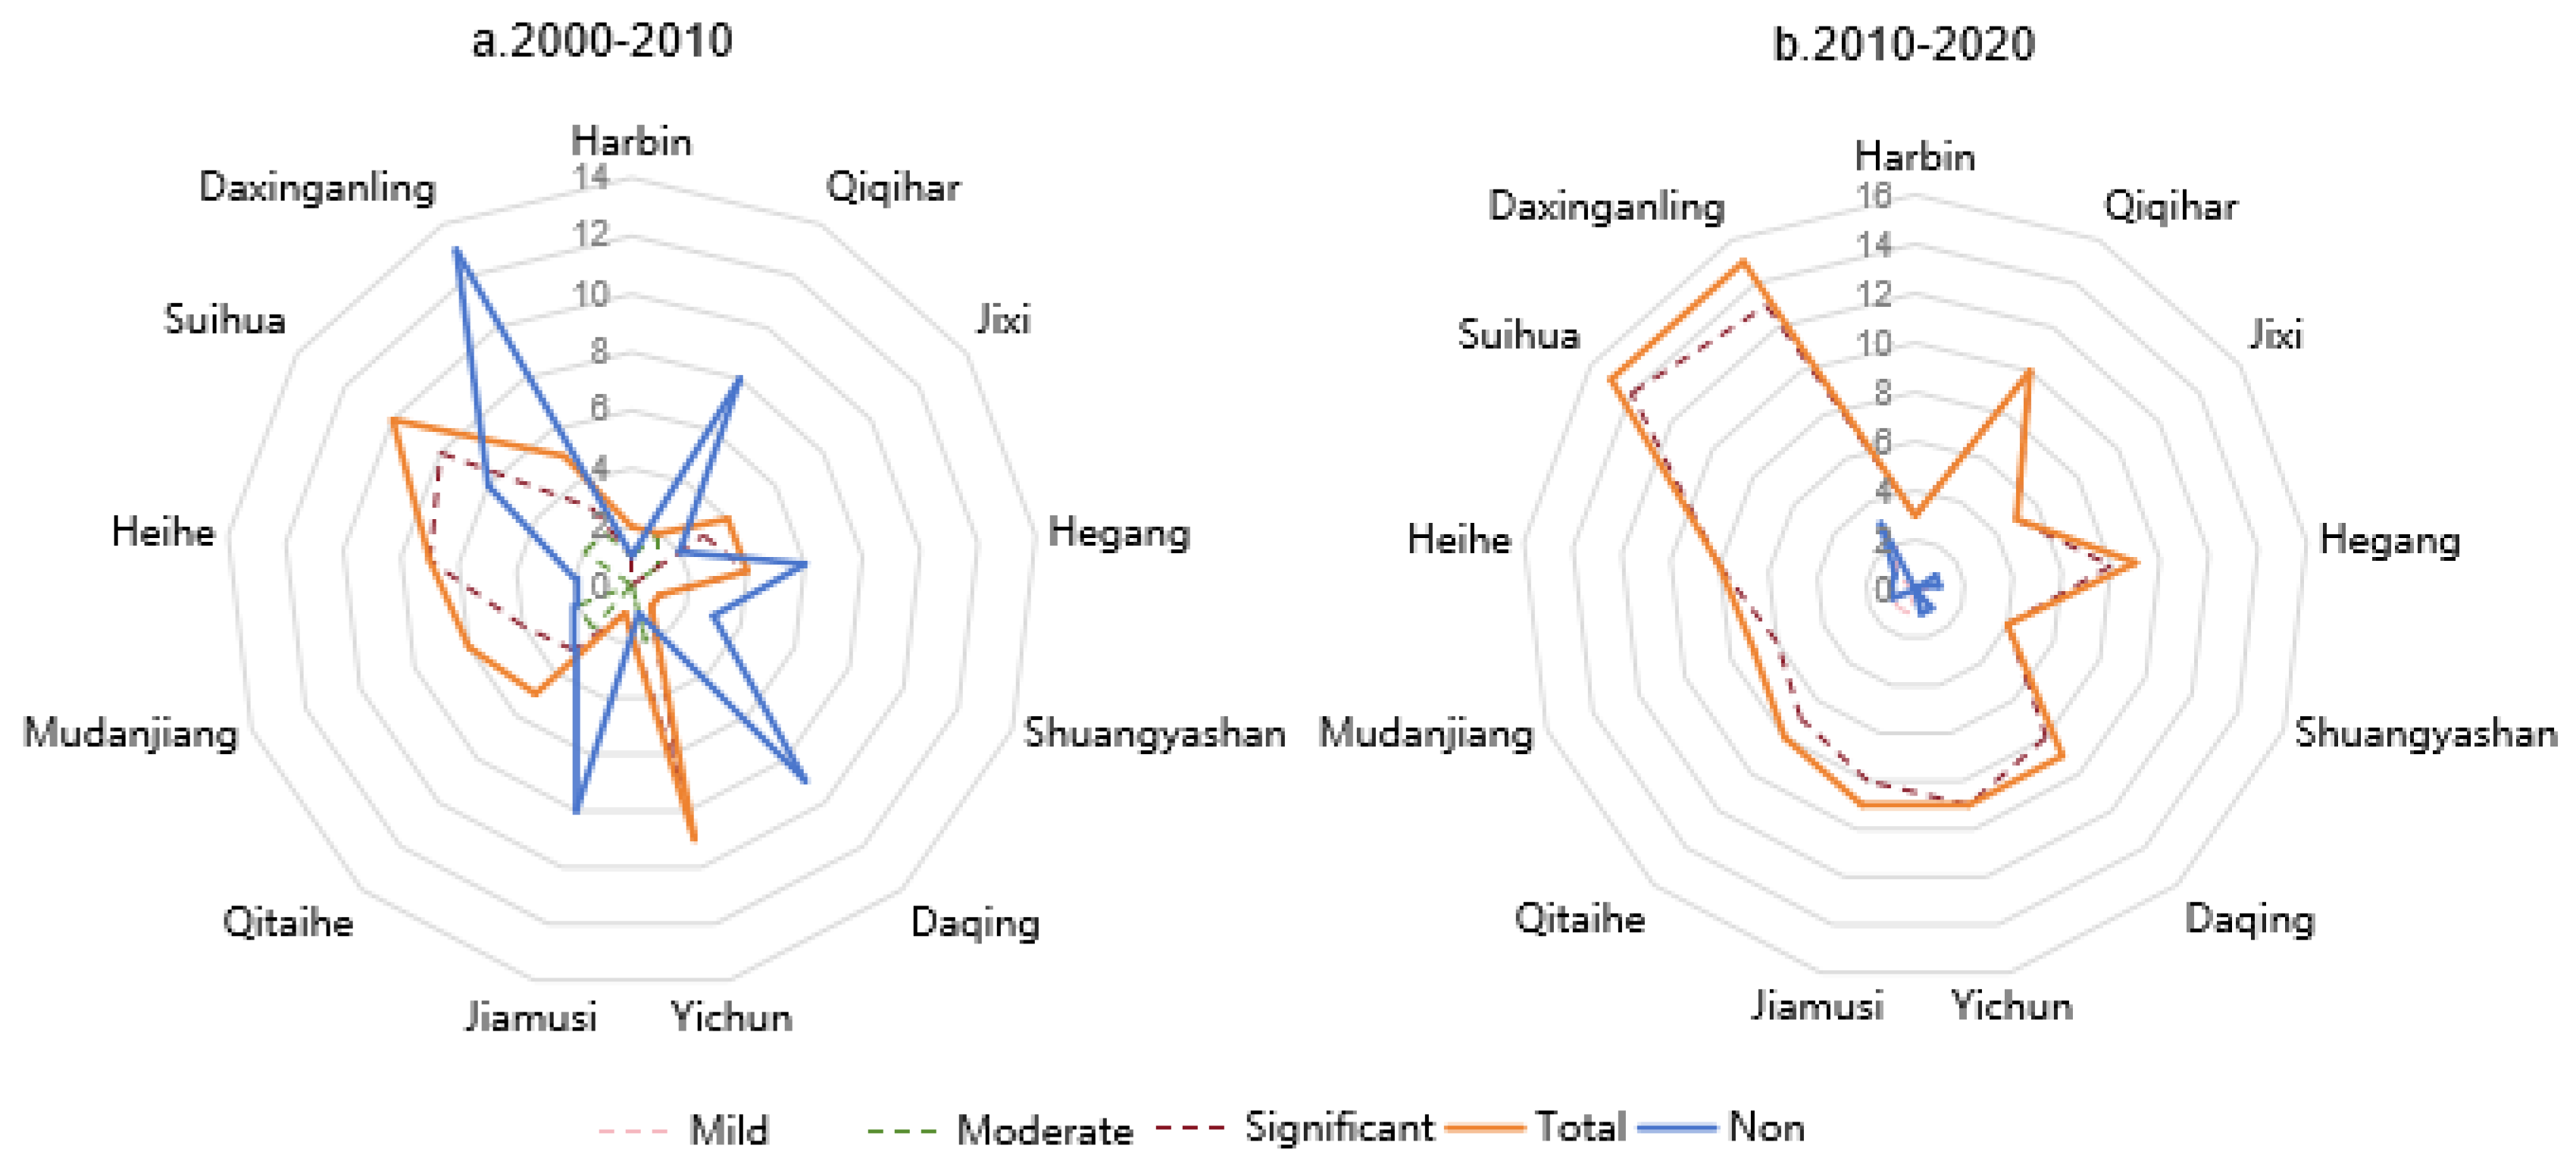
Figure 3.
Spatial distribution of different evolution type of counties in Heilongjiang province.
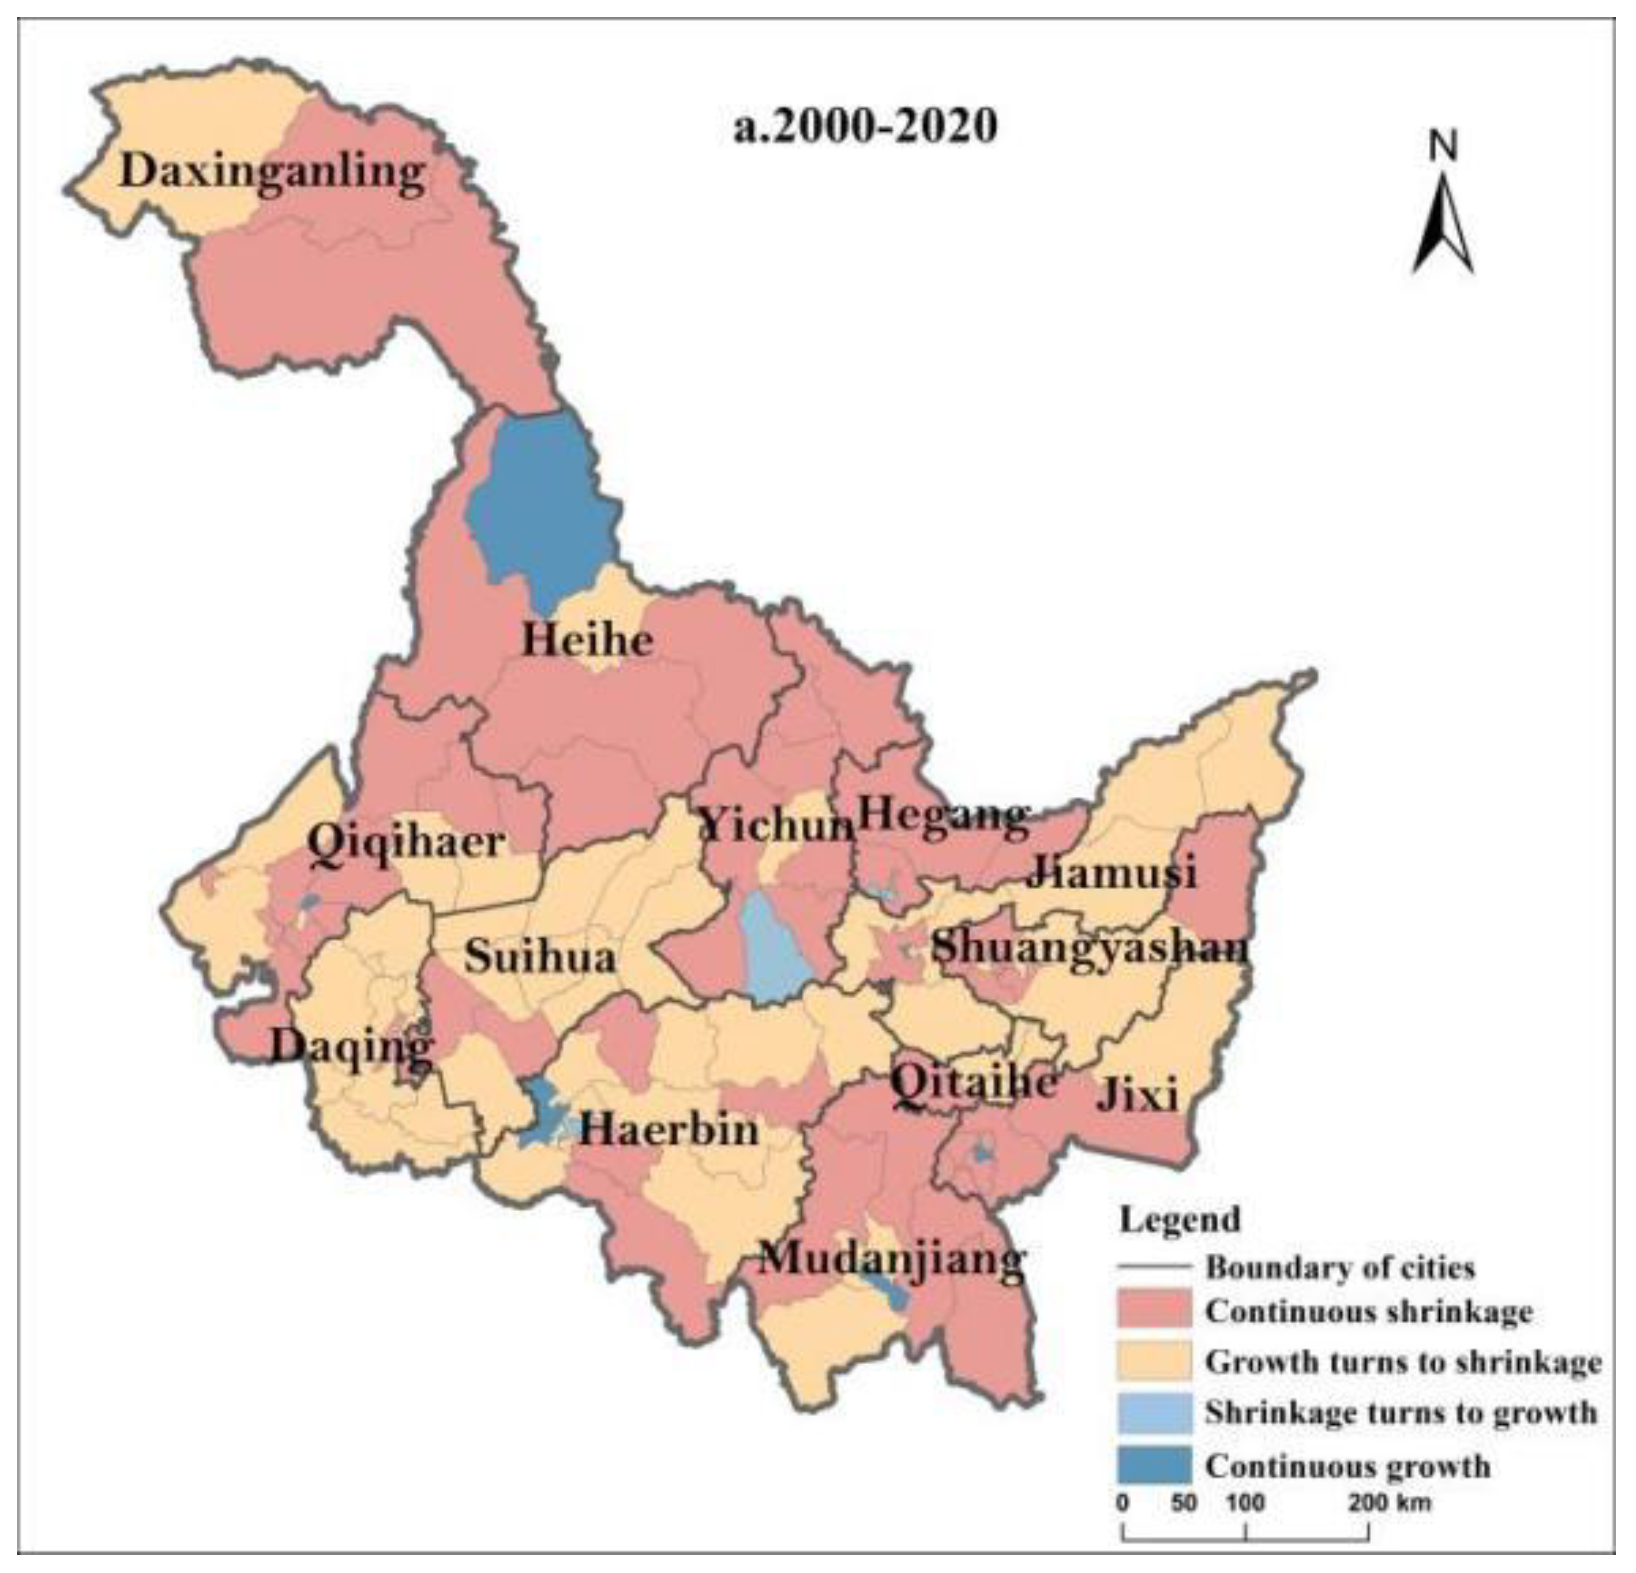
Figure 4.
LISA cluster map of county population shrinkage in Heilongjiang province.
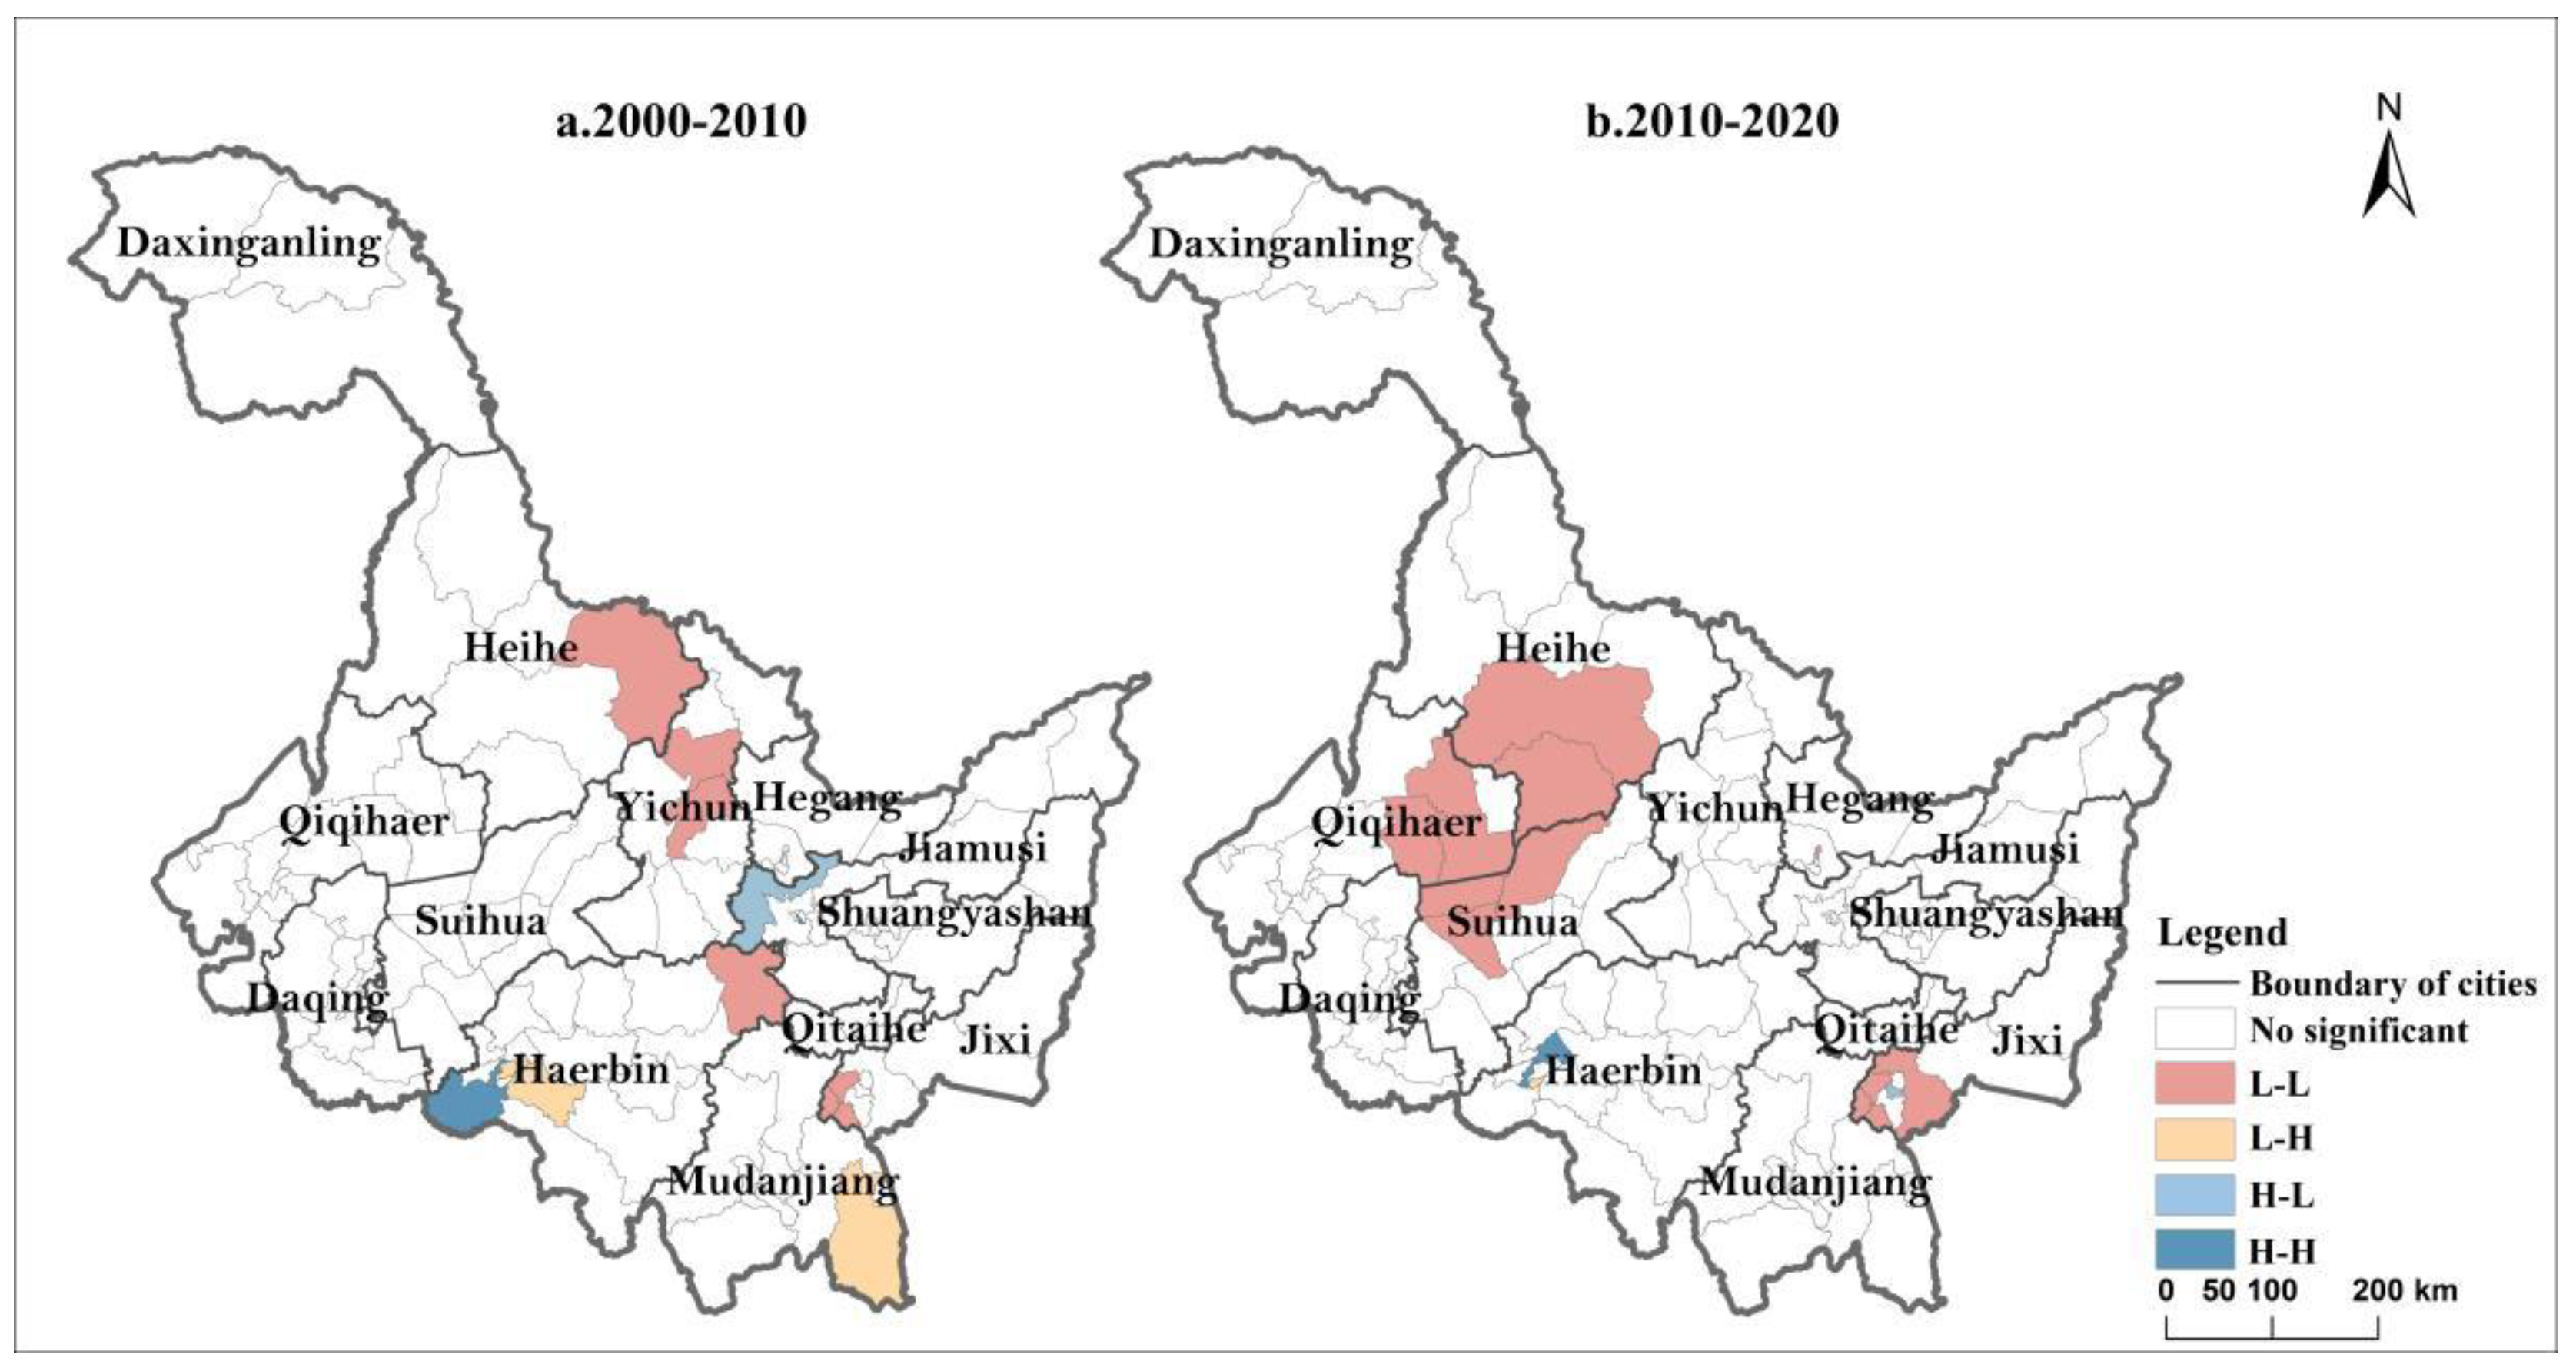
Table 1.
Status of county population shrinkage in Heilongjiang province .
| The type of shrinkage | 2000-2010 | 2010-2020 | Two periods | |||
| Quantity (unit) | Percentage (%) | Quantity (unit) | Percentage (%) | Quantity (unit) | Range (%) | |
| Mild shrinkage | 0 | 0.00 | 8 | 6.61 | +8 | +6.61 |
| Moderate shrinkage | 14 | 11.57 | 0 | 0.00 | -14 | -11.57 |
| Significant shrinkage | 43 | 35.54 | 103 | 85.12 | +60 | +49.58 |
| Total shrinkage type | 57 | 47.11 | 111 | 91.73 | +54 | +44.62 |
| Non-shrinkage | 64 | 52.89 | 10 | 8.27 | -54 | -44.62 |
Table 2.
The number and proportion of population shrinkage types of cities in Heilongjiang province.
Table 2.
The number and proportion of population shrinkage types of cities in Heilongjiang province.
| The 1st period(2000-2010) | The 2nd period (2010-2020) | Total Change | ||||||||||||
| Mild | Moderate | Significant | Total | % | Mild | Moderate | Significant | Total | % | Quantity | Percent | |||
| Harbin | 0 | 2 | 3 | 5 | 4.13 | 2 | 0 | 13 | 15 | 12.40 | +10 | +8.27 | ||
| Qiqihar | 0 | 2 | 8 | 10 | 8.26 | 1 | 0 | 14 | 15 | 12.40 | +5 | +4.14 | ||
| Jixi | 0 | 0 | 7 | 7 | 5.79 | 0 | 0 | 8 | 8 | 6.61 | +1 | +0.82 | ||
| Hegang | 0 | 2 | 4 | 6 | 4.96 | 1 | 0 | 6 | 7 | 5.79 | +1 | +0.83 | ||
| Shuangyashan | 0 | 2 | 3 | 5 | 4.13 | 1 | 0 | 7 | 8 | 6.61 | +3 | +2.48 | ||
| Daqing | 0 | 0 | 1 | 1 | 0.83 | 1 | 0 | 8 | 9 | 7.44 | +8 | +6.61 | ||
| Yichun | 0 | 2 | 7 | 9 | 7.44 | 0 | 0 | 9 | 9 | 7.44 | +0 | +0.00 | ||
| Jiamusi | 0 | 0 | 1 | 1 | 0.83 | 1 | 0 | 8 | 9 | 7.44 | +8 | +6.61 | ||
| Qitaihe | 0 | 0 | 1 | 1 | 0.83 | 0 | 0 | 4 | 4 | 3.31 | +3 | +2.48 | ||
| Mudanjiang | 0 | 0 | 4 | 4 | 3.31 | 1 | 0 | 8 | 9 | 7.44 | +5 | +4.13 | ||
| Heihe | 0 | 1 | 3 | 4 | 3.31 | 0 | 0 | 5 | 5 | 4.13 | +1 | +0.82 | ||
| Suihua | 0 | 2 | 0 | 2 | 1.65 | 0 | 0 | 10 | 10 | 8.26 | +8 | +6.61 | ||
| Greater Khingan | 0 | 1 | 1 | 2 | 1.65 | 0 | 0 | 3 | 3 | 2.48 | +1 | +0.83 | ||
Disclaimer/Publisher’s Note: The statements, opinions and data contained in all publications are solely those of the individual author(s) and contributor(s) and not of MDPI and/or the editor(s). MDPI and/or the editor(s) disclaim responsibility for any injury to people or property resulting from any ideas, methods, instructions or products referred to in the content. |
© 2025 by the authors. Licensee MDPI, Basel, Switzerland. This article is an open access article distributed under the terms and conditions of the Creative Commons Attribution (CC BY) license (http://creativecommons.org/licenses/by/4.0/).
Copyright: This open access article is published under a Creative Commons CC BY 4.0 license, which permit the free download, distribution, and reuse, provided that the author and preprint are cited in any reuse.


