
Submitted:
24 September 2025
Posted:
25 September 2025
You are already at the latest version
Abstract
Prediction of stock price index direction is a challenging task due to the complex and dynamic nature of financial markets. Accurate forecasts can yield substantial benefits for investors. This study develops an artificial neural network (ANN) based model to predict next-day movements of the BELEX15 Index, an emerging market index of the Belgrade Stock Exchange. Eleven technical indicators were selected as input features. A series of parameter-setting experiments were performed to optimize the ANN architecture, including hidden neurons, training functions, and learning parameters. The model was trained and validated using daily data from 2006 to 2024. The proposed model achieved 71.39% accuracy, outperforming comparable ANN models applied to other stock markets and significantly exceeding attempts to apply existing models to BELEX15. These findings demonstrate the potential of ANN-based models for market-specific forecasting and their utility in designing effective trading strategies in emerging financial markets.
Keywords:
market direction forecasting
; ANN
; BELEX15 Index
; technical indicators
1. Introduction
Over the past several decades, forecasting stock price indices and their dynamics has attracted substantial scholarly attention. This problem is particularly challenging because financial markets exhibit inherently dynamic, nonlinear, complex, nonparametric, and chaotic behaviors, which complicate accurate modeling and prediction.
Stock markets are influenced by numerous macroeconomic and market-specific factors, including political events, general economic conditions, investor expectations, movements of other stock markets, and investor psychology. Many studies on stock price prediction exist in the literature, primarily focusing on developed financial markets, while only a few addresses emerging markets. Accurate predictions of stock price index movements are essential for developing effective trading strategies.
The BELEX15 Index, established in September 2005, is the leading index of the Belgrade Stock Exchange, reflecting the performance of the most liquid Serbian shares. With a market capitalization of €4,238 million in September 2025, BELEX15 is a free-float, market capitalization weighted index. This study aims to predict the next-day direction of BELEX15 movements using historical stock price data and an artificial neural network (ANN) based methodology. The strength of neural networks lies in their ability to process nonlinear relationships in stock data, outperforming many traditional models as shown in [1].
The major contributions of this study are:
- demonstrating the predictability of stock price index direction on the Serbian market using ANN.
- optimizing the ANN architecture through systematic parameter-setting experiments.
- comparing the proposed model’s performance with previously published models on other markets.
Empirical results indicate an accuracy of 71.39%, corresponding to a 2.5 ratio of profitable to non-profitable transactions.
1.1. Literature Review
The number of studies investigating the direction of financial instruments is increasing steadily. Both academic researchers and practitioners have focused on predicting stock market index movements and developing strategies to translate predictions into profits [2]. A recent review [3] emphasizes how advanced neural network architectures are transforming financial applications such as algorithmic trading, portfolio optimization, and risk management, while outlining their strengths, limitations, and future research directions.
Stock market prediction models are generally classified into fundamental analysis and technical analysis [4]. Fundamental analysis relies on macroeconomic indicators (exports, interest rates, inflation, foreign exchange rates, unemployment) and company-specific financial profiles (earnings yield, dividend yields, price-to-earnings ratio, price-to-book ratio) [5]. Technical analysis assumes that historical price patterns repeat, using price and volume correlations to infer market behavior. Numerous technical indicators have been proposed for investment decision-making [6,7]. Maingo et.al. [8] published study about volatility modelling of the daily Johannesburg Stock Exchange All Share Index (JSE ALSI) and tested the model’s predictive capability with a rolling forecast.
Soft computing approaches, particularly ANNs, have shown promising results in financial time series prediction [9]. For example, Sevim et al. [10] developed an ANN-based early warning system for currency crises in Turkey. ANNs are proved to be effective to predict next day opening stock values [11] highlighting their central role in automated and accurate stock market forecasting. Numerous studies demonstrate effectiveness of ANN in predicting stock price indices [6,7,12,13,14,15,16,17,18]. ANN predictions can be used directly, or they can be interpreted by generative AI, guided by prompt engineering. It is shown in [19] that an explainable AI–based framework combining neural networks and generative AI can be highly profitable in portfolio recommendations, achieving over 56% average profitability on NASDAQ-100 and S&P-500 data. Comprehensive review of Atsalakis and Valavanis [20], summarize ANN and soft computing techniques for stock market forecasting. Kristensen and Sognefest [21] proposed actor-model-based trading platform that enables parallel retraining of ANNs without interrupting live trading, allowing newly trained networks to seamlessly replace older ones while ensuring continuous and reliable system operation.
Researchers have also explored hybrid approaches combining ANN with other techniques [22,23] or alternative artificial intelligence models like fuzzy logic [5,24] and support vector machines [6,25,26]. Recent research comparing statistical, machine learning, and deep learning models for European financial and cryptocurrency markets found that hybrid approaches generally outperform traditional and non-parametric methods, offering promising though moderate forecasting accuracy [27]. Zeng and Chen [28] used RVGWL (rising visibility graphs and the Weisfeiler–Lehman subtree kernel) method to transform stock time series into graph structures, enabling probabilistic trend forecasting through structural similarity. Machine learning and deep learning techniques are innovative methods to analyze financial trends and market behavior [29]. Phuoc et.al. [30] used Long Short-Term Memory (LSTM) algorithm and the corresponding technical analysis indicators. Khansama et.al. [31] have developed some kind of Fused Attention model which integrates Random, Global, and Sparse Attention mechanisms and applied it to stock market trend prediction across several indices using thirteen technical indicators. Besides all new machine learning methods, multi-layer perceptron ANN with backpropagation algorithm is still very applicable nowadays, as can be seen in recent literature [32].
Stock index prediction models have been applied to multiple markets, including the Athens Stock Exchange [33], Belgium Bel 20 [34], Brazil [35], Canada [18], Indian NIFTY [32,36], Istanbul ISE-100 [6,12,13,37], Johannesburg [8], Korea [7], Madrid [14,26], NYSE [15,16,24,33], S&P 500 [23,38], Shanghai [39], Serbia [40,41,42,43], Taiwan [2,44], Tokyo TOPIX [17] and Vietnam [30].
To date, there is limited research on the Belgrade Stock Exchange. Ralević et al. [40] applied a fuzzy model to predict individual stock prices, but not the direction of BELEX15 index movements. Petrovic [41] applied ARIMA method for forecasting Belex15 Index and showed good statistical suitability, although a higher RMSE (Root Mean Square Error) compared to neural networks. Jaksic et.al. [42] used Winter’s additive and Winter’s multiplicative method to perform the analysis and the forecasting of BELEXline and BELEX15 future values. Zivkovic [43] proved high potential of ARIMA model for short-term forecast when it comes to Belgrade Stock Exchange indices. This study presents the first ANN-based model predicting BELEX15 next day index direction.
2. Materials and Methods
2.1. Research Data and Features
This section describes the volume and origin of the research data and the selection of useful indicators and features for accurate prediction.
2.1.1. Data Overview
This study utilizes daily data from the BELEX15 Index, the primary stock market index of the Belgrade Stock Exchange. The dataset spans the period from January 9, 2006, to December 31, 2024, encompassing a total of 4,845 trading days, during 19 years of trading. The target variable is the direction of daily closing price movement, classified as either an increase (or no change) or a decrease. Out of the total cases, 2,480 instances correspond to upward or stable movements, while 2,365 instances reflect downward movements. Table 1 presents the annual distribution of daily upward and downward movements in the observed period, revealing an overall balanced dataset with 51.2% upward/stable cases and 48.8% downward cases. The 2008 global financial crisis produced a marked negative bias (34.6% increases vs. 65.4% decreases), while the following years until 2012 also reflected a slight dominance of downward movements. From 2013 onward, the distribution stabilizes around parity, with 2020 showing an exact 50:50 split during the COVID-19 crisis. In contrast, the most recent period (2021–2024) demonstrates a persistent positive bias, culminating in 2024 with 59.4% increases, the highest share since 2006. These results suggest that while the dataset is suitable for classification tasks without major imbalance adjustments, temporal dynamics and regime shifts, particularly during crisis and recovery periods, should be considered in predictive modeling.
Several subsets were derived from the full dataset to facilitate model development and evaluation. The first subset, referred to as the parameter-setting data set, comprised approximately 20% of all cases, selected randomly. This subset was used in preliminary experiments to identify efficient ANN parameter values. Following this, the predictive performance of multiple ANN models was assessed using the full dataset. For these experiments, the data were randomly partitioned into training (~70%), validation (~15%), and test (~15%) subsets, maintaining the balance between increasing and decreasing cases. To enhance robustness, stratified random sampling and repeated trials under multiple partitions were applied, providing more reliable performance estimates than a single split.
The values of BELEX15 Index are calculated and published daily on the web site of the Belgrade Stock Exchange [45]. Following historical indicators are available among others: value at opening, daily max and min values, closing value, turnover, as well as a relative change compared with closing value from the previous day.
Many fund managers and investors in the stock markets generally accept certain criteria for technical indicators as the signal of future market trends [25]. The criteria selection as a starting step, significantly determines the direction of research. The previous studies hypothesized that various technical indicators may be used as input variables in the construction of the prediction models to forecast the direction of movement of the stock price index [2].
2.1.2. Feature Selection
Eleven technical indicators were selected as ANN inputs based on prior studies and expert judgment [6,7,13,25] (Table 2). Sagaceta-Mejía et.al. [46] show that a good selection of features can improve the efficiency of the computational resources while attaining similar or even better prediction results. Indicators include moving averages, volume weighted average price - VWAP, momentum, stochastic oscillators, relative strength index - RSI, moving average convergence/divergence - MACD, accumulation/distribution (A/D) oscillator, and commodity channel index - CCI. These indicators capture critical aspects of market behavior, including price trends, momentum, volatility, and trading volume dynamics. Input values were scaled to the range [-1, 1] to normalize features and avoid dominance of larger values. Features with only positive values were scaled to [0, 1], while features with negative and positive values preserved their sign during scaling (Eq. 1).
Several modifications were introduced in the feature selection procedure compared to commonly used technical indicators. First, moving average–based features were evaluated in two ways. Our experiments indicated that simple moving averages are more suitable for predicting exact stock index values, whereas the ratio of the closing price to the moving average (first three features in Table 2) improves performance when predicting only the direction of movement. Second, the volume-weighted average price (VWAP), often neglected in previous studies, provides critical information by incorporating turnover data, which enhances predictive accuracy (third feature in Table 2).
Momentum indicators were included for both short-term (2-day) and long-term (10-day) periods to capture variations over different time horizons. Additionally, redundant features were avoided: many prior studies [6,7] unnecessarily include Larry Williams %R alongside Stochastic %K, although the former is merely an inverted form of the latter. The set of technical indicators in this study was therefore carefully selected to optimize predictive performance, balancing relevance, diversity, and non-redundancy.
2.1.3. Target Values
Second component of the training data set is the target values, representing the variable the ANN model is trained to predict. During preliminary parameter-setting experiments, several encoding variants were evaluated. The first variant, commonly adopted in prior studies [6,7], categorizes the daily change in the stock price index as “0” or “1”, where “0” indicates that the following day’s index is lower than the current day’s, and “1” indicates that the index is higher than or equal to the current day’s value. The second variant employs “-1” and “1” categories, which demonstrated superior predictability compared to the first variant. The most effective approach identified during the parameter-setting phase was to use the relative daily price change in percentage as the target. In this formulation, the ANN is trained to predict the magnitude of the next day’s change, rather than merely its direction.
Using historical data, summary statistics were computed for the selected indicators (prior to scaling) and for the target values, as presented in Table 3. These values are subsequently linearly scaled to the range [-1, 1], while preserving the original sign of each feature. Features with exclusively positive values (features 1, 2, 3, 6, 7, and 8 in Table 3) were scaled to the range [0, 1], whereas features containing both positive and negative values were scaled such that negative values remain negative and positive values remain positive. This sign-preserving linear scaling (Eq. 1) ensures that feature magnitudes are comparable while maintaining the inherent directional information. It ensures numerical stability and allows the ANN model to learn effectively across all input dimensions.
2.2. Prediction ANN Model
A two-layer feedforward ANN with sigmoid hidden neurons and a linear output neuron was developed to predict next-day BELEX15 movements. Inputs comprise the eleven technical indicators (Table 2). The hidden layer size was determined empirically, while the output neuron predicts relative price change, subsequently converted into a direction classification by comparing the output with zero threshold. The architecture of the prediction model is depicted in Figure 1.
Two distinct training sets were generated for the parameter-setting experiments. The first set, used for classification tasks, employed discrete target values {−1, 1}, whereas the second set, for regression-based prediction, used the actual percentage change of the next day’s index as the target. The ANN was trained using the backpropagation algorithm, with parameter-setting experiments conducted in three phases:
- Phase 1 – Tested 10 training functions and 7 hidden layer sizes (n) → 140 treatments.
- Phase 2 – Refined search with two best training functions and 20–23 levels of hidden neurons → 86 treatments.
- Phase 3 – Optimized additional parameters (maximum validation failures, initial μ) → 84 treatments.
In the first phase, ten different backpropagation training functions and seven levels of hidden neurons (n) were evaluated for both training sets, resulting in a total of 2×10×7=140 treatments. The best-performing training function, hidden neuron level, and their optimal combination were identified from this phase.
The second phase involved a more refined search. For the classification training set, the two best training functions and twenty levels of hidden neurons (more accurately search) were tested, whereas for the prediction set, the two best training functions and twenty-three levels of hidden neurons were evaluated, yielding a total of 2×20+2×23=86 treatments. All treatments in the first and second phases employed default parameters for the selected training functions.
In the third phase, the optimal combination of training function and number of hidden neurons was adopted. Two additional parameters were empirically tuned: the maximum number of validation failures (max_fails) and the initial value of the adaptive learning rate parameter μ. Twelve levels of max_fails and seven levels of μ were tested, resulting in 12 × 7 = 84 additional treatments. Collectively, all three phases encompassed 140 + 86 + 84 = 310 experimental treatments to optimize the ANN parameters.
Table 4 summarizes the ANN parameters and their respective levels used throughout the parameter-setting experiments. Each combination was evaluated on the training, validation, and test subsets, and prediction accuracy was computed to assess performance. The three parameter combinations yielding the highest average performance across these datasets were selected to train the final ANN models using the entire dataset.
3. Results
3.1. Parameter Setting Experiments
The parameter-setting experiments were conducted in three consecutive phases, testing a total of 310 parameter combinations. For each combination, the average performance across the training, validation, and test datasets was calculated, ranging from 61.79% to 90.85%. From this analysis, the three parameter combinations exhibiting the highest average performance were selected for further evaluation on the entire dataset. The best-performing combinations, along with their corresponding performances, are summarized in Table 5. Notably, the Levenberg-Marquardt backpropagation function consistently achieved the highest performance across all three top parameter combinations.
Training on the entire dataset showed similar performance for all three combinations, with the second combination achieving the highest test accuracy (71.39%) and is therefore selected as the optimal configuration for the proposed ANN model (Table 6).
3.2. Comparison with Other Models
The predictive performance of the proposed model was further evaluated against existing studies from different stock markets. It is important to note that the accuracy of a model may vary significantly across different markets due to differences in market structure, liquidity, and investor behavior.
Several representative studies include:
- Zhang et al. [39] applied an ANN to predict stock price directions in the Shanghai Stock Exchange.
- Kim and Han [7] developed an ANN with genetic algorithm–based feature discretization (GAFD) and compared it with standard backpropagation (BPLT) and conventional GA (GALT) for predicting the Korea stock index.
- Lendasse et al. [34] used a radial basis function network (RBFN) to forecast the Belgium Bel 20 index.
- Lin et al. [22] compared four models (regression, GARCH-M, ANN, and neuro-fuzzy) for next-day direction prediction across various markets.
- Atsalakis and Valavanis [33] proposed ANFIS (adaptive neuro fuzzy inference system) for ASE and NYSE index forecasting.
- Kara et al. [6] achieved the highest reported accuracy (75.74%) for the ISE-100 index using a backpropagation ANN.
Table 7 summarizes the best results of these studies for reference (sorted alphabetically by the author). Since Kara et al. [6] claimed best prediction performances; authors have reproduced their ANN model and applied it on BELEX15 index for the sake of the comparison on the same market.
Among the 19 models considered, Kara et al. [6] reported the highest accuracy (75.74%) for the ISE-100 index. This model, a backpropagation ANN with 90 sigmoid hidden neurons and 10 scaled technical indicators (one linear output neuron for classification in set of {0, 1}, trained in 6000 epochs), achieved excellent results on the Turkish market but performed poorly when applied to the BELEX15 Index, achieving only 47.80% accuracy. In contrast, the ANN proposed in this study attained 71.39% accuracy on BELEX15, representing the highest reported predictive performance for this market. To the authors’ knowledge, this is the first ANN model capable of successfully predicting the direction of BELEX15 Index movements, highlighting its superior market-specific performance.
4. Discussion and Conclusions
Forecasting stock market index movements remains complex but critical, providing actionable insights for trading. In this study, an ANN–based model was developed to predict next-day movements of the BELEX15 Index using daily historical data from 2006 to 2024. The proposed model achieved a prediction accuracy of 71.39%, outperforming most comparable soft-computing approaches and representing the first market-specific model for BELEX15 direction prediction.
While eleven technical indicators proved effective, incorporating macroeconomic variables such as exchange rates, interest rates, and inflation could further improve predictive performance. These findings demonstrate the robustness and utility of ANN-based forecasting in emerging markets, offering valuable guidance for designing effective trading strategies.
Funding
This research received no external funding.
Data Availability Statement
Data is available.
Conflicts of Interest
The authors declare no conflicts of interest.
Abbreviations
The following abbreviations are used in this manuscript:
| A/D | Accumulation/distribution |
| ANFIS | Adaptive neuro fuzzy inference system |
| ANN | Artificial neural network |
| CCI | Commodity channel index |
| GAFD | Genetic algorithm–based feature discretization |
| LSTM | Long short-term memory |
| MA | Moving average |
| MACD | Moving average convergence/divergence |
| RBFN | Radial basis function network |
| RMSE | Root mean square error |
| RSI | Relative strength index |
| RVGWL | Rising visibility graphs and the Weisfeiler–Lehman subtree kernel |
| SVM | Support vector machines |
| VWAP | Volume weighted average price |
References
- Akinrinola, O.; Addy, W.A.; Ajayi-Nifise, A.O.; Odeyemi, O.; Falaiye, T. Predicting stock market movements using neural networks: A review and application study. GSC Advanced Research and Reviews 2024, 18, 297–311. [Google Scholar] [CrossRef]
- Chen, A.S.; Leung, M.T.; Daouk, H. Application of neural networks to an emerging financial market: Forecasting and trading the Taiwan Stock Index. Computers & Operations Research 2003, 30, 901–923. [Google Scholar] [CrossRef]
- Mienye, E.; Jere, N.; Obaido, G.; Mienye, I.D.; Aruleba, K. Deep Learning in Finance: A Survey of Applications and Techniques. AI 2024, 5, 2066–2091. [Google Scholar] [CrossRef]
- Black, F. The trouble with econometrics models. Financial Analysis Journal 1982, 38, 29–37. [Google Scholar] [CrossRef]
- Dourra, H.; Siy, P. Investment using technical analysis and fuzzy logic. Fuzzy Sets and Systems 2002, 127, 221–240. [Google Scholar] [CrossRef]
- Kara, Y.; Boyacioglu, M.A.; Baykan, O.K. Predicting direction of stock price index movement using artificial neural networks and support vector machines: The sample of the Istanbul Stock Exchange. Expert Systems with Applications 2011, 38, 5311–5319. [Google Scholar] [CrossRef]
- Kim, K.-J.; Han, I. Genetic algorithms approach to feature discretization in artificial neural networks for the prediction of stock price index. Expert Systems with Applications 2000, 19, 125–132. [Google Scholar] [CrossRef]
- Maingo, I.; Ravele, T.; Sigauke, C. Volatility Modelling of the Johannesburg Stock Exchange All Share Index Using the Family GARCH Model. Forecasting 2025, 7, 16. [Google Scholar] [CrossRef]
- Sermpinis, G.; Theofilatos, K.; Karathanasopoulos, A.; Georgopoulos, E.F.; Dunis, C. Forecasting foreign exchange rates with adaptive neural networks using radial-basis functions and Particle Swarm Optimization. European Journal of Operational Research 2013, 225, 528–540. [Google Scholar] [CrossRef]
- Sevim, C.; Oztekin, A.; Bali, O.; Gumus, S.; Guresen, E. Developing an early warning system to predict currency crises. European Journal of Operational Research 2014, 237, 1095–1104. [Google Scholar] [CrossRef]
- Awad, A.L.; Elkaffas, S.M.; Fakhr, M.W. Stock Market Prediction Using Deep Reinforcement Learning. Appl. Syst. Innov. 2023, 6, 106. [Google Scholar] [CrossRef]
- Avci, E. Forecasting daily and sessional returns of the ISE-100 index with neural network models. Journal of Dogus University 2011, 8, 128–142. [Google Scholar] [CrossRef]
- Diler, A.I. Predicting direction of ISE national-100 index with back propagation trained neural network. Journal of Istanbul Stock Exchange 2003, 7, 65–81. [Google Scholar]
- Fernandez-Rodriguez, F.; Gonzalez-Martel, C.; Sosvilla-Rivebo, S. On the profitability of technical trading rules based on artificial neural networks: Evidence from the Madrid stock market. Economics Letters 2000, 69, 89–94. [Google Scholar] [CrossRef]
- Halliday, R.J. Equity trend prediction with neural networks: An Empirical Analysis. Master Thesis, Massey University, Albany, New Zeland, 2012. [Google Scholar]
- Harvey, C.R.; Travens, K.E.; Costa, M.J. Forecasting emerging market returns using neural networks. Emerging Markets Quarterly 2000, 4, 43–55. [Google Scholar]
- Kimoto, T.; Asakawa, K.; Yoda, M.; Takeoka, M. Stock market prediction system with modular neural networks. In Proceedings of the 1990 IJCNN International Joint Conference on Neural Networks, San Diego, California, 17-21 June 1990. [Google Scholar] [CrossRef]
- Olson, D.; Mossman, C. Neural network forecasts of Canadian stock returns using accounting ratios. International Journal of Forecasting 2003, 19, 453–465. [Google Scholar] [CrossRef]
- García-Magariño, I.; Bravo-Agapito, J.; Lacuesta, R. Cybersecure XAI Algorithm for Generating Recommendations Based on Financial Fundamentals Using DeepSeek. AI 2025, 6, 95. [Google Scholar] [CrossRef]
- Atsalakis, G.S.; Valavanis, K.P. Surveying stock market forecasting techniques – Part II: Soft computing methods. Expert Systems with Applications 2009, 36, 5932–5941. [Google Scholar] [CrossRef]
- Kristensen, T.S.; Sognefest, A.H. Can Artificial Neural Networks Be Used to Predict Bitcoin Data? Automation 2023, 4, 232–245. [Google Scholar] [CrossRef]
- Lin, C.-S.; Khan, H.A.; Huang, C.-C. Can the neuro fuzzy model predict stock indexes better than its rivals? CIRJE F-Series CIRJE-F-165, CIRJE, Faculty of Economics, University of Tokyo, 2002.
- Yudong, Z.; Lenan, W. Stock market prediction of S&P 500 via combination of improved BCO approach and BP neural network. Expert Systems with Applications 2009, 36, 8849–8854. [Google Scholar] [CrossRef]
- Doeksen, B.; Abraham, A.; Thomas, J.; Paprzycki, M. Real stock trading using soft computing models. In Proceedings of the Int. Conf. on Information Technology: Coding and Computing ITCC 2, Las Vegas, NV, USA, 04-06 April 2005. [Google Scholar] [CrossRef]
- Kim, K.-j. Financial time series forecasting using support vector machines. Neurocomputing 2003, 55, 307–319. [Google Scholar] [CrossRef]
- Perez-Cruz, F.; Alfonso-Rodriguez, J.-A.; Giner, J. Estimating GARCH models using support vector machines. Quantitative Finance 2003, 3, 163–172. [Google Scholar] [CrossRef]
- Ampountolas, A. Comparative Analysis of Machine Learning, Hybrid, and Deep Learning Forecasting Models: Evidence from European Financial Markets and Bitcoins. Forecasting 2023, 5, 472–486. [Google Scholar] [CrossRef]
- Zeng, Z.; Chen, Y. Identifying and Forecasting Recurrently Emerging Stock Trend Structures via Rising Visibility Graphs. Forecasting 2025, 7, 26. [Google Scholar] [CrossRef]
- Saberironaghi, M.; Ren, J.; Saberironaghi, A. Stock market prediction using machine learning and deep learning techniques: A review. Applied Mathematics 2025, 5, 76. [Google Scholar] [CrossRef]
- Phuoc, T.; Anh, P.T.K.; Tam, P.H.; Nguyen, C.V. Applying machine learning algorithms to predict the stock price trend in the stock market – The case of Vietnam. Humanities and Social Sciences Communications 2024, 11, 393. [Google Scholar] [CrossRef]
- Khansama, R.R.; Priyadarshini, R.; Nanda, S.K.; Barik, R.K.; Saikia, M.J. SGR-Net: A Synergistic Attention Network for Robust Stock Market Forecasting. Forecasting 2025, 7, 50. [Google Scholar] [CrossRef]
- Jayaraman, G.; Azad, I.; Ahmed, H.M.S.; Khan, M.S.; Hussein, M. Revolutionizing stock market predictions in emerging markets: An in-depth examination of multilayer perceptron artificial neural networks empowered by technical indicators on the NIFTY IT Index. SSRN, 2024. [CrossRef]
- Atsalakis, G.S.; Valavanis, K.P. Forecasting stock market short-term trends using a neuro-fuzzy based methodology. Expert Systems with Applications 2009, 36, 10696–10707. [Google Scholar] [CrossRef]
- Lendasse, A.; de Bodt, E.; Wertz, V.; Verleysen, M. Non-linear financial time series forecasting – Application to the Bel 20 stock market index. European Journal of Economic and Social Systems 2000, 14, 81–91. [Google Scholar] [CrossRef]
- De Oliveira, F.A.; Nobre, C.N.; Zarate, L.E. Applying Artificial Neural Networks to prediction of stock price and improvement of the directional prediction index – Case study of PETR4, Petrobras, Brazil. Expert Systems with Applications 2013, 40, 7596–7606. [Google Scholar] [CrossRef]
- Mishra, R.G.; Sharma, D.; Gadhavi, M.; Pant, S.; Kumar, A. A Deep Reinforcement Learning Framework for Strategic Indian NIFTY 50 Index Trading. AI 2025, 6, 183. [Google Scholar] [CrossRef]
- Altay, E.; Satman, M.H. Stock market forecasting: Artificial neural networks and linear regression comparison in an emerging market. Journal of Financial Management and Analysis 2005, 18, 18–33. [Google Scholar]
- Yongchareon, S. AI-Driven Intelligent Financial Forecasting: A Comparative Study of Advanced Deep Learning Models for Long-Term Stock Market Prediction. Mach. Learn. Knowl. Extr. 2025, 7, 61. [Google Scholar] [CrossRef]
- Zhang, G.; Patuwo, B.E.; Hu, M.Y. Forecasting with artificial neural networks: The state of the art. International Journal of Forecasting 1998, 14, 35–62. [Google Scholar] [CrossRef]
- Ralević, N.M.; Djaković, V.Dj.; Andjelić, G.B.; Kovačević, I.M.; Kiurski, J.S.; Čomić, L.Lj. Fuzzy prediction based on regression models: Evidence from the Belgrade Stock Exchange – Prime market and graphic industry. In Proceedings of the 2011 IEEE Int. Symposium on Intelligent Systems and Informatics (SISY), Subotica, Serbia, 08-10 September 2011. [Google Scholar] [CrossRef]
- Petrović, M. Estimating the movement of BELEX15 index values using the ARIMA model. Journal of Process Management – New Technologies 2020, 8, 1–11. [Google Scholar] [CrossRef]
- Jakšić, M.; Milanović, M.; Stojković, D. Short-term forecasting of BELEXline and BELEX15 movements. Facta Universitatis: Series Economics and Organization 2020, 17, 87–96. [Google Scholar] [CrossRef]
- Zivkovic, A. Forecast of Belex15 and Belexline movement using ARIMA model. Economic Analysis 2022, 55, 90–104. [Google Scholar] [CrossRef]
- Chang, Y.-H.; Huang, C.-W. Utilizing Genetic Algorithms in Conjunction with ANN-Based Stock Valuation Models to Enhance the Optimization of Stock Investment Decisions. AI 2024, 5, 1011–1029. [Google Scholar] [CrossRef]
- Belgrade Stock Exchange – Belex15 historical data. Available online: https://www.belex.rs/eng/trgovanje/indeksi/belex15/istorijski. (accessed on 21-09-2025).
- Sagaceta-Mejía, A.R.; Sánchez-Gutiérrez, M.E.; Fresán-Figueroa, J.A. An intelligent approach for predicting stock market movements in emerging markets using optimized technical indicators and neural networks. Economics 2024, 18, 20220073. [Google Scholar] [CrossRef]
Figure 1.
Architecture of the proposed ANN prediction model.
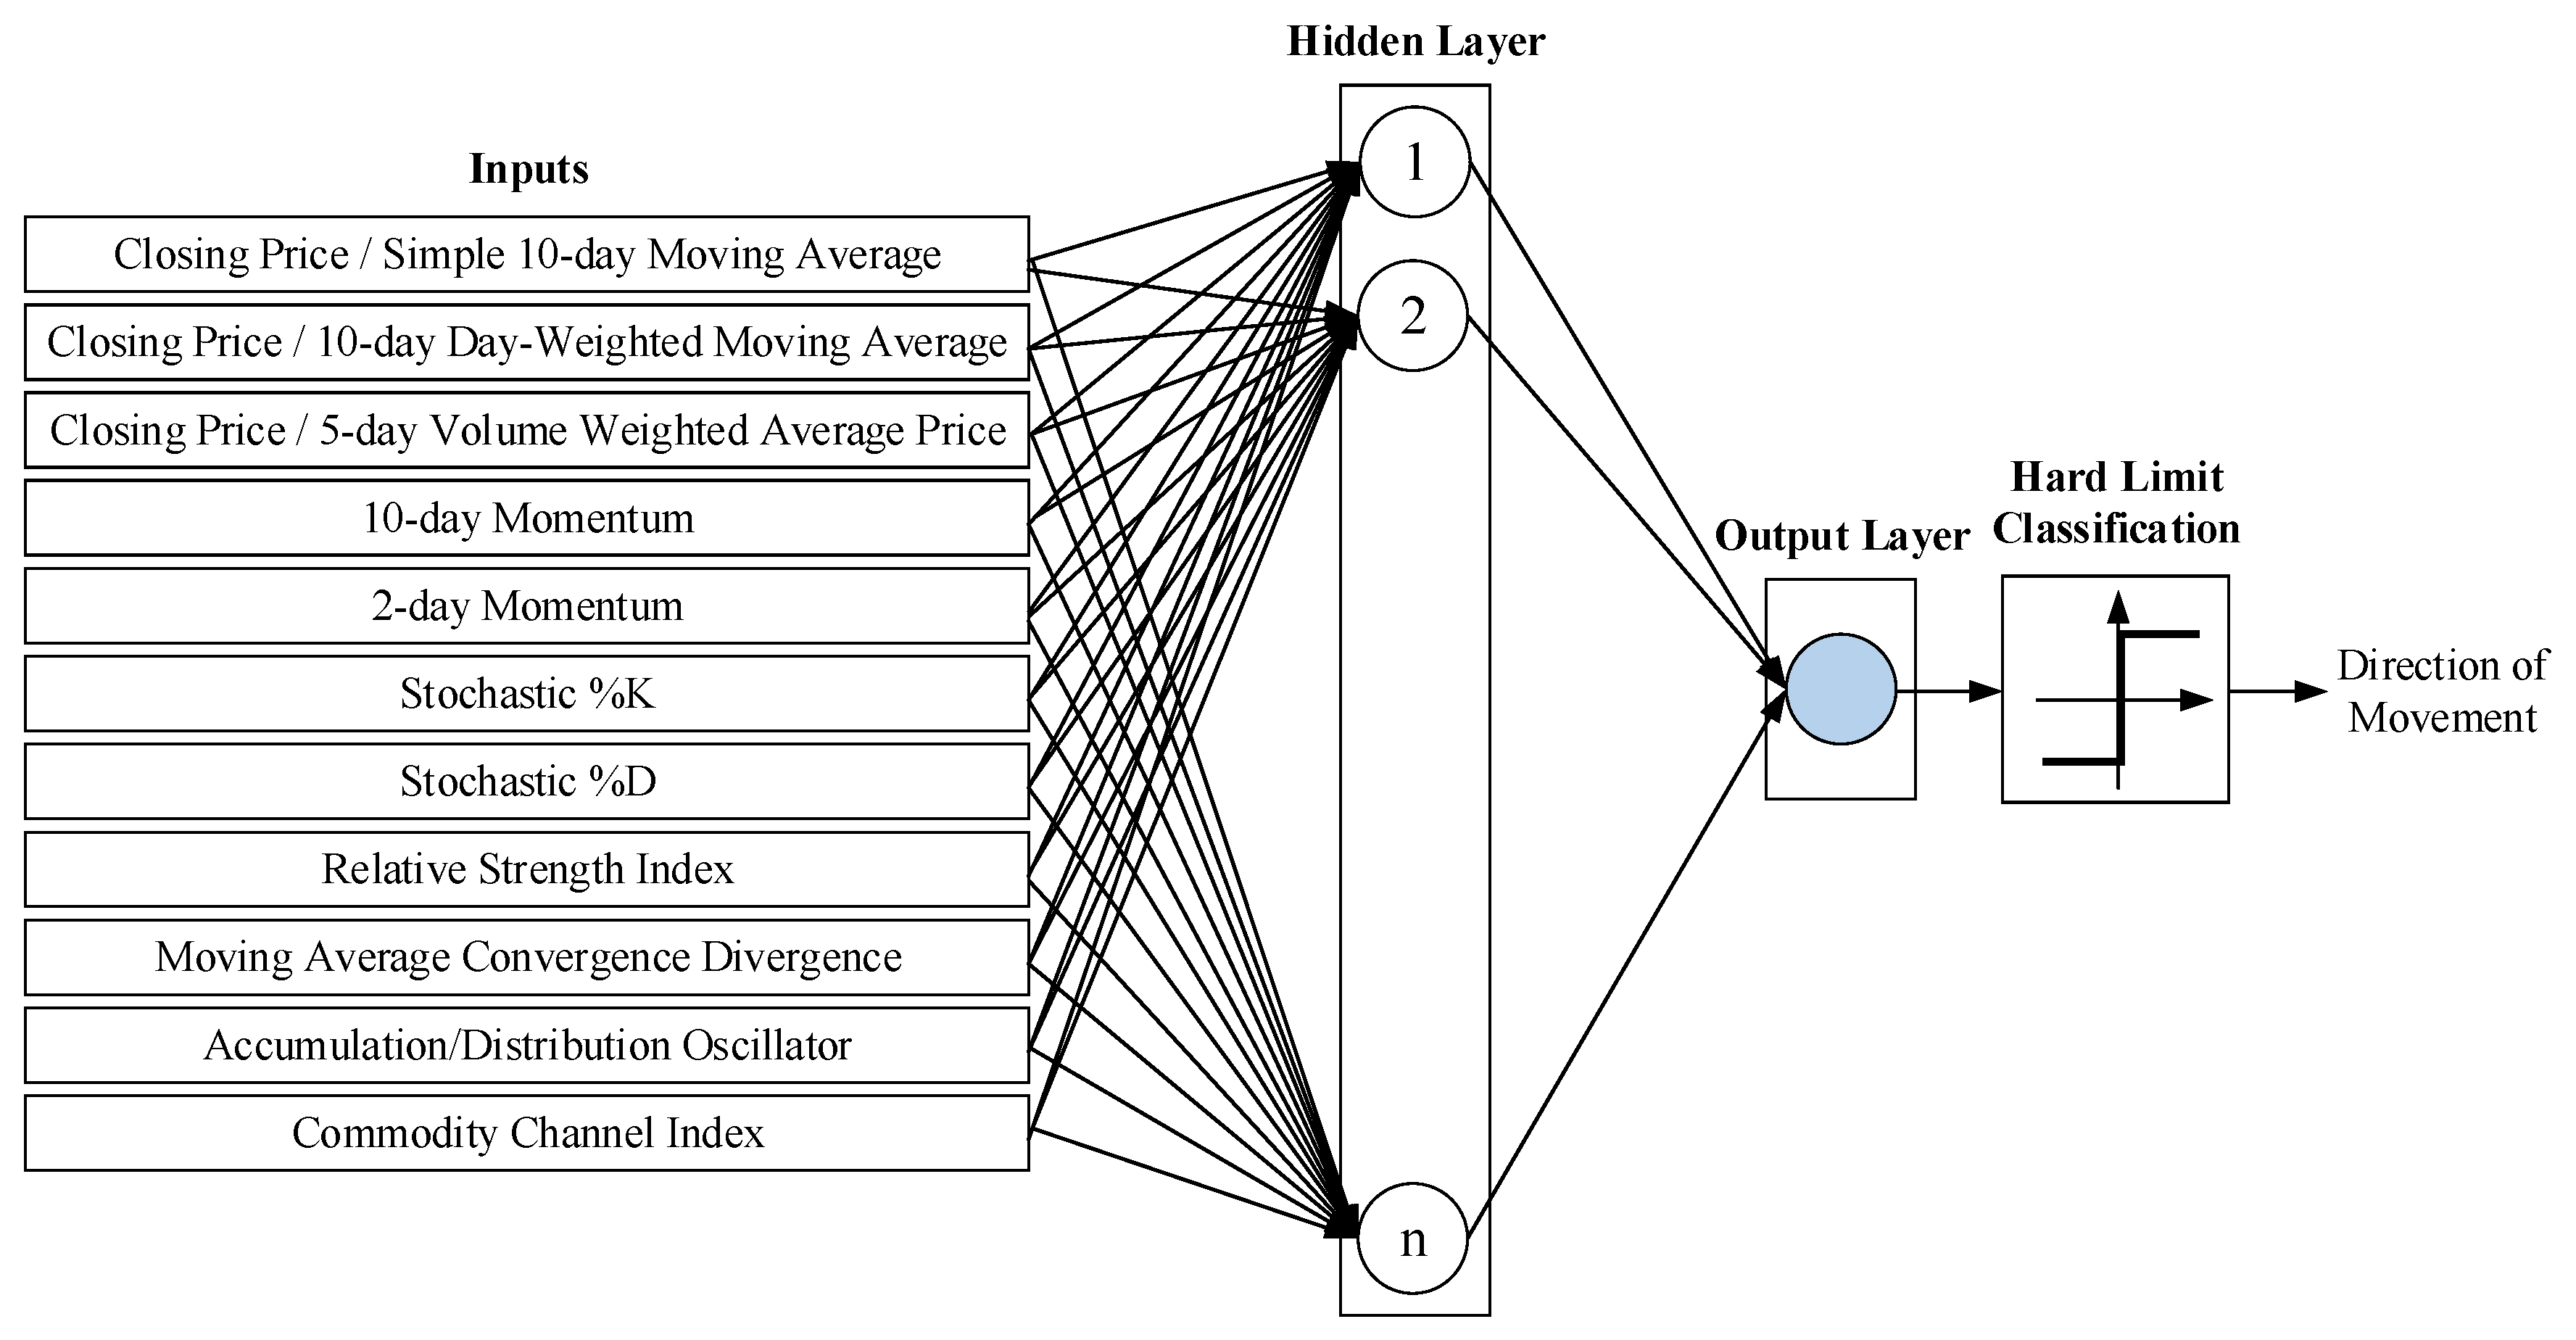

Table 1.
Number of cases per year.
| Year | Increase | % | Decrease | % | Total |
|---|---|---|---|---|---|
| 2006 | 148 | 59.7 | 100 | 40.3 | 248 |
| 2007 | 130 | 51.8 | 121 | 48.2 | 251 |
| 2008 | 88 | 34.6 | 166 | 65.4 | 254 |
| 2009 | 121 | 47.6 | 133 | 52.4 | 254 |
| 2010 | 129 | 51.4 | 122 | 48.6 | 251 |
| 2011 | 121 | 47.8 | 132 | 52.2 | 253 |
| 2012 | 117 | 46.6 | 134 | 53.4 | 251 |
| 2013 | 136 | 54.0 | 116 | 46.0 | 252 |
| 2014 | 133 | 52.8 | 119 | 47.2 | 252 |
| 2015 | 122 | 48.4 | 130 | 51.6 | 252 |
| 2016 | 134 | 53.0 | 119 | 47.0 | 253 |
| 2017 | 129 | 51.2 | 123 | 48.8 | 252 |
| 2018 | 123 | 49.0 | 128 | 51.0 | 251 |
| 2019 | 133 | 52.8 | 119 | 47.2 | 252 |
| 2020 | 126 | 50.0 | 126 | 50.0 | 252 |
| 2021 | 135 | 53.8 | 116 | 46.2 | 251 |
| 2022 | 133 | 53.2 | 117 | 46.8 | 250 |
| 2023 | 133 | 53.6 | 115 | 46.4 | 248 |
| 2024 | 149 | 59.4 | 102 | 40.6 | 251 |
| Total | 2,480 | 51.2 | 2,365 | 48.8 | 4,845 |
Table 2.
Selected technical indicators and their formulas used as input features for the ANN model.
| Name of indicator | Formula |
|---|---|
| Closing price / simple 10-day moving average |
|
| Closing price / day-weighted 10-day moving average |
|
| Closing price / 5-day VWAP (Volume Weighted Average Price) | |
| 10-day momentum rate of change | |
| 2-day momentum rate of change | |
| Stochastic %K | |
| Stochastic %D | |
| RSI (Relative Strength Index) | |
| MACD (Moving Average Convergence Divergence) |
|
| A/D (Accumulation/Distribution) Oscillator | |
| CCI (Commodity Channel Index) |
is the closing price, the volume traded, the upward price change, the downward price change, the highest price, the lowest price at day t; and mean lowest low price and highest high price in the last n days; DIFF: EMA(12)t - EMA(26)t, exponential moving average EMA(k)t: EMA(k)t-1 + α x (Ct - EMA(k)t-1), smoothing factor α: 2/(1+k), k is time period of k-day exponential moving average. Mt: (Ht+Lt+Ct)/3, SMt: ; Dt: .
Table 3.
Summary statistics of the input features and target values prior to scaling.
| Feature | Max | Min | Mean | Standard deviation |
|---|---|---|---|---|
| Ct / simple MA | 1.199 | 0.859 | 1.000 | 0.024 |
| Ct / day-weighted MA | 1.179 | 0.889 | 1.000 | 0.017 |
| Ct / VWAP | 1.237 | 0.892 | 0.999 | 0.015 |
| 10-day momentum | 0.492 | -0.217 | 0.001 | 0.045 |
| 2-day momentum | 0.227 | -0.152 | 0.000 | 0.017 |
| Stochastic %K | 100 | 0 | 48.501 | 30.102 |
| Stochastic %D | 98.229 | 1.243 | 48.508 | 28.263 |
| RSI | 100 | 0 | 48.219 | 23.407 |
| MACD | 230.14 | -147.187 | -1.691 | 39.435 |
| A/D Oscillator | 7.185 | -2.791 | 0.47 | 0.606 |
| CCI | 287.185 | -269.617 | -0.502 | 110.35 |
| Target | 12.93 | -10.29 | 0.009 | 1.083 |
Notes: Ct = closing price at day t; MA = moving average; VWAP = volume-weighted average price. Momentum features correspond to the percentage rate of change over 2-day and 10-day periods. Stochastic %K and %D, RSI, MACD, A/D Oscillator, and CCI are standard technical indicators used to capture market trends, momentum, and volatility. Target values represent the relative daily price change in percentage.
Table 4.
ANN parameter values tested during parameter-setting experiments.
| Parameter | Level |
|---|---|
| Training function | BFGS quasi-Newton, Bayesian regulation, Conjugate gradient with Powell-Beale restarts, Conjugate gradient with Fletcher-Reeves updates, Conjugate gradient with Polak-Ribiére updates, Levenberg-Marquardt, One-step secant, Resilient, Sequential order incremental training with learning functions, Scaled conjugate gradient |
| Hidden neurons (n) | Phase 1: 10, 15, 23, 35, 50, 75, 90 Phase 2 (classification): 40, 45, …, 135 Phase 2 (prediction): 25, 30, …, 135 |
| Initial μ (Phase 3) | 0.0000016, 0.000008, 0.00004, 0.0002, 0.001, 0.005, 0.025 |
| Max validation failures (Phase 3) |
3, 4, 5, 6, 7, 10, 15, 20, 30, 40, 50, 60 |
| Max epochs | 10,000 (Phase 1-2), 20,000 (Phase 3) |
| Minimum performance gradient | 1e-7 |
Table 5.
Best parameter combinations and performance during parameter-setting experiments.
| No | Training function | n | Initial μ | Max Fails | Performance (%) |
|---|---|---|---|---|---|
| 1 | Levenberg-Marquardt | 60 | 0.001 | 6 | 90.85 |
| 2 | Levenberg-Marquardt | 60 | 0.005 | 7 | 90.05 |
| 3 | Levenberg-Marquardt | 80 | 0.001 | 6 | 89.65 |
Table 6.
ANN performance (%) on entire dataset.
| Parameter Combination (n; Initial μ; Max Fails) | Train (%) | Validation (%) | Test (%) |
|---|---|---|---|
| (60; 0.001; 6) | 68.28 | 66.10 | 70.60 |
| (60; 0.005; 7) | 71.23 | 69.01 | 71.39 |
| (80; 0.001; 6) | 76.06 | 65.30 | 70.60 |
Table 7.
Comparison of predictive models.
| Author(s) | Market (Index) | Model | Performance (%) |
|---|---|---|---|
| Altay and Satman, 2005 [37] | ISE 100 | BPN | 57.8 |
| Atsalakis and Valavanis, 2009 [33] | ASE & NYSE | ANFIS | 68.33 1 |
| Diler, 2003 [13] | ISE 100 | BPN | 60.81 |
| Doeksen et al., 2005 [24] | NYSE | M-FIS | 53.31 |
| TS-FIS | 56 | ||
| Fernandez-Rodriguez et al., 2000 [14] | Madrid | ANN | 58 |
| Halliday, 2004 [15] | NYSE | ANN | 55.57 |
| Harvey et al., 2000 [16] | NYSE | ANN | 59 |
| Kara et al., 2011 [6] | ISE 100 | BPN | 75.74 |
| Kim and Han, 2000 [7] | Korea | ANN BPLT | 51.81 |
| ANN GALT | 50.6 | ||
| ANN GAFD | 61.7 | ||
| Lendasse et al., 2000 [34] | Belgium Bel 20 | RBFN | 57.2 |
| Lin et al., 2002 [22] | Various | Regression | 52.47 |
| Garch_M | 52.83 | ||
| ANN | 55.77 | ||
| Neuro-fuzzy | 58.03 | ||
| Perez-Cruz et al., 2003 [26] | Madrid | SVM | 57 |
| Zhang et al., 1998 [39] | Shanghai | ANN | 56.3 |
| Kara et al. (comparison) | BELEX15 | BPN | 47.8 |
| Proposed model | BELEX15 | ANN | 71.39 |
1 Accuracy obtained only for a specific three-month period.
Disclaimer/Publisher’s Note: The statements, opinions and data contained in all publications are solely those of the individual author(s) and contributor(s) and not of MDPI and/or the editor(s). MDPI and/or the editor(s) disclaim responsibility for any injury to people or property resulting from any ideas, methods, instructions or products referred to in the content. |
© 2025 by the authors. Licensee MDPI, Basel, Switzerland. This article is an open access article distributed under the terms and conditions of the Creative Commons Attribution (CC BY) license (http://creativecommons.org/licenses/by/4.0/).
Copyright: This open access article is published under a Creative Commons CC BY 4.0 license, which permit the free download, distribution, and reuse, provided that the author and preprint are cited in any reuse.


