Submitted:
23 September 2025
Posted:
24 September 2025
You are already at the latest version
Abstract
This study addresses the reliance on empirical methods in the structural analysis of hinged prefabricated frame beam (HPFM) structures by proposing a theoretically rigorous analytical framework based on the Winkler foundation model. The proposed analytical framework comprises three main steps: (a) The HPFB structure is discretized into individual beam segments supported on a Winkler foundation, based on the locations of anchorage points and hinge connections; (b) A system of linear equations is formulated using static equilibrium and deformation compatibility conditions at both anchorage points and hinge joints. Solving this system yields the distribution of concentrated loads—applied perpendicular to the slope surface at anchorage points—among horizontal and longitudinal beam segments of the cross beams, and simultaneously determines the shear forces transferred through hinge joints to adjacent beam ends; and (c) The deflection and internal forces for each Winkler-supported beam segment are evaluated using the computed loads and beam-end shear forces obtained in the previous step. To evaluate the validity and practical applicability of the proposed framework, a simplified HPFB structure was analyzed in terms of load distribution, beam-end shear forces, deflections, and internal forces. The results were compared with those from a traditional frame beam (TFB) structure under identical conditions to assess differences in mechanical behavior between the two structures. Deformation analysis at both the anchorage points and hinge joints indicates that the proposed analytical framework inherently satisfies deformation compatibility conditions at the anchorage points and hinge joints. Consequently, the results demonstrate improved accuracy compared to those derived from empirical methods. Comparative analysis reveals that, relative to the TFB structure, the HPFB structure exhibits larger deflections near the beam ends and smaller deflections in regions farther away from the beam ends, along with a reduced maximum negative bending moment, an increased maximum positive bending moment, and lower maximum shear forces. These results suggest that the HPFB structure offers improved mechanical performance. A sensitivity analysis was further performed to quantify the influence of the subgrade reaction coefficient on the mechanical behavior of the HPFB structure. As the subgrade reaction coefficient increases multiplicatively, the concentrated loads allocated to the shorter horizontal beam segments and their corresponding beam-end shear forces exhibit a progressive increase. Conversely, the loads assigned to the longer longitudinal beam segments and the associated beam-end shear forces demonstrate a consistent decrease.Variations in beam loading induced by a multiplicative increase in the subgrade reaction coefficient significantly influence beam deflection, yet exert only a minimal effect on both the bending moment and shear force. Consequently, the proposed analytical framework establishes a robust theoretical foundation for the rational design of HPFB structures, diminishing the dependency on empirical approaches and enhancing the reliability of structural performance predictions.
Keywords:
Hinged prefabricated frame beam (HPFB)
; Traditional frame beam (TFB)
; structural mechanical analysis
; load‐transfer mechanism
; Winkler foundation model
; retaining structure
; analytical framework
; sensitivity analysis
; slope engineering
1. Introduction
The frame beam (also known as grid beam or lattice beam) slope anchoring system has evolved in China over the past forty years alongside developments in retaining structure technology [1,2,3,4,5]. This system comprises a network of reinforced concrete beams constructed on the slope surface, arranged in horizontal and vertical directions with typical spacing not exceeding 4.0 m [6]. Each intersection point is anchored using either a bolt or a cable (see Figure 1). Compared to bolt-supported frame beams, the cable-supported system exhibits superior performance in reinforcing high and steep slopes and in mitigating landslide risks. This enhancement stems from the capacity to apply substantial prestress via anchor cables at the beam intersections (termed anchorage points), which facilitates active stabilization, enables effective deformation control, modifies the slope stress field, and improves overall slope stability. Similar to bolt-supported systems, the construction of cable-supported frame beam slope anchoring structures follows a sequential process, which includes trimming the slope surface, drilling anchor holes and installing anchors, erecting beam formwork and reinforcement cages, pouring concrete, and subsequent curing. This extended procedure leaves the slope temporarily unsupported for a long time, raising potential instability risks during construction. Slope instability induced by excavation unloading [7,8,9], rainfall infiltration [10,11,12], mechanical vibrations [13,14], groundwater fluctuations [15,16], or other triggering factors [17,18] poses a widespread challenge in geotechnical engineering worldwide. Such failures, particularly those occurring during construction, can lead to severe consequences, including human casualties, significant economic losses, project delays, and substantial cost overruns. Research on preventive measures to mitigate construction-related slope instability remains a critical and ongoing focus within the field of geotechnical and slope engineering.
From a construction management perspective, schedule compression serves as a fundamental strategy for mitigating slope instability risks during earthwork and structural activities. For frame beam anchoring systems, the extended curing period of cast-in-place concrete constitutes a critical path activity that directly constrains project duration. Minimizing or eliminating the curing period can significantly accelerate the construction schedule, enabling earlier surface protection and load transfer to the anchors. This, in turn, enhances slope stability at an earlier stage. Consequently, replacing traditional cast-in-place frame beams with prefabricated beam elements offers an innovative construction approach that merits thorough technical and economic evaluation. Following the installation of anchor cables, prefabricated beam elements are systematically assembled on the slope surface. Prestresses are then applied to the anchor cables at the designated anchor points, compressing the beams firmly against the slope surface and thereby enhancing overall stability. In response to the potential benefits of this construction method—including reduced on-site duration and improved quality control—researchers worldwide have developed a variety of prefabricated frame beam configurations and numerous connection techniques to facilitate the assembly of these modular elements. Emerging as early as the 1980s, Japan pioneered the use of a prestressed precast reinforced concrete(RC) crossbeam structure for slope stabilization [19,20]. This system employed prestressed anchor cables installed at the intersections of prefabricated beams, with multiple crossbeams distributed across the slope surface to form a decentralized reinforcement mechanism. The technology was subsequently adopted and applied in the Taiwan region of China [21]. However, at that time, the widespread adoption of the prestressed precast RC crossbeam system—originally developed in Japan—was hindered in mainland China by factors such as limited mechanization and constraints in construction technology. In recent years, China has made significant progress in the development of prefabricated frame beam structures. These systems expand upon the original concept of precast RC crossbeam by incorporating additional straight beams, thereby enhancing both structural integrity and adaptability. Qin et al.[22] investigated the mechanical behavior of prefabricated frame beams, composed of prefabricated crossbeams and straight beams with disconnected ends, using an integrated methodology that combined analytical modeling, field testing, and numerical simulation. Their results provide valuable insights for the design of prefabricated frame structures with variable cross-sections. In a related study, Dai et al. [23]employed both field experiments and numerical simulations to analyze the contact pressure and internal forces in frame beams constructed from prefabricated crossbeams and straight beams, considering both unconnected ends and wet rigid connections. A comparative analysis was performed between the responses of these prefabricated systems and those of conventional cast-in-situ frame beams. The outcomes of this work offer practical guidance for the design and implementation of slope anchoring techniques using prefabricated frame beam structures. Seeking an optimal balance between non-connected and rigid wet connections for prefabricated frame beam systems, Zhang et al. [24] introduced hinges to connect the ends of prefabricated crossbeams and straight beams, thereby proposing a novel hinged prefabricated frame beam (HPFB) slope anchoring system. As illustrated in Figure 2, the slope reinforcement system is implemented through a sequential construction procedure: (1) boreholes are drilled from designated locations on the prepared slope surface into the stable underlying stratum, and prestressed anchor cables are installed; (2) prefabricated cross beams and straight beams are positioned on the slope surface and interconnected with pins; and (3) the anchor cables are prestressed and subsequently locked at the nodal intersections of the beam network.
Based on research and monitoring data from a slope reinforcement project in Guizhou Province, China, Zhang et al. [24] concluded that the HPFB system demonstrates comprehensive advantages over the existing TFB system in terms of construction period, personnel and machinery, safety management, economic cost, Co2 emissions, and supporting effects. Building upon this foundational work, Zhang’s research team [25,26] conducted comprehensive investigations into multiple critical aspects of the HPFB system. Their research encompassed the manufacturing of prefabricated components, construction methodologies for slope anchoring, structural design principles of the frame beams, and detailed performance of the specialized hinge connections. Informed by these studies, the team developed and established the Hunan Provincial Standard Technical specification for the anchoring of hinged assembled frame beam structure [27], providing authoritative guidance for the practical application of this innovative retaining structure.
In the multifaceted research concerning the HPFB system, structural analysis theory holds critical importance, as it directly governs the design of prefabricated components and ensures the long-term stability of reinforced slopes throughout their service life. Analytical approaches for TFB structures typically idealize the vertical component (relative to the slope surface) of the cable prestress at beam intersections as a concentrated load. This load is subsequently distributed to the horizontal and longitudinal beams according to established principles of structural mechanics [28,29]. Under specified external loading conditions, the horizontal and longitudinal beams are then analyzed independently, often employing either the inverted beam method or the theory of beams on elastic foundations. Building upon the structural analysis concepts of TFB structures, the Hunan Provincial Standard [27] recommends applying the inverted beam method for the analysis of HPFB structures. However, recognizing that this method does not account for soil-structure interaction, Zhang et al. [30] proposed an alternative method in which the multi-span continuous horizontal and longitudinal beams with hinged connections are modeled as beams resting on Winkler foundation. Using this model, they compared the mechanical performance of HPFB and TFB structures under identical conditions. Their results indicate that, relative to TFB systems, HPFB structures exhibit larger deflections, comparable shear forces, and reduced bending moments.
In both of the aforementioned methods, the distribution of prestress from anchor cables applied at beam intersections is analyzed by modeling the horizontal and longitudinal beams as infinite or semi-infinite beams on a Winkler foundation. However, this simplification results in a load distribution that does not fully satisfy deformation compatibility conditions at the intersections. Consequently, structural analyses relying on these assumptions are susceptible to substantial inaccuracies, especially in predicting deformation and internal force distributions under complex loading conditions. In response to the inherent limitations of current structural analysis methods for HPFB structures, this study proposes a novel analytical framework based on the Winkler foundation model. The proposed methodology comprises three fundamental phases: (1) structural discretization of the HPFB structure into individual beam segments; (2) determination of applied loads and beam-end shear forces for each segment based on principles of static equilibrium and deformation compatibility; and (3) mechanical analysis of each beam segment under the derived loading and free boundary conditions. To validate the proposed framework, an HPFB structure consisting of four precast crossbeams and four precast straight beams was designed and analyzed. The study investigated load distribution, beam-end shear forces, deformation behavior, and internal force distributions within the beam segments. Comparative assessments were conducted against a TFB structure under identical conditions. Furthermore, a sensitivity analysis was performed to evaluate the influence of the subgrade reaction coefficient on the mechanical response of the HPFB structure.
2. Structural Analysis Framework for HPFB Structures
2.1. Basic Assumptions
To facilitate the analytical treatment of the HPFB as a spatial structure on slope surface, the following fundamental assumptions are introduced:
(1) The self-weight of the prefabricated components and the frictional resistance at the beam-soil interface are neglected;
(2) The component of anchor cable prestress parallel to the slope surface is neglected, whereas the perpendicular component is idealized as a concentrated load applied at the anchorage point and distributed to both the horizontal and longitudinal segments of the cross beam;
(3) The propagation of stresses and deformations through the subgrade is disregarded, and the underlying soil supporting the frame beam structure is idealized as a Winkler elastic foundation;
(4) The interaction of torsional effects between orthogonally oriented beams is neglected. Specifically, it is assumed that bending moments in a beam along one direction do not induce torsional responses in perpendicularly aligned beams; instead, the moment is fully resisted by the beam in which it originates.
2.2. Structural Decomposition
Performing structural analysis of spatial load-bearing structures on slope surfaces using analytical methods remains particularly challenging due to the complex structure-soil interaction, as well as the spatial variability of both loads and boundary conditions.To simplify the analysis, the conventional approach involves decomposing the frame beam—an integrated spatial structure—into a series of horizontal and longitudinal beams. The decomposition of the aforementioned structure inherently entails a corresponding distribution of loads. After determining the concentrated loads applied to the horizontal and longitudinal beams, the deformation and internal forces of each beam can be individually analyzed based on their respective boundary conditions.
In accordance with the structural analysis principles established for the TFB structure, a detailed schematic diagram of the HPFB structure is provided in Figure 3. As shown in the schematic diagram of the HPFB structure in Figure 3, the coordinate system is defined as follows: the x-axis aligns with the strike direction of the slope, the y-axis extends from the slope crest to the toe along the slope surface, and the z-axis is perpendicular to the slope surface, directed inward toward the slope mass. The elements labeled AeaE, GbgB, fCFc, and hdHD represent the prefabricated cross beams installed at the four corners of the system. At their intersection points 1, 2, 3, and 4, four concentrated loads—denoted as F1, F2, F3, and F4—are applied perpendicular to the x-y plane. These loads correspond to the vertical components of the anchor cable prestress applied at these locations. The system also includes four prefabricated straight beams, labeled ab, cd, ef, and gh, which are installed between the cross beams. Each end of these straight beams is connected to the corresponding cross beam via hinged joints, designated as a, b, c, d, e, f, g, and h. The system is initially decomposed at anchorage points 1, 2, 3, and 4 into two horizontal beams (AB and CD) and two longitudinal beams (EF and GH). Concurrently, the concentrated loads F1, F2, F3, and F4 are distributed as follows:
- (1)
- Loads F1x, F2x, F3x, and F4x are allocated to the horizontal beams AB and CD;
- (2)
- Loads F1y, F2y, F3y, and F4y are assigned to the longitudinal beams EF and GH.
Furthermore, the hinged connections at points a, b, c, d, e, f, g, and h are released, and a pair of shear forces—equal in magnitude but opposite in direction—is applied at both ends of each original hinge location. These beam-end shear forces are denoted as Fa, Fb, Fc, Fd, Fe, Ff, Fg, and Fh, respectively. As a result of this decomposition, each horizontal beam (AB and CD) and each longitudinal beam (EF and GH) is further divided into three separate beam segments (see Figure 4).
2.3. Load Distribution and Beam-end Shear Forces Determination
2.3.1. Analysis of Anchorage Points
Taking the prefabricated cross beam AeaE (as shown in Figure 3) as an example, the static equilibrium and deformation compatibility conditions at anchorage point 1 are elaborated in detail.
To distribute the concentrated force F1 at the anchorage point 1 to the horizontal beam segment Aa and the longitudinal beam segment eE respectively, the static equilibrium equation at the anchorage point 1 must first be satisfied:
Furthermore, the horizontal beam segment Aa and the longitudinal beam segment Ee, both resting on Winkler foundation with free boundaries, must also satisfy the deformation compatibility condition at the anchorage point 1.
As illustrated in Figure 4a, the horizontal beam segment Aa is subjected to the concentrated load F1x and the bean-end shear force Fa transmitted from hinge a. Regrettably, both concentrated loads acting on the horizontal beam segment Aa—specifically, the applied force F1x and the beam-end shear force Fa from the hinge a—remain unknown. We may provisionally assume that a unit load of F1x=1 kN is applied independently at point 1 on the horizontal beam segment Aa. Under this condition, the resulting deflection of the beam segment Aa at the anchorage point 1 is denoted as . Subsequently, a unit shear force of Fa = 1 kN is applied independently at the right end “a” of the same beam segment. The corresponding deflection at the anchorage point 1 is denoted as . When the horizontal beam segment Aa is simultaneously subjected to both F1x and Fa , the total deflection at the anchorage point 1 can be expressed using the principle of superposition as:
Similarly, for the longitudinal beam segment Ee, as shown in Figure 4c, the total deflection at the anchorage point 1 under the combined action of two unknown forces F1y and Fe, can be expressed using the principle of superposition as:
Owing to the deformation compatibility requirement at the intersection point 1 of the prefabricated cross beam AeaE, the following equation must be satisfied:
Similarly, the deformation compatibility conditions at the anchorage points of the remaining three prefabricated cross beams (as illustrated in Figure 3) can be analyzed using an analogous procedure.
2.3.2. Analysis of Hinge Points
As established in structural engineering principles, hinged connections between prefabricated components are designed to transmit shear forces while permitting rotational freedom, thereby preventing the transfer of bending moments. Furthermore, deformation compatibility must be ensured at the beam ends on both sides of the hinge to guarantee consistent displacement and rotation under applied loads.
Taking hinge point a of the horizontal beam AB, as shown in Figure 4a, as an example, the deformation compatibility condition is elaborated in detail. On both sides of hinge a are the horizontal beam segments Aa and ab. Owing to structural continuity, the deflections of beam segments Aa and ab at their shared end a must be equal.
Firstly, beam segment Aa is modeled as a beam resting on a Winkler foundation with free boundary conditions. It is subjected to an unknown concentrated load F1x and an unknown beam-end shear force Fa transmitted from hinge a.
When a unit load of F1x = 1 kN is applied independently at anchorage point 1 of beam segment Aa, the resulting deflection at point a is denoted as ;
Similarly, when a unit shear force of Fa = 1 kN is applied independently at point a of the same beam segment, the deflection at point a is denoted as .
Under the combined action of both F1x and Fa, the total deflection at point a of beam segment Aa can be expressed using the principle of superposition as:
Similarly, under the simultaneous action of the two unknown beam-end shear forces Fa and Fb, the total deflection of the horizontal beam segment ab at end a can be expressed using the principle of superposition as:
Owing to the deformation compatibility requirement at hinge a, the deflections of beam segments Aa and ab must be equal at this location:
By following the same procedure, the deformation compatibility equations for the remaining hinged joints of the HPFB structure, as illustrated in Figure 3, can be systematically derived.
2.3.3. Formulation and Solution of a System of Linear Equations
In accordance with the principles established in Sections 2.3.2 and 3.2.3, a system of linear equations for the HPBF structure illustrated in Figure 3 is constructed as follows:
Given that the system consists of 16 linear equations with 16 unknowns, it is determinate and admits a unique solution. However, when the HPFB structure, as illustrated in Figure 3, exhibits symmetry about both the x- and y-axes and is subjected to four equal concentrated loads at the anchorage points, the number of unknowns and equations in Equation (8) can be significantly reduced. It should be emphasized that without predefined classifications of beam segment types (e.g., infinite, semi-infinite, or finite long beams), manual computation of the coefficients in the linear system becomes exceedingly complex and impractical. To address this challenge, the symbolic computation software Mathematica is employed to automate the derivation and solution process [31,32]. For prefabricated components with variable cross-sections, analytical solutions for deflections are generally intractable due to the spatially varying flexural rigidity. In such cases, the Finite Difference Method (FDM) [23] is adopted to numerically compute deflections under unit loads at critical points.
2.4. Analysis of Deformation and Internal Forces for Beam Segments
By solving the system of linear equations developed in Section 2.3.3, the concentrated loads acting on each beam segment and the shear forces transmitted through the hinged joints to the beam ends are determined. Subsequently, under the action of these known loads and free boundary conditions, the deformation and internal forces of each beam segment resting on a Winkler foundation are analyzed individually.
3. Case Study and Results
3.1. Project Overview
To evaluate the validity of the analytical framework proposed in this study and to determine whether the HPFB structure exhibits a more rational structural mechanical response compared to the TFB structure, both structures, as illustrated in Figure 5, were modeled and evaluated under identical conditions.
As shown in Figure 5a, the HPFB structure consists of four precast cross beams and four precast straight beams interconnected via hinges near the beam ends. All prefabricated components are made of C30 concrete and designed as prismatic beams with a constant cross-section of 300 mm×300 mm. The TFB structure, depicted in Figure 5b, is identical in all respects—including material, cross-sectional dimensions, and loading—to the HPFB structure, with the only difference being the absence of hinged connections. A prestress force of 300 kN is applied perpendicular to the x–y plane at each anchorage point (labeled 1 to 4) in both structures.
It is assumed that both structures are supported by a Winkler foundation characterized by a subgrade reaction coefficient of 12000kN/m3. Under identical working conditions, a comparative analysis is first performed between the two structures with respect to load distribution, deflection, and internal forces. Subsequently, a sensitivity analysis of the mechanical response is conducted for the HPFB structure illustrated in Figure 5a, considering subgrade reaction coefficients of 6000kN/m3, 12000kN/m3, and 24000kN/m3, respectively, to investigate the influence of the subgrade reaction coefficient on the mechanical behavior of the HPFB structure.
3.2. Comparative Analysis
3.2.1. Load Distribution and Verification of Deformation Compatibility
For the two frame structures illustrated in Figure 5, two distinct systems of linear equations are formulated and solved: one based on the analytical procedure proposed in this study, and the other following the force method for frame beams developed by Fan et al.[29].
Both structures illustrated in Figure 5 are symmetric with respect to the x- and y-axes, and the concentrated loads acting at the beam intersections (representing the components of cable prestress perpendicular to the x-y plane) are equal in magnitude. Consequently, the following conditions for both structures are satisfied: F1x=F2x=F3x=F4x, F1y=F2y=F3y=F4y.
For the HPFB structure illustrated in Figure 5a, the following conditions are also satisfied: Fa=Fb=Fc=Fd , Fe=Ff=Fg=Fh.
Owing to the structural symmetry and force equivalence, the resulting load distributions and shear forces transmitted from the hinged joints to both ends of the beam segments are simplified and summarized in Table 1.
As indicated in Table 1, for the HPFB structure, the framework proposed in this study allocates a smaller concentrated load to the shorter horizontal beam segment Aa. Consequently, the hinged joint a transmits a correspondingly lower shear force to the end of beam segment Aa. Conversely, a larger concentrated force is assigned to the longer longitudinal beam segment Ee, resulting in the hinged point e transferring a higher shear force to the end of beam segment Ee.
Similar to the TFB structure, a smaller concentrated load is allocated to the shorter beam segment Aa, while a larger concentrated load is assigned to the longer beam segment Ee. The subtle difference in load distribution outcomes between the two structures results primarily from the introduction of hinged connections, which alters the relative stiffness between the beam and the subgrade. Moreover, the formulation and solution of the system of linear equations enable the determination of the shear forces transmitted through the hinges to individual beam segments, thus establishing a theoretical foundation for the design of the hinged connections.
Based on the load distribution results and beam-end shear forces provided in Table 1, and applying the Winkler foundation model, the deflections at the intersection points and hinge joints can be independently calculated for the decomposed beam segments and horizontal/longitudinal beams of the two frame structures illustrated in Figure 5a and Figure 5b. The deflection results for both structures are comprehensively summarized in Table 2.
As shown in Table 2, the deflections at anchorage point 1 of the horizontal beam segment Aa and the longitudinal beam segment Ee in the HPFB structure show complete agreement. Furthermore, the deflection values at hinge joint a for adjacent segments Aa and ab are identical, and the same consistency is observed at hinge joint e for segments Ee and ef. These results confirm that the system of linear equations developed in this study rigorously enforces deformation compatibility, thereby validating the rationality and mechanical consistency of the proposed analytical framework for HPFB structures.
As summarized in Table 2, the deflections at anchorage point 1 of the horizontal beam AB and the longitudinal beam EF intersecting at this location in the TFB structure are also equal. However, the deflection values at this point are slightly smaller than those observed at the corresponding anchorage point 1 in the HPFB structure.
3.2.2. Comparative Analysis of Deflection curves
Based on the load distribution and beam-end shear forces given in Table 1, the deflection curves of both horizontal and longitudinal beams on a Winkler foundation with free boundaries can be obtained for each structural configuration. Given the structural symmetry and equal magnitude of concentrated loads at all anchorage points, only the deflection curves of horizontal beam AB and longitudinal beam EF are presented for each system, with the corresponding results shown in Figure 6 and Figure 7, respectively.
As shown in Figure 6, the horizontal beam AB in the HPFB structure exhibits a clearly defined three-segment deflection distribution pattern, whereas the deflection curve of the corresponding beam in the TFB structure approximates a horizontal line. Specifically, the deflection curves of beam segments Aa and bB exhibit approximately linear distributions with noticeable inclination, while beam segment ab shows a nearly horizontal distribution. The maximum deflections of beam AB in both frame structures occur at the beam ends. Notably, the maximum deflection of horizontal beam AB in the HPFB structure is greater than that in the TFB structure. As the distance from the beam ends increases, the deflection of horizontal beam AB in the HPFB structure gradually decreases. Eventually, within a specific mid-span region, the deflection of the HPFB structure becomes progressively smaller than that of the TFB structure. Overall, compared to beam AB in the TFB structure, the deflection curve of beam AB in the HPFB structure exhibits more pronounced variations.
As shown in Figure 7, the deflection curves of beam EF in both structural systems exhibit distribution characteristics highly consistent with those of horizontal beam AB shown in Figure 6. However, unlike the horizontal beam AB in the TFB structure (see Figure 6), the longitudinal beam EF in the TFB structure demonstrates a pronounced minimum deflection located at the mid-span of the beam.
The observed distinctions in the deflection behavior of the horizontal and longitudinal beams between the two structural configurations, as illustrated in Figure 6 and Figure 7, are primarily attributed to the introduction of hinged connections in the HPFB system. These connections disrupt structural continuity, increase kinematic degrees of freedom, and enhance the stiffness of individual beam segments relative to the subgrade. Consequently, beam segments in the HPFB system—particularly those in peripheral regions—undergo significant rotation about their longitudinal axis under eccentric loading. In contrast, the central beam segments in the in the HPFB structure, subjected to symmetrical loading from both ends, exhibit a response characterized by approximately uniform settlement.
As evidenced by the deflection results of the horizontal and longitudinal beams in Figure 6 and Figure 7, the present findings align with those reported by Zhang et al. [30], confirming that-compared to the TFB structure-the maximum deflection of the beam in the HPFB structure is greater, whereas the minimum deflection is smaller.”
3.2.3. Comparative Analysis of Bending Moment Curves
Based on the results summarized in Table 1, the bending moment distributions for horizontal beam AB and longitudinal beam EF in both structural systems are plotted separately and presented in Figure 8 and Figure 9, respectively.
As illustrated in Figure 8, notable differences are observed in the bending moment distributions of horizontal beam AB between the two structural systems. The HPFB structure demonstrates a reduced maximum negative bending moment and an increased positive bending moment compared to the TFB configuration. Quantitatively, the maximum negative and positive bending moments in beam AB of the HPFB structure are -4.25524kN·m and 14.9158kN·m, respectively. In contrast, the corresponding values in the TFB structure are -26.5137kN·m and 9.21772kN·m. The ratios of the maximum negative bending moment and the maximum positive bending moment between the two structural systems are 16% and 162%, respectively.
The introduction of hinge joints a and b significantly confines the negative bending moment region primarily within the prefabricated straight beam segment ab, while substantially diminishing the magnitude of the maximum negative bending moment at the mid-span of this segment relative to the TFB structure. Additionally, the bending moment variation along beam AB in the HPFB system exhibits a smoother and more gradual transition compared to the TFB structure.
As demonstrated in Figure 9, the bending moment distributions of longitudinal beam EF in both structural systems exhibit patterns consistent with those observed in Figure 8. However, compared to Figure 8, Figure 9 shows larger magnitudes of both maximum negative and positive bending moments. This difference can be attributed to the higher concentrated loads and beam-end shear forces distributed to the individual segments of longitudinal beam EF. Quantitatively, the maximum negative and positive bending moments in longitudinal beam EF of the HPFB structure are -10.8727kN·m and 56.44kN·m, respectively. In contrast, the corresponding values in the TFB structure are -58.73kN·m and 38.7365kN·m. The ratios of these maximum bending moments between the two structural systems—specifically for the negative and positive moments—are calculated as 18.5% and 146%, respectively.
Consistent with the behavior observed at hinge joints a and b in horizontal beam AB of the HPFB structure (see Figure 8), the bending moments at hinge joints e and f in longitudinal beam EF (see Figure 9) are also zero. These results further corroborate the validity and mechanical consistency of the analytical framework proposed in this study.
Based on the results shown in Figure 8 and Figure 9, the ratio of the maximum negative bending moment between the two structures proposed in this study ranges from 16% to 18.5%, while the ratio of the maximum positive bending moment ranges from 146% to 162%. These values differ significantly from those reported by Zhang et al.[30], who stated that “the maximum bending moment in the HPFB structure is approximately 70–80% of that in the TFB structure.”
The alteration in the structural configuration leads to a significant transformation in the bending moment behavior of the HPFB system. This modification leads to a substantial decrease in the maximum negative bending moment and a moderate increase in the maximum positive bending moment in the HPFB structure relative to the TFB system.
3.2.4. Comparative Analysis of Shear Force Curves
Based on the load distribution and beam-end shear forces provided in Table 1, the shear force diagrams for horizontal beam AB and longitudinal beam EF in both structural systems are plotted separately and presented in Figure 10 and Figure 11, respectively.
As shown in Figure 10 and Figure 11, the shear force diagrams of both horizontal beam AB and longitudinal beam EF in the HPFB structure exhibit similar distinguishing characteristics when compared to their counterparts in the TFB structure. Compared to the TFB structure, the HPFB structure exhibits consistently smaller magnitudes of maximum shear forces in both its horizontal and longitudinal beams. From a quantitative perspective, as shown in Figure 10, the maximum shear force in beam AB of the HPFB structure is 55.4222kN, whereas that in the TFB structure is 71.7854kN. Similarly, according to Figure 11, the maximum shear force in beam EF is 106.09kN for the HPFB structure, compared to 115.047kN for the TFB structure. These results demonstrate a notable discrepancy with the findings reported by Zhang et al.[30], who stated that “the difference in maximum shear forces between the two structural systems is relatively small, with only approximately a 10% variance.”
Additionally, unlike the segmented linear distribution characteristic of the shear force diagrams of The TFB structure, the shear force curves of both horizontal and longitudinal beams in the HPFB structure exhibit convex upward features in the first half of the span and concave downward characteristics in the second half. Furthermore, due to the modified structural configuration, the HPFB structure exhibits a more balanced distribution between the maximum positive and negative shear forces.
The observed differences in the shear force diagrams between the two frame structures primarily stem from the introduction of hinge joints, which alters the load application points on both horizontal beam AB and longitudinal beam EF. Specifically, the TFB structure in Figure 5b sustains concentrated loads at two points, whereas the HPFB structure in Figure 5a carries loads at four points.
3.3. Sensitivity Analysis of Subgrade Reaction Coefficient on the Mechanical Response of HPFB Structures
Numerous factors influence the structural mechanical response of HPFB systems, including the anchoring force, subgrade reaction coefficient, cross-sectional dimensions, cantilever length, and hinge joint positions [30]. Among these, the subgrade reaction coefficient is an objective parameter largely determined by site-specific geological conditions, while the others can be subjectively adjusted during the design process. In practice, however, the subgrade reaction coefficient itself is also affected by factors such as the width of the beam bottom, the type of applied load, and the magnitude of the loading [33].
To investigate the sensitivity of the subgrade reaction coefficient to the mechanical response of the HPFB structure, a multiplicatively increasing variation of this coefficient is applied while keeping all other conditions unchanged. For the HPFB structure shown in Figure 5a, a sensitivity analysis is conducted encompassing the load distribution and determination of beam-end shear force, as well as the deflection, bending moment, and shear force curves of the beams. Specifically, the subgrade reaction coefficient k is assigned values of 6000kN/m3, 12000kN/m3, and 24000kN/m3, respectively.
3.3.1. Load Distribution and Determination of Beam-End Shear Forces
According to the structural analysis framework proposed in this study, the load distribution and beam-end shear forces of the HPFB structure shown in Figure 5a were determined for three distinct values of subgrade reaction coefficient. The results are summarized in Table 3.
As summarized in Table 3, a multiplicative increase in the subgrade reaction coefficient leads to a progressive rise in both the load carried by the shorter horizontal beam segments and the resulting end shear forces. Conversely, the longer longitudinal beam segments experience a reduction in load allocation and a corresponding decrease in shear forces at their ends. This behavior arises because an increase in the subgrade reaction coefficient enhances stress concentration near the anchorage zones at the beam-subgrade interface, which modifies the load transfer mechanism and amplifies the stiffness sensitivity of the shorter beam segments. However, despite these localized effects, variations in the subgrade reaction coefficient exhibit negligible influence on both the load distribution and the beam-end shear forces within the HPFB structure.
3.3.2. Sensitivity Analysis of Deflection to the Subgrade Reaction Coefficient
Based on the results presented in Table 3 and employing Winkler foundation model, separate deflection curves were plotted for horizontal beam AB and longitudinal beam EF in the HPFB structure shown in Figure 5a. The corresponding results are illustrated in Figure 12 and Figure 13, respectively.
As shown in Figure 12 and Figure13, the deflection of both horizontal beam AB and longitudinal beam EF decreases with increasing subgrade reaction coefficient. Notably, the outer segments of both beams experience a more rapid reduction in deflection. Consequently, the overall deflection profiles of both beams become progressively flatter as the subgrade reaction coefficient increases.
The observed behavior is primarily attributed to the enhanced restraint against longitudinal rotation of the outer beam segments, resulting from the increased subgrade reaction coefficient. This restraint reduces differential deflection along the beam. Extrapolating this trend suggests that with a further increase in the subgrade reaction coefficient, the deflection curves of both the horizontal and longitudinal beams would asymptotically approach horizontal lines.
Based on the comprehensive analysis of Figure 12 and Figure 13, it can be concluded that the subgrade reaction coefficient has a significant effect on the deflection of the frame beam. Specifically, a multiplicative increase in the subgrade reaction coefficient leads to a corresponding reduction in beam deflection. This result is in exact agreement with the findings reported by Zhang et al.[30].
3.3.3. Sensitivity Analysis of Bending Moment to the Subgrade Reaction Coefficient
Based on the results in Table 3 and employing Winkler foundation model, bending moment curves were plotted separately for both horizontal beam AB and longitudinal beam EF. The corresponding bending moment curves are presented in Figure 14 and Figure 15, respectively.
As shown in Figure 14 and Figure 15, a multiplicatively increasing subgrade reaction coefficient does not significantly alter the overall profile of the bending moment curves in the HPFB structure. However, its influence on the magnitude of bending moments is strongly dependent on the length of the beam segments.
In horizontal beam AB, which is composed of relatively short segments, an increase in the subgrade reaction coefficient leads to an increased external load transferred to the beam. As a result, both the maximum negative and positive bending moments show a consistent increase.
In contrast, for the longer longitudinal beam EF, an increase in the subgrade reaction coefficient causes a reduction in the external load imposed on the beam. This leads to a corresponding decrease in both the maximum negative and positive bending moments.
As the subgrade reaction coefficient increases, the bending moment curves of horizontal beam AB and longitudinal beam EF exhibit slowly divergent and convergent trends, respectively. This behavior further demonstrates the overall insensitivity of bending moments in the HPFB structure to variations in the subgrade reaction coefficient.The observed bending moment responses of the horizontal and longitudinal beams under varying subgrade reaction coefficients are consistent with the findings reported by Zhang et al.[30].
3.3.4. Sensitivity Analysis of Shear Force to the Subgrade Reaction Coefficient
Based on the results presented in Table 3 and employing the Winkler foundation model, shear force distributions were analyzed separately for horizontal beam AB and longitudinal beam EF within the HPFB structure. The corresponding shear force curves are illustrated in Figure 16 and Figure 17, respectively.
As shown in Figure 16 and Figure 17, a multiplicatively increasing subgrade reaction coefficient does not significantly alter the overall shear force behavior of the HPFB structure. However, distinct trends are observed in individual beam elements.
In the horizontal beam AB, an increase in the subgrade reaction coefficient leads to a gradual rise in external loads. This results in an increase in both the maximum negative and positive shear forces, causing the shear force curve to expand outward.
Conversely, in the longitudinal beam EF, an increase in the subgrade reaction coefficient reduces the external load carried by the beam. Consequently, both the maximum negative and positive shear forces decrease gradually, leading to an inward contraction of the shear force curve.
In summary, the shear force response of the HPFB structure demonstrates considerable insensitivity to variations in the subgrade reaction coefficient, a conclusion consistent with the findings reported by Zhang et al.[30].
4. Conclusions
Given that current structural analysis of HPFB structures predominantly relies on empirical approaches, this study proposes an alternative analytical framework based on the Winkler foundation model. To evaluate the performance of HPFB structures relative to traditional TFB structures, a comparative analysis was conducted under identical conditions, involving one HPFB and one TFB structure. The comparison examined load distribution, beam-end shear force, deflection, bending moment, and shear behavior. Additionally, the sensitivity of the HPFB structure’s mechanical response—including deflection, bending moment, and shear force—to variations in the subgrade reaction coefficient was systematically investigated. The following conclusions are drawn:
- (1)
- Consistent with the load distribution observed in the TFB structure, the analytical framework proposed in this study allocates smaller concentrated loads to the shorter horizontal beam segments and larger concentrated loads to the longer longitudinal beam segments. Correspondingly, the hinged connections transfer smaller shear forces to the shorter horizontal segments and larger shear forces to the longer longitudinal segments.
- (2)
- The proposed analytical framework rigorously enforces the deformation compatibility conditions at both the anchorage points and hinged joints, thereby demonstrating the rationality and applicability of the HPFB structural analysis methodology presented in this study.
- (3)
- Compared to the TFB structure, the HPFB structure exhibits larger deflections near the beam ends and smaller deflections in certain intermediate regions. Furthermore, the deflection curves of both the horizontal and longitudinal beams in the HPFB structure exhibit clearly segmented, approximately linear distribution characteristics.
- (4)
- A comparative analysis of bending moment distributions under identical conditions indicates that, compared to the TFB structure, the HPFB exhibits higher positive bending moments at the anchorage points of both horizontal and longitudinal beams, along with substantially reduced moments in the mid-span regions of the precast straight beams. Furthermore, the bending moment curves in the HPFB structure display a smoother and more gradual variation along the beam length.
- (5)
- A comparative analysis of shear forces under identical conditions demonstrates that, relative to the TFB structure, the HPFB system exhibits lower maximum shear values at the anchorage points of both horizontal and longitudinal beams. Additionally, the shear force curves in the HPFB structure are characterized by distinctly convex profiles in the front segments and concave profiles in the rear segments of the beams.
- (6)
- As the subgrade reaction coefficient increases multiplicatively, the concentrated loads assigned to the shorter horizontal beam segments show a gradual increasing trend, while those allocated to the longer longitudinal beam segments exhibit a gradual decreasing trend. Correspondingly, the end shear forces transferred through the hinged connections to the shorter horizontal segments increase gradually, whereas those transferred to the longer longitudinal segments decrease gradually.
- (7)
- With a multiplicative increase in the subgrade reaction coefficient, the deflections of both the horizontal and longitudinal beams in the HPFB structure decrease correspondingly, while their deflection curves exhibit a progressively flatter profile. This trend clearly demonstrates the considerable influence of the subgrade reaction coefficient on the deflection behavior of the beams.
- (8)
- Sensitivity analysis reveals that a multiplicative increase in the subgrade reaction coefficient exerts a negligible influence on both the bending moments and shear forces within the HPFB structure. This finding suggests that, provided beam deflection meets design requirements, it is feasible to adopt a unified set of design parameters for slopes with varying subgrade stiffness.
Data Availability Statement
The data used to support the findings of this study are available from the corresponding author upon reasonable request.
Acknowledgments
This research was supported by the General project of Hunan Provincial Education Department (Grant Number: 20C1608 and 21C0269), Science Foundation for Youths of Hunan Province of China (Grant Number: 2021JJ40460), which are gratefully acknowledged.
Conflicts of Interest
The authors declare that they have no conflicts of interest to report regarding the present study.
References
- Zhang, H.; Lu, Y.; Cheng, Q. Numerical simulation of reinforcement for rock slope with rock bolt (anchor cable) frame beam. J. Highw. Transp. Res. Dev. (Engl. Ed.) 2008, 3, 65–71. [CrossRef]
- Cheng, Z.; Wang, Z.; Xi, H.; Zou, L.; Zhou, Z.; Zhou, C. Recent advances in high slope reinforcement in China: Case studies. J. Rock Mech. Geotech. Eng. 2016, 8, 775–788. [CrossRef]
- Deng, D.P.; Zhao, L.H.; Li, L. Limit-equilibrium analysis on stability of a reinforced slope with a grid beam anchored by cables. Int. J. Geomech. 2017, 17, 06017013.
- Liu, Z.; Shi, K.Y.; Wu, X.P.; Dai, S.L. Coupled calculation model for anchoring force loss in a slope reinforced by a frame beam and anchor cables. Eng. Geol. 2019, 260, 105245. [CrossRef]
- Chen, M.; Zhang, Z.; Liu, G.; et al. Experimental and numerical evaluation of creep and coupling mechanism with lattice structure of the deposits coarse-grained soils in reservoir area. KSCE J. Civ. Eng. 2025, 29, 100026. [CrossRef]
- Fan, J.; Yang, S.; Deng, B.; et al. A New Technique of Lattice Beam Construction with Pre-Anchoring for Strengthening Cut Slope: A Numerical Analysis of Temporary Stability during Excavation. Buildings 2022, 12, 1930. [CrossRef]
- Zhang, S.; Pei, X.; Wang, S.; Huang, R.; Zhang, X. Centrifuge model testing of loess landslides induced by excavation in Northwest China. Int. J. Geomech. 2020, 20, 04020022. [CrossRef]
- Wang, Z.; Gu, D.; Zhang, W. Influence of excavation schemes on slope stability: A DEM study. J. Mt. Sci. 2020, 17, 1509–1522.
- Li, Q.; Wang, Y.M.; Zhang, K.B.; et al. Field investigation and numerical study of a siltstone slope instability induced by excavation and rainfall. Landslides 2020, 17, 1485–1499. [CrossRef]
- Yubonchit, S.; Chinkulkijniwat, A.; Horpibulsuk, S.; et al. Influence factors involving rainfall-induced shallow slope failure: Numerical study. Int. J. Geomech. 2017, 17, 04016158.
- Lee, L.M.; Gofar, N.; Rahardjo, H. A simple model for preliminary evaluation of rainfall-induced slope instability. Eng. Geol. 2009, 108, 272–285. [CrossRef]
- Rahimi, A.; Rahardjo, H.; Leong, E.C. Effect of antecedent rainfall patterns on rainfall-induced slope failure. J. Geotech. Geoenviron. Eng. 2011, 137, 483–491. [CrossRef]
- Wu, T.; Zhou, C.; Jiang, N.; et al. Stability analysis for high-steep slope subjected to repeated blasting vibration. Arab. J. Geosci. 2020, 13, 828.
- Xu, J.; Yan, C.; Zhao, X.; et al. Monitoring of train-induced vibrations on rock slopes. Int. J. Distrib. Sens. Netw. 2017, 13, 1550147716687557.
- Budhu, M.; Gobin, R. Seepage-induced slope failures on sandbars in Grand Canyon. J. Geotech. Geoenviron. Eng. 1995, 121, 601–609.
- Yu, L.; Zheng, X.; Liu, Z.; et al. Multiscale modelling of the seepage-induced failure of a soft rock slope. Acta Geotech. 2022, 17, 4717–4738. [CrossRef]
- Xu, J.; Wang, Z.; Ren, J.; et al. Mechanism of slope failure in loess terrains during spring thawing. J. Mt. Sci. 2018, 15, 845–858.
- Paranunzio, R.; Laio, F.; Nigrelli, G.; et al. A method to reveal climatic variables triggering slope failures at high elevation. Nat. Hazards 2015, 76, 1039–1061. [CrossRef]
- Sato, A.; Hatakeyama, O. Characteristics of slope surfaces deformed by frost heaving. In Transportation Soil Engineering in Cold Regions, Volume 1: Proceedings of TRANSOILCOLD 2019; Springer: Singapore, 2019; pp. 9–17.
- Qin, M.; Dou, G.; Yang, J.; Wei, S. Field Test and Numerical Study of Three Types of Frame Beams Subjected to a 600 kN Anchoring Force. Buildings 2024, 14, 401.
- Liao, H.J.; Chen, H.M. Cut Slope Failure of Mudstone Formations in Southern Taiwan. In Advances in Geotechnical Engineering: The Skempton Conference, Proceedings of the Skempton Conference on Geotechnical Engineering, Royal Geographical Society, London, UK, 29–31 March 2004; Institution of Civil Engineers: London, UK, 2004; Volume 2, pp. 868–880. ISBN 978-0727732483.
- Qin, M.; Yang, J.; Wei, S. Calculation of precast prestressed beam with variable cross-sections on Pasternak foundation under anchoring force. KSCE J. Civ. Eng. 2024, 28, 3941–3950.
- Dai, X.; Cao, Y.; Wei, S.; Wei, P.; Huo, H.; Cai, J.; Li, Y. Analysis of reinforcement effect of different anchoring forces on slope stabilised by prefabricated anchorage cable frame beams. Structures 2024, 69, 107476.
- Zhang, J.; Zhou, Q.; Li, F.; Zhang, S. Case study of field application of prefabricated anchoring frame beam structure in slope supporting projects. J. Constr. Eng. Manag. 2022, 148, 05022008. [CrossRef]
- Le, X. Stability Analysis of Red Clay Slope of Jiang-yu Expressway in Guizhou Province and Support of Fabricated Frame Beam. Master’s Thesis, Changsha University of Science & Technology, Changsha, China, 2019.(in Chinese).
- Zhou, Q. Study on Node Mechanical Properties and Shear Behavior of Hinged Prefabricated Anchoring Frame Beam Structure. Master’s Thesis, Changsha University of Science & Technology, Changsha, China, 2022.(in Chinese).
- DB43/T 2938-2024;Technical specification for the anchoring of hinged assembled frame beam structure; Administration for Market Regulation of Hunan Province: Changsha, China, 2024.(in Chinese).
- Li, J.B.; Zhu, Y.P.; Ye, S.H.; M, X.R. Internal force analysis and field test of lattice beam based on Winkler theory for elastic foundation beam. Math. Probl. Eng. 2019, 2019, 5130654.
- Fan, J.; Yang, S.; Deng, B.; Sun, B.; Liu, T. A comparison of load distribution methods at the node and internal force analysis of the lattice beam based on the winkler foundation model. Buildings 2023, 13, 1731. [CrossRef]
- Zhang, J., Zhou, S., Zhang, S., Li, F. Stress-induced deformation characteristics of a hinged prefabricated anchor frame beam .J Changsha Univ Sci Tech (Nat Sci), 2025, 22(1): 1-14.(in Chinese).
- Dinev, D. Analytical solution of beam on elastic foundation by singularity functions. Eng. Mech. 2012, 19, 381–392.
- Papusha, A.N. Beam Theory for Subsea Pipelines: Analysis and Practical Applications, 1st ed.; John Wiley & Sons, Inc.: Hoboken, NJ, USA, 2015.
- Bowles, J.E. Foundation Analysis and Design, 5th ed.; McGraw-Hill: New York, NY, USA, 1996.
Figure 1.
The frame beam slope anchoring system: (a) system with anchor bolts; (b) system with anchor cables.
Figure 1.
The frame beam slope anchoring system: (a) system with anchor bolts; (b) system with anchor cables.
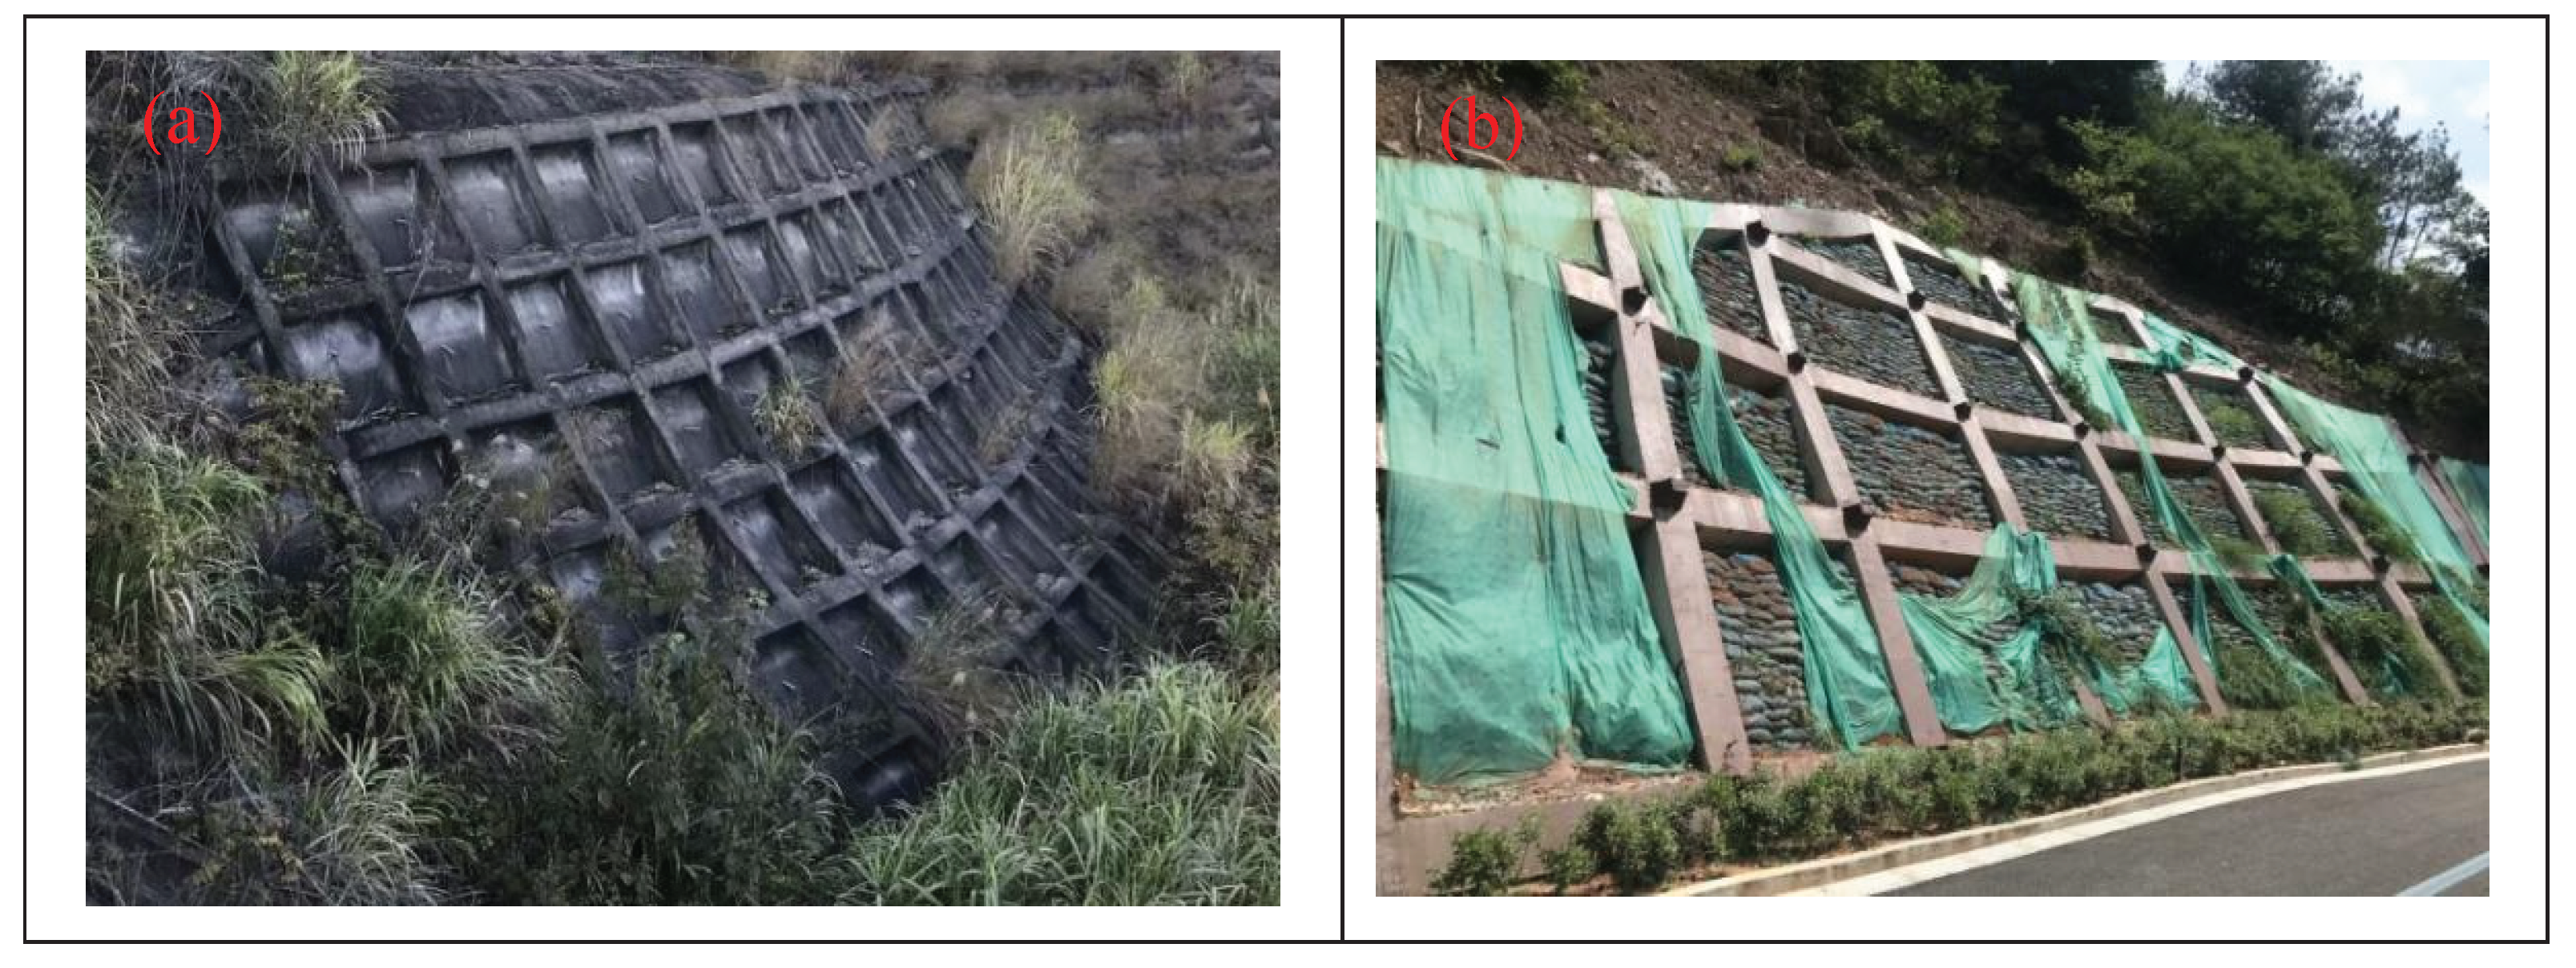
Figure 2.
Schematic Diagram of HPFB Slope Anchoring System.
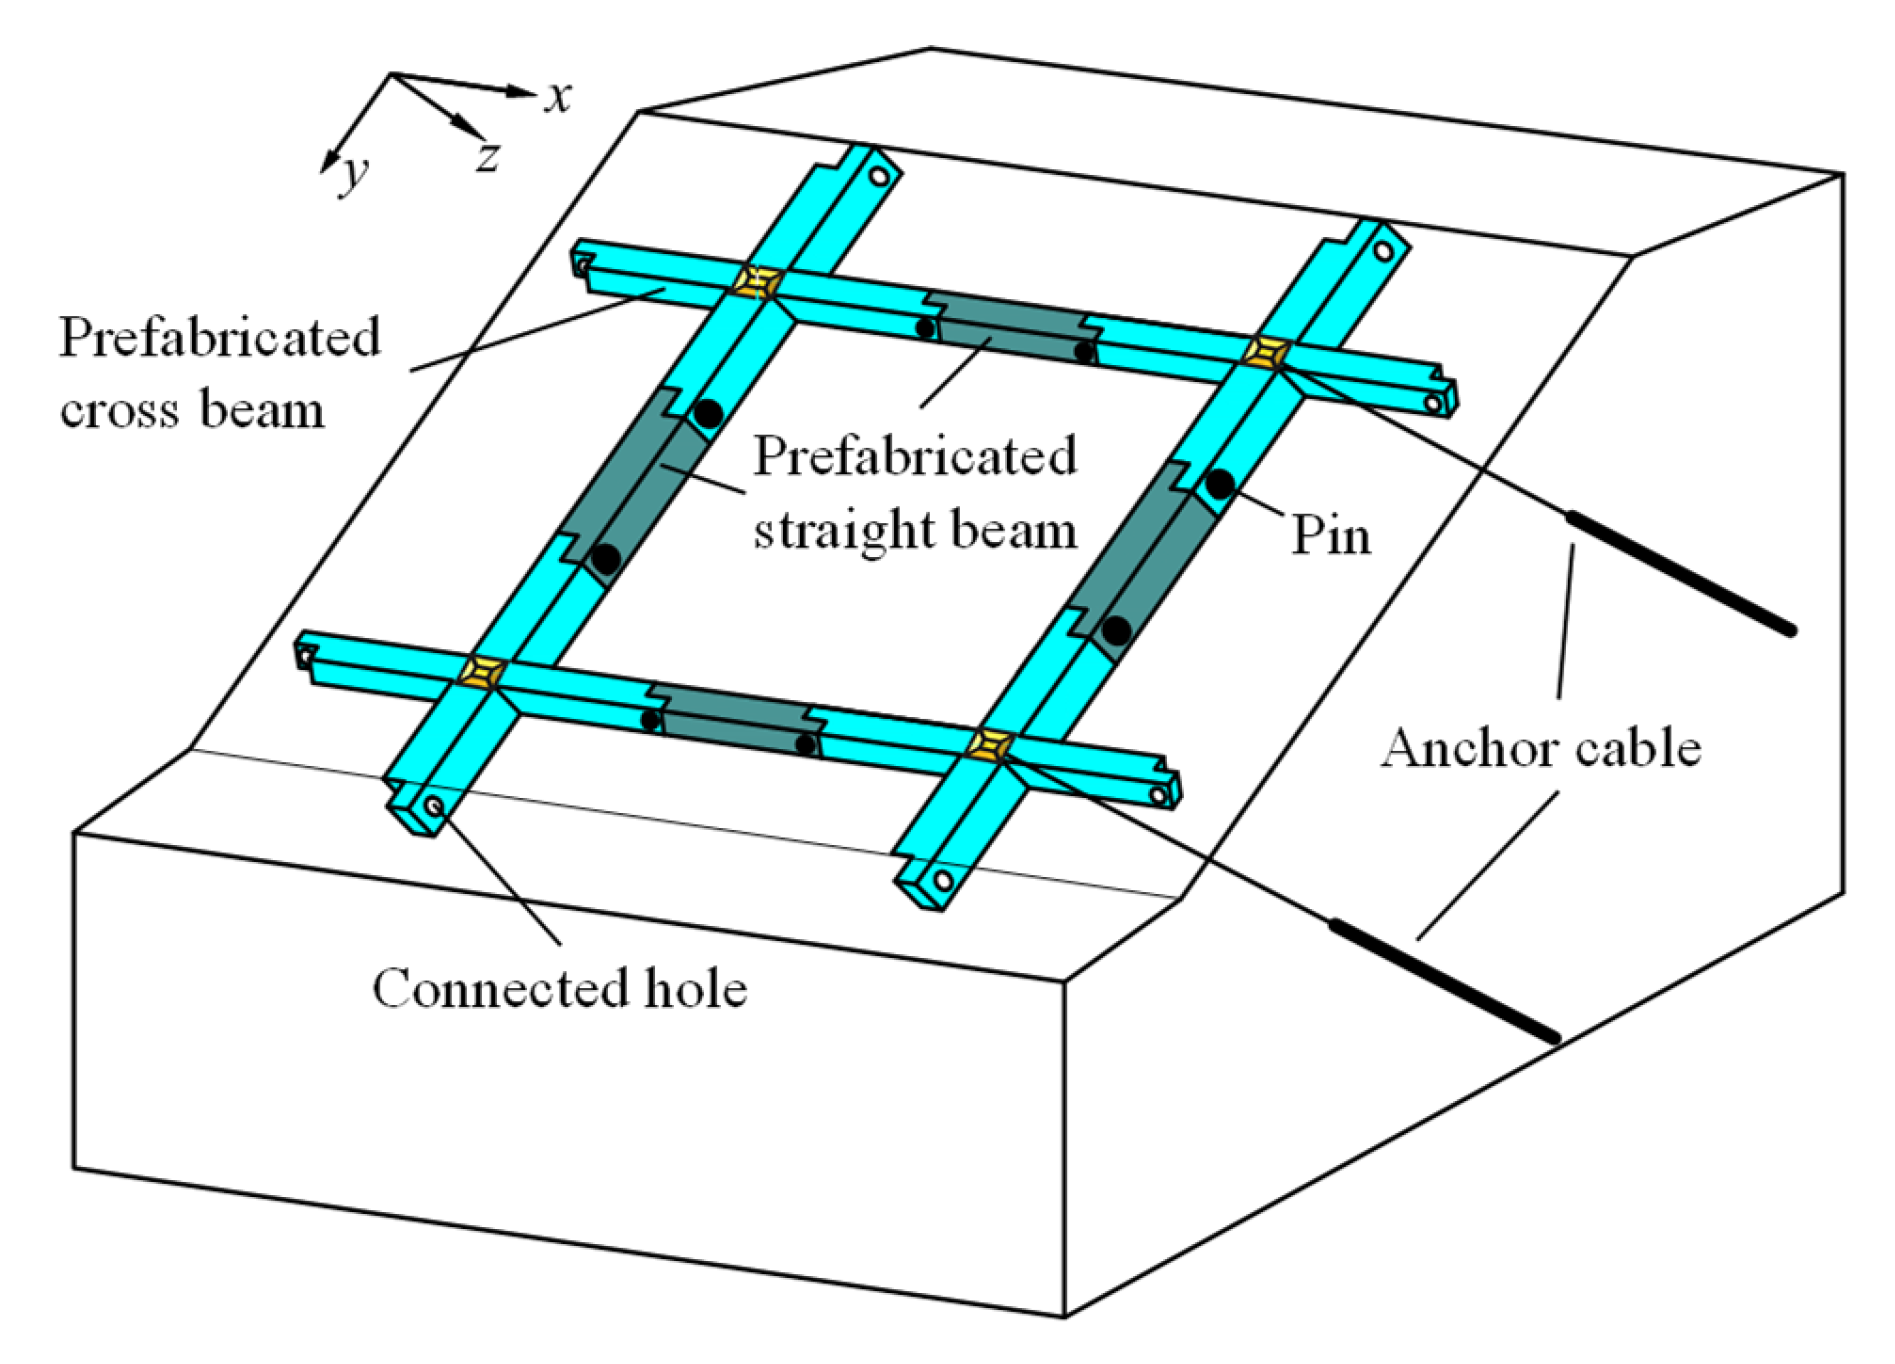
Figure 3.
Schematic Diagram of HPFB Structure.
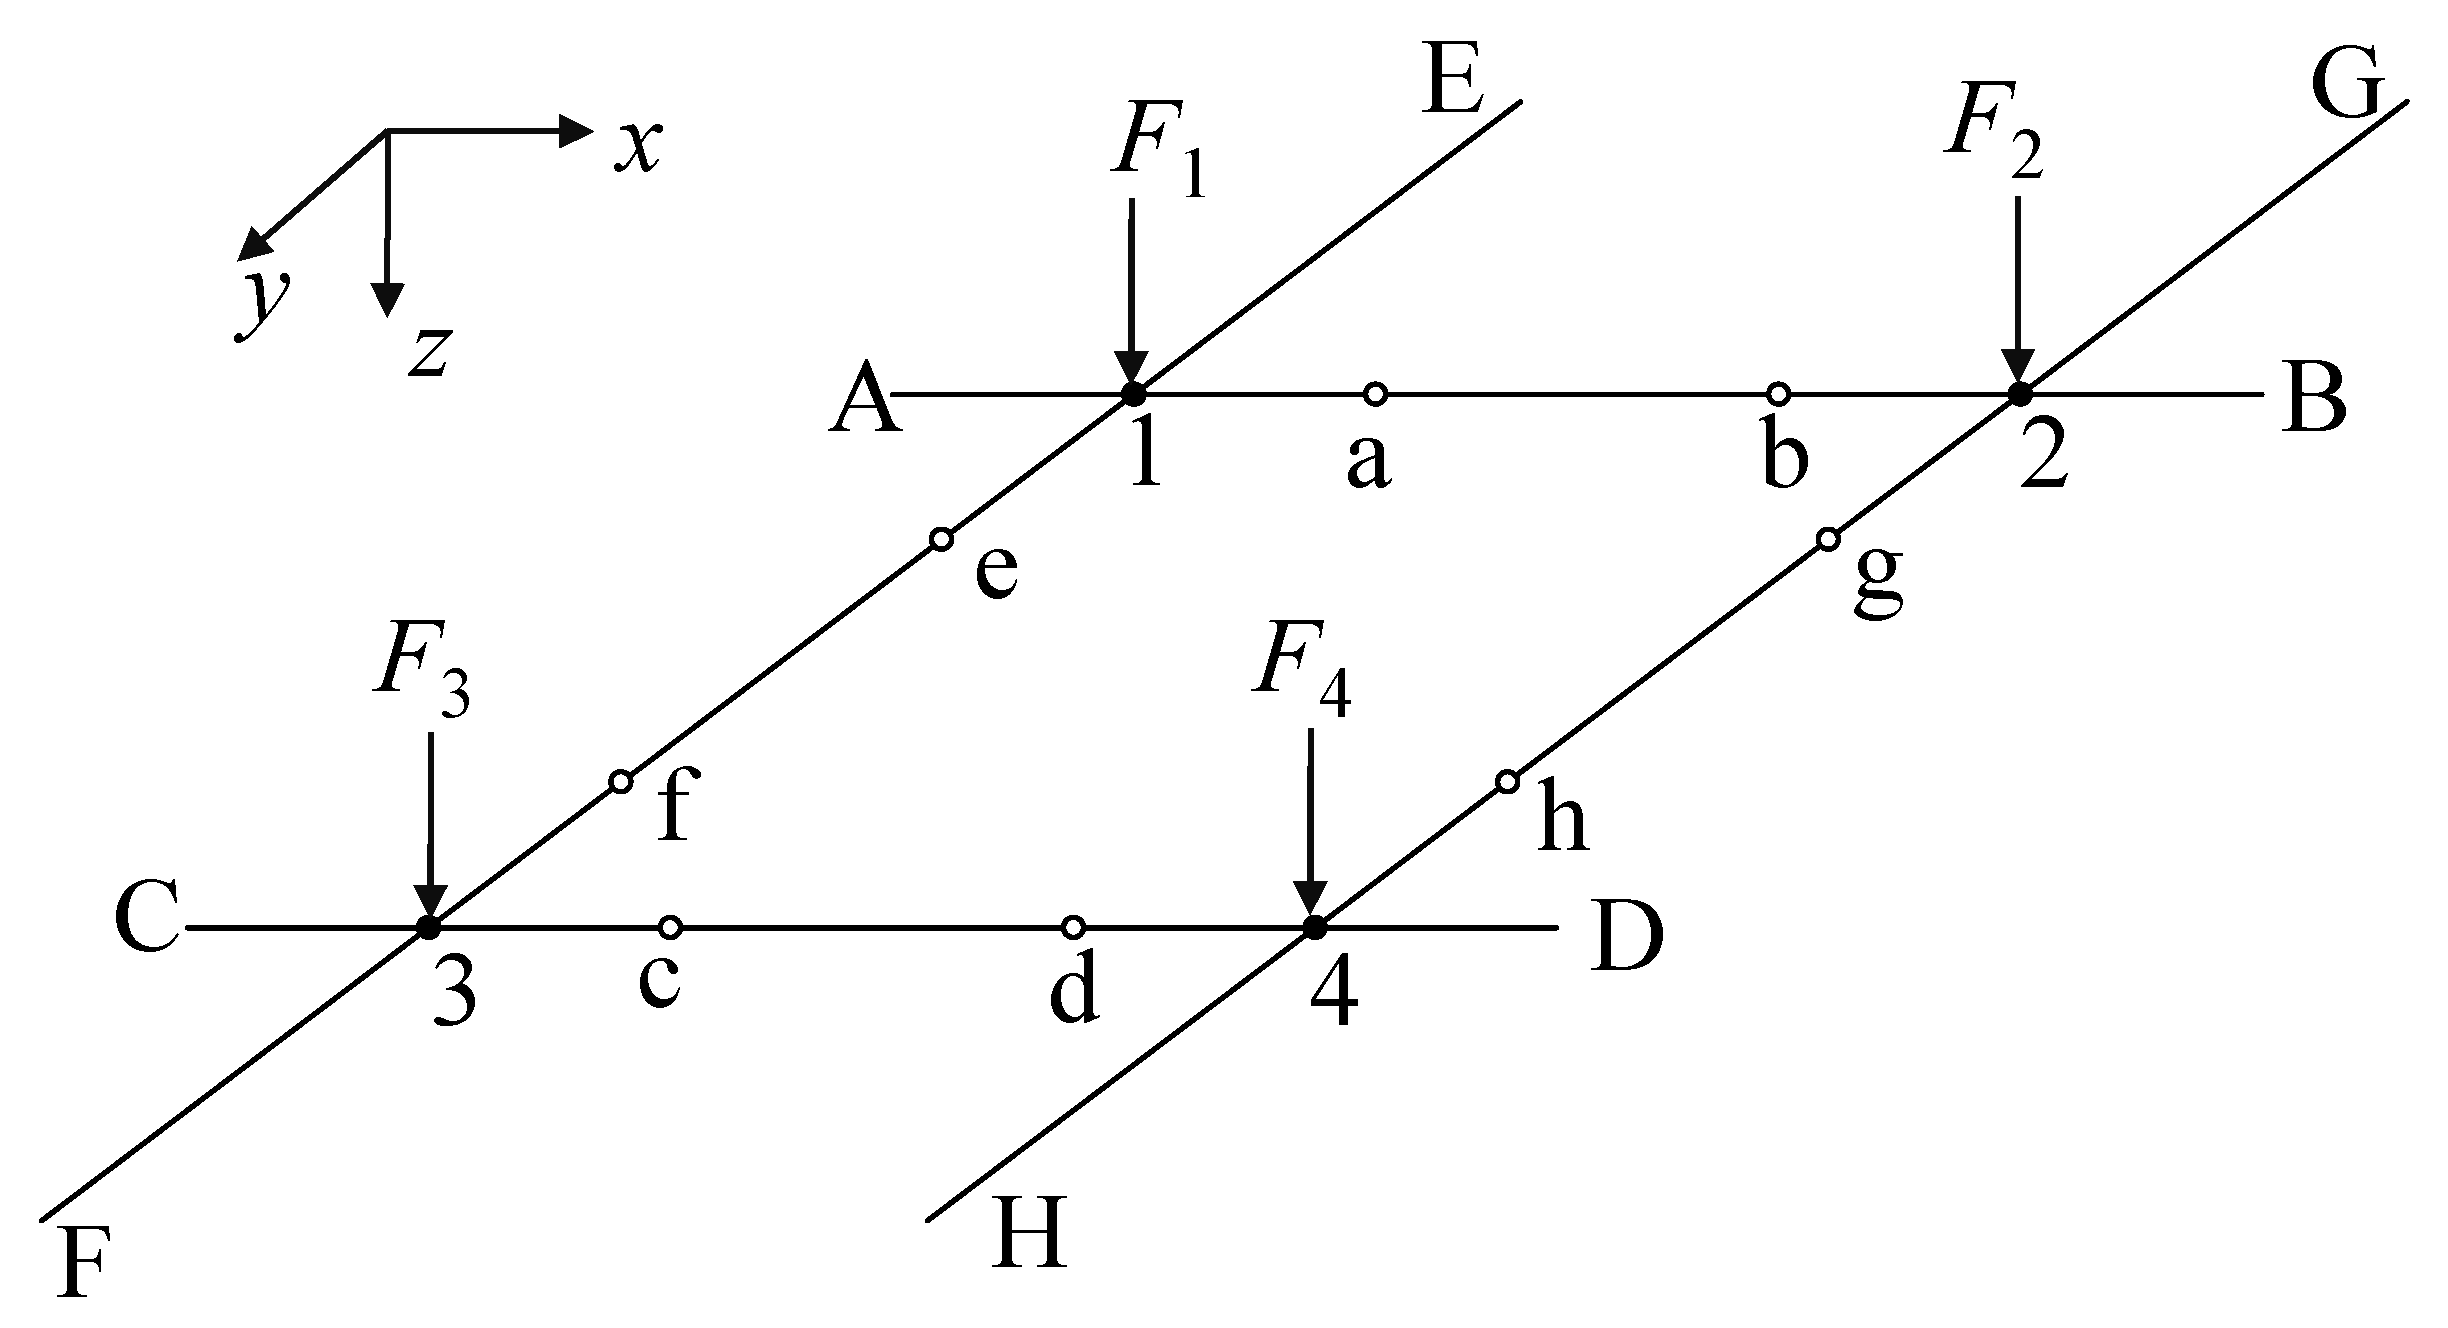
Figure 4.
Schematic diagram of disassembled horizontal and longitudinal beams under concentrated loads and a beam-end shear forces: (a) horizontal beam AB; (b) horizontal beam CD; (c) longitudinal beam EF; (d) longitudinal beam GH;.
Figure 4.
Schematic diagram of disassembled horizontal and longitudinal beams under concentrated loads and a beam-end shear forces: (a) horizontal beam AB; (b) horizontal beam CD; (c) longitudinal beam EF; (d) longitudinal beam GH;.
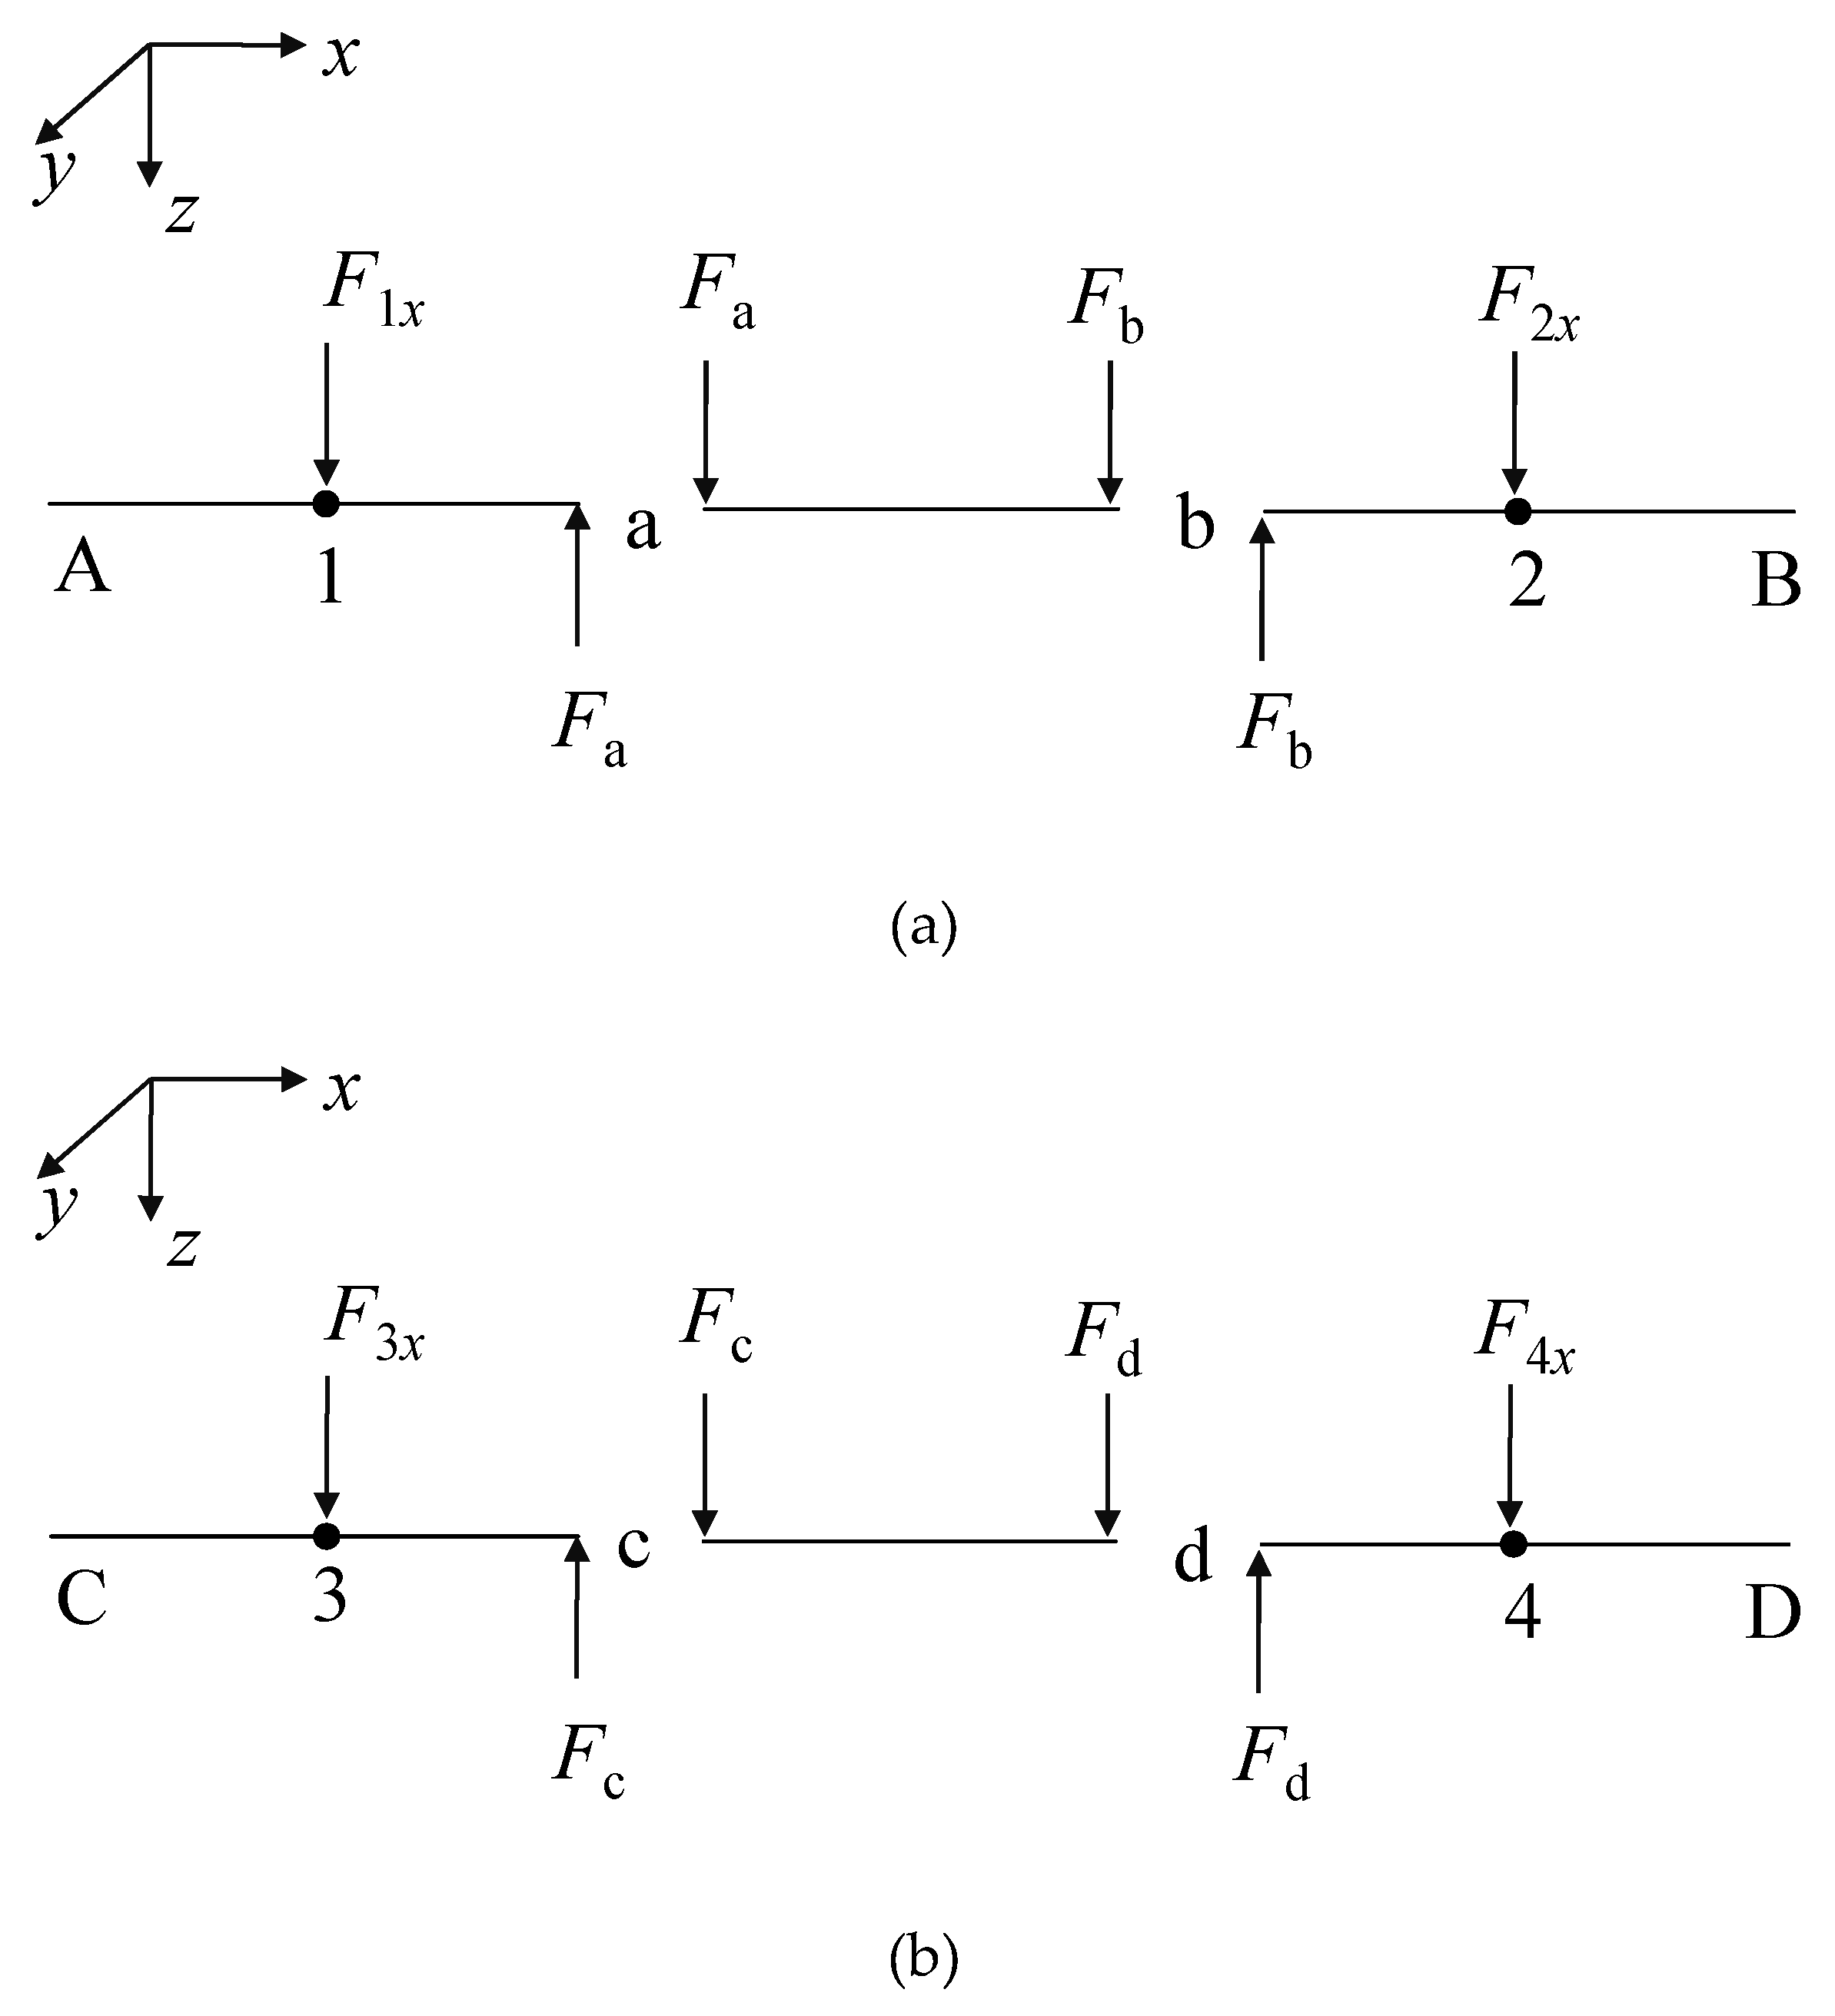
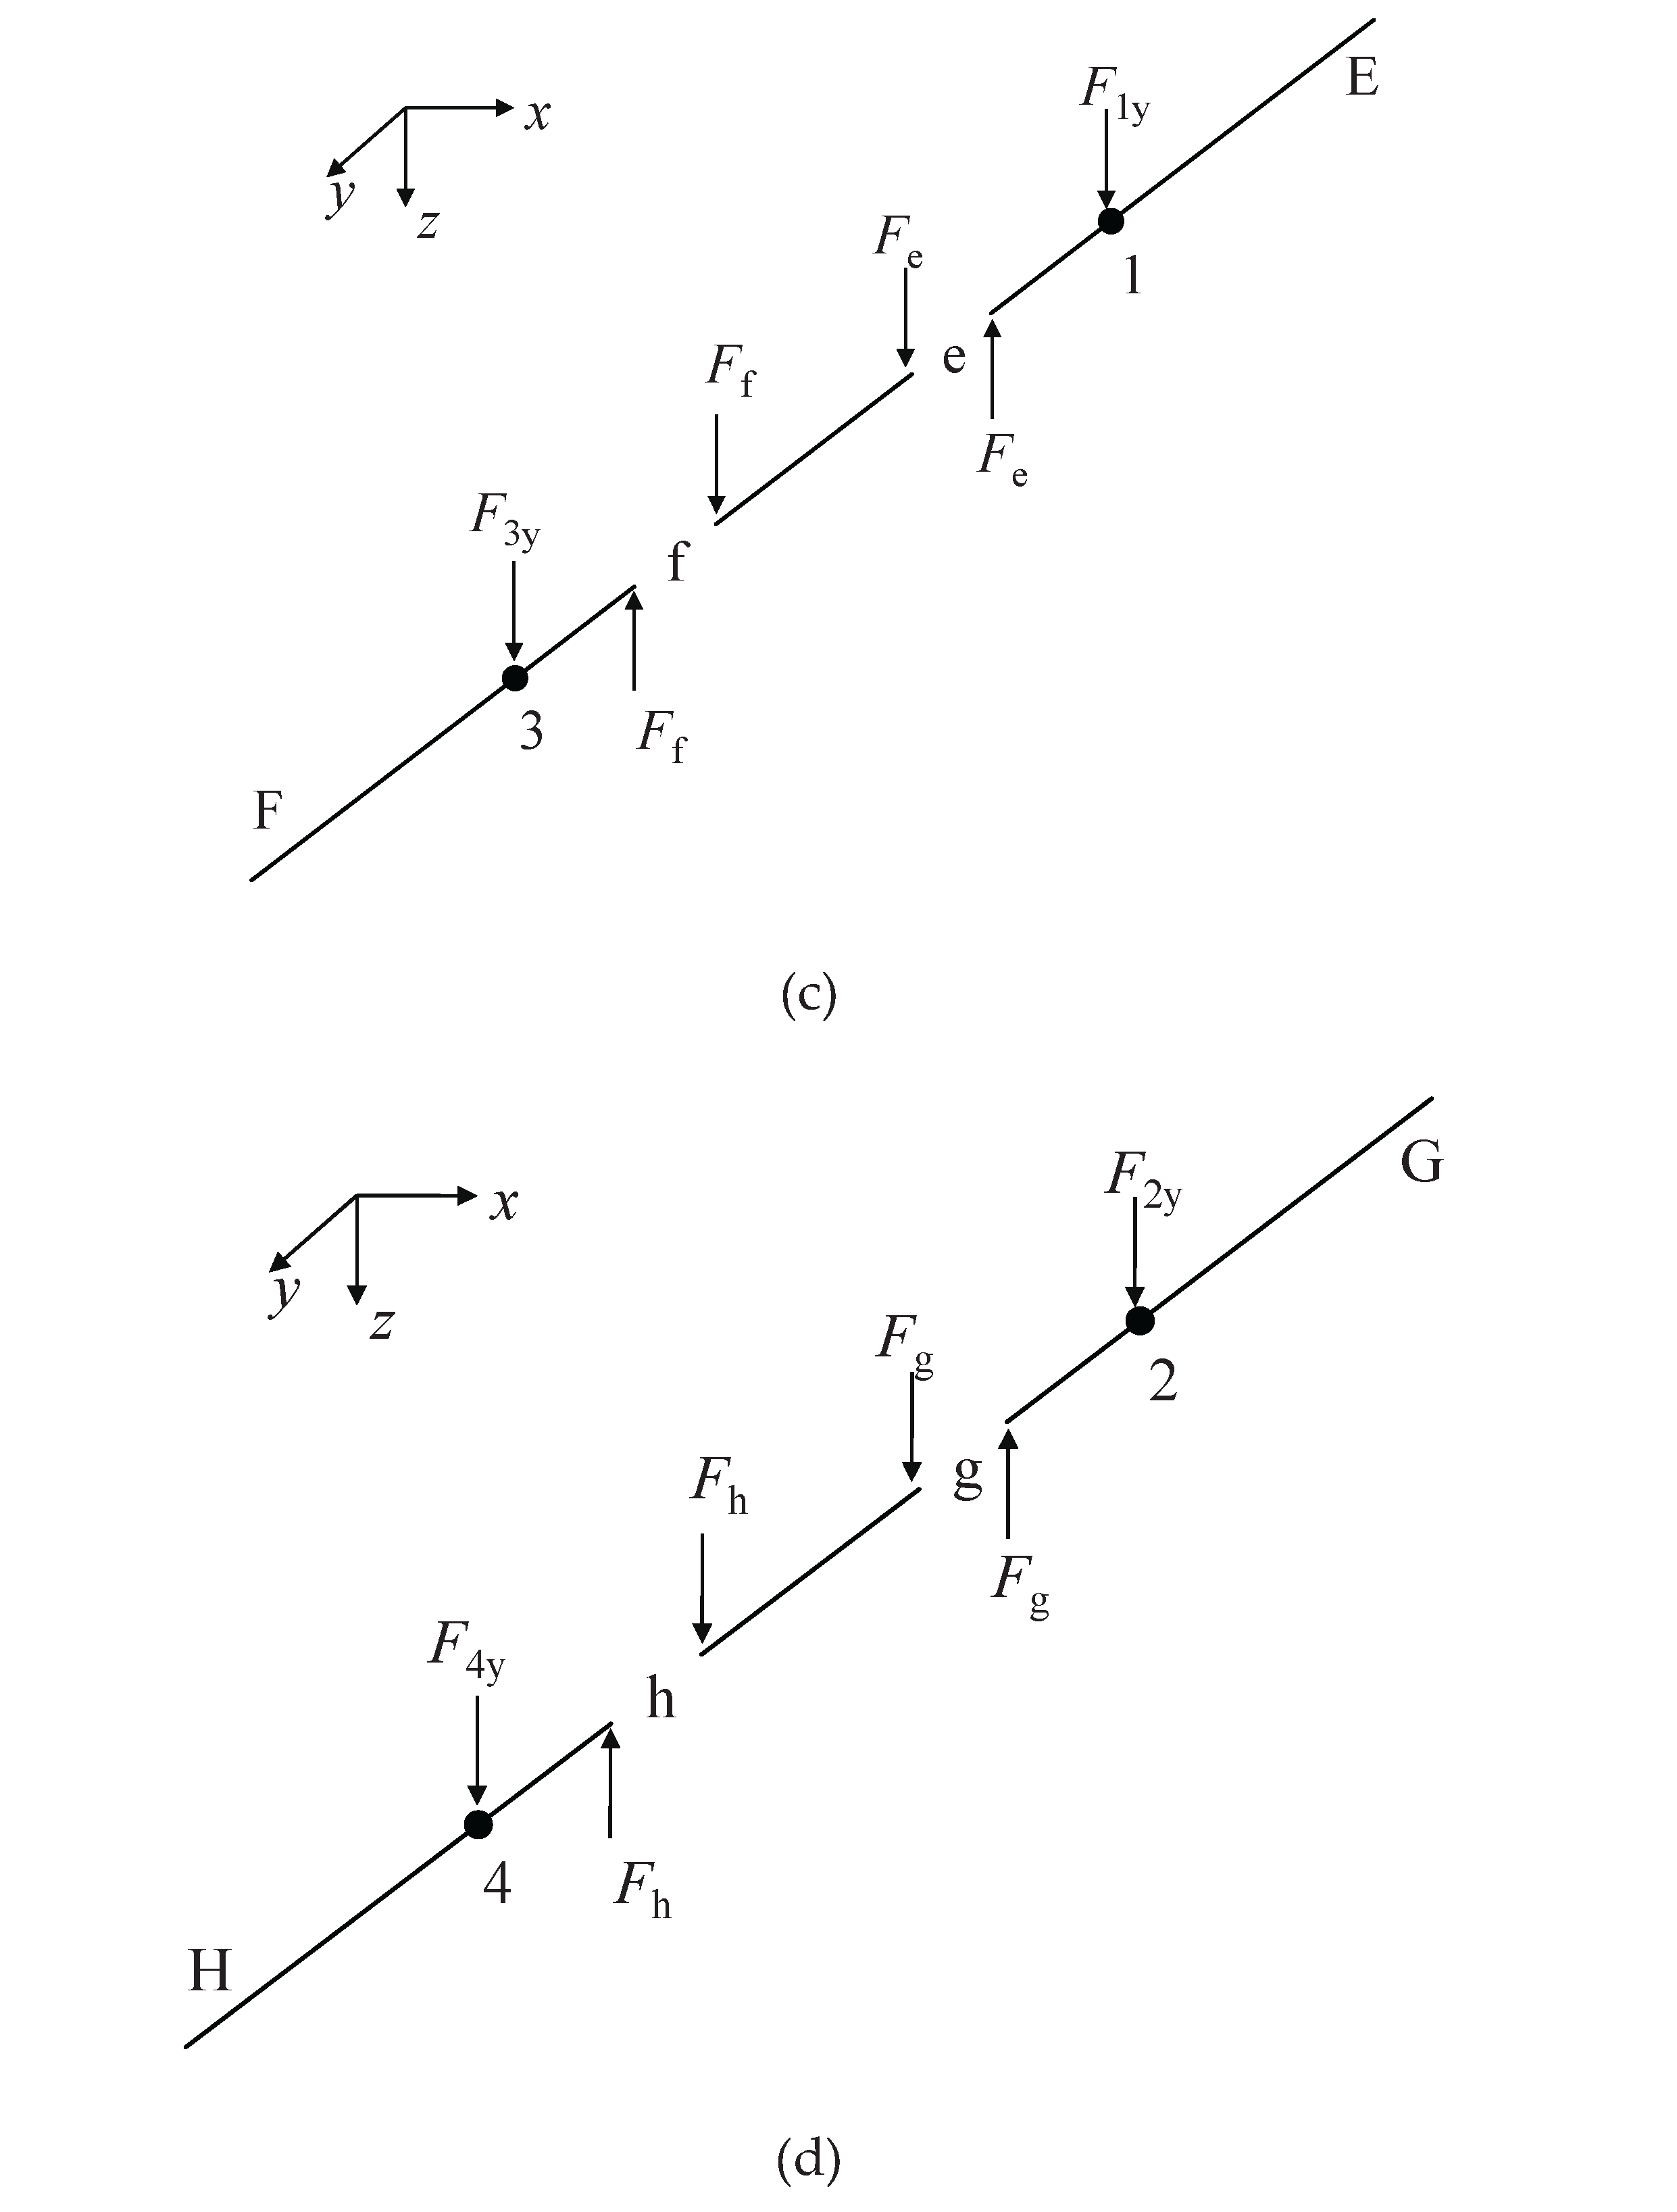
Figure 5.
Planar schematic diagrams of the two compared frame beam structures (unit: mm): (a) HPFB structure; (b) TFB structure.
Figure 5.
Planar schematic diagrams of the two compared frame beam structures (unit: mm): (a) HPFB structure; (b) TFB structure.
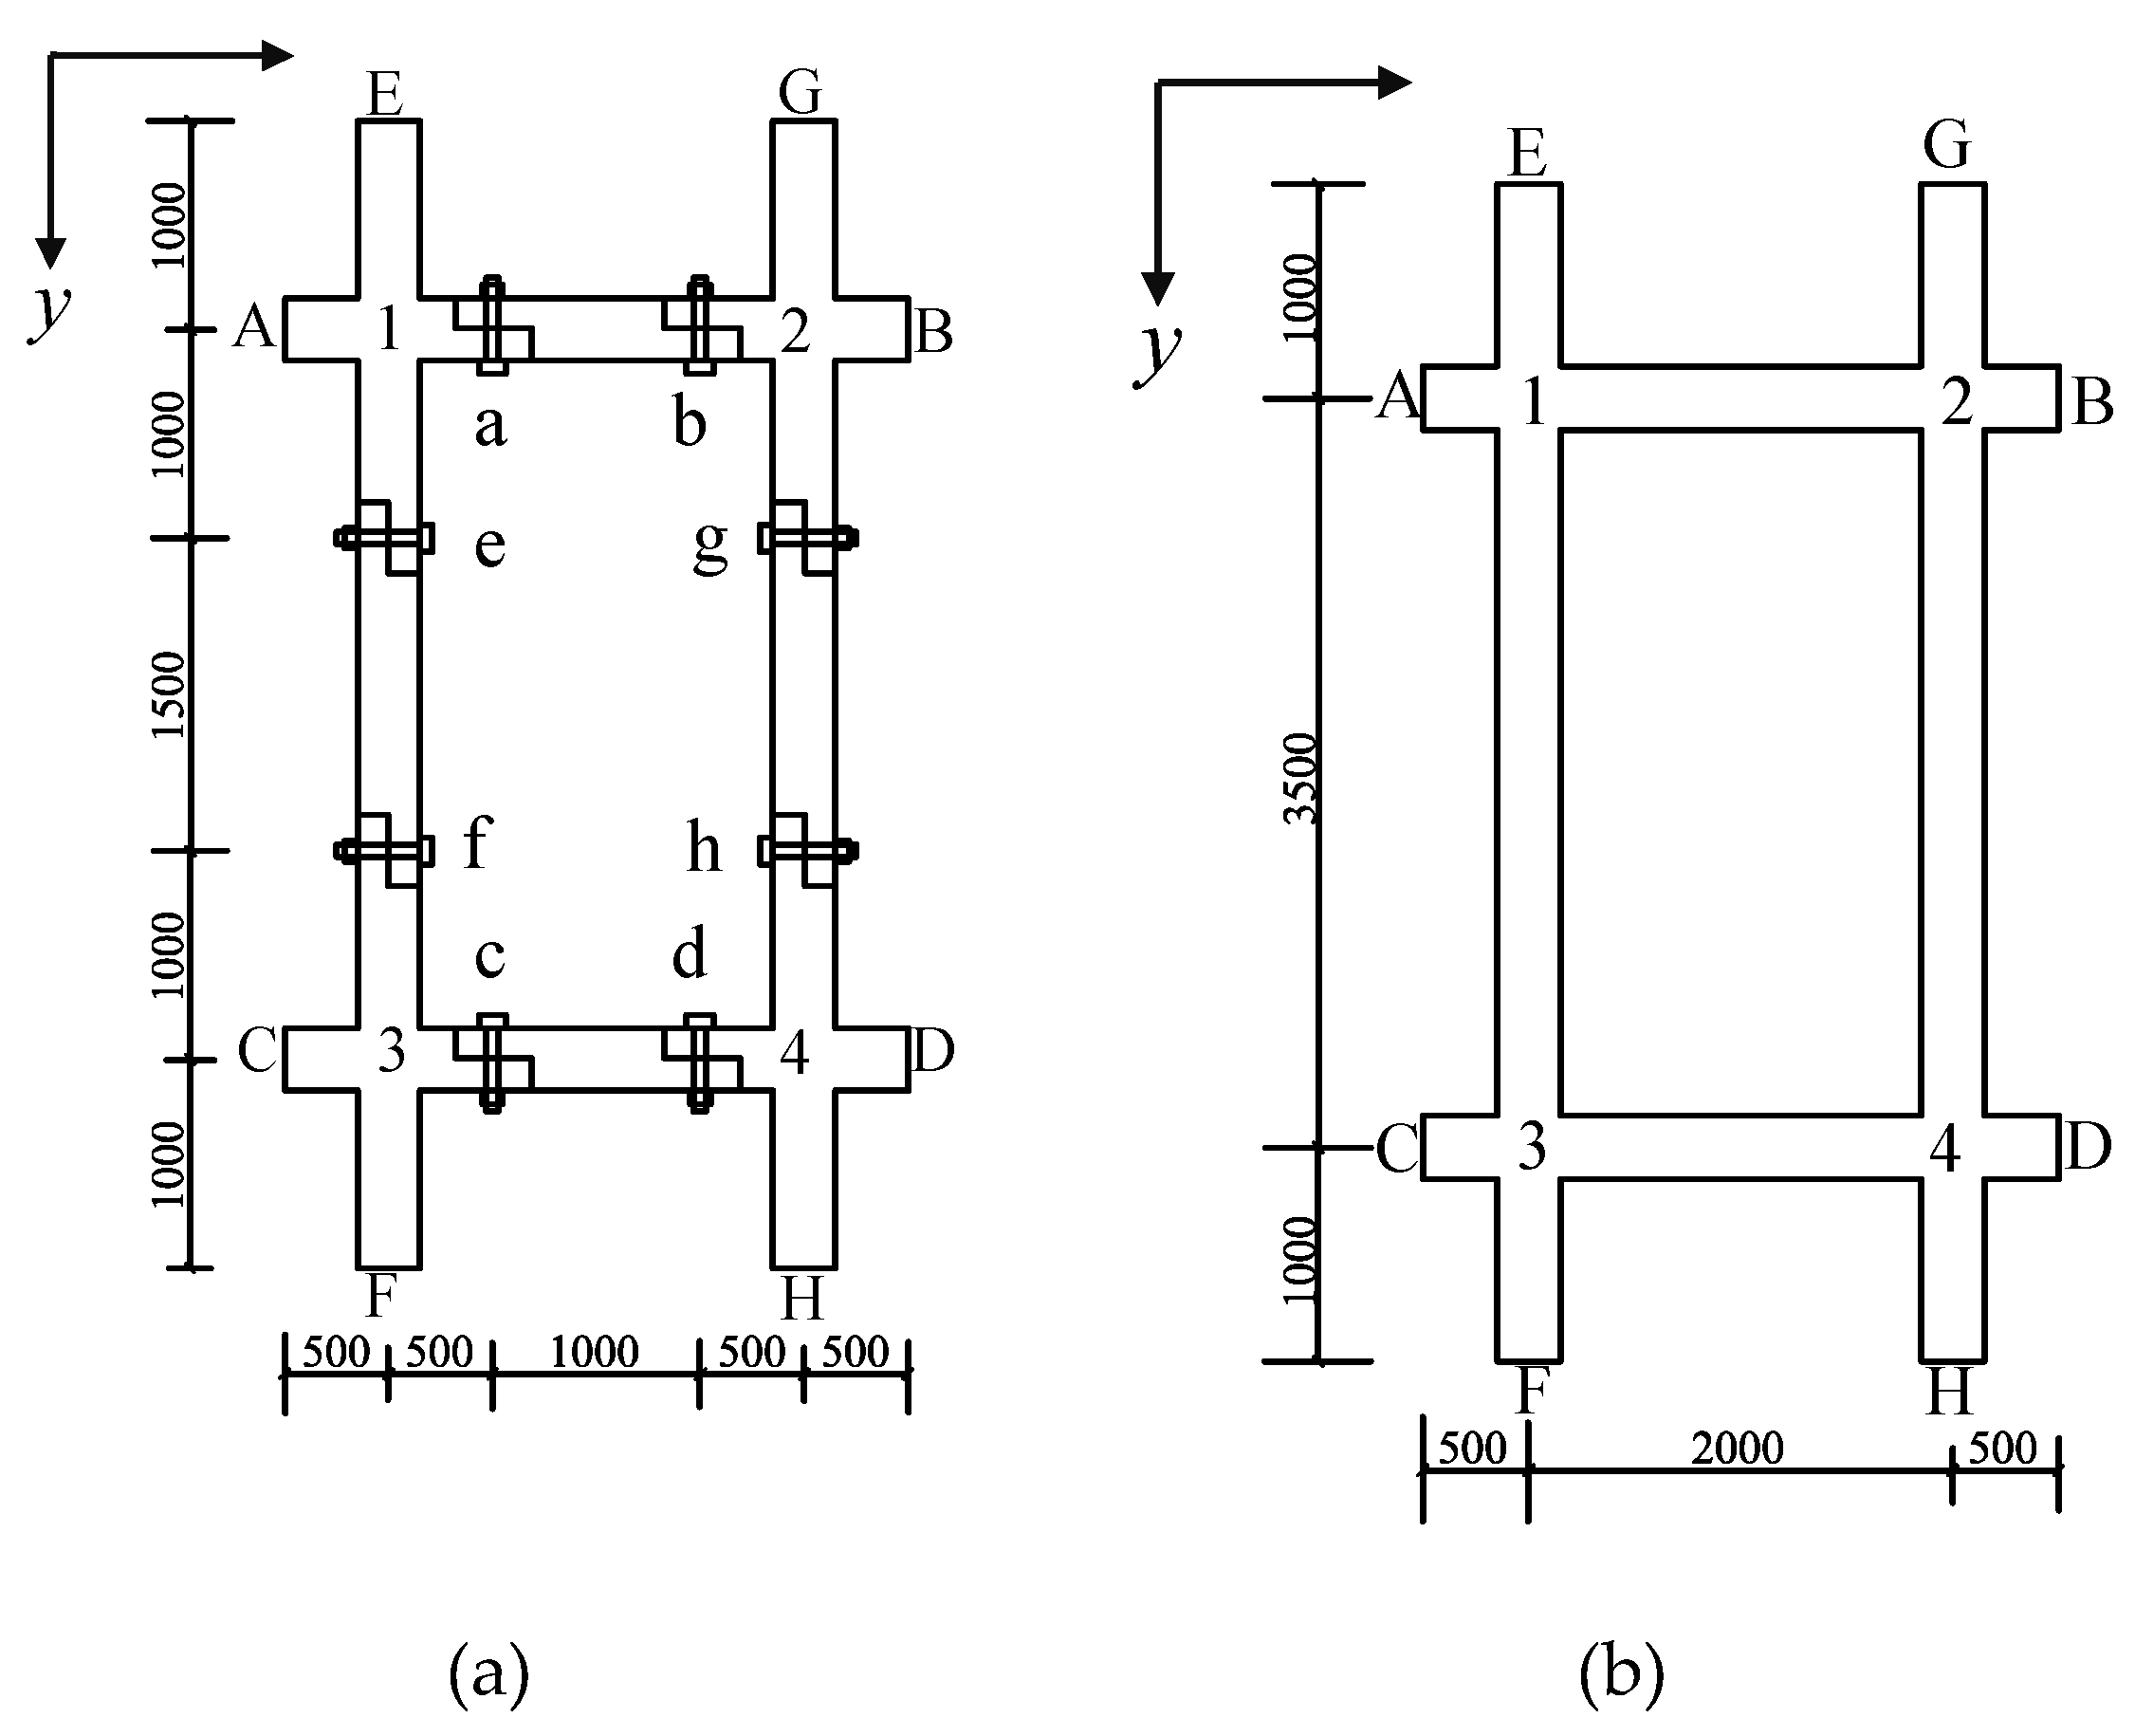
Figure 6.
Deflection curves of horizontal beam AB for both structures.
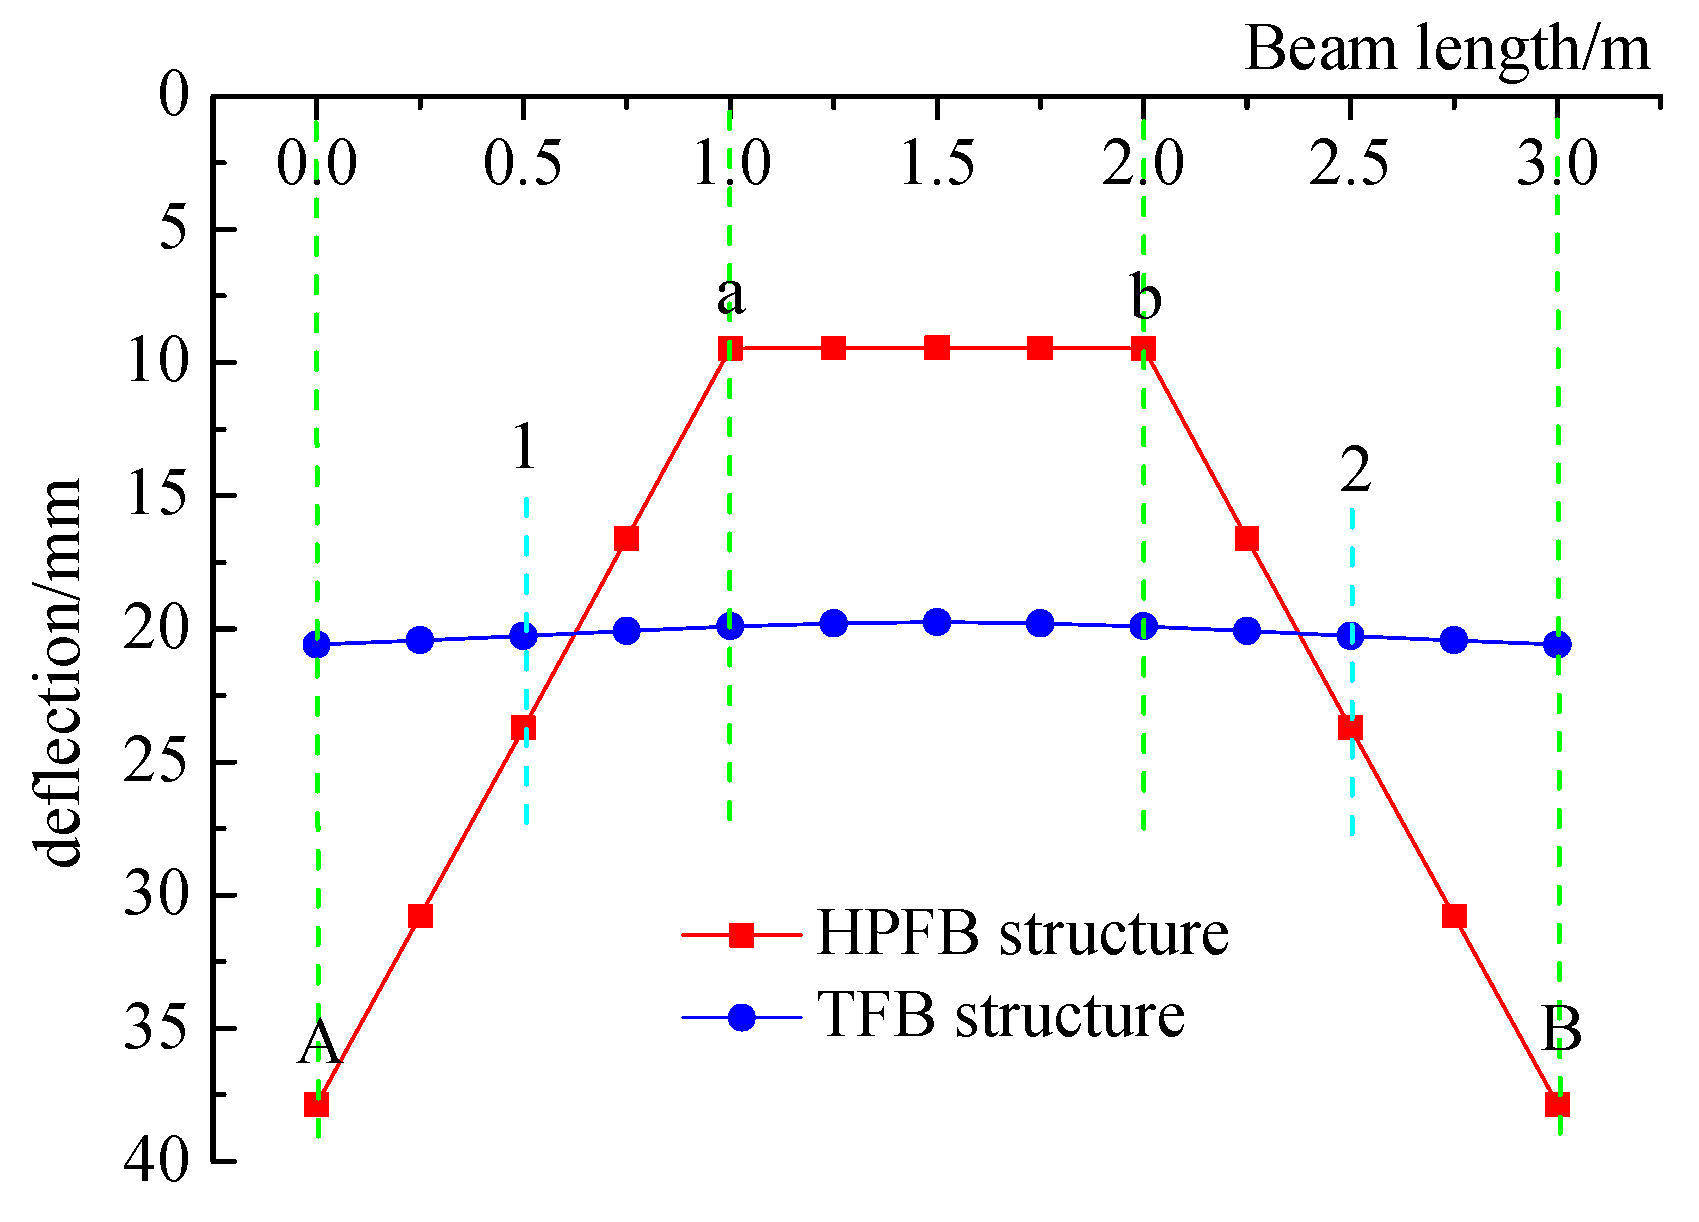
Figure 7.
Deflection curves of longitudinal beam EF for both structures.
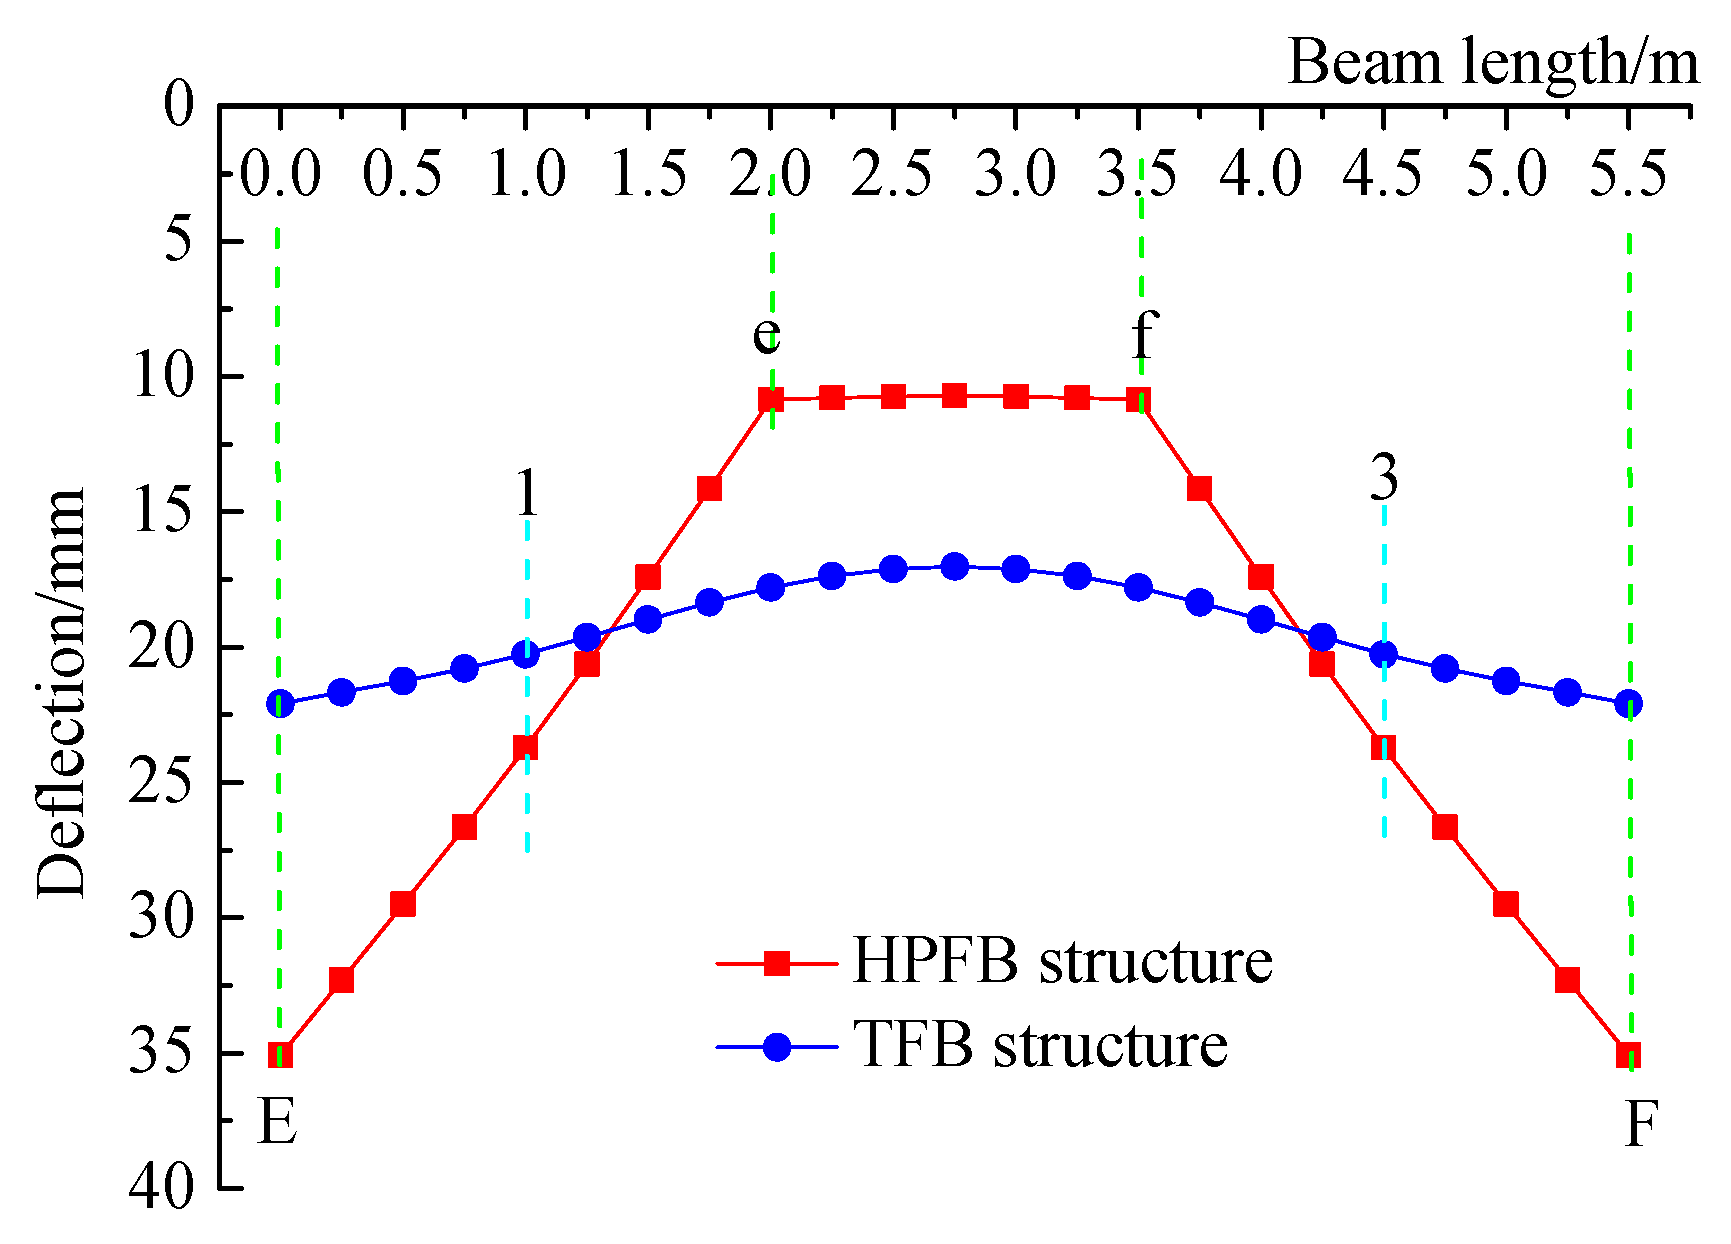
Figure 8.
Bending moment curves of horizontal beam AB for both structures.
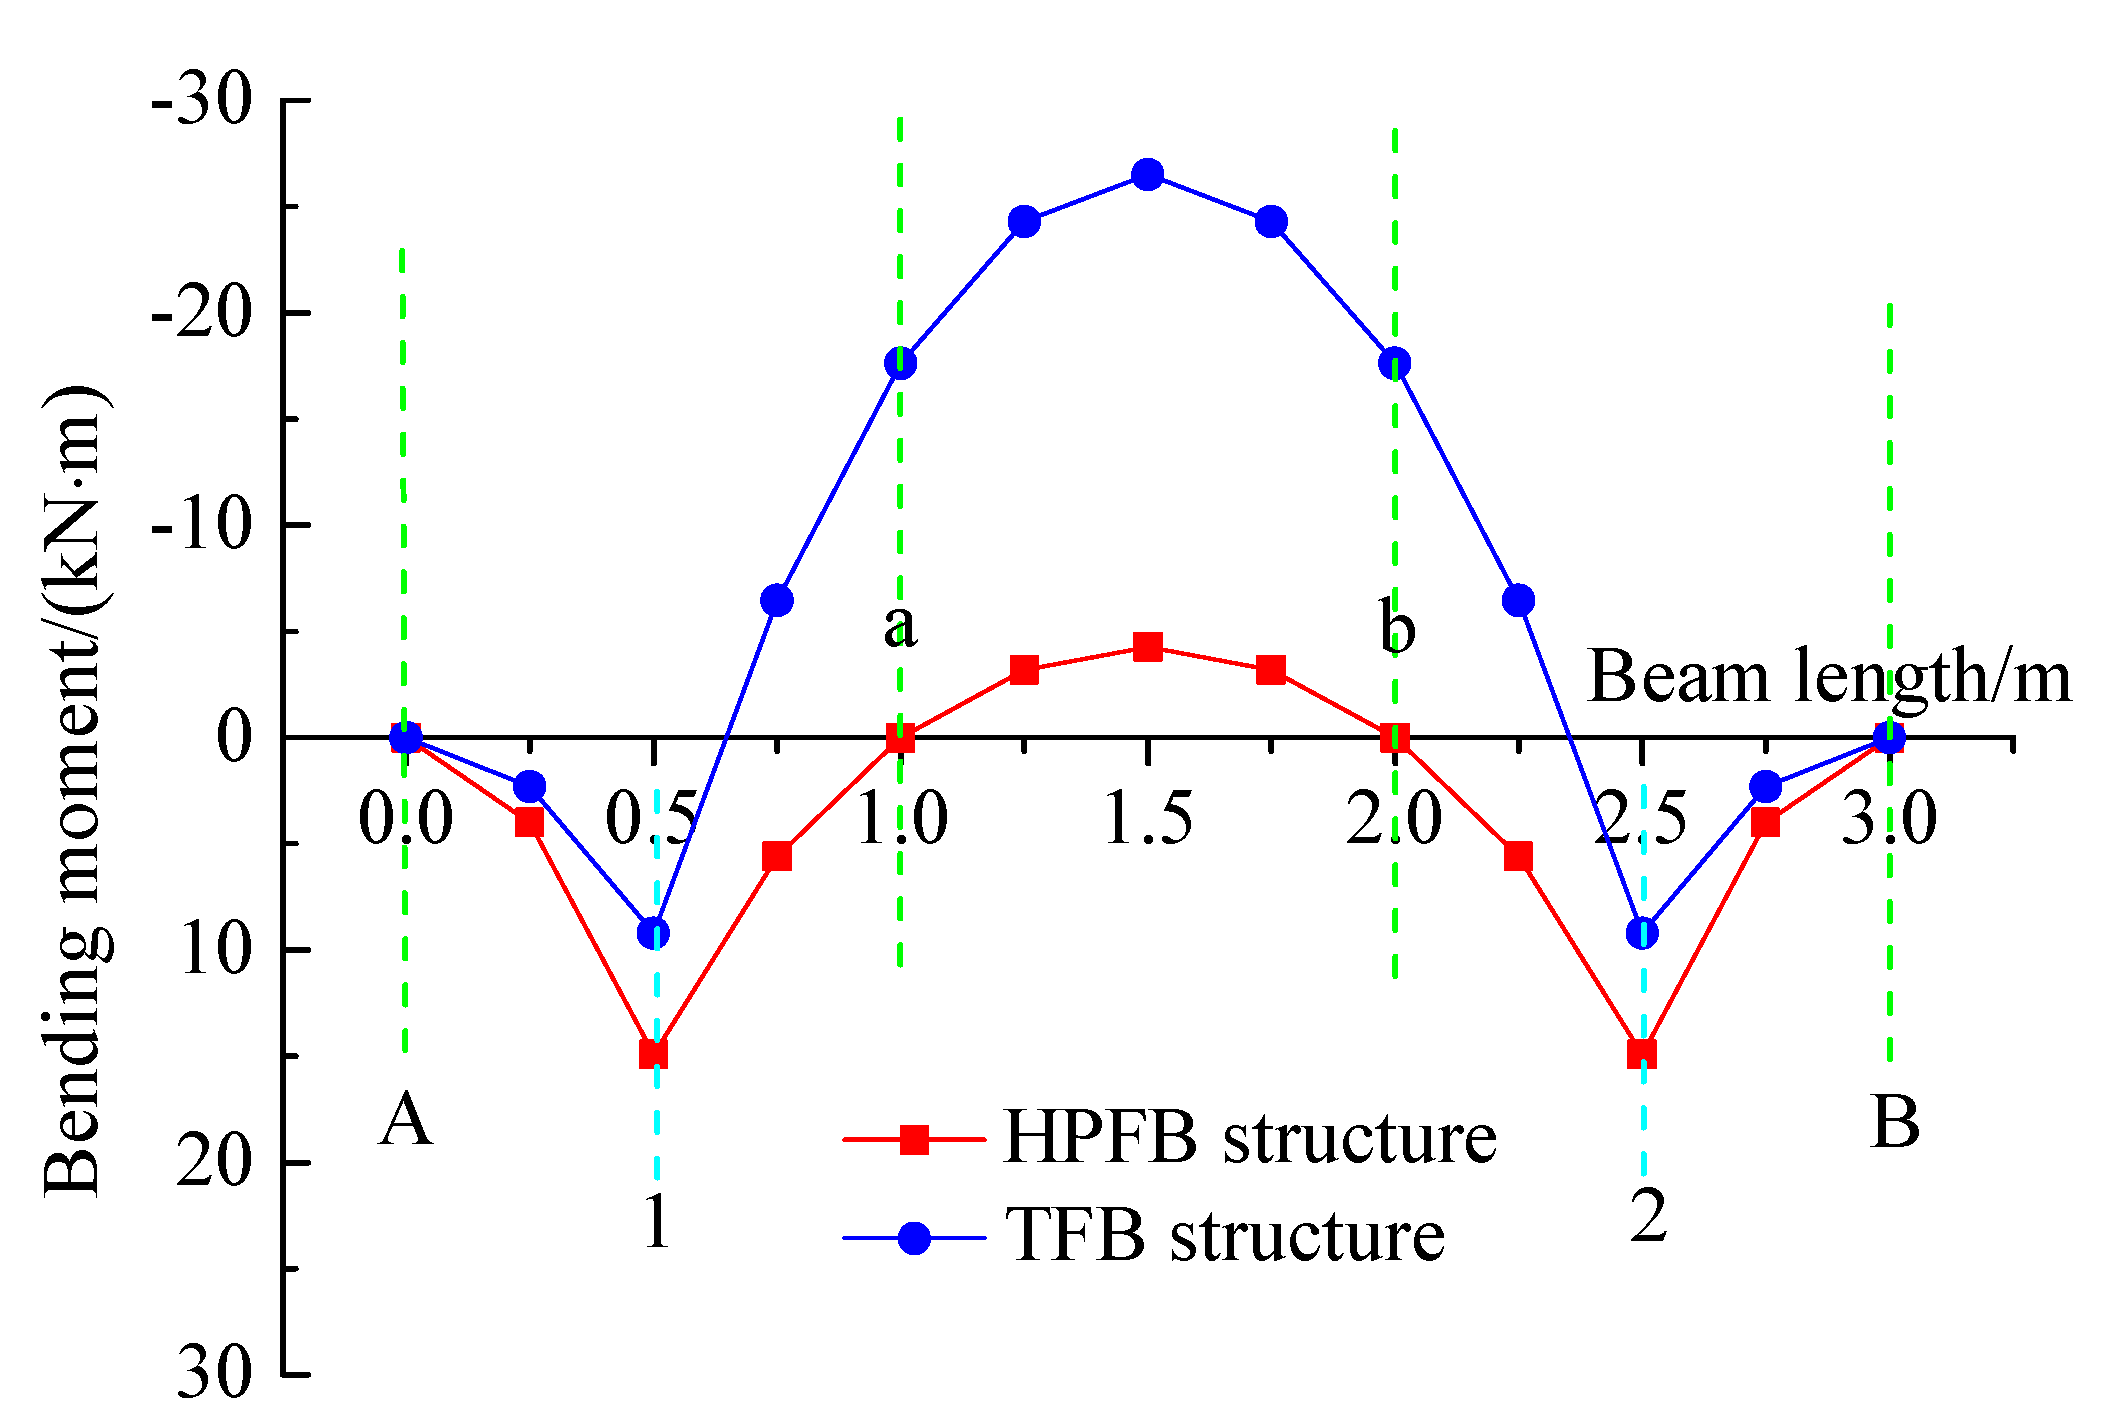
Figure 9.
Bending moment curves of longitudinal beam EF for both structures.
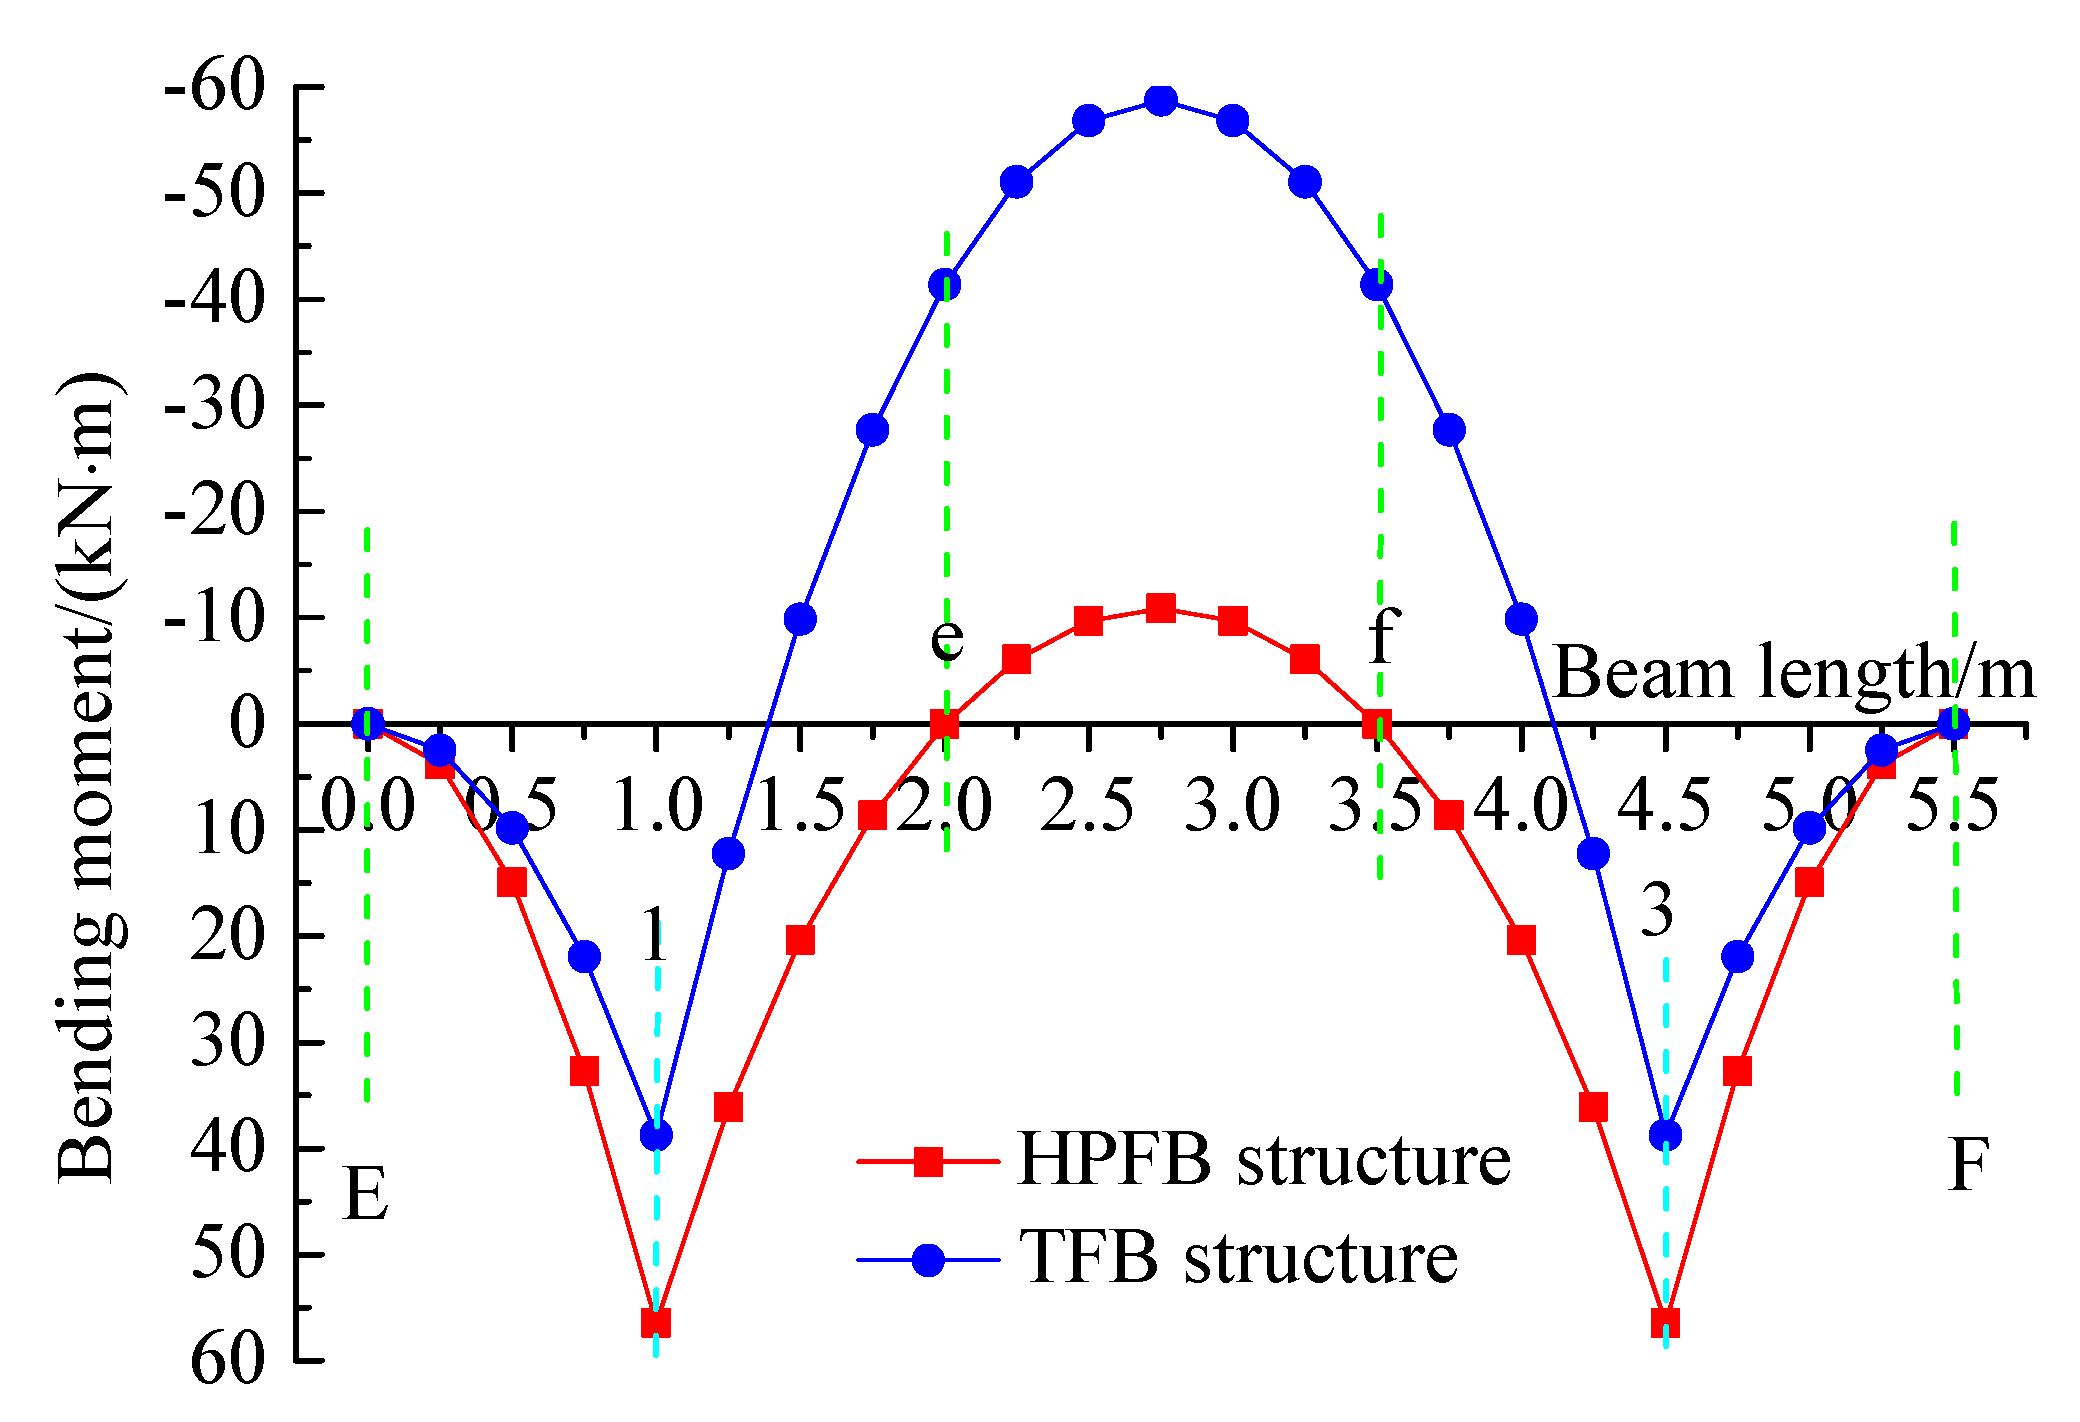
Figure 10.
Shear force diagrams of horizontal beam AB for both structures.
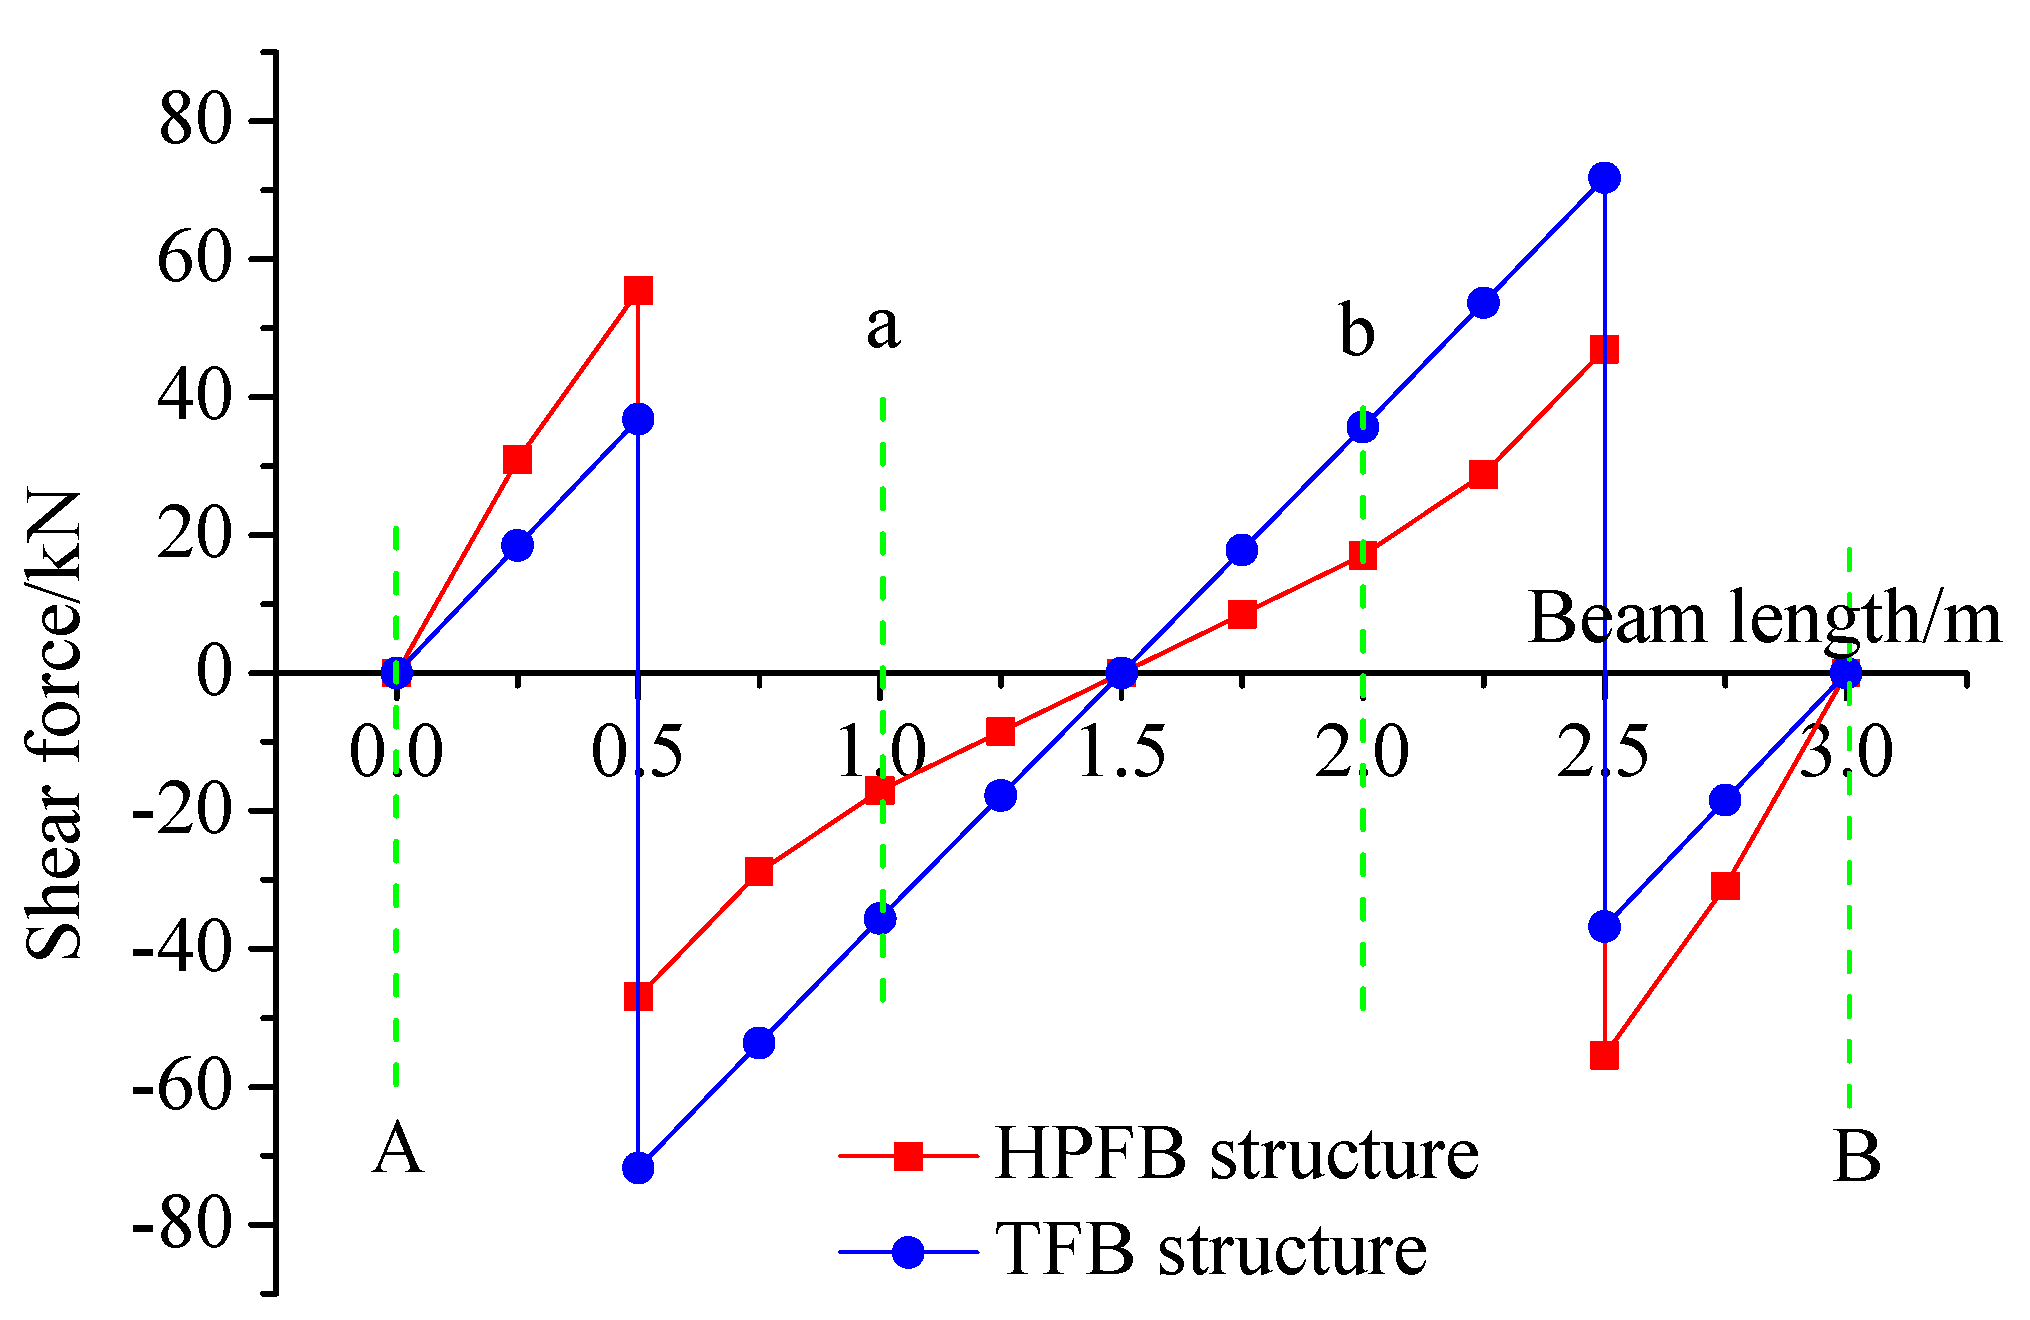
Figure 11.
Shear force diagrams of longitudinal beam EF for both structures.
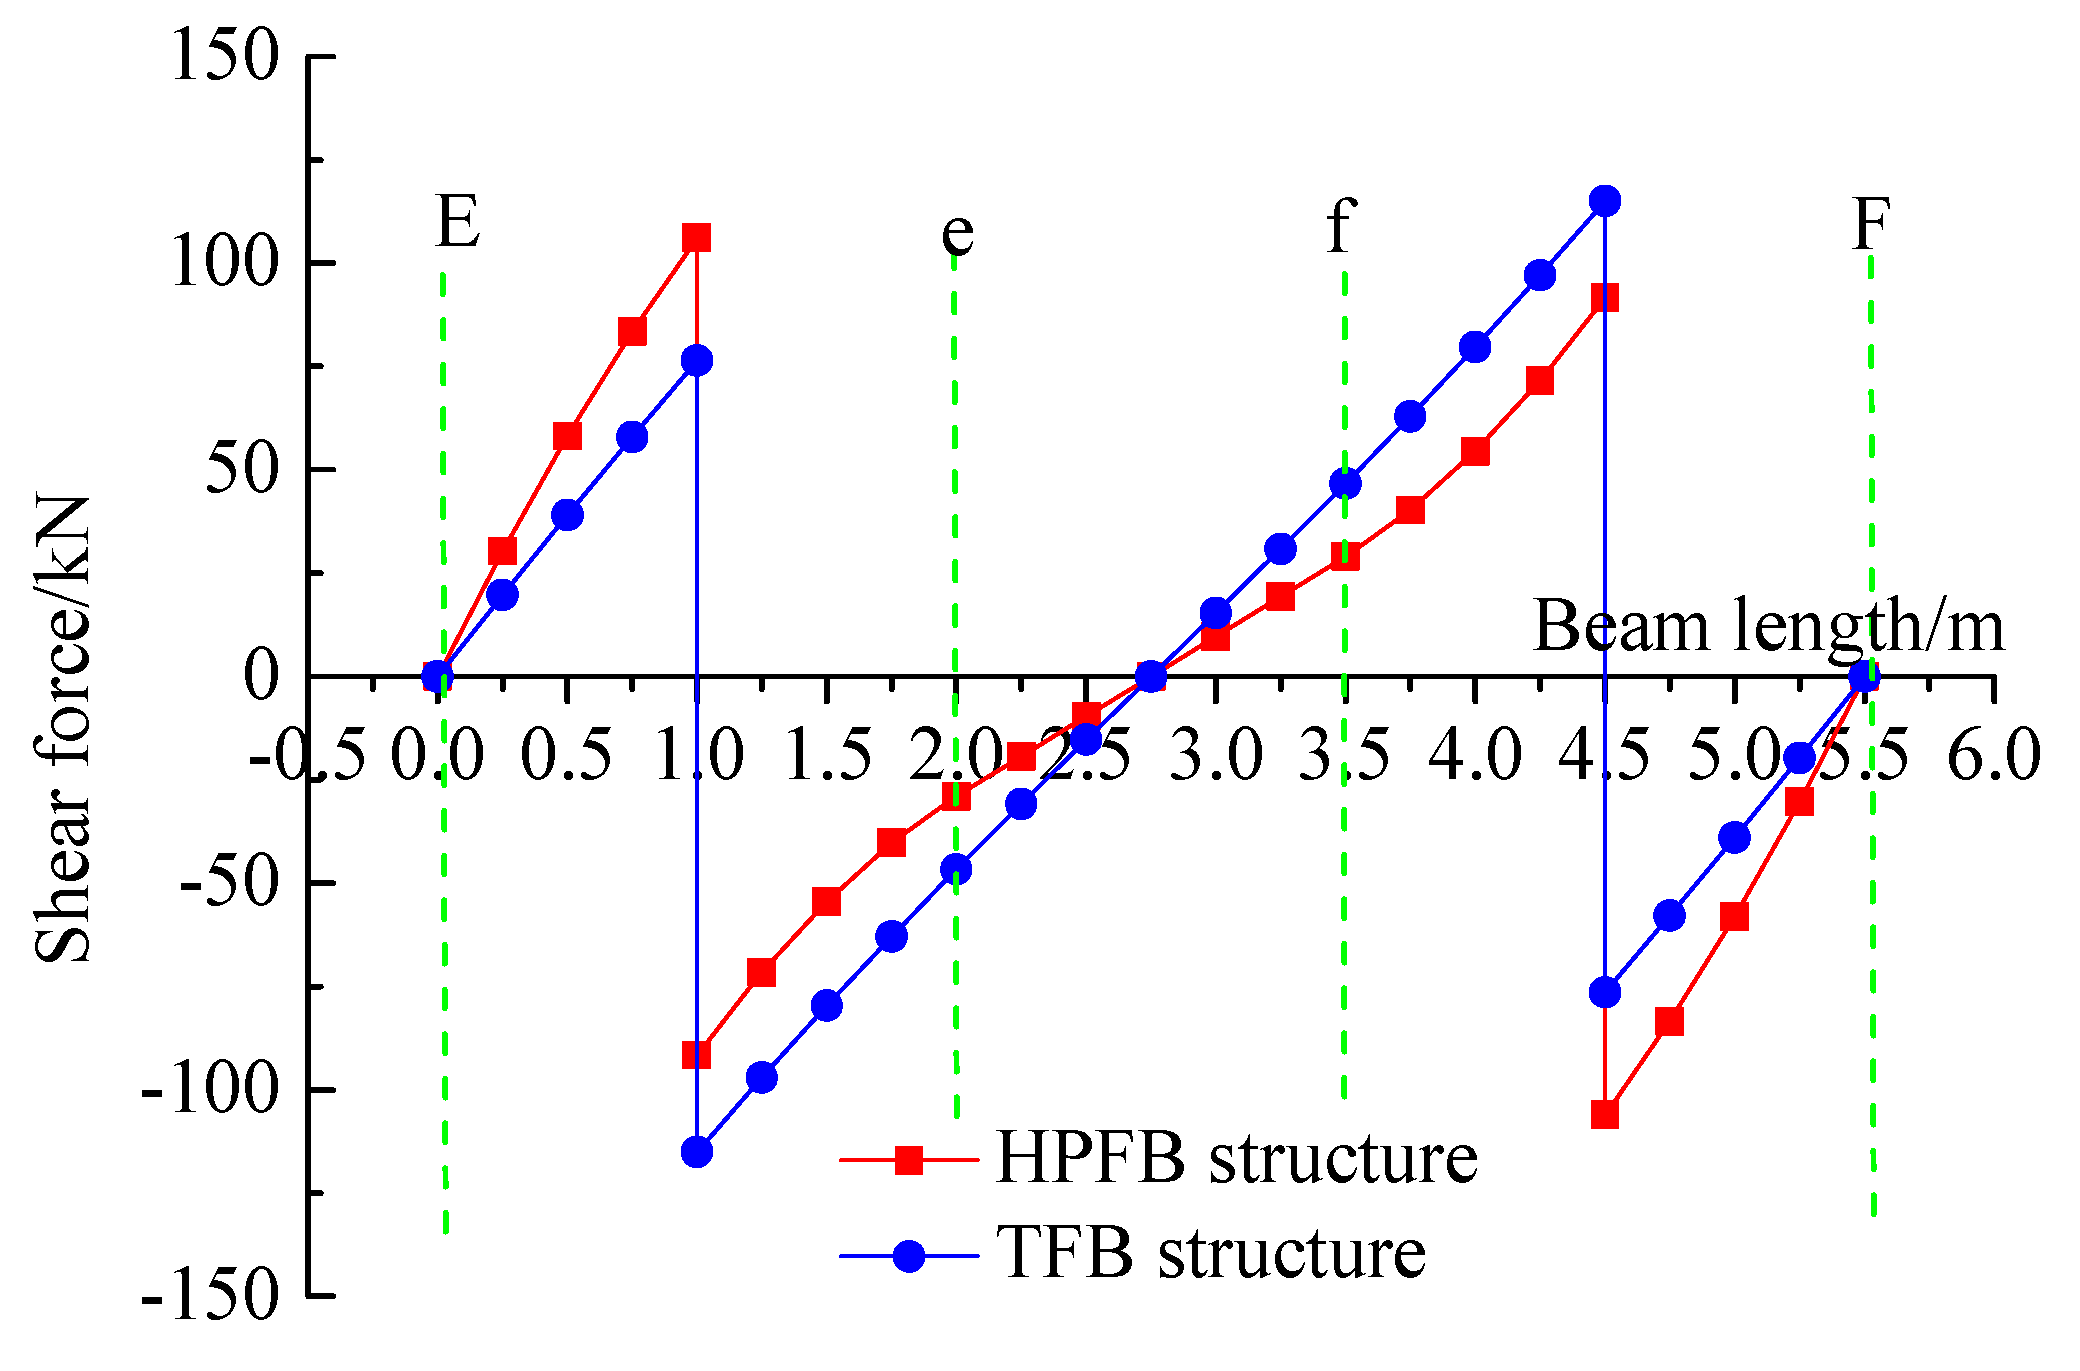
Figure 12.
Deflection Curves of Horizontal Beam AB to the Subgrade Reaction Coefficient.
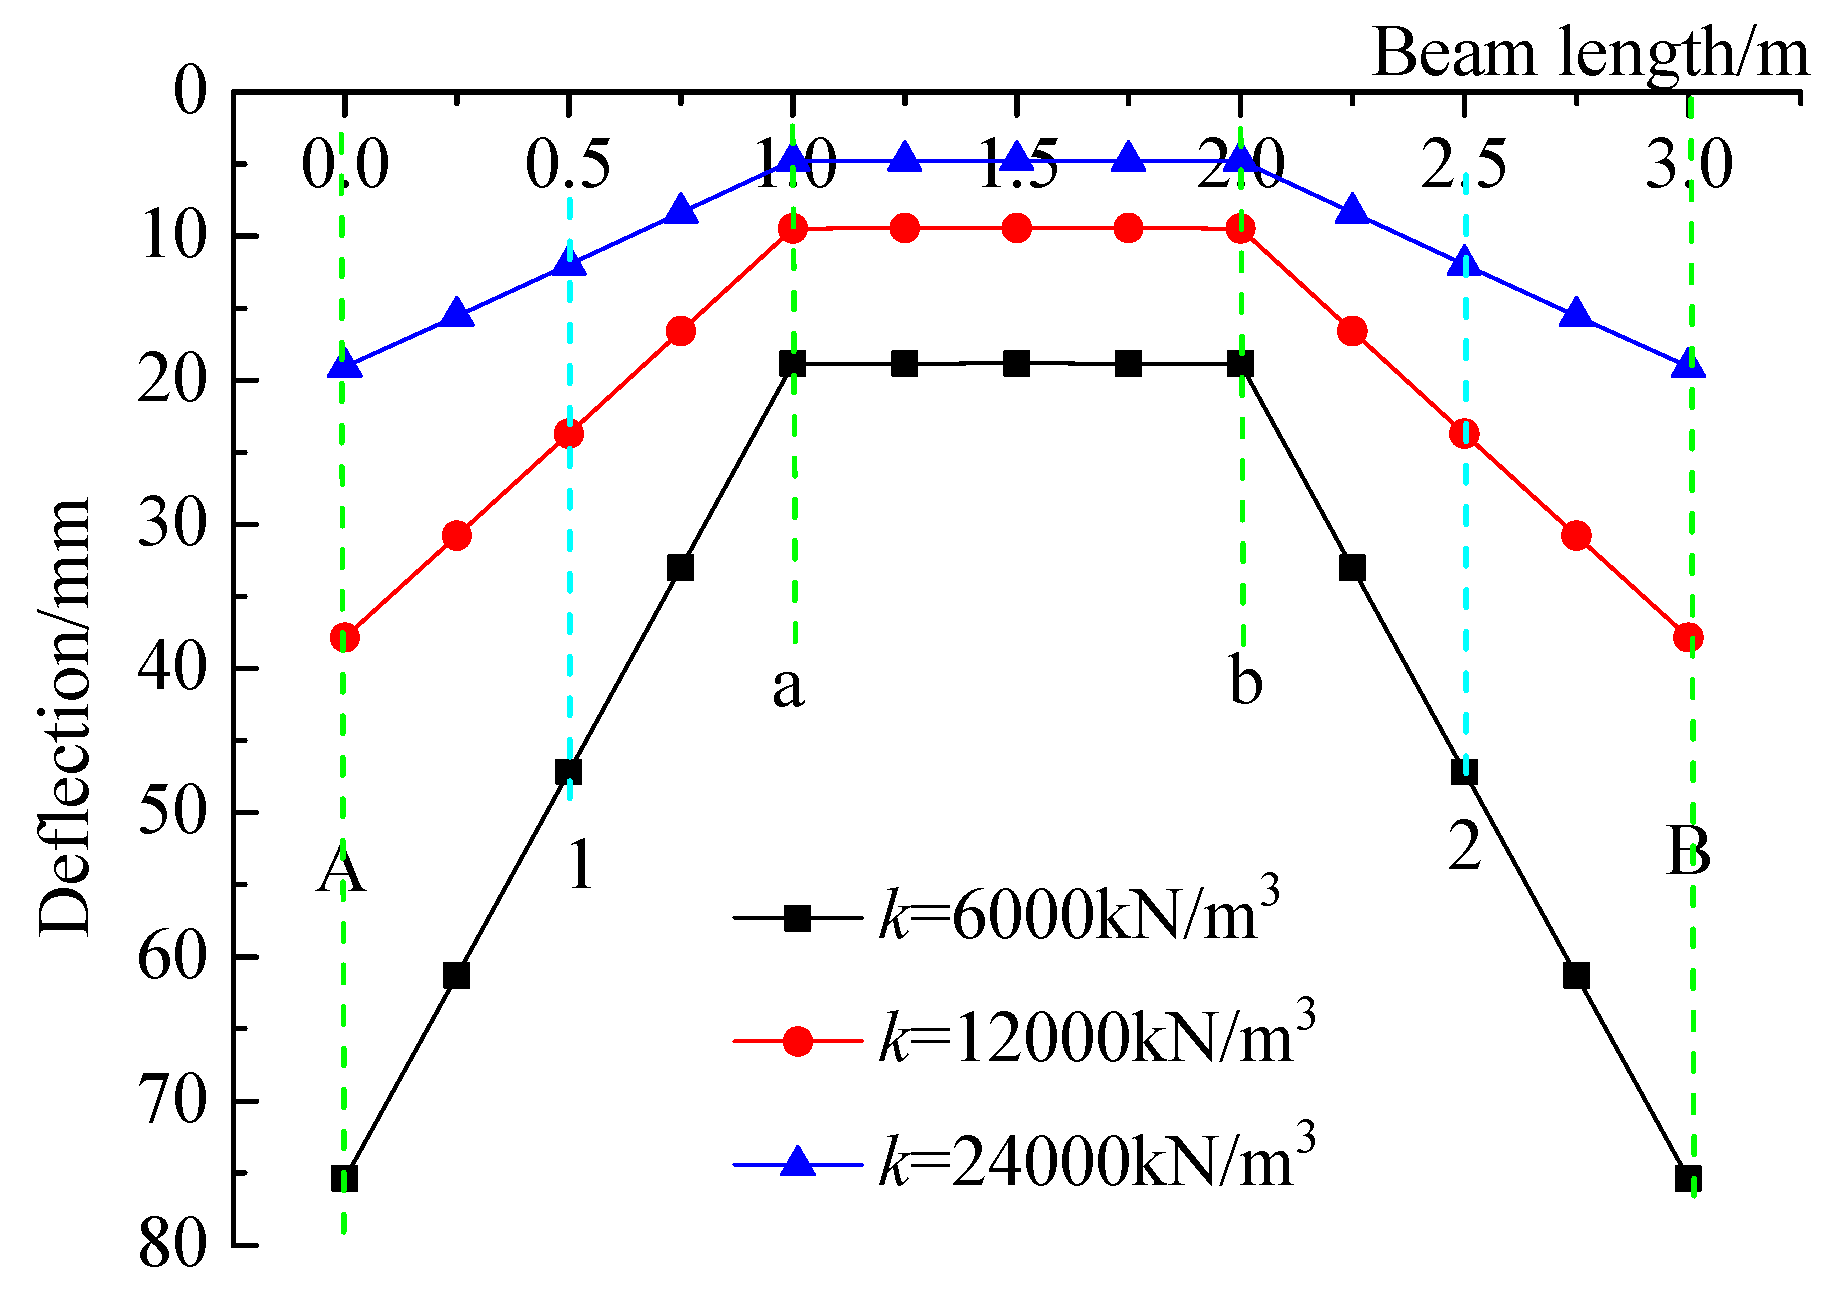
Figure 13.
Deflection Curves of Longitudinal Beam EF to the Subgrade Reaction Coefficients.
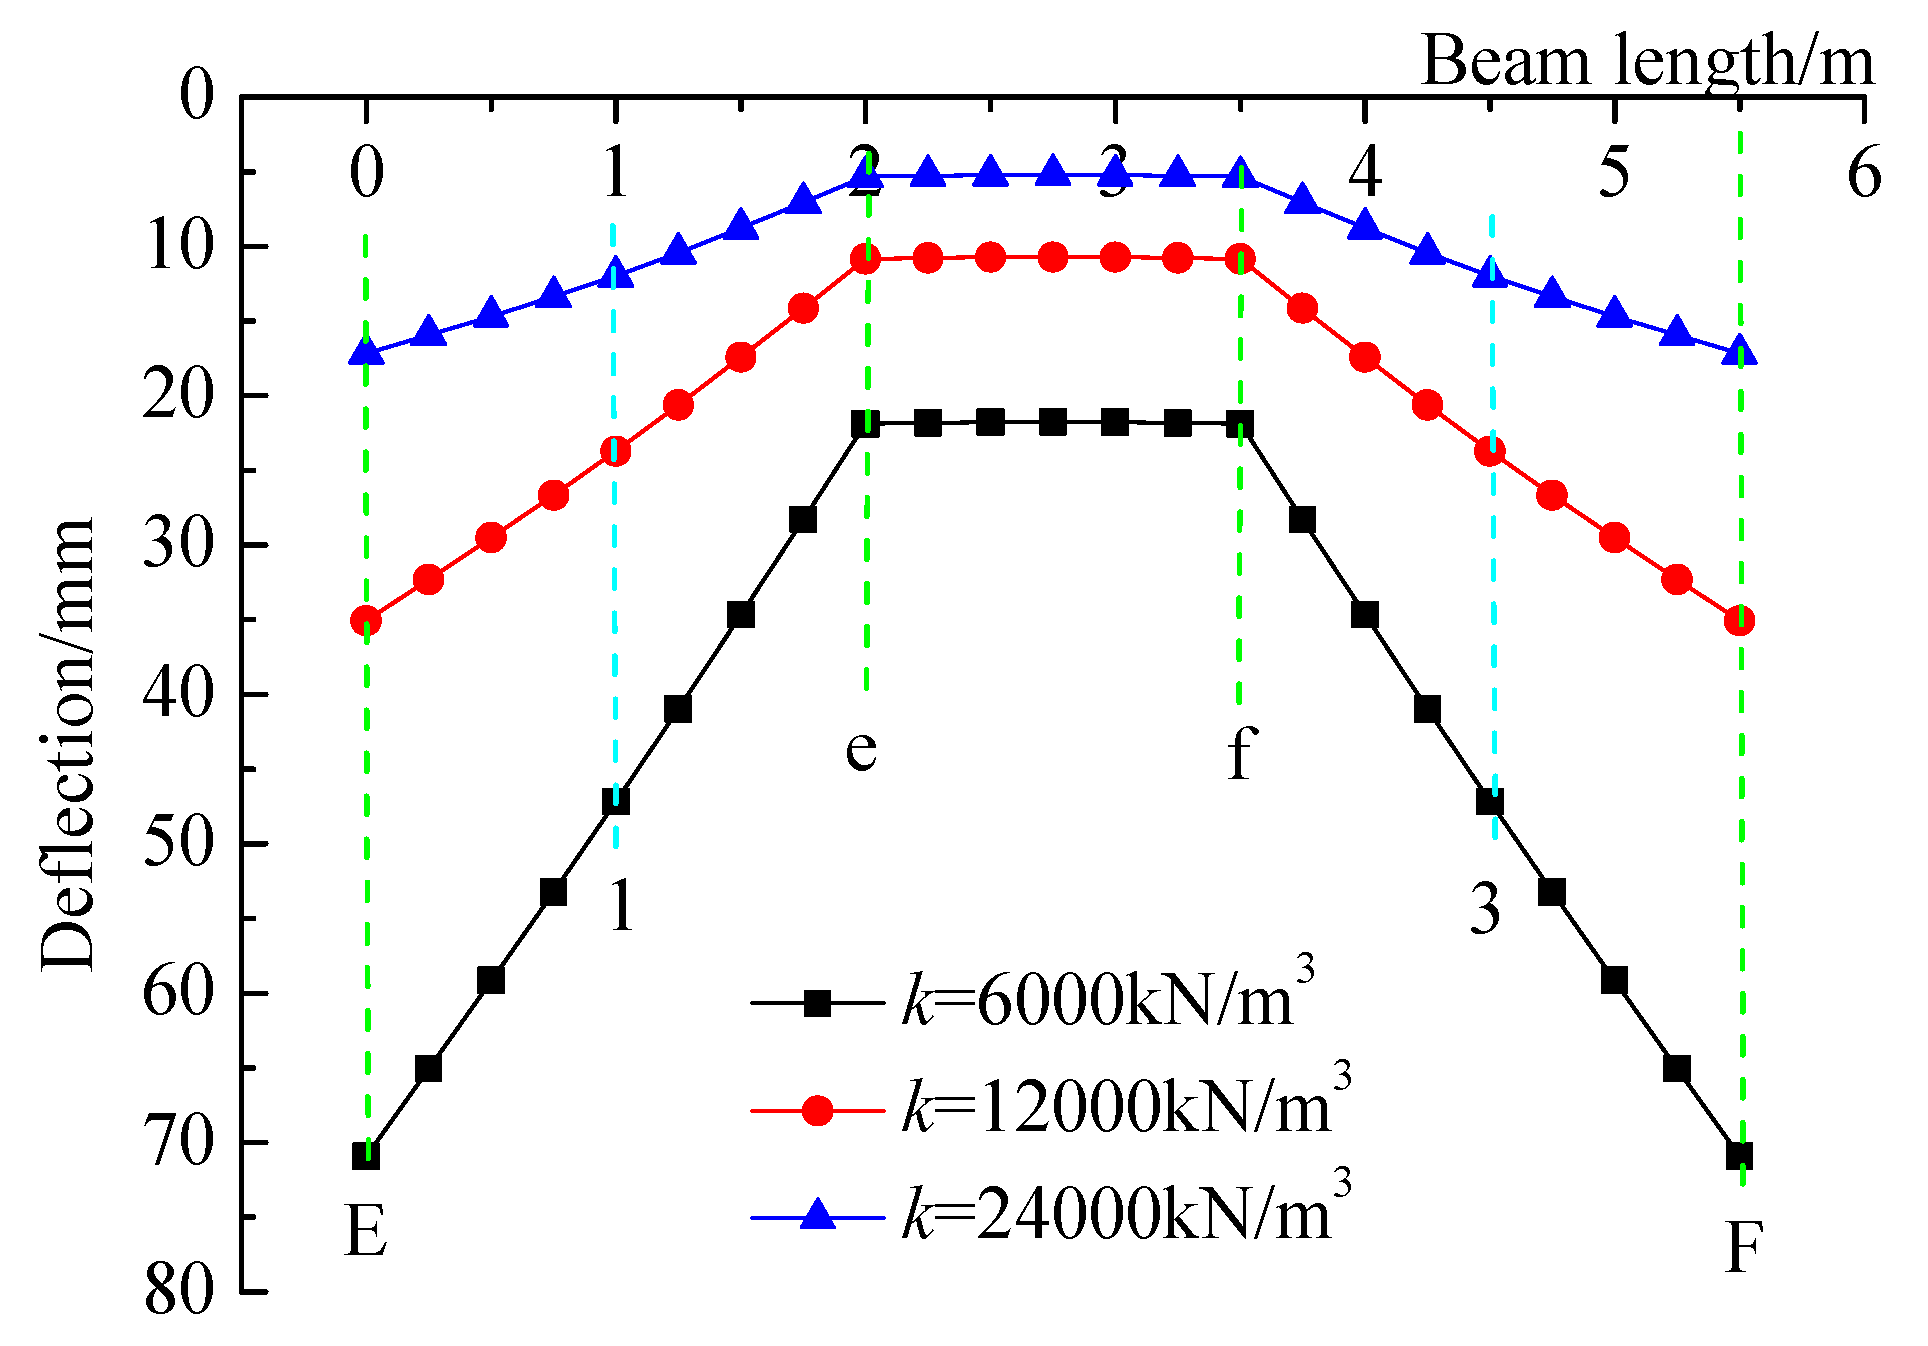
Figure 14.
Bending Moment Curves of Horizontal Beam AB to the Subgrade Reaction Coefficients.
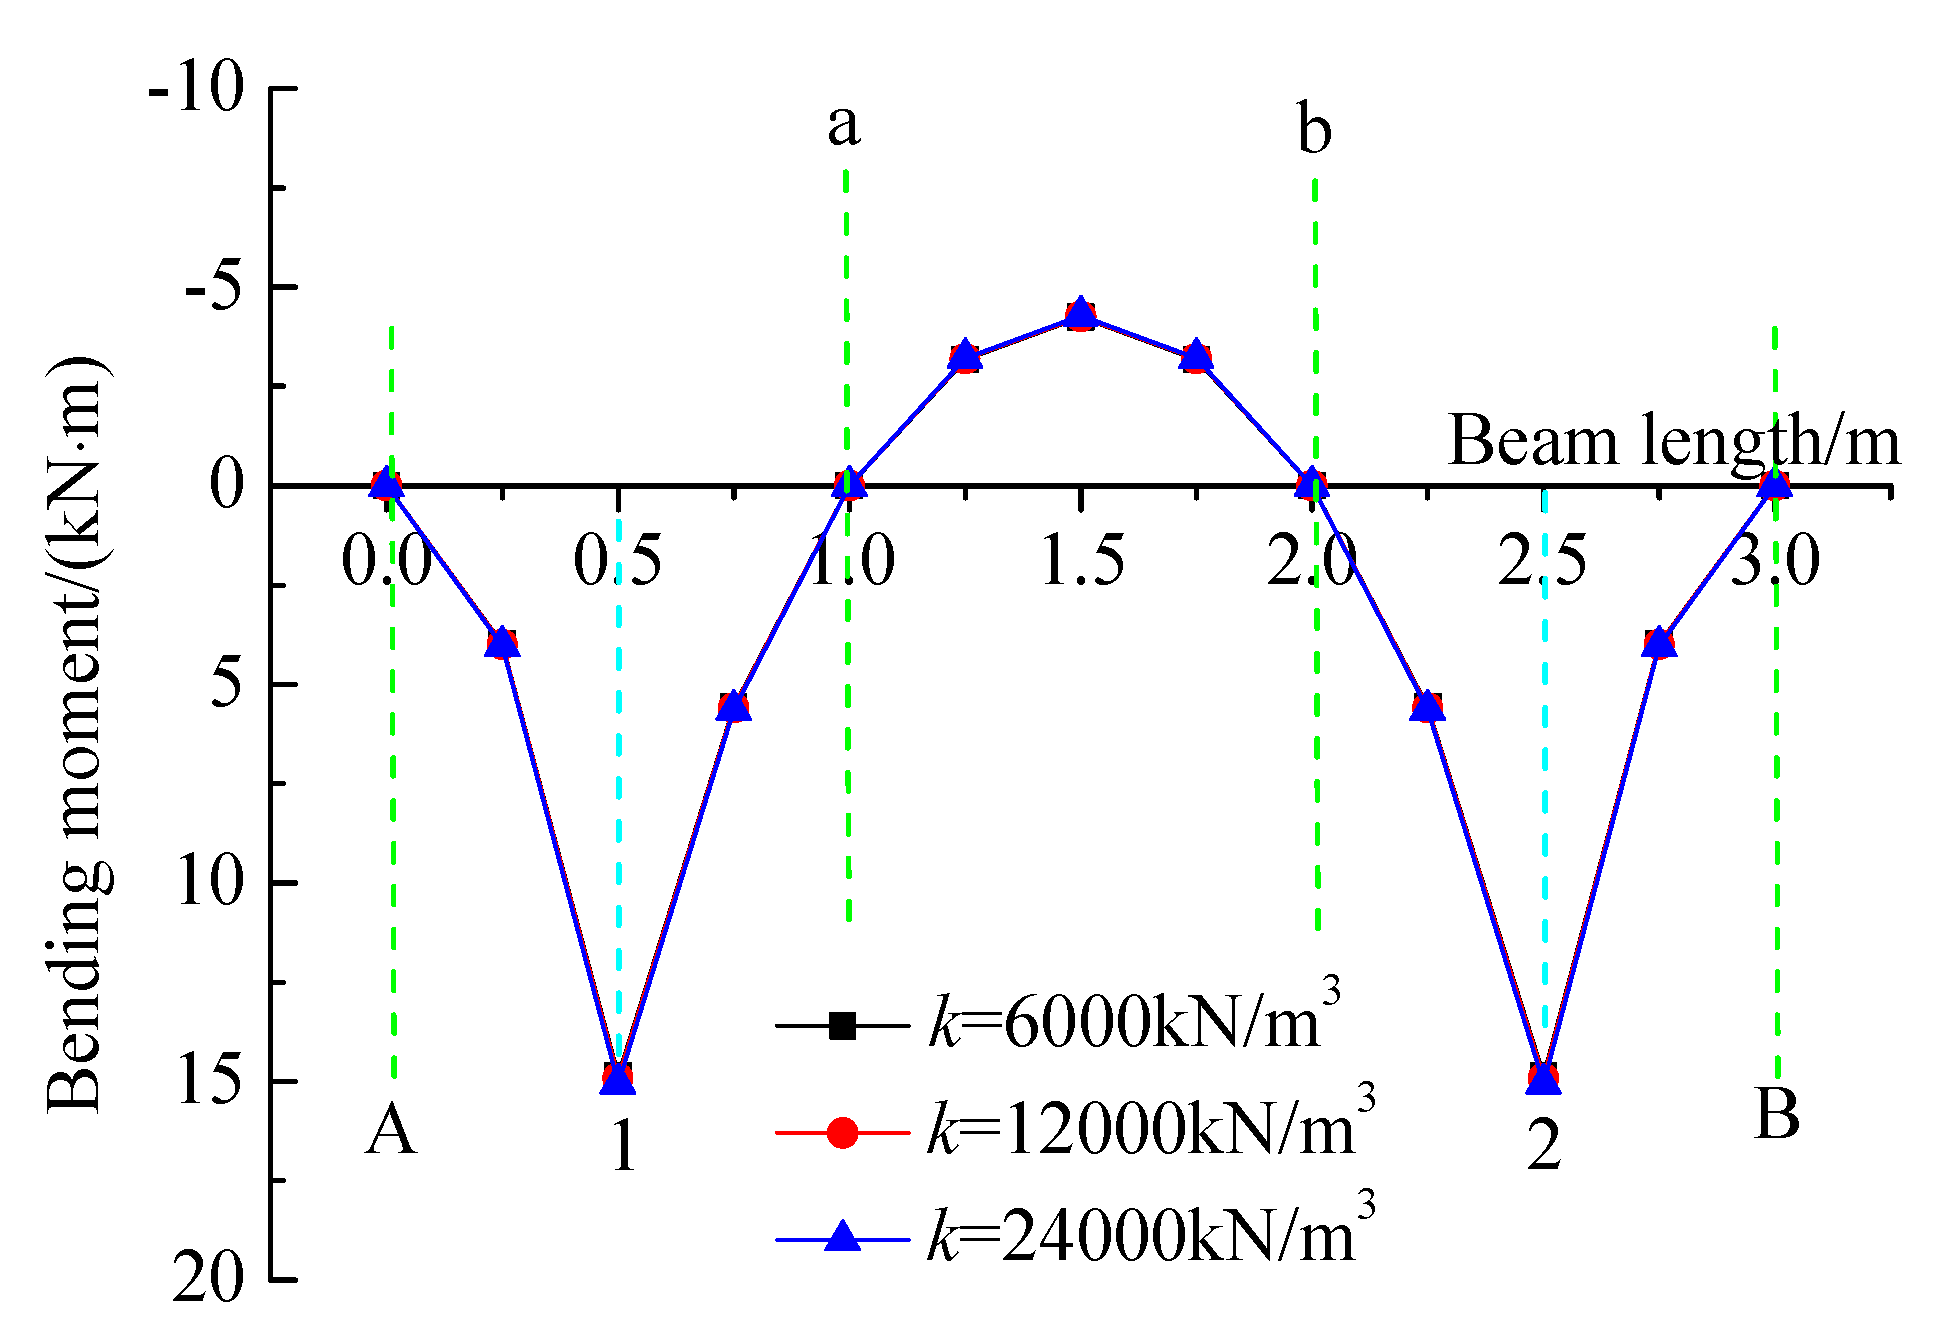
Figure 15.
Bending Moment Curves of Longitudinal Beam EF to the Subgrade Reaction Coefficients.
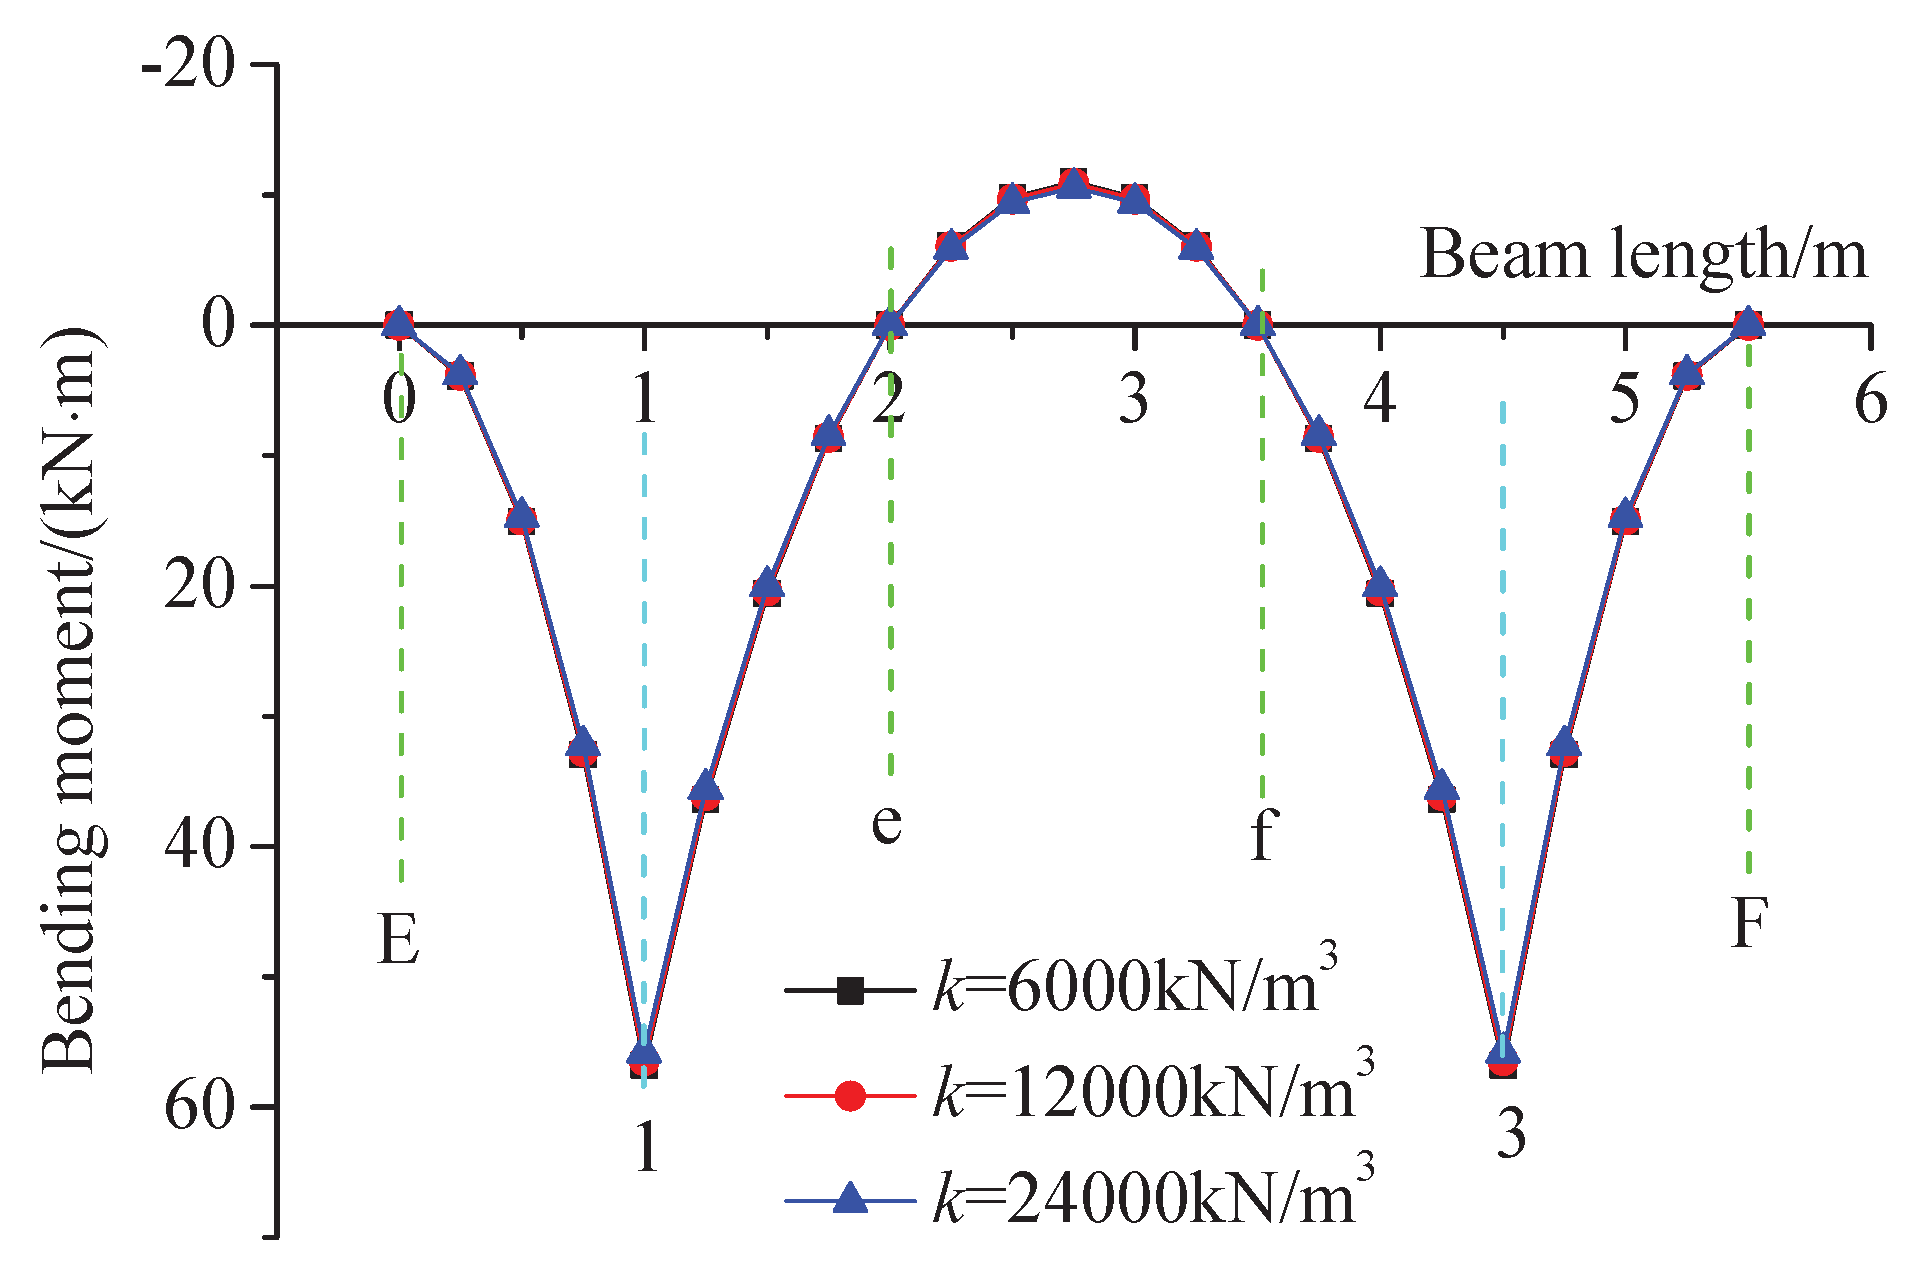
Figure 16.
Shear Force Curves of Horizontal Beam AB to the Subgrade Reaction Coefficients.
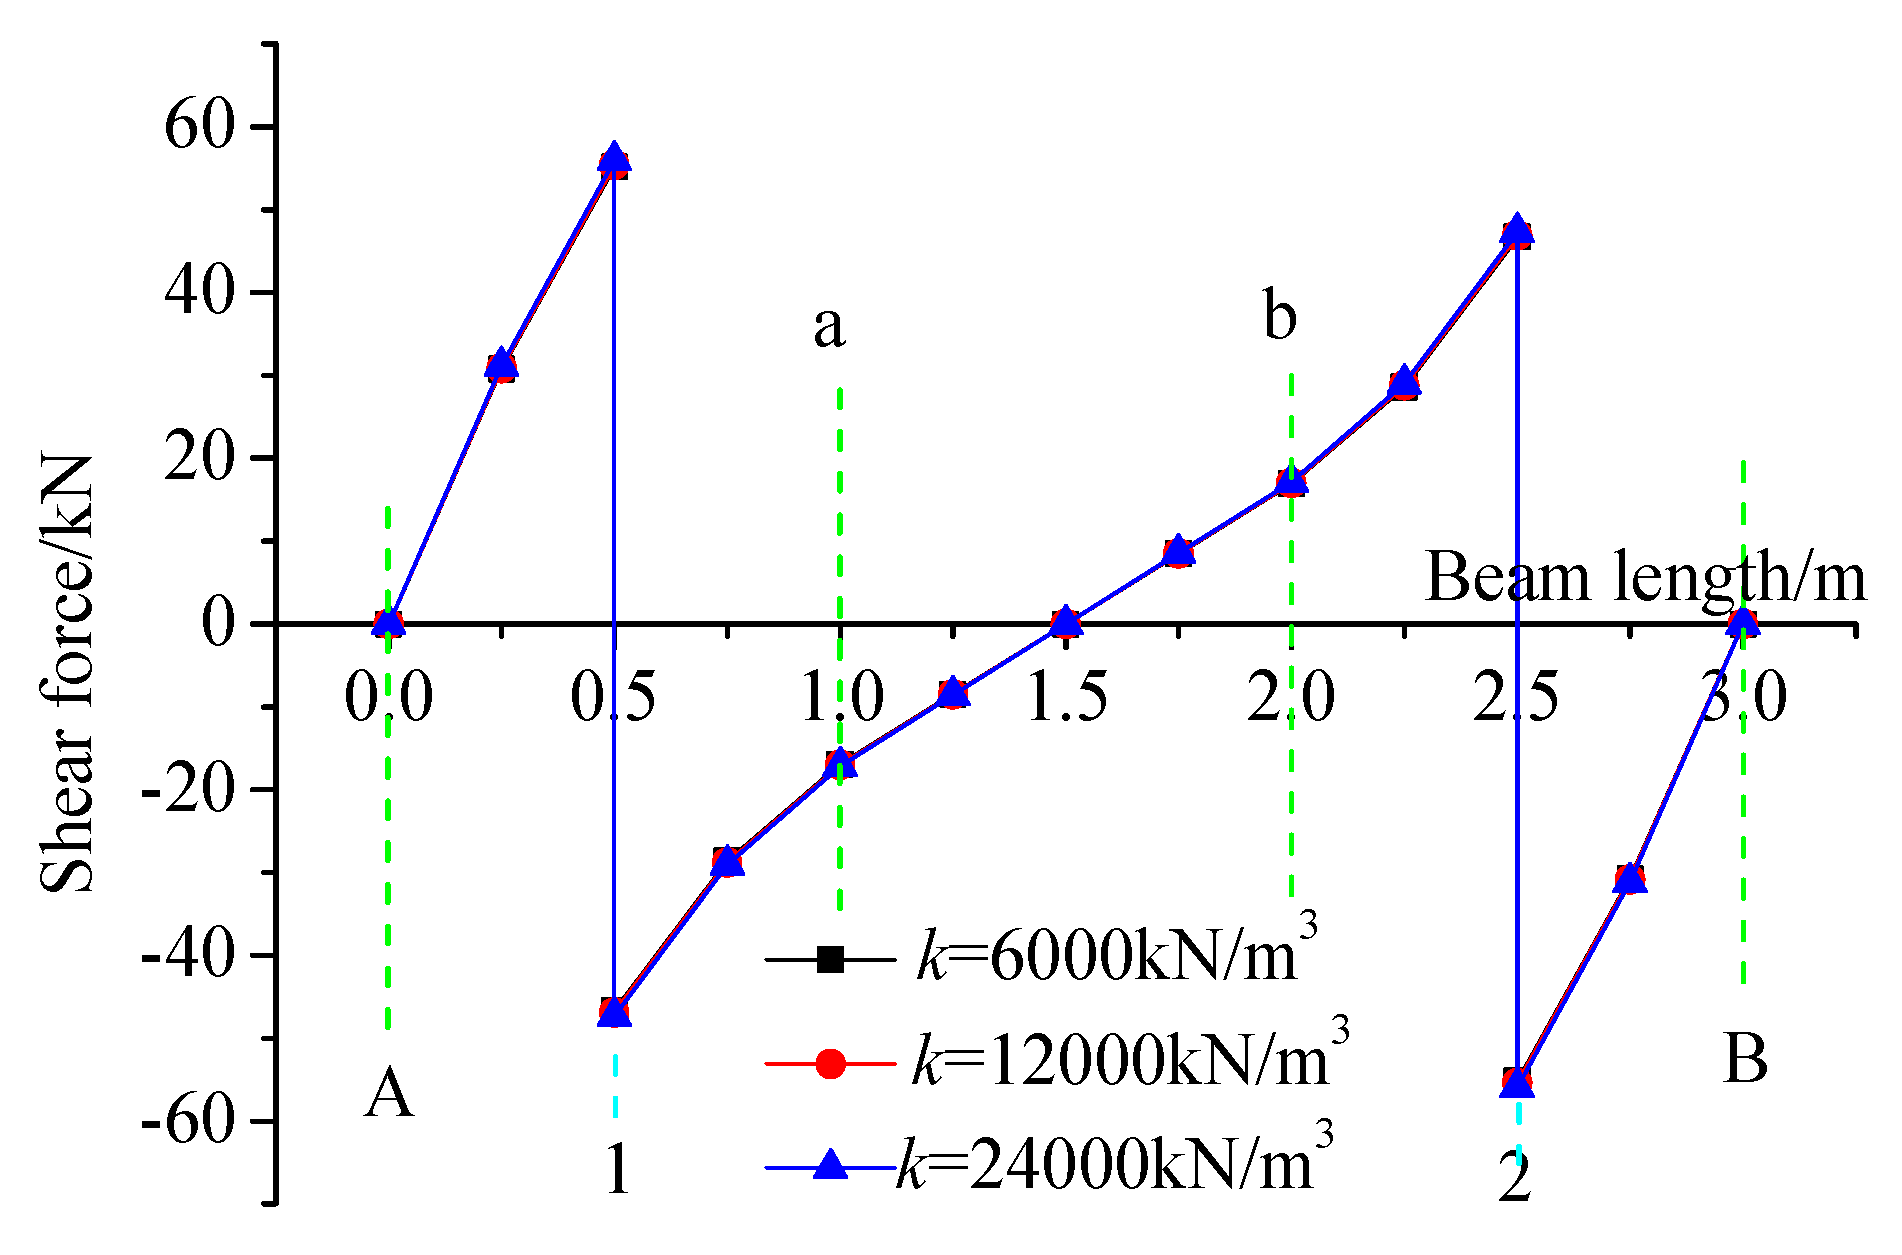
Figure 17.
Shear Force Curves of Longitudinal Beam EF to the Subgrade Reaction Coefficients.
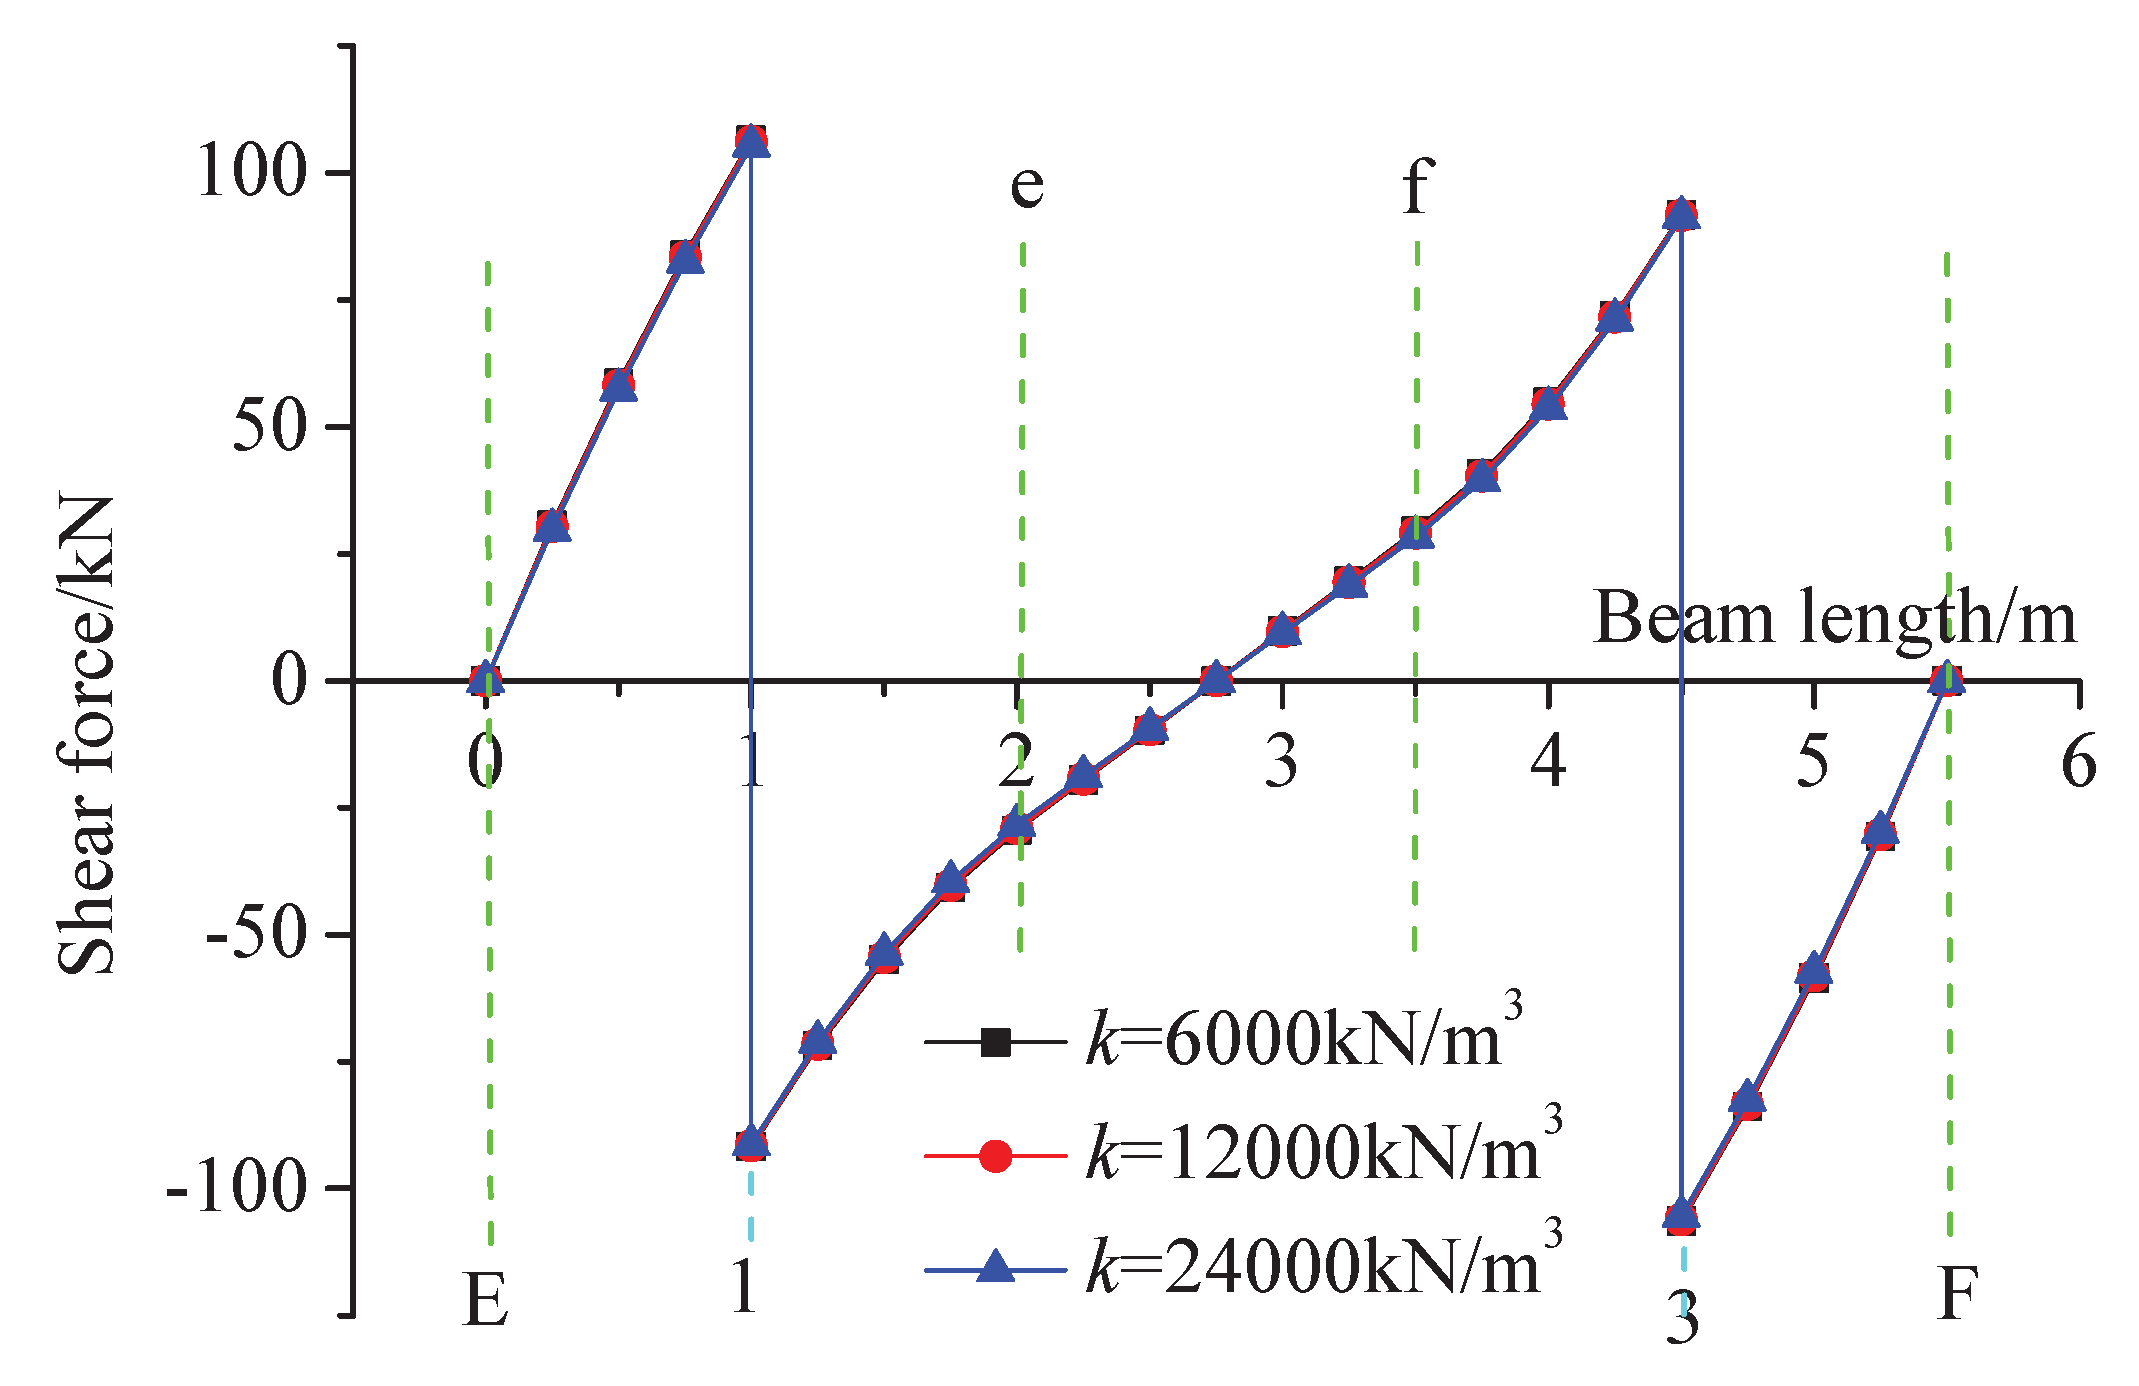

Table 1.
Load distribution and beam-end shear forces.
| HPFB structure | TFB structure | ||||
| F1x/kN | F1y/kN | Fa/kN | Fe/kN | F1x/kN | F1y/kN |
| 102.331 | 197.699 | 17.0278 | 29.0528 | 108.557 | 191.443 |
Table 2.
Deflections of beam segments and horizontal/longitudinal beams.
| HPFB structure | TFB structure | ||||||
| w1x/mm | w1y/mm | waAa/mm | waab/mm | weEe/mm | weef/mm | w1x/mm | w1y/mm |
| 23.7151 | 23.7151 | 9.4738 | 9.4739 | 10.8409 | 10.8409 | 20.2595 | 20.2595 |
Table 3.
Load Distribution and Beam-End Shear Forces under Various Subgrade Reaction Coefficients.
| k=6000kN/m3 | k=12000kN/m3 | k=24000kN/m3 | |
| F1x/kN | 101.833 | 102.331 | 103.305 |
| F1y/kN | 198.167 | 197.669 | 196.695 |
| Fa/kN | 16.9585 | 17.0278 | 17.1622 |
| Fe/kN | 29.4237 | 29.0528 | 28.3292 |
Disclaimer/Publisher’s Note: The statements, opinions and data contained in all publications are solely those of the individual author(s) and contributor(s) and not of MDPI and/or the editor(s). MDPI and/or the editor(s) disclaim responsibility for any injury to people or property resulting from any ideas, methods, instructions or products referred to in the content. |
© 2025 by the authors. Licensee MDPI, Basel, Switzerland. This article is an open access article distributed under the terms and conditions of the Creative Commons Attribution (CC BY) license (http://creativecommons.org/licenses/by/4.0/).
Copyright: This open access article is published under a Creative Commons CC BY 4.0 license, which permit the free download, distribution, and reuse, provided that the author and preprint are cited in any reuse.


