Submitted:
22 September 2025
Posted:
23 September 2025
You are already at the latest version
Abstract
Background: Dynamic whole-body (D-WB) FDG PET/CT is a novel technique that enables the direct reconstruction of multiparametric images representing the FDG metabolic uptake rate (MRFDG) and "free" FDG (DVFDG). Applying complementary parameters with distinct characteristics compared to static SUV images, the aims of this study are as follows: 1) to determine the threshold values of SUV, MRFDG, and DVFDG for malignant and benign lesions; 2) to compare the specificity of MRFDG and DVFDG images with static SUVbw images; 3) to assess whether any of the dynamic imaging parameters correlate more significantly with malignancy or non-malignancy in the examined lesions based on the measured values obtained from D-WB FDG PET/CT.
Results: Patlak PET parameters (MRFDG, DVFDG) combined with mean SUVbw achieved the highest accuracy of 0.82 (F1-score = 0.90) for malignancy detection. Classification accuracy in tumors was 0.86 (F1 = 0.92), lymph nodes reached 0.81 (F1 = 0.89). Relative contribution analysis showed that DVFDG accounted for up to 65 % of classification weight. The ROC analysis demonstrated AUC values above 0.8 for all models, with optimal thresholds achieving sensitivities around 0.85 and specificities up to 0.93. Thresholds for malignancy detection were for mean values: SUVbw>5.8 g/mL, MRFDG>0.05 µmol/mL/min, DVFDG> 68 %; for maximal values: SUVbw> 8.7 g/mL, MRFDG> 0.11 µmol/mL/min, DVFDG> 202 %.
Conclusions: The D-WB [¹⁸F]FDG PET/CT images in this study highlight the potential for improved differentiation between malignant and benign lesions compared to conventional SUVbw imaging in patients with locally advanced head and neck cancers presenting with cervical lymphadenopathy and carcinoma of unknown primary (CUP). This observation may be particularly relevant in common diagnostic dilemmas, especially in distinguishing residual or recurrent tumors from post-radiotherapy changes. Further validation in larger cohorts with histopathological confirmation is warranted.
Keywords:
PET/CT
; SUV
; multiparametric PET
; dynamic PET
; FDG
; Patlak modeling
; head and neck tumour
; lymphadenopathy
1. Background
Positron Emission Tomography/Computed Tomography (PET/CT) hybrid imaging is one of the most widely used, modern, and rapidly developing methods, primarily employed in oncological diagnostics but also for the evaluation of infection and inflammation [1].
PET/CT imaging is conventionally performed at a single time point, for the most commonly used tracer 2-deoxy-2-[18F]fluoro-D-glucose ([18F]FDG), 60 minutes after its administration, followed by the reconstruction of a standardized uptake value (SUVbw) image, assessing the semiquantitative relation of the tracer uptake to glucose metabolism, normalized by the injected dose and body weight, and adjusted for factors such as timing and decay correction [2,3,4]
Although SUVbw is a commonly used semi-quantitative measure of tracer activity in tissues, it is influenced by a wide range of factors (such as patient body composition, time from injection, blood glucose, scanner calibration and others), imparing the overall precision, physiological reliability and repeatibility of measured values [5,6].
Advancements in PET scanner technology and software have introduced new opportunities for PET/CT image quatification. Dynamic whole-body (D-WB) imaging is a recently developed technique for standard Field-Of-View PET/CT that involves multiple whole-body (WB) passes and the extraction of image-derived input functions (IDIF) [7,8], providing dynamic PET data for the reconstruction of WB multiparametric images based on linear Patlak analysis [9].
Multiparametric imaging supplements the standard SUVbw image with two new parametric images: one displaying the effective metabolic rate of [18F]FDG being phosphorylated to [18F]FDG-6-phosphate (FDG-6-P) in the tissues (MRFDG), and the other displaying the distribution volume of free [18F]FDG in the reversible compartments and fractional blood volume (DVFDG) [8]. Unlike SUVbw images, thus allowing the reader to differentiate between free and bound FDG-6-P in tissue.
Hybrid imaging with PET/CT plays a significant role in the diagnostic work-up of squamous cell carcinoma (SCC) of the head and neck, particularly in staging challenging cases where clinical evaluation and other imaging methods can be unreliable. FDG PET/CT is also widely used to detect hidden primary tumors, assess response to chemoradiotherapy, and to detect relapsing disease [10,11].
Metastases to cervical lymph nodes from carcinoma of unknown primary origin (CUP) account for approximately 3–7 % of all head and neck cancers [10,11,12,13]. Given the previously mentioned limitations of SUVbw-based evaluation, false-positive and false-negative results may occur, posing a significant diagnostic challenge [14,15]. False-negative results are commonly caused by factors such as the proximity of the lesion to areas with high metabolism, artifacts caused by dental prostheses, limited PET resolution, inherently low FDG avidity in some tumors, significant necrosis or cystic components of the tumor, and small lesion size [14,15]. On the other hand, inflammation and post-treatment fibrosis are the most common causes of false-positive results [15,16]. The pharyngeal tonsils are the most frequent site of both false-positive and false-negative findings on FDG-PET [15,16].
This study therefore aimed to evaluate the possible advantages of performing D-WB FDG PET multiparametric analysis of tumors in the head and neck region.
2. Methods
2.1. Patient Population
The study was a retrospective analysis of D-WB PET/CT data from 43 patients (23 males, 20 females) selected from all D-WB PET/CT examinations performed between January 2020 and June 2021 at the Department of Nuclear Medicine & PET-Centre, Aarhus University Hospital. The majority of patients (n = 38; 88.4%) underwent staging for primary tumors of the head and neck region, most of whom presented with cervical lymphadenopathy at the time of examination (n = 31; 72.1%). In a smaller subgroup, the indication was primary cervical lymphadenopathy of unknown origin (n = 5; 11.6%). (Figure 1). Table 1 shows histology of examinated lessions.
2.2. Data acquisition and Image Reconstruction
Participants were scanned using a fully automated multiparametric PET/CT acquisition protocol (FlowMotion® Multiparametric PET, Siemens Healthineers, Knoxville, USA) on a Siemens Biograph Vision 600 PET/CT scanner (Siemens Healthineers, Knoxville, USA) with 26.2 cm axial field of view. In short, a 20-min multiparametric PET acquisition protocol using a population based input-function (PBIF) [17] scaled to the late IDIF, was started 50 minutes after a standardized injection of FDG (4 MBq/kg) using an Intego PET Infusion System (MEDRAD, Inc., Warrendale, PA, USA). First, a low-dose WB CT (25 Ref mAs, 120 kV, Care Dose4D, Care kV, Admire level 3) was performed. The PET reconstruction parameters for D-WB were the following: For the SUVbw image, we used TrueX+TOF, 6 iterations, 5 subsets, 440×440 matrix, no filtering, and relative scatter correction. For the dynamic PET images used for IDIF extraction, we used TrueX+TOF, 4 iterations, 5 subsets, 440×440 matrix, no filtering, and relative scatter correction. Parametric images of MRFDG and DVFDG were generated using direct Patlak reconstruction method with non-negativity constraints using list-mode data from four 5 min passes (50–70 min), TrueX+TOF, 8 iterations, 5 subsets, 30 nested loops, 440×440 matrix, 2 mm Gaussian filter, and relative scatter correction. (Figure 2) A more detailed overview of this protocol is described by Dias et al. [8,17].
2.3. Image Analysis and VOI Delineation
Multiparametric images were visually inspected using Hermes Gold Client v.2.5.0 (Hermes Medical Solutions AB, Stockholm, Sweden). VOI delineation of the multiparametric images was performed by AHD using PMOD® 4.0 (PMOD Technologies Ltd, Zürich, Switzerland). Semiquantitative values of SUVmax and SUVmean were obtained from the conventional PET reconstructions, whereas MRFDG and DVFDG values were extracted from the multiparametric images.
A region of interest (VOI) was placed on the primary tumor and the FDG-avid lymph nodes. In patients with indications of cervical lymphadenopathy, the VOI was placed on the FDG-avid lymph nodes. In total 142 VOIs on each of three images were analyzed.
Note the high quality of Patlak images, the improved target to background activity of the MRFDG images when compared to the SUVbw images, but also the marked activity in certain areas of the lesions on the DVFDG images (Figure 3).
2.4. Statistical Analysis
Dynamic PET data from 43 patients were analyzed and categorized into two classes based on the presence or absence of malignancy. Average and maximum standardized uptake values (), as well as dynamic PET parameters ( and ), were measured in solid tumors or nodes.
A binomial logistic regression was performed to estimate the additional predictive value of dynamic PET in malignancy recognition. The optimal parameters and of the logistic regression model, defined as
for predicting the probability of class given a measured value , were determined using scikit-learn Python module using lbfgs minimization [18]. Precision, recall (sensitivity), and F1-score, based on maximum probability decisions, were estimated for each class in the optimal model and for all carcinoma types combined.
In clinical applications, different probability thresholds could be used as decision criteria, considering subsequent treatment costs. To evaluate the model's performance across this range of possible thresholds, the receiver operating characteristic (ROC) curve and the area under the curve (AUC) were determined for the optimal model. Probability thresholds for maximum Youden index and minimum distance to ideal point were found with corresponding sensitivity and specificity.
Six different models with various input data were studied:
to estimate the additional predictive value of dynamic PET. The three parameters , and are expected to be linearly dependent under the assumptions underlying the Patlak plot. The models containing all three basic parameters may therefore be interpreted as a test of the condition’s validity: when the classification metrics show no additional benefit compared to use of only two of the parameters, the linear dependency of the parameters can be assumed.
The formula (1) can be inverted for , so a threshold for p-value can be transformed to a threshold for a simple linear expression in terms of :
so that the conditions
are equivalent.
3. Results
Dynamic PET parameters were evaluated in cohort of 43 patients, categorized into malignancy and non-malignancy lesion classes. Six binomial logistic regression models (M1-M6) were trained using combinations of average or maximum SUVbw, MRFDG and DVFDG to assess the predictive value of dynamic PET imaging.
Figure 4 shows the measured data in parameter space for patients categorized into the two classes. The optimal binomial regression model parameters and for six different models M1 – M6 are presented for the mean and maximum values (see Supplementary Table S1 and S2). Performance metrics (precision, recall, and F1-score) for mean value and each class are detailed in Supplementary Table S3. We also investigated the M1 analyzing node and tumor performance separately with performance measures for comparison presented in Supplementary Table S4.
3.1. Diagnostic Performance of Models
Across all evaluated binomial logistic regression models, Model M1 (SUVbw, MRFDG, DVFDG) consistently showed the highest diagnostic performance in distinguishing malignant from benign lesions. Using mean values, M1 achieved an accuracy of 0.82, precision of 0.83, recall of 0.98, F1-score of 0.90, and specificity of 0.21. Models M2 and M3 demonstrated comparable performance with slightly lower or similar F1-scores and precision. Models based solely on dynamic parameters (M3, M5, M6) provided similar classification performance to hybrid models, confirming the independent diagnostic value of kinetic features.
In the subgroup analysis (Supplementary Table S4), the classification performance further improved for solid tumors, with M1 reaching an F1-score of 0.92 and perfect recall (1.00). Performance in lymph nodes remained strong with an F1-score of 0.89. Models using maximum values showed slightly reduced but comparable diagnostic metrics.
3.2. ROC and Threshold Analysis
Receiver operating characteristic (ROC) curves for each model are illustrated in Figure 5 and Figure 6 for mean and maximum values, respectively. Area under the ROC curve (AUC) values confirmed the superior performance of M1 across all input combinations.
Supplementary Tables S5 and S6 present optimal probability thresholds derived from the Youden index, minimum distance to the ideal point, and thresholds for achieving 95 % sensitivity. For M1 using mean values, the maximum Youden index corresponded to a threshold of 0.85 (sensitivity: 0.56, specificity: 0.93), while the minimal distance threshold was 0.71. Comparable trends were observed for maximum values.
3.3. Relative Feature Contributions
For the relative contributions of each feature within the classification models, see Supplementary Table S7. In M1, DVFDG accounted for 65 % of the decision weight, SUVbw for 34 %, and MRFDG for only 1%. In M3, DVFDG contributed up to 97 % of the model's predictive value. These findings suggest that DVFDG plays a prominent role in the predictive performance of the classification models.
3.4. Decision Thresholds and Clinical Translation
Linear threshold functions were derived to support clinical implementation. For Model M3, the optimal linear decision rule based on mean values was: DVFDG [%] + (7.2 × MRFDG [µmol/min/ml])> 70. For maximum values, the rule changed to: DVFDG [%] + (-29 × MRFDG [µmol/min/ml])> 194 (Table 2). Normalized single-parameter thresholds based on the Youden index for mean values were: SUVbw> 5.8 g/mL, MRFDG> 0.050 µmol/mL/min, DVFDG> 68 %. (Table 3).
4. Discussion
4.1. Interpretation of Key Findings
Our results clearly demonstrate that Patlak PET parameters, particularly MRFDG and DVFDG, significantly improve the differentiation between malignant and non-malignant lesions compared to conventional SUVbw-based metrics. Among all evaluated models, the combination of mean SUVbw, MRFDG, and DVFDG (Model M1) achieved the highest diagnostic performance, with an accuracy of 82 % and an F1-score of 0.90. When stratified by lesion type, Model M1 performed better in solid tumors (accuracy: 0.86; F1 = 0.92) than in lymph nodes (accuracy: 0.81; F1 = 0.89), suggesting greater robustness in predicting malignancy in primary lesions compared to metastatic lymphadenopathy.
4.2. Added Value of Kinetic Parameters
These findings are consistent with established knowledge that SUVbw has limitations as a standalone quantitative biomarker in nuclear medicine. Its sensitivity to physiological and technical sources of variability, such as blood glucose levels, imaging time-point, image noise, scanner resolution, and ROI delineation, can undermine reproducibility and diagnostic confidence [19]. In contrast, dynamic Patlak PET imaging allows for kinetic modeling of tracer uptake, offering a more biologically meaningful assessment of tissue metabolism, minimizing the impact of confounding factors like plasma glucose activity and imaging time-point dependence. Importantly, models using only dynamic parameters (Models M3, M4, M6) performed comparably to hybrid models, underscoring the independent diagnostic utility of kinetic Patlak features.
4.3. Feature Importance and Model Complexity
Feature importance analysis (Supplementary Table S7) highlighted DVFDG as the most prominent contributor in this model analysis. In Model M1, DVFDG accounted for approximately 65 % of the classification decision, compared to 34 % for SUVbw and only 1 % for MRFDG. In Model M3, which included only MRFDG and DVFDG, DVFDG contributed to 97 % of the decision weight. These findings are notable given that DVFDG is a often overlooked parameter due to questions regarding its reproducibilty and clinical relevance [20],underscoring its potential diagnostic value in this context. Interestingly, more complex models (e.g., M2, M5) that incorporated all three parameters did not outperform simpler two-parameter models. This may reflect underlying linear dependency among the features, as suggested by the Patlak graphical model, where over-parameterization could reduce interpretability without improving accuracy.
4.4. Clinical Implications in Head and Neck Oncology
From a clinical perspective, these findings are particularly relevant for recurrent head and neck cancers, where anatomical distortion caused by surgery, reconstruction, radiation fibrosis, and inflammation complicate interpretation of conventional PET metrics. In such settings, improved lesion characterization using kinetic features can potentially reduce diagnostic uncertainty and help avoid unnecessary biopsies or surgical interventions. To support clinical translation, we proposed simplified linear decision thresholds based on DVFDG and MRFDG (Table 2), and suggested parameter cutoffs for malignancy detection using normalized data (Table 3) for mean values: SUVbw>5.8 g/mL, MRFDG> 0.05 µmol/mL/min, DVFDG> 68 %. These values may serve as practical reference points, adaptable to desired tradeoffs between sensitivity and specificity in routine clinical use.
5. Limitations
This study has several limitations. First, the small sample size (n = 43) restricts the generalizability of the findings. Second, lesions were not stratified by histological subtype, anatomical subsite, or treatment intensity (e.g., radiotherapy dose), factors that may influence tracer kinetics. Third, although kinetic parameters were derived using the Patlak model, which assumes irreversible tracer uptake over time, a behavior generally observed in malignant lesions, we did not independently validate this assumption. In lesions with necrosis, disrupted vasculature, or heterogeneous perfusion, the Patlak model’s assumptions, particularly the irreversibility of tracer uptake, may not be satisfied. This could lead to inaccurate MRFDG and DVFDG estimates, as potencial reversible tracer or non-linear kinetics are not accounted for in the model. Additionally, we did not compare Patlak modeling with alternative kinetic approaches, such as full compartmental models (LAFOV PET) or nonlinear regression methods, which might better capture complex tracer dynamics in selected lesions.
6. Future Directions
Future research should aim to validate these results in larger, multicenter cohorts, with stratification by tumor subtype, treatment history, and anatomical context. Given the specific assumptions of the Patlak model, further studies should evaluate its applicability across different lesion types, and explore alternative or hybrid kinetic modeling approaches that may better capture complex tracer dynamics. Moreover, integration of dynamic PET data with multimodal imaging, radiomics, or molecular biomarkers could enhance diagnostic accuracy in complex post-treatment settings. Development of clinical decision-support tools based on dynamic metrics may aid tumor boards in real-time decision-making. Assessing automation feasibility, model reproducibility, and clinician acceptance will be critical for translation into practice. Ultimately, prospective trials are needed to determine whether incorporating dynamic PET metrics into clinical workflows improves key outcomes including diagnostic accuracy, treatment decisions, avoidance of invasive procedures, patient quality of life, and healthcare cost-effectiveness.
7. Conclusions
Dynamic PET data appears to enhance the distinction between malignant and non-malignant lesions, particularly in solid tumors. This study provides evidence for the diagnostic value of dynamic imaging parameters in classifying malignant lesions. Logistic regression models that incorporate a limited number of kinetic features demonstrate a favorable balance between accuracy and interpretability, highlighting their potential as decision-support tools in clinical practice. Moreover, the identification of clinically relevant thresholds may enable more reliable detection of tumor recurrence. Future studies with larger cohorts are warranted to further validate these findings and confirm their clinical applicability.
Author Contributions
GH: Initiation and design of the study; data extraction; analysis and interpretation of the results; drafting and approval of the manuscript; accountable of all aspects of the work. AHD: data extraction; critical revision and approval of the manuscript; accountable of all aspects of the work. JP: critical revision and approval of the manuscript; accountable of all aspects of the work. OLM: critical revision and approval of the manuscript; accountable of all aspects of the work. PK: analysis and interpretation of the results; critical revision and approval of the manuscript; accountable of all aspects of the work. LCG: critical revision and approval of the manuscript; accountable of all aspects of the work.
Funding
The work is supported by a grant IGA_LF_2025_007.
Ethics approval and consent to participate
The study was approved by the Danish Patient Safety Authority. The study was performed in accordance with the ethical standards as laid down in the 1964 Declaration of Helsinki. All methods were carried out in accordance with relevant guidelines and regulations. Informed consent was obtained from each patient before inclusion into the study.
Consent for publication
Not applicable.
Aviability of data and materials
The datasets used and analysed during the current study are available from the corresponding author on reasonable request.
Acknowledgments
Thanks to the Head of the Department of Nuclear Medicine, University Hospital Olomouc and Palacky University Olomouc, for their general support and for contributing to the development of conditions necessary for my research work.
Competing Interests
The authors declare that they have no competing interests.
References
- Hess S, Blomberg BA, Zhu HJ, Høilund-Carlsen PF, Alavi A. The Pivotal Role of FDG-PET/CT in Modern Medicine. Academic Radiology 2014;21:232–49. [CrossRef]
- Eskian M, Alavi A, Khorasanizadeh M, Viglianti BL, Jacobsson H, Barwick TD, et al. Effect of blood glucose level on standardized uptake value (SUV) in 18F- FDG PET-scan: a systematic review and meta-analysis of 20,807 individual SUV measurements. Eur J Nucl Med Mol Imaging 2019;46:224–37. [CrossRef]
- Lindholm P, Minn H, Leskinen-Kallio S, Bergman J, Ruotsalainen U, Joensuu H. Influence of the blood glucose concentration on FDG uptake in cancer--a PET study. J Nucl Med 1993;34:1–6.
- Boellaard R, Krak NC, Hoekstra OS, Lammertsma AA. Effects of noise, image resolution, and ROI definition on the accuracy of standard uptake values: a simulation study. J Nucl Med 2004;45:1519–27.
- Huang, SC. Anatomy of SUV. Standardized uptake value. Nucl Med Biol 2000;27:643–6. [CrossRef]
- Thie, JA. Understanding the standardized uptake value, its methods, and implications for usage. J Nucl Med 2004;45:1431–4.
- Karakatsanis NA, Lodge MA, Tahari AK, Zhou Y, Wahl RL, Rahmim A. Dynamic whole-body PET parametric imaging: I. Concept, acquisition protocol optimization and clinical application. Phys Med Biol 2013;58:7391–418. [CrossRef]
- Dias AH, Pedersen MF, Danielsen H, Munk OL, Gormsen LC. Clinical feasibility and impact of fully automated multiparametric PET imaging using direct Patlak reconstruction: evaluation of 103 dynamic whole-body 18F-FDG PET/CT scans. Eur J Nucl Med Mol Imaging 2021;48:837–50. [CrossRef]
- Patlak CS, Blasberg RG, Fenstermacher JD. Graphical evaluation of blood-to-brain transfer constants from multiple-time uptake data. J Cereb Blood Flow Metab 1983;3:1–7. [CrossRef]
- Bakhshayesh Karam M, Doroudinia A, Safavi Nainee A, Kaghazchi F, Yousefi Koma A, Mehrian P, et al. Role of FDG PET/CT scan in head and neck cancer patients. Archives of Iranian Medicine 2017;20:452–8.
- Szyszko TA, Cook GJR. PET/CT and PET/MRI in head and neck malignancy. Clin Radiol 2018;73:60–9. [CrossRef]
- Zhuang SM, Wu X-F, Li J-J, Zhang G-H. Management of lymph node metastases from an unknown primary site to the head and neck (Review). Mol Clin Oncol 2014;2:917–22. [CrossRef]
- Liu, Y. FDG PET/CT for metastatic squamous cell carcinoma of unknown primary of the head and neck. Oral Oncol 2019;92:46–51. [CrossRef]
- Tsetsos N, Poutoglidis A, Arsos G, Tsentemeidou A, Kilmpasanis A, Katsampoukas D, et al. 18F-FDG-PET/CT interpretation pitfalls in patients with head and neck cancer. American Journal of Otolaryngology 2022;43:103209. [CrossRef]
- Purohit BS, Ailianou A, Dulguerov N, Becker CD, Ratib O, Becker M. FDG-PET/CT pitfalls in oncological head and neck imaging. Insights Imaging 2014;5:585–602. [CrossRef]
- Metser U, Miller E, Lerman H, Even-Sapir E. Benign nonphysiologic lesions with increased 18F-FDG uptake on PET/CT: characterization and incidence. AJR Am J Roentgenol 2007;189:1203–10. [CrossRef]
- Dias AH, Smith AM, Shah V, Pigg D, Gormsen LC, Munk OL. Clinical validation of a population-based input function for 20-min dynamic whole-body 18F-FDG multiparametric PET imaging. EJNMMI Phys 2022;9:60. [CrossRef]
- Pedregosa F, Varoquaux G, Gramfort A, Michel V, Thirion B, Grisel O, et al. Scikit-learn: Machine Learning in Python. Journal of Machine Learning Research 2011;12:2825–30.
- Keyes JW, Jr. SUV: standard uptake or silly useless value? J Nucl Med. 1995 Oct;36(10):1836-9.
- Laffon E, Marthan R. Is Patlak y-intercept a relevant metrics? Eur J Nucl Med Mol Imaging. 2021 May;48(5):1287-1290. [CrossRef]
Figure 1.
Studied group characteristics.
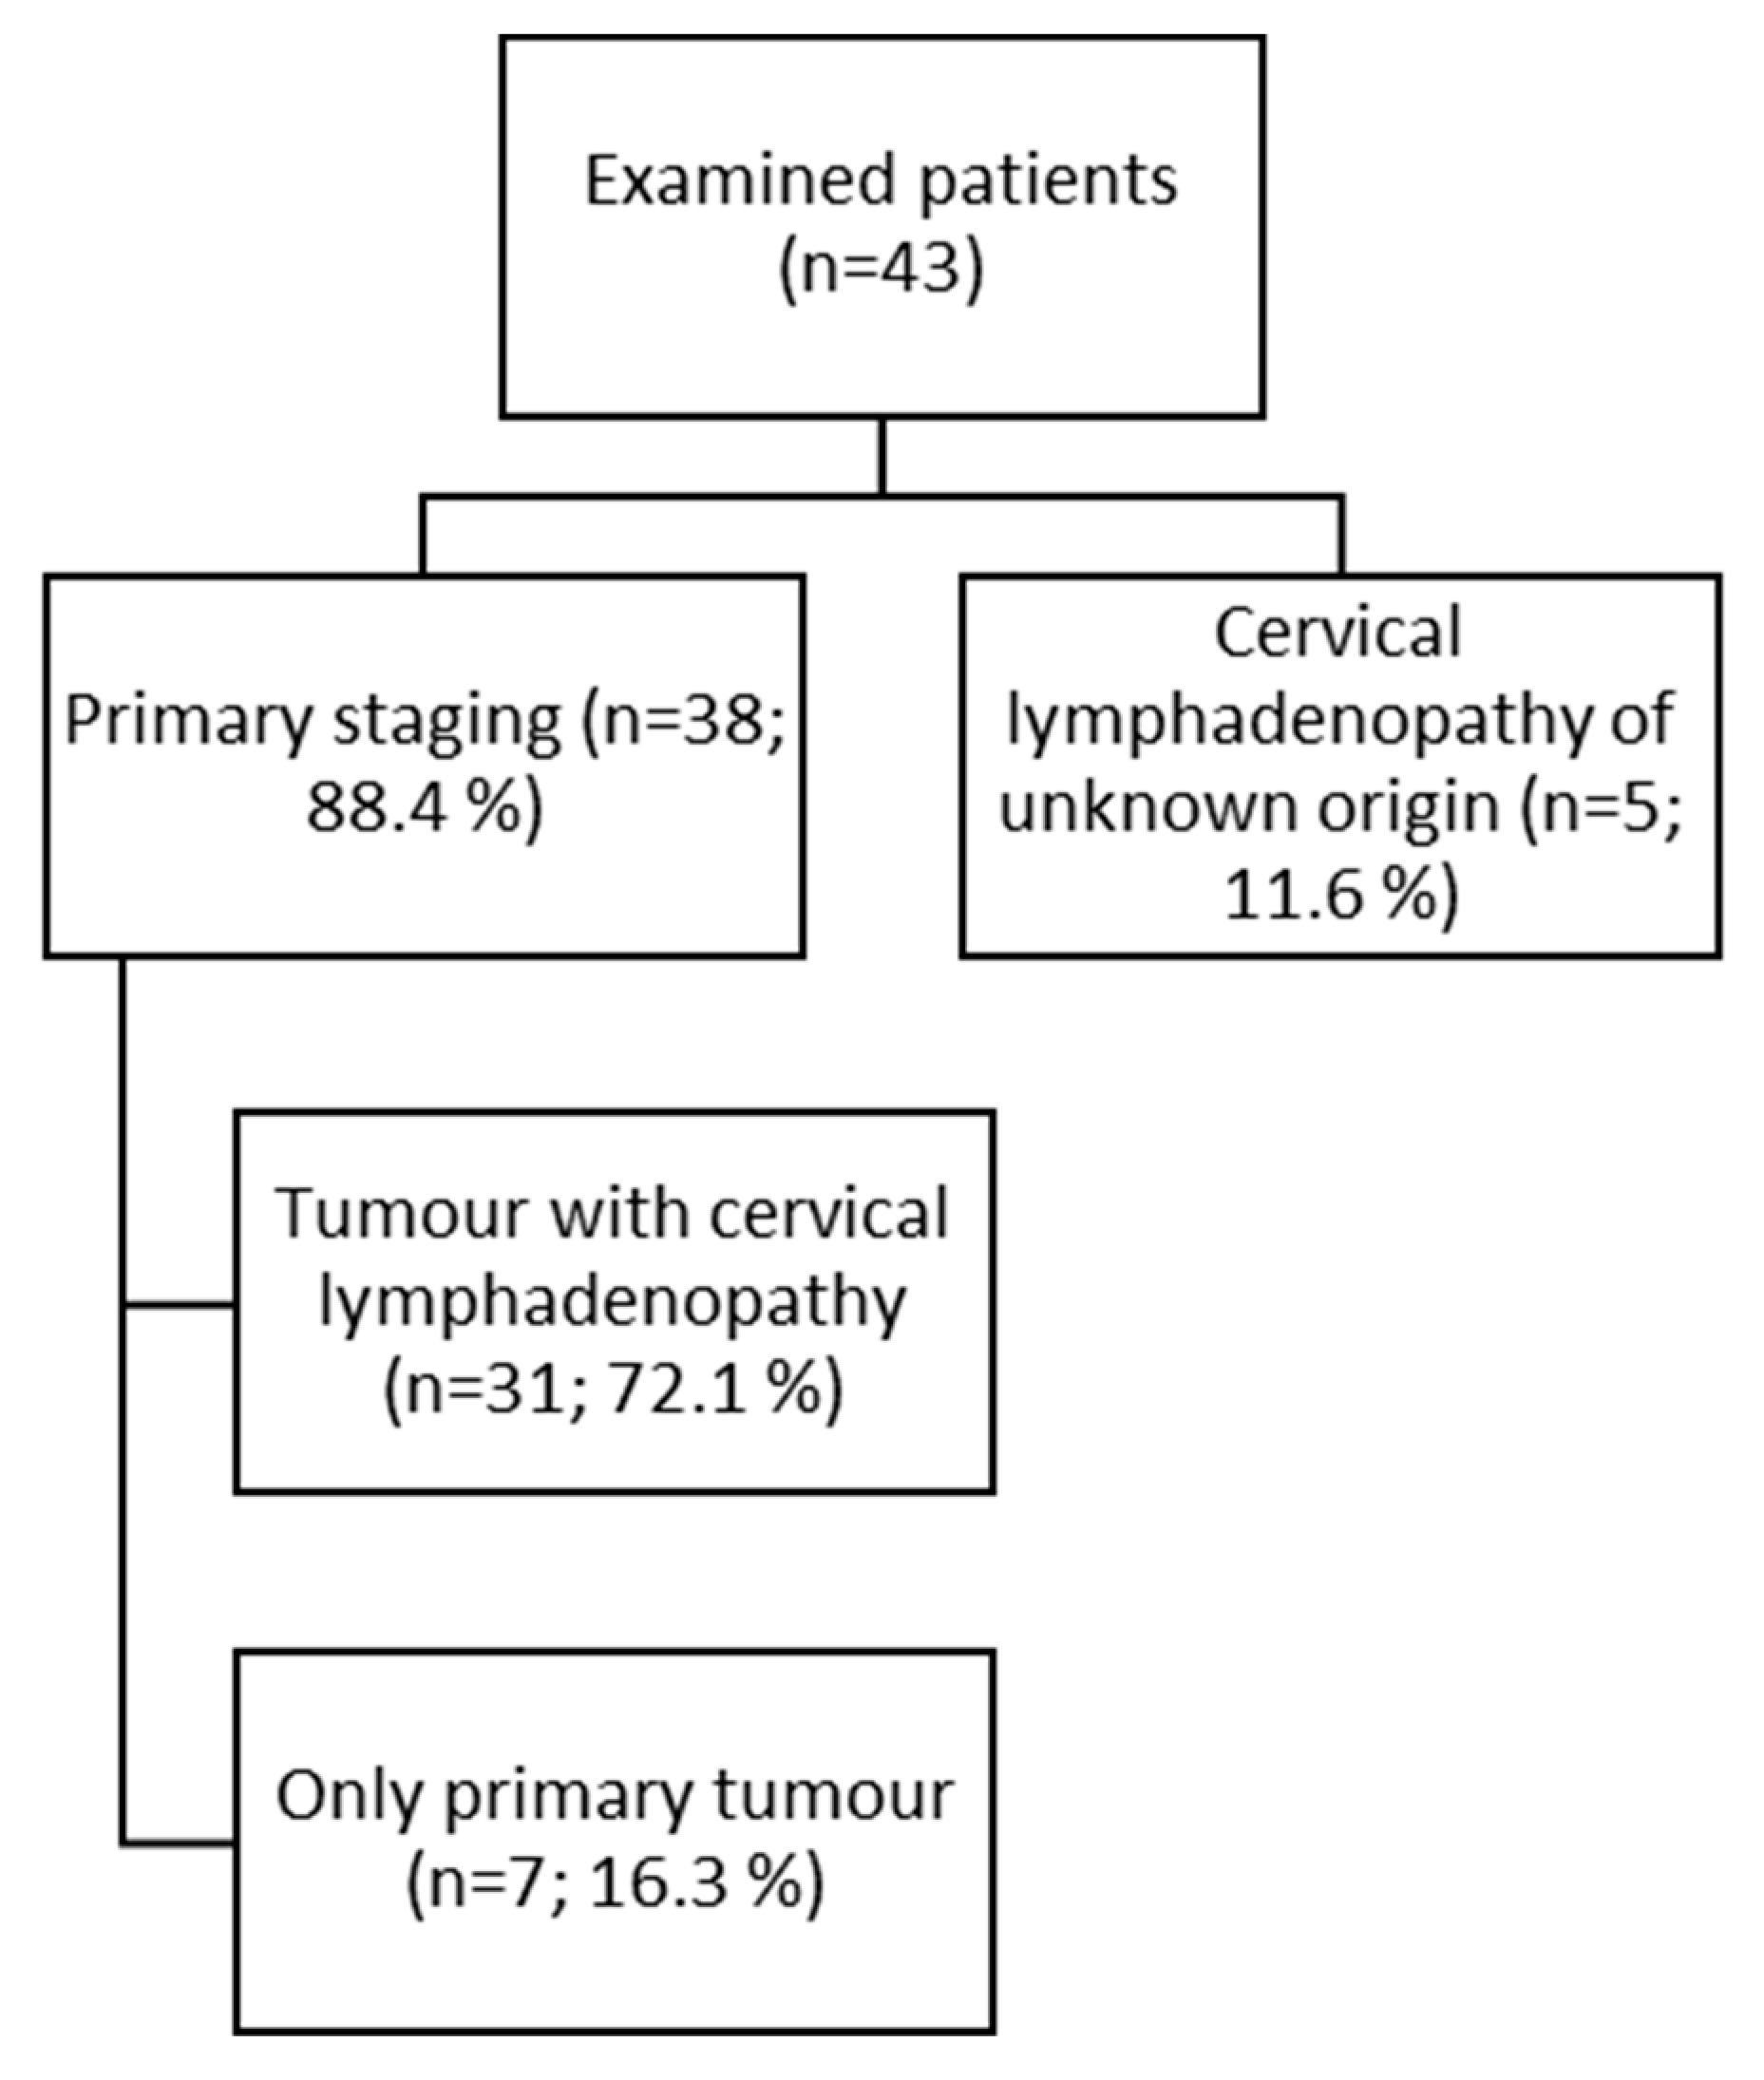
Figure 2.
Schema of 20-minutes D-WB PET/CT protocol. Created with BioRender.
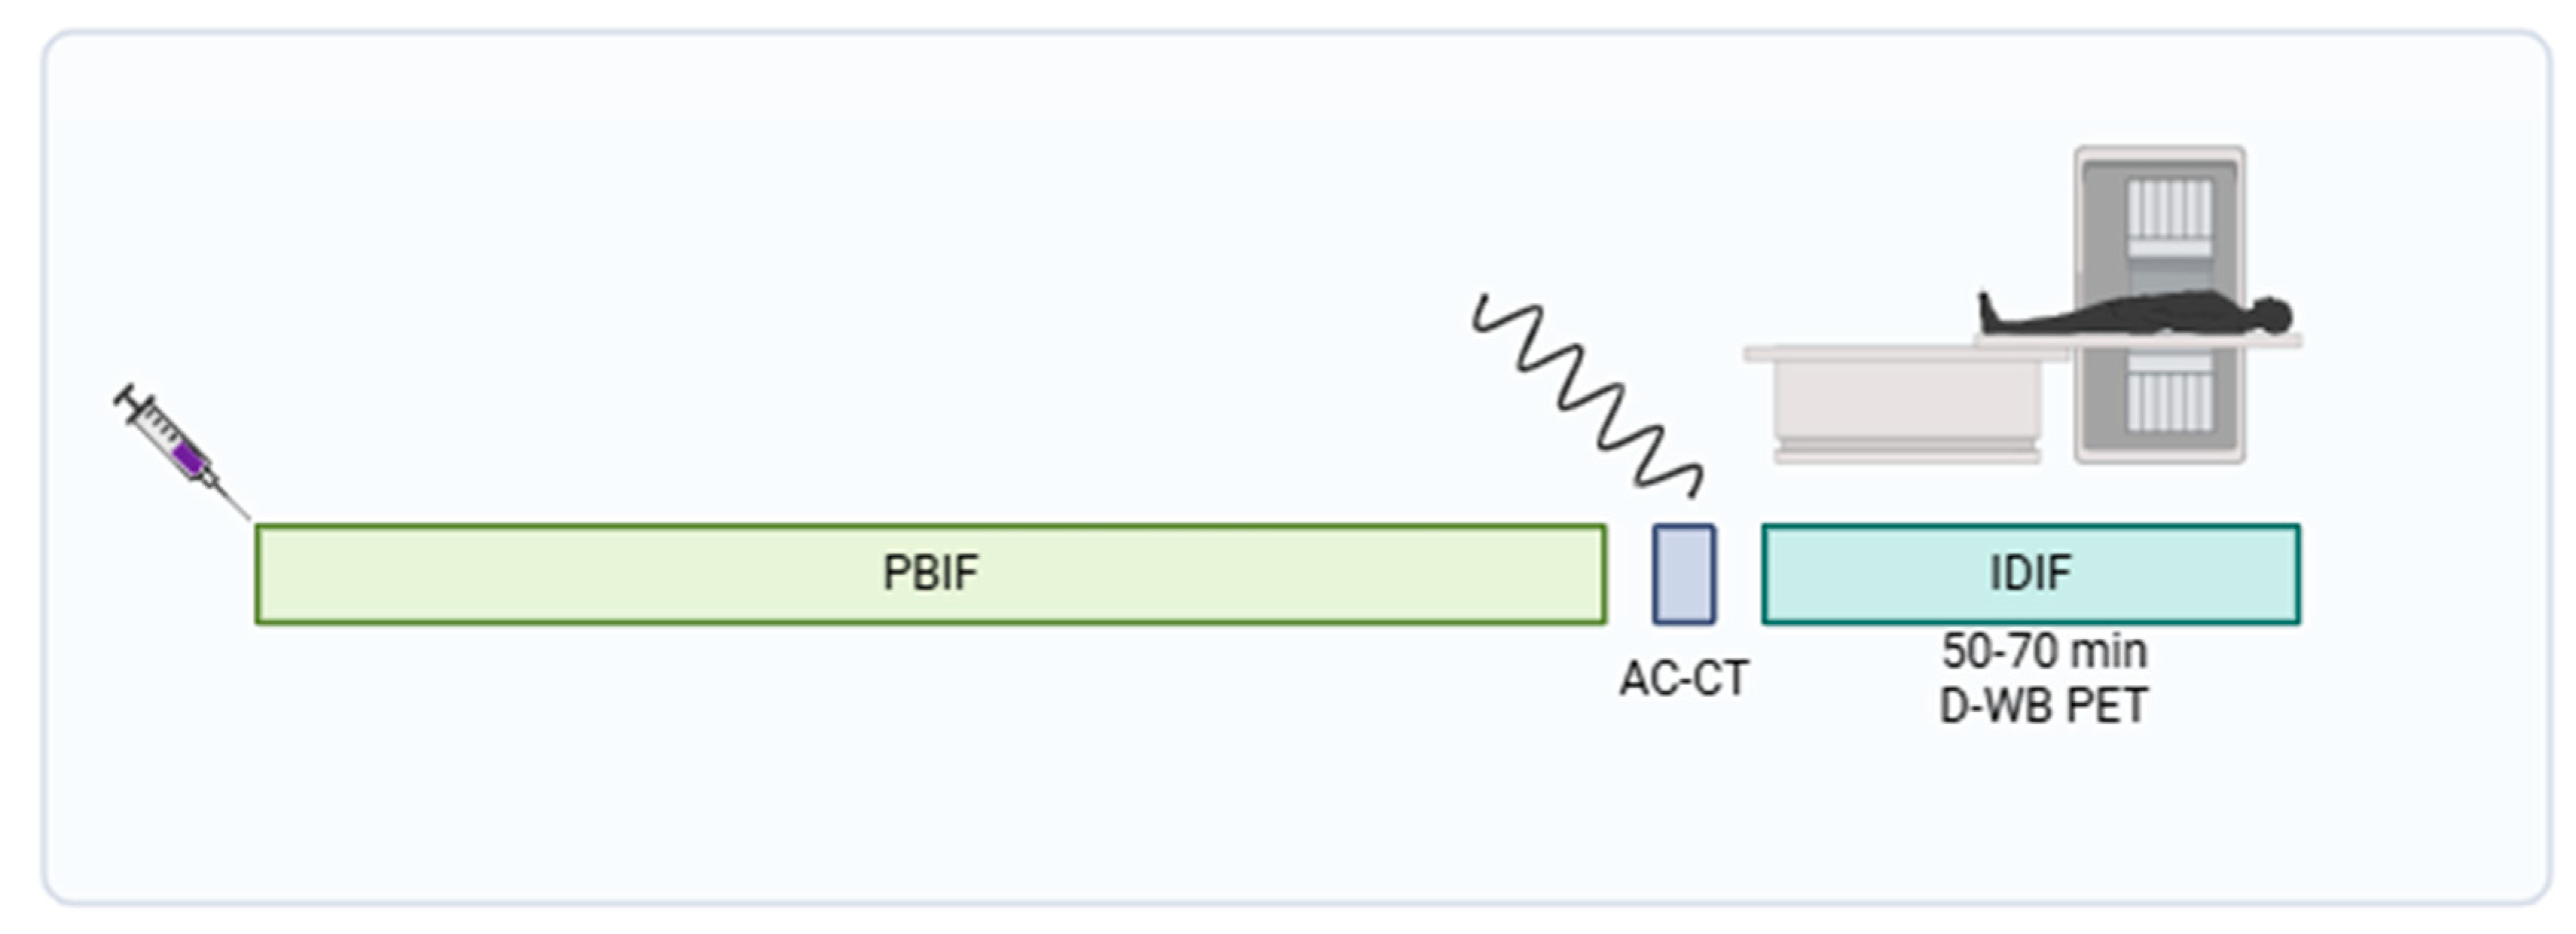
Figure 3.
Example of SUV, MRFDG and DVFDG images in a patient with SCC (thick arrows) and local lymph node metastisation in the neck region (think arrows).
Figure 3.
Example of SUV, MRFDG and DVFDG images in a patient with SCC (thick arrows) and local lymph node metastisation in the neck region (think arrows).
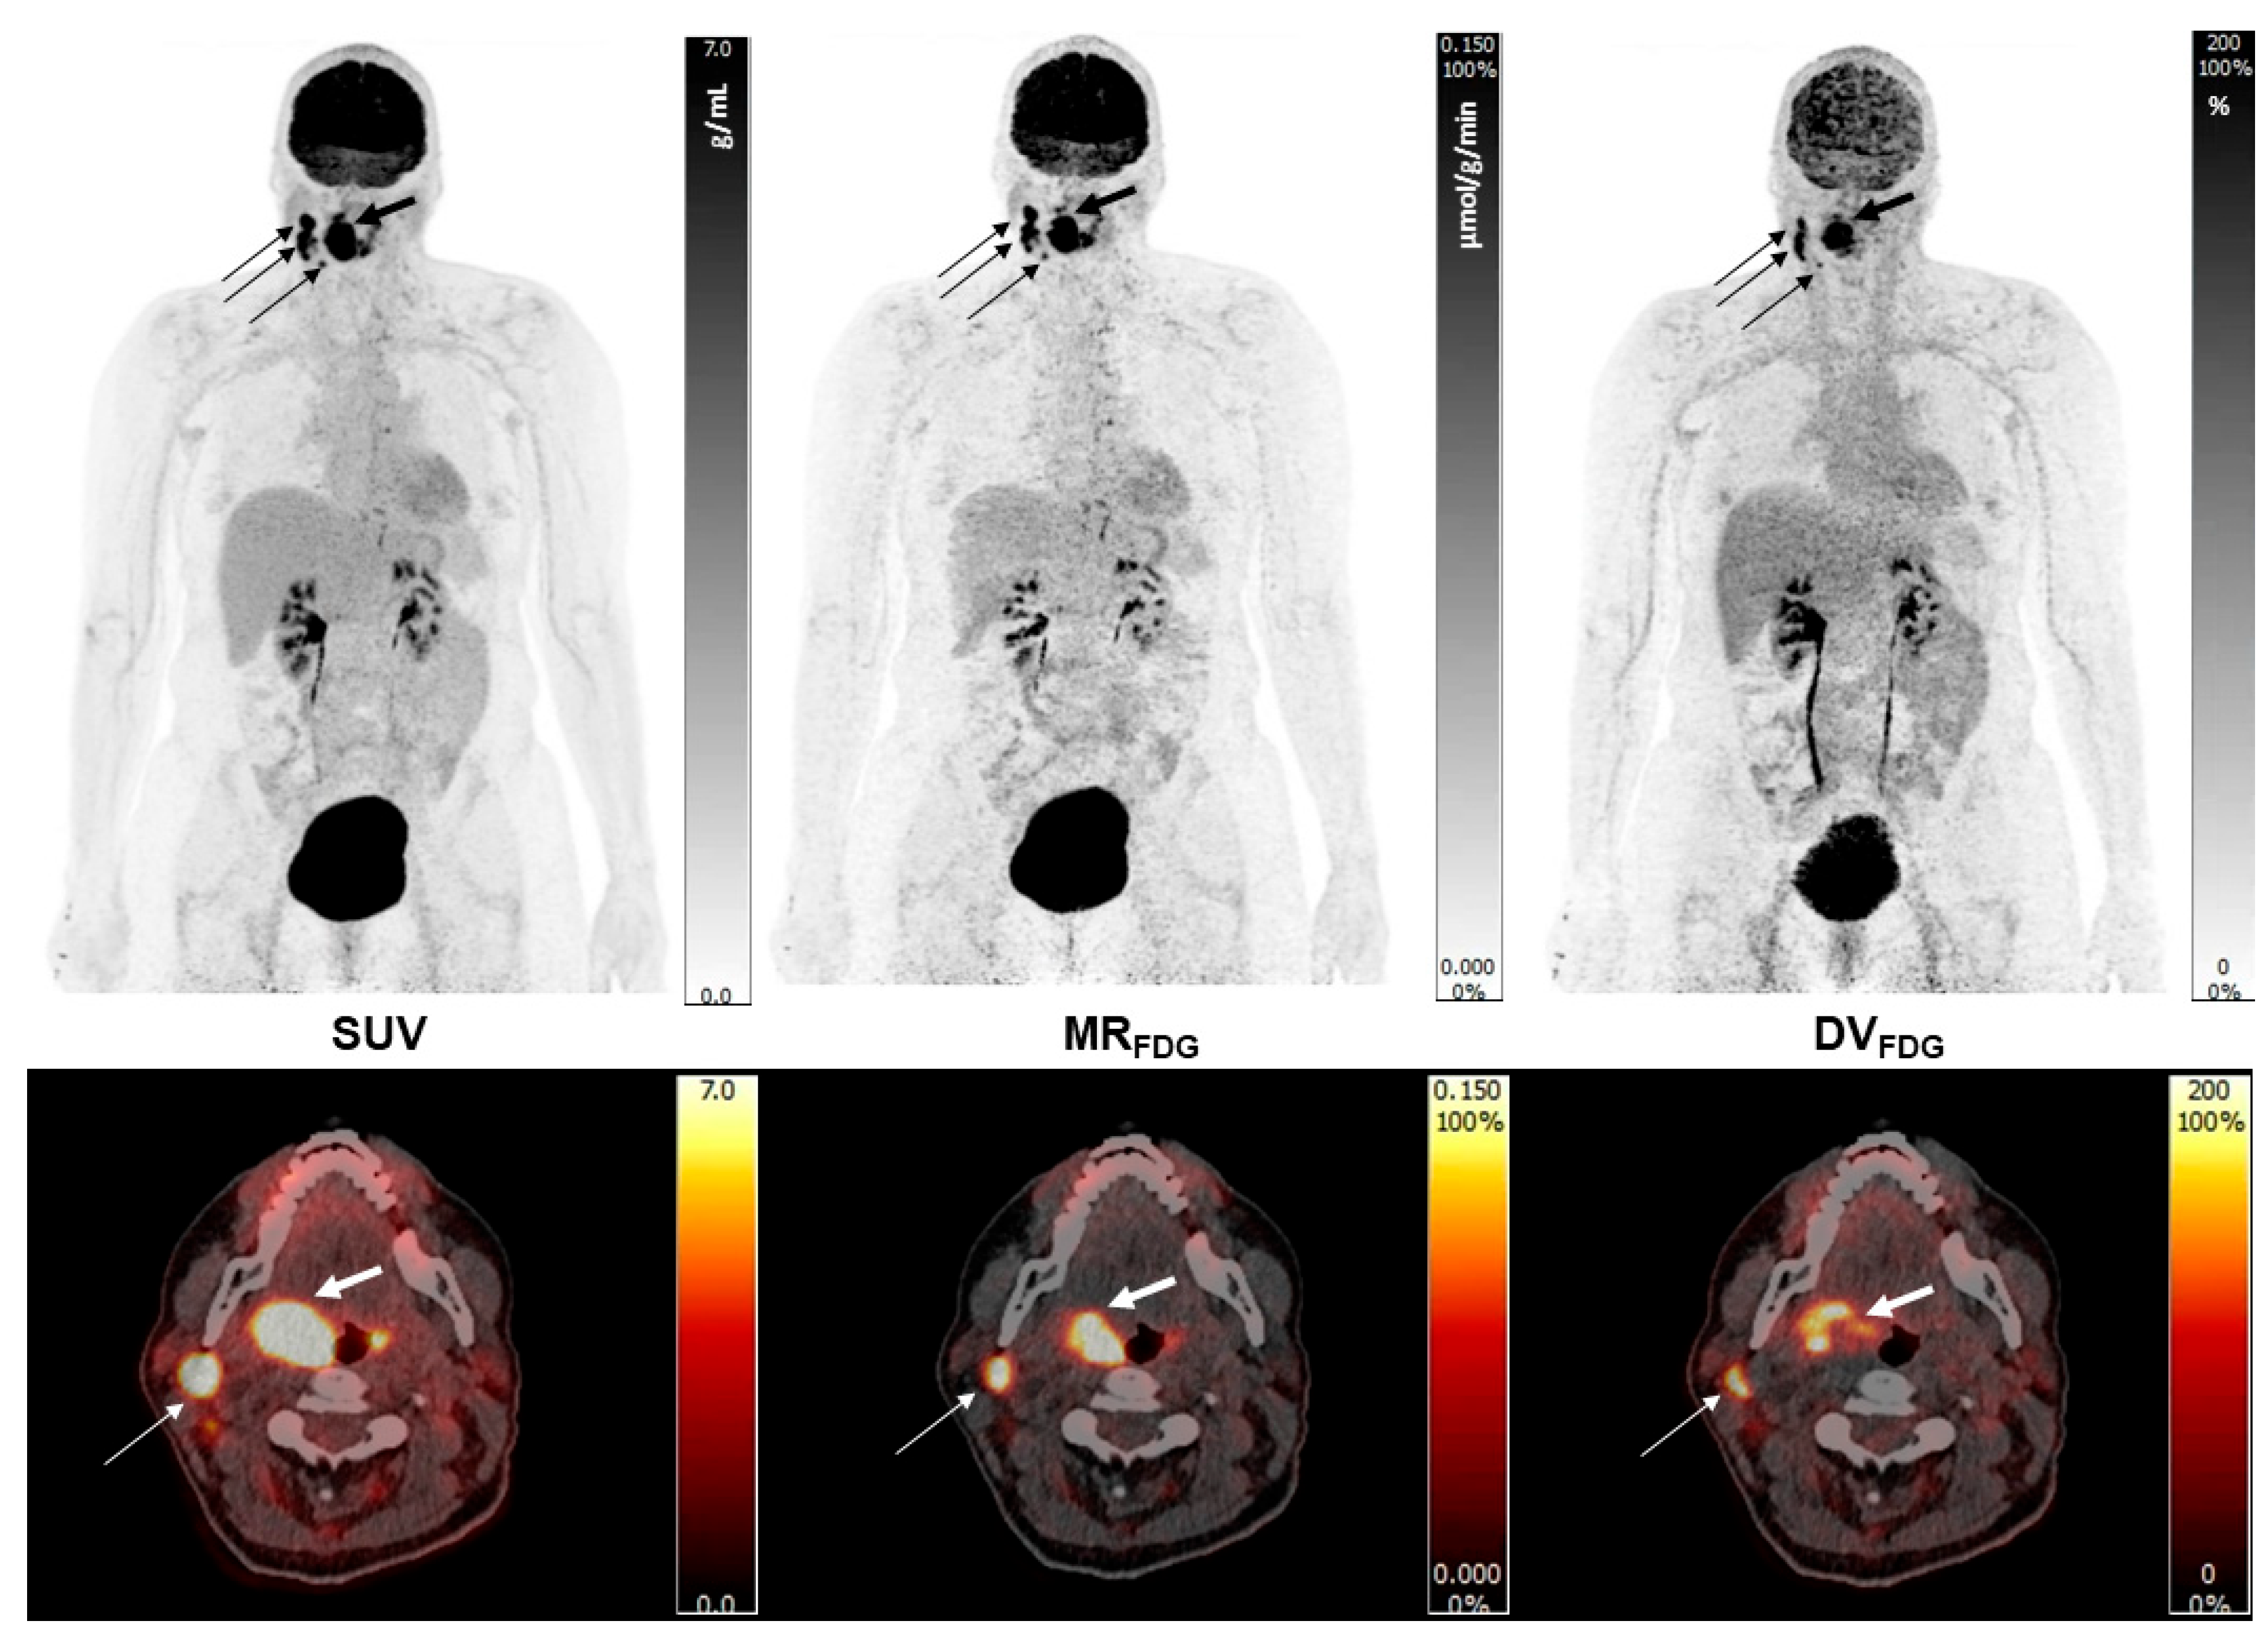
Figure 4.
Lesion classification in parameter space using mean value SUVbw, MRFDG, DVFDG.
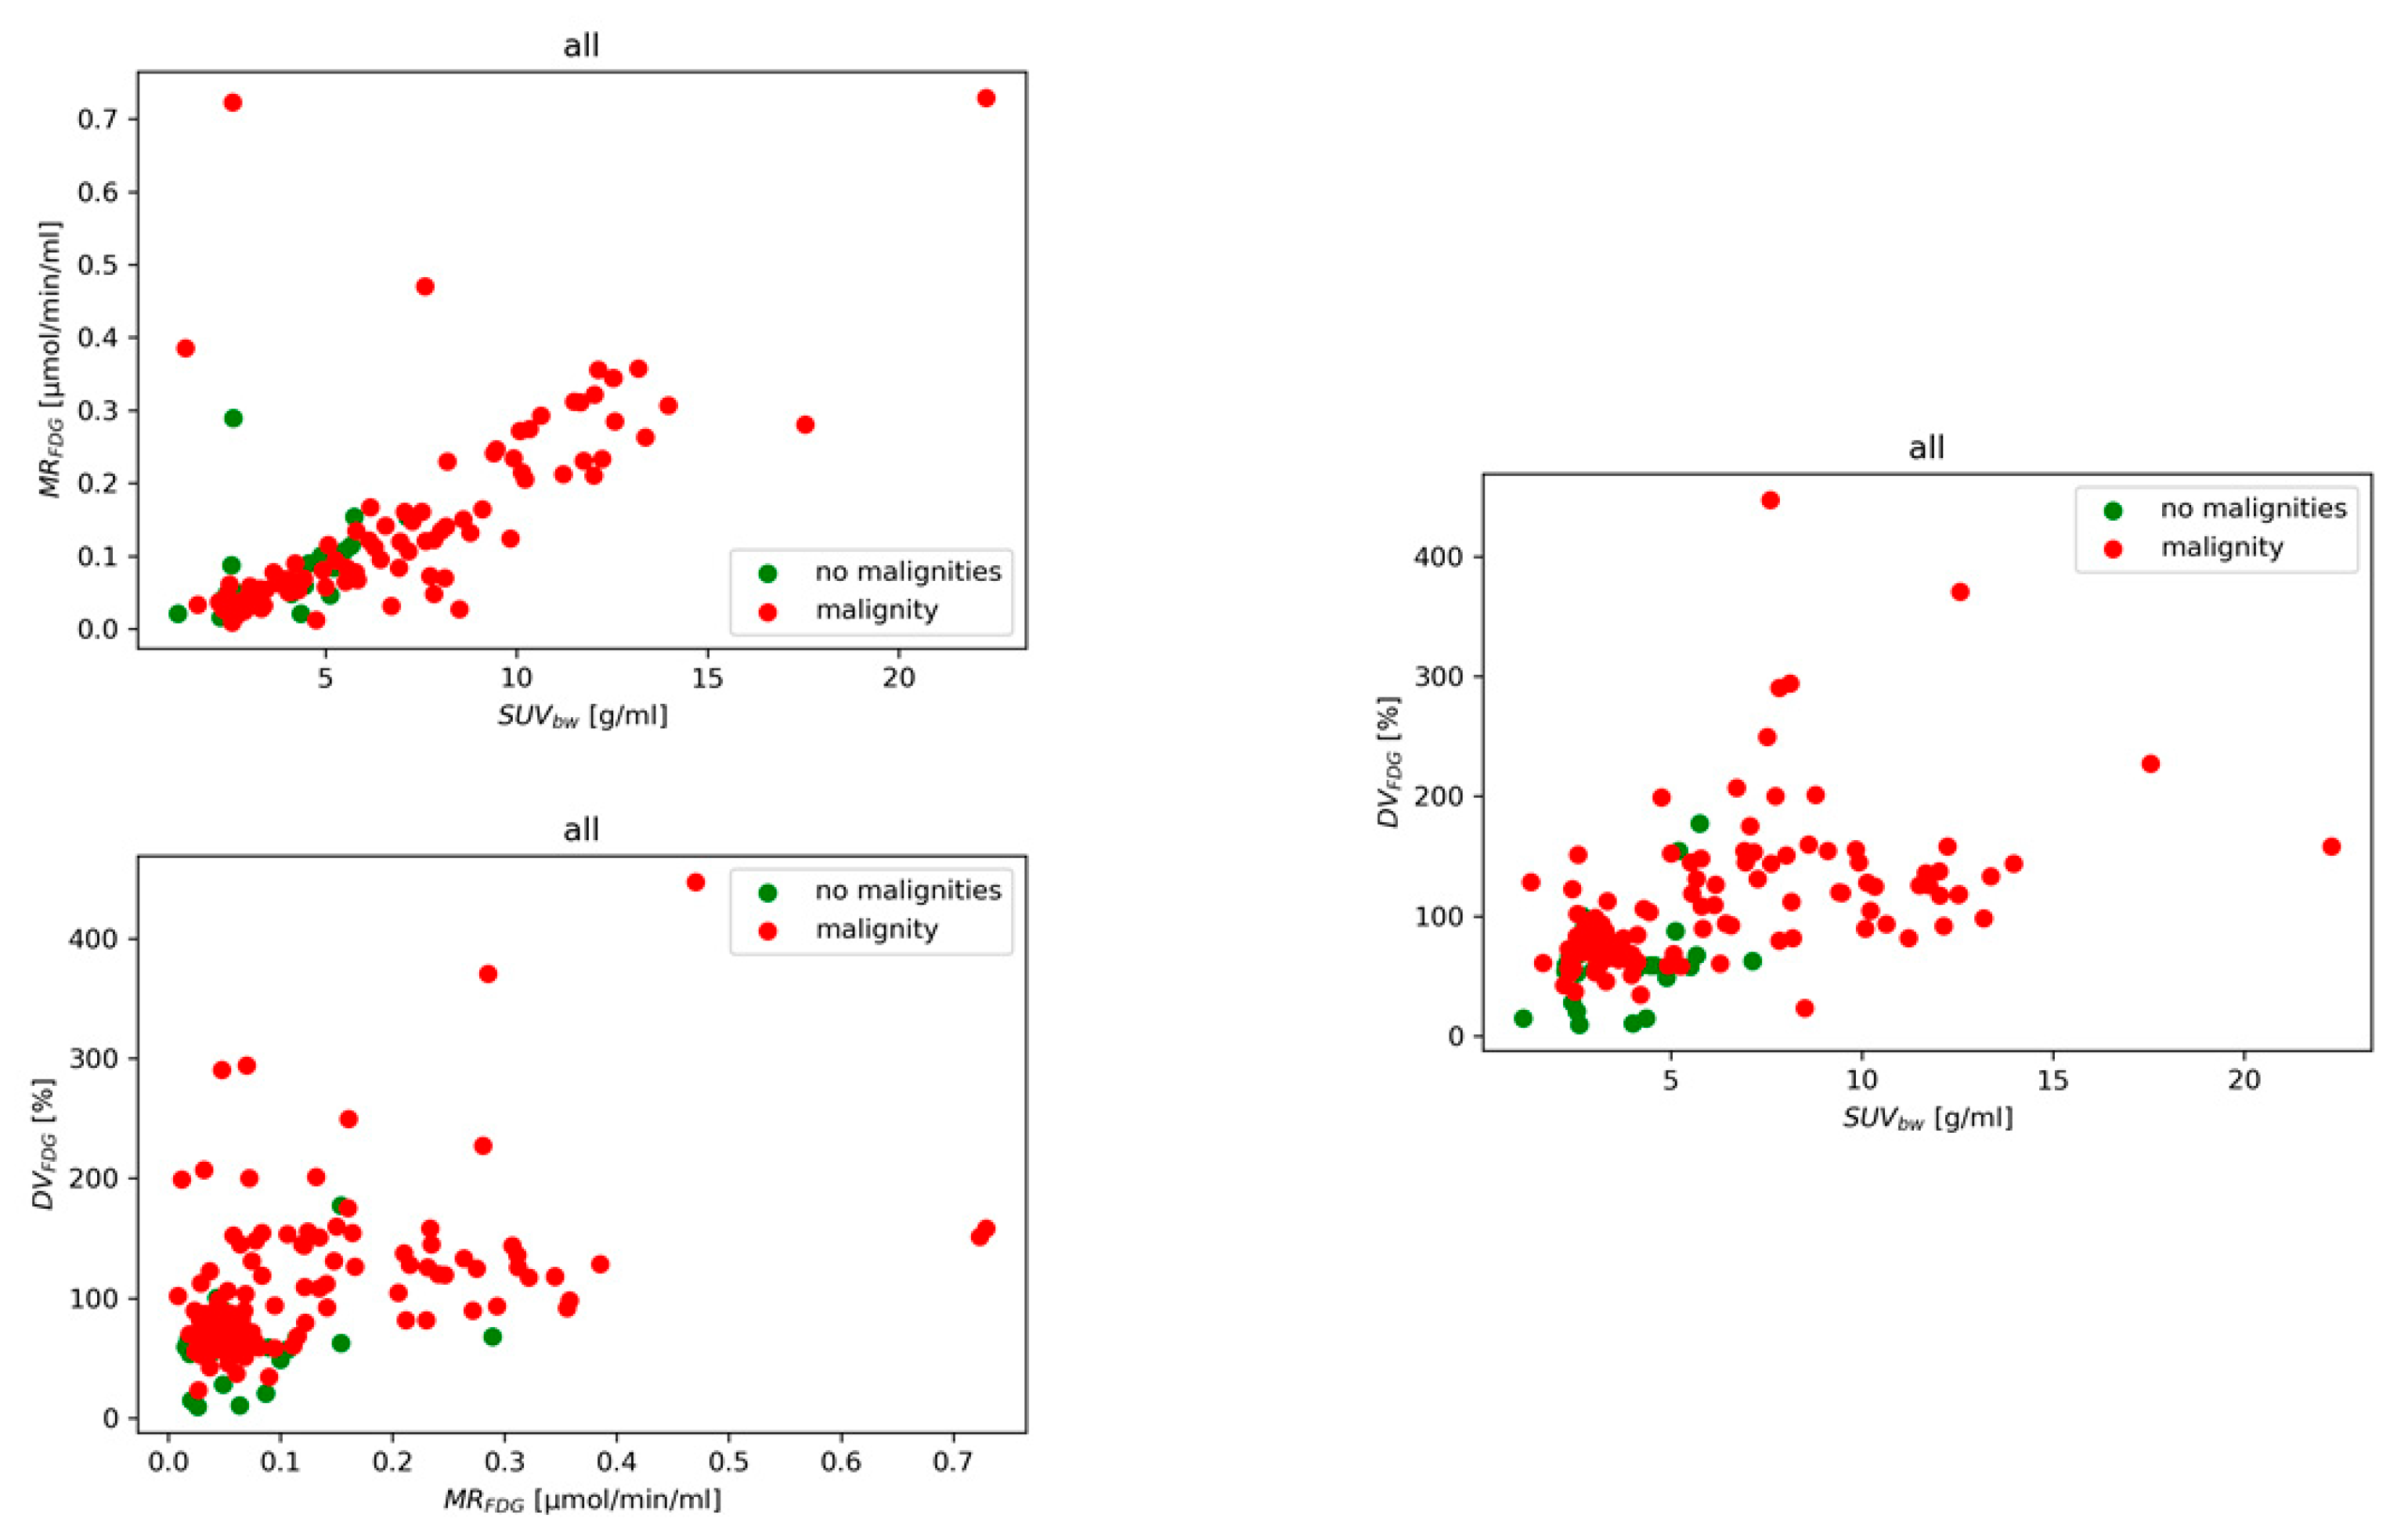
Figure 5.
ROC curves for the binomial regression models for mean value .
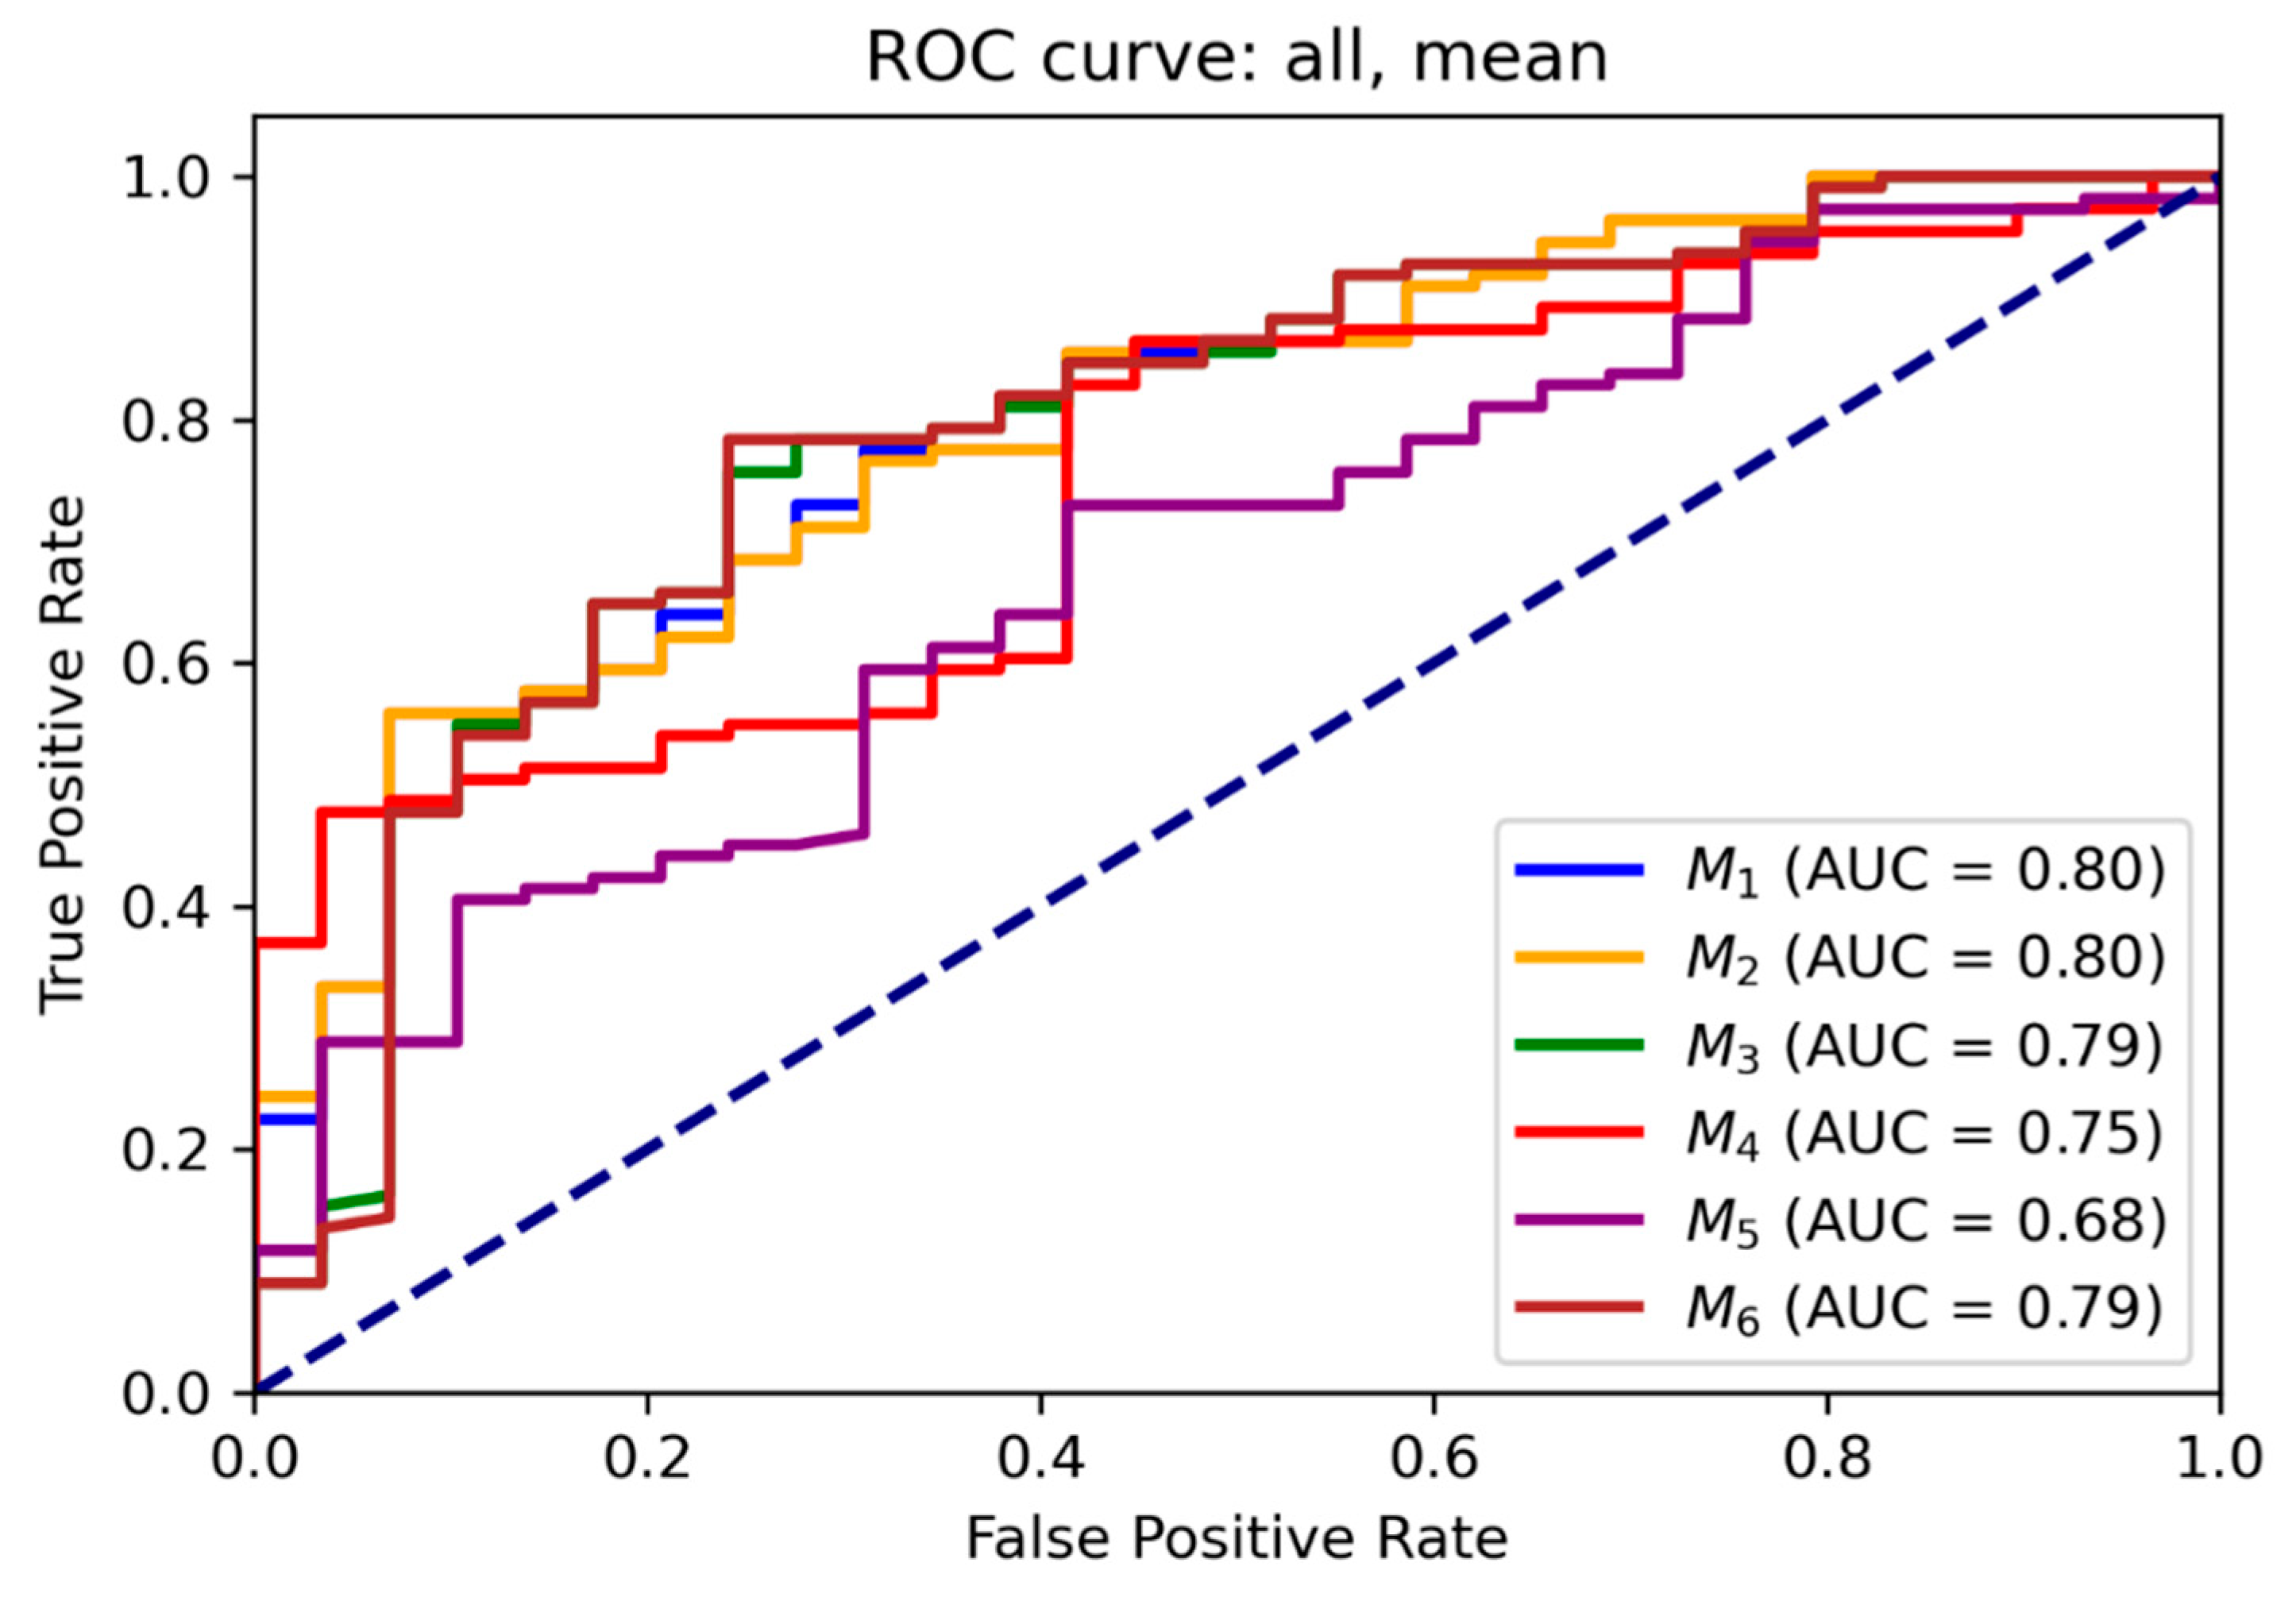
Figure 6.
ROC curves for the binomial regression models for maximum value.
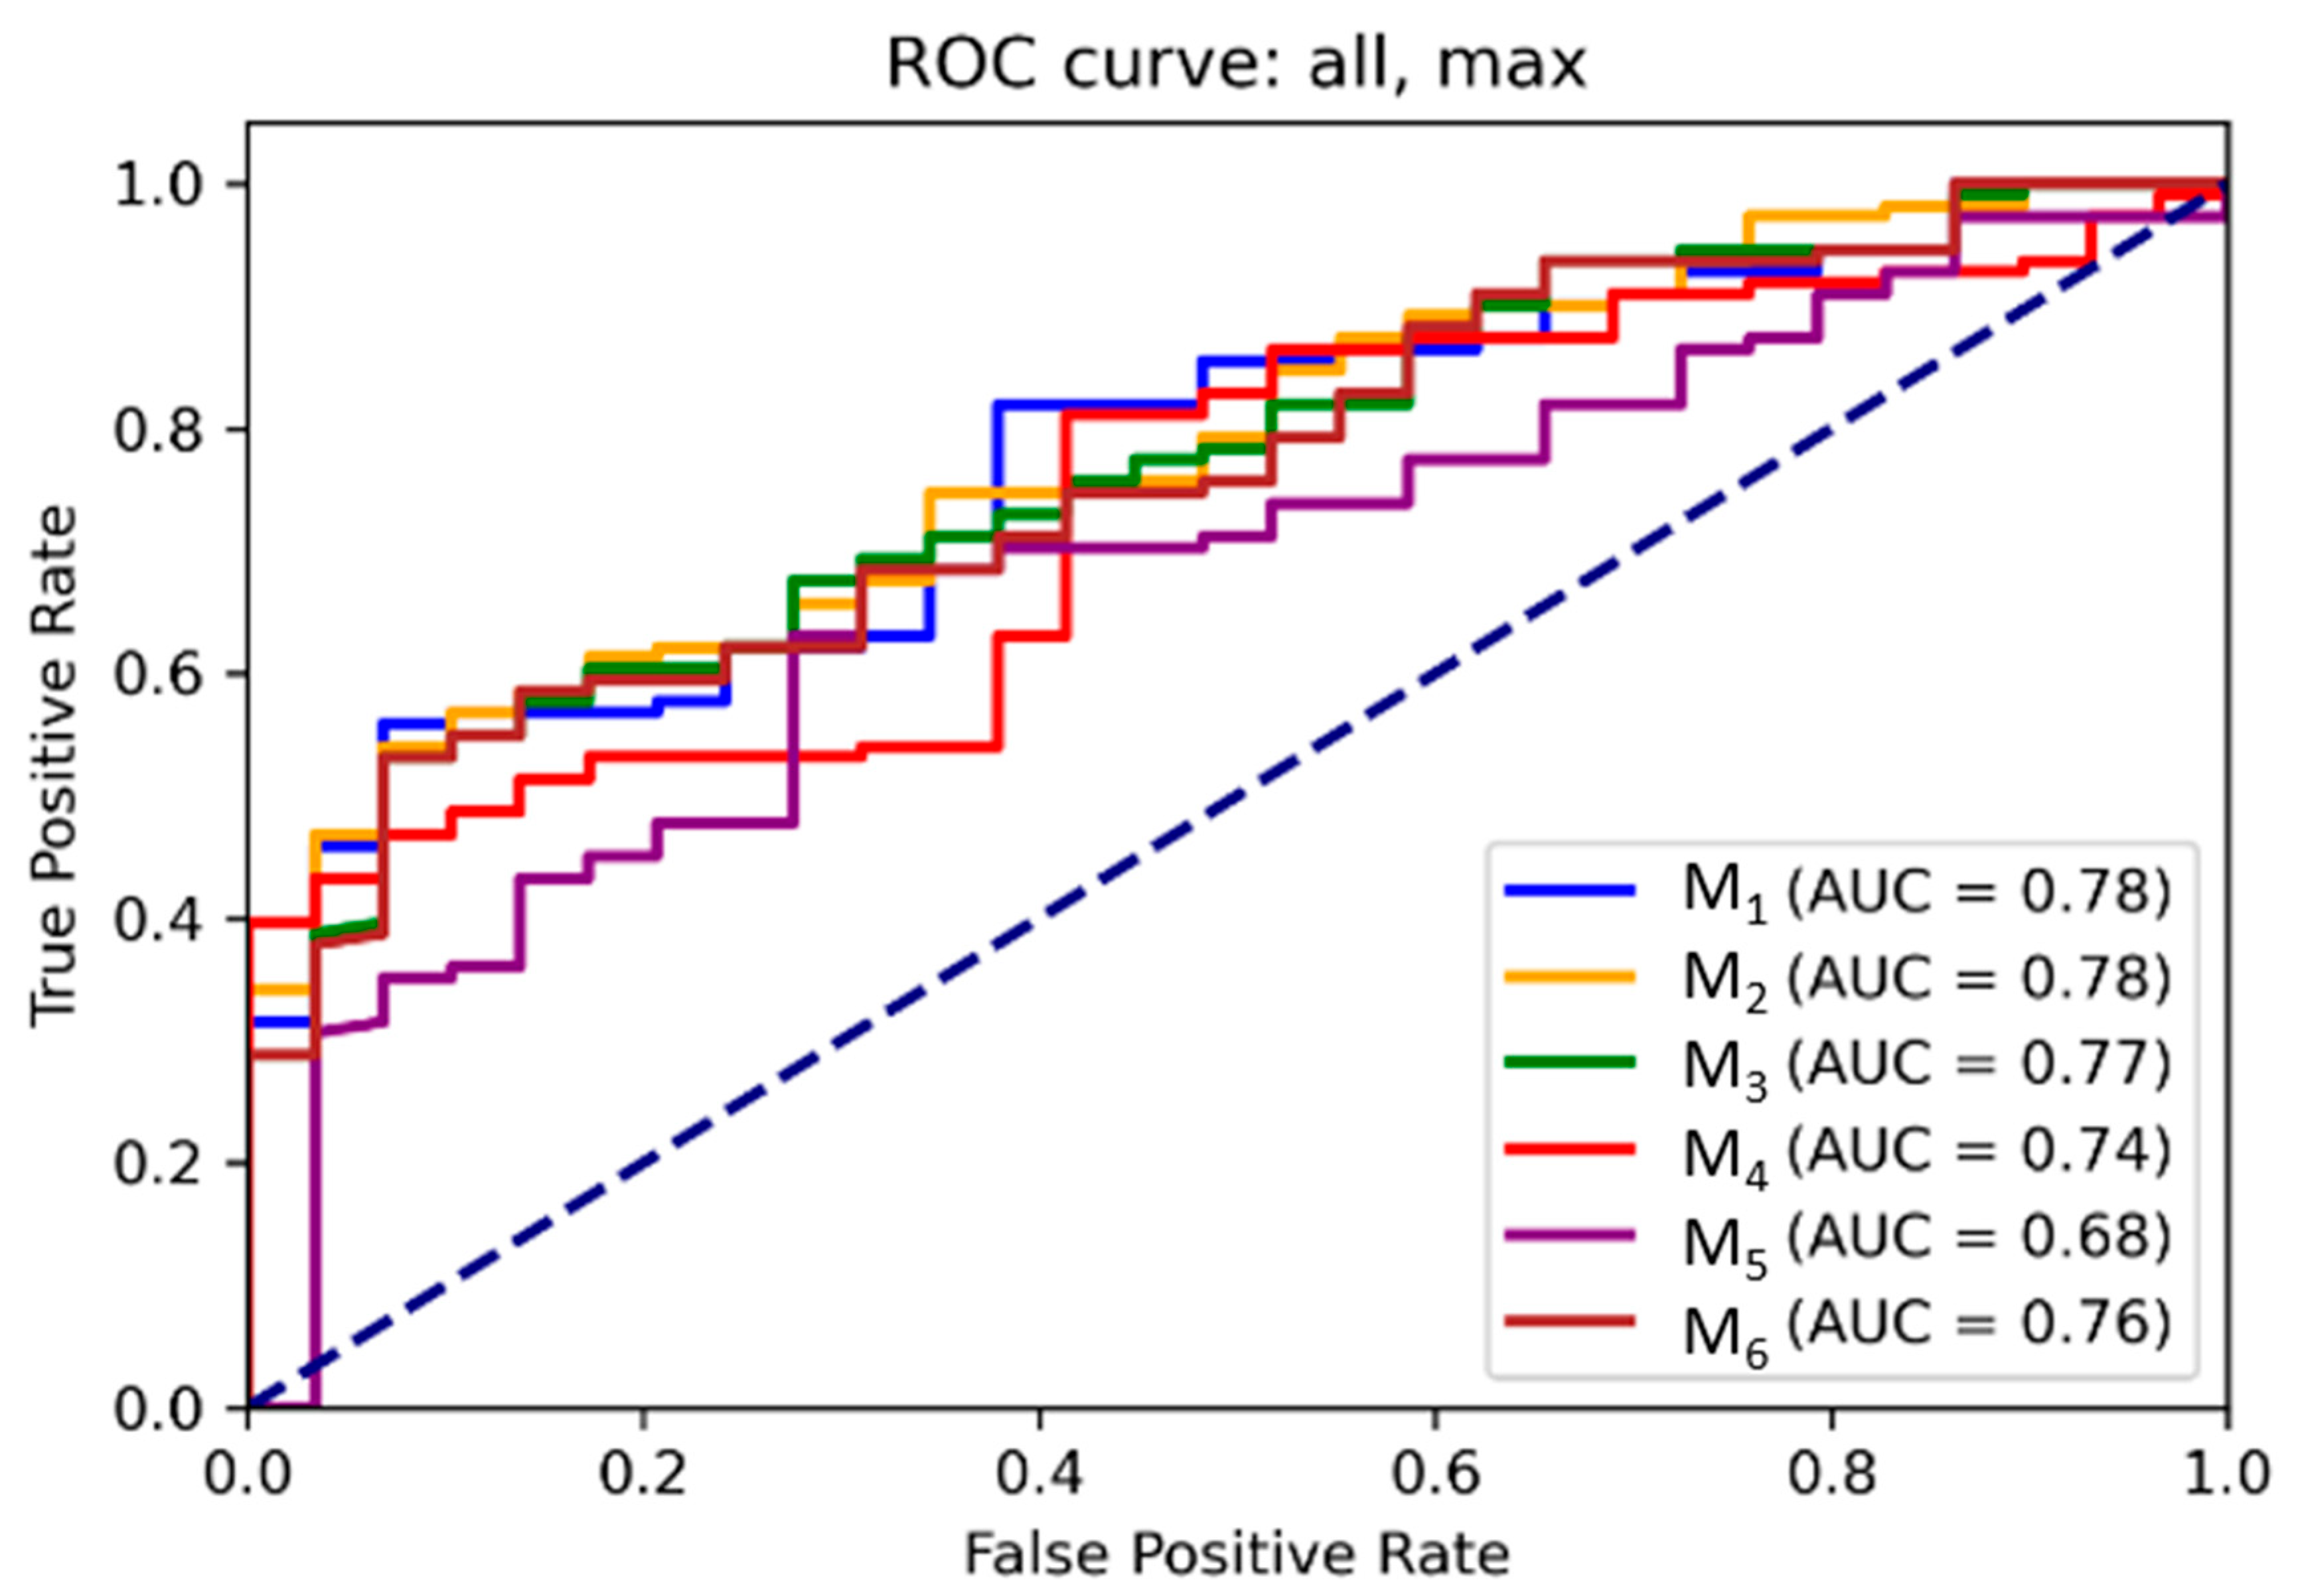

Table 1.
Histology of examined lesions.
| Histology | Tumor (n=38) |
Lymph nodes (n=104) |
|---|---|---|
| Malignant | 30 (78.9 %) | 82 (78.8 %) |
| Squamous cell carcinoma | 25 (65.8 %) | 62 (50.6 %) |
| Other malignities (lymphoma, adenocarcinoma, verucosic carcinoma, epithelial-myoepithelial carcinoma, epitheloid sarcoma, sebocellular carcinoma) | 5 (13.2 %) | 20 (19.2 %) |
| Non-malignant (e.g. inflammation, physiological finding) | 8 (21 %) | 22 (21.1 %) |
Table 2.
Thresholds derived from maximum Youden index, minimum distance to ideal point and for 95 % sensitivity for dynamic PET. The thresholds are derived for equation: DVFDG [%] + weight x [µmol/min/ml]> threshold.
Table 2.
Thresholds derived from maximum Youden index, minimum distance to ideal point and for 95 % sensitivity for dynamic PET. The thresholds are derived for equation: DVFDG [%] + weight x [µmol/min/ml]> threshold.
| M3 | weight for MRFDG | Youden index | distance | 95 % sensitivity |
| mean | 7.2 | 70 | 70 | 52 |
| max | -29 | 194 | 147 | 94 |
Table 3.
Normalized thresholds derived from maximum Youden index, minimum distance to ideal point and for 95 % sensitivity for individual parameters.
Table 3.
Normalized thresholds derived from maximum Youden index, minimum distance to ideal point and for 95 % sensitivity for individual parameters.
| unit | Youden index | distance | 95.0 % sensitivity | |
| mean | SUVbw (g/mL) | 5.8 | 3.0 | 2.4 |
| MRFDG (µmol/mL/min) | 0.050 | 0.050 | 0.026 | |
| DVFDG (%) | 68 | 68 | 51 | |
| max | SUVbw (g/mL) | 8.7 | 4.4 | 3.4 |
| MRFDG (µmol/mL/min) | 0.110 | 0.110 | 0.051 | |
| DVFDG (%) | 202 | 168 | 96 |
Disclaimer/Publisher’s Note: The statements, opinions and data contained in all publications are solely those of the individual author(s) and contributor(s) and not of MDPI and/or the editor(s). MDPI and/or the editor(s) disclaim responsibility for any injury to people or property resulting from any ideas, methods, instructions or products referred to in the content. |
© 2025 by the authors. Licensee MDPI, Basel, Switzerland. This article is an open access article distributed under the terms and conditions of the Creative Commons Attribution (CC BY) license (http://creativecommons.org/licenses/by/4.0/).
Copyright: This open access article is published under a Creative Commons CC BY 4.0 license, which permit the free download, distribution, and reuse, provided that the author and preprint are cited in any reuse.


