Submitted:
20 September 2025
Posted:
23 September 2025
You are already at the latest version
Abstract
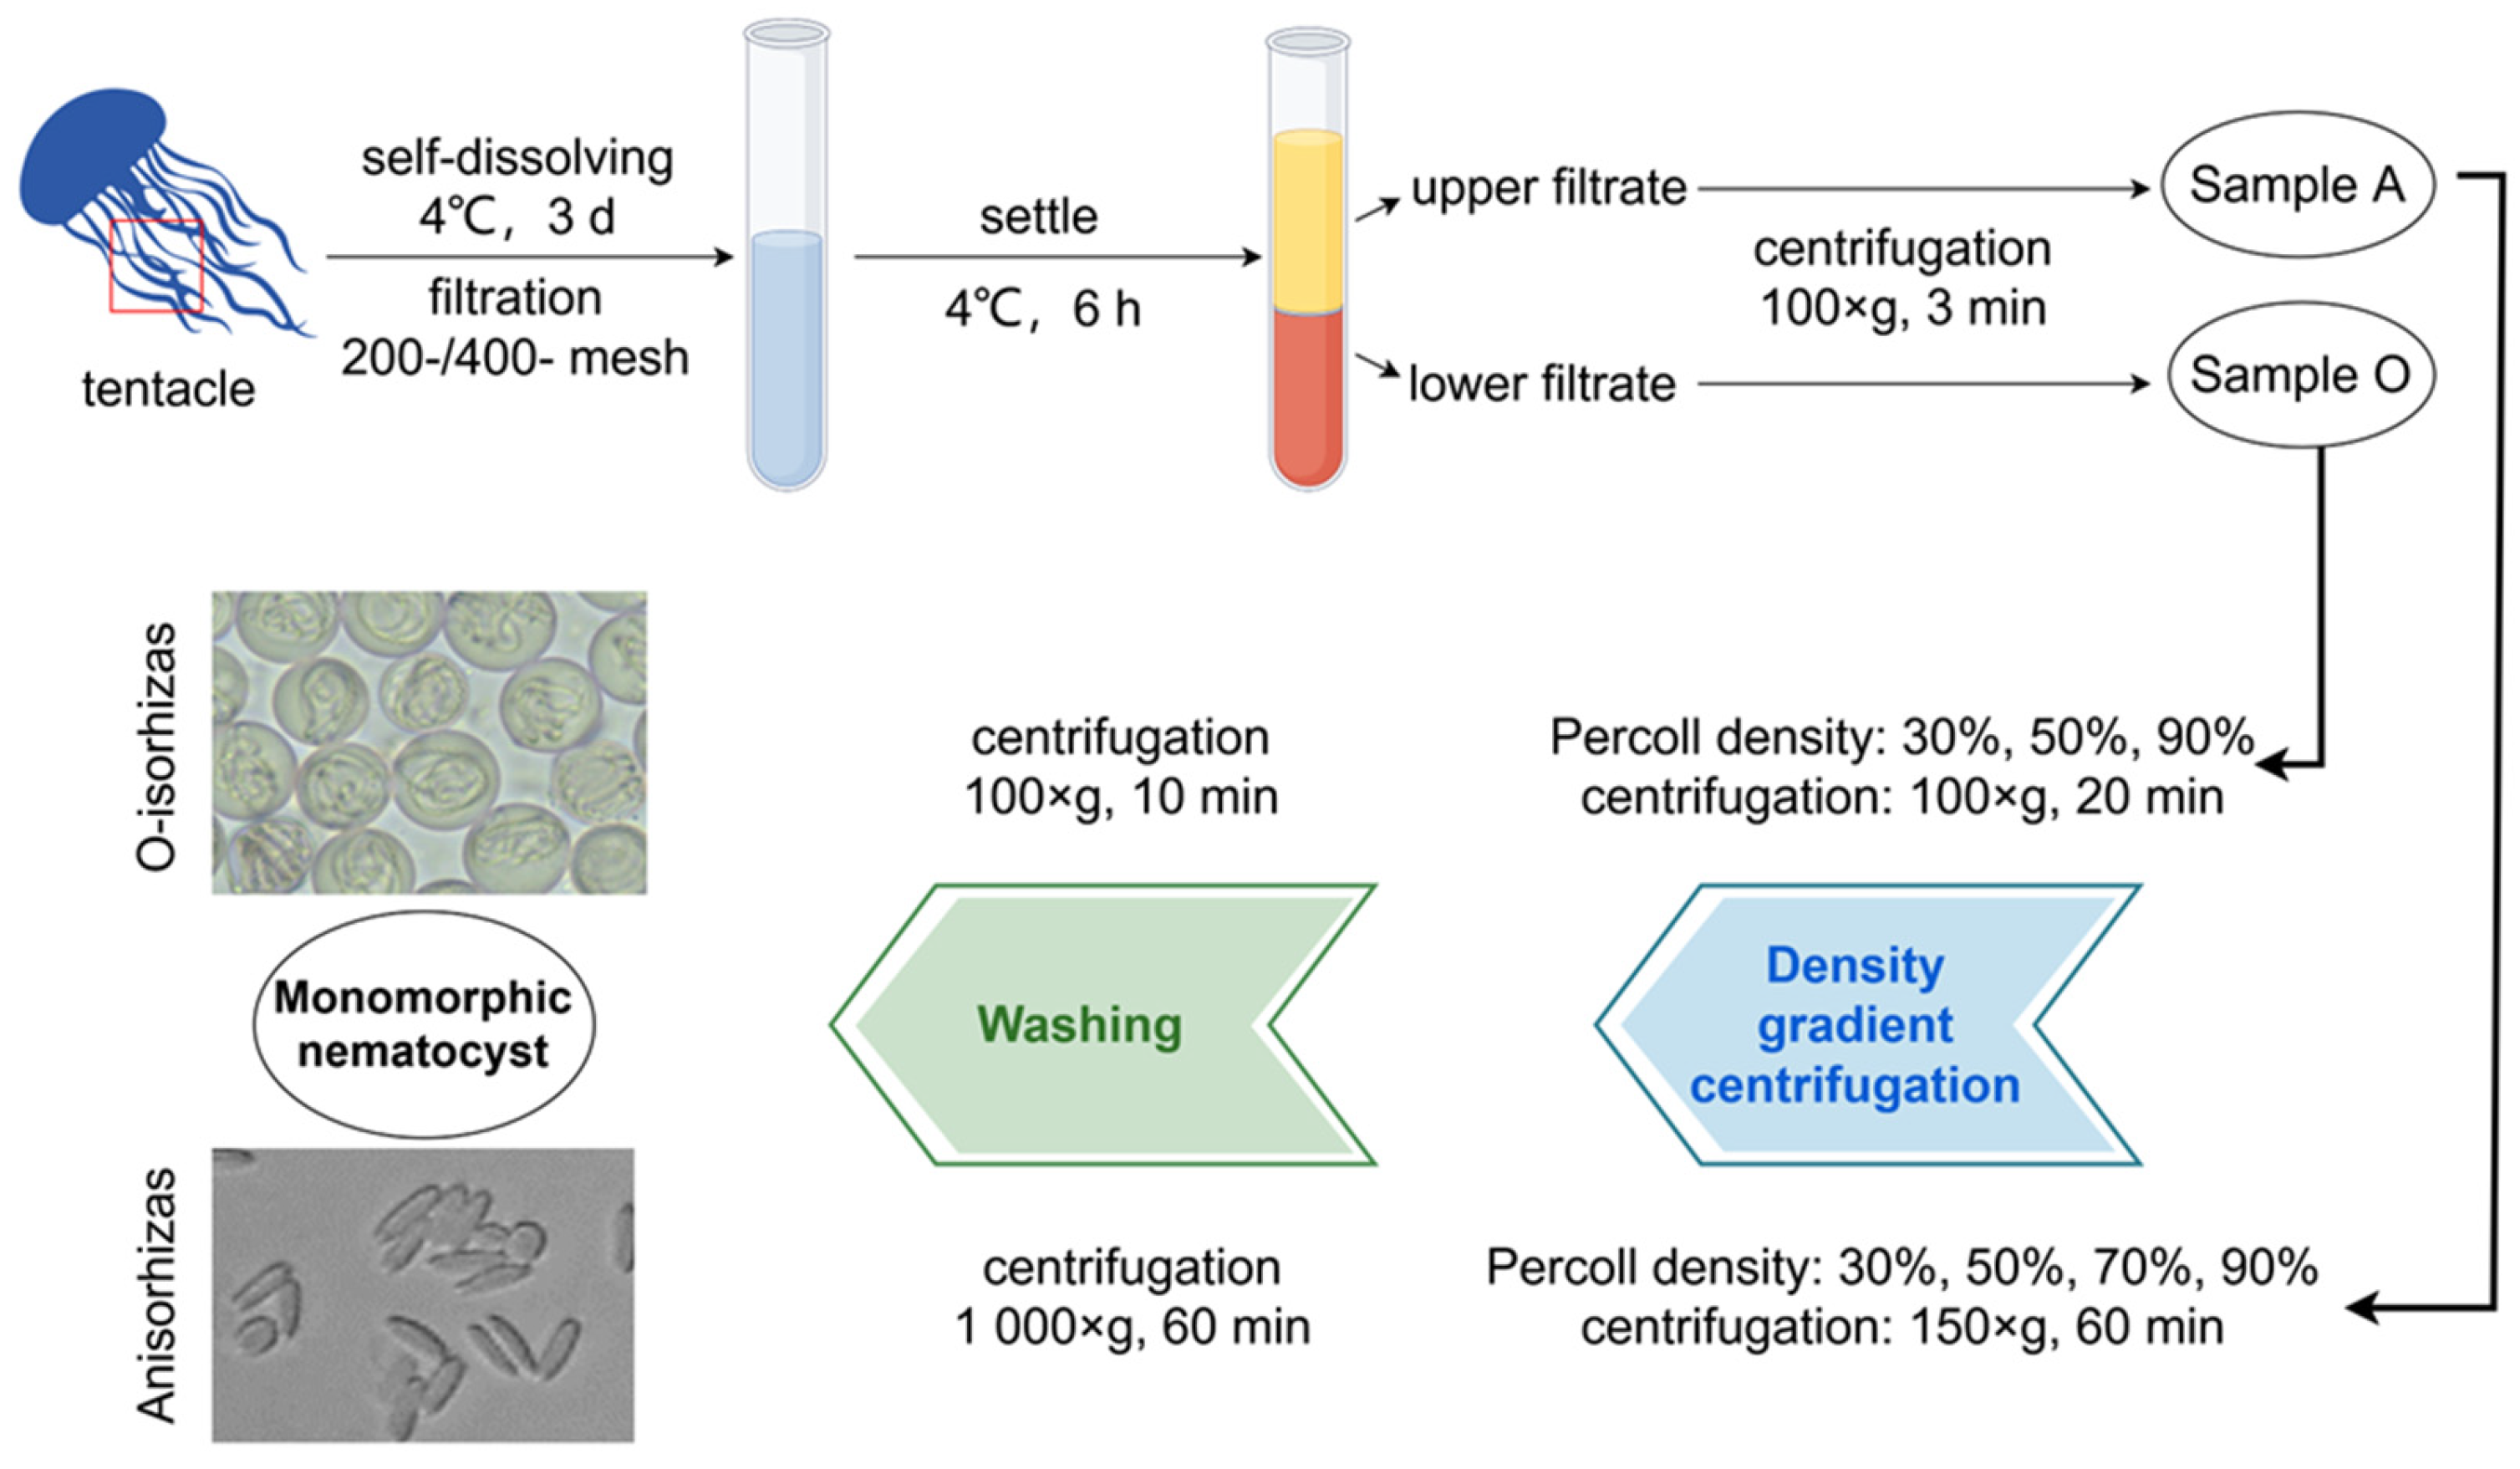
Nemopilema nomurai is a species of common large toxic jellyfish in China seas, and its tentacle tissues contain various types of nematocysts. However, the correlation between the morphology and function of nematocysts still remains unclear. In this study, we first obtained two monomorphic nematocysts with high-purity from N. nomurai, namely Anisorhizas and O-isorhizas, by density gradient centrifugation: the Anisorhizas is small and rod-shaped and the O-isorhizas is larger and spherical. Upon deionized water stimulation, O-isorhizas exhibited a stronger discharge capability than Anisorhizas. The nematocyst contents of Anisorhizas (AnC) and O-isorhizas (OnC) were extracted separately, and their composition and bioactivities were analyzed simultaneously. The protein bands by SDS-PAGE revealed similar distributions in AnC and OnC, except that the protein band distribution in OnC was more extensive. OnC showed stronger cytotoxicity, hemolytic activity, metalloprotease activity, and serine protease activity than AnC. In contrast, AnC exhibited a higher antioxidant activity and significant proinflammatory activity. Both AnC and OnC exhibited antimicrobial activities against certain marine pathogenic Vibrios. These results suggest that O-isorhizas, with the larger capsule capability, stronger discharge ability and toxicity, likely plays a major role in inducing toxic effects and tissue damage, while Anisorhizas, being smaller and less toxic, may undertake preferentially other functions, such as synergistic predation, environmental stress adaptation, and energy balance maintenance. This study provides insights into the morpho-functional relationship between various types of nematocysts, and also lays a foundation for further exploration of the functional diversity of nematocysts and the mechanisms underlying jellyfish envenomation.
Keywords:
1. Introduction
2. Results
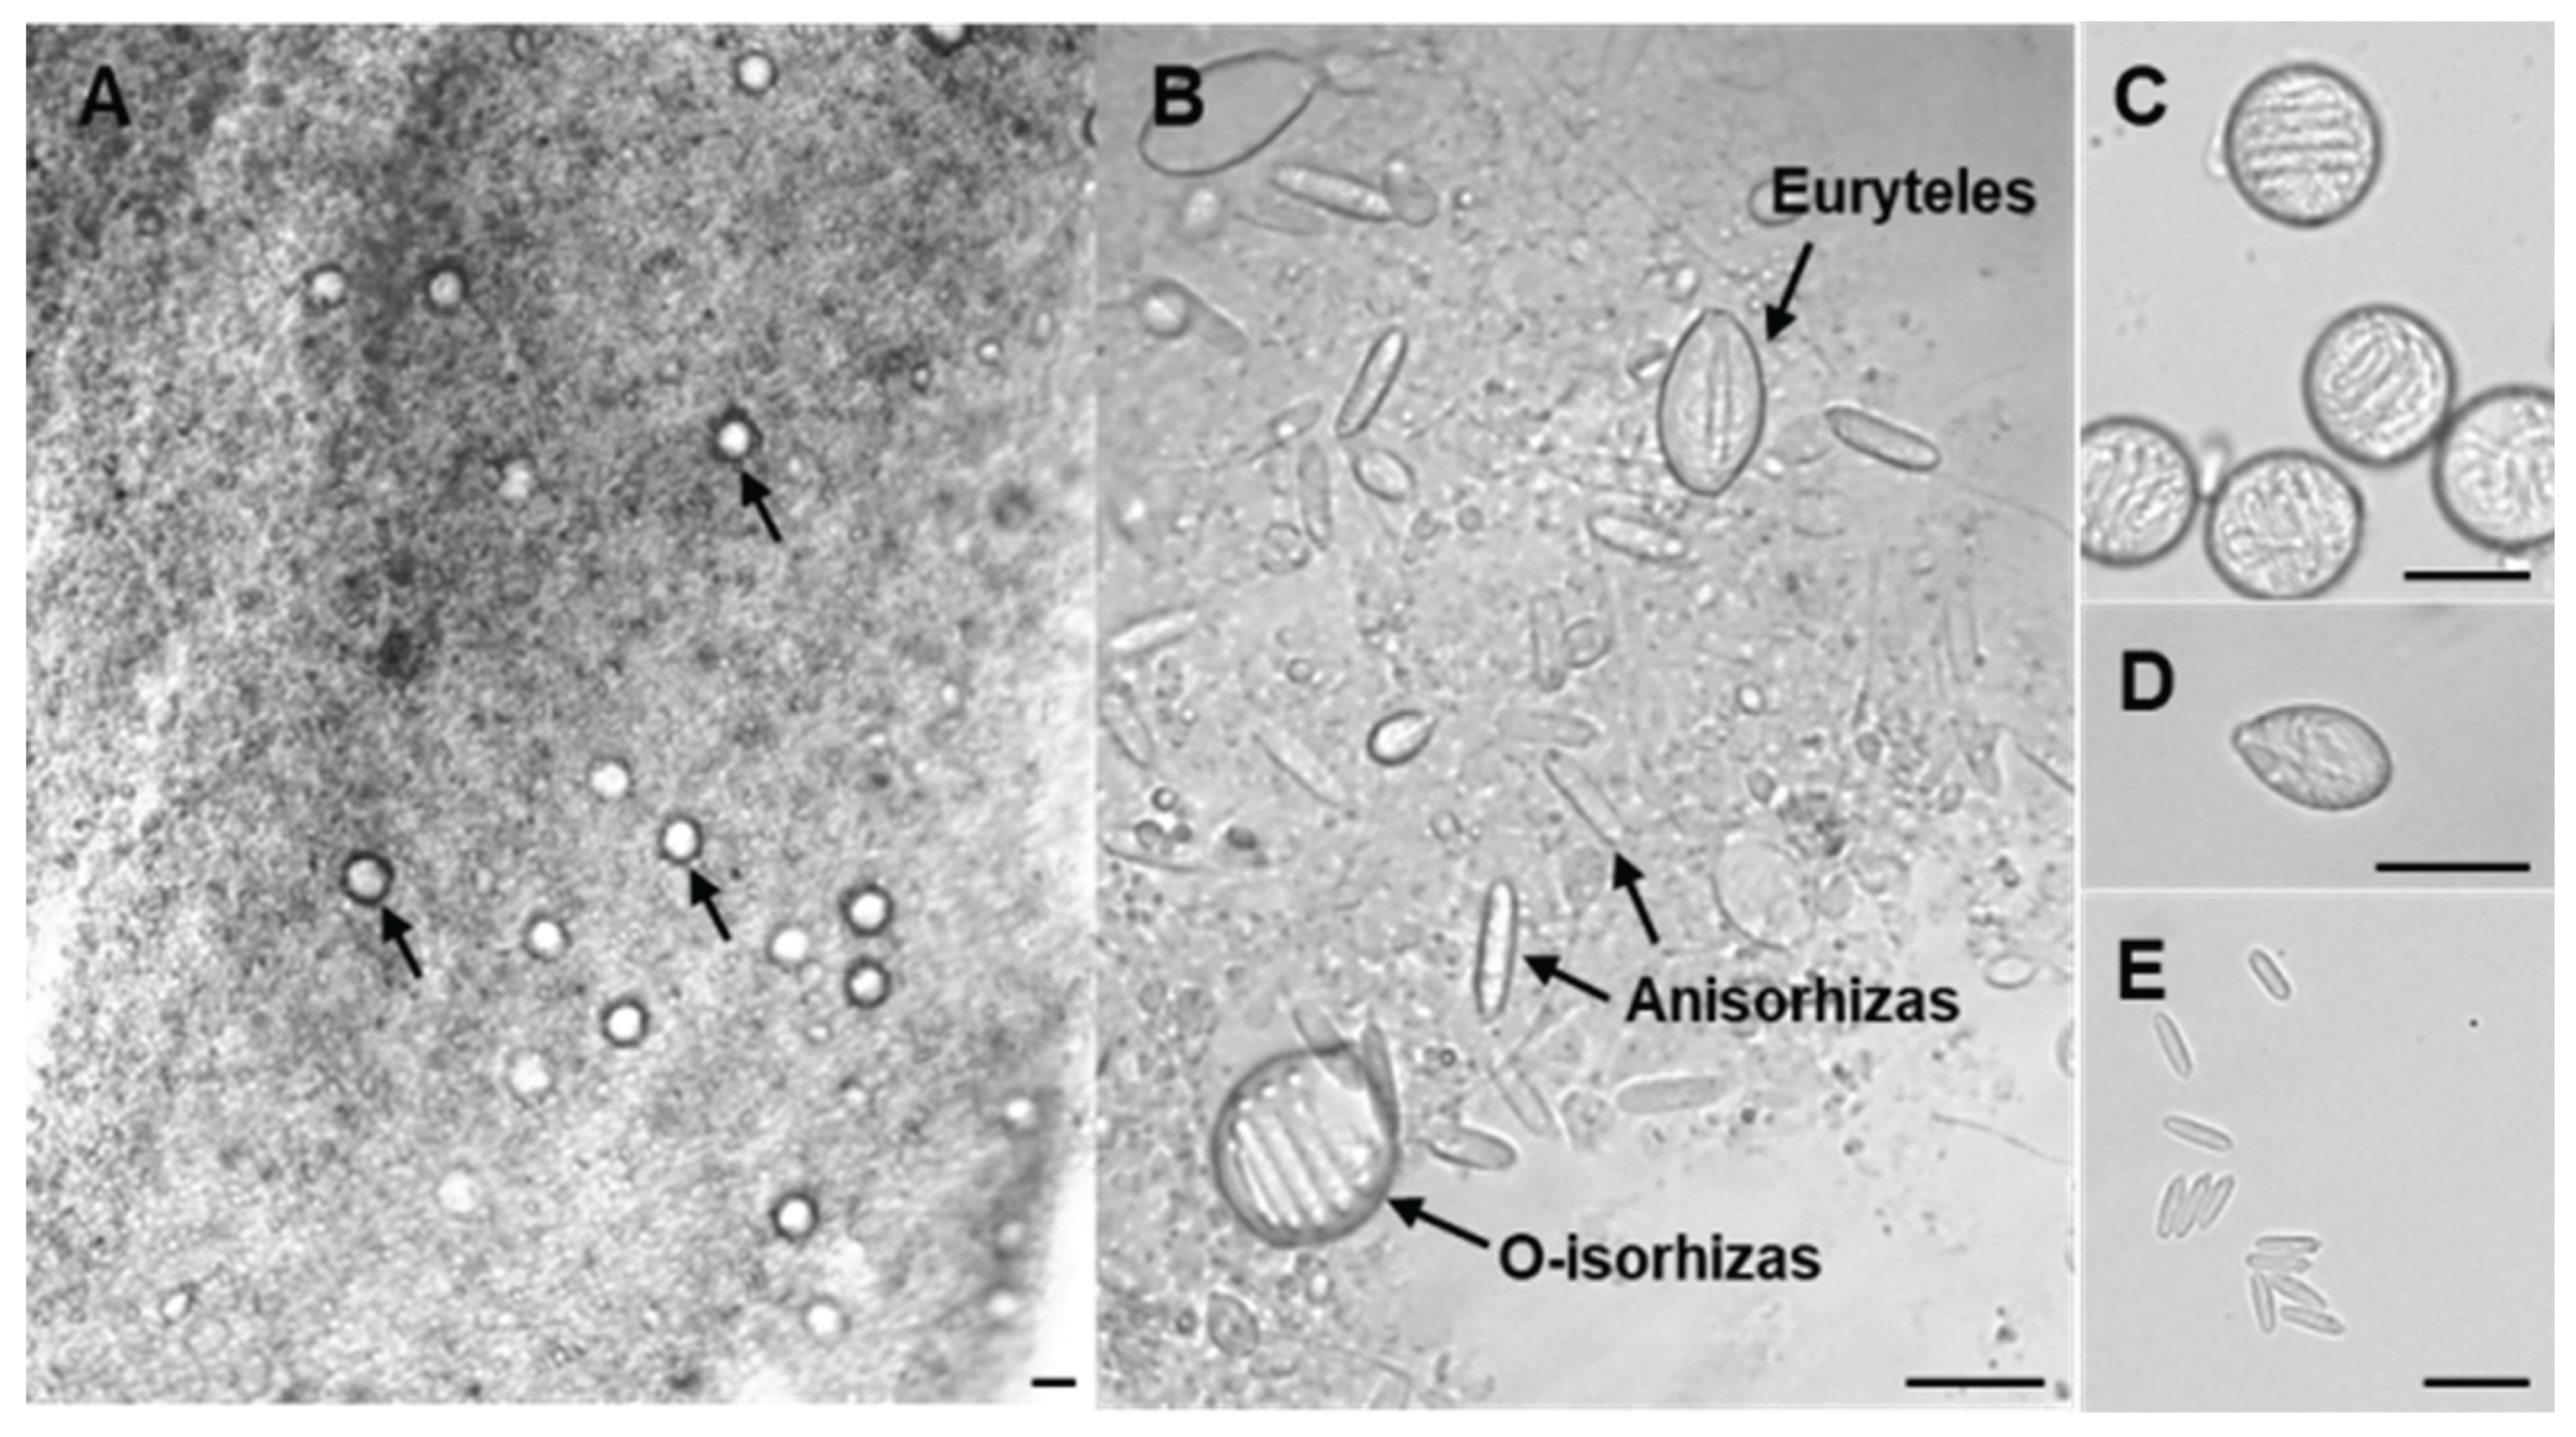
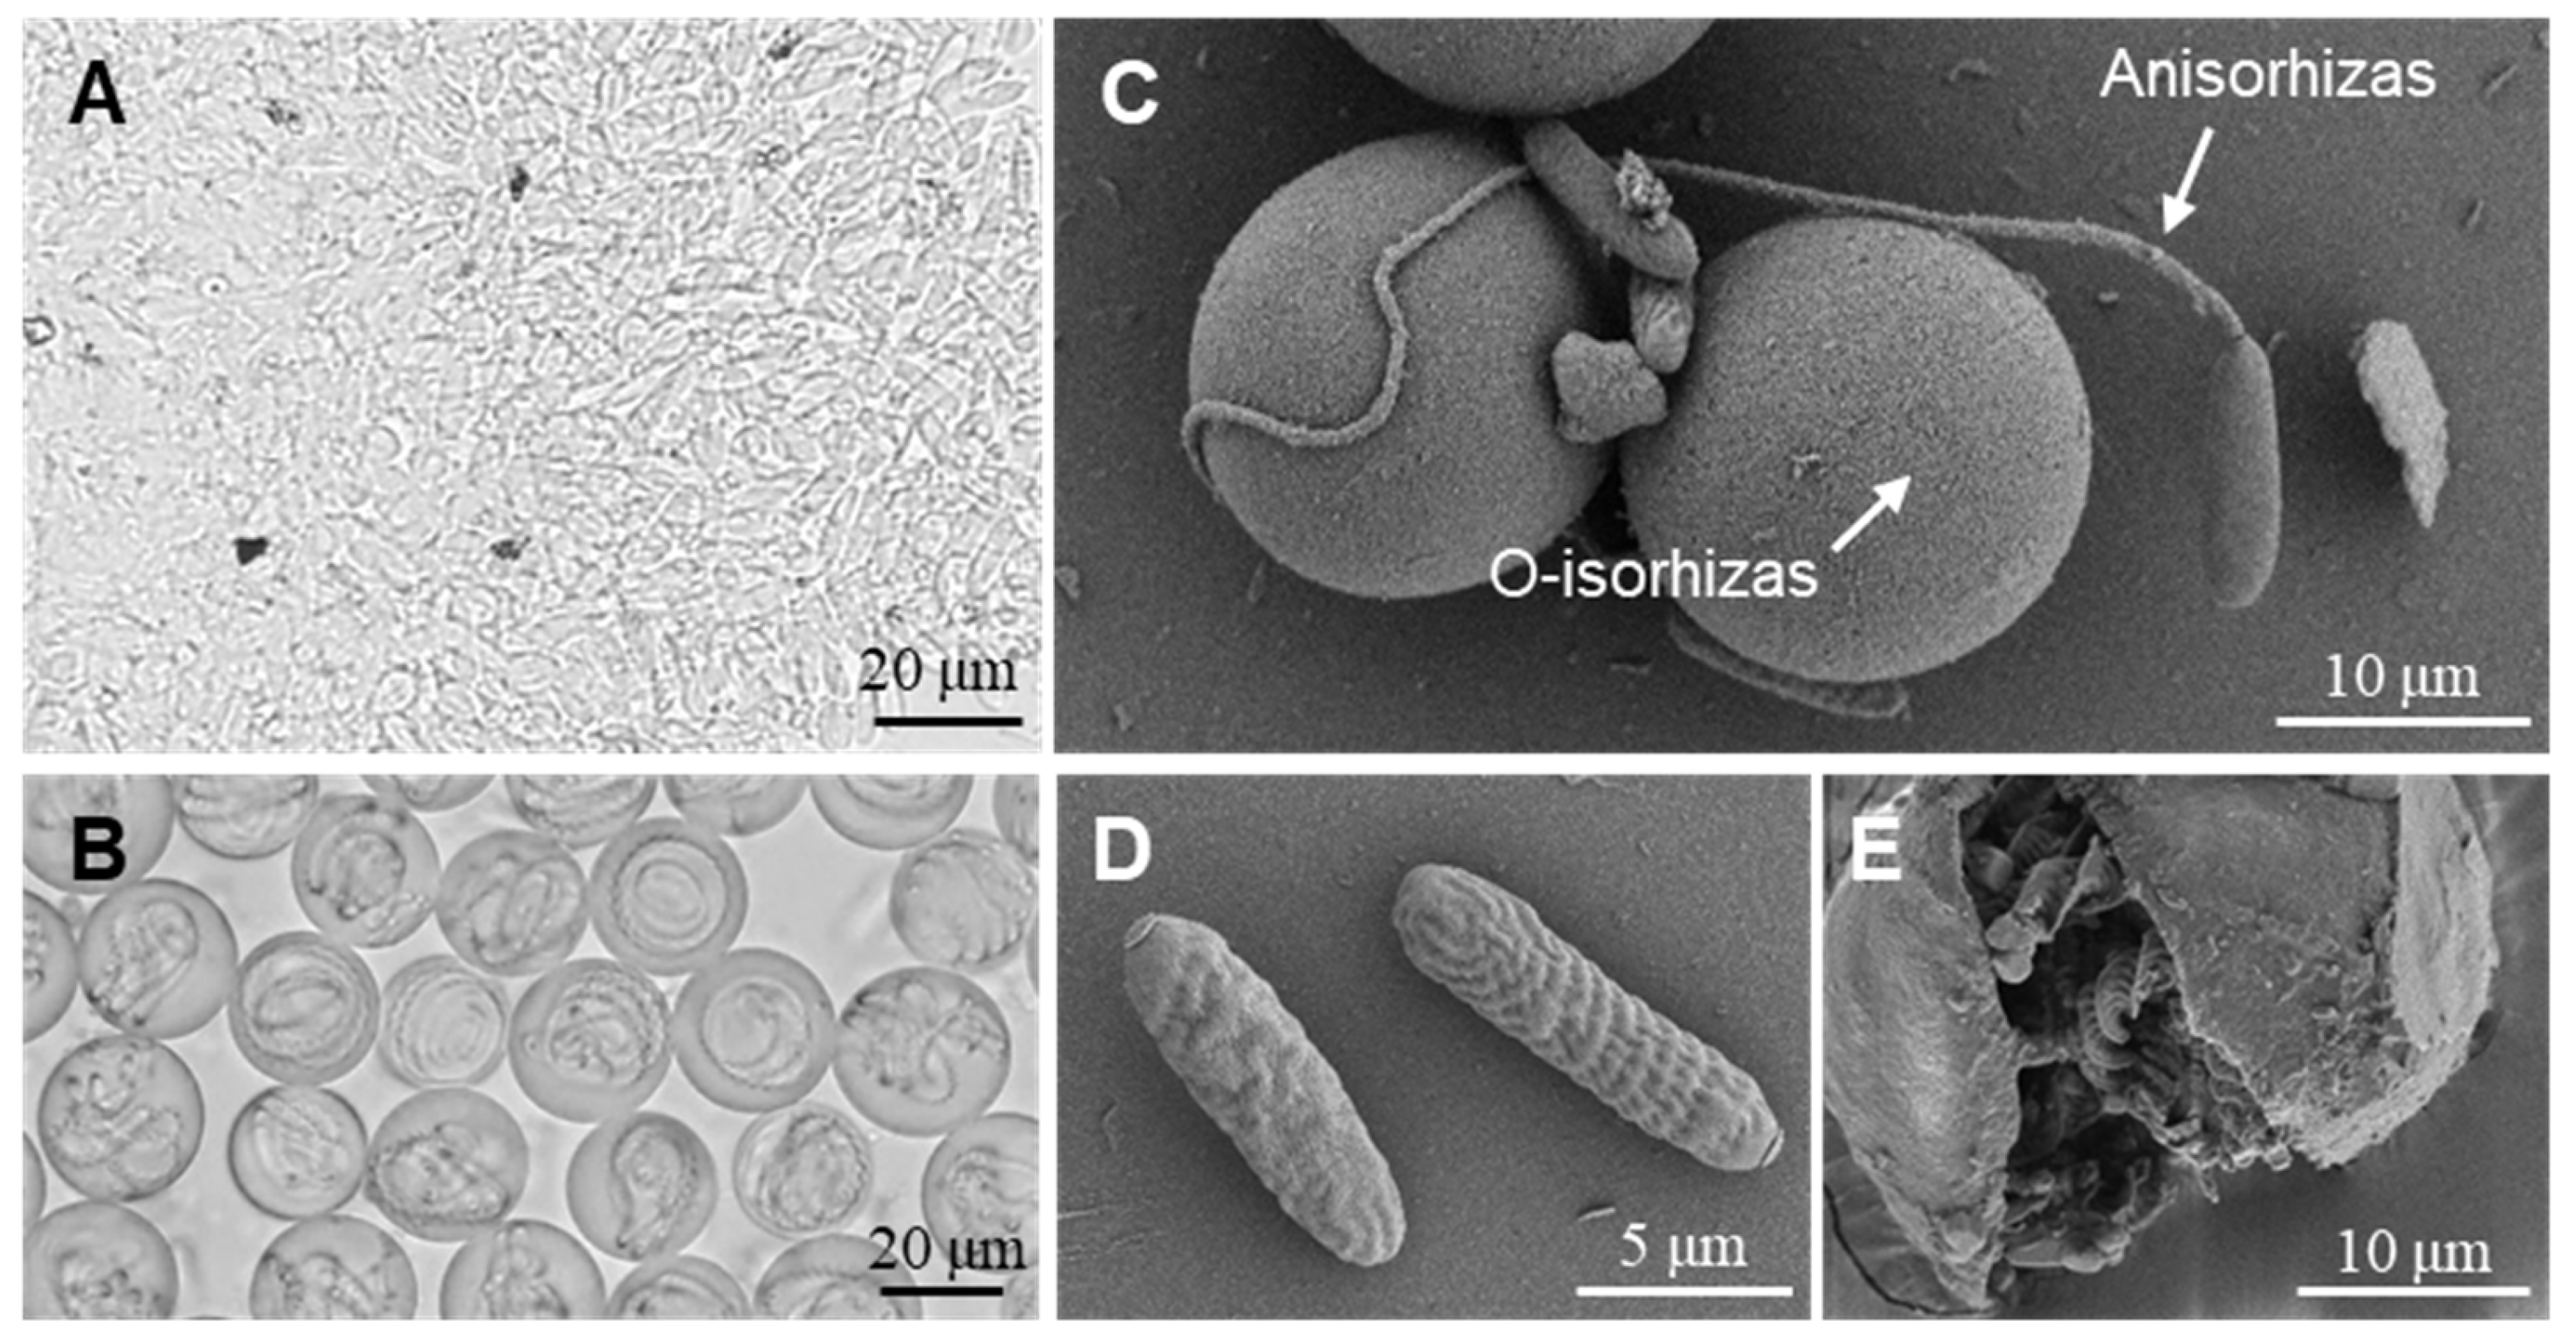
2.1. Microsopic Morphology of N. nomurai Nematocyst
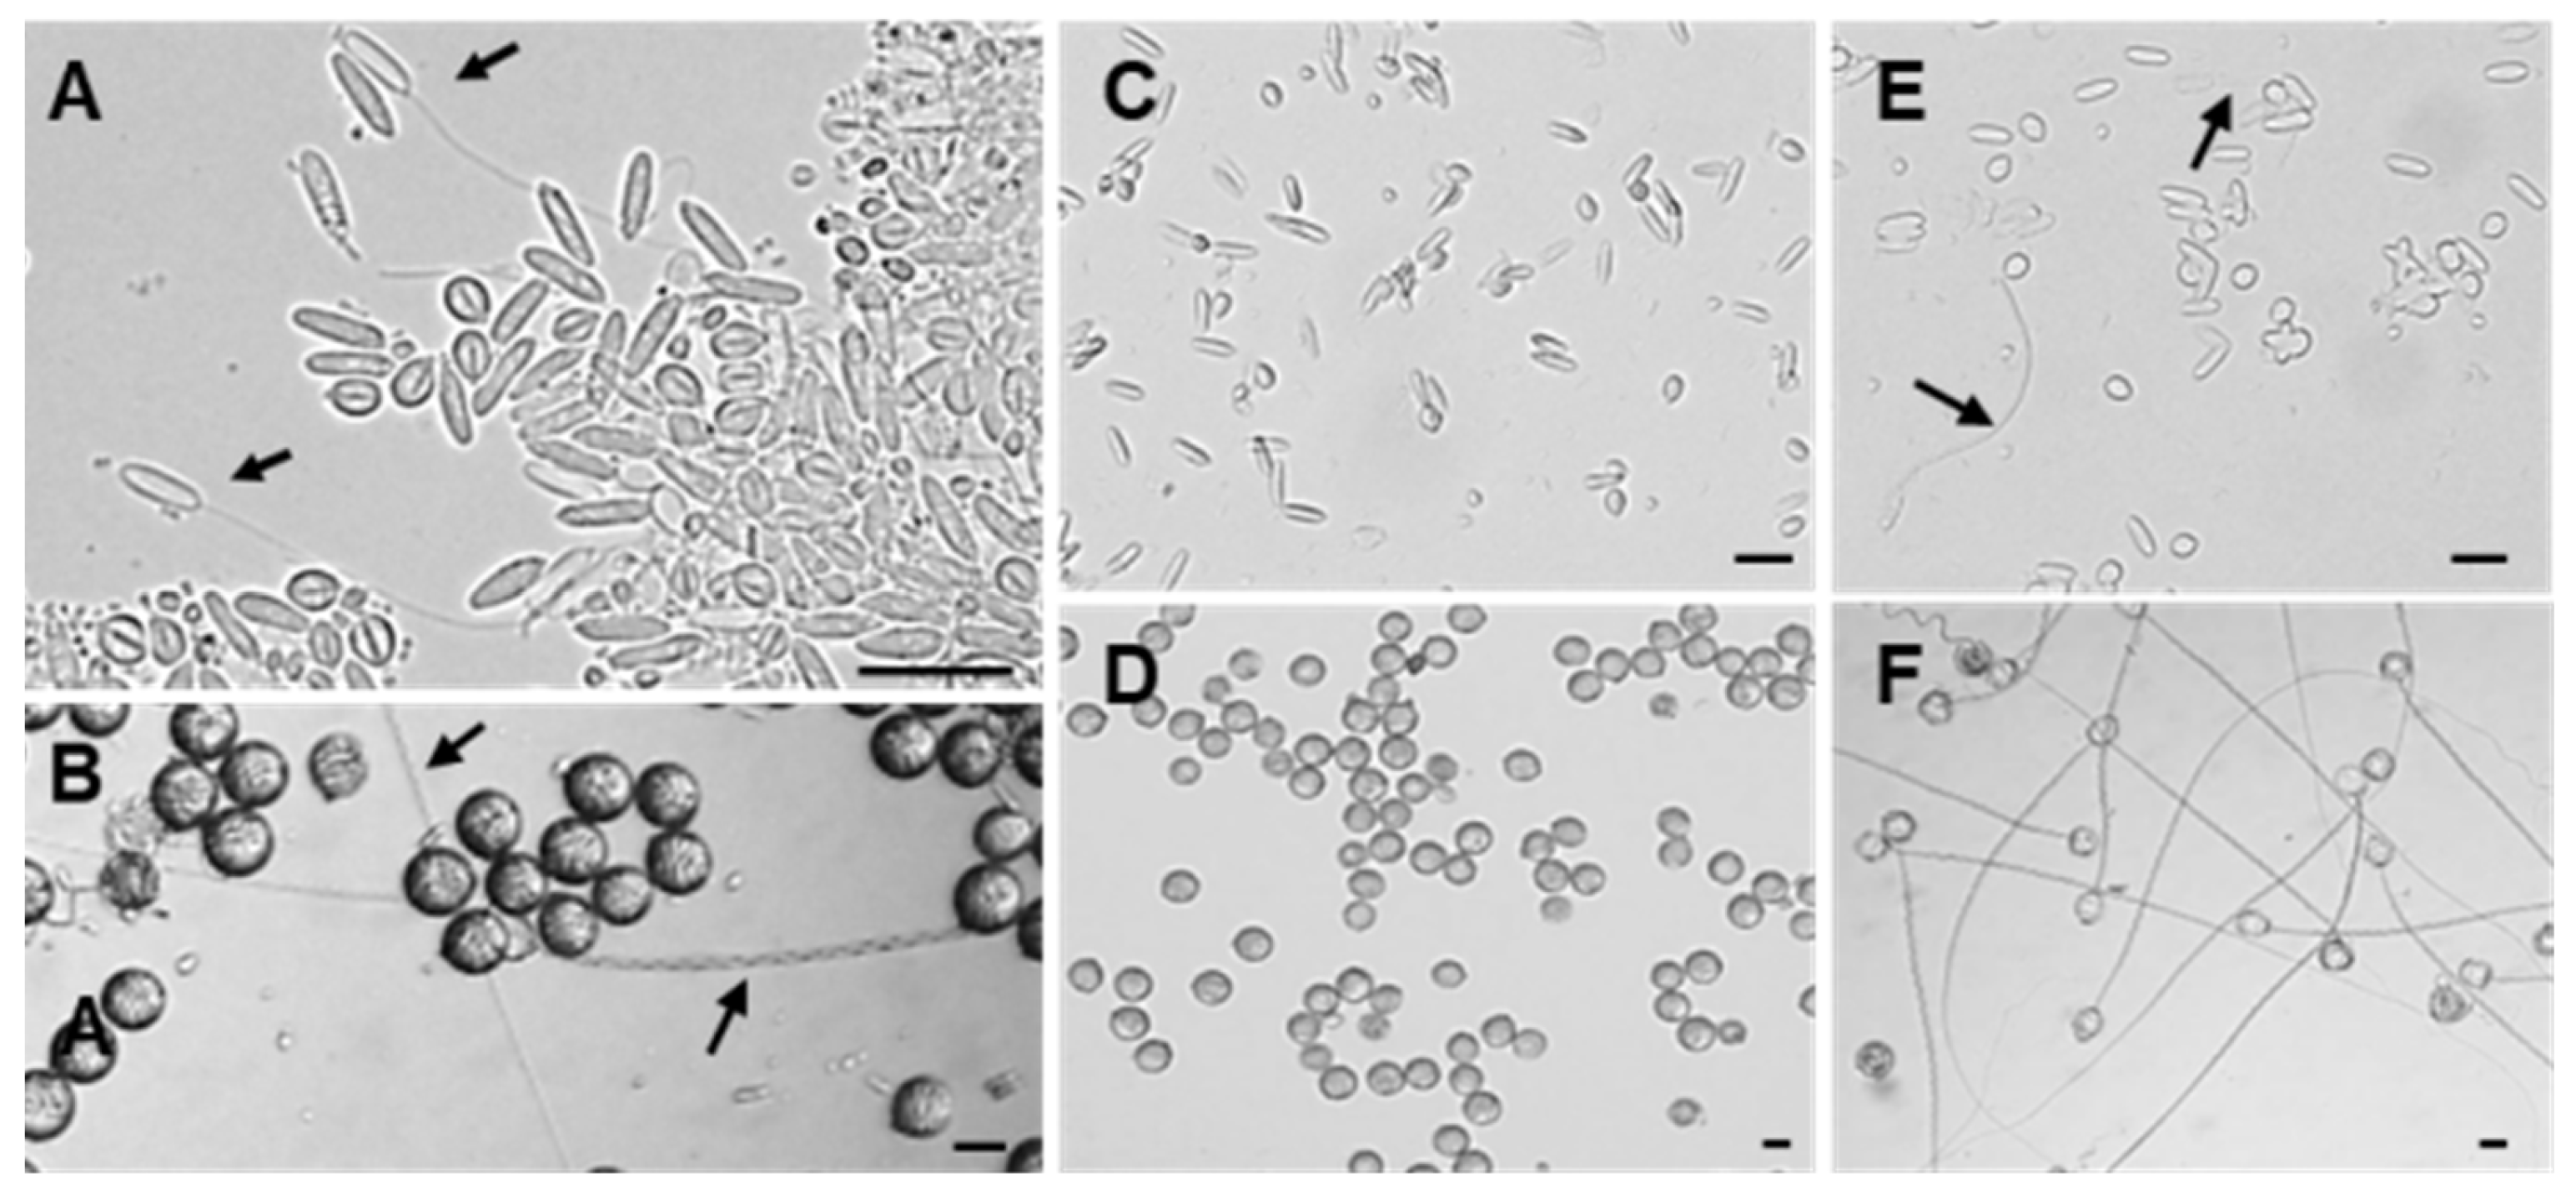
2.2. Discharge Abilities of Anisorhizas and O-Isorhizas
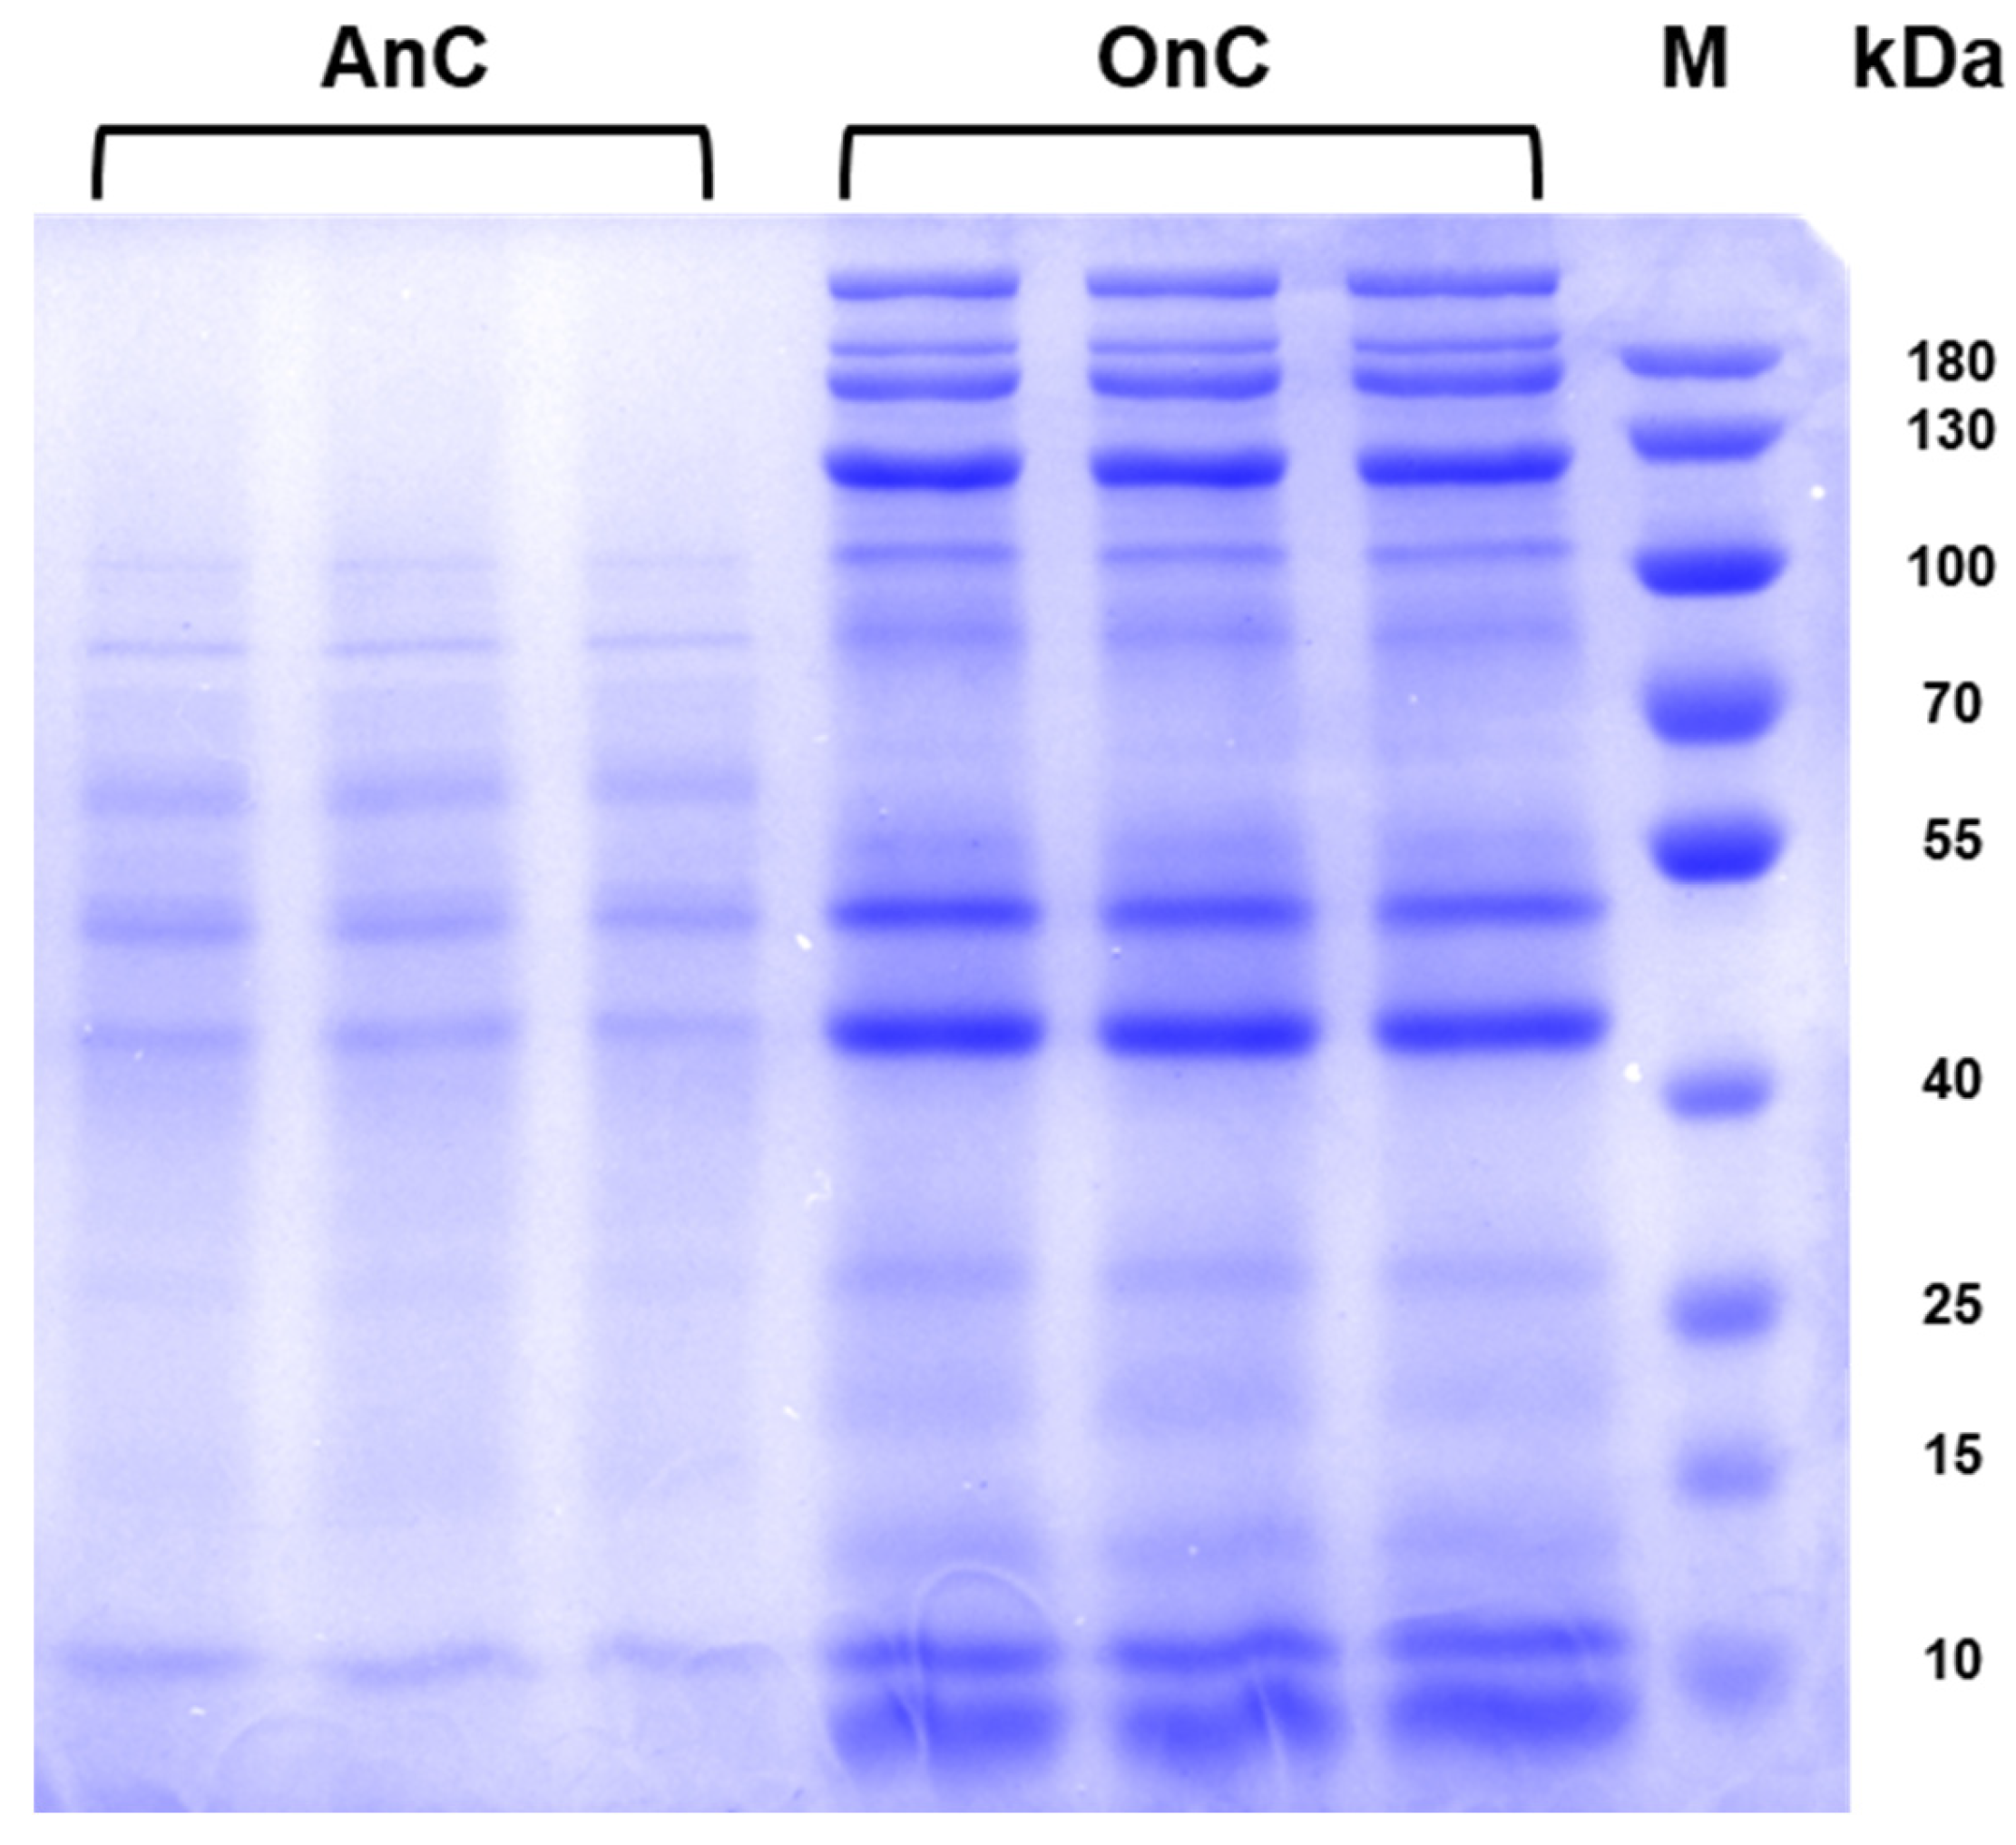
2.3. Protein Composition in Nematocysts
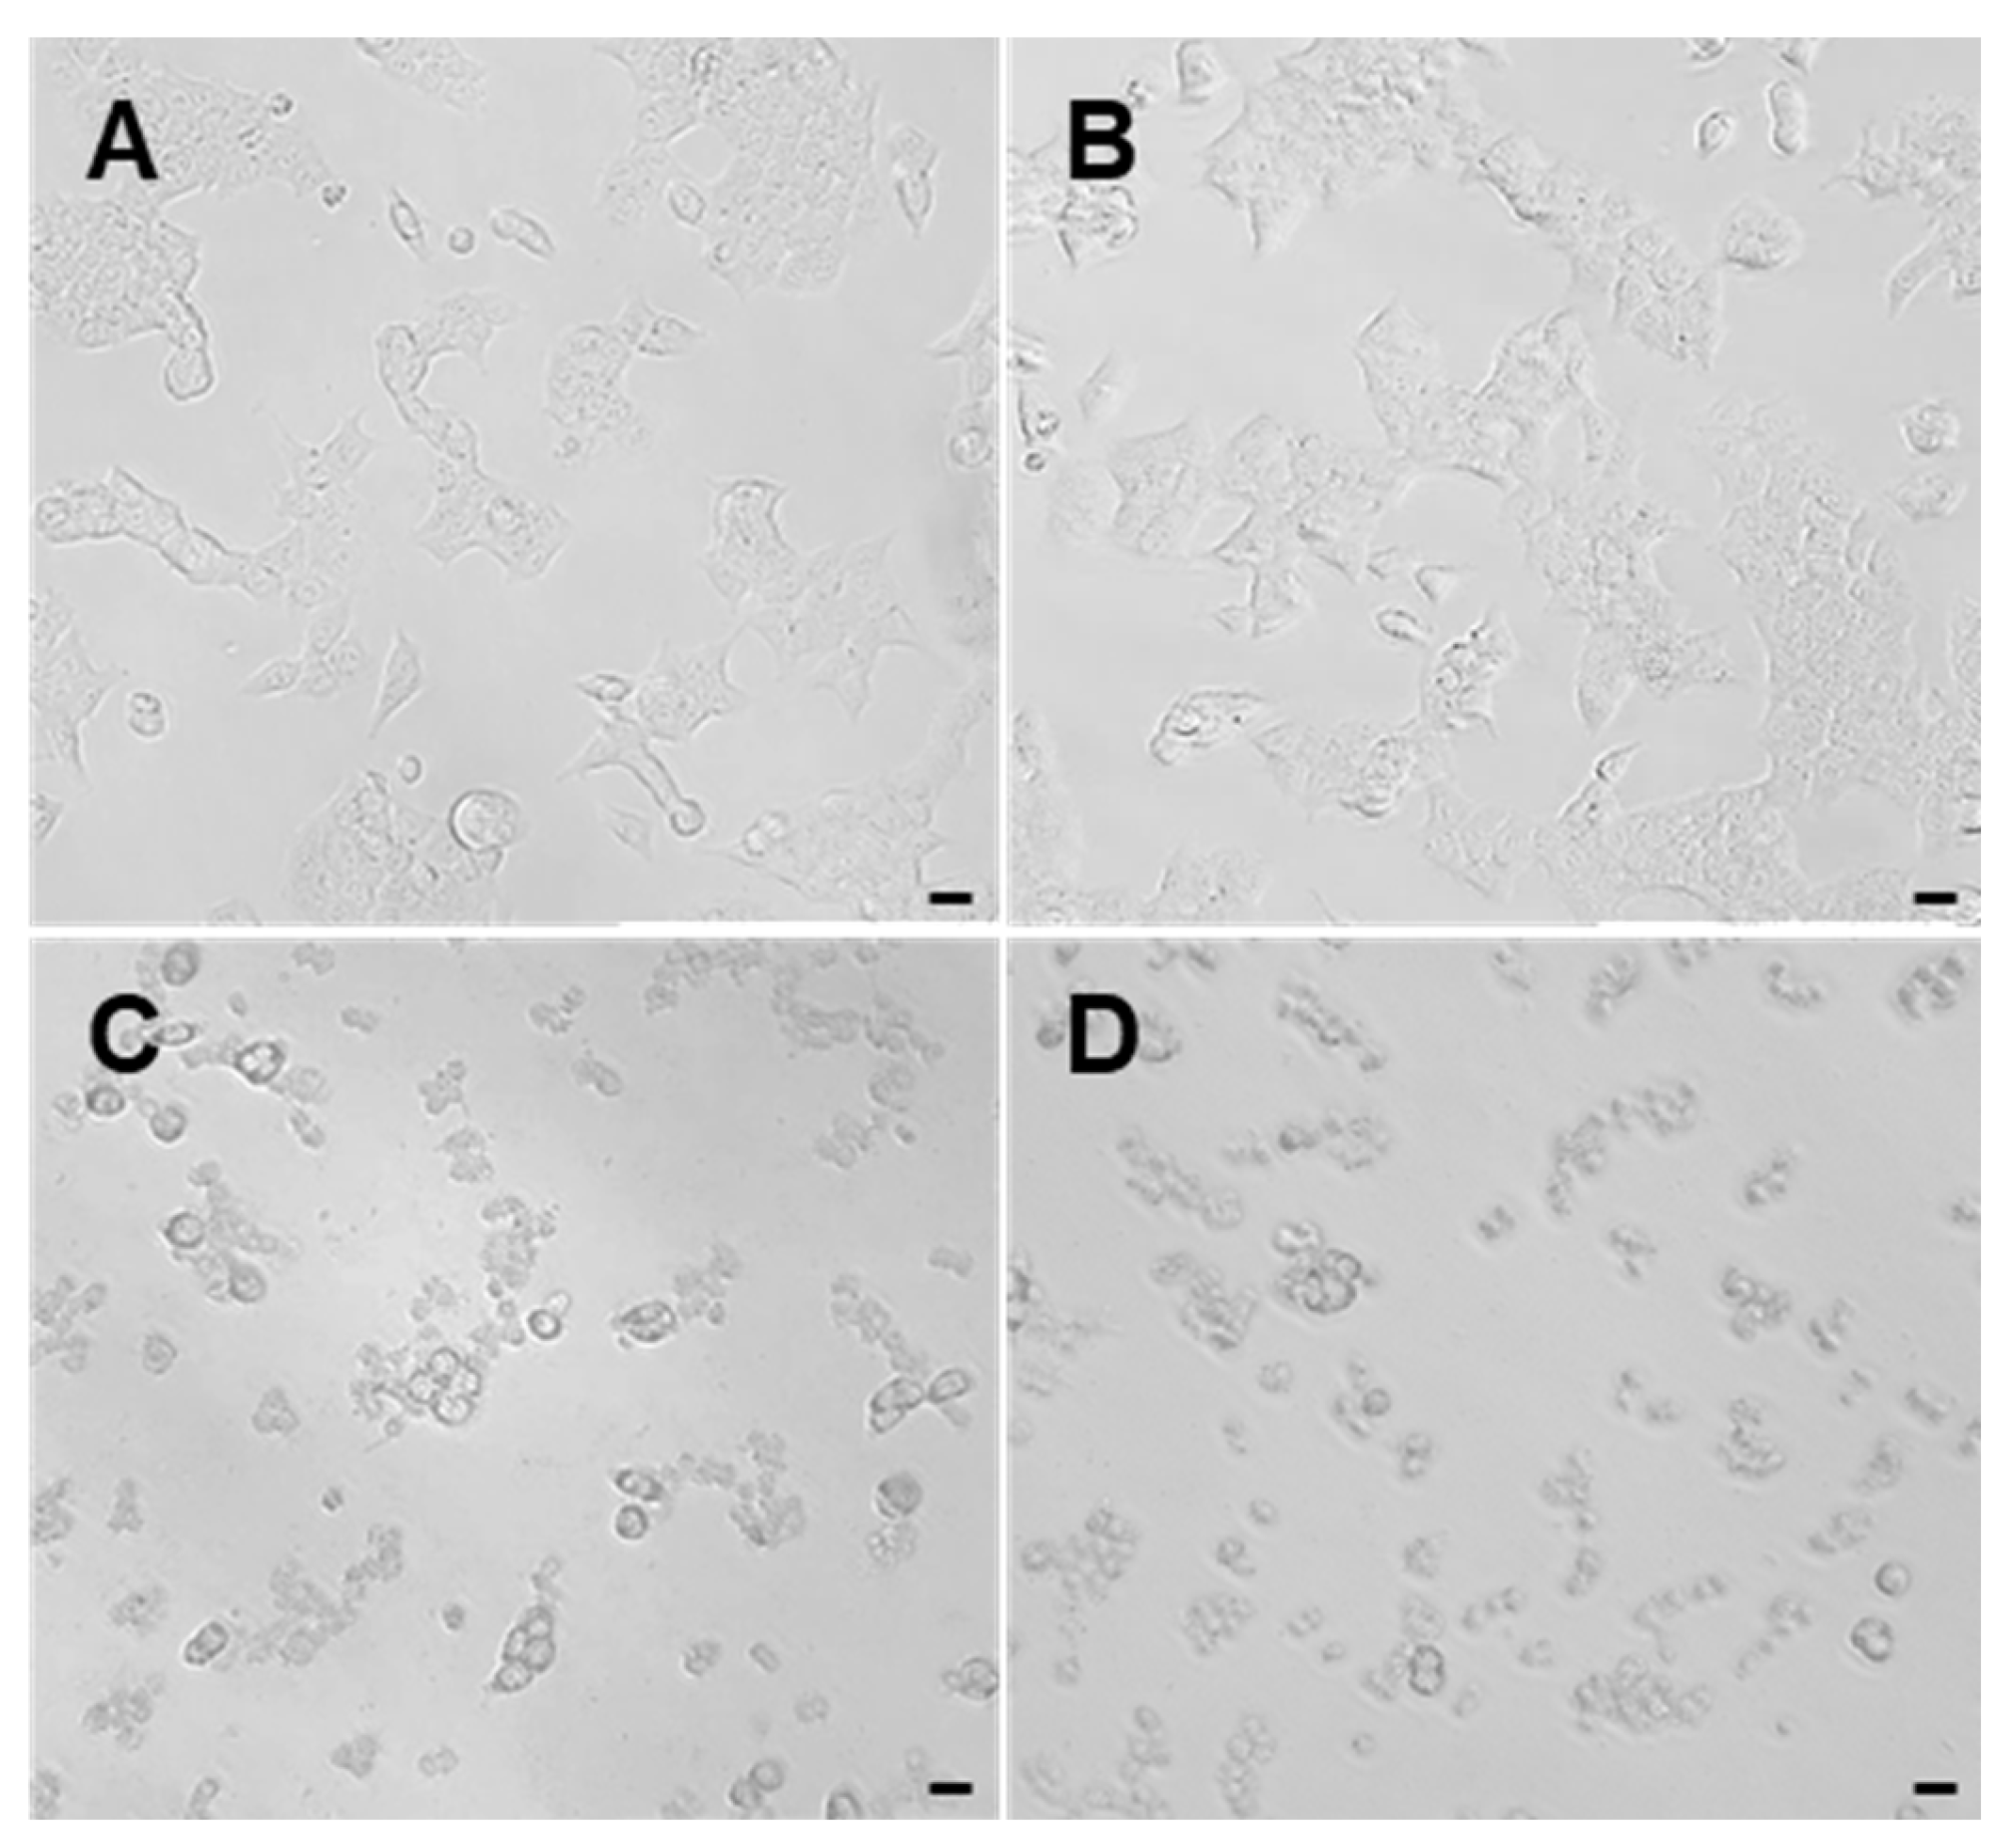
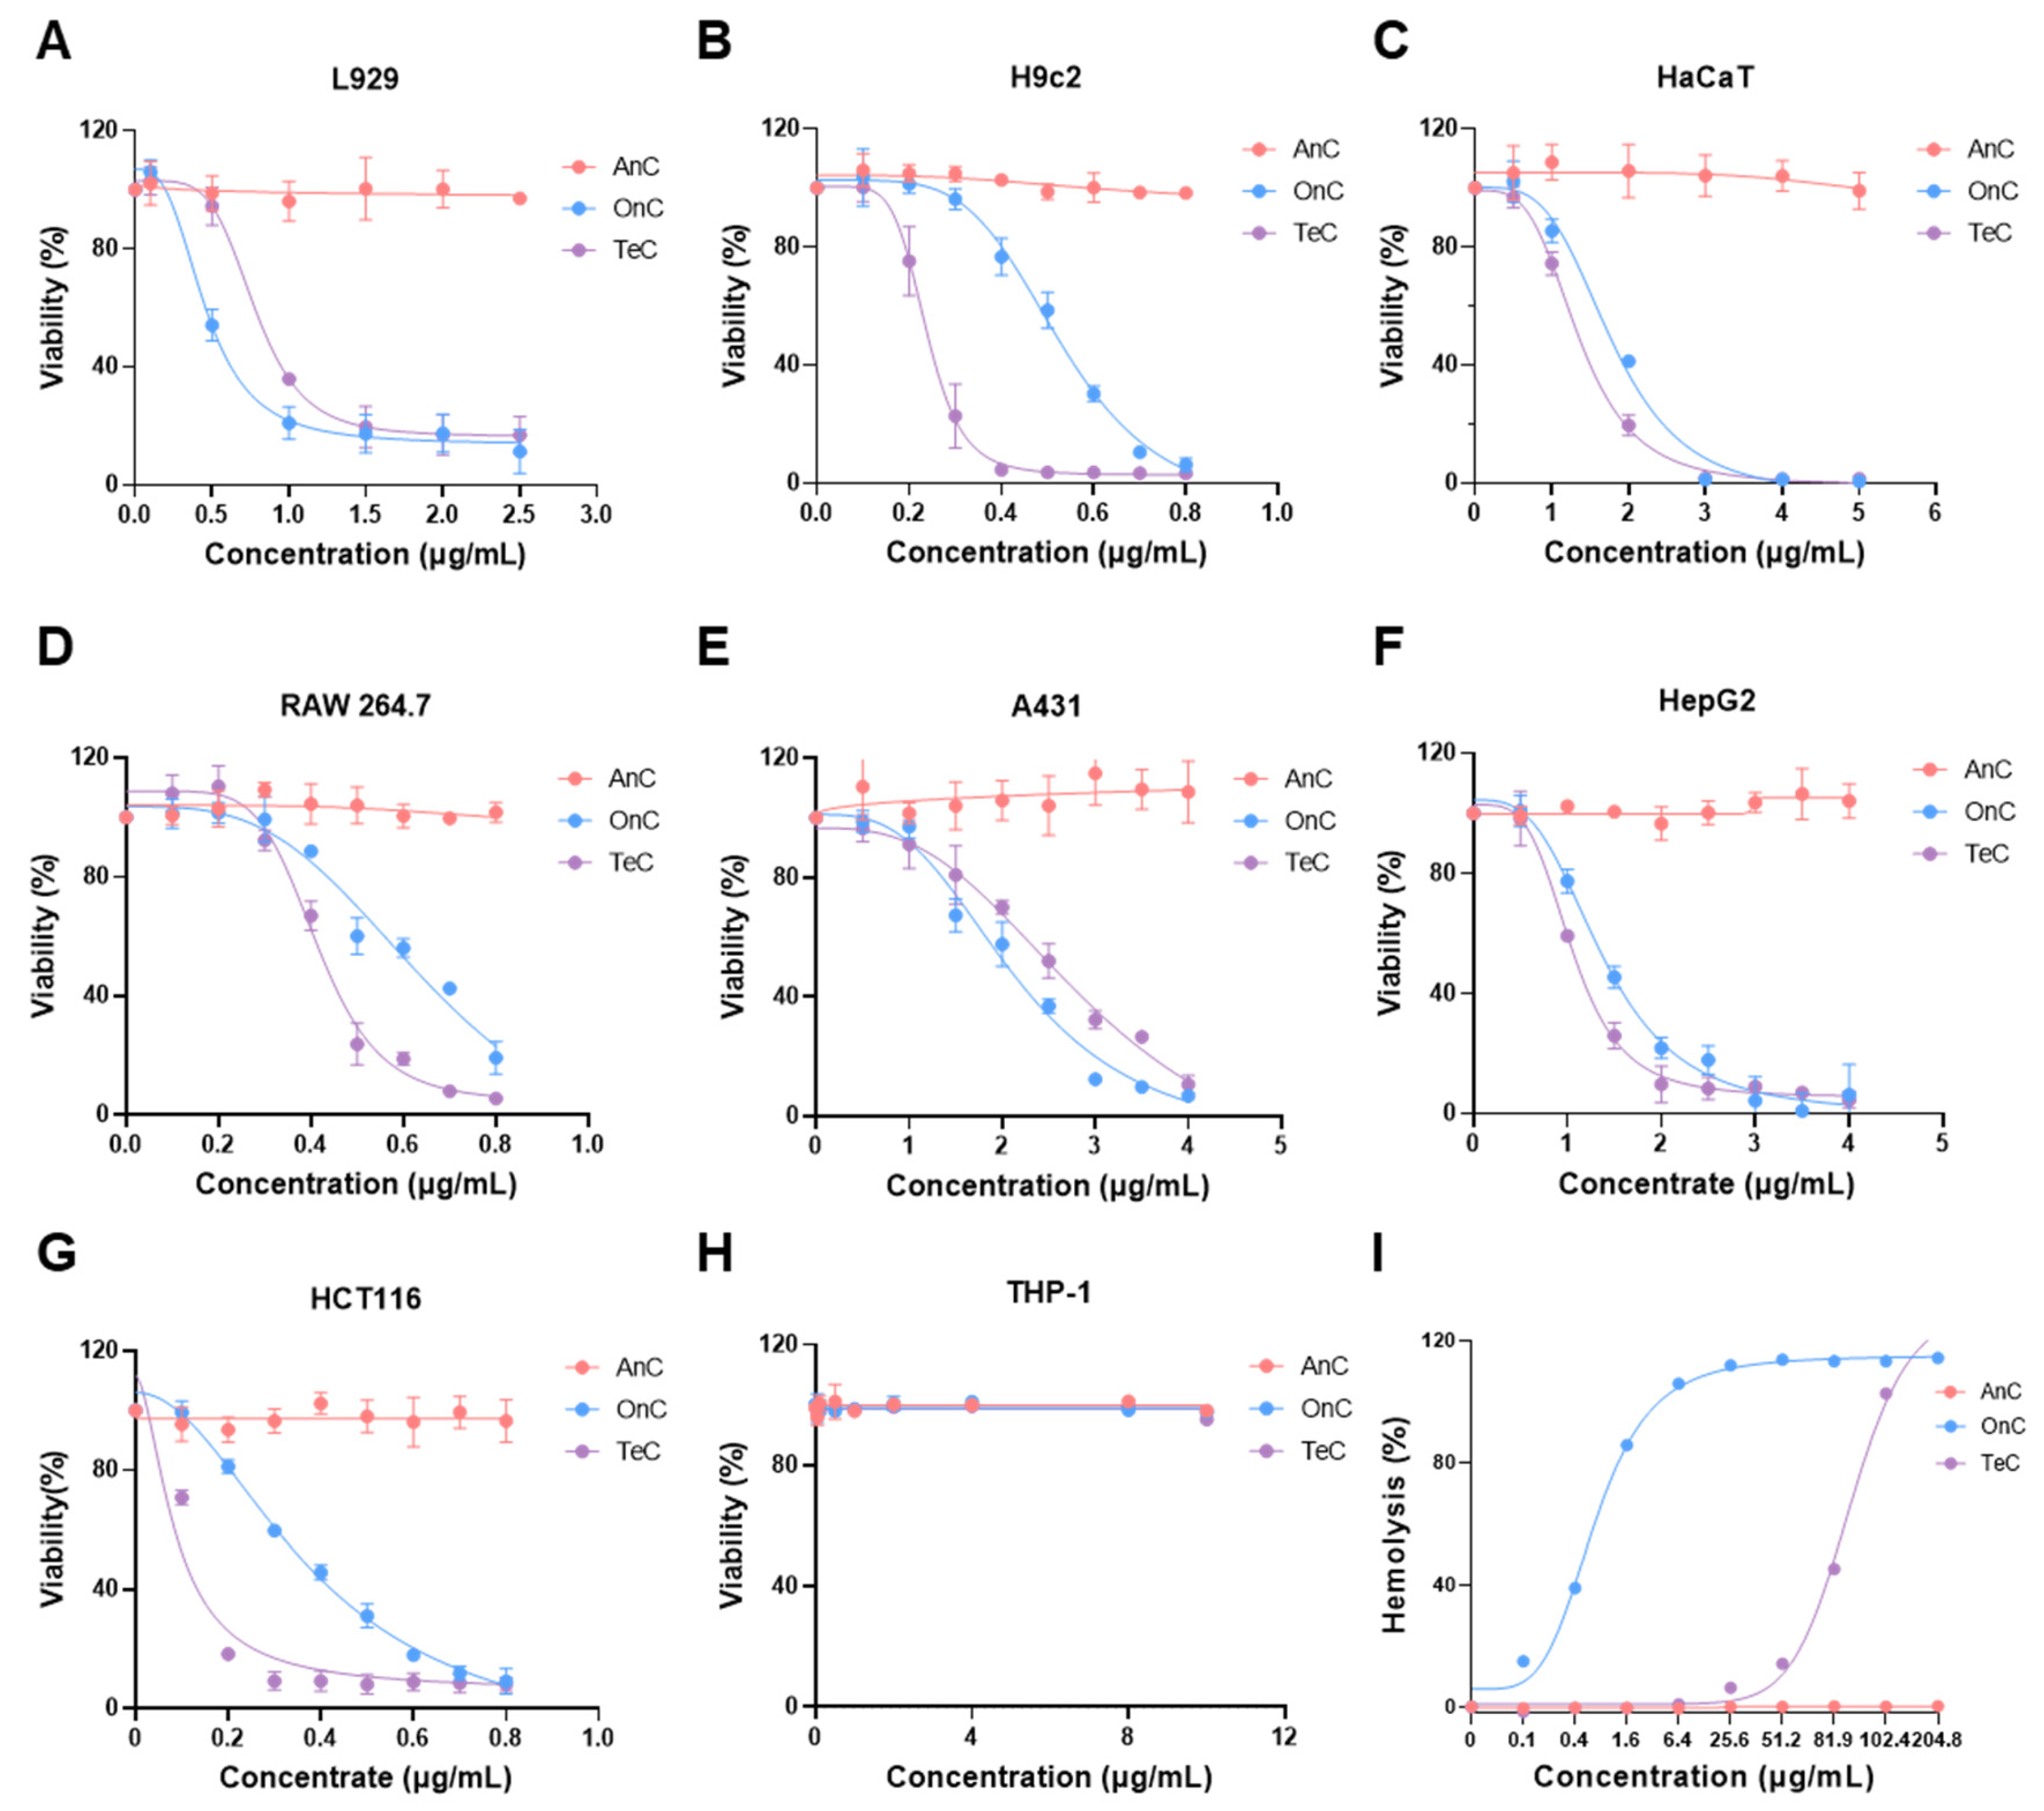
2.4. Cytotoxicity of AnC and OnC
2.5. Hemolytic Effects of AnC and OnC
2.6. Enzyme Activity of AnC and OnC
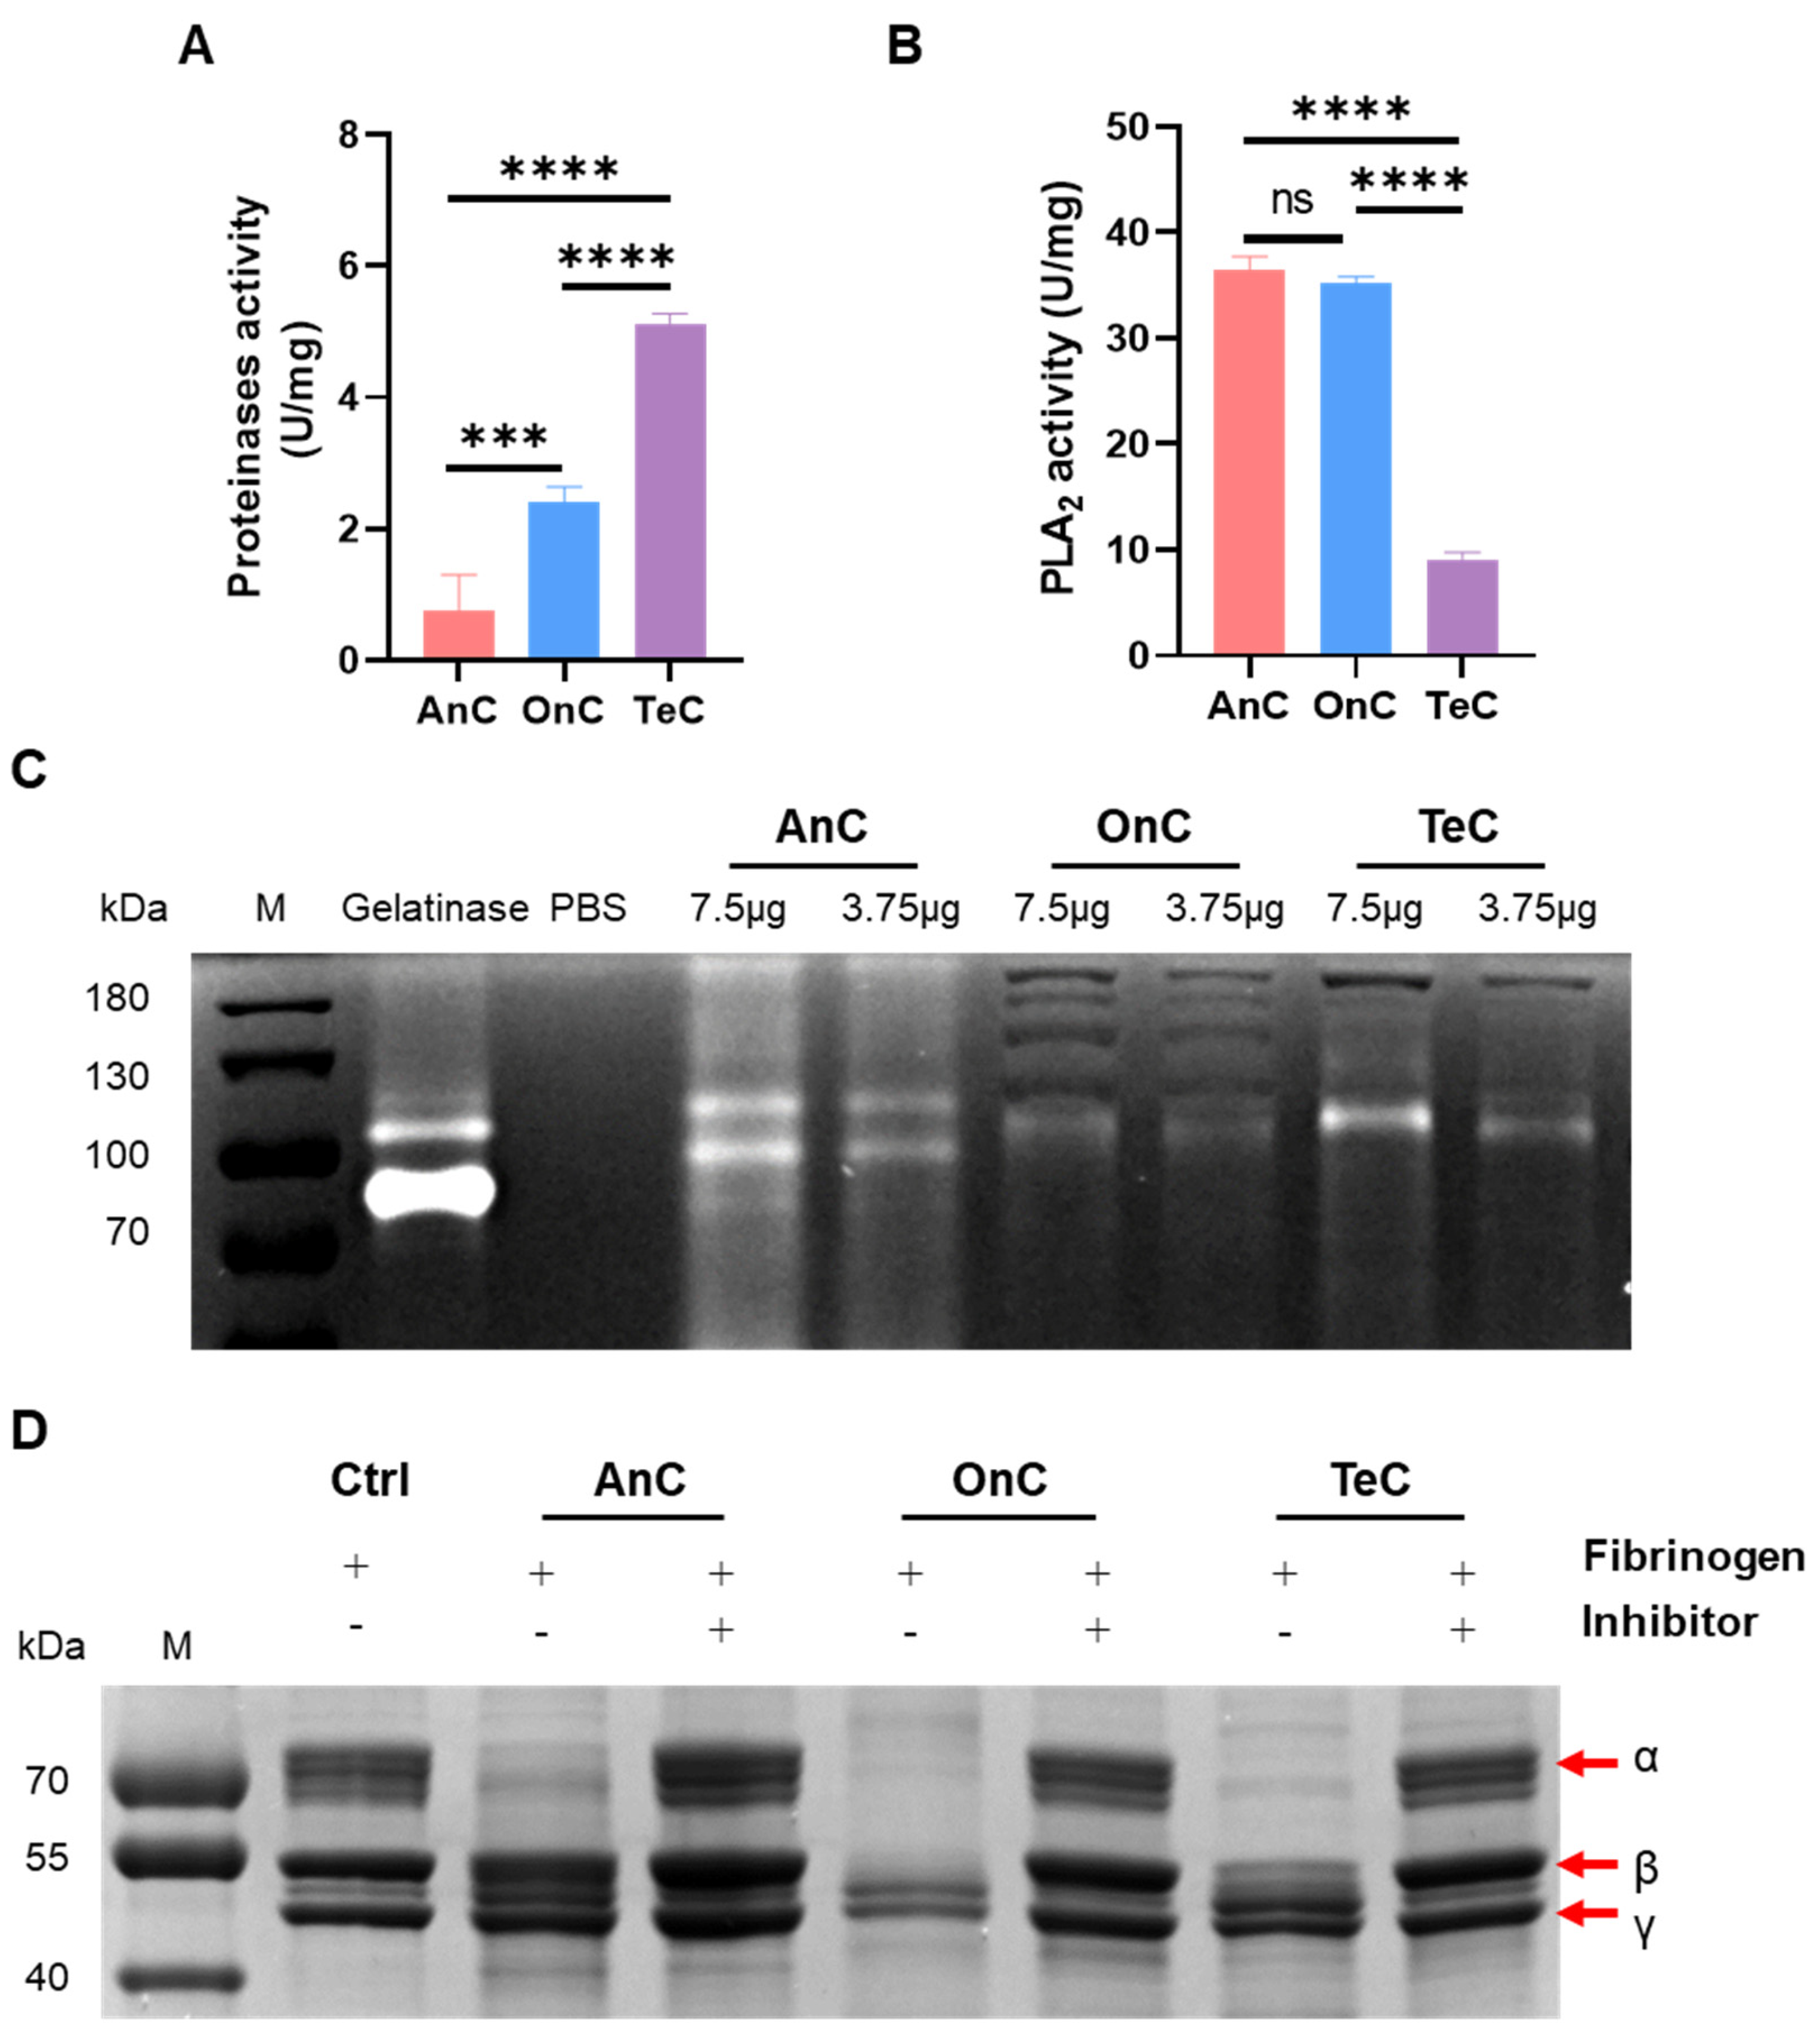
2.6.1. Metalloproteinase Activity
2.6.2. Phospholipase A2 (PLA2) Activity
2.6.3. Serine Protease Activity
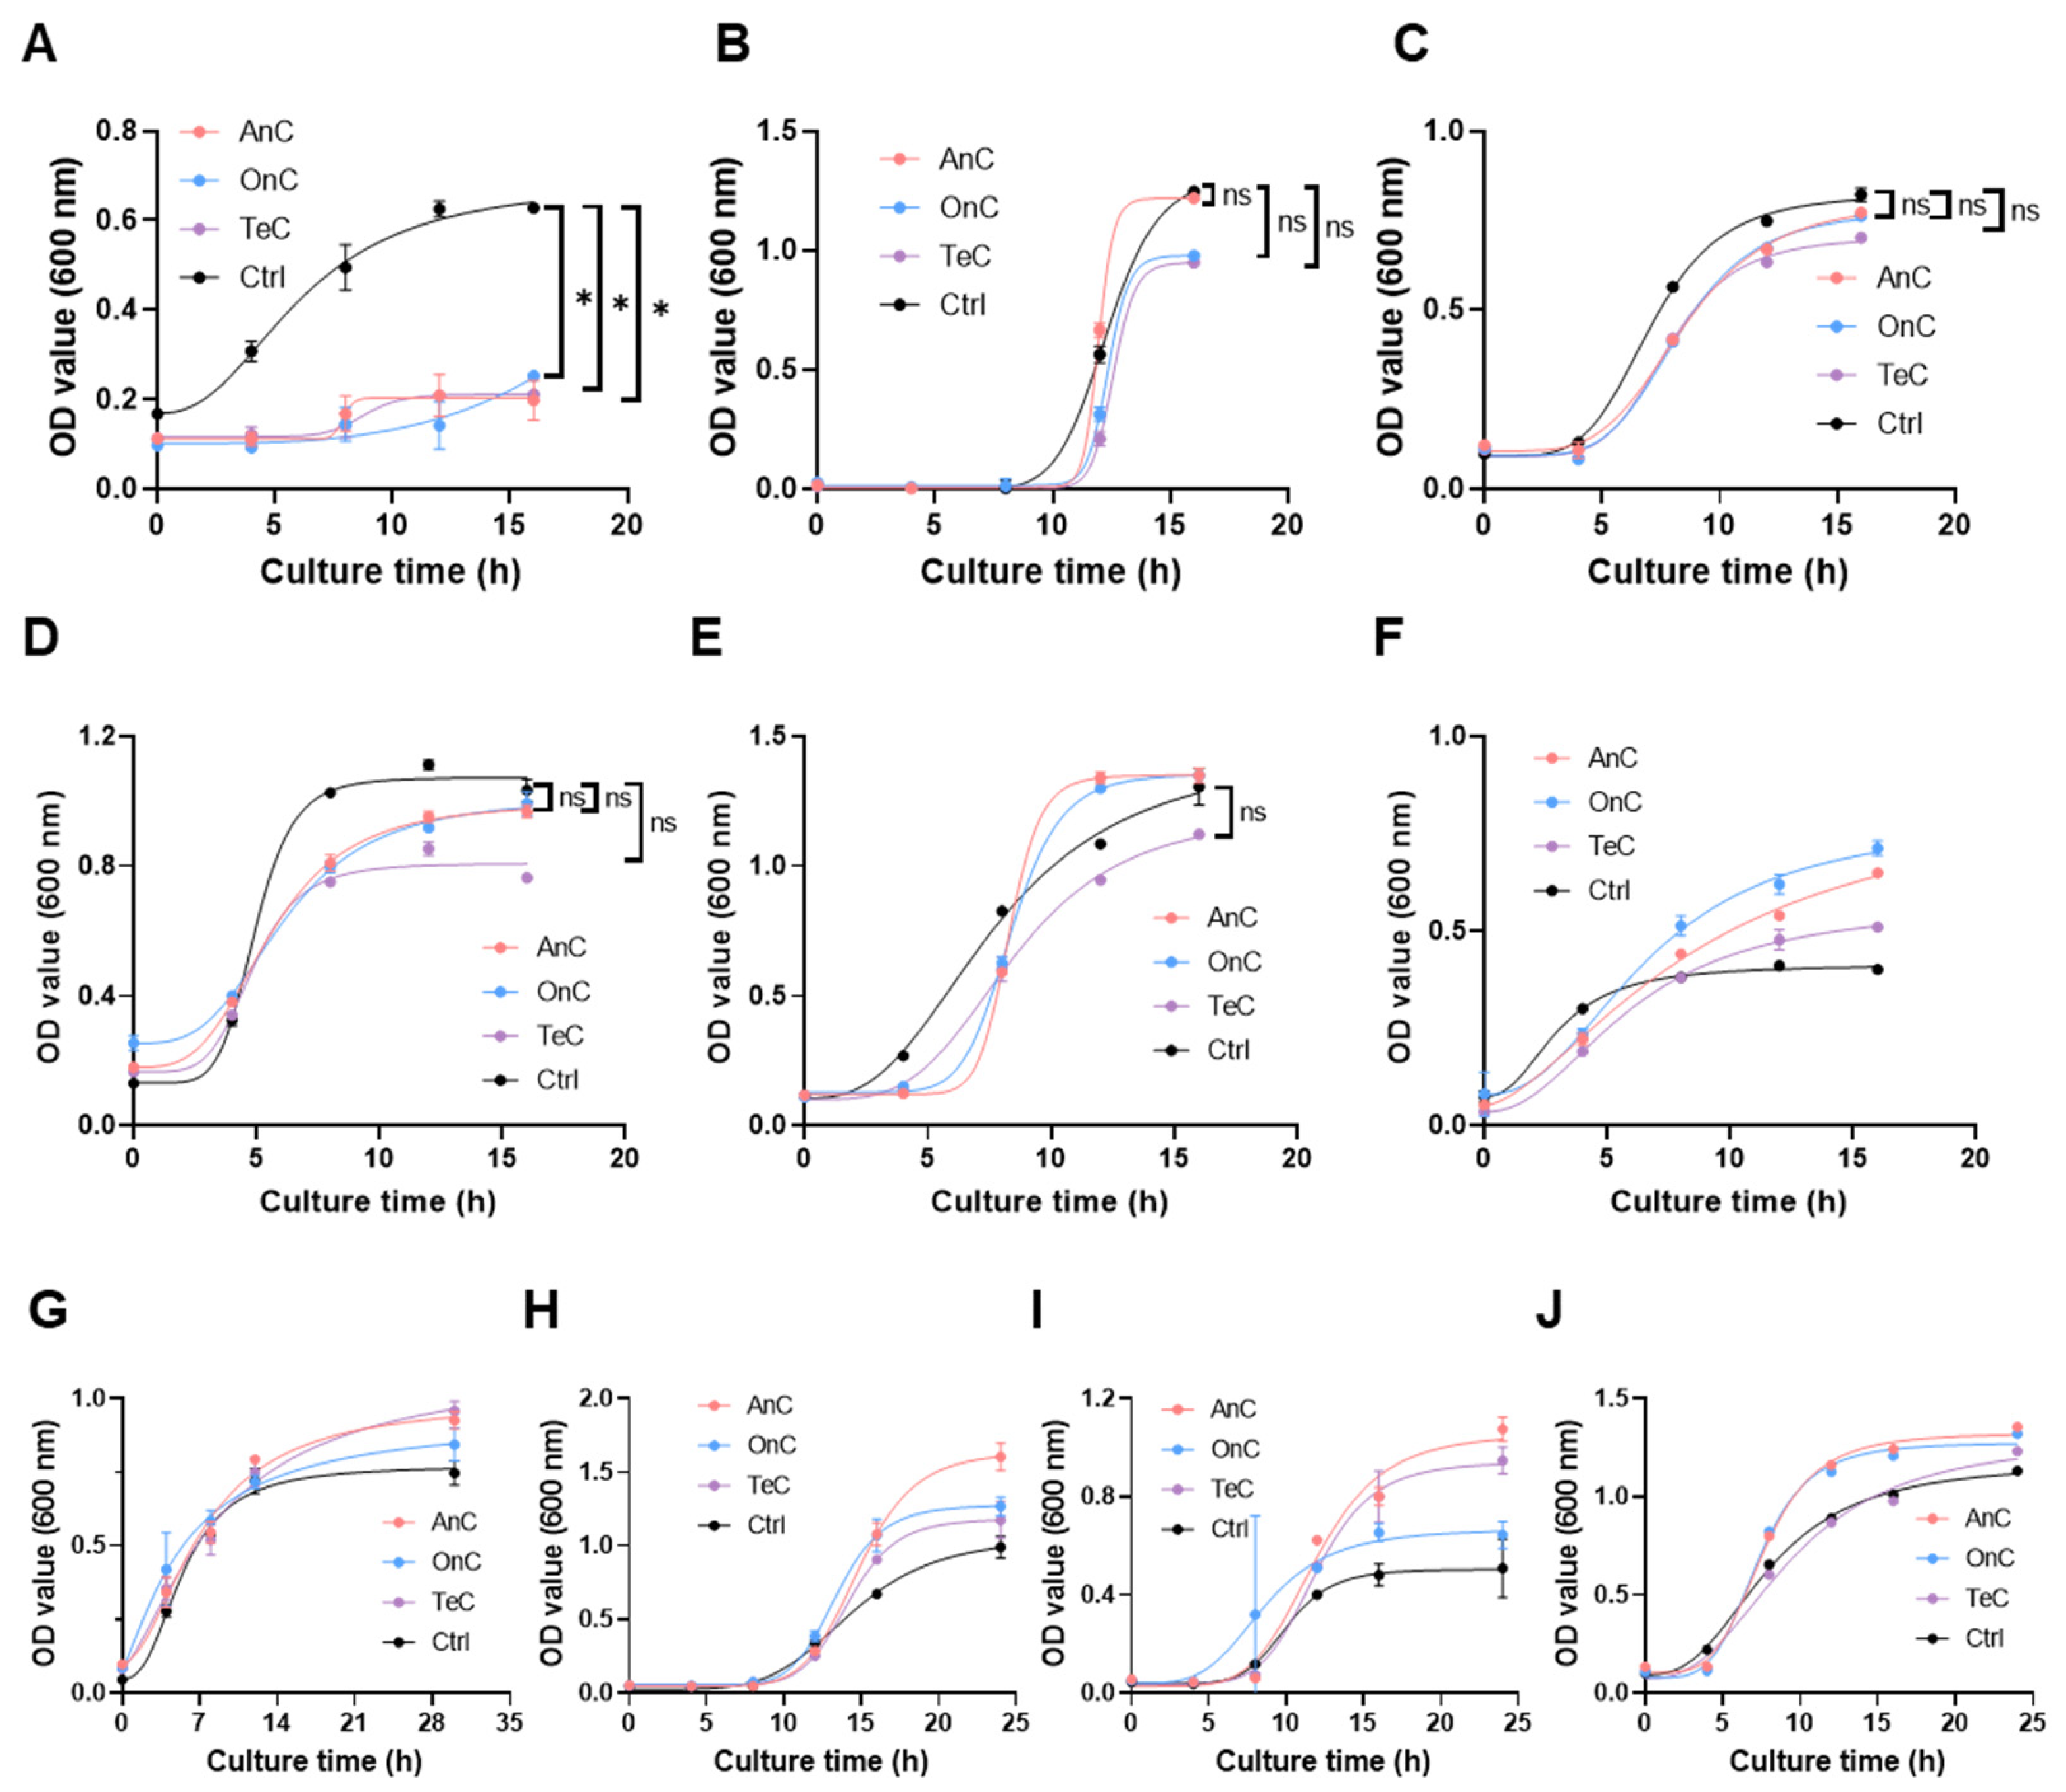
2.7. Antimicrobial Activity of AnC and OnC
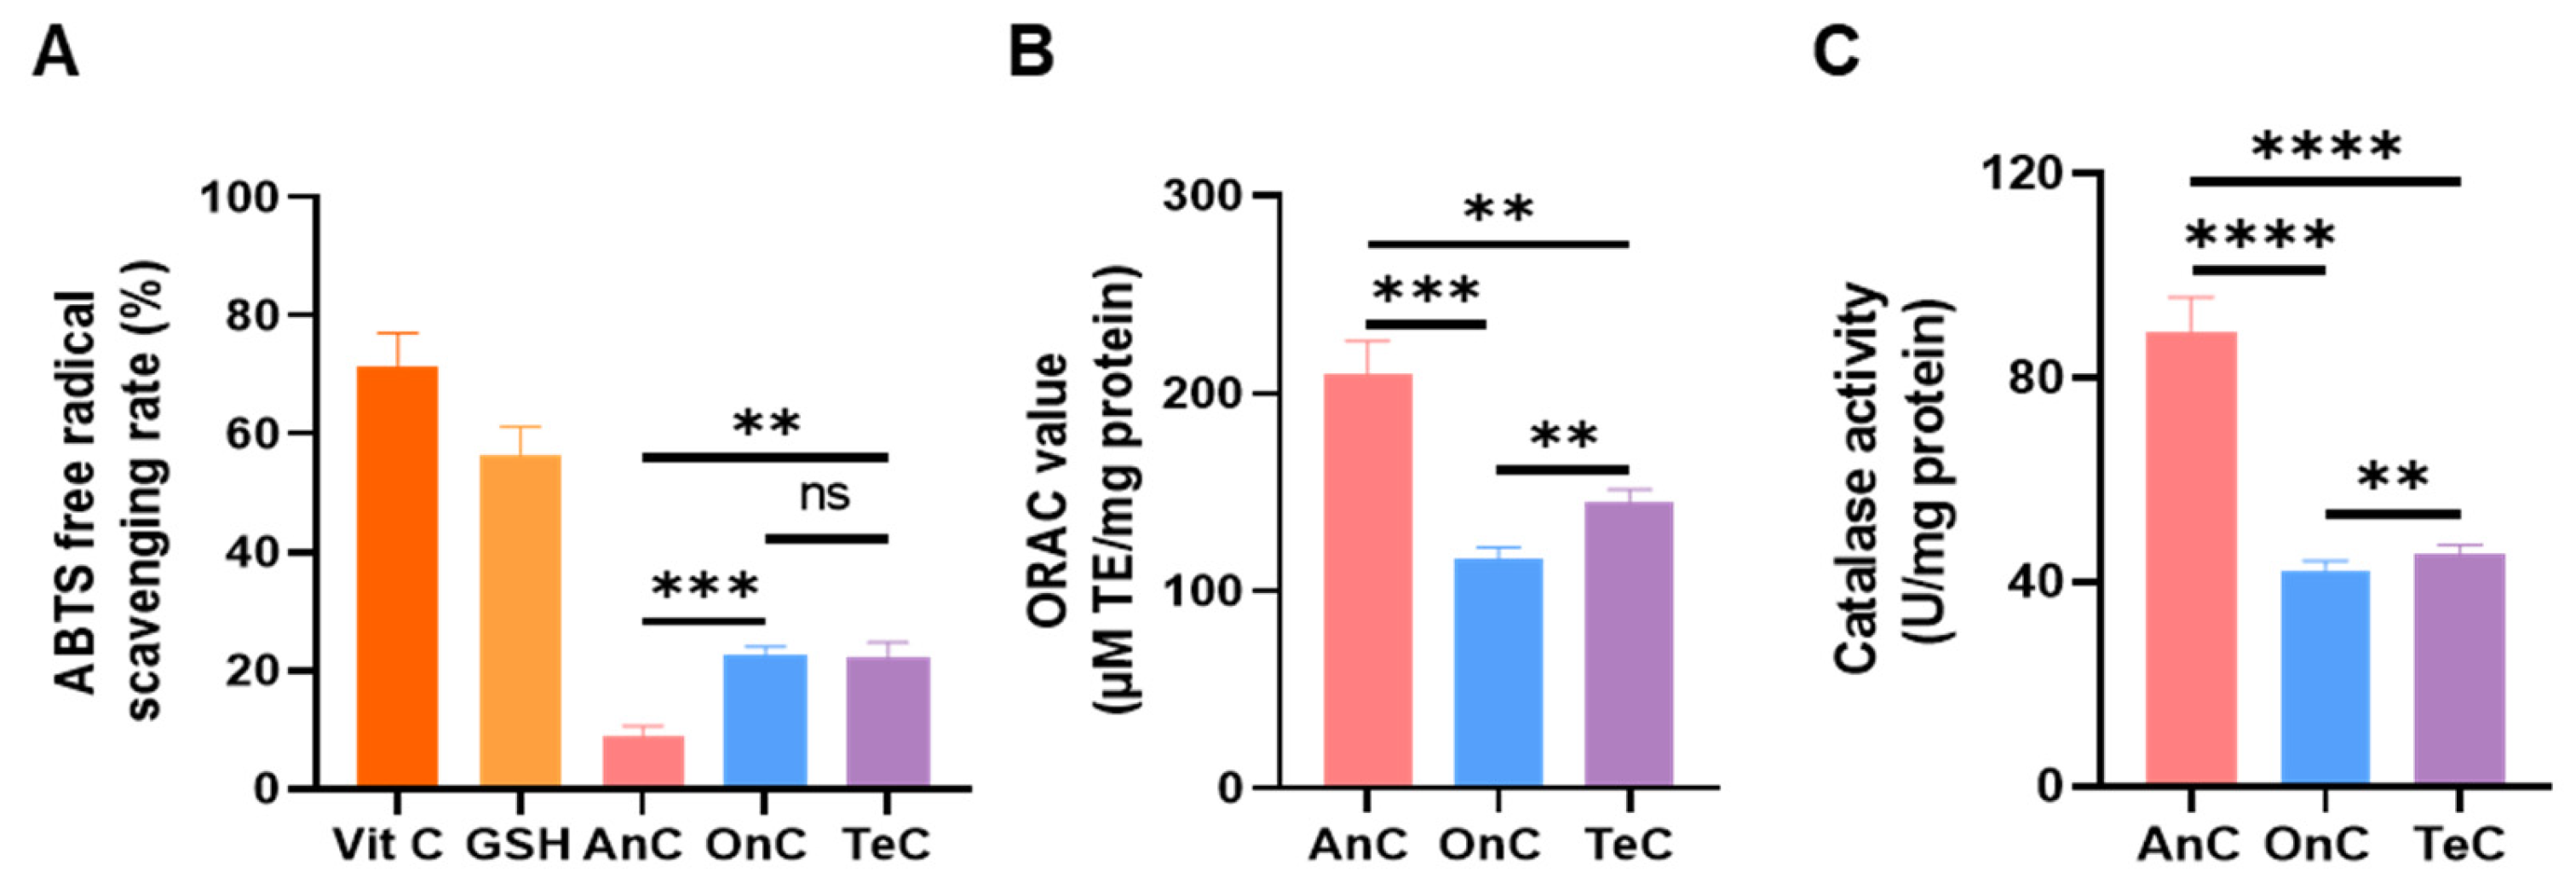
2.8. Antioxidant Activity of AnC and OnC
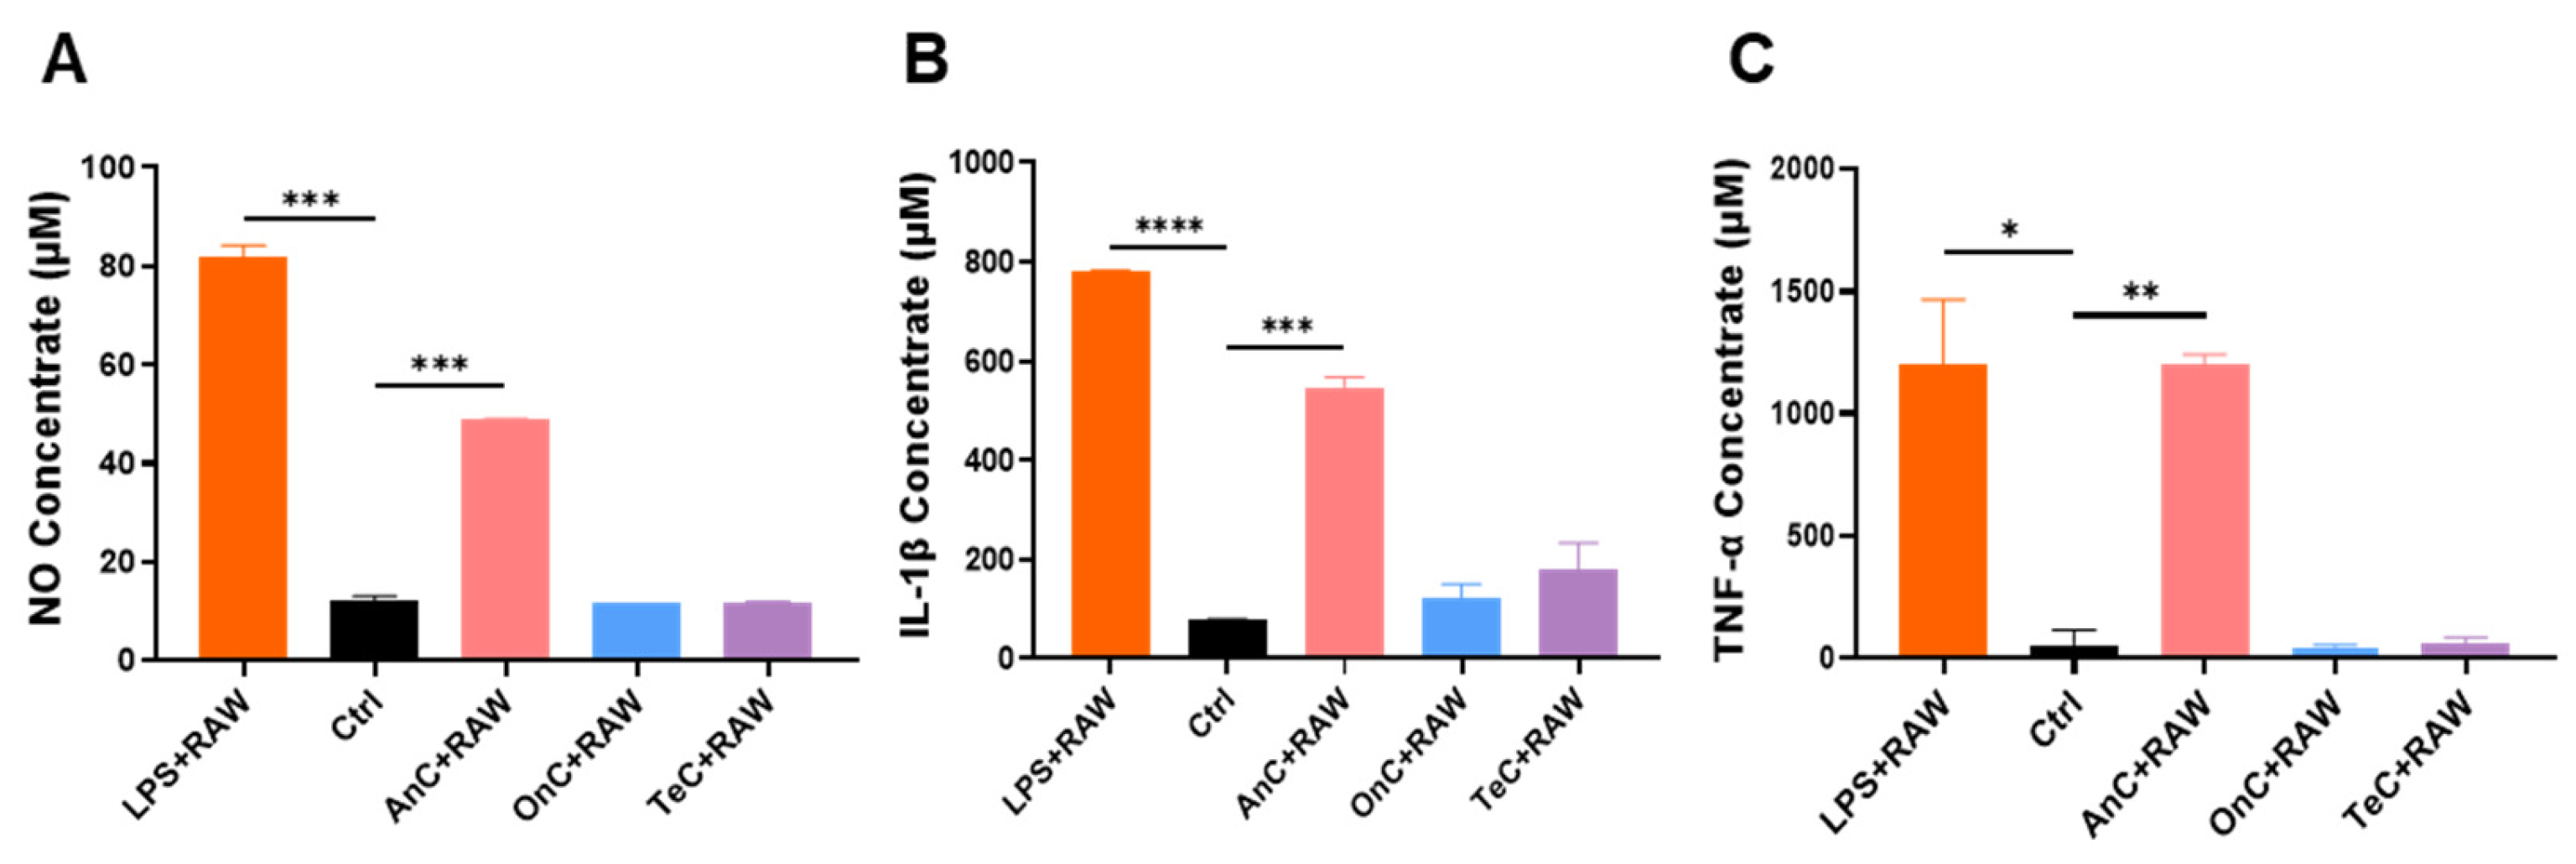
2.9. Proinflammatory Effect of AnC and OnC
3. Discussion
4. Materials and Methods
5.1. Chemicals and Reagents
5.2. Jellyfish Collection
5.3. Isolation and Purification of Two Monomorphic Nematocysts
5.2.1. Isolation and Purification of Anisorhizas
5.2.2. Isolation and Purification of O-Isorhizas
5.4. Assessment of Nematocyst Discharge Capacity
5.5. Nematocyst Content Extraction and SDS-PAGE Analysis
5.6. N. nomurai Tentacle Extraction
5.7. Cytotoxicity Assays
5.8. Enzyme Activity Assays
5.8.1. Metalloproteinase Activity
5.8.2. Zymography of Proteases
5.8.3. PLA2 Activity
5.8.4. Fibrinogenolytic Assay
5.9. Hemolysis Assays
5.10. Antimicrobial Activity
5.11. Antioxidant Activity Assay
5.11.1. ABTS·+ Scavenging Assay
5.11.2. Oxygen Radical Absorbance Capacity
5.11.3. Catalase Activity Assay
5.12. Proinflammatory Effect Assays
5. Conclusions
Author Contributions
Funding
Institutional Review Board Statement
Data Availability Statement
Acknowledgments
Conflicts of Interest
Abbreviations
| AnC | Anisorhizas nematocyst content |
| OnC | O-isorhizas nematocyst content |
| TeC | Tentacle extract content |
| NOBA | 4-nitro-3-octanoyloxybenzoic acid |
| T-AOC | Total Antioxidant Capacity |
| GSH | Glutathione |
| ORAC | Oxygen radical absorbance capacity |
| AMPs | Antimicrobial peptides |
| TE | Trolox equivalent |
| CAT | Catalase |
References
- Kim, J.H.; Han, S.B.; Durey, A. Fatal Pulmonary Edema in a Child after Jellyfish Stings in Korea. Wilderness Environ. Med. 2018, 29, 527–530. [Google Scholar] [CrossRef] [PubMed]
- Remigante, A.; Costa, R.; Morabito, R.; La Spada, G.; Marino, A.; Dossena, S. Impact of Scyphozoan Venoms on Human Health and Current First Aid Options for Stings. Toxins (Basel) 2018, 10, 133. [Google Scholar] [CrossRef] [PubMed]
- Pyo, M.-J.; Lee, H.; Bae, S.; Heo, Y.; Choudhary, I.; Yoon, W.; Kang, C.; Kim, E. Modulation of Jellyfish Nematocyst Discharges and Management of Human Skin Stings in Nemopilema Nomurai and Carybdea Mora. Toxicon 2016. [Google Scholar] [CrossRef] [PubMed]
- Jouiaei, M.; Yanagihara, A.A.; Madio, B.; Nevalainen, T.J.; Alewood, P.F.; Fry, B.G. Ancient Venom Systems: A Review on Cnidaria Toxins. Toxins 2015, 7, 2251–2271. [Google Scholar] [CrossRef]
- Barbara, F.; Vito, V.; Agostinho, A. Sea Anemone (Cnidaria, Anthozoa, Actiniaria) Toxins: An Overview. Marine drugs 2012, 10. [Google Scholar] [CrossRef]
- Gian, L.M. Hemolytic Venoms from Marine Cnidarian Jellyfish - an Overview. Journal of venom research 2014, 5. [Google Scholar]
- Gian, L.M.; Luigi, P. Mediterranean Jellyfish Venoms: A Review on Scyphomedusae. Marine drugs 2010, 8. [Google Scholar] [CrossRef]
- Mariottini, G.L.; Pane, L. Cytotoxic and Cytolytic Cnidarian Venoms. A Review on Health Implications and Possible Therapeutic Applications. Toxins (Basel) 2013, 6, 108–151. [Google Scholar] [CrossRef]
- Killi, N.; Mariottini, G.L. Cnidarian Jellyfish:Ecological Aspects, Nematocyst Isolation, and Treatment Methods of Sting. Results Probl Cell Differ 2018, 65, 477–513. [Google Scholar]
- Wang, C.; Wang, B.L.; Wang, B.; Wang, Q.; Wang, T.; He, Q.; Zhang, L. Unique Diversity of Sting-Related Toxins Based on Transcriptomic and Proteomic Analysis of the Jellyfish Cyanea Capillata and Nemopilema Nomurai (Cnidaria: Scyphozoa). J. Proteome Res. 2019, 18, 436–448. [Google Scholar] [CrossRef]
- Kitatani, R.; Yamada, M.; Kamio, M.; Nagai, H. Length Is Associated with Pain: Jellyfish with Painful Sting Have Longer Nematocyst Tubules than Harmless Jellyfish. PLoS ONE 2015, 10, e0135015. [Google Scholar] [CrossRef] [PubMed]
- Holstein, T.; Tardent, P. An Ultrahigh-Speed Analysis of Exocytosis: Nematocyst Discharge. Sci. (N.Y.) 1984, 223, 830–833. [Google Scholar] [CrossRef]
- Östman, C. 26 - NEMATOCYSTS AS TAXONOMIC CRITERIA WITHIN THE FAMILY CAMPANULARIIDAE, HYDROZOA. In The Biology of Nematocysts; Hessinger, D.A., Lenhoff, H.M., Eds.; Academic Press, 1988; pp. 501–517. ISBN 978-0-12-345320-4. [Google Scholar]
- Ostman, C. A Guideline to Nematocyst Nomenclature and Classification, and Some Notes on the Systematic Value of Nematocysts. Sci. Mar. 2000, 64, 31–46. [Google Scholar] [CrossRef]
- Kass simon, G.; Scappaticci, A.A. The Behavioral and Developmental Physiology of Nematocysts. Can. J. Zool. 2002, 80, 1772–1794. [Google Scholar] [CrossRef]
- Purcell, J. Predation on Zooplankton by Large Jellyfish, Aurelia, Cyanea and Aequorea, in Prince William Sound, Alaska. Mar. Ecol. Prog. Ser. 2003, 246, 137–152. [Google Scholar] [CrossRef]
- Mariscal, R.N. Nematocysts. In Coelenterate Biology; Elsevier, 1974; pp. 129–178. ISBN 978-0-12-512150-7. [Google Scholar]
- Calder, D.R. Nematocysts of the Coronate Scyphomedusa, Linuche Unguiculata, with a Brief Reexamination of Scyphozoan Nematocyst Classification. Chesapeake Science 1974, 15, 170. [Google Scholar] [CrossRef]
- Underwood, A.H.; Seymour, J.E. Venom Ontogeny, Diet and Morphology in Carukia Barnesi, a Species of Australian Box Jellyfish That Causes Irukandji Syndrome. Toxicon 2007, 49, 1073–1082. [Google Scholar] [CrossRef]
- Yue, Y.; Yu, H.; Li, R.; Xing, R.; Liu, S.; Li, K.; Wang, X.; Chen, X.; Li, P. Functional Elucidation of Nemopilema Nomurai and Cyanea Nozakii Nematocyst Venoms’ Lytic Activity Using Mass Spectrometry and Zymography. Toxins 2017, 9, 47. [Google Scholar] [CrossRef]
- Brinkman, D.L.; Jia, X.; Potriquet, J.; Kumar, D.; Dash, D.; Kvaskoff, D.; Mulvenna, J. Transcriptome and Venom Proteome of the Box Jellyfish Chironex Fleckeri. BMC genom. 2015, 16, 407. [Google Scholar] [CrossRef]
- Dong, Z.; Liu, D.; Keesing, J.K. Jellyfish Blooms in China: Dominant Species, Causes and Consequences. Mar Pollut Bull 2010, 60, 954–963. [Google Scholar] [CrossRef] [PubMed]
- Geng, H.; Li, R.; Teng, L.; Yu, C.; Wang, W.; Gao, K.; Li, A.; Liu, S.; Xing, R.; Yu, H.; et al. Exploring the Efficacy of Hydroxybenzoic Acid Derivatives in Mitigating Jellyfish Toxin-Induced Skin Damage: Insights into Protective and Reparative Mechanisms. Mar Drugs 2024, 22, 205. [Google Scholar] [CrossRef]
- Geng, X.-Y.; Wang, M.-K.; Hou, X.-C.; Wang, Z.-F.; Wang, Y.; Zhang, D.-Y.; Danso, B.; Wei, D.-B.; Shou, Z.-Y.; Xiao, L.; et al. Comparative Analysis of Tentacle Extract and Nematocyst Venom: Toxicity, Mechanism, and Potential Intervention in the Giant Jellyfish Nemopilema Nomurai. Mar Drugs 2024, 22, 362. [Google Scholar] [CrossRef] [PubMed]
- Kim, E.; Lee, S.; Kim, J.-S.; Yoon, W.D.; Lim, D.; Hart, A.J.; Hodgson, W.C. Cardiovascular Effects of Nemopilema Nomurai (Scyphozoa: Rhizostomeae) Jellyfish Venom in Rats. Toxicol Lett 2006, 167, 205–211. [Google Scholar] [CrossRef] [PubMed]
- Yue, Y.; Yu, H.; Li, R.; Li, P. Topical Exposure to Nemopilema Nomurai Venom Triggers Oedematogenic Effects: Enzymatic Contribution and Identification of Venom Metalloproteinase. Toxins (Basel) 2021, 13, 44. [Google Scholar] [CrossRef] [PubMed]
- Yu, C.; Yue, Y.; Yin, X.; Li, R.; Yu, H.; Li, P. Identifying and Revealing the Geographical Variation in Nemopilema Nomurai Venom Metalloprotease and Phospholipase A2 Activities. Chemosphere 2021, 266, 129164. [Google Scholar] [CrossRef]
- Li, A.; Yu, H.; Li, R.; Yue, Y.; Yu, C.; Geng, H.; Liu, S.; Xing, R.; Li, P. Jellyfish Nemopilema Nomurai Causes Myotoxicity through the Metalloprotease Component of Venom. Biomed Pharmacother 2022, 151, 113192. [Google Scholar] [CrossRef]
- Asirvatham, R.D.; Hwang, D.H.; Prakash, R.L.M.; Kang, C.; Kim, E. Pharmacoinformatic Investigation of Silymarin as a Potential Inhibitor against Nemopilema Nomurai Jellyfish Metalloproteinase Toxin-like Protein. Int. J. Mol. Sci. 2023, 24, 8972. [Google Scholar] [CrossRef]
- Ma, Y.; Yu, H.; Teng, L.; Geng, H.; Li, R.; Xing, R.; Liu, S.; Li, P. NnM469, a Novel Recombinant Jellyfish Venom Metalloproteinase from Nemopilema Nomurai, Disrupted the Cell Matrix. Int J Biol Macromol 2024, 281, 136531. [Google Scholar] [CrossRef]
- Li, A.; Yu, H.; Li, R.; Yue, Y.; Yu, C.; Liu, S.; Xing, R.; Li, P. Effects of Toxin Metalloproteinases from Jellyfish Nemopilema Nomurai Nematocyst on the Dermal Toxicity and Potential Treatment of Jellyfish Dermatitis. Int Immunopharmacol 2024, 128, 111492. [Google Scholar] [CrossRef]
- Lehtovirta, J.; Vartio, T. Type IV Collagenases in Human Amniotic Fluids and Amnion Epithelial Cells. Biochim Biophys Acta 1994, 1206, 83–89. [Google Scholar] [CrossRef]
- Hwang, D.H.; Lee, H.; Choudhary, I.; Kang, C.; Chae, J.; Kim, E. Protective Effect of Epigallocatechin-3-Gallate (EGCG) on Toxic Metalloproteinases-Mediated Skin Damage Induced by Scyphozoan Jellyfish Envenomation. Sci Rep 2020, 10, 18644. [Google Scholar] [CrossRef]
- Ovchinnikova, T.V.; Balandin, S.V.; Aleshina, G.M.; Tagaev, A.A.; Leonova, Y.F.; Krasnodembsky, E.D.; Men’shenin, A.V.; Kokryakov, V.N. Aurelin, a Novel Antimicrobial Peptide from Jellyfish Aurelia Aurita with Structural Features of Defensins and Channel-Blocking Toxins. Biochem Biophys Res Commun 2006, 348, 514–523. [Google Scholar] [CrossRef]
- Suganthi, K.; Bragadeeswaran, S. Antimicrobial and Immunomodulatory Activities of Jellyfish (Chrysaora Quinquecirrha) Venom. In Prospects in Bioscience: Addressing the Issues; Sabu, A., Augustine, A., Eds.; Springer India: India, 2012; pp. 283–292. ISBN 978-81-322-0809-9. [Google Scholar]
- Morales-Landa, J.L.; Zapata-Pérez, O.; Cedillo-Rivera, R.; Segura-Puertas, L.; Simá-Alvarez, R.; Sánchez-Rodríguez, J. Antimicrobial, Antiprotozoal, and Toxic Activities of Cnidarian Extracts from the Mexican Caribbean Sea. Pharmaceutical Biology 2007, 45, 37–43. [Google Scholar] [CrossRef]
- Liu, J.; Li, A.; Li, Y.; Li, J.; Geng, X.; Wan, J.; Lu, Q.; Wang, Q.; Wang, M.; Yang, J. Identification and Characterization of a Novel GAPDH-Derived Antimicrobial Peptide From Jellyfish. J Pept Sci 2025, 31, e70011. [Google Scholar] [CrossRef] [PubMed]
- Ahn, E.-Y.; Hwang, S.J.; Choi, M.-J.; Cho, S.; Lee, H.-J.; Park, Y. Upcycling of Jellyfish (Nemopilema Nomurai) Sea Wastes as Highly Valuable Reducing Agents for Green Synthesis of Gold Nanoparticles and Their Antitumor and Anti-Inflammatory Activity. Artif Cells Nanomed Biotechnol 2018, 46, 1127–1136. [Google Scholar] [CrossRef] [PubMed]
- SUGANTHI, K.; Subramanian, B.; Kumaran, S.; Sangappellai, T. Biological and Pharmacological Activities of Jelly Fish Crambionella Stuhalmanni (Chun, 1896) and Chrysaora Quinquecirrha (Desor, 1848). International Journal of Pharmacy and Pharmaceutical Sciences 2011, 3, 230–236. [Google Scholar]
- Ayed, Y.; Sghaier, R.M.; Laouini, D.; Bacha, H. Evaluation of Anti-Proliferative and Anti-Inflammatory Activities of Pelagia Noctiluca Venom in Lipopolysaccharide/Interferon-γ Stimulated RAW264.7 Macrophages. Biomed Pharmacother 2016, 84, 1986–1991. [Google Scholar] [CrossRef]
- D’ambra, I.; Lauritano, C. A Review of Toxins from Cnidaria. Mar. Drugs 2020, 18, 507. [Google Scholar] [CrossRef]
- Dennis, E.A.; Cao, J.; Hsu, Y.-H.; Magrioti, V.; Kokotos, G. Phospholipase A2 Enzymes: Physical Structure, Biological Function, Disease Implication, Chemical Inhibition, and Therapeutic Intervention. Chem Rev 2011, 111, 6130–6185. [Google Scholar] [CrossRef]
- Murakami, M.; Kudo, I. Phospholipase A2. J Biochem 2002, 131, 285–292. [Google Scholar] [CrossRef]
- Khan, S.A.; Ilies, M.A. The Phospholipase A2 Superfamily: Structure, Isozymes, Catalysis, Physiologic and Pathologic Roles. Int J Mol Sci 2023, 24, 1353. [Google Scholar] [CrossRef]
- Burke, J.E.; Dennis, E.A. Phospholipase A2 Structure/Function, Mechanism, and Signaling. J Lipid Res 2009, 50 Suppl, S237–242. [Google Scholar] [CrossRef]
- Markland, F.S.; Swenson, S. Snake Venom Metalloproteinases. Toxicon 2013, 62, 3–18. [Google Scholar] [CrossRef] [PubMed]
- Olaoba, O.T.; Karina Dos Santos, P.; Selistre-de-Araujo, H.S.; Ferreira de Souza, D.H. Snake Venom Metalloproteinases (SVMPs): A Structure-Function Update. Toxicon X 2020, 7, 100052. [Google Scholar] [CrossRef]
- Li, A.; Yu, H.; Li, R.; Liu, S.; Xing, R.; Li, P. Inhibitory Effect of Metalloproteinase Inhibitors on Skin Cell Inflammation Induced by Jellyfish Nemopilema Nomurai Nematocyst Venom. Toxins (Basel) 2019, 11, 156. [Google Scholar] [CrossRef] [PubMed]
- Bueno, M.R.; Daneri, A.; Armendáriz-Borunda, J. Cholestasis-Induced Fibrosis Is Reduced by Interferon Alpha-2a and Is Associated with Elevated Liver Metalloprotease Activity. J Hepatol 2000, 33, 915–925. [Google Scholar] [CrossRef] [PubMed]
- Swenson, S.; Markland, F.S. Snake Venom Fibrin(Ogen)Olytic Enzymes. Toxicon 2005, 45, 1021–1039. [Google Scholar] [CrossRef]
- White, J. Snake Venoms and Coagulopathy. Toxicon 2005, 45, 951–967. [Google Scholar] [CrossRef]
- Kini, R.M. Serine Proteases Affecting Blood Coagulation and Fibrinolysis from Snake Venoms. Pathophysiol Haemost Thromb 2005, 34, 200–204. [Google Scholar] [CrossRef]
- Bae, S.K.; Lee, H.; Heo, Y.; Pyo, M.J.; Choudhary, I.; Han, C.H.; Yoon, W.D.; Kang, C.; Kim, E. In Vitro Characterization of Jellyfish Venom Fibrin(Ogen)Olytic Enzymes from Nemopilema Nomurai. J. Venom. Anim. Toxins Incl. Trop. Dis. 2017, 23, 35. [Google Scholar] [CrossRef]
- Tawfik, M.M.; Eissa, N.; Althobaiti, F.; Fayad, E.; Abu Almaaty, A.H. Nomad Jellyfish Rhopilema Nomadica Venom Induces Apoptotic Cell Death and Cell Cycle Arrest in Human Hepatocellular Carcinoma HepG2 Cells. Molecules 2021, 26, 5185. [Google Scholar] [CrossRef]
- Cornara, L.; Mariottini, G.L.; Giordani, P.; Smeriglio, A.; Trombetta, D.; Guida, L.; Lavorano, S.; Burlando, B. Modulatory Activities of Plant Extracts on Jellyfish Cytotoxicity. Wilderness Environ Med 2020, 31, 266–272. [Google Scholar] [CrossRef] [PubMed]
- Wang, S.; Fan, L.; Pan, H.; Li, Y.; Qiu, Y.; Lu, Y. Antimicrobial Peptides from Marine Animals: Sources, Structures, Mechanisms and the Potential for Drug Development. Front. Mar. Sci. 2023, 9, 1112595. [Google Scholar] [CrossRef]
- Morgado, S.M.; Dos Santos Freitas, F.; Lourenço da Fonseca, E.; Vicente, A.C.P. Vibrio Mimicus Lineage Carrying Cholera Toxin and Vibrio Pathogenicity Island, United States and China. Emerg Infect Dis 2024, 30, 1729–1732. [Google Scholar] [CrossRef] [PubMed]
- Harada, K.; Maeda, T.; Hasegawa, Y.; Tokunaga, T.; Ogawa, S.; Fukuda, K.; Nagatsuka, N.; Nagao, K.; Ueno, S. Antioxidant Activity of the Giant Jellyfish Nemopilema Nomurai Measured by the Oxygen Radical Absorbance Capacity and Hydroxyl Radical Averting Capacity Methods. Mol Med Rep 2011, 4, 919–922. [Google Scholar] [CrossRef]
- Balamurugan, E.; Menon, V.P. In Vitro Radical Scavanging Activities of Chrysaora Quinquecirrha Nematocyst Venom. Drug Discov Ther 2009, 3, 56–61. [Google Scholar]
- Suganthi, K.; Bragadeeswaran, S.; Kumaran, N.S.; Thenmozhi, C.; Thangaraj, S. In Vitro Antioxidant Activities of Jelly Fish Chrysaora Quinquecirrha Venom from Southeast Coast of India. Asian Pacific Journal of Tropical Biomedicine 2012, 2, S347–S351. [Google Scholar] [CrossRef]
- Cao, Y.; Gao, J.; Zhang, L.; Qin, N.; Zhu, B.; Xia, X. Jellyfish Skin Polysaccharides Enhance Intestinal Barrier Function and Modulate the Gut Microbiota in Mice with DSS-Induced Colitis. Food Funct 2021, 12, 10121–10135. [Google Scholar] [CrossRef]
- Liu, S.; Wang, Y.; Su, M.; Song, S.-J.; Hong, J.; Kim, S.; Im, D.S.; Jung, J.H. A Bile Acid Derivative with PPARγ-Mediated Anti-Inflammatory Activity. Steroids 2018, 137, 40–46. [Google Scholar] [CrossRef]
- Liu, S.; Su, M.; Song, S.-J.; Hong, J.; Chung, H.Y.; Jung, J.H. An Anti-Inflammatory PPAR-γ Agonist from the Jellyfish-Derived Fungus Penicillium Chrysogenum J08NF-4. J Nat Prod 2018, 81, 356–363. [Google Scholar] [CrossRef]
- Wan, Y.; Fu, Y.; Wang, F.; Sinclair, A.J.; Li, D. Protective Effects of a Lipid Extract from Hard-Shelled Mussel (Mytilus Coruscus) on Intestinal Integrity after Lipopolysaccharide Challenge in Mice. Nutrients 2018, 10, 860. [Google Scholar] [CrossRef] [PubMed]
- Liu, F.; Zhang, X.; Li, Y.; Chen, Q.; Liu, F.; Zhu, X.; Mei, L.; Song, X.; Liu, X.; Song, Z.; et al. Anti-Inflammatory Effects of a Mytilus Coruscus α-d-Glucan (MP-A) in Activated Macrophage Cells via TLR4/NF-κB/MAPK Pathway Inhibition. Mar Drugs 2017, 15, 294. [Google Scholar] [CrossRef] [PubMed]
- Chen, J.; Bao, C.; Cho, S.H.; Lee, H.J. Green Lipped Mussel Oil Complex Suppresses Lipopolysaccharide Stimulated Inflammation via Regulating Nuclear Factor-κB and Mitogen Activated Protein Kinases Signaling in RAW264.7 Murine Macrophages. Food Sci Biotechnol 2017, 26, 815–822. [Google Scholar] [CrossRef]
- Joshi, I.; Mohideen, H.S.; Nazeer, R.A. A Meretrix Meretrix Visceral Mass Derived Peptide Inhibits Lipopolysaccharide-Stimulated Responses in RAW264.7 Cells and Adult Zebrafish Model. Int Immunopharmacol 2021, 90, 107140. [Google Scholar] [CrossRef]
- Gong, F.; Chen, M.-F.; Chen, J.; Li, C.; Zhou, C.; Hong, P.; Sun, S.; Qian, Z.-J. Boiled Abalone Byproduct Peptide Exhibits Anti-Tumor Activity in HT1080 Cells and HUVECs by Suppressing the Metastasis and Angiogenesis in Vitro. J Agric Food Chem 2019, 67, 8855–8867. [Google Scholar] [CrossRef]
- Li, J.; Wang, Q.; Zou, S.; Song, J.; Zhang, P.; Wang, F.; Huang, Y.; He, Q.; Zhang, L. Protective Effects of Epigallocatechin-3-Gallate (EGCG) against the Jellyfish Nemopilema Nomurai Envenoming. Toxins (Basel) 2023, 15, 283. [Google Scholar] [CrossRef]
- Harada, K.; Maeda, T.; Hasegawa, Y.; Tokunaga, T.; Tamura, Y.; Koizumi, T. Antioxidant Activity of Fish Sauces Including Puffer (Lagocephalus Wheeleri) Fish Sauce Measured by the Oxygen Radical Absorbance Capacity Method. Mol Med Rep 2010, 3, 663–668. [Google Scholar] [CrossRef] [PubMed]
Disclaimer/Publisher’s Note: The statements, opinions and data contained in all publications are solely those of the individual author(s) and contributor(s) and not of MDPI and/or the editor(s). MDPI and/or the editor(s) disclaim responsibility for any injury to people or property resulting from any ideas, methods, instructions or products referred to in the content. |
© 2025 by the authors. Licensee MDPI, Basel, Switzerland. This article is an open access article distributed under the terms and conditions of the Creative Commons Attribution (CC BY) license (http://creativecommons.org/licenses/by/4.0/).


