
Submitted:
19 September 2025
Posted:
23 September 2025
You are already at the latest version
Abstract
The concept of fluid tolerance was recently introduced by our group. Here we review the major organ systems affected by potential venous congestion (cardiovascular, pulmonary, abdominal, renal, central nervous system and dermal tissue) as well as the pathophysiological findings that may lead them to be more vulnerable to detrimental effects of overzealous fluid administration. We thus propose an organ system-based framework for clinicians to assess their patient’s fluid tolerance by different means ranging from the traditional physical examination to the more invasive and technology-based methods. Hopefully this can lead to further study and eventual validation of a fluid tolerance score.
Keywords:
fluid tolerance
; volume assessment
; fluid resuscitation
; septic shock
; fluid administration
; fluid responsiveness
; fluid management
; critical care
Outline
- Intro
- The pathophysiology & importance of congestion
- The Importance of the Inferior Vena Cava
-
Clinical Assessment of Fluid Tolerance of Key Organ Systems
- The respiratory system
- The cardiovascular system
- The kidneys
- The abdomen
- The central nervous system
- The skin and soft tissues
- Discussion
- Conclusion
- References
1. Introduction
Historically, intravenous (IV) fluid administration has been viewed as a vital pillar in the management of acutely ill patients[1,2]. While, at times, volume expansion is a life saving endeavor, there is a growing body of literature documenting the harms of aggressive IV fluid resuscitative efforts[3,4]. A common strategy in recent years used to combat the harms of over-resuscitation is utilizing tools that assist in identifying patients who are “fluid responsive”[5], or in whom a bolus of IV fluid will increase a patient's cardiac output (CO) and restore end organ perfusion[6]. Although such a strategy is preferable to indiscriminate administration of IV fluids to all patients, it is unlikely to represent the optimal strategy for each individual patient, as it is possible to induce both fluid-responsiveness and venous congestion[7]. Or in brief, transiently increase cardiac output[8] while concurrently increasing interstitial edema.
Recently, the concept of fluid tolerance was introduced by our group as an alternative strategy for fluid administration[9]. While fluid responsiveness asks “will a fluid bolus increase a patient’s CO?” a surrogate outcome of questionable clinical import, fluid tolerance asks a far more holistic question. Fluid tolerance asks clinicians to assess the potential benefits and harms of fluid administration to decide if fluid administration is more likely to help or harm the patient in question.
In this follow-up paper, we review the key elements of a thorough bedside assessment to assess the patient's level of fluid tolerance. As it is a broader question regarding a patient's overall risk/benefit ratio of fluid administration, we feel that multiple data points are often required, including elements of the traditional physical examination, hemodynamic data, radiographic data, as well as point-of-care ultrasound.
1.1. The Pathophysiological Consequences of Fluid Overload and Venous Congestion
The understanding that venous congestion can result in organ dysfunction is by no means new to the medical literature. Almost one hundred years ago, Winton performed very elegant animal studies showing how elevating renal vein pressures had immediate effect on organ function, reflected by a decreased urine output, in fact of greater magnitude than a corresponding decrease in arterial pressure[10]. While organ perfusion pressure is often stated to be mean arterial pressure (MAP) - central venous pressure (CVP), this isn’t exactly accurate. Most of the arterial pressure is lost across the arteriolar network, such that the inflow pressure - that of the distal pre-capillary arteriole - is significantly lower (mostly in the 30-40 mmhg range)[11]. The pressure drop between any two points along the circuit depends critically on the diameter of the vessels between these two points. However, the steepest pressure drop (ΔP/Δx) does not occur along the capillaries, where vessel diameters are smallest, but rather along the precapillary arterioles. Indeed, the aggregate resistance contributed by vessels of a particular order of arborization depends not only on their average radius but also on the number of vessels in parallel. While a vascular waterfall has been shown to exist[12,13], it is important to realize that there is still an entire capillary network to traverse, and that a gradient will exist across this as well and impact flow from proximal to distal capillary. Elevated venous pressures will result in greater tissue edema, which will also compound the effects of vascular congestion by increasing the distance between the oxygen-laden hemoglobin and the cells. Ince describes these types of microcirculatory dysfunction as tamponade (type 3) and edema (type 4)[14,15].
Figure 1.
Conceptual illustration of the pressure gradient across the circulatory system from large arteries to large veins. Note the decreased transcapillary driving pressure resulting from elevated venous pressures.
Figure 1.
Conceptual illustration of the pressure gradient across the circulatory system from large arteries to large veins. Note the decreased transcapillary driving pressure resulting from elevated venous pressures.
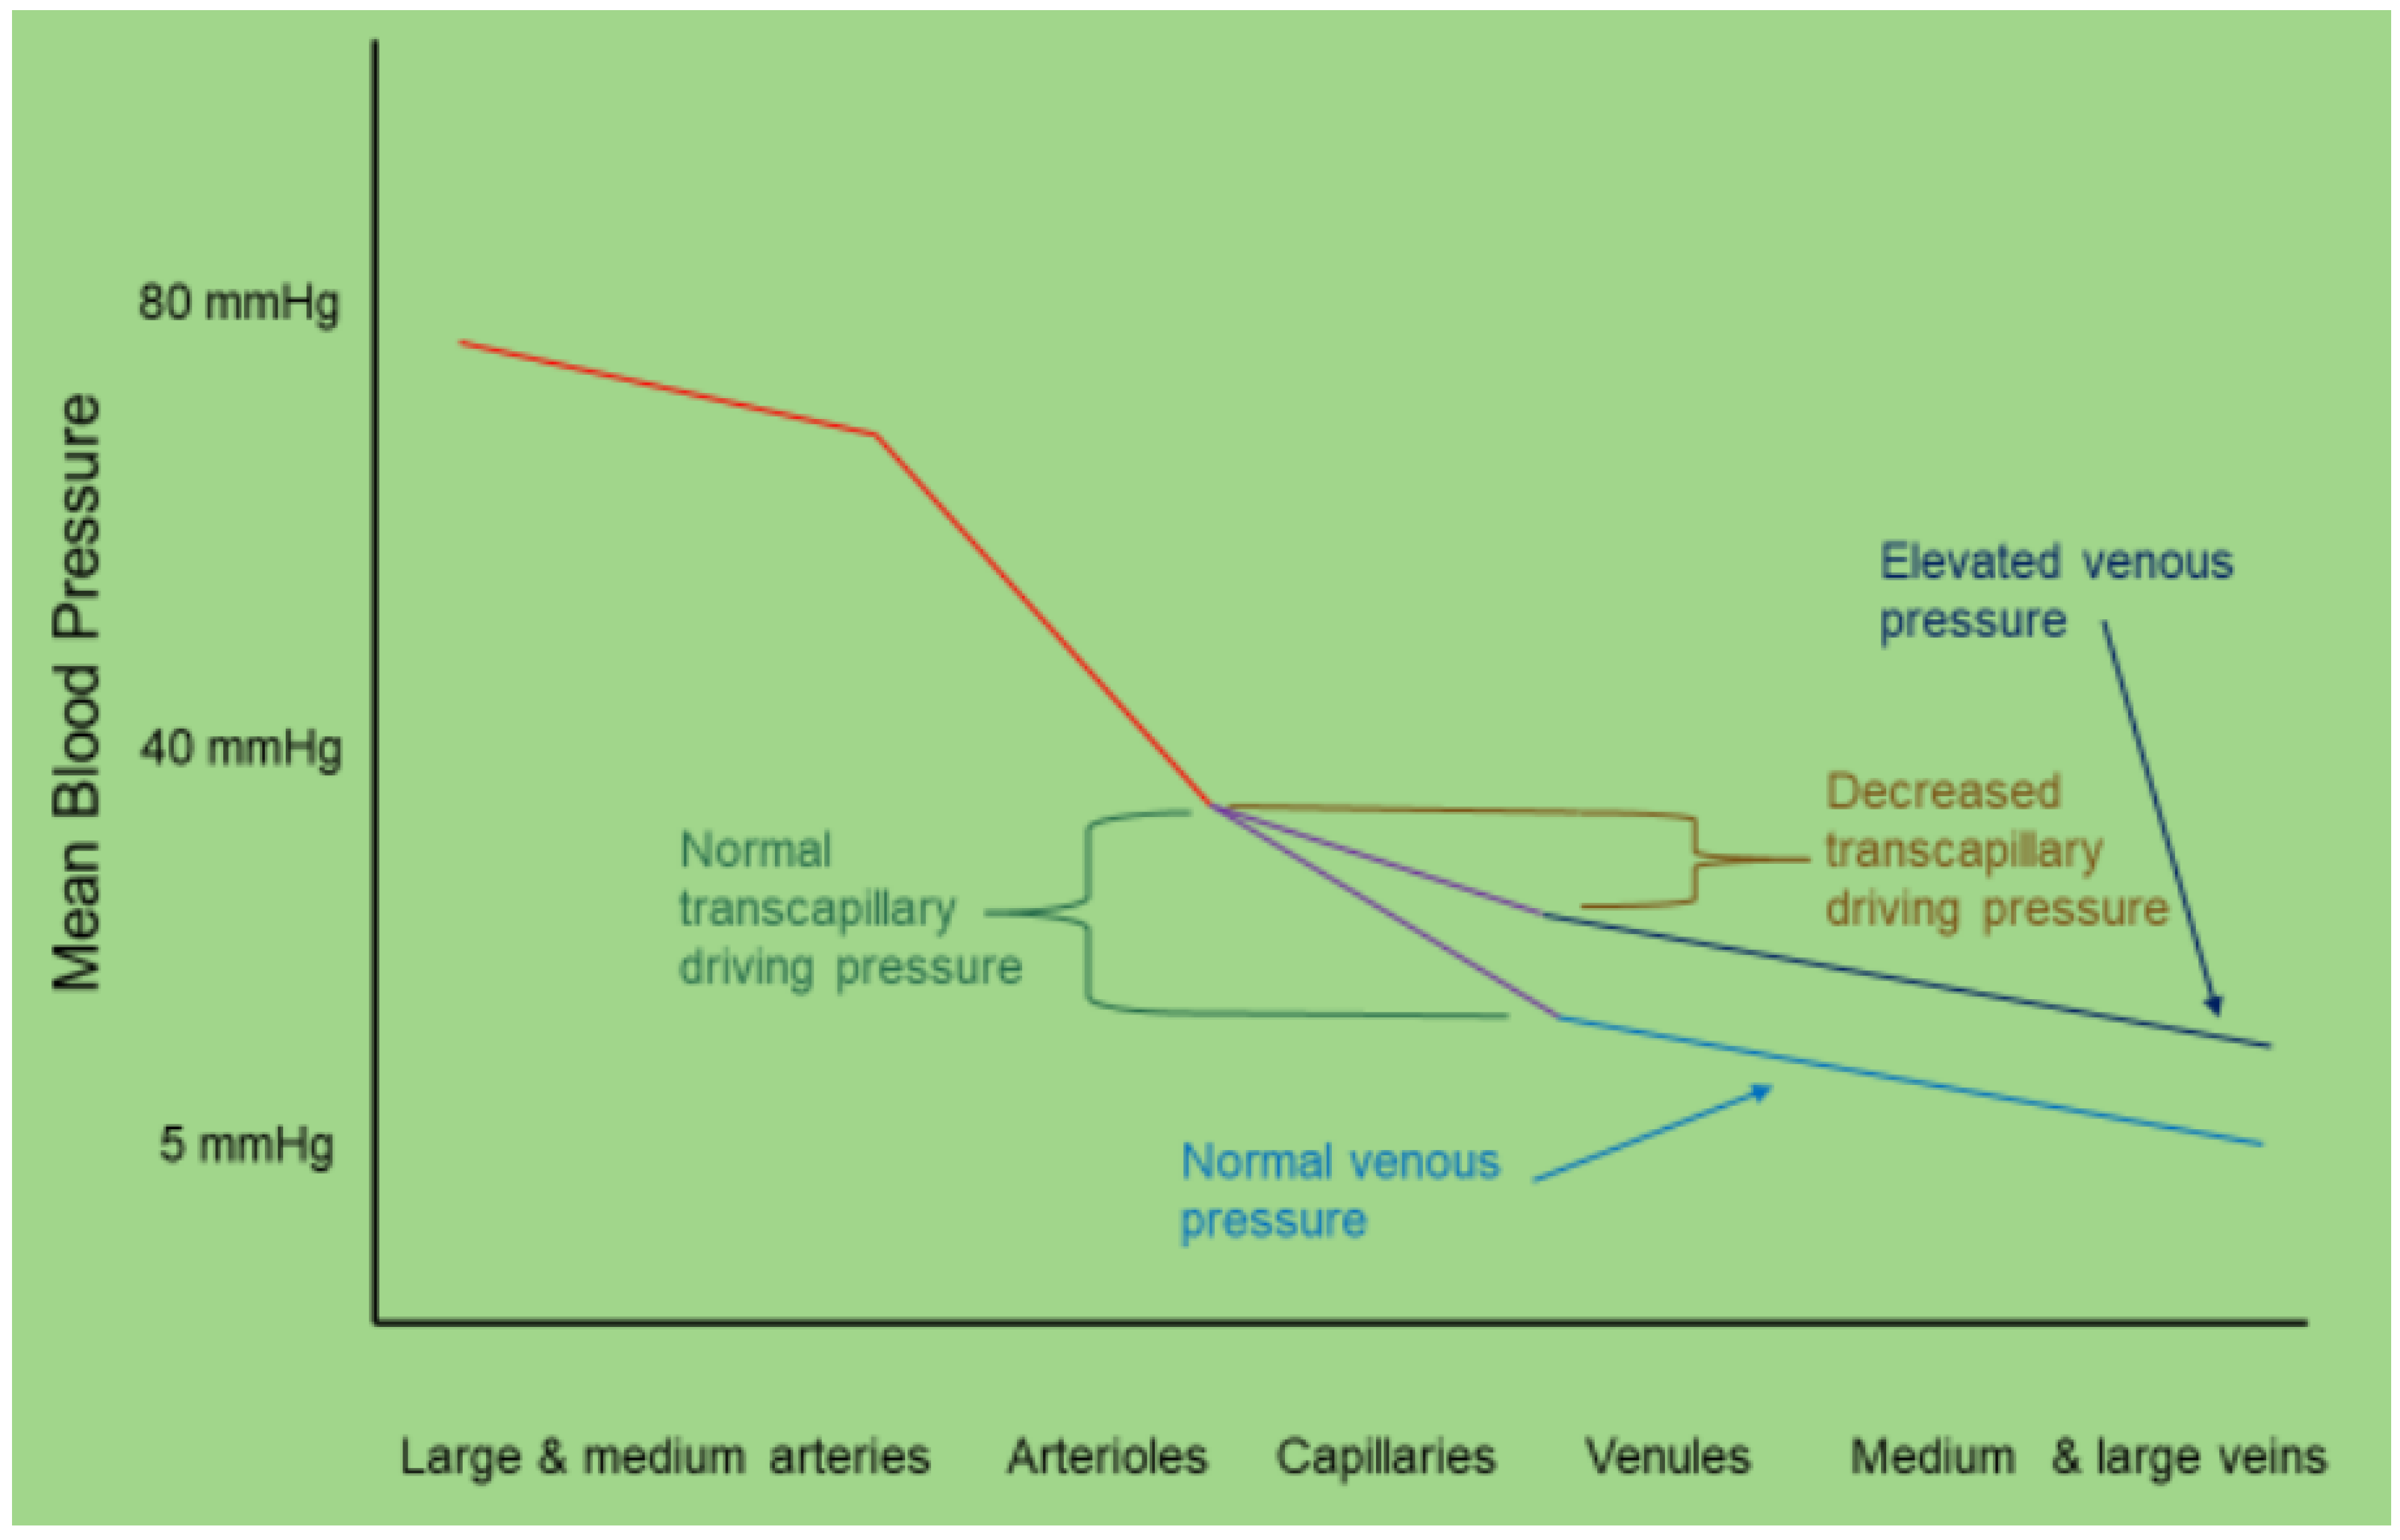
Most of the resuscitation literature has largely targeted the arterial side of the circulation, with little attention being paid to either right ventricular function or the venous side of the circulatory system. Recently the effects of resuscitative strategies on the venous side of the circulation has become more apparent as literature demonstrated an increase in forward flow parameters may not represent an improvement in microcirculation, a state of hemodynamic incoherence, if it results in excessive venous pressures. Vellinga et al showed nicely that in septic patients, CVP values above 12 mmhg actually worsened microcirculation[16].
Increased central venous pressure (CVP), resulting from conditions such as heart failure, iatrogenic fluid overload, or chronic kidney disease, leads to retrograde pressure transmission to the capillary beds of vital organs like the liver, kidneys, and lungs[3,17]. The primary consequences of systemic venous congestion include interstitial edema and tissue hypoperfusion[18]. Elevated venous pressures force fluid into the interstitial compartment, impeding the efficient exchange of oxygen and nutrients at the cellular level. Hypoperfusion worsens the situation, as venous congestion diminishes the pressure gradient required for adequate capillary blood flow, ultimately resulting in tissue hypoxia. Organs such as the kidneys and liver are particularly vulnerable, with venous congestion contributing to the onset of conditions like cardiorenal syndrome and congestive hepatopathy.
Figure 2.
Dynamics of capillary and lymphatic flow under normal and elevated pressure conditions. Top Right Panel: Normal Capillary Flow: Blood flows smoothly from the arterial side to the venous side with normal Pmsf (mean systemic filling pressure). Normal Lymphatic Flow: Lymphatics maintain normal flow with normal RAP (right atrial pressure). Center Panel: Congestion of Capillary: Elevated Pmsf leads to congestion on the venous side, increasing interstitial pressure. Congestion of Lymphatics: Elevated RAP causes lymphatic congestion, further contributing to interstitial pressure. Bottom Right Panel: Tamponade of the Capillary: Elevated Pmsf results in capillary tamponade, leading to interstitial edema. Tamponade of Lymphatics: Elevated RAP causes lymphatic tamponade, exacerbating interstitial edema. The central 3D representation shows the interaction between capillaries and lymphatics, highlighting the effects of pressure changes on fluid dynamics within the interstitium.
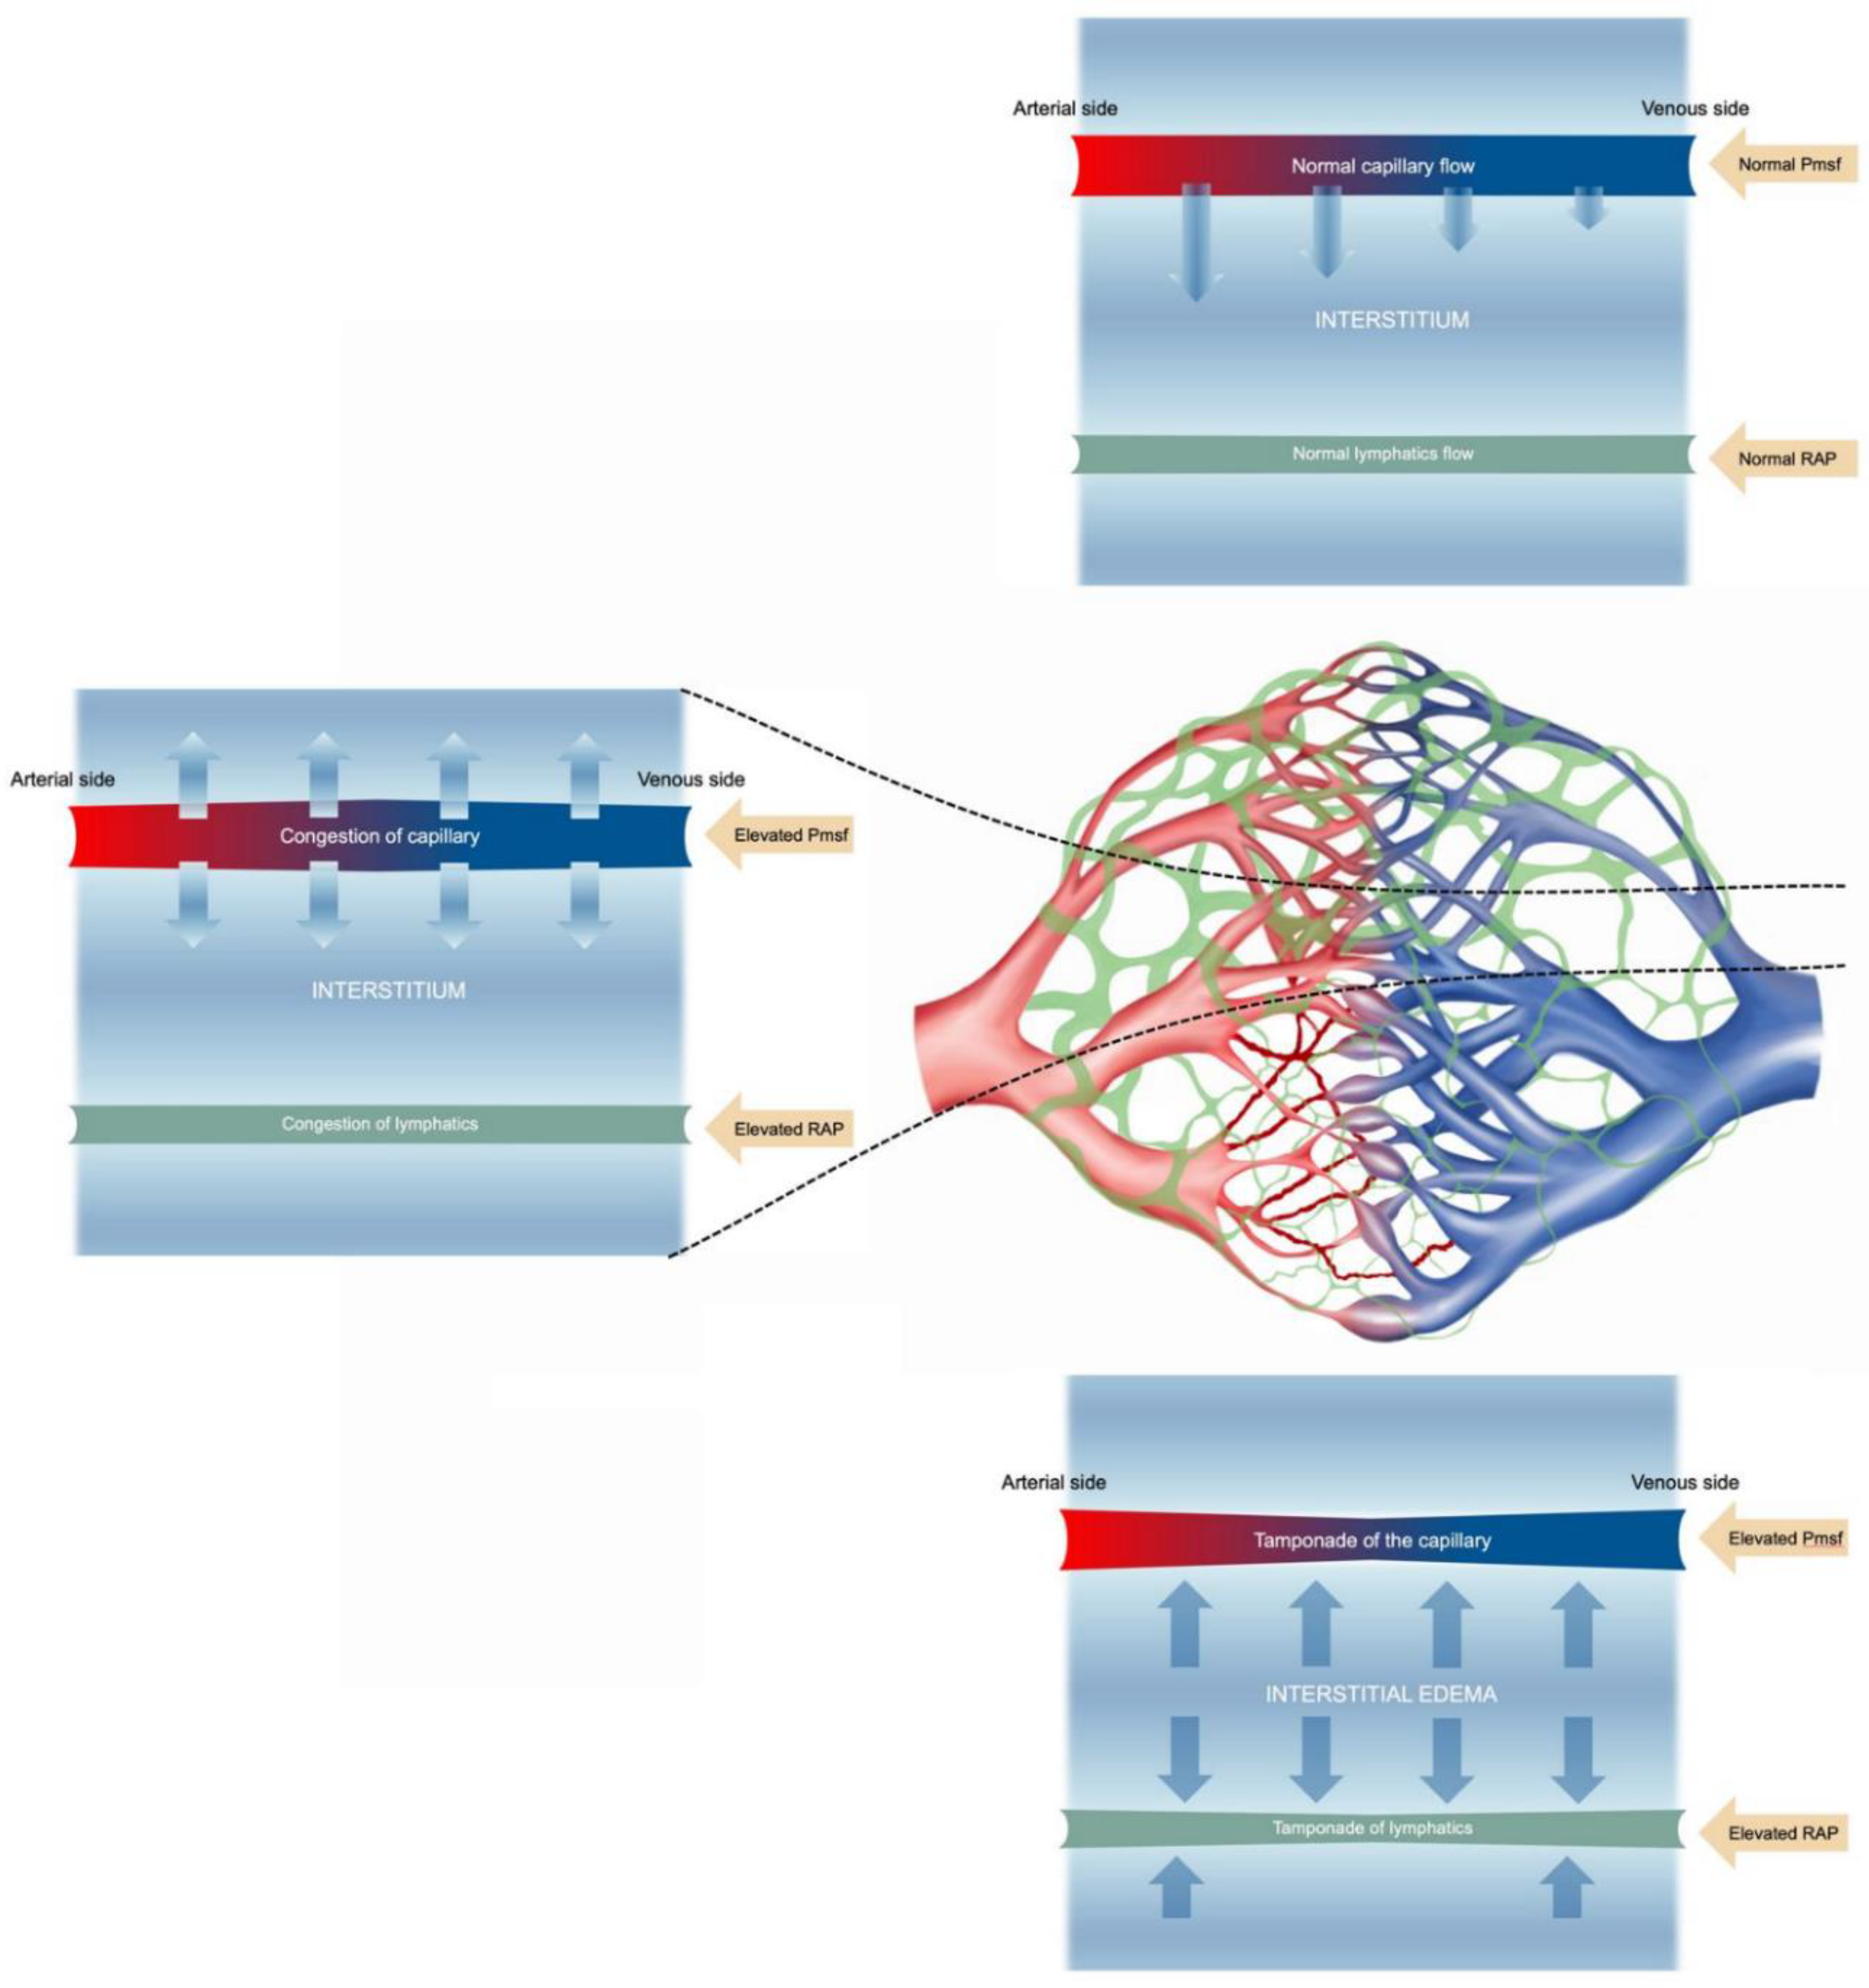
Interstitial edema arises from two key mechanisms: (1) expansion of the interstitial compartment from an increase in distribution of fluids from the intravascular space into the interstitium and (2) dysfunction of the lymphatic drainage[19]. In cases of sepsis, these processes are exacerbated by inflammatory mediators, including nitric oxide (NO), tumor necrosis factor (TNF), and interleukin-6 (IL-6), which increase vascular permeability and further impair lymphatic drainage. These combined mechanisms underscore the importance of assessing fluid tolerance in clinical practice, as venous congestion can significantly worsen organ function and patient outcomes[20,21,22].
1.2. In defense of the Central Venous Pressure and Inferior Vena Cava
Central venous pressure measurement has cycled in and out of favor in the last decades, and while it is a key component of hemodynamics, it must be well understood. Commonly it is felt to represent preload, while in fact it is a reflection of the operating point where the venous return (VR) function meets the cardiac efficiency function rather than being the responsible component of RV preload[17]. It's an important distinction, because if CVP is responsible for the preload instead of the result of the VR and cardiac efficiency (Eh) junction, then it would lead the clinician to target a CVP rather than to target Pmsf or Eh to generate better flow if needed, as the difference between Pmsf and CVP is what guides venous return[23]. Additionally, physicians who target CVP to increase CO tend to target CVPs of 8-12 mmhg which is a pathological state leading to venous congestion, well documented to be detrimental in the critically ill, as mentioned earlier[3,24]. Consequently, a strategy to increase flow when needed by adjusting the Pmsf (via Csys or intravenous fluids depending on the circumstances) or Eh (via inotrope or afterload reduction depending on circumstances) should be promoted rather than an isolated CVP target.
Similarly to the CVP, the inferior vena cava (IVC) is central to venous congestion, as it is the great vessel leading into the right atrium, and reflects the balance between mean systemic filling pressure (the driving force for venous return) and the CVP (the downstream pressure). Unfortunately the bulk of the history surrounding IVC assessment has focused on its role in fluid responsiveness while its use in understanding hemodynamics and assessing fluid tolerance has been largely ignored. Furthermore, given the ovoid shape of the IVC, the manner in which it is traditionally assessed limits one’s ability to achieve accurate results. Lile most echographic assessments we recommend a broader evaluation of the vessel in three dimensions, taking into account respiratory effort, intra-abdominal pressure and assessing its plethoricity[25]. It is important to remember the relative degree of collapse of the IVC represents the relationship between the internal pressure within the IVC pushing outward on the vessel’s walls and the intra-abdominal pressure compressing the IVC externally. These pressures can be influenced by changes in right atrial pressure, intrathoracic pressure, and MSFP. In most cases it is assumed that the patient has a normal abdominal compartment pressure (5 mmHG) and mild variations in intrathoracic pressures[26].
A plethoric IVC is the startpoint for splanchnic and infra-diaphragmatic tissue congestion, and should be part of regular patient assessment. The authors suggest averaging a short axis scan of the IVC over the intrahepatic section and looking for a sphericity index over 80%, a respiratory variability below 20% to determine if it is plethoric[25]. If found, this should probably be at least a signal for cautiousness with further fluids as well as prompting further assessment of venous congestion to determine if fluid removal would be beneficial.
1.3. Clinical Assessment of Fluid Tolerance: An Organ Based Approach
A. The Respiratory System - While most of the literature focuses on the pulmonary capillary wedge (PCWP) or left atrial pressure (LAP) as the key element in pulmonary fluid tolerance, we would suggest that this is only part of the risk factors or evidence of fluid intolerance. Indeed, the traditional cutoffs such as a PCWP of 18 mmHg were derived from patients with essentially normal lungs and with acute left ventricular dysfunction. If a patient has already some element of lung pathology, whether or not there is concomitant elevation in LAP/PCWP, a leaky capillary bed with pneumonia, or borderline respiratory function due to another disease, they may very well be already fluid intolerant from a pulmonary standpoint. It is important to realize that from a fluid tolerance perspective, whether the extravascular fluid is of cardiogenic or non-cardiogenic origin matters little, as both represent a clinical state where worsening may result from further fluid administration.
At the Bedside - The initial step in assessing fluid tolerance or congestion in the respiratory system involves a detailed clinical observation and examination.[27] Observing the patient's breathing, including rate, rhythm and use of accessory muscles, provides initial indicators of respiratory distress and potential fluid overload requiring further assessment. Listening to abnormal sounds, such as crackles or wheezes across lung fields, or decreased air entry, can suggest localized or widespread pulmonary congestion and potential pleural effusions. Oxygen requirement points at potential fluid intolerance. Minute ventilation requirements: As pulmonary pathology increases, so does V/Q mismatch leading to a decrease in alveolar ventilation. In such cases patients will increase their minute ventilation in order to maintain a normal PCO2.
Imaging Studies - Chest radiography is a fundamental imaging tool that can reveal fluid-related issues. While chest X-rays only have moderate specificity (52–94%) and low sensitivity (44–58%) in detecting fluid overload, the presence of significant parenchymal disease of any etiology should suggest limited fluid tolerance[28]. Pulmonary edema may appear as upper lobe pulmonary venous diversion (often referred to as the "stag's antler sign") or an increased cardiothoracic ratio, which helps assess underlying cardiogenic causes. Features of pulmonary alveolar edema include air space opacification, represented by white areas throughout the lungs, classically in a batwing distribution. In mild cases, interstitial fluid may not be visible on a chest X-ray. However, as it progresses, it can be seen between the airspaces or the interstitial compartment as the fluid spills over into the airspaces. Features of pulmonary interstitial edema are peribronchial cuffing (thickening around the bronchi) and perihilar haze (increased density around the hilar region).
Ultrasound: Lung ultrasound (LUS) has emerged as a highly effective tool for diagnosing pulmonary edema due to its ability to rapidly and accurately identify the associated sonographic patterns, primarily through the detection of B-lines, and pleural effusions[29]. LUS is reported to have high sensitivity (90-100%) and specificity (94-100%) in this regard[30]. Additionally, LUS is excellent to diagnose the presence, size and characteristics of pleural effusions.
CT +/- Pulmonary Angiography: CT is highly effective for visualizing the pulmonary arteries[4]. Due to its high sensitivity and specificity, CT-PA is considered the gold standard for diagnosing pulmonary embolism. If pulmonary edema is suspected due to heart failure or other causes, CT-PA is not the first-line diagnostic tool. It can also show signs that suggest pulmonary edema, such as septal thickening or peribronchial cuffing.
1.3.1. Device-Based Assessments
Noninvasive Monitoring
Bioreactance and Bioimpedance: bioreactance devices analyze the relative phase shift of an oscillating current passing through the thoracic cavity[31]. They can estimate real-time changes in stroke volume, but also provide dynamic measurements of thoracic fluid content (TFC), representing a potentially significant advancement in the noninvasive monitoring of fluid status. TFC represents the whole (extravascular, intravascular, and intrapleural) fluid component in the thorax and correlates with extravascular lung water in patients with preeclampsia[32,33]. This technology enhances the ability of healthcare providers to make informed decisions regarding fluid management in fluid overload settings, particularly by trending the data.
Invasive Monitoring
Pulmonary Artery Catheter (PAC): The PAC plays a role in managing heart failure, mainly through its ability to directly assess cardiac filling pressures and output. It can be useful in assessing pulmonary edema, as a PCWP >18 mmHg may suggest a component or a risk for cardiogenic pulmonary edema, and it may point the clinician towards a particular management path. An elevated PCWP should prompt echocardiography to assess the underlying cause and guide appropriate management, which may be diuresis in cases of true volume overload, afterload reduction (mitral regurgitation), inotropy if systolic dysfunction, etc. In critically ill patients or those with complex cardiac conditions, the data from the PAC can be very useful for customizing treatment plans and may potentially improve patient outcomes[34].
Transpulmonary Thermodilution Techniques: these methods yield accurate cardiac output and hemodynamic parameters, but also provide a unique parameter, the extravascular lung water index (EVLWi)[35]. EVLWi measures the amount of water in the lungs outside the blood vessels. It is calculated based on the patient's body weight, making it a personalized index of lung water content. It may serve to quantify and monitor pulmonary edema, to distinguishing edema Types: By using EVLWi in conjunction with the pulmonary vascular permeability index (PVPI = EVLW/pulmonary blood volume), clinicians can trend increasing intolerance and differentiate between hydrostatic and permeability-induced pulmonary edema. High PVPI and/or EVLWi values suggest that there may be increased pulmonary vascular leakage, and that further fluid administration may risk fluid overload and may even indicate the need for fluid removal to prevent the worsening of pulmonary congestion[35].
B. The Cardiovascular System
The response of the cardiovascular system to fluid therapy has been the principal physiological focus since the inception of intravenous fluid therapy. Initial predictions of a patient’s response to fluid therapy were based on both qualitative and quantitative measures of cardiac (left ventricular cavity) and vascular structures (IVC variance). Because of their different geometries, behaviors, and anatomical locations, when considering the heart’s response to fluid therapy, the right and left ventricles must be considered both separately and together.
The Right Heart
The right heart is the intersection of the venous and the pulmonary circulations. Owing, in part, to historically not being considered ‘the driver’ of cardiac output, scant work has been performed to identify right ventricular parameters which predict fluid responsiveness. Moreover, the right heart should not be used to identify fluid responsiveness, rather, an abnormal right heart should represent a ‘stop sign’ to clinicians considering volume administration.
Patients with pulmonary hypertension (PH) deserve consideration. For patients with well-compensated PH, the right ventricle has (more) optimal wall tension than those with decompensated failure. Consequently, fluid administration will distend right ventricular myocardium, worsening wall tension and impeding contractility. Gaining insight into the severity of pulmonary hypertension has been described and can be readily performed [36] using pulse wave Doppler of the right ventricular outflow tract. Clinicians caring for patients with any degree of right ventricular dysfunction should be reluctant to undertake volume resuscitation given concern for lowering cardiac output, rather than raising it. Additionally, providing fluids to patients with a dysfunctional RV may lead to systemic sequelae mentioned later.
The Left Heart
Echocardiography has utility for identification of an important cause for increased extravascular lung water, which is an elevation of left atrial pressure (LAP). An elevated LAP results in an elevated PCWP leading to accumulation of fluid in the interstitium of the lung and, when severe, with flooding of the alveolar compartment. The exact value of LAP that results in pulmonary edema is not known for the individual patient, as pulmonary capillary permeability, interstitial pressure, alveolar pressure, efficiency of lymphatic drainage (which may be modified by the central venous pressure), the gravitational hydrostatic gradient of the lung, and serum oncotic pressure are determinants of the risk for pulmonary edema.
The intensivist has several methods for assessing the possibility of an elevated LAP. Classical findings of pulmonary edema on physical examination include rales and those associated with the presence of pleural effusion. These are non-specific and may be difficult to ascertain in the critically ill patient. The chest radiograph may have findings suggestive of pulmonary edema such as increased vascular pedicle diameter, cardiomegaly, Kerley B lines, perihilar ground glass opacities, or vascular redistribution. All of these findings require a good quality PA chest radiograph (well centered, erect, well penetrated, with full inspiratory hold). The chest radiograph in the intensive care unit is usually technically inadequate, so it is not useful for assessment of pulmonary edema deriving from elevation of LAP. The pulmonary artery catheter is useful for direct measurement of P. This is an invasive procedure with well-defined risks and uncertain advantages compared to ultrasonography.
This leaves ultrasonography as the most useful imaging modality to assess LAP. Lung ultrasonography can be productively combined with echocardiography when estimating LAP. The finding of a generalized A line pattern is strongly associated with a pulmonary artery occlusion pressure that is below 18 mm Hg and usually below 12 mm Hg[29,30]. Given that PCWP is a reasonable surrogate for LAP, an A line pattern effectively rules of an elevation LAP sufficient to result in pulmonary edema. This is a means of rapidly ruling out venous congestion of the lung.
For the operator with skill at the limited or goal directed examination, there are findings that indicate an augmented risk of pulmonary edema due to an increase in LAP. These include a reduction in left ventricular (LV) contractility, increased LV wall thickness (with or without reduction in LV function) suggesting diastolic dysfunction, an increase of left atrial size, or findings of significant left sided valve failure (e.g. mitral stenosis, aortic stenosis, major regurgitation detected with color Doppler)[37]. While none of these findings indicate that there is presently an elevation of LAP, they serve to caution the operator that there is risk of an elevated LAP. If the LAP is not elevated at the time of examination, these findings indicate that the patient is at risk for developing an elevated LAP if there is untoward fluid administration or change in other loading conditions.
For the operator who has skill at more advanced echocardiography, spectral Doppler allows for a semi-quantitative measurement of LAP. While Doppler cannot give a precise numerical estimate of LAP, it can identify whether there is or is not an elevated LAP often defined as a PCWP greater than 18 mm Hg. The American Society of Echocardiography (ASE) has a comprehensive Guideline that summarizes the evaluation of diastolic function and estimates of LAP[38]. The document includes algorithms that are in standard use by consultative echocardiography services. The algorithms may apply well to stable patients in the echocardiography laboratory, but not so effectively to critically ill patients. Several studies have described the difficulty in applying the ASE algorithms to critically ill patients, as some of the measurements are difficult to obtain in critically ill patients due to technical challenges[39]. This is not to discount their utility in the population from which they were derived i.e., stable echocardiology laboratory patients. While it is reasonable to use the obtainable elements of the algorithm in an attempt to estimate LAP, an alternative approach is to apply a simpler algorithm that may be applicable to the critically ill patient. Brault et al reported in a population of critically ill patients on ventilatory support; that, if the lateral mitral annular tissue Doppler velocity was greater than 8 cm/sec, no patient had an elevation of PCWP. If the mitral E wave velocity to mitral A velocity ratio was greater than 1.5, there was substantial risk that the PCWP was elevated. Other patterns were not correlated with PCWP[40]. Doppler measurements are useful in some patients to define whether the LAP is elevated. They cannot determine its exact value but rather, like 2D imaging, they alert the clinician to the risk of pulmonary edema. Even if this is not present at the time of the examination, Doppler findings consistent with an elevation in LAP discourage the use of fluid infusion and warn of the risk of load dependent pulmonary edema.
Although not proven, typical Doppler parameters should be considered to define a continuum of risk (e.g., as the E/e’ ratio of 30 likely represents a much higher risk of elevated LAP than an E/e of 15). In using Doppler to estimate LAP, the operator needs to be familiar with those elements that are known to invalidate Doppler measurements for assessment of LAP such as localized ischemic injury of the region of the lateral mitral annulus, mitral annular calcification, severe mitral regurgitation, and mitral stenosis. Atrial fibrillation results in loss of the mitral inflow A, so the E/A ratio cannot be determined. While echocardiography may give a semiquantitative estimate of LAP; it is always productively combined with lung ultrasonography and clinical assessment to identify cardiogenic venous congestion with pulmonary edema, which may be amenable to effective treatment.
C. The Kidneys
The kidneys are one of the most important organs germane to any discussion of venous congestion. This is because the kidney is central to the system’s fluid and electrolyte regulation. Because they are the primary organ responsible for regulating the body’s volume, a number of mechanisms exist in order to regulate the renal blood flow (RBF) and appropriately convert this flow into urine to be expelled or conversely to be retained through resorption.
These mechanisms include the MAP supplied via the systemic blood pressure, the RBF itself, the glomerular filtration rate (GFR), electrolyte processing and resorption of most of the glomerular filtrate through the length of the nephrons, and finally the regulated reabsorption of water from the final filtrate which is determined by the presence or absence of vasopressin. The GFR itself depends on the fraction of RBF that is not shunted past the glomeruli, the pressure inside Bowman’s capsule, and the interaction of the afferent and efferent glomerular arterioles that will determine intraglomerular pressure driving filtration as well as effect the RBF itself–as increased glomerular arteriolar tone impedes the delivery of the RBF. The processing of the glomerular filtrate throughout the nephron, in turn, depends on a number of neurohormonal factors, both supplied within the kidney itself and via other organs such as the heart, brain, and vasculature. Some neurohormonal factors also affect afferent and efferent glomerular vascular tone as well.
Central to many of the mechanisms involving the kidneys’ volume control are the system’s (both kidney and systemic) perception of its volume status, regardless of if these perceptions are accurate or not. Unfortunately, many factors contemporary with venous congestion lead to misinterpretation of the true hemodynamic circumstances and volume status. This often leads to the kidneys inappropriately retaining sodium and water during venous congestion when hypoperfusion exists because the default of the kidneys is frequently to assume malperfusion is a function of haemorrhage or fluid and electrolyte loss rather than of a distributive or congestive nature such as sepsis or congestive heart failure, respectively. Particularly challenging to the clinician is in sepsis syndromes, where IVF are often prescribed when urine output decreases, with the mistaken belief that the lack of urine production is due to intravascular hypovolemia rather than over resuscitation with fluids leading to congestion and thus hypoperfusion of the kidneys.
There are multiple deleterious effects on kidney function caused by venous congestion. The development of interstitial edema decreases RBF via tamponading mechanisms. The kidneys, being encapsulated organs, are particularly prone to the detrimental effects of interstitial edema, as there is little room for interstitial volume to expand and thus intracapsular pressures rapidly rise. Increased intra-abdominal pressure has an external compressive effect on the kidneys that also decreases RBF. In addition to the decrease in RBF, lymphatic clearance of edema is impaired as lymphatics can also be prone to tamponade forces. Increased venous pressures not only lead to capillary hypertension and renosarca, but also promote sluggish blood flow through the renal vasculature.
Fluid administration aimed at improving acute kidney injury or oliguria will only achieve this goal if: 1) Fluids increase renal perfusion through increased cardiac output and 2) worsening venous congestion is avoided during this process. These 2 conditions may appear to be mutually exclusive, however, it is important to understand that in some conditions there can be a significant difference between fluid induced increase in cardiac output and fluid induced organ congestion[41,42]. A clear example of this happens in patients with torrential tricuspid regurgitation where the pressure generating preload can be significantly lower than the pressure of the regurgitating jet. Accordingly, fluid administration might increase cardiac output while at the same time exacerbating organ congestion. The severity of atrial backflow reaching the peripheral organs can be assessed at the bedside using venous Doppler. Retrograde atrial flow has the opposite direction as normal venous return. Thus, increasing atrial backflow manifests as interrupted flow in the intra-renal veins (interlobar or arcuate) (Figure Argaiz).
Figure 3.
Intra-renal venous Doppler waveforms showing the local effects of increasing congestion. Flow above the baseline is mostly arterial (except for systolic venous flow reversal that can be seen above baseline) and venous below. Note the progression from continuous to discontinuous flow with significant reduction of venous flow until there is only some diastolic flow observed. This illustrates the significant impact elevated venous pressures have on tissue perfusion via impaired afterload.
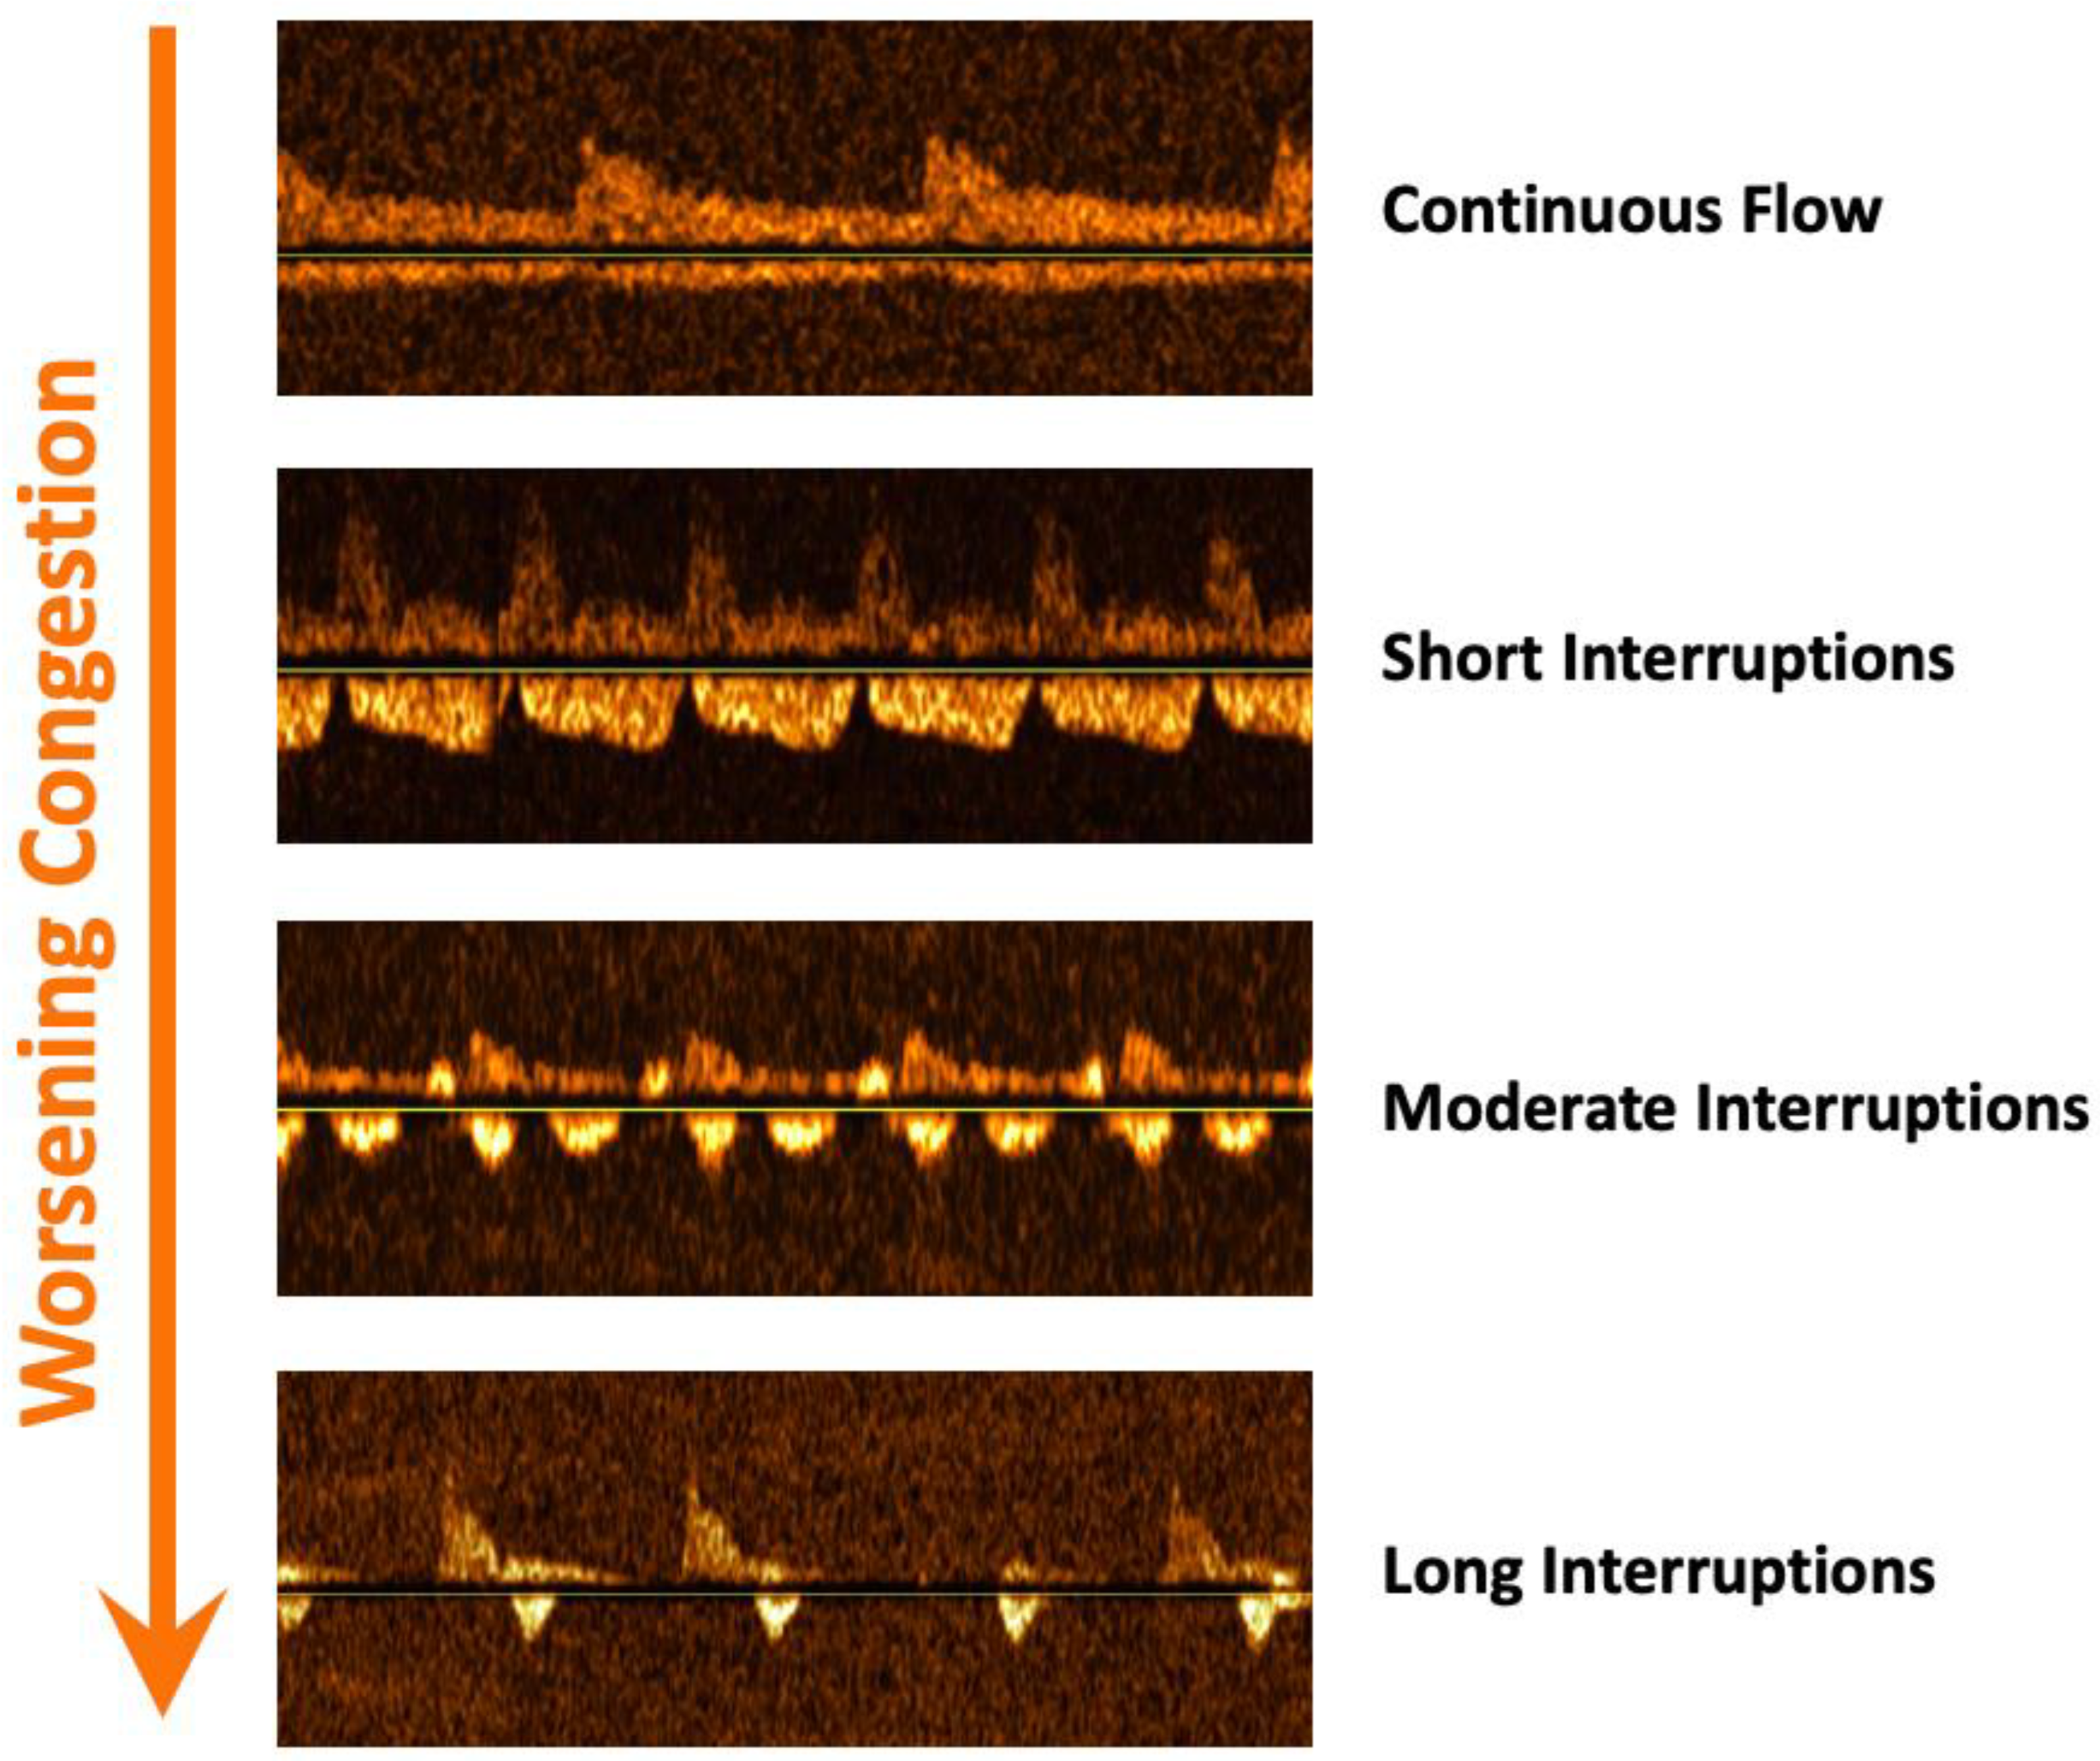
These venous Doppler alterations have been strongly linked with congestive kidney injury in cardiac surgery[43], pulmonary hypertension[44,45], acute coronary syndromes[20], and non-selected critically ill patients[46,47]. In some of these populations, venous Doppler improved the diagnostic yield of congestive nephropathy compared to CVP[43,46]. Similarly, reverse atrial flow but not CVP was associated with congestive hepatopathy in patients with pulmonary hypertension[42]. Finally, both portal and intra-renal venous abnormalities predict adequate response to diuretics in ICU patients. Hence, it is our opinion that altered venous patterns, specifically a portal vein pulsatility fraction > 30-40% and intra-renal venous interruptions of more than 20% of cardiac cycle are clear signs of fluid intolerance given the risk of congestive kidney injury[48]. Important caveats when performing venous Doppler for assessing organ congestion include liver cirrhosis for portal vein and both advanced chronic kidney disease (eGFR < 15) and obstructive uropathy[49].
Finally, while often disregarded, assessment of tubular integrity with urinary indices and urine sediment is an important component when considering fluid administration. In the presence of clear signs of tubular dysfunction (high fractional excretion of sodium (FENa), isosthenuria, muddy brown granular casts), renal function is unlikely to improve with fluid administration even if renal perfusion is increased. That said, it is fundamental to understand that signs of preserved tubular function are not indicators of hypovolemia as the kidneys will respond equally to any hemodynamic derangement including distributive and congestive scenarios[48]. Thus, administering fluids based on a low FENa alone will inevitably lead to unnecessary fluid overload in many patients.
From a practical standpoint, the most basic way to assess the risk of renal dysfunction associated with fluid overload is assessment of the jugular venous pulse, understanding that elevated values likely represent fluid intolerance as right ventricular limitation is attained[41]. Invasively, central venous pressure and waveform analysis can provide similar information. With necessary equipment and skill, 2D and Doppler analysis of the venous system is the most practical and evidence-based bedside approach. As mentioned above, a combination of IVC, hepatic, portal and intrarenal venous Doppler, the venous excess ultrasound score (VExUS) score, correlates well with renal dysfunction[22,50],, as does the renal venous stasis index (RVSI) (RVSI refs). The presence of abnormal or worsening scores should represent fluid intolerance and prompt the clinician to address the etiology of the elevation in CVP or MSFP.
D. The abdomen
During fluid resuscitation significant amounts of fluid can have several important effects: increased bowel edema and ascites which, if marked, can lead to elevated intra-abdominal pressure and reduced venous return. Consequently, cardiac output decreases, organ function can fail, and a vicious cycle of ongoing fluid resuscitation and accumulation can ensue, especially because these patients often display short-lived fluid-responsiveness, misleading those who follow a narrow fluid-responsiveness strategy[51].
Intestinal edema impairs bowel contractility and absorption, leading to ileus, hindering effective feeding. Moreover, increased intra-abdominal pressure (IAP) can lead to both forward (decreased mesenteric blood flow) and backward failure (decreased abdominal perfusion pressure (APP) = MAP – IAP), affecting perfusion to all abdominal organs and worsening outcomes due to intestinal permeability and bacterial translocation. This scenario often precipitates conditions like abdominal compartment syndrome, frequently observed in conditions such as severe burns, trauma or acute pancreatitis where large amounts of fluids are often administered. Additionally, inflammation reduces microvascular flow, increasing vascular permeability and leading to second (edema) and third space (ascites) fluid formation. This cascade adversely affects lymphatic flow, exacerbating edema[52].
Experimental models have validated that lymphatic fluid from compromised intestines can indeed worsen systemic inflammation and endothelial damage. Therefore, acknowledging the gut as a pivotal contributor to multiple organ dysfunction syndrome and abdominal compartment syndrome is crucial. The challenges in evaluating gut function should not obscure its critical role in systemic health and disease progression. In analogy to recognition of similar processes in lung (ALI) and kidneys (AKI), a novel concept was introduced, acute gastrointestinal injury (AGI), manifested through bowel edema and the ensuing IAH. Even more than other organ dysfunction syndromes, AGI has a negative impact on distant organ systems through the development of IAH, and can contribute to the development of AKI and ALI. However, understanding and managing acute gastrointestinal injury remain challenging due to the complexity of gut function assessment.
1.3.2. Clinical Assessment
The simplest and initial assessment should be palpation of the abdomen for potentially elevated IAP, which has already been linked to poor prognosis in several epidemiological studies. This of course may be due to an increase in air, intraluminal or extraluminal fluid accumulation, or edema of the viscera, which will need further evaluation.
Basic measurement of IAP - Intra-abdominal pressure measurement[52]: IAP is the steady-state pressure concealed within the abdominal cavity. On average, it is approximately 5–7 mmHg in critically ill adults. IAH is defined by a sustained or repeated pathological elevation in IAP ≥ 12 mmHg. ACS is defined as a sustained IAP > 20 mmHg (with or without an APP < 60 mmHg) that is associated with new organ dysfunction/failure.The reference standard for intermittent IAP measurements is via the bladder with a maximal instillation volume of 25 mL of sterile saline. IAP should be expressed in mmHg and measured at end-expiration in the supine position after ensuring that abdominal muscle contractions are absent and with the transducer zeroed at the level of the midaxillary line.
Imaging - Plain abdominal X-ray may identify a “grey” abdomen indicative for second and third space fluid accumulation and/or dilated fluid-filled (or with air/fluid levels) bowels. The stomach may be distended, and indirect signs of intra-abdominal may be present (eg. elevated hemidiaphragms and decreased lung volumes).
Point of care ultrasound (POCUS) - This should be the mainstay of bedside evaluation of the abdomen. There have been many protocols, originating with the focused abdominal sonography in trauma (FAST) protocol [FAST ref], and likely culminating in the more recent and extensive GUTS protocol[53,54,55], a tool for identifying and quantifying free fluid often resulting from sepsis, capillary leak, or massive fluid resuscitation. POCUS can evaluate bowel wall thickness, diameter, contents, peristalsis, and vascularity. These features help diagnose conditions like bowel obstruction, providing insight into intestinal diseases and their severity.
The GUTS protocol offers a structured sonographic examination of the abdomen, integrating both GI and urinary tract assessments, aimed at improving the clinical management of these patients. The protocol includes measurement of the antral cross-sectional area (CSA) to estimate gastric volume, evaluation of the small bowel and colon diameters to detect abnormalities, assessment of the GI tract wall layers to identify inflammation or edema, observation of bowel motility to determine peristalsis effectiveness, and the use of Doppler ultrasound to assess blood flow within the GI tract and related organs.
A solid POCUS assessment is essential for evaluating the gastrointestinal tract and some of these techniques may require radiological specialist expertise depending on the bedside clinician-sonographer’s skillset. It is our feeling that most clinicians should acquire the ability to identify ascites and fluid-filled bowel stomach and bowel as a minimal start point, as these are amenable to rapid intervention. It is also important to remember that while POCUS is useful for initial evaluations, it does not replace CT for detailed assessments.
Abdominal CT - this is the preferred imaging modality for diagnosing intra-abdominal diseases such as pancreatitis, bowel perforation or obstruction, acute mesenteric ischemia, abdominal abscesses, and various infectious or inflammatory processes[56]. The presence of significant intra-abdominal pathology should raise the potential for abdominal fluid intolerance. Fluid accumulation will lead to a reshaping and stretching of the abdominal fascia leading to a change in shape from ellipse to sphere (as seen with IAH and ACS) it can also assess gynoid (pear) versus abdominal (apple) fat deposition giving a clue towards abdominal compliance for the prediction of deleterious effects related to fluid administration[27,57].
In summary, any significant GI pathology, especially if associated with elevation of IAP, points towards some degree of fluid intolerance. The presence of significantly elevated IAP or ACS would be a strong marker of intolerance, unless it can rapidly be remedied (drainage of air or fluid).
E. The central nervous system (CNS)
The brain is another organ which can be impacted by congestion. Cheyne-Stokes breathing has long been associated with severe congestive heart failure though the precise mechanism remains unclear[58]. By the nature of its rigid casing, the compliance curve of the intracranial cavity has a sharp upturn in pressure when contents exceed the egress capacity of cerebrospinal fluid.
Denault’s group noted a strong association of post-operative delirium with portal vein pulsatility in a cohort of cardiac surgery patients[59]. In post arrest patients, Ameloot et al. essentially confirmed Winton’s studies by demonstrating that elevated CVP was more strongly associated with cerebral desaturation than low MAP[60]. Interestingly, this was noted to start at the relatively “low” CVP value of 5 mmhg, only overcome by a very high MAP of 90-100 mmhg. Cerebral oxygenation using near-infrared spectroscopy was also noted to improve with fluid removal during dialysis along with improvement in pulmonary congestion[61].
It is already well established that elevated intracranial pressure (ICP) is a deleterious parameter across a wide variety of pathologies. While there is no literature showing that simple venous congestion such as may occur in congestive heart failure, renal failure or iatrogenic volume overload carries permanent cerebral consequences, in the setting of pre-existing or primary intracranial pathology, particularly inflammatory, it would be logical to avoid adding a congestive insult to the microcirculation.
At the Bedside
History is very important in this case, so patients presenting with a primary neurological issue should flag to assess ICP, including the potential for ICP elevation in the next days or hours, and should be considered to have limited fluid tolerance. This includes CNS infection, stroke or intracranial hemorrhage, trauma, post-arrest encephalopathy, intracranial masses, etc. A basic neurological exam, particularly papilledema (Frisen scale) in sedated patients, is important[62].
POCUS can help first by assessing optic nerve sheaths - diameters above 5.0 mm generally correlate with elevated ICP (>20mmhg), and with trans-cranial Doppler (TCD), which can also identify intracranial hypertension based on waveform velocities and morphology[63,64]. CT and MRI can also provide signs of elevated ICP[64].
The gold standard of ICP evaluation is of course direct measurement, so for patients who already have a drain or intraparenchymal pressure transducer in place, elevated values should represent at least a state of fluid intolerance.
It is beyond the scope of this article, naturally, to review elevated ICP management, but from a standpoint of fluid tolerance, its detection or suspicion should prompt the clinician to carefully weigh the pros and cons of any fluid administration.
F. The skin and soft tissues
Skin and soft tissue edema is frequent in critically ill patients and often multifactorial due to hypoalbuminemia, capillary leak syndrome, elevated CVP, lymphatic obstruction, physical movement restriction and commonly excessive fluid administration.
In a normal euvolemic patient, it only takes an increase of 2,5 to 3L in the interstitial space to develop visible edema (Goyal 2023) and this correlates to results showing incidence of 18% to 24,8% subcutaneous edema within the first 24h of ICU admission[65,66].
Long regarded as benign in the critically care community and considered as an unfortunate part of the process in critically ill patients, tissue edema can lead to serious complications such as pressure sores and ulcers, wound infection and impaired healing, compartment syndrome, systemic infection, increased critical care myopathy, decreased range of motion and joint mobility leading to more deconditioning.
At the Bedside
As mentioned earlier, there is no systematic tool to assess the onset and evolution of subcutaneous edema but a multimodal evaluation (physiological measurement, physical examination,ultrasound), helps render a better assessment.
First, a measurement of ins and outs is essential despite the fact that critically ill patients will have insensible loss from breathing, wound, stool, urine loss etc. A daily weight measurement can compensate for these insensible losses.
A correlation should be made with the physical examination of extremities and gravity-dependant areas by visual examination, diameter measurement and palpation. It could be difficult only by palpation to assess every 24h the variation of edema, so the diameter measurement with the ins and outs combined with weight should provide a better assessment of the clinical evolution.
For the majority of intensivists, inspection and palpation is the key to assess the edema and gives a fairly good assessment if there is enough interstitial fluid present.
The Pitting Test is a straightforward tool to evaluate the severity of edema. Usually, 5 seconds of firm pressure to the skin of the extremities and gravity-dependant area reveals a pit or not. Depending on the clinical findings, the scale is graded from 1 to 4.
Grade 1: immediate rebound with 2 mm pit
Grade 2: < 15 sec rebound with 3-4 mm pit
Grade 3: 15-60 sec rebound with 5-6 mm pit
Grade 4: > 2 min rebound with 8 mm pit
Despite its simplicity to assess pitting edema in a qualitative way, there is a lack of inter-rater reliability in terms of pressure and depth evaluation. Moreover, the pitting test is not reliable for all areas (such as the abdominal wall) because of the lack of the underlying bony structure in this area.
Recently, the development of the FLUID protocol (Focus Liquid Ultrasonography in Dropsy), a quantitative assessment approach in the critically ill patients using ultrasound getting compared to a standardized Pitting Test in 36 measurements body sites over 7 body parts was useful[67]. This protocol proved to be better in assessing the onset and the severity of subcutaneous edema, being more accurate and faster than the Pitting Test.
Unfortunately, the study focused on admission and a lack of dynamic observations prevented a more thorough assessment of the edema status along the ICU stay. As mentioned by the authors, the 36 measurement sites were not optimal for a rapid assessment tool so a rapid FLUID protocol would be needed for a day to day application[67].
Skin and soft tissue edema, often disregarded in the past, should nowadays be part of a critically ill patient's clinical examination. This condition shows an underlying pathological process and correlates with poor outcomes especially in critically ill patients. The time of “you have to swell to get well” should be a remnant of the past. Ultrasound guided subcutaneous edema shows promise: relatively simple and helps to detect a lower grade of edema especially in the gravity-dependent areas not always visible in a recumbent critically ill patient.
1.4. Fluid Intolerance - Putting it All Together
For the bedside clinician, an accurate assessment of fluid intolerance requires an understanding of the patient's pathology, comorbidities, temporal location in the disease state, an accurate tally of previous fluids administered, and a thorough assessment of signs of fluid intolerance.
Pathology - Shock is not a monolith. Different types of shock and different sources of shock present different risk profiles for fluid administration. For example, patients with subarachnoid hemorrhage anecdotally seem to tolerate, large volumes of IV fluid administration without a large degree of harm when compared to disease state such as sepsis, burns, or pancreatitis, all of whom have a much larger degree of capillary leak and risk of interstitial edema, thus increasing the risk of IV fluid administration. Similarly, a patient with obstructive shock due to massive pulmonary embolism already has a very high-risk profile to IV fluid administration even before any hemodynamic evaluations are performed. This initial understanding of a patient's shock state can be considered part of a clinicians pre-test probability of fluid tolerance.
Comorbidities - Similar to a patient's type of shock, their pre-existing comorbidities can increase or decrease the risk of fluid administration. A patient with pre-existing CHF or pulmonary hypertension will be less likely to tolerate IV fluid administration then a patient with no pre-existing cardiac dysfunction. A patient’s comorbidities should also be incorporated into a clinicians pretest probability of fluid tolerance.
Temporal state of a resuscitation - It is important for clinicians to understand that resuscitation is a dynamic state and the risk profile for fluid administration is not absolute but rather changes with the shifting factors of the underlying disease state. For example, early IV fluid administration in hemorrhagic shock before hemorrhage control has been achieved as the potential to lead to worsening of coagulopathy and blood loss. But once control of the bleeding has been controlled this risk profile changes. Understanding the current temporal state of the disease in question is necessary when a pretest probability of fluid tolerance.
Accurate tally of IV fluids administered - As the amount of IV fluid a patient has received increases, the likelihood that further IV fluid is going to be beneficial decreases. Simply put, if a patient has already received 10L of IV crystalloid and is still in shock, it is increasingly unlikely that the next liter administered will remedy the situation. Understanding the volume of IV fluids previously given is paramount to understanding the patients pretest probability of benefit for future fluid administration.
Once a clinician has assessed these factors and calculated a pretest probability of fluid tolerance it is now incumbent on them to perform a hemodynamic assessment looking for signs of fluid intolerance. These findings should be interpreted from the prospective the prior probability of harm/benefit and post-test probability of harm/benefit can be obtained. Clinicians should use the tools described above and illustrated in Fig xa to assess signs of fluid intolerance and incorporate these findings with their prior calculated pretest probability of fluid tolerance.
Figure 4.
Theoretical diagnostic workflow for the assessment of fluid tolerance.
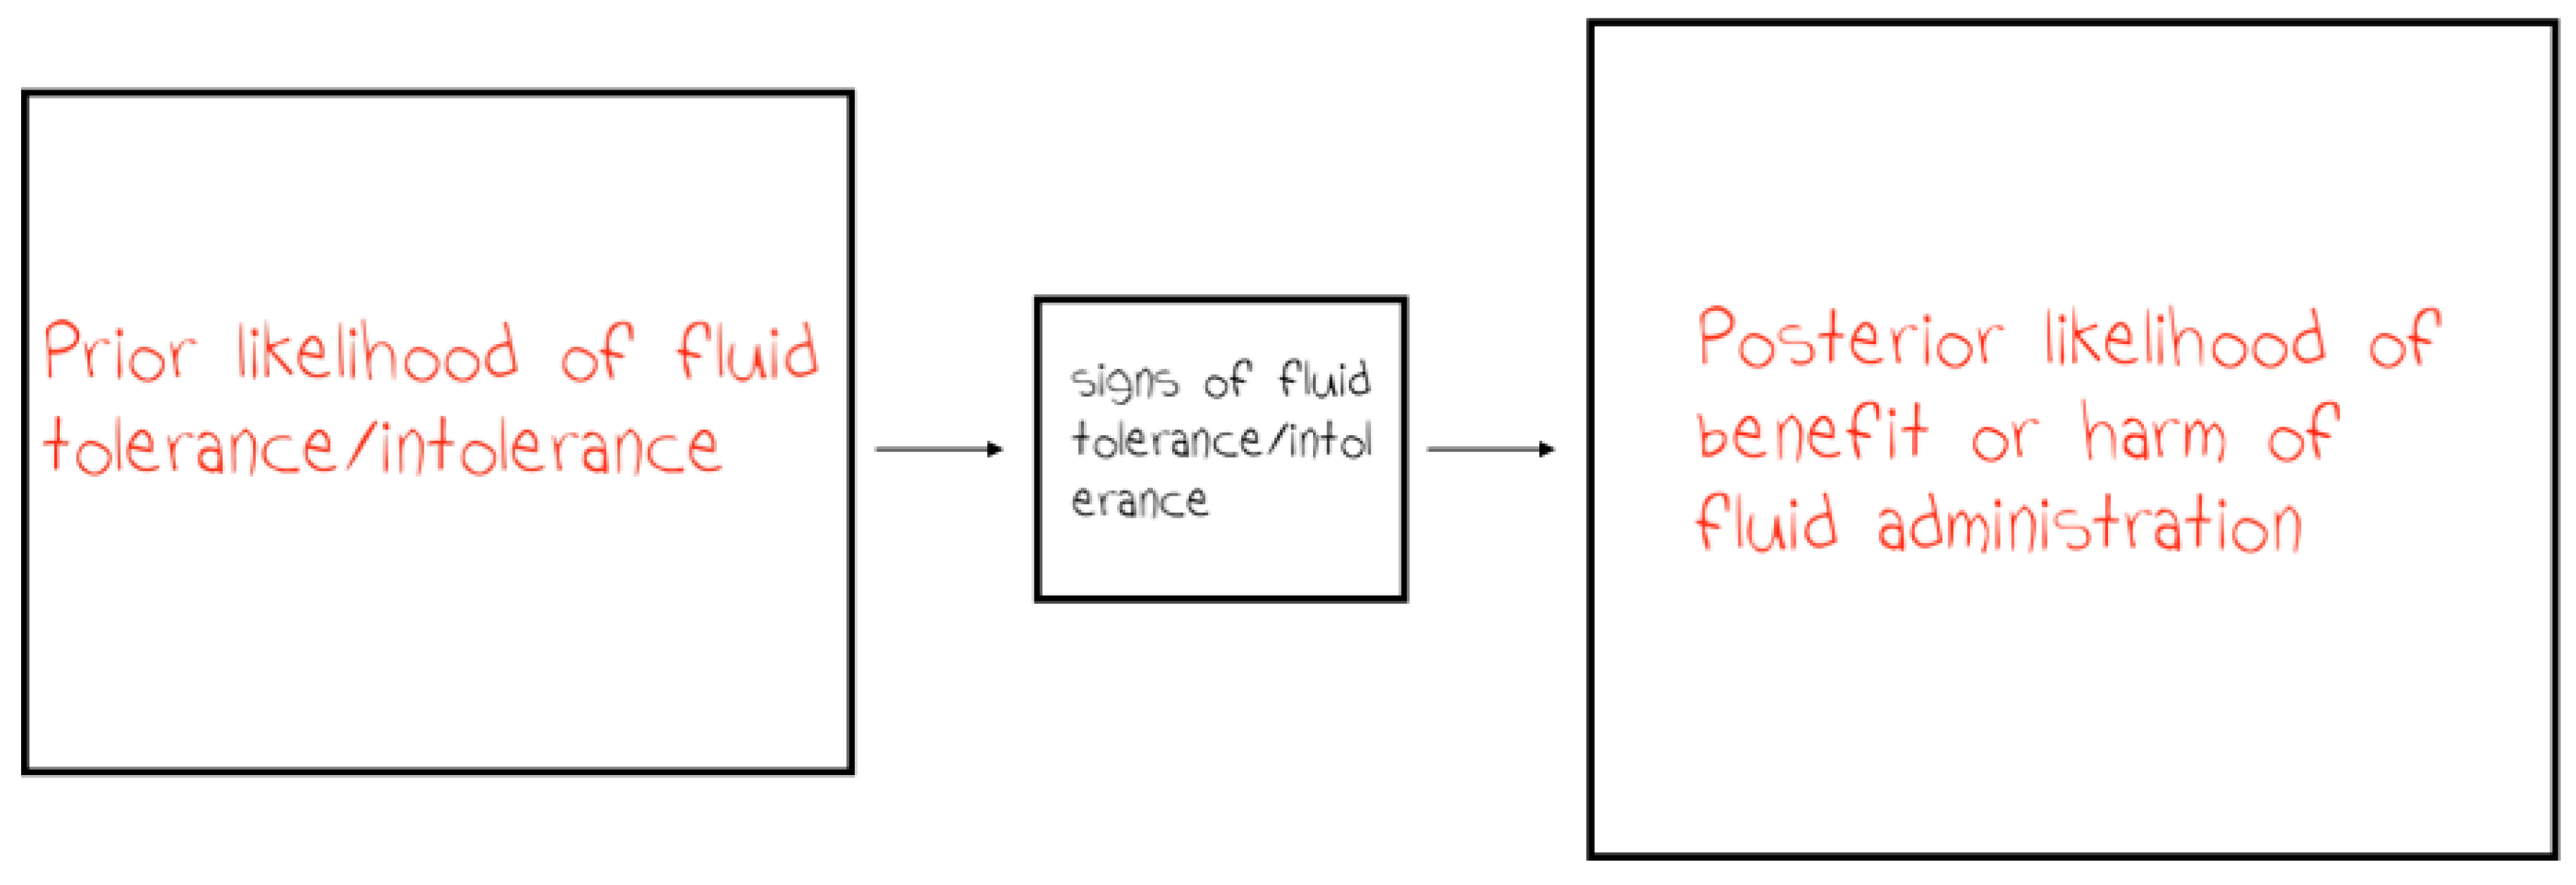
Figure 5.
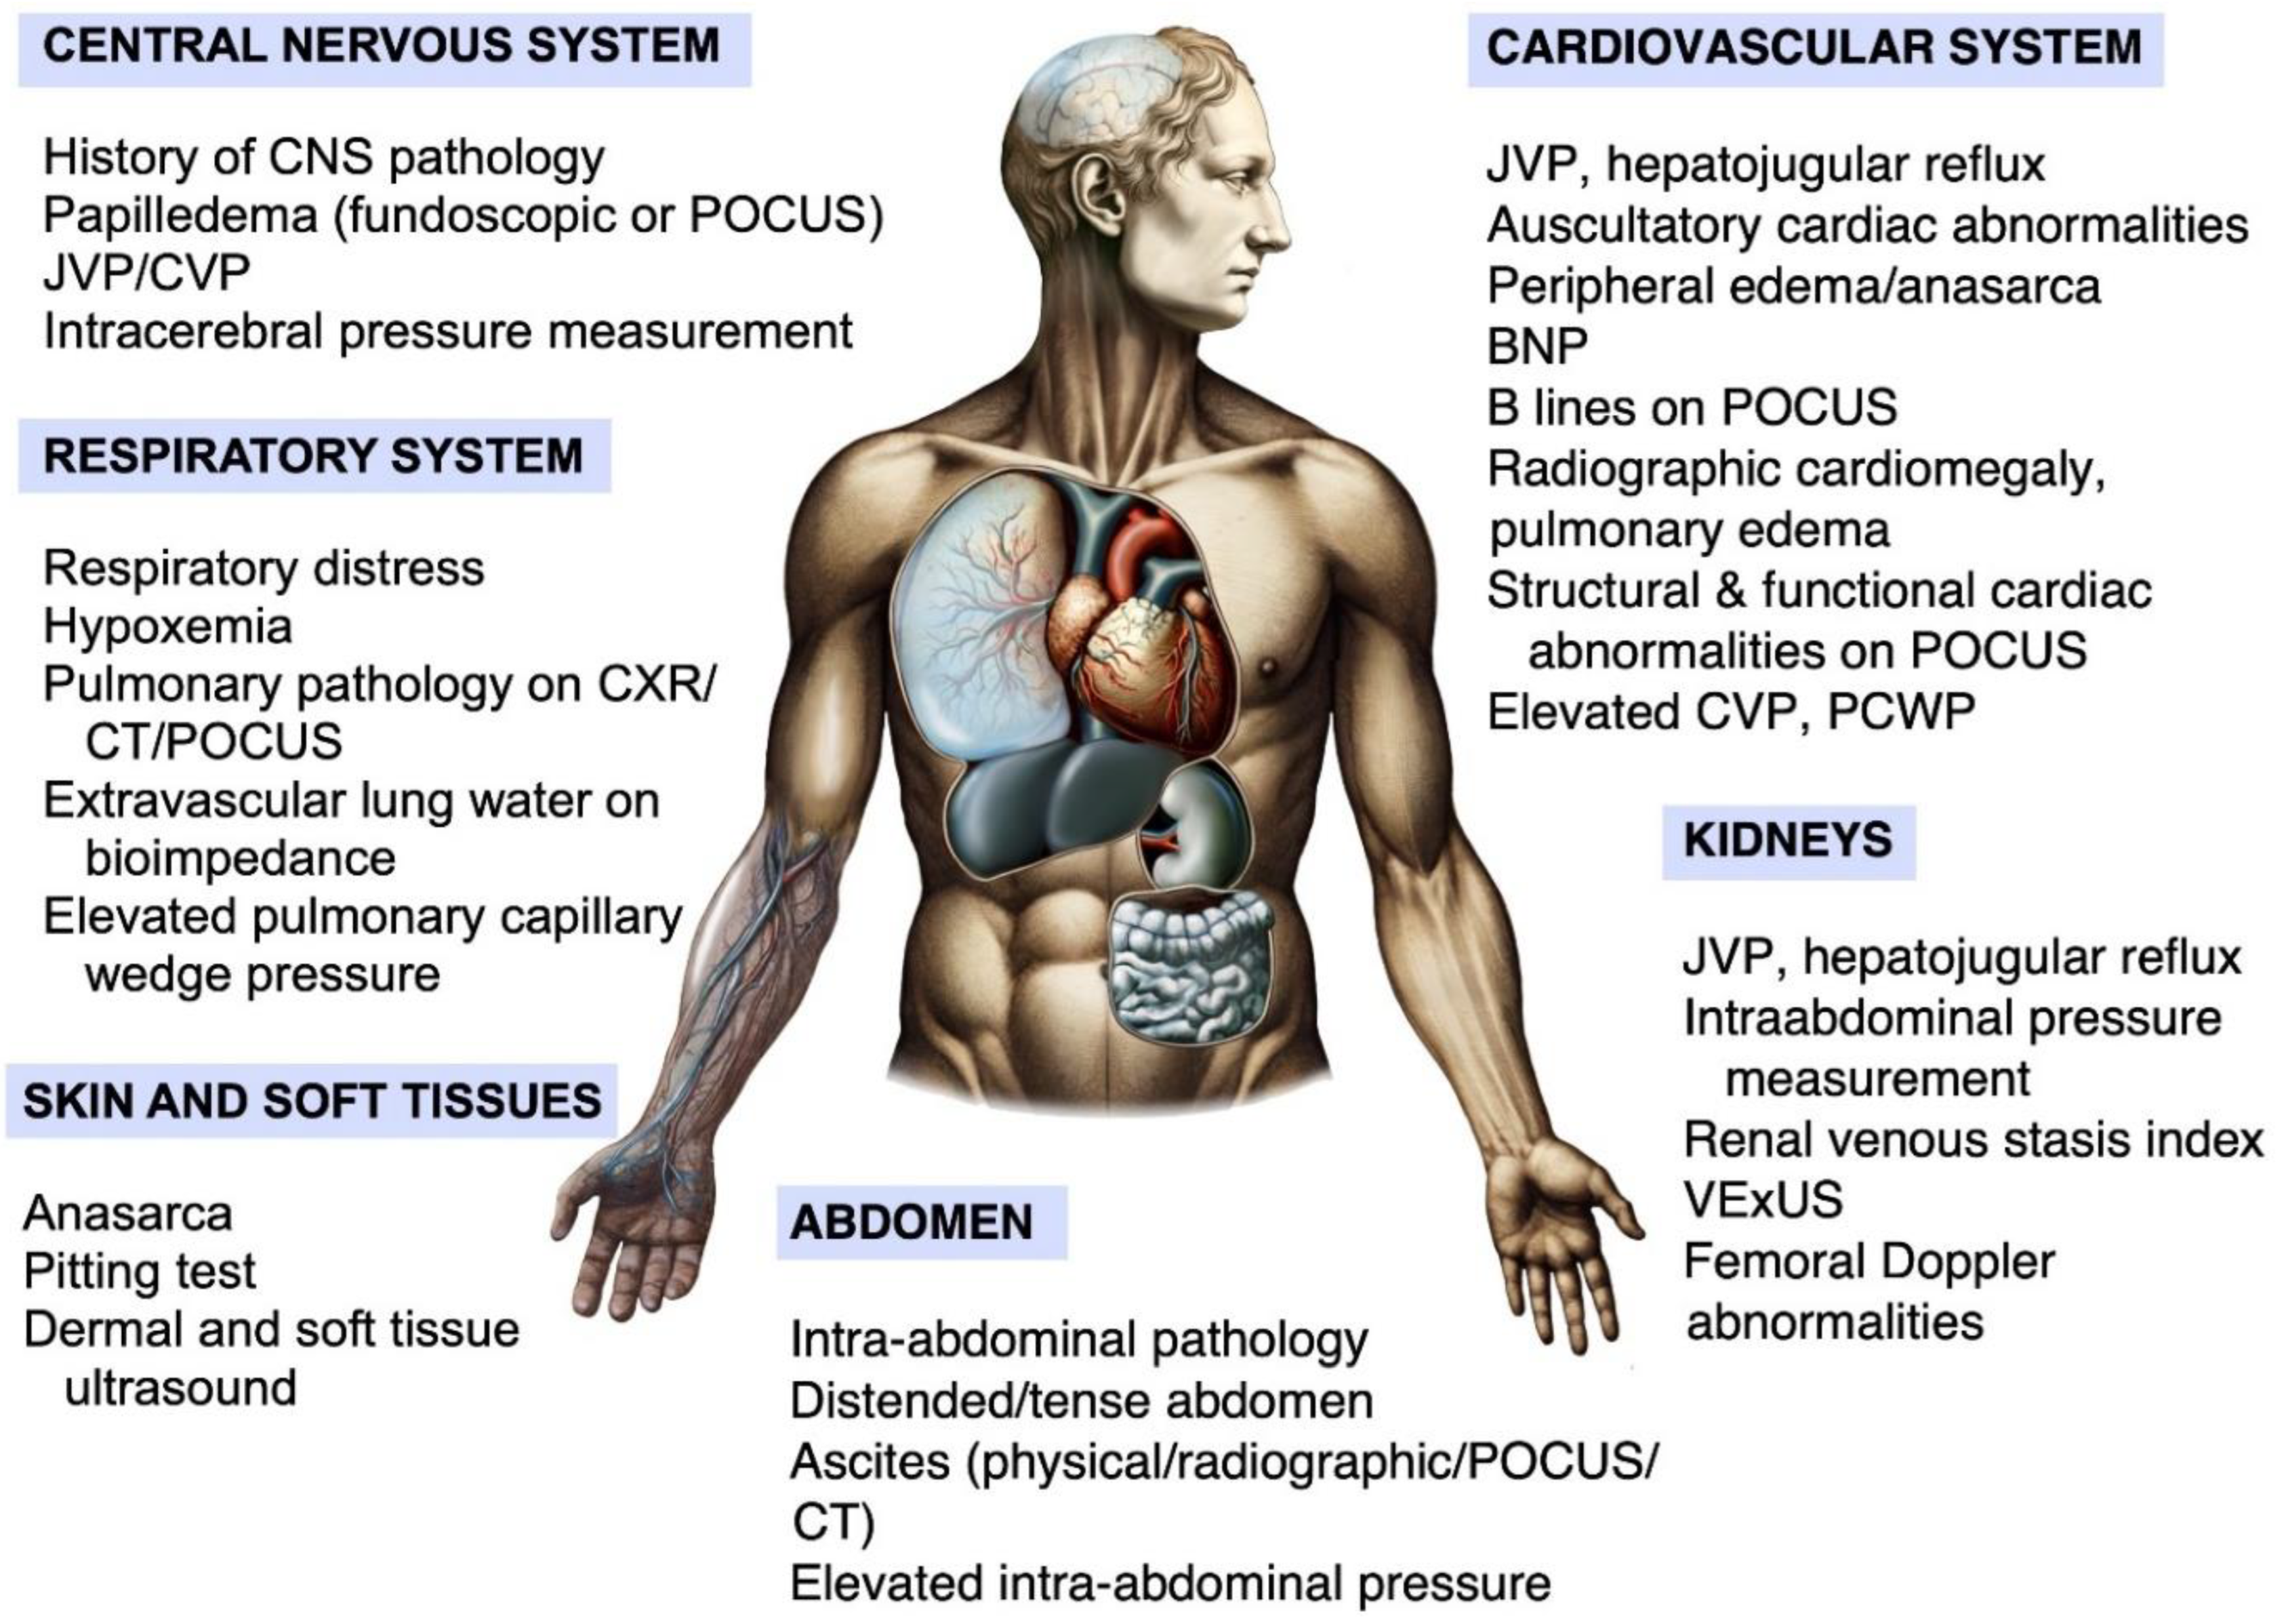
Diagram illustrating the organ systems vulnerable to fluids and the potential means to assess their tolerance. This figure summarizes the multi-systemic/ multiorgan approach to assessing fluid tolerance in critically ill patients. Each system can be evaluated using bedside assessments, laboratory tests, imaging studies, and device-based technologies.
Figure 5.
Diagram illustrating the organ systems vulnerable to fluids and the potential means to assess their tolerance. This figure summarizes the multi-systemic/ multiorgan approach to assessing fluid tolerance in critically ill patients. Each system can be evaluated using bedside assessments, laboratory tests, imaging studies, and device-based technologies.
2. Summary
It is clear from decades of literature and clinical experience that venous congestion/fluid overload can have dire consequences across several organ systems. The nuanced concept of 'fluid tolerance' warrants systematic incorporation into clinical protocols, underscoring that fluid responsiveness does not uniformly translate to a beneficial outcome following fluid administration, particularly due to the possibility of venous congestion. The management of fluids in the critically ill is a complex interplay between optimizing cardiac output and tissue perfusion via fluid infusion and circumventing the adverse effects of fluid overload, which can be present even in patients characterized as fluid-responsive. This refined strategy takes a more holistic approach, integrating a patient’s shock state, comorbidities, prior resuscitative efforts, and assessment of fluid intolerance into posterior probability of harm/benefit of IV fluid administration[68,69,70].
Incorporating multi-modal monitoring data is pivotal for a comprehensive view, promoting continuous adjustment of fluid management. This methodology reduces fluid overload complications and advances tailored patient care. By combining thorough clinical evaluations, cutting-edge imaging modalities, and state-of-the-art monitoring technology, clinicians can devise individualized fluid management plans to reduce complications and support the recovery of critically ill patients.
We have assembled here a fairly comprehensive and multi-level collection of parameters that could be used to create and validate a scale of fluid tolerance that could be used as a clinical tool when deciding on the risk:benefit ratio of fluid administration. In the meantime, these parameters can be used by clinicians to gauge the degree of fluid tolerance their patient has, a form of Gestalt, adding it to their global assessment, while awaiting further research as to the optimal scoring system and way to include it in a management strategy.
References
- Bakker J, Kattan E, Annane D, Castro R, Cecconi M, de Backer D, et al. Current practice and evolving concepts in septic shock resuscitation. Intensive Care Med 2022;48:148–63. [CrossRef]
- Bentzer P, Griesdale DE, Boyd J, MacLean K, Sirounis D, Ayas NT. Will this hemodynamically unstable patient respond to a bolus of intravenous fluids? JAMA - J Am Med Assoc 2016;316:1298–309. [CrossRef]
- Boyd JH, Frcp C, Forbes J, Nakada T, Walley KR, Frcp C, et al. Fluid resuscitation in septic shock: A positive fluid balance and elevated central venous pressure are associated with increased mortality* 2011;39:259–65. [CrossRef]
- Bagshaw SM, Brophy PD, Cruz D, Ronco C. Fluid balance as a biomarker : impact of fluid overload on outcome in critically ill patients with acute kidney injury. Crit Care 2008;12:1–3. [CrossRef]
- Monnet X, Shi R, Teboul J-L. Prediction of fluid responsiveness. What’s new? Ann Intensive Care 2022;12:46. [CrossRef]
- Kattan E, Ospina-Tascón GA, Teboul J-L, Castro R, Cecconi M, Ferri G, et al. Systematic assessment of fluid responsiveness during early septic shock resuscitation: Secondary analysis of the ANDROMEDA-SHOCK trial. Crit Care 2020;24. [CrossRef]
- Muñoz F, Born P, Bruna M, Ulloa R, González C, Philp V, et al. Coexistence of a fluid responsive state and venous congestion signals in critically ill patients: a multicenter observational proof-of-concept study. Crit Care 2024;28:52. [CrossRef]
- Aya HD, Ster IC, Fletcher N, Grounds RM, Rhodes A, Cecconi M. Pharmacodynamic analysis of a fluid challenge. Crit Care Med 2016;44:880–91. [CrossRef]
- Kattan E, Castro R, Miralles-Aguiar F, Hernandez G RP. The emerging concept of Fluid Tolerance : a position paper. J Crit Care 2022;71. [CrossRef]
- Winton, FR. The influence of venous pressure on the isolated mammalian kidney. J Physiol 1931;72:49. [CrossRef]
- Pinsky MR, García MIM, Dubin A. Significance of critical closing pressures (starling resistors) in arterial circulation. Crit Care 2024;28:1–3. [CrossRef]
- Maas JJ, De Wilde RB, Aarts LP, Pinsky MR, Jansen JR. Determination of Vascular Waterfall Phenomenon by Bedside Measurement of Mean Systemic Filling Pressure and Critical Closing Pressure in the Intensive Care Unit. Anesth Analg 2012;114:803. [CrossRef]
- Andrei S, Bar S, Nguyen M, Bouhemad B, Guinot PG. Effect of norepinephrine on the vascular waterfall and tissue perfusion in vasoplegic hypotensive patients: a prospective, observational, applied physiology study in cardiac surgery. Intensive Care Med Exp 2023;11:1–11. [CrossRef]
- Kara A, Akin S, Ince C. Monitoring microcirculation in critical illness. Curr Opin Crit Care 2016;22:444–52. [CrossRef]
- Ince, C. Hemodynamic coherence and the rationale for monitoring the microcirculation. Crit Care 2015;19:S8. [CrossRef]
- Vellinga NAR, Ince C, Boerma EC. Elevated central venous pressure is associated with impairment of microcirculatory blood flow in sepsis: A hypothesis generating post hoc analysis. BMC Anesthesiol 2013;13. [CrossRef]
- Berlin DA, Bakker J. Starling curves and central venous pressure. Crit Care 2014;19. [CrossRef]
- Ruste M, Reskot R, Schweizer R, Mayet V, Fellahi JL, Lagrèze MJ. Changes in portal pulsatility index induced by a fluid challenge in patients with haemodynamic instability and systemic venous congestion : a prospective cohort study. Ann Intensive Care 2024. [CrossRef]
- Woodcock TE, Woodcock TM. Revised Starling equation and the glycocalyx model of transvascular fluid exchange: An improved paradigm for prescribing intravenous fluid therapy. Br J Anaesth 2012;108:384–94. [CrossRef]
- Viana-Rojas JA, Argaiz E, Robles-Ledesma M, Arias-Mendoza A, Nájera-Rojas NA, Alonso-Bringas AP, et al. Venous excess ultrasound score and acute kidney injury in patients with acute coronary syndrome. Eur Hear J Acute Cardiovasc Care 2023;12:413–9. [CrossRef]
- Longino A, Martin K, Leyba K, Siegel G, Gill E, Douglas IS, et al. Correlation between the VExUS score and right atrial pressure: a pilot prospective observational study. Crit Care 2023;27:1–5. [CrossRef]
- Beaubien-Souligny W, Rola P, Haycock K, Bouchard J, Lamarche Y, Spiegel R, et al. Quantifying systemic congestion with Point-Of-Care ultrasound: development of the venous excess ultrasound grading system. Ultrasound J 2020;12. [CrossRef]
- De Backer D, Vincent JL. Should we measure the central venous pressure to guide fluid management? Ten answers to 10 questions. Crit Care 2018;22:1–6. [CrossRef]
- Rivers E, Nguyen B, Havstad S, Ressler J, Muzzin A, Knoblich B, et al. Early-goal directed therapy in the treatment of severe sepsis and septic shock. N Engl J Med 2001;345:1368–77.
- Rola P, Haycock K, Spiegel R. What every intensivist should know about the IVC. J Crit Care 2024;80. [CrossRef]
- Persichini R, Lai C, Teboul JL, Adda I, Guérin L, Monnet X. Venous return and mean systemic filling pressure: physiology and clinical applications. Crit Care 2022;26:1–11. [CrossRef]
- Malbrain MLNG, Marik PE, Witters I, Cordemans C, Kirkpatrick AW, Roberts DJ, et al. Fluid overload, de-resuscitation, and outcomes in critically ill or injured patients: A systematic review with suggestions for clinical practice. Anaesthesiol Intensive Ther 2014;46:361–80. [CrossRef]
- Finfer S, Myburgh J, Bellomo R. Intravenous fluid therapy in critically ill adults. Nat Rev Nephrol 2018;14:541–57. [CrossRef]
- Mojoli F, Bouhemad B, Mongodi S, Lichtenstein D. Lung ultrasound for critically ill patients. Am J Respir Crit Care Med 2019;199:701–14. [CrossRef]
- Lichtenstein, DA. Lung ultrasound in the critically ill. Ann Intensive Care 2014;4:1. [CrossRef]
- Koratala A, Ronco C, Kazory A. Diagnosis of Fluid Overload: From Conventional to Contemporary Concepts. Cardiorenal Med 2022;12:141–54. [CrossRef]
- Peacock WF, Albert NM, White RD, Emerman CL. Bioimpedance monitoring: Better than chest x-ray for predicting abnormal pulmonary fluid? Congest Hear Fail 2000;6:86–9. [CrossRef]
- Hammad Y, Hasanin A, Elsakka A, Refaie A, Abdelfattah D, Rahman SA, et al. Thoracic fluid content: a novel parameter for detection of pulmonary edema in parturients with preeclampsia. J Clin Monit Comput 2019;33:413–8. [CrossRef]
- Ware LB, Matthay MA. Clinical practice. Acute pulmonary edema. N Engl J Med 2005;353:2788–96. [CrossRef]
- Jozwiak M, Teboul JL, Monnet X. Extravascular lung water in critical care: recent advances and clinical applications. Ann Intensive Care 2015;5:1–13. [CrossRef]
- López-Candales A, Edelman K. Shape of the right ventricular outflow Doppler envelope and severity of pulmonary hypertension. Eur J Echocardiogr 2012;13:309–16. [CrossRef]
- Vieillard-Baron A, Millington SJ, Sanfilippo F, Chew M, Diaz-Gomez J, McLean A, et al. A decade of progress in critical care echocardiography: a narrative review. Intensive Care Med 2019;45:770–88. [CrossRef]
- Nagueh SF, Smiseth OA, Appleton CP, Byrd BF, Dokainish H, Edvardsen T, et al. Recommendations for the Evaluation of Left Ventricular Diastolic Function by Echocardiography: An Update from the American Society of Echocardiography and the European Association of Cardiovascular Imaging. J Am Soc Echocardiogr 2016;29:277–314. [CrossRef]
- Orde S, Slama M, Hilton A, Yastrebov K, McLean A. Pearls and pitfalls in comprehensive critical care echocardiography. Crit Care 2017;21. [CrossRef]
- Brault C, Marc J, Mercado P, Diouf M, Tribouilloy C, Zerbib Y, et al. Estimation of Pulmonary Artery Occlusion Pressure Using Doppler Echocardiography in Mechanically Ventilated Patients. Crit Care Med 2020;48:E943–50. [CrossRef]
- Magder, S. Right Atrial Pressure in the Critically Ill: How to Measure, What Is the Value, What Are the Limitations? Chest 2017;151:908–16. [CrossRef]
- Rako ZA, Yogeswaran A, Yildiz S, Weidemann P, Zedler D, da Rocha BB, et al. Liver stiffness is associated with right heart dysfunction, cardiohepatic syndrome, and prognosis in pulmonary hypertension. J Heart Lung Transplant 2024;43:1105. [CrossRef]
- Beaubien-Souligny W, Benkreira A, Robillard P, Bouabdallaoui N, Chassé M, Desjardins G, et al. Alterations in Portal Vein Flow and Intrarenal Venous Flow Are Associated With Acute Kidney Injury After Cardiac Surgery: A Prospective Observational Cohort Study. J Am Heart Assoc 2018;7. [CrossRef]
- Gómez-Rodríguez C, Tadeo-Espinoza H, Solis-Huerta F, Leal-Villarreal MA de J, Guerrero-Cabrera P, Cruz N, et al. Hemodynamic Evaluation of Right-Sided Congestion With Doppler Ultrasonography in Pulmonary Hypertension. Am J Cardiol 2023;203:459–62. [CrossRef]
- Husain-Syed F, Birk HW, Ronco C, Schörmann T, Tello K, Richter MJ, et al. Doppler-Derived Renal Venous Stasis Index in the Prognosis of Right Heart Failure. J Am Heart Assoc 2019;8. [CrossRef]
- Fujii K, Nakayama I, Izawa J, Iida N, Seo Y, Yamamoto M, et al. Association between intrarenal venous flow from Doppler ultrasonography and acute kidney injury in patients with sepsis in critical care: a prospective, exploratory observational study. Crit Care 2023;27:278. [CrossRef]
- Spiegel R, Teeter W, Sullivan S, Tupchong K, Mohammed N, Sutherland M, et al. The use of venous Doppler to predict adverse kidney events in a general ICU cohort. Crit Care 2020;24. [CrossRef]
- Argaiz ER, Rola P, Haycock KH, Verbrugge FH. Fluid management in acute kidney injury: from evaluating fluid responsiveness towards assessment of fluid tolerance. Eur Hear Journal Acute Cardiovasc Care 2022;11:786–93. [CrossRef]
- Argaiz, ER. VExUS Nexus: Bedside Assessment of Venous Congestion. Adv Chronic Kidney Dis 2021;28:252–61. [CrossRef]
- Prager R, Arntfield R, Wong MYS, Ball I, Lewis K, Rochwerg B, et al. Venous congestion in septic shock quantified with point-of-care ultrasound: a pilot prospective multicentre cohort study. Can J Anaesth 2024. [CrossRef]
- De Laet IE, Malbrain MLNG, De Waele JJ. A Clinician’s Guide to Management of Intra-Abdominal Hypertension and Abdominal Compartment Syndrome in Critically Ill Patients. Crit Care 2020;24:1–9. [CrossRef]
- Kirkpatrick AW, Roberts DJ, De Waele J, Jaeschke R, Malbrain MLNG, De Keulenaer B, et al. Intra-abdominal hypertension and the abdominal compartment syndrome: Updated consensus definitions and clinical practice guidelines from the World Society of the Abdominal Compartment Syndrome. Intensive Care Med 2013;39:1190–206. [CrossRef]
- Perez-Calatayud AA, Carrillo-Esper R, Anica-Malagon ED, Briones-Garduño JC, Arch-Tirado E, Wise R, et al. Point-of-care gastrointestinal and urinary tract sonography in daily evaluation of gastrointestinal dysfunction in critically ill patients (GUTS Protocol). Anaesthesiol Intensive Ther 2018;50:40–8. [CrossRef]
- Wong A, Vieillard-Baron A, Malbrain MLNG. Emergency bedside ultrasound: benefits as well as caution - part 1. General. Curr Opin Crit Care 2019;25:613–21. [CrossRef]
- Malbrain MLNG, De Tavernier B, Haverals S, Slama M, Vieillard-Baron A, Wong A, et al. Executive summary on the use of ultrasound in the critically ill: consensus report from the 3rd Course on Acute Care Ultrasound (CACU). Anaesthesiol Intensive Ther 2017;49:393–411. [CrossRef]
- Severgnini P, Inzigneri G, Olvera C, Fugazzola C, Mangini M, Padalino P, et al. New and old tools for abdominal imaging in critically ill patients. Acta Clin Belg 2007;62:173–82. [CrossRef]
- Malbrain MLNG, Chiumello D, Pelosi P, Bihari D, Innes R, Ranieri VM, et al. Incidence and prognosis of intraabdominal hypertension in a mixed population of critically ill patients: A multiple-center epidemiological study*. Crit Care Med 2005;33:315–22.
- Aldabal L, Bahammam AS. Cheyne-stokes respiration in patients with heart failure. Lung 2010;188:5–14. [CrossRef]
- Benkreira A, Beaubien-Souligny W, Mailhot T, Bouabdallaoui N, Robillard P, Desjardins G, et al. Portal Hypertension Is Associated With Congestive Encephalopathy and Delirium After Cardiac Surgery. Can J Cardiol 2019;35:1134–41. [CrossRef]
- Ameloot K, Genbrugge C, Meex I, Eertmans W, Jans F, De Deyne C, et al. Is venous congestion associated with reduced cerebral oxygenation and worse neurological outcome after cardiac arrest? Crit Care 2016;20:1–8. [CrossRef]
- Minato S, Ookawara S, Ito K, Hayasaka H, Kofuji M, Uchida T, et al. Continuous monitoring of changes in cerebral oxygenation during hemodialysis in a patient with acute congestive heart failure. J Artif Organs 2020;23:292–5. [CrossRef]
- Selhorst JB, Gudeman SK, Butterworth JF, Harbison JW, Miller JD, Becker DP. Papilledema after acute head injury. Neurosurgery 1985;16:357–63. [CrossRef]
- Stead GA, Cresswell F V., Jjunju S, Oanh PKN, Thwaites GE, Donovan J. The role of optic nerve sheath diameter ultrasound in brain infection. ENeurologicalSci 2021;23. [CrossRef]
- Canac N, Jalaleddini K, Thorpe SG, Thibeault CM, Hamilton RB. Review: pathophysiology of intracranial hypertension and noninvasive intracranial pressure monitoring. Fluids Barriers CNS 2020;17. [CrossRef]
- Danziger J, Chen K, Cavender S, Lee J, Feng M, Mark RG, et al. Admission Peripheral Edema, Central Venous Pressure, and Survival in Critically Ill Patients. Ann Am Thorac Soc 2016;13:705–11. [CrossRef]
- Chen C, Lee J, Johnson AE, Mark RG, Celi LA, Danziger J. Right Ventricular Function, Peripheral Edema, and Acute Kidney Injury in Critical Illness. Kidney Int Reports 2017;2:1059. [CrossRef]
- Zhang W, Gu Y, Zhao Y, Lian J, Zeng Q, Wang X, et al. Focused liquid ultrasonography in dropsy protocol for quantitative assessment of subcutaneous edema. Crit Care 2023;27:1–12. [CrossRef]
- De Backer D, Aissaoui N, Cecconi M, Chew MS, Denault A, Hajjar L, et al. Intensive Care Med 2022. [CrossRef]
- De Backer D, Cecconi M, Chew MS, Hajjar L, Monnet X, Ospina-Tascón GA, et al. A plea for personalization of the hemodynamic management of septic shock. Crit Care 2022;26:1–13. [CrossRef]
- Pfortmueller CA, Dabrowski W, Wise R, van Regenmortel N, Malbrain MLNG. Fluid accumulation syndrome in sepsis and septic shock: pathophysiology, relevance and treatment—a comprehensive review. Ann Intensive Care 2024;14. [CrossRef]
Disclaimer/Publisher’s Note: The statements, opinions and data contained in all publications are solely those of the individual author(s) and contributor(s) and not of MDPI and/or the editor(s). MDPI and/or the editor(s) disclaim responsibility for any injury to people or property resulting from any ideas, methods, instructions or products referred to in the content. |
© 2025 by the authors. Licensee MDPI, Basel, Switzerland. This article is an open access article distributed under the terms and conditions of the Creative Commons Attribution (CC BY) license (http://creativecommons.org/licenses/by/4.0/).
Copyright: This open access article is published under a Creative Commons CC BY 4.0 license, which permit the free download, distribution, and reuse, provided that the author and preprint are cited in any reuse.


