
Submitted:
19 September 2025
Posted:
22 September 2025
You are already at the latest version
Abstract
ABSTRACT
Background:
This prospective correlation study investigated the relationship between smudge cells, surface CD20, and soluble CD20 in untreated chronic lymphocytic leukemia (CLL) patients.
Materials and Methods:
Blood smears were prepared manually from patient samples and stained using May-Grunwald Giemsa. B-cell phenotyping was performed at diagnosis using a FACS Canto II flow cytometer (Becton Dickinson, CA, USA). Soluble CD20/MS4A1 levels were measured using competitive ELISA.
Results:
A significant inverse correlation was observed between smudge cells and soluble CD20 levels (r = -0.51, p = 0.006). Similarly, surface CD20 mean fluorescence intensity (MFI) exhibited a significant inverse relationship with smudge cell percentages (r = -0.36, p = 0.04). A weak positive association was noted between soluble CD20/MS4A1 and surface CD20 MFI (Spearman’s rho = 0.34, p = 0.064). Soluble CD20 levels ≥2.2 ng/dL predicted higher smudge cell percentages with a sensitivity of 69% and specificity of 86% (area under the curve (AUC) = 0.75, 95% CI: 0.57–0.93, p = 0.021).
Conclusion:
This study highlights a significant inverse relationship between smudge cells and both soluble and surface CD20 in CLL patients. These findings suggest that soluble CD20 may be key to understanding smudge cell pathophysiology and could serve as a potential prognostic marker in CLL.
Keywords:
Chronic Lymphocytic Leukemia
; soluble CD20
; CD20 expression
; smudge cell
1. Introduction
Chronic lymphocytic leukemia (CLL) is the most common leukemia in the Western hemisphere [1]. The condition primarily affects older individuals [2]. With improvements in disease management, the 5-year relative survival rate for CLL patients improved from 65.1% in 1975 to a projected 87.2% in 2021 [3]. CLL treatment has experienced a significant shift, moving from chemoimmunotherapy (CIT) to the use of targeted novel agents such as Bruton Tyrosine Kinase inhibitors (BTKi) and the B-cell lymphoma 2 (BCL2) inhibitor venetoclax. These targeted therapies are now approved as monotherapies or combined with anti-CD20 monoclonal antibodies. Their synergistic effects have naturally prompted the investigation of novel combination therapies involving multiple new agents [4−6].
Smudge cells (SCs), also called Gumprecht shadows, smear cells, or basket cells, are fragmented CLL B cells found in the blood smears of CLL patients. They do not possess any discernible cytoplasmic membrane or nuclear structure. Studies by Nowakowski et al. have demonstrated that the proportion of SCs in routine blood smears is an independent prognostic indicator in CLL patients [7,8]. Another study found that 66.7% of newly diagnosed Egyptian B-CLL patients had a smudge cell percentage below 30%, with a significant correlation between a low smudge cell percentage (below 30%) and advanced-stage disease. It was also determined that patients with more than 30% smudge cells at diagnosis had higher survival rates [9]. Similarly, research by Sall A et al. showed that, in line with the suggestion by Nowakowski et al. [8], using a 30% cut-off value for SC percentage is associated with disease prognosis [10]. The mechanism underlying the formation of SCs remains unclear. Nowakowski et al. have identified an inverse relationship between the formation of SCs and vimentin, a cytoskeletal protein [7]. They have explained this finding by noting that high vimentin expression in lymphocytes is associated with increased cellular rigidity [11].
In patients with CLL, it is thought that soluble CD20 may originate from the breakdown of leukemic cells. It has been previously hypothesized that soluble CD20 might play a role in SC formation [12]. In this analysis, we explored the possible relationship between smudge cells, surface CD20, and soluble CD20 in patients with CLL.
2. Materials and Methods
2.1. Patients
This experimental analysis included patients with CLL diagnosis who were not on treatment. A sample size of 30 patients was reached during the data collection, considering accessibility to patients meeting the criteria and the minimum threshold for correlation studies. Since medications used in CLL treatment can cause changes in smudge cell percentages and surface/soluble CD20 levels, patients were selected among treatment-naïve patients.
The diagnosis of CLL was made by flow cytometry, which confirmed the presence of at least 5000/μL circulating monoclonal B cells with a CLL immunophenotype which includes the expression of CD19, CD5, and CD23, weak expression of CD20, and either kappa or lambda light chains. In addition, there may be expression of CD43 and CD200, but CD79b is expected to be weak or missing [13].
Every participant gave informed consent, and the research followed the Helsinki Declaration's strict guidelines for clinical practice. The Institutional Ethics Committee approved the study (Approval number: 09.2022.1637). We recorded demographic characteristics, laboratory data including leukocyte, lymphocyte, hemoglobin, and platelet counts, and genetic test results from the hospital's computerized database.
2.2. Peripheral Blood Smears of the Patients
We prepared blood smears from blood samples using a manual technique consistently performed by the same technician. The May-Grunwald Giemsa dye was used to stain the slides. The sample from each patient was split into two slides, which were inspected by the same technician who didn't know about the patient's progress or the clinical facts. The findings from the two assessments were compared in order; if there was a significant difference between the assessments that went beyond three percent, a third assessment was conducted, and the average of the three assessments was calculated.
The proportion of SC was assessed by calculating the proportion of total lymphocytes, rather than as a percentage of total white blood cells (WBC), using the following formula: Number of SCs × 100/Total lymphocytes (SCs + intact lymphocytes)
2.3. Immunophenotyping
The B-cell phenotypic was analyzed using the FacsCanto II flow cytometer (Becton Dickinson, CA, USA) at the time of diagnosis. Using this method, the levels of CD20 MFI in CLL cells were determined.
2.4. Soluble CD20/MS4A1 (Membrane Spanning 4-Domains A1) Levels Analysis via Competitive ELISA (Enzyme-Linked Immunoassay)
A 5cc blood sample was withdrawn from all patients and healthy subjects. It was then centrifuged at room temperature (3000 rpm), and the resulting serum samples were stored at -80 °C until subsequent analysis. The competitive ELISA kit, cataloged as LG-EH14877 by FARMASINA, was utilized. This method employs a competitive ELISA protocol to quantitatively determine levels of soluble CD20/MS4A1. Dispensing specific antibodies against soluble CD20/MS4A1 into 96-well plates allowed free soluble CD20 and biotin-bound CD20 to compete for binding. The plates are then filled with the streptavidin-Horradish Peroxidase (HRP) combination after washing procedures to eliminate unbound antibodies. Tetramethylbenzidine, a particular substrate, is then introduced, starting a colorimetric reaction that is catalyzed by the HRP enzyme. The reaction is stopped with the addition of a stop solution, and the amount of soluble CD20/MS4A1 is quantified by measuring absorbance at 450 nm. The recognized unit indicating the soluble CD20/MS4A1 levels was ng/dL.
2.5. Data Analysis
The statistical analysis was conducted using SPSS 28.0.1.1 software. Frequency and cross-tabulation tables were investigated in these investigations. The Shapiro-Wilk Test was used to determine whether the data distribution was normal. For skewed data, non-parametric tests including the Spearman correlation and the Kruskal-Wallis test were used. A significance level of p<0.05 was adopted. The ROC curve was employed to establish the threshold value for soluble CD20, which predicts the occurrence of smudge formation in CLL patients.
3. Results
Patients ranged in age from 47 to 83 years, with 20 out of 30 (66.7%) being male. The median age of the patient population was 65 years. Thirty of the study participants had at least three of the B symptoms (fever, sweats at night, and weight loss) at the time of diagnosis. Lymphadenopathy was observed in 11 out of 30 (36%) of the patients, while six out of 30 (20%) had hepatosplenomegaly. The patients were divided into the following Rai stages: 13 patients (43.3%) were in stage 0, 7 patients (23.3%) were in stage 1, 3 patients (10%) were in stage 2, 6 patients (20%) were in stage 3, and 1 patient (3.3%) was in stage 4 (Table 1).
Median white blood cell, lymphocyte count, hemoglobin value, and platelet count were 27.5 x10³/µL, 21.9 x10³ cells/µL, 13.05 g/dL, and 184 x103/µL (Table 1). In flow cytometric analysis, median CD20 MFI on cell surfaces was 227. Soluble CD20/MS4A1 levels in competitive ELISA analysis were 2.11 ng/dL. Median percentage of SCs on each high-power field high-power field was 25.75% (Table 2).
A weak positive relationship was found between soluble CD20/MS4A1 and surface CD20 MFI, but it was on the edge of statistical significance (Spearman’s rho = 0.34, p = 0.064). Spearman's correlation test revealed a significant inverse association between CD20 MFI on cell surfaces and the smudge cell ratio (r = -0.36, p = 0.04). Additionally, a significant inverse relationship was observed between levels of soluble CD20 antigen and the percentage of smudge cells, indicating a moderate correlation (correlation coefficient (r) = -0.51, p = 0.006) (Figure 1A–C and Table 3). To determine the cut-off value for soluble CD20 predicting smudge formation in CLL patients, we performed ROC curve analysis. The median percentage of smudge cells, which was 25.75%, was established as the cut-off value. With a sensitivity of 69% and specificity of 86% (area under the curve (95% CI): 0.75 [0.57 to 0.93], p = 0.021), soluble CD20 at a cut-off of 2.2 ng/dL predicted more smudge cells (Figure 1D).
4. Discussion
In this investigation, the percentage of SCs and soluble CD20 antigen levels were found to be significantly inversely correlated. Similarly, we found an inverse relationship between the amount of surface CD20 antigen and the smudge cell ratio. Further, we demonstrated that a cut-off value for soluble CD20 of 2.2 ng/dL or less predicts smudge cell formation. A weak positive relationship was found between soluble CD20/MS4A1 and surface CD20 MFI. These observations may potentially lead to the development of smudge cell production.
Smudge cells, occasionally detected in normal peripheral blood films (PBFs) [14, are also commonly present in abnormal PBFs, particularly among individuals diagnosed with acute and chronic leukemia, though typically in higher concentrations in CLL [15]. The exact process responsible for the presence of SCs in peripheral blood films is not well known.
According to Nowakowski et al., soluble CD20 in CLL patients' plasma may be liberated from leukemic cells, and membrane shedding may result in the development of smudge cells. They also hypothesized that elevated levels of soluble CD20 might be associated with a poor prognosis in CLL [16]. However, they did not test this hypothesis. Our findings demonstrated that soluble CD20 in the plasma of CLL patients is inversely related with smudge cell formation. Although the exact mechanism of CD20 antigens is unknown, we postulate that most probably CD20 antigens reduce the fragility of leukemic cells by supporting the cytoskeletal proteins. Our results support the hypothesis that surface CD20 expression and soluble CD20 levels are interrelated. Both of those parameters predict in vivo cell fragility.
A previous study pointed out that CD20 expression is related with trisomy 12 and good response to rituximab therapy [17]. A separate investigation examining the influence of CD20 expression on disease outcomes found that individuals with newly diagnosed, untreated chronic lymphocytic leukemia (CLL) with high levels of CD20 expression experience improved survival without the need for therapy. However, they could not demonstrate any relationship between CD20 expression and rituximab response [16]. So, the conclusions of studies assessing the impact of CD20 expression on survival are conflicting. Several confounders should have been considered. Since we did not perform survival analyses, we cannot draw a definite conclusion regarding the impact of CD20 expression or soluble CD20 levels on disease outcomes. However, we hypothesized that the presence of soluble CD20 may affect disease progression and response to therapy. For instance, we could use soluble CD20 levels as a biomarker to track disease activity or assess the effectiveness of treatment. It may also make CD20-targeting therapies less effective because therapeutic antibodies might bind to circulating CD20 proteins and stop them from getting to leukemic cells.
The mechanism of smudge cell formation has a key role in the pathophysiology of lymphocytic leukemia. It is believed to be associated with changes in the structural properties of lymphocytes that make them more fragile or susceptible to fragmentation than normal [15,18,19]. In this study, we provided a cut-off value for soluble CD20, which could potentially aid in predicting the extent of smear cell presence.
The small sample size is a limitation of this study. However, the primary aim was to examine the relationships between laboratory parameters. Nevertheless, it was sufficient to demonstrate significant relationships. Due to the prolonged overall survival of CLL patients, there was insufficient observation time to evaluate the effects of smudge cell count, surface CD20, and soluble CD20 levels on prognosis and overall survival.
5. Conclusions
There is a significant and inverse relationship between smudge cells and both surface CD20 and soluble CD20/MS4A1. Soluble CD20 and surface CD20 expression are correlated. Both of those markers may be related to in vivo cell fragility.
Author Contributions
All writers have made substantial contributions to the preparation of this work and should be granted authorship rights. I.A., T.T., and O.C. participated in the article's design process. The data collection and analysis of the investigations were assisted by I.T., A.B., B.K., E.K., M.E.Y., and M.A.G. O.C. as well as T.T. were in charge of writing the manuscript and doing the statistical analysis. A.T.T., I.A., A.F.Y., T.T., and O.C. contributed to interpreting intellectual content and data analysis. In addition, every contributor contributed to the case report's authoring, drafting, and editing. Finally, each author contributed to the case report's final changes.
Funding
The authors received no specific funding for this work.
Indicated Consent of the Patient
Before their participation, all study participants gave their informed consent.
Data Accessibility Statement
The corresponding author can provide the data that supports the study's conclusions upon request. Because of ethical and privacy concerns, they are not available to the public.
Acknowledgments
The authors gratefully acknowledge The Büyük Kulüp (Cercle d'Orient), Istanbul, Turkey for kindly providing the diagnostic kits used in this study.
Declaration of Competing Interests
The authors declare that The Büyük Kulüp (Cercle d'Orient), Istanbul, Turkey provided the diagnostic kits used in this study. The company had no role in study design, data collection, data analysis, or manuscript preparation.
Clinical Trial Registration
For this inquiry, registration in a clinical trial database was not necessary.
Ethics of Approval Statement
Every subject provided informed consent, and the research adhered to strict clinical guidelines stated in the Helsinki Declaration. The Institutional Ethics Committee approved the institution (Approval number: 09.2022.1637).
References
- Siegel RL, Miller KD, Fuchs HE, Jemal A. Cancer statistics, 2022. CA: a cancer journal for clinicians. 2022;72(1).
- Hallek M, Al-Sawaf O. Chronic lymphocytic leukemia: 2022 update on diagnostic and therapeutic procedures. American journal of hematology. 2021;96(12):1679-1705.
- Cronin KA, Ries LA, Edwards BK. The surveillance, epidemiology, and end results (SEER) program of the National Cancer Institute. Cancer. 2014;120:3755-3757.
- Kipps TJ, Choi MY. Targeted therapy in chronic lymphocytic leukemia. The Cancer Journal. 2019;25(6):378-385.
- Awan FT, Al-Sawaf O, Fischer K, Woyach JA. Current perspectives on therapy for chronic lymphocytic leukemia. American Society of Clinical Oncology Educational Book. 2020;40:320-329.
- Darwiche W, Gomila C, Ouled-Haddou H, et al. Ascorbic acid (vitamin C) synergistically enhances the therapeutic effect of targeted therapy in chronic lymphocytic leukemia. Journal of experimental & clinical cancer research. 2020;39:1-17.
- Nowakowski GS, Hoyer JD, Shanafelt TD, et al. Using smudge cells on routine blood smears to predict clinical outcome in chronic lymphocytic leukemia: a universally available prognostic test. Elsevier; 2007:449-453.
- Nowakowski GS, Hoyer JD, Shanafelt TD, et al. Percentage of smudge cells on routine blood smear predicts survival in chronic lymphocytic leukemia. Journal of Clinical Oncology. 2009;27(11):1844-1849.
- Abaza HM, Eltawil AE, Safwat NA, Elzeiny WS. The prognostic significance of dipeptidyl peptidase IV (CD26) expression in B-cell chronic lymphocytic leukemia. The Egyptian Journal of Haematology. 2021;46(1):11-22.
- Sall A, Seck M, Fall S, et al. Smudge cells percentage on blood smear is a reliable prognostic marker in chronic lymphocytic leukemia. Hematology, Transfusion and Cell Therapy. 2022;44(1):63-69.
- Brown MJ, Hallam JA, Colucci-Guyon E, Shaw S. Rigidity of circulating lymphocytes is primarily conferred by vimentin intermediate filaments. The Journal of Immunology. 2001;166(11):6640-6646.
- Nowakowski GS, Hoyer JD, Shanafelt TD, et al. Percentage of smudge cells on routine blood smear predicts survival in chronic lymphocytic leukemia. J Clin Oncol. Apr 10 2009;27(11):1844-9. doi:10.1200/jco.2008.17.0795.
- Rawstron A, Kreuzer K, Soosapilla A, et al. Pilot study to assess reagent and instrument quality for reproducible diagnosis of chronic lymphocytic leukemia: an ESCCA and ERIC harmonisation project. HAEMATOLOGICA. 2016;101:226-227.
- Gulati G, Ly V, Uppal G, Gong J. Feasibility of counting smudge cells as lymphocytes in differential leukocyte counts performed on blood smears of patients with established or suspected chronic lymphocytic leukemia/small lymphocytic lymphoma. Laboratory Medicine. 2017;48(2):137-147.
- Johansson P, Eisele L, Klein-Hitpass L, et al. Percentage of smudge cells determined on routine blood smears is a novel prognostic factor in chronic lymphocytic leukemia. Leukemia research. 2010;34(7):892-898.
- Nowakowski GS, Hoyer JD, Shanafelt TD, et al. Percentage of smudge cells on routine blood smear predicts survival in chronic lymphocytic leukemia. Journal of Clinical Oncology. 2009;27(11):1844.
- Tam CS, Otero-Palacios J, Abruzzo LV, et al. Chronic lymphocytic leukaemia CD20 expression is dependent on the genetic subtype: a study of quantitative flow cytometry and fluorescent in-situ hybridization in 510 patients. British journal of haematology. 2008;141(1):36-40.
- Gohary NMIE, Omar HM, Omran AAE-M, Taleb FMA. Brief Overview about Chronic Lymphocytic Leukemia Markers and Diagnosis. Tobacco Regulatory Science (TRS). 2023:4096-4108.
- Panda D, Tejwani N, Mehta A. Chronic lymphocytic leukemia: Current approach to lab diagnosis. Journal of Current Oncology. 2022;5(1):39.
Figure 1.
(A) A weak positive relationship was found between soluble CD20/MS4A1 and surface CD20 MFI. (B) Spearman correlation test demonstrated a significant inverse association between CD20 MFI on cell surfaces and the smudge cell ratio. (C) There was a significant inverse relationship between the levels of soluble CD20 antigen and the percentage of smudge cells, indicating a moderate relationship. (D) These findings show that the cut-off value of soluble CD20 predicting smudge cell formation is 2.2 ng/dL, and this value is statistically significant.
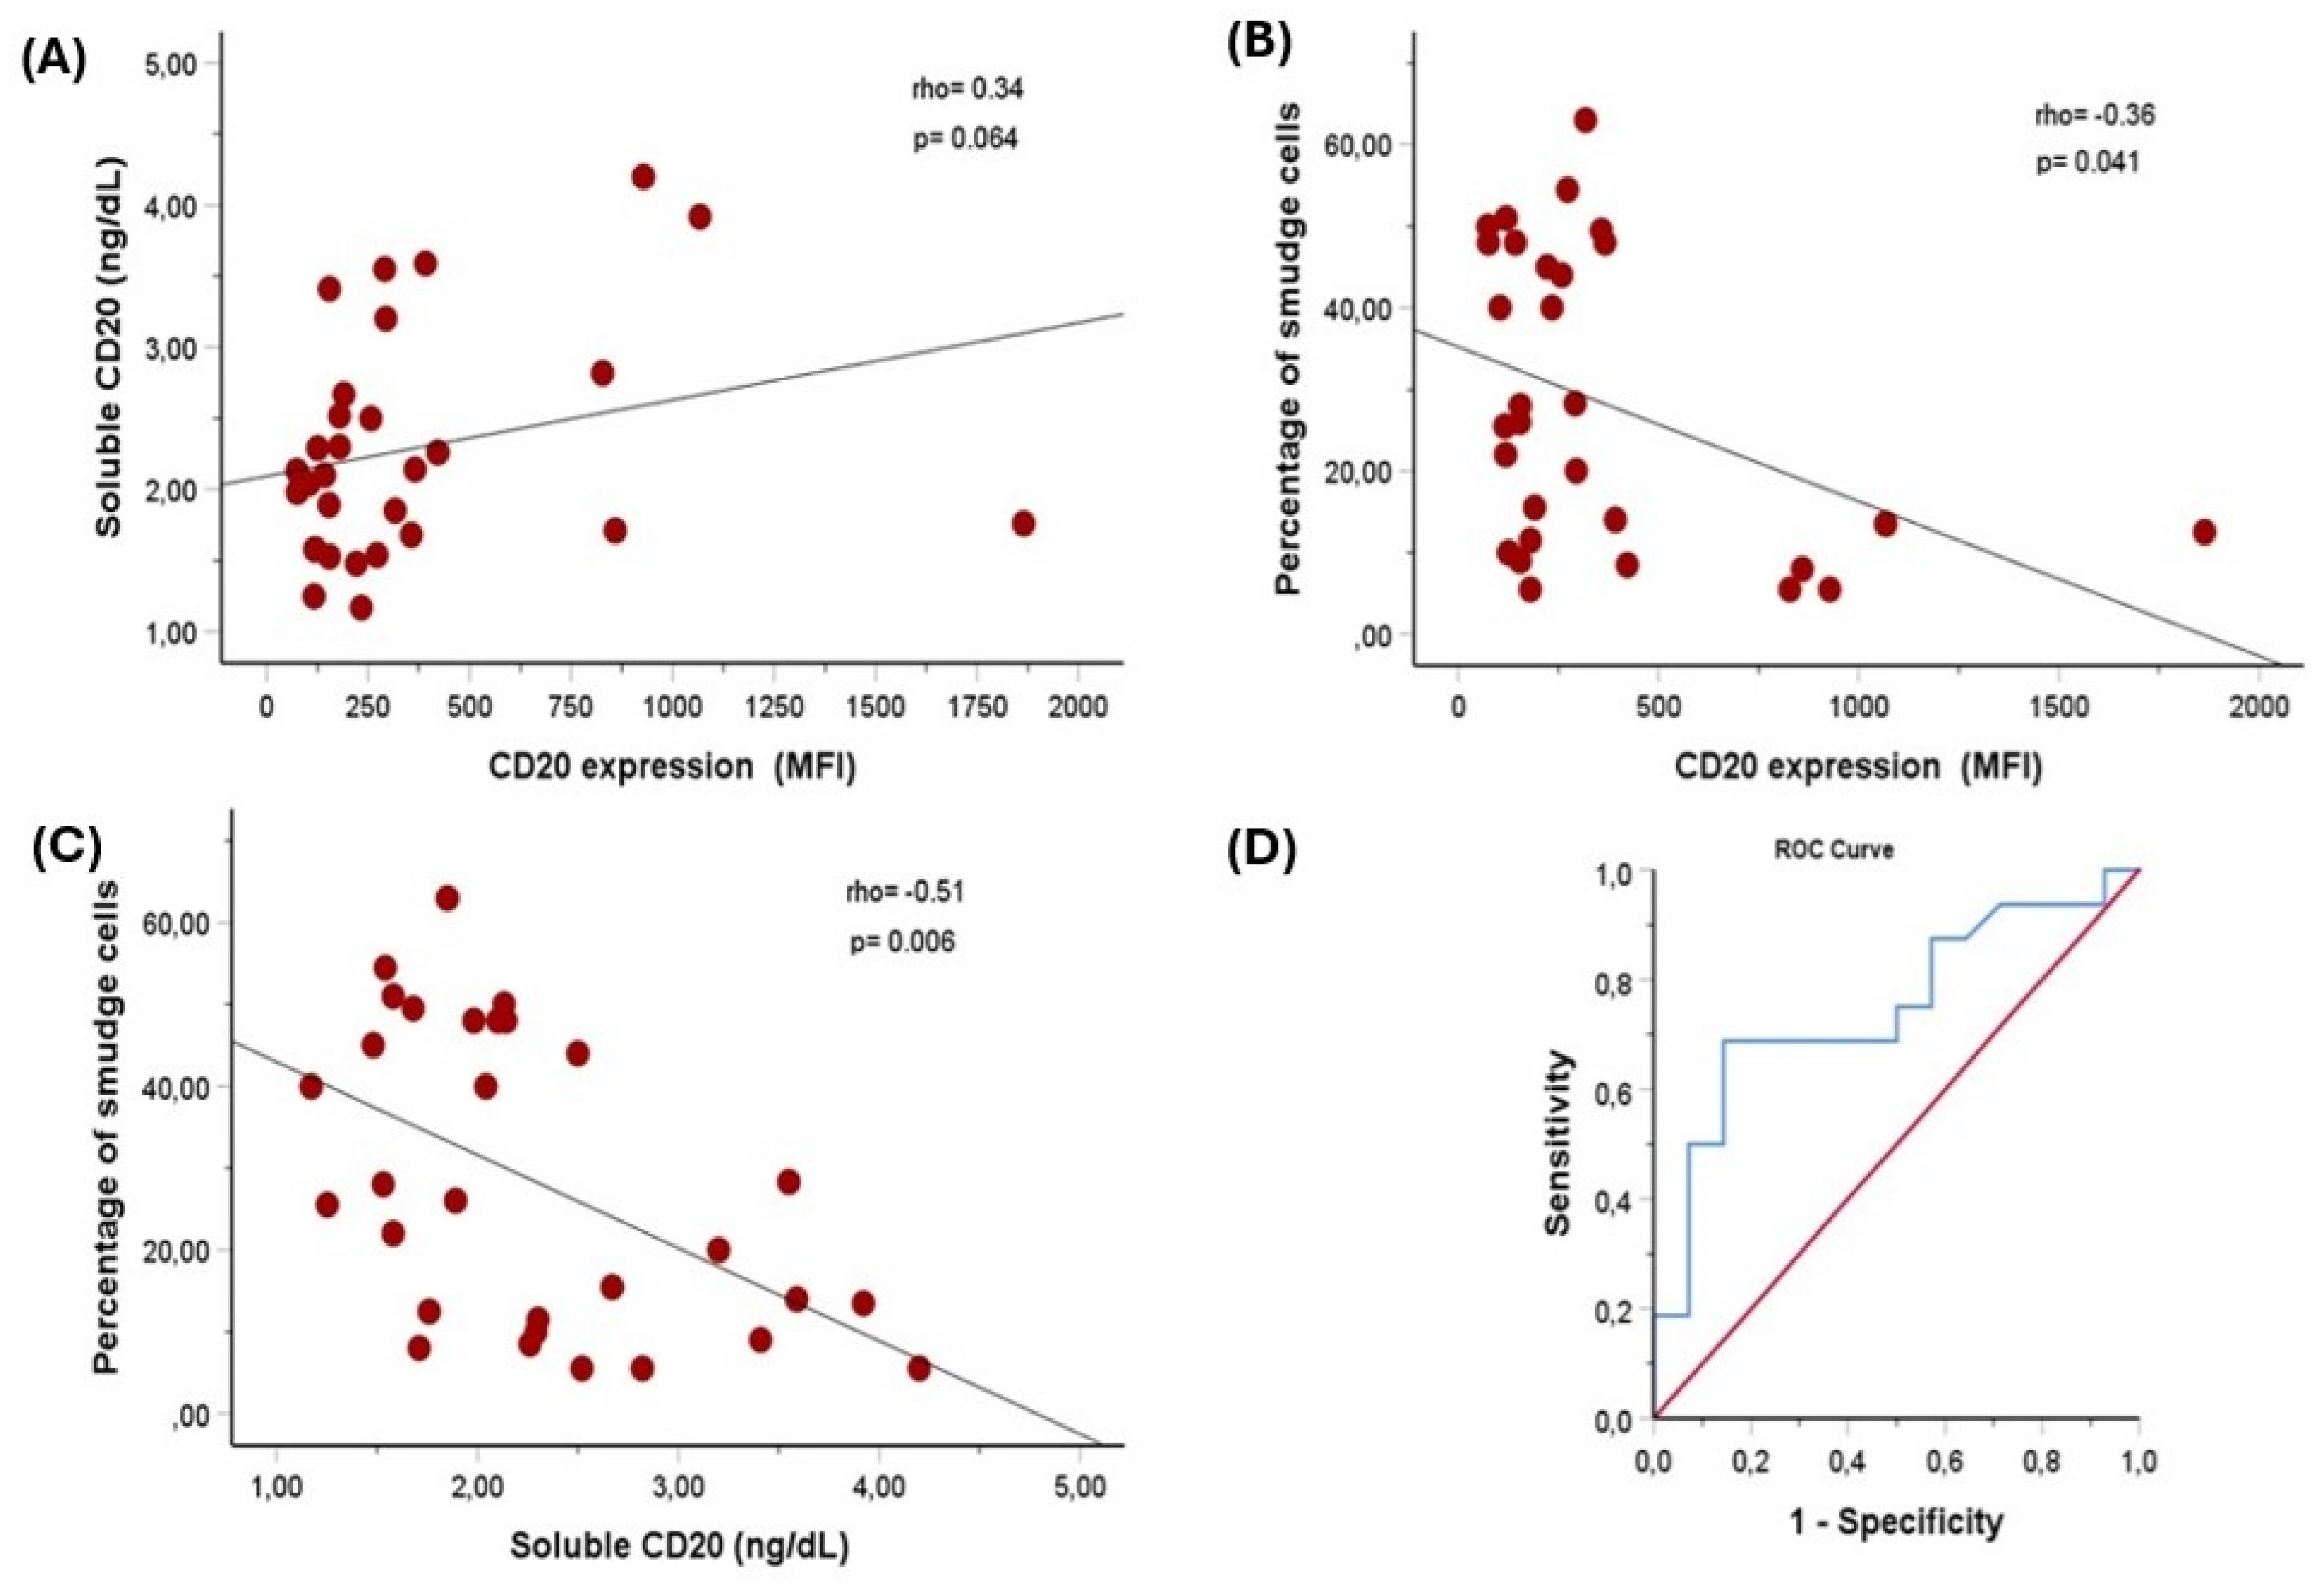

Table 1.
Patient Characteristics (N = 30).
| Characteristic | Value |
| Age, median (range), years | 65 (47-83) |
| Male, n (%) | 20 (66.7) |
| WBC (x103/μl), median (range) | 27.5 (8.3-209.9) |
| Lymphocyte (x103/μl), median (range) | 21.9 (5.4-191.8) |
| Hemoglobin (g/dL), median (range) | 13.05 (9.2-16) |
| Platelet (x103/μl), median (range) | 18.4 (107-358) |
| RAI, n (%) | |
| 0 | 13 (43.3) |
| I | 7 (23.3) |
| II | 3 (10.0) |
| III | 6 (20.0) |
| IV | 1 (3.3) |
| IgHV, n (%) | |
| Mutated | 13 (43.3) |
| Unmutated | 11 (36.6) |
| Unknown | 6 (20) |
WBC: White Blood Cell; per μl: per microliter; IgHV: immunoglobulin heavy chain.
Table 2.
Patient Characteristics.
| Variable | Value |
| CD20 MFI, median (range) | 227 (74-1864) |
| Soluble CD20/MS4A1(ng/dL), median (range) | 2.11 (1.17-4.20) |
| Percentage of smudge cells, median (range) | 25.75 (5.5-63) |
MFI, Median fluorescence intensity; MS4A1, Membrane Spanning 4-Domains A1.
Table 3.
The relationship between the percentage of smudge cells and other laboratory tests.
| Variable 1 | Variable 2 | Correlation Coef (rho) | P value |
| Soluble CD20 | Percentage of smudge cells | -0.51 | 0.006 |
| CD20 MFI | Percentage of smudge cells | -0.36 | 0.041 |
| Soluble CD20 | CD20 MFI | 0,34 | 0.064 |
MFI, Median fluorescence intensity; Correlation coef. (rho), correlation coefficient (Spearman’s rho).
Disclaimer/Publisher’s Note: The statements, opinions and data contained in all publications are solely those of the individual author(s) and contributor(s) and not of MDPI and/or the editor(s). MDPI and/or the editor(s) disclaim responsibility for any injury to people or property resulting from any ideas, methods, instructions or products referred to in the content. |
© 2025 by the authors. Licensee MDPI, Basel, Switzerland. This article is an open access article distributed under the terms and conditions of the Creative Commons Attribution (CC BY) license (http://creativecommons.org/licenses/by/4.0/).
Copyright: This open access article is published under a Creative Commons CC BY 4.0 license, which permit the free download, distribution, and reuse, provided that the author and preprint are cited in any reuse.


