Submitted:
21 September 2025
Posted:
24 September 2025
You are already at the latest version
Abstract
Introduction: Iron deficiency is a common condition in the general population, with a higher incidence in critically ill patients. Anemia associated with these alterations is linked to increased morbidity and mortality in ICU patients. Objective: This pilot study explored whether provisional CRP and ferritin thresholds might relate to survival and examined preliminary associations with analytical and clinical variables in critically ill patients. Material and Method: A prospective, observational pilot study was conducted on 75 ICU patients over three months. Hematological and biochemical parameters (CRP, ferritin, iron, transferrin, hemoglobin) were analyzed at admission, 48 hours, and on days 4 and 7. Clinical data included age, sex, ICU stay, survival, SOFA and APACHE II scores, complications (AKI, acute lung injury), and interventions (mechanical ventilation, in-fections). Data were analyzed using mixed regression models and Wilcoxon tests. Results: In this pilot cohort (mean age 53.65 years; 61.33% male), survival was 82.67%. Higher CRP and ferritin levels were observed among non-survivors and those with AKI p< 0.05. A CRP level ≥145 mg/L was associated with a constellation of more unfavorable clinical indicators (older age, longer ICU stay, higher APACHE II and SOFA scores, more me-chanical ventilation, higher AKI and infection rates, and reduced survival) p< 0.05. Ferritin levels were higher in males and non-survivors and showed positive correlations with SOFA score and ICU length of stay. The exploratory prognostic performance of the CRP threshold was AUC=0.8103.
Keywords:
iron deficiency
; Ferritin
; C-reactive protein
; critical illness
; intensive care unit
1. Introduction
Iron deficiency is a prevalent condition in the general population, but its incidence rises markedly in patients admitted to the Intensive Care Unit (ICU). [1] Critical illnesses exacerbate this deficiency through functional iron dysregulation, characterized by decreased iron absorption, impaired recycling, and reduced bioavailability of stored iron. In critically ill patients, anemia severity—often assessed by parameters such as hemoglobin and hematocrit—can significantly compromise oxygen transport, making anemia one of the primary contributors to morbidity and mortality during ICU stays. [2,3]
Critical illnesses induce profound alterations in iron metabolism, largely mediated by the hormone hepcidin, a 25-amino acid polypeptide synthesized by hepatocytes. Hepcidin secretion is stimulated by inflammatory cytokines and iron overload. Once released, hepcidin binds to ferroportin, a cellular iron exporter found in duodenal enterocytes, macrophages, and hepatocytes, leading to its degradation. This process reduces dietary iron absorption, limits the release of recycled iron from macrophages, and lowers circulating iron levels, promoting the sequestration of iron in storage sites within hepatocytes. [4]
Emerging evidence suggests that measuring hepcidin levels could help guide intravenous iron therapy in patients most likely to benefit from this intervention. Other acute-phase reactants, such as ferritin (an intracellular iron storage protein) and lactoferrin (an iron-binding glycoprotein), are similarly regulated by the inflammatory response. The higher affinity of ferritin and lactoferrin for iron, compared to transferrin (a circulating iron transporter and negative acute-phase reactant), creates a state of hypoferremia. While cytokines directly induce rapid changes in ferritin and transferrin levels, hepcidin remains the key regulator of iron metabolism, determining the severity and duration of iron restriction. This pattern—characterized by low serum iron, low transferrin, and high ferritin—is observed in approximately 75% of critically ill patients within the first three days of ICU admission. [4,5]
The metabolic changes in iron associated with critical illnesses have two major clinical implications. First, diagnosing functional iron deficiency is challenging and cannot be reliably achieved using standard iron study parameters. Second, patients with persistent iron dysregulation are at increased risk of developing nosocomial infections, cognitive dysfunction, neuromuscular dysfunction, and cardiopulmonary complications. Persistent functional iron deficiency can lead to severe metabolic imbalances, where reduced iron availability impairs vital organ function. Correcting non-anemic iron deficiency has been shown to improve cognitive and cardiopulmonary function, aerobic capacity, and fatigue. Consequently, further research and prospective clinical trials are needed to evaluate the potential benefits of iron chelation therapy in critical illnesses and sepsis. [2,3,4,5]
Globally, studies have highlighted the role of biomarkers like ferritin in predicting outcomes in critically ill patients. For example, a study conducted by M. Elouadani in Morocco [6] revealed that elevated levels of CRP, ferritin, and procalcitonin were associated with severe and critical forms of COVID-19, as well as poor prognosis. This research emphasized the importance of clinical-biological scoring systems incorporating multiple biomarkers to standardize treatment practices and ensure appropriate prescriptions for COVID-19 patients. Similarly, a study by Deng et al. [7] analyzed 100 hospitalized COVID-19 patients in the ICU and found that ferritin levels at admission could serve as an independent predictor of hospital mortality. Median ferritin concentrations in the deceased group were approximately three times higher than in survivors (1,722.25 μg/L vs. 501.90 μg/L, p < 0.01). Ferritin levels also correlated with other inflammatory cytokines. Logistic regression analysis confirmed ferritin as an independent predictor of hospital mortality, particularly in patients with elevated ferritin levels, with an adjusted odds ratio of 104.97 (95% CI: 2.63–4,185.89; p = 0.013). Furthermore, ferritin demonstrated superior discriminative capacity, with an area under the ROC curve (AUC) of 0.822 (95% CI: 0.737–0.907), outperforming both procalcitonin and CRP. These findings underscore the need for studies to evaluate the diagnostic utility of ferritin and CRP, particularly their AUC, in Spanish ICUs.
This pilot study explored whether provisional CRP and ferritin thresholds might relate to survival and examined preliminary associations with analytical and clinical variables in critically ill patients.
2. Materials and Methods
This pilot, observational, and prospective study was conducted in the Polytrauma and Burn Unit of the Intensive Care Medicine Service of Hospital La Paz (Madrid, Spain) Participants were prospectively enrolled from a cohort of patients admitted to this unit over 3 months (March, April, and May 2024), following the ethics committee protocol HULP: PI-6034. Enrollment was carried out after obtaining informed consent, either directly from the patients or through their legal representatives.
The study included adult patients (over 18 years of age) admitted to the ICU for at least 7 days who provided informed consent. Patients with active hematological diseases or incomplete data (clinical or hematimetric) were excluded. A non-probabilistic convenience sampling method was applied, including all patients admitted to the unit who met the eligibility criteria.
Participants were followed until ICU discharge or death. Sample collection was performed following the unit’s protocol, which routinely monitors infection and inflammation markers. Data were collected at four time points: at admission, 48 hours post-admission, and on days 4 and 7 of ICU stay. During the study period, 75 patients were admitted to the ICU. Two databases were created: one focusing on hematimetric variables (N=44), referred to as the HEM-Database, and another including analytical variables such as CRP, procalcitonin, and others, encompassing the entire cohort (N=75), referred to as the BIOCH-Database.
2.1. Statistical Analysis
The characteristics of the participants were described using summary statistics. Frequencies and percentages were reported for categorical variables, while for continuous variables, means with standard deviations (SD) or medians with interquartile ranges (IQR) were used, as appropriate. The Mann-Whitney U test was used for non-parametric comparisons using STATA version 18 (Texas, USA). The following variables were collected: Sociodemographic Variables: Age, sex. Clinical Variables: ICU length of stay, survival status (yes/no), ICU admission Sequential Organ Failure Assessment (SOFA) score (ranging from 0 [low organ failure severity] to 24 [high organ failure severity]), and Acute Physiology and Chronic Health Evaluation APACHE II score (ranging from 0 [low acute illness severity] to 299 [high acute illness severity]. Complications: Acute Lung Injury (ALI) (yes/no), Acute Kidney Injury (AKI) (yes/no), Mechanical Ventilation: Use of mechanical ventilation (yes/no) and duration in days.
Infections: Diagnosis of infection (yes/no), infection site (pulmonary, abdominal, bloodstream, urinary, central nervous system, or other).
Hematological and Biochemical Parameters: Ferritina (ng/ml) Iron (μg/dL), IST (Iron Saturation Index, %): CRP (C-Reactive Protein, mg/L): Transferrin (mg/dL).
3. Results
In Table 1, we can see the admission profile and clinical characteristics of patients admitted to the ICU. Regarding reasons for admission, the most frequent were other types of burns (18.67%), followed by flame burns (13.33%) and septic shock or sepsis (8%). Other notable causes included multiple trauma (8%), traumatic brain injury (TBI) (5.33%), respiratory failure (4%), and other medical reasons (6.67%). The total number of patients included in the analysis was 75.
The demographic analysis revealed a mean age of 53.65 years (SD: 17.66), with a median of 57 years (range: 18–84). Most patients were male (61.33%), while 38.67% were female. The median ICU stay was 6 days, with a mean of 13.71 days (SD: 19.19) and a range of 1 to 86 days. Regarding survival outcomes, 82.67% of patients survived, while 17.33% did not.
Clinical scores indicated a mean APACHE II score of 12.37 (SD: 6.86) and a mean SOFA score of 3.74 (SD: 3.36). These scores reflect the severity of illness in the cohort, with interquartile ranges (IQR) of 7–16 for APACHE II and 1–6 for SOFA.
Complications were common among the patients. Acute lung injury was observed in 24% of cases, while 44% required mechanical ventilation, with a median duration of 0 days (mean: 6.59 days, SD: 13.43). Acute kidney injury (AKI) occurred in 25.68% of patients. Thromboembolic events (TDE) were less frequent, affecting 9.33% of the cohort.
Infections were a significant concern, as 41.33% of patients experienced at least one infection. Pulmonary infections were the most common (20%), followed by urinary infections (10.67%), bloodstream infections (9.33%), abdominal infections (8%), and central nervous system (CNS) infections (4%). Other types of infections were observed in 8% of patients.
In Table 2, the descriptive characteristics of different biomarkers related to iron metabolism and inflammation in patients are presented. Descriptive statistics such as the mean, standard deviation (SD), minimum and maximum values, as well as the median (P50) and interquartile ranges (P25-P75) are included. Ferritin (ng/ml) shows high variability in its values. The average values have a mean of 1037.01 ng/ml (SD = 1556.81), with an interquartile range of 322.45 to 1348.00 ng/ml. Iron (μg/dL) also shows variability. The minimum values have a mean of 37.86 μg/dL (SD = 34.28), ranging from 6.00 to 184.00 μg/dL, with a median of 25.00 μg/dL. The Iron Saturation Index (IST, %) shows minimum values with a mean of 22.28% (SD = 23.16), ranging from 4.00% to 111.00%. The average values have a mean of 34.14% (SD = 25.56), and the maximum values reach a mean of 51.26% (SD = 39.45), with a range of 8.00% to 159.00%. C-reactive protein (CRP, mg/L) shows minimum values with a mean of 13.74 mg/L (SD = 26.89), ranging from 0.50 to 182.60 mg/L, with a median of 4.80 mg/L. Transferrin (mg/dL) has a mean of 140.18 mg/dL (SD = 63.38), while the maximum values reach a mean of 165.84 mg/dL (SD = 69.50), with a range of 25.00 to 297.00 mg/dL.
Regarding the “HEM-Database,” aimed at establishing the relationship between ferritin, survival, and sex, the following statistically significant differences were identified: the minimum ferritin values are significantly different between women and men (p=0.0467), with men presenting higher minimum ferritin values on average (602.81 ng/ml) compared to women (321.35 ng/ml). Regarding survival differences, the minimum ferritin values are significantly different based on survival status (p=0.0064), with patients who did not survive having higher minimum ferritin values on average compared to those who survived. Similarly, the mean ferritin values are significantly different based on survival status (p=0.0407), with patients who did not survive showing higher mean ferritin values (1971.20 ng/ml) compared to those who survived (725.61 ng/ml). See Table 3 for details.
To further analyze ferritin, the Mann-Whitney U test was performed to compare differences between two independent groups. The results revealed significant differences in multiple clinical and biochemical parameters. Men showed significantly higher minimum ferritin levels than women (,p=0.0467), reflecting differences in iron reserves. Patients who did not survive exhibited significantly higher minimum ferritin levels than survivors (z=2.724,p=0.0064). Regarding iron and infection, patients with infections had significantly higher minimum iron levels compared to those without infections (z=3.153,p=0.0012). Finally, concerning the Iron Saturation Index (IST), non-survivors showed significantly higher minimum IST levels than survivors (z=2.132,p=0.0321), while patients requiring mechanical ventilation had significantly higher maximum IST levels compared to those who did not require it (z=−2.120,p=0.0336).
Concerning transferrin, patients with infections presented significantly higher minimum transferrin levels (z=2.364,p=0.0172), while patients requiring mechanical ventilation showed significant differences in transferrin levels (z =2.545,p=0.0109), suggesting alterations in iron metabolism in critically ill patients.
Regarding the Spearman correlation coefficient, it was used to evaluate the strength and direction of monotonic relationships between continuous variables. The following significant correlations were identified: A negative correlation (ρ=−0.4354,p=0.0035) suggests that higher SOFA scores (indicative of greater organ dysfunction) were associated with lower minimum ferritin levels. A negative correlation (ρ=−0.4750, p=0.0013 indicates that longer ICU stays were associated with lower minimum transferrin levels. Additionally, a negative correlation (ρ=−0.3974ρ=−0.0083) suggests that prolonged mechanical ventilation was associated with lower transferrin levels. See Table 4
Finally, descriptive statistics were calculated to summarize the distribution of the main variables across different groups. These provide additional context to the findings. Non-survivors had a mean ferritin level of 1971.20 ng/mL (SD = 2650.80), significantly higher than survivors (mean = 725.61 ng/mL, SD = 812.97). Patients without infections had a higher mean iron level (59.00 μg/dL, SD = 40.56) compared to those with infections in “other” locations (38.02 μg/dL, SD = 10.38). The analysis compares two groups of patients based on the cutoff point of 300 for the variable ferropenia-300, with a sensitivity of 0.8182 and specificity of 0.7237. Group 0 includes patients with ferropenia300 < 300, while Group 1 includes patients with ferropenia300 ≥ 300. Several clinical variables were analyzed to identify significant differences between the groups.
Regarding age, the mean was 55.80 years (SD: 19.48) in Group 0 and 56.42 years (SD: 16.57) in Group 1. The Wilcoxon test showed no significant differences (p = 0.953). Regarding sex, 50% of Group 0 were women compared to 29.17% in Group 1. The chi-square test also showed no significant differences (p = 0.158).
The duration of ICU stay was similar between groups, with a mean of 20.40 days (SD: 23.63) in Group 0 and 19.83 days (SD: 22.78) in Group 1. The Wilcoxon test indicated no significant differences (p = 0.822). However, a significant difference was observed in survival, where 10% of patients in Group 0 did not survive, compared to 37.50% in Group 1 (p = 0.036), suggesting that patients with ferropenia300 ≥ 300 have a higher proportion of non-survivors.
The Apache II score showed no significant differences (p = 0.705), with a mean of 12.90 (SD: 4.47) in Group 0 and 14.22 (SD: 7.70) in Group 1. Similarly, the SOFA score also showed no significant differences (p = 0.371), with a mean of 5.15 (SD: 3.27) in Group 0 and 4.22 (SD: 3.50) in Group 1. Regarding acute lung injury, 30% of Group 0 and 33.33% of Group 1 were affected, with no significant differences (p = 0.813).
Regarding the need for mechanical ventilation, 50% of Group 0 and 54.17% of Group 1 required it, with no significant differences (p = 0.783). The number of days on mechanical ventilation was also similar, with a mean of 9.95 days (SD: 16.65) in Group 0 and 10.00 days (SD: 16.22) in Group 1 (p = 0.861).
Other variables, such as acute kidney injury (AKI) (p = 0.423), thromboembolic disease (TDE) (p = 0.521), and infection (p = 0.467), showed no significant differences between groups. The location of the infection also showed no significant differences, including pulmonary location (p = 0.679), abdominal location (p = 0.261), urinary location (p = 0.521), CNS location (p = 0.356), blood location (p = 0.880), and other locations (p = 0.521).
The only significant difference observed was in survival, where patients with ferropenia300 ≥ 300 had a higher proportion of non-survivors. No statistically significant differences were found in the other clinical variables. Regarding the ROC curve, the evaluated model has an AUC of 0.7769, indicating that it can correctly discriminate between positive and negative classes in approximately 81% of cases, which is considered good performance. See Figure 1.
Regarding the “BIOCH-Database,” it was used to analyze C-reactive protein (CRP). Table 5 presents the results of two statistical analyses: the Wilcoxon tests (Rank-Sum Test) and Spearman correlations. In the Wilcoxon tests, which compare two groups in terms of a numerical variable such as CRP levels, it was observed that non-surviving patients had significantly higher mean CRP values compared to survivors (z = 3.360, p = 0.0005). Similarly, non-surviving patients showed significantly higher maximum CRP values compared to survivors (z = 3.489, p = 0.0003). Furthermore, patients with AKI had significantly higher maximum CRP values compared to those without AKI (z = -3.752, p = 0.0001).
As for the Spearman correlations, a moderate positive correlation was found between SOFA and maximum CRP (Rho = 0.5503, p = 0.0000), indicating that higher SOFA scores (an indicator of organ dysfunction) are associated with higher maximum CRP levels. Similarly, a moderate positive correlation was observed between days on mechanical ventilation and maximum CRP (Rho = 0.5206, p = 0.0000), suggesting that patients with higher CRP levels tend to require more days of mechanical ventilation. Additionally, a moderate positive correlation was identified between the Apache II score and maximum CRP (Rho = 0.4851, p = 0.0000), implying that patients with greater clinical severity have higher maximum CRP levels.
Table 6 compares clinical characteristics and outcomes between the two groups defined by the maximum CRP cutoff point (145). For continuous variables, the Wilcoxon rank-sum test was used to determine differences between groups, while for categorical variables, the Chi-square test was used to assess associations. Patients with CRP ≥ 145 were older, had longer ICU stays, higher Apache II and SOFA scores, greater need for mechanical ventilation, higher incidence of AKI and infections, and lower survival rates. The maximum CRP cutoff point (145) effectively discriminates between patients with poorer prognoses and those with better clinical outcomes, as demonstrated by the AUC of 0.8103 (see Figure 2).
4. Discussion
This pilot study explored whether provisional CRP and ferritin thresholds might relate to survival and examined preliminary associations with analytical and clinical variables in critically ill patients. It is well-established that hyperferritinemia is associated with high mortality, regardless of the underlying pathology (8–10). In our study, the minimum ferritin values showed significant differences based on survival status (p = 0.0064), with higher average values observed in patients who did not survive. Similarly, the mean ferritin values were also significantly higher in non-survivors (1971.20 ng/ml) compared to survivors (725.61 ng/ml), with p = 0.0407.
Yang et al. [11] conducted a systematic review of 19 studies involving 125,490 patients. This review demonstrated that elevated serum iron levels are associated with an increased risk of mortality, particularly in sepsis patients. Regarding iron and infections, our results revealed that patients with infections had significantly higher minimum iron levels compared to those without infections (z = 3.153, p = 0.0012). This phenomenon may reflect a defense mechanism known as iron sequestration, in which the body reduces iron availability to limit pathogen growth. Therefore, our findings are consistent with those reported in Yang’s review.
With respect to CRP, our results are also consistent with the scientific literature. Chi et al. [ 12] analyzed 189 studies during the COVID-19 pandemic, confirming that elevated CRP levels are associated with worse clinical outcomes, including greater disease severity, ICU admission, and mortality (e.g., disease severity: SMD = −0.87 mg/L, 95% CI: [−1.27, −0.47], p < 0.001; mortality: SMD = −1.32 mg/L, 95% CI: [−1.95, −0.69], p < 0.001; ICU admission: SMD = −1.39 mg/L, 95% CI: [−1.68, −1.11], p < 0.001). In our study, mean CRP levels were significantly associated with survival, with a z/Rho of 3.360 and a p-value of 0.0005, indicating that non-survivors likely had higher mean CRP levels. Similarly, the maximum CRP levels showed an even stronger association with survival (z/Rho = 3.489, p = 0.0003). Both results are highly significant and suggest that both mean and peak CRP levels are strong prognostic indicators of survival.
Our findings align with those of Demelo-Rodríguez et al. [13], who identified a CRP cutoff of >5 mg/dL with moderate predictive capacity for mortality (AUC = 0.7). However, our study used a higher CRP cutoff (≥145 mg/L), which demonstrated better overall discriminative capacity (AUC = 0.8103), with high sensitivity (84.62%) and specificity (81.67%) for predicting adverse outcomes. Both studies conclude that elevated CRP levels are associated with worse clinical outcomes, and our data highlight an optimal cutoff (≥145 mg/L) with high sensitivity and specificity.
Regarding ICU predictors, Ríos-Toro et al. [14] highlighted that changes in SOFA scores between admission and day 2 were significantly associated with mortality (p = 0.002), identifying SOFA variations as an independent predictor of mortality (OR = 2.13, 95% CI: 1.18–3.86). Similarly, our data show significant differences in SOFA scores between the evaluated groups. In the group with CRP ≤145 mg/L, the mean score was 3.14 (SD: 3.15) and the median was 2.00 (IQR: 1.00–4.00), while in the group with CRP >145 mg/L, the mean score was 5.15 (SD: 3.57) and the median was 5.00 (IQR: 2.00–8.50). The Wilcoxon analysis (z = -2.177) yielded a p-value of 0.0295, confirming that SOFA is a key indicator of clinical severity, and its relationship with other markers, such as CRP, may reflect the progression of organ dysfunction.
Regarding APACHE II, Ríos-Toro et al. [14] found that changes in APACHE II scores between admission and day 2 were significant in non-survivors (p = 0.001). A significant association was also identified between changes in APACHE II scores from admission to day 5 and mortality (p = 0.002). In our study, a moderate positive correlation was observed between average APACHE II scores and clinical severity. The group with CRP >145 mg/L presented higher scores, which could indicate greater clinical severity compared to the group with CRP ≤145 mg/L. Both studies confirm that APACHE II is a robust marker of clinical severity, and its association with CRP may reflect disease progression in critically ill patients.
Regarding mechanical ventilation, our findings are consistent with those of Saldías-Peñafiel et al. [15], who reported that elevated CRP levels are significantly associated with a higher likelihood of requiring mechanical ventilation. In our study, elevated CRP levels were also significantly associated with mechanical ventilation, and patients with higher CRP levels required significantly more days of ventilation. Furthermore, Saldías-Peñafiel et al. noted that failure to reduce CRP levels in the early days predicts worse outcomes, which is consistent with our findings.
Finally, regarding ferritin, our results align with those of Liu et al. [16], who demonstrated that ferritin levels ≥300 ng/mL are associated with lower survival rates. In our study, non-survivors exhibited significantly higher minimum ferritin levels compared to survivors. Additionally, patients with infections showed significantly higher minimum iron levels than those without infections, reinforcing the hypothesis of iron sequestration as a defense mechanism. Our findings on ferritin’s predictive capacity are consistent with those reported by Deng et al. [7], who identified ferritin as an independent marker of in-hospital mortality in critically ill patients, with high discriminative capacity (AUC = 0.822).
5. Conclusions
In this pilot cohort, higher CRP and ferritin levels were associated with poorer survival and more adverse clinical indicators. Non-survivors showed elevated values, and the provisional thresholds CRP≥145 mg/LCRP≥145 mg/L and ferritin≥300 ng/mLferritin≥300 ng/mL coincided with greater illness severity and longer ICU stay. CRP displayed exploratory discriminative performance AUC=0.8103AUC=0.8103, while ferritin showed moderate discrimination AUC=0.7769AUC=0.7769. These observations are hypothesis-generating and require validation in larger, adequately powered studies before any clinical implementation is considered.
6. Limitations
This pilot study has several limitations. First, the sample size (n = 75) is modest, which restricts statistical power and precision of estimates. The analyses were therefore intentionally limited to exploratory, primarily univariable assessments of associations between biomarker levels (CRP and ferritin), sociodemographic factors, and clinical variables, rather than definitive inference. Given the number of patients and events, proceeding with multivariable modeling was considered statistically unviable; with this cohort size, any model would likely be underpowered and at risk of overfitting while identifying few, if any, independent predictors. Accordingly, findings should be viewed as hypothesis-generating. We did not attempt to establish definitive CRP or ferritin thresholds; instead, we characterized patterns of association to inform future study design. Additional limitations include the single-center design, potential residual confounding (e.g., unmeasured chronic inflammatory conditions), and the absence of external validation or longitudinal repeated measures beyond the initial ICU assessments. These preliminary observations provide a foundation for larger, adequately powered multicenter studies in which robust multivariable adjustment and validation of independent predictive factors will be feasible.
This section is not mandatory but may be added if there are patents resulting from the work reported in this manuscript.
Author Contributions
Conceptualization, Manuel de la Cruz-Garcinuño and Antonio Martinez Sabater; methodology, Michal Czapla,Manuel de la Cruz-Garcinuño; software, Enrique Polo-Andrade; validation, Manuel de la Cruz-Garcinuño, Antonio Rodríguez-Calvo; formal analysis, Antonio Martinez Sabater; investigation, Carmen Sarmiento and Enrique Polo, resources, Ana Cobos-Rincon data curation, Paula Álvarez; writing—original draft preparation, Manuel de la Cruz-Garcinuño and Urko Aguirre; writing—review and editing, Raul Juarez Vela; supervision, Manuel Quintana-Diaz; project administration, Raul Juarez Vela; funding acquisition, Clara Isabel Tejada-Garrido,Manuel Quintana-Diaz. All authors have read and agreed to the published version of the manuscript.
Funding
This research was funded by the Government of La Rioja through the University of La Rioja’s Special Plan for Health Sciences.
Institutional Review Board Statement
The study was conducted in accordance with the Declaration of Helsinki and approved by the Institutional Review Board of La Pazz with protocol HULP: PI-6034. Enrollment was carried out after obtaining informed consent, either directly from the patients or through their legal representatives.
Data Availability Statement
The generated data are available upon reasonable request from the corresponding author.
Acknowledgments
We are deeply grateful to all the patients and their families at Hospital Universitario La Paz in Madrid, Spain.
Conflicts of Interest
The authors declare no conflicts of interest.
References
- Muñoz M, Leal-Noval SR, García-Erce JA, Naveira E. Prevalence and treatment of anemia in the critically ill patient. Med Intensiva. 2007 Oct;31(7):388-98. Available at: http://scielo.isciii.es/scielo.php?script=sci_arttext&pid=S0210-56912007000700005&lng=es.
- Vincent JL, Baron JF, Reinhart K, Gattinoni L, Thijs L, Webb A, et al.; ABC (Anemia and Blood Transfusion in Critical Care) Investigators. Anemia and blood transfusion in critically ill patients. JAMA. 2002 Sep 25;288(12):1499-507. [CrossRef] [PubMed]
- Tacke F, Nuraldeen R, Koch A, Strathmann K, Hutschenreuter G, Trautwein C, et al. Iron parameters determine the prognosis of critically ill patients. Crit Care Med. 2016 Jun;44(6):1049-58. [CrossRef]
- Litton E, Lim J. Iron metabolism: an emerging therapeutic target in critical illness. Crit Care. 2019 Mar 9;23(1):81. [CrossRef] [PubMed] [PubMed Central]
- Huang I, Pranata R, Lim MA, Oehadian A, Alisjahbana B. C-reactive protein, procalcitonin, D-dimer, and ferritin in severe coronavirus disease-2019: a meta-analysis. Ther Adv Respir Dis. 2020;14:1753466620937175. [CrossRef]
- Elouadani M, Konzi C, Addi Y, Mourji D, Biaz A, Elmechtani S, et al. C-reactive protein, ferritin, and procalcitonin in 300 Moroccan patients with COVID-19. Clin Lab. 2022 Oct;68(10):10.7754/Clin.Lab.2022.220124. [CrossRef]
- Deng F, Zhang L, Lyu L, Lu Z, Gao D, Ma X, et al. Increased levels of ferritin on admission predict intensive care unit mortality in patients with COVID-19. Med Clin (Engl Ed). 2021;156(7):324-31. [CrossRef]
- Carcillo JA, Sward K, Halstead ES, et al. A systemic inflammation mortality risk assessment contingency table for severe sepsis. Pediatr Crit Care Med. 2016;18:143. [CrossRef]
- Garcia PC, Longhi F, Branco RG, Piva JP, Lacks D, Tasker RC. Ferritin levels in children with severe sepsis and septic shock. Acta Paediatr. 2007;96:1829. [CrossRef]
- Bennett TD, Hayward KN, Farris RW, Ringold S, Wallace CA, Brogan TV. Very high serum ferritin levels are associated with increased mortality and critical care in pediatric patients. Pediatr Crit Care Med. 2011;12:e233. [CrossRef]
- Yang DC, Zheng BJ, Li J, Yu Y. Iron and ferritin effects on intensive care unit mortality: a meta-analysis. World J Clin Cases. 2024;12(16):2803-12. [CrossRef]
- Chi L, Wang S, Wang X, Yang C, Luo J. Predictive value of C-reactive protein for disease severity and survival in COVID-19 patients: a systematic review and meta-analysis. Clin Exp Med. 2023;23(6):2001-8. [CrossRef]
- Demelo-Rodríguez P, Galeano-Valle F, Marcelo-Ayala A, Fernández-Carracedo E, Cuenca-Zarzuela A, Gómez-Morales M, et al. C-reactive protein level predicts 30-day mortality and bleeding in patients with venous thromboembolism: a prospective single-center study. Med Clin (Barc). 2020;155(2):51-6. [CrossRef]
- Rios-Toro JJ, Pola-Gallego de Guzman MD, Guerrero-Marin M, Rodriguez-Rubio D, Ruiz-Garcia MI, Aguilar-Alonso E, et al. Prognostic value of variations in serum biomarkers and prognostic score values between admission and second day in intensive care unit septic patients. Cureus. 2021;13(7):e16472. [CrossRef]
- Saldías-Peñafiel F, Salinas-Rossel G, Farcas-Oksenberg K, Reyes-Sánchez A, Díaz-Patiño O. Usefulness of serum C-reactive protein in the diagnosis and treatment of immunocompetent adults hospitalized with community-acquired pneumonia. Rev Med Chil. 2019;147(8):983-92. [CrossRef]
- Liu M, Yang C, Chu Q, Wang J, Wang Q, Kong F, et al. High serum levels of ferritin may predict poor survival and walking ability for patients with hip fractures: a propensity score matching study. Biomark Med. 2022;16(11):857-66. [CrossRef]
Figure 1.
ROC Curve (Receiver Operating Characteristic) with a cutoff point of 300 for the variable ferropenia-300.
Figure 1.
ROC Curve (Receiver Operating Characteristic) with a cutoff point of 300 for the variable ferropenia-300.
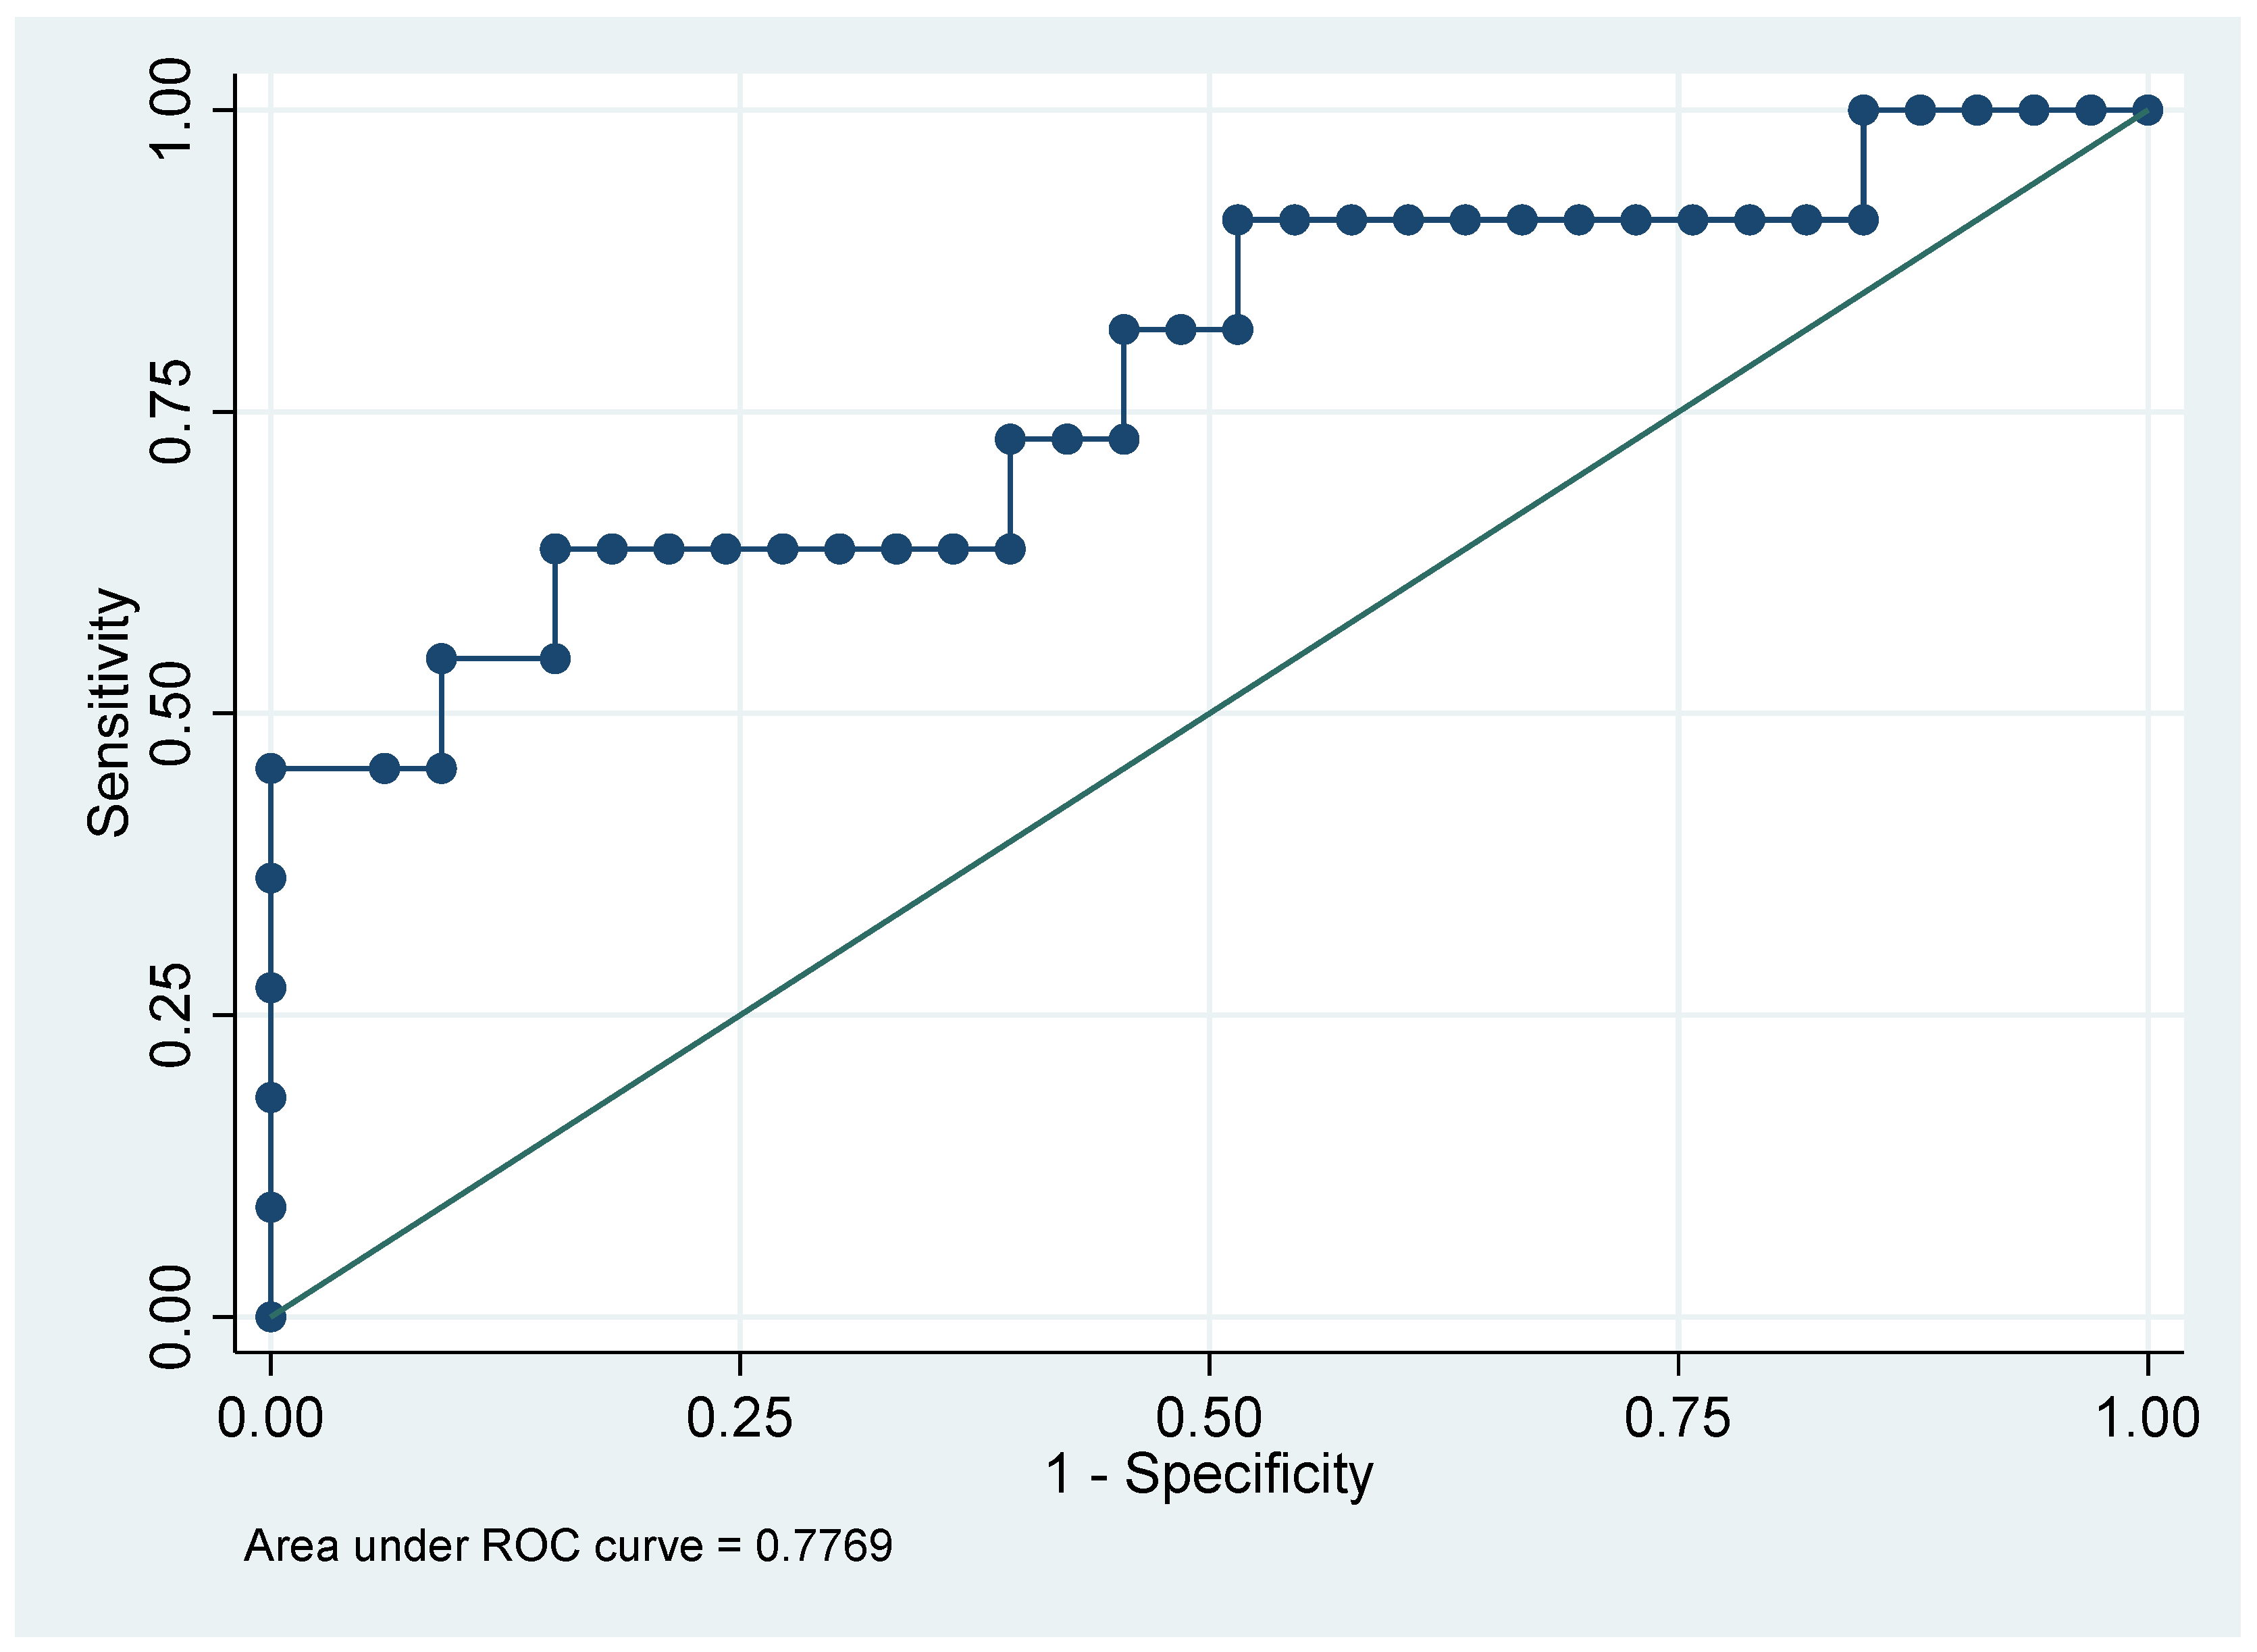
Figure 2.
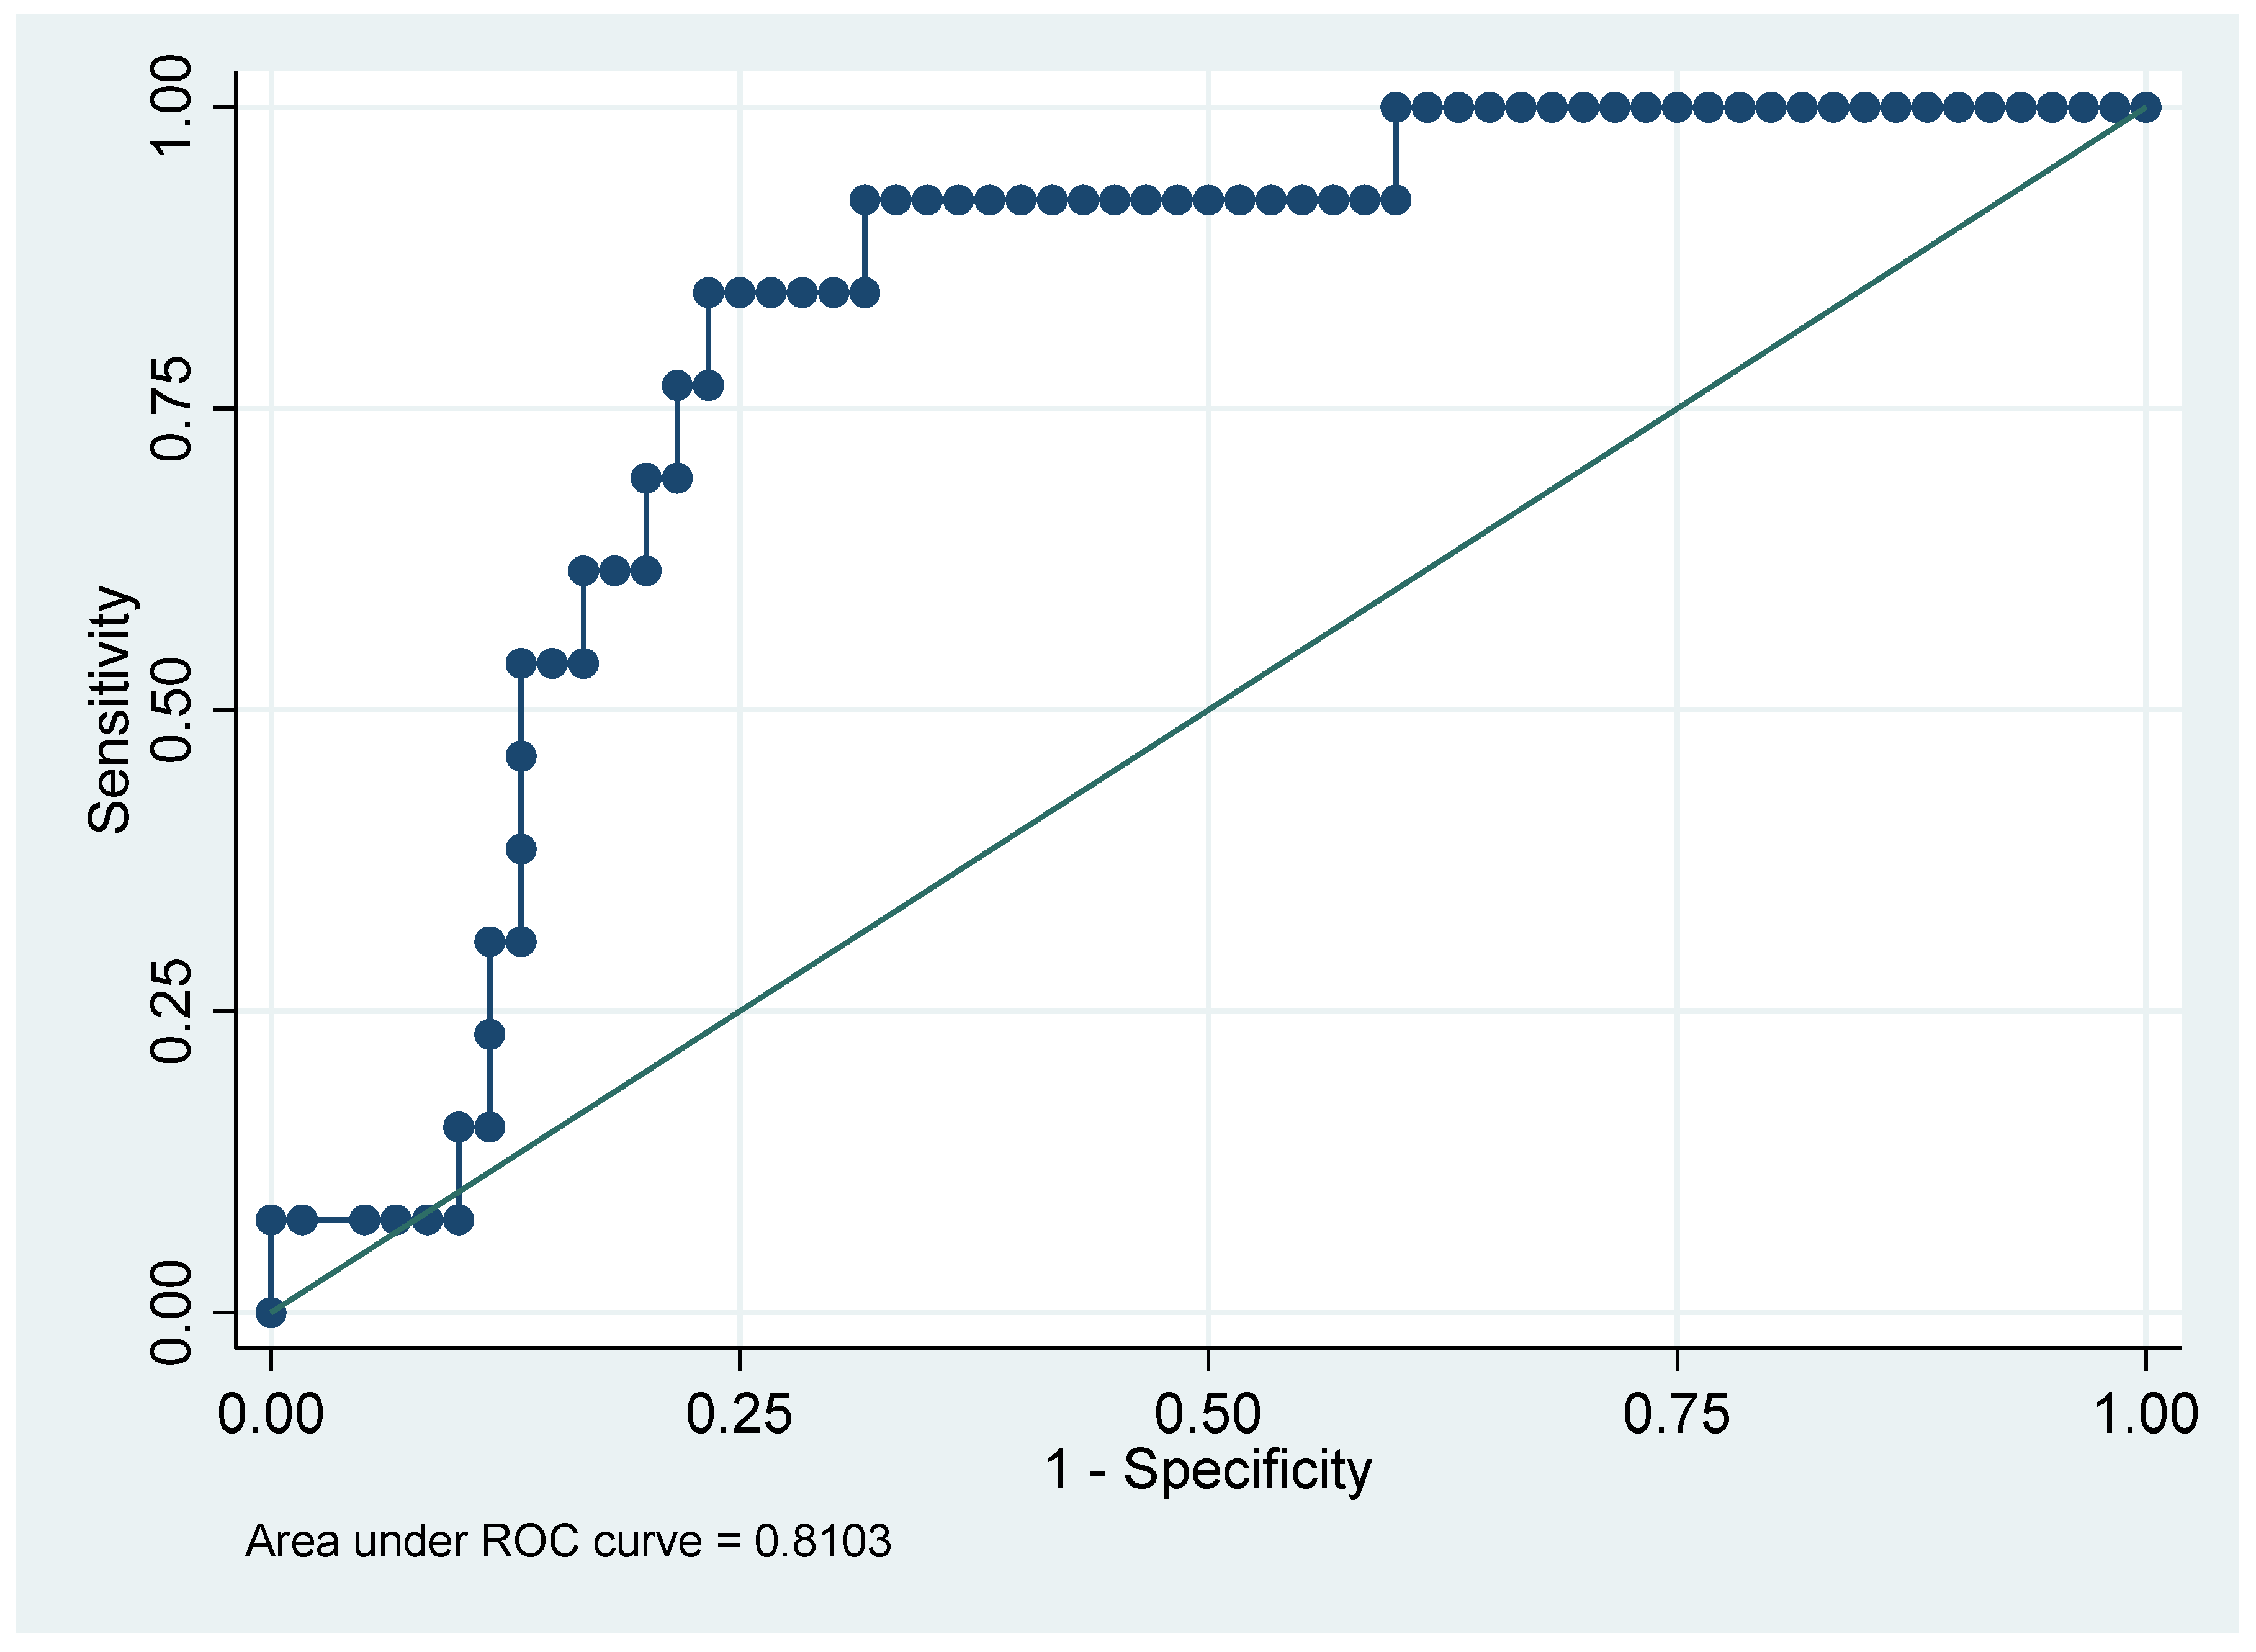

Table 1.
Clinical and Sociodemographic Characteristics of the Sample.
| Variable | Value/Frequency (n) | Percentage (%) | Mean (SD) | Median (P50) | Min—Max | P25—P75 |
| Reason for Admission | ||||||
| - Septic Shock or Sepsis | 6 | 8.00 | ||||
| - Flame Burn | 10 | 13.33 | ||||
| - Multiple Trauma | 6 | 8.00 | ||||
| - TBI (Traumatic Brain Injury) | 4 | 5.33 | ||||
| - Respiratory Failure | 3 | 4.00 | ||||
| - Burns (Other) | 14 | 18.67 | ||||
| - Other Medical Reasons | 5 | 6.67 | ||||
| - Total | 75 | 100.00 | ||||
| Demographic Characteristics | ||||||
| - Age (years) | 53.65 (17.66) | 57.00 | 18–84 | 41–68 | ||
| - Sex: Female | 29 | 38.67 | ||||
| - Sex: Male | 46 | 61.33 | ||||
| - Total | 75 | 100.00 | ||||
| ICU Stay and Survival | ||||||
| - ICU Stay (days) | 13.71 (19.19) | 6.00 | 1–86 | 4–12 | ||
| - Survival: Yes | 62 | 82.67 | ||||
| - Survival: No | 13 | 17.33 | ||||
| - Total | 75 | 100.00 | ||||
| Clinical Scores | ||||||
| - APACHE II Score | 71 | 12.37 (6.86) | 11.00 | 1–29 | 7–16 | |
| - SOFA Score | 72 | 3.74 (3.36) | 3.00 | 0–12 | 1–6 | |
| Complications | ||||||
| - Acute Lung Injury: Yes | 18 | 24.00 | ||||
| - Acute Lung Injury: No | 57 | 76.00 | ||||
| - Total | 75 | 100.00 | ||||
| - Mechanical Ventilation: Yes | 33 | 44.00 | ||||
| - Mechanical Ventilation: No | 42 | 56.00 | ||||
| - Total | 75 | 100.00 | ||||
| - Mechanical Ventilation (days) | 6.59 (13.43) | 0.00 | 0–62 | 0–6 | ||
| - Acute Kidney Injury (AKI): Yes | 19 | 25.68 | ||||
| - Acute Kidney Injury (AKI): No | 55 | 74.32 | ||||
| - Total | 74 | 100.00 | ||||
| - Thromboembolic Events (TDE): Yes | 7 | 9.33 | ||||
| - Thromboembolic Events (TDE): No | 68 | 90.67 | ||||
| - Total | 75 | 100.00 | ||||
| Infections | ||||||
| - Infection: Yes | 31 | 41.33 | ||||
| - Infection: No | 44 | 58.67 | ||||
| - Total | 75 | 100.00 | ||||
| - Pulmonary: Yes | 15 | 20.00 | ||||
| - Pulmonary: No | 60 | 80.00 | ||||
| - Total | 75 | 100.00 | ||||
| - Abdominal: Yes | 6 | 8.00 | ||||
| - Abdominal: No | 69 | 92.00 | ||||
| - Total | 75 | 100.00 | ||||
| - Urinary: Yes | 8 | 10.67 | ||||
| - Urinary: No | 67 | 89.33 | ||||
| - Total | 75 | 100.00 | ||||
| - Central Nervous System: Yes | 3 | 4.00 | ||||
| - Central Nervous System: No | 72 | 96.00 | ||||
| - Total | 75 | 100.00 | ||||
| - Bloodstream: Yes | 7 | 9.33 | ||||
| - Bloodstream: No | 68 | 90.67 | ||||
| - Total | 75 | 100.00 | ||||
| - Other Infections: Yes | 6 | 8.00 | ||||
| - Other Infections: No | 69 | 92.00 | ||||
| - Total | 75 | 100.00 |
Note: Quantitative variables include the mean, standard deviation (SD), median (P50), and interquartile ranges (P25-P75). Categorical variables are presented as absolute frequencies (n) and percentages (%).
Table 2.
Characteristics of different biomarkers related to iron metabolism and inflammation.
| Variable | N | Mean | SD | Min | Max | P50 (Median) | P25 | P75 |
| Ferritin ng/ml | ||||||||
| - Minimum | 44 | 494.07 | 597.34 | 21.00 | 3245.00 | 319.50 | 128.00 | 496.50 |
| - Mean | 44 | 1037.01 | 1556.81 | 44.00 | 9446.00 | 541.67 | 322.45 | 1348.00 |
| - Maximum Value | 44 | 1980.45 | 3979.39 | 44.00 | 21736.00 | 760.00 | 357.50 | 1600.00 |
| Iron ug/dl | ||||||||
| - Minimum | 44 | 37.86 | 34.28 | 6.00 | 184.00 | 25.00 | 17.00 | 45.50 |
| - Mean | 44 | 56.61 | 38.85 | 9.00 | 184.00 | 44.25 | 32.81 | 63.50 |
| - Maximum Value | 44 | 82.07 | 58.67 | 9.00 | 290.00 | 65.50 | 46.00 | 95.00 |
| IST (Iron Saturation Index) % | ||||||||
| - Minimum | 43 | 22.28 | 23.16 | 4.00 | 111.00 | 16.00 | 10.00 | 23.00 |
| - Mean | 43 | 34.14 | 25.56 | 8.00 | 111.00 | 24.00 | 18.67 | 43.88 |
| - Maximum Value | 43 | 51.26 | 39.45 | 8.00 | 159.00 | 36.00 | 22.00 | 71.00 |
| CRP (C-Reactive Protein) mg/dl | ||||||||
| - Minimum | 73 | 13.74 | 26.89 | 0.50 | 182.60 | 4.80 | 0.50 | 13.60 |
| - Mean | 73 | 96.05 | 66.33 | 0.50 | 225.23 | 87.41 | 34.58 | 148.48 |
| - Maximum Value | 73 | 207.96 | 134.10 | 0.50 | 509.00 | 220.50 | 87.60 | 324.50 |
| Transferrin mg/dl | ||||||||
| - Minimum | 43 | 120.56 | 67.61 | 25.00 | 284.00 | 124.00 | 67.00 | 173.00 |
| - Mean | 43 | 140.18 | 63.38 | 25.00 | 284.00 | 130.11 | 86.25 | 196.00 |
| - Maximum Value | 43 | 165.84 | 69.50 | 25.00 | 297.00 | 162.00 | 105.00 | 211.00 |
| Total | ||||||||
| - Minimum | 247 | 123.68 | 308.06 | 0.50 | 3245.00 | 25.00 | 9.00 | 104.00 |
| - Mean | 247 | 253.55 | 748.83 | 0.50 | 9446.00 | 82.22 | 36.33 | 175.28 |
| - Maximum Value | 247 | 466.67 | 1810.28 | 0.50 | 21736.00 | 127.00 | 58.60 | 284.00 |
Table 3.
HEM-Database. Ferritin and Statistical Association.
| Variable | Category | N | Mean | SD | Min | Max | P50 (Median) | P25 | P75 | Rank-Sum Test | Significant Difference |
| Ferritin ng/ml (minimum) | Sex | ||||||||||
| Female | 17 | 321.35 | 393.35 | 21.00 | 1583.00 | 137.00 | 67.00 | 458.00 | p = 0.0467 | Yes (p < 0.05) | |
| Male | 27 | 602.81 | 680.53 | 57.00 | 3245.00 | 352.00 | 224.00 | 1044.00 | |||
| Total | 44 | 494.07 | 597.34 | 21.00 | 3245.00 | 319.50 | 128.00 | 496.50 | |||
| Ferritin ng/ml (minimum) | Survival | ||||||||||
| No | 11 | 348.00 | - | - | - | - | - | - | p = 0.0064 | Yes (p < 0.01) | |
| Yes | 33 | 642.00 | - | - | - | - | - | - | |||
| Ferritin ng/ml (mean) | Survival | ||||||||||
| No | 11 | 1971.20 | 2650.80 | 67.00 | 9446.00 | 939.00 | 570.82 | 2508.75 | p = 0.0407 | Yes (p < 0.05) | |
| Yes | 33 | 725.61 | 812.97 | 44.00 | 3850.22 | 451.88 | 212.67 | 968.00 | |||
| Total | 44 | 1037.01 | 1556.81 | 44.00 | 9446.00 | 541.67 | 322.45 | 1348.00 |
Table 4.
Combined Analysis (Mann-Whitney U Test and Spearman Correlations).
| Test Type | Variable 1 | Variable 2 / Category | Group1 / Rho | Group2 / p | z / Significant | Significant |
| Mann-Whitney U Test | Ferritin (minimum) | Sex | Female | Male | -1.989 | 0.0467 |
| Ferritin (minimum) | Survival | No | Yes | 2.724 | 0.0064 | |
| Iron (minimum) | Infection | No | Yes | 3.153 | 0.0012 | |
| Iron (minimum) | Location (OTHERS) | No | Yes | 2.035 | 0.0401 | |
| IST (minimum) | Survival | No | Yes | 2.132 | 0.0321 | |
| IST (maximum) | Mechanical Ventilation | No | Yes | -2.120 | 0.0336 | |
| Transferrin (minimum) | Infection | No | Yes | 2.364 | 0.0172 | |
| Spearman Correlations | SOFA | Ferritin (minimum) | -0.4354 | 0.0035 | - | Yes |
| Days in ICU | Transferrin (minimum) | -0.4750 | 0.0013 | - | Yes | |
| Days on MV | Transferrin (minimum) | -0.3974 | 0.0083 | - | Yes |
Table 5.
Statistical Analysis by CRP.
| Variable | Category/Variable 2 | Group 1 | Group 2 | z/Rho | p (Exact) | Significant |
| CRP (mean) | Survival | No | Yes | 3.360 | 0.0005 | Yes |
| CRP (maximum) | Survival | No | Yes | 3.489 | 0.0003 | Yes |
| CRP (maximum) | AKI | No | Yes | -3.752 | 0.0001 | Yes |
| SOFA Score | PCR (maximum) | - | - | 0.5503 | 0.0000 | Yes |
| Days on MV | PCR (maximum) | - | - | 0.5206 | 0.0000 | Yes |
| Apache II Score | PCR (maximum) | - | - | 0.4851 | 0.0000 | Yes |
Table 6.
Analysis Between the Cutoff of CRP of 145.
| Variable | Group CRP < 145 (0) | Group CRP ≥ 145 (1) | Statistical Test | p-value |
| Age (years) | Mean: 50.87 (SD: 17.75) Median: 51.50 (37.00-64.50) |
Mean: 59.71 (SD: 16.39) Median: 62.00 (50.00-74.00) |
Wilcoxon (z = -1.951) | 0.0511 |
| ICU Stay (days) | Mean: 10.50 (SD: 15.19) Median: 5.00 (2.00-9.00) |
Mean: 22.67 (SD: 25.53) Median: 11.00 (6.00-28.00) |
Wilcoxon (z = -2.972) | 0.0030 |
| Survival (%) | Yes: 94.23% No: 5.77% |
Yes: 52.38% No: 47.62% |
Chi-square (χ2 = 17.8994) | <0.001 |
| Apache II Score | Mean: 10.92 (SD: 6.29) Median: 10.00 (6.00-16.00) |
Mean: 15.45 (SD: 6.57) Median: 14.00 (10.50-20.50) |
Wilcoxon (z = -2.523) | 0.0116 |
| SOFA Score | Mean: 3.14 (SD: 3.15) Median: 2.00 (1.00-4.00) |
Mean: 5.15 (SD: 3.57) Median: 5.00 (2.00-8.50) |
Wilcoxon (z = -2.177) | 0.0295 |
| Mechanical Ventilation (%) | Yes: 34.62% No: 65.38% |
Yes: 71.43% No: 28.57% |
Chi-square (χ2 = 8.1842) | 0.004 |
| Days on Mechanical Ventilation | Mean: 4.29 (SD: 9.25) Median: 0.00 (0.00-2.50) |
Mean: 12.90 (SD: 19.72) Median: 3.00 (0.00-12.00) |
Wilcoxon (z = -2.894) | 0.0038 |
| AKI (%) | Yes: 17.65% No: 82.35% |
Yes: 42.86% No: 57.14% |
Chi-square (χ2 = 5.0420) | 0.025 |
| Infection (%) | Yes: 30.77% No: 69.23% |
Yes: 66.67% No: 33.33% |
Chi-square (χ2 = 7.9631) | 0.005 |
Disclaimer/Publisher’s Note: The statements, opinions and data contained in all publications are solely those of the individual author(s) and contributor(s) and not of MDPI and/or the editor(s). MDPI and/or the editor(s) disclaim responsibility for any injury to people or property resulting from any ideas, methods, instructions or products referred to in the content. |
© 2025 by the authors. Licensee MDPI, Basel, Switzerland. This article is an open access article distributed under the terms and conditions of the Creative Commons Attribution (CC BY) license (http://creativecommons.org/licenses/by/4.0/).
Copyright: This open access article is published under a Creative Commons CC BY 4.0 license, which permit the free download, distribution, and reuse, provided that the author and preprint are cited in any reuse.


