
Submitted:
20 September 2025
Posted:
22 September 2025
You are already at the latest version
Abstract
The human gut hosts approximately 100 trillion microbes, forming a complex ecosystem critical to the body’s metabolism, nutrition, and immune function. Despite growing research, African Americans remain underrepresented in clinical studies. This study addresses the gap through a comprehensive meta-analysis of gut microbiome datasets. Fecal sample data from amplicon sequencing were analyzed using a bioinformatics pipeline that incorporated DADA2 for sequence processing and Phyloseq for diversity analysis within RStudio. Statistical approaches, including Wilcoxon tests, Kruskal-Wallis tests, PERMANOVA, and ANCOM-BC, identified significant microbial differences. Results revealed that African Americans exhibited lower microbial diversity. Beta diversity metrics demonstrated a stronger effect of ethnicity compared to diet, age, sex, and BMI, highlighting its significance in microbiome variation. Similarly, ANCOM-BC identified Clostridium sensu stricto 1 significantly enriched in healthy African Americans, while Dialister was depleted, a finding with potential clinical relevance given previous research linking reduced Dialister abundance with depression. Additionally, machine learning approaches were found to potentially complement traditional statistical methods by handling class imbalance and identifying complex microbial associations. By addressing critical gaps in microbiome research, this study underscores the importance of inclusive datasets in enhancing disease risk prediction and ensuring that microbiome-based health interventions are equitable and broadly applicable.
Keywords:
gut
; microbiome
; African American
; meta-analysis
; machine learning
; ethnicity
1. Introduction
1.1. The Global Microbiome
The microbiome is a community of microorganisms that interacts with the host and the environment, contributing to the ecosystem in unique ways [1]. For example, bacteria residing in the gut can aid in digestion, synthesize important nutrients such as vitamin K, and even promote angiogenesis [2]. In the soil, studies show microorganisms facilitate its development and plant growth through symbiotic relationships and cycle carbon, nitrogen, and other elements [3]. Similarly, it is believed that the first synthesizer of oxygen was cyanobacteria, and even today, microorganisms in the oceans make up half of the oxygen on Earth [4]. The dynamic interplay between microbiomes, their hosts, and surrounding environments underscores their fundamental importance in sustaining the natural ecosystem and promoting health across diverse biological systems.
1.2. The Gut Microbiome
Considering the microbiome in different environments, one of the most important environments related to human health is the gut microbiome. The human gut microbiome is a dynamic and complex community of microorganisms that includes bacteria, fungi, viruses, and archaea residing in the gastrointestinal tract. These microbes play a fundamental role in digestion, metabolism, immune regulation, and even neurological function. With about 100 trillion microbes, human cells are at least outnumbered by a factor of one—the gut microbiome is now regarded as an essential organ-like entity [5]. Its influence goes beyond gut health, with new evidence linking microbiome composition to metabolic disorders, inflammatory diseases, mental health issues, and cancer development [6].
Given its extensive genetic and functional diversity, the gut microbiome offers a remarkable opportunity for scientific discovery [7]. Researchers are now studying how microbial imbalances contribute to disease and how microbiome-targeted therapies could enhance health outcomes. However, gaps still exist in our understanding, especially regarding microbiome differences across various populations.
Although the gut microbiome has gained significant attention in modern science, its recognition goes back much earlier. In the 17th century, Antonie van Leeuwenhoek (1632-1723) was the first to observe and document microorganisms from stool and saliva samples [8]. Even before that, ancient medical traditions recognized the gut’s importance. Hippocrates famously said that “all disease begins in the gut,” a view also echoed in Ayurveda, the traditional Indian medicine system (dating back to 1500 BCE). Ayurvedic practices, such as emphasizing dietary diversity, fermented foods, fiber-rich plants, and herbs, are now understood to help support a healthy gut microbiome [9].
Although there was an early understanding of gut health, it was not until the 19th century that scientists began to realize the importance of intestinal microbes. The development of germ theory, probiotics, and the discovery of the gut’s extensive neural networks, sometimes called the “second brain,” laid the groundwork for modern microbiome research [8].
To deepen our understanding of the gut microbiome’s role in health and disease, researchers increasingly use meta-analysis, a statistical approach that combines findings from multiple studies. This method allows for cross-validation of associations across different populations and study designs, leading to new discoveries that individual studies might miss due to limited sample sizes or specific demographic constraints. For example, essential microbial and metabolic biomarkers linked to colorectal cancer have been identified through a meta-analysis, revealing patterns that can support early diagnosis and intervention processes [10].
However, microbiome research remains disproportionately focused on certain populations, leaving substantial gaps in knowledge about underrepresented groups. For example, in a 2018 study on gut microbiome diversity across ethnicities in the United States, only 13 African American (AA) participants out of 1,375 individuals were included, highlighting a significant imbalance in research representation [11]. To address this disparity, this study systematically compiled and analyzed microbiome datasets, with a focus on African Americans. By combining findings from various studies, this research seeks to promote a more inclusive and comprehensive understanding of the gut microbiome’s role in health and disease.
2. Materials and Methods
2.1. Study Population and Data Collection
A literature review and search initially identified studies that conducted metagenomic and metabolomic analyses of gut microbiome data, focusing on African Americans or other minority groups. The next step was to select studies based on the inclusion criteria: (a) studies used fecal samples, (b) employed 16S ribosomal RNA (rRNA) amplicon sequencing, (c) metadata included demographic information, and (d) raw sequence data were available for download. Studies were excluded if they lacked demographic data or involved populations of infants and pregnant women. When raw sequence data or metadata were not publicly available, the authors of the papers were contacted via email to request the data.
Initially, the Microbial Metabolites Database (MiMeDB) and the Microbiome Metabolome Integration Platform (MMIP) were used to search for microbiome and metabolome data. However, due to the lack of straightforward demographics data, Google Scholar and PubMed were used along with Gene Expression Omnibus (GEO). “gut microbiome” AND “metabolome” AND “”16S” OR “Amplicon”” AND “fecal” was the search query used for conducting a general search and to gain an understanding of the research present so far in this field. Then, a more focused search using the query “gut” AND “microbiome” AND “metabolome” AND “16s rRNA” OR “amplicon” AND “African American” AND “PRJ” OR “PRE” was conducted. The new query with the added variables was necessary to gain a clear understanding of whether research has covered African Americans. The “PRJ” and “PRE” queries were added to ensure the papers included data that could be accessed through the National Center for Biotechnology Information (NCBI) or the European Molecular Biology Laboratory’s European Bioinformatics Institute (EMBL-EBI), and 571 results from found from Google Scholar. PubMed resulted in only fourteen results (PRJ and PRE queries had to be removed to find relevant papers since adding those resulted in zero results).
The search resulted in identifying fifteen studies containing 16S rRNA fecal microbiome data. One study was excluded because demographic data were requested from the authors but not available, leaving a final total of fourteen studies. The National Center for Biotechnology Information Sequence Read Archive (NCBI SRA) public repository was the source from which raw FASTQ files were downloaded. Metadata was collected either from the supplementary information of the study or from SRA. Samples from individuals under eighteen and pregnant women were not included in the analysis. The methodology flowchart of the entire process is shown in Figure 1.
For the purposes of this study, ethnic groups were classified as follows: African Americans (U.S. citizens of African descent, distinguished from the broader Black category), Caucasian (individuals of European descent worldwide), Asian (East, South, and Southeast Asian descent), Hispanic/Latino (individuals of Latin American descent), Native American (indigenous peoples of North America), Multiracial (individuals identifying with two or more racial categories), and Other (individuals not fitting the above categories). See Table A1 and Table A2 in the Appendix.
2.2. Data Processing and Quality Control
Raw FASTQ files were downloaded and split into their respective forward and reverse files using QIIME. Folders for each study were created chronologically from 1 to 14, and related files were saved in their respective folders. The sequence data for each study were filtered to a maximum of 10,000 reads. DADA2 in RStudio was used to process raw fastq files and obtain the ASV tables.
2.2.1. Metadata Coercion
To ensure consistency in the metadata across studies, column names were systematically standardized. First, relevant columns such as Run, BioProject, Age, Sex, BMI, Country, Continent, Ethnicity or Race, and Treatment or Condition were extracted and uniformly formatted. While demographic data were included whenever possible, for studies conducted in specific countries, geographic proxies were used to infer ethnicity—for example, samples from India and China were classified as “Asian” (n = 175), and samples from an Italian cohort (n = 31) were classified as “Caucasian” [12]. All other studies contained explicit demographic data. This approach aimed to include data from Asian populations not covered in previous meta-analyses. When Age and BMI data were unavailable for individual samples, mean values reported in the papers were used and added to the metadata. The Treatment/Condition column was replaced with a new “Study.Group” column, indicating whether patients were “Healthy” or “Diseased,” with careful verification that treatment samples were collected before intervention.
2.2.2. DADA2
DADA2 is an RStudio package designed for modeling and correcting errors in Illumina-sequenced amplicon data. It accurately infers sample sequences, differentiating sequences by as little as one nucleotide without grouping them into Operational Taxonomic Units or OTUs [13]. Instead, a quality-aware error model enables the construction of Amplicon Sequence Variants (ASVs). DADA2 enhances the accuracy of diversity and dissimilarity measurements, potentially allowing for strain-level variation studies using amplicon methods. Unlike methods that create OTUs, DADA2 preserves biological information by precisely reconstructing amplicon-sequenced communities at high resolution [13]. In this study, the DADA2 pipeline was used for quality filtering, denoising, and merging amplicon sequence data from the downloaded 16S rRNA sequencing data [13]. All procedures were conducted in R version 4.0.3, with the DADA2 pipeline implemented via the dada2 package (v1.16.0). Additional visualizations were carried out using the ggplot2 (v3.3.3) and phyloseq (v1.32.0) packages. Taxonomic assignment was performed by comparing sequences against a SILVA database (silva_nr99_v138.1_train_set.fa) as the reference.
2.2.3. Statistical Analysis
Data was analyzed using specific groupings for comparison: (a) Grouping by Health Status—Healthy versus Diseased, (b) Grouping by African American (AA) Status—African American versus Non-African Americans (non-AA), and (c) Grouping by Health Status within African Americans—Healthy African Americans versus Healthy Non-Africans.
Alpha diversity is a measure of within-sample diversity [14]. This measure encompasses the number of different organisms, also referred to as richness, and the evenness of their distribution [14]. The two commonly used indices for alpha diversity are the Shannon Index and the Simpson Index [15,16]. While the Shannon index is useful for assessing the overall community structure, the Simpson Index, with its focus on more dominant species, can highlight if certain taxa are overrepresented within a sample.
Alpha diversity was calculated using unfiltered counts from the Phyloseq object. Shannon and Simpson indices were computed, and their significance was assessed with the Wilcoxon Rank Sum Test and Kruskal-Wallis Test. P-values from pairwise comparisons were adjusted with the Benjamini-Hochberg (BH) procedure to control the false discovery rate [17]. This adjustment was necessary to reduce false positives when performing multiple statistical tests across different demographic groups.
Beta diversity measures the between-sample diversity, revealing how species composition varies across different locations or communities [14]. It enables a spatial understanding of biodiversity patterns by quantifying the differences between groups. One method of this spatial approach is through Bray-Curtis dissimilarity, a statistical measure that assesses the dissimilarity in species composition between two sites based on the abundance data of the gut microbiome [18]. In this study, this measurement was applied to compare microbial communities between ethnicities.
Since data varied in the number of total reads, normalization was conducted by Cumulative Sum Scaling (CSS), where all samples were scaled to the sequencing depth of the smallest sample [19]. This normalization approach was conducted to mitigate bias from samples with a higher number of reads. Finally, Permutational Multivariate Analysis of Variance (PERMANOVA), a non-parametric test that assesses whether the centroids and dispersion of groups differ in multivariate space, was conducted to determine whether observed differences between ethnic groups were statistically significant [20].
The merged phyloseq object created from the Data Integration step was used to develop a taxonomic tree for a straightforward visualization of microbial composition of all studies. The treeio package and ggtree package were used for the tree construction and visualization, respectively [21,22]. A prevalence analysis of the complete dataset was also conducted by using the abundance data of the top genera in each ethnic group to examine how they differ from one another.
Observing the Firmicutes/Bacteroidota ratio is a common method for understanding the composition of bacteria in samples, as they consistently dominate the gut microbiome. After aggregating taxa to the phylum level, the total count per sample for each phylum was obtained. Then, the Log2 ratio of Firmicutes over Bacteroidota was calculated. The mean of the F/B ratio was also calculated to get a better visualization between healthy and diseased African Americans versus other ethnicities.
Differential abundance analysis (DAA) is another important statistical measure for identifying microbial taxa that differ significantly in abundance between conditions or groups. One method of DAA is the Analysis of Compositions of Microbiomes with Bias Correction (ANCOM-BC) [23]. ANCOM-BC corrects for sample-specific biases that can affect microbiome data, allowing researchers to identify which specific bacteria are truly different between groups by analyzing absolute abundance rather than just relative proportions [23]. This study was conducted to investigate the differential abundance of microbial composition in city-specific data and the complete dataset between healthy African Americans and healthy non-African Americans.
2.2.4. Preliminary Machine Learning Application for Ethnicity Prediction
Although Random Forest classifiers have consistently shown superior performance in microbiome data prediction, this meta-analysis aims to explore newer algorithmic approaches. Using the extensive feature set available, gradient boosting algorithms were chosen to assess potential improvements in predictive modeling beyond traditional Random Forest methods, such as LightGBM, XGBoost, and AdaBoost. Random Forest was also used for comparison.
Gradient boosting algorithms are machine learning methods that build decision trees sequentially, with each new tree aiming to correct the errors of the combined previous trees, thereby gradually enhancing the overall prediction accuracy [24]. AdaBoost, introduced in 1995, was a pioneer in this area, emphasizing learning from weaker models [25]. XGBoost further advanced the field by adding regularization and system optimization, which boosted both prediction accuracy and efficiency [26]. The latest algorithm extends these concepts using innovative sampling and feature compression techniques [27].
The ASV and taxonomy tables from the merged phyloseq object were exported as individual .csv files. For the ASV data, normalization was performed using log transformation. The exported data files were then used for machine learning (ML) analysis in Google Colab.
Google Colaboratory (Colab) is a cloud platform that allows free, browser-based execution of Python code. It has become popular for machine learning development because of its accessible GPU resources and collaborative features [28]. The exported CSV files—ASV, taxonomy, and metadata—were combined into a single data frame called merge_all and saved as a CSV file.
Missing values were addressed using suitable domain strategies: numerical features were filled with zeros, and categorical features were replaced with empty strings. Features with few occurrences (n < 6) were eliminated to decrease dimensionality and reduce noise.
The data was divided into train (80%), validation (10%), and test (10%) sets. These splits were stratified to keep class distributions consistent across all partitions, ensuring that each subset accurately represents the original data. The preprocessor was designed to identify categorical and numerical features, with categorical features being transformed using one-hot encoding. After preprocessing, hyperparameter tuning was performed for each candidate model. Initially, models were trained on the training set and then iteratively refined based on validation set performance metrics. The final evaluation used the test set to unbiasedly assess the predictive performance of all the algorithms implemented.
3. Results
From the data collection, a total of 1,836 amplicon sequenced samples were considered for the data analysis consisting of different ethnicities: African American (n=274), Asian (n=307), Caucasian (n=1028), Hispanic/Latino (n=160), Native American (n=3), Multiracial (n=55), and Other (n=9). After DADA2 analysis which included filtering and quality control, the remaining samples were: African American (n=245), Asian (n=250), Caucasian (n=925), Hispanic/Latino (n=85), Native American (n=2), Multiracial (n=27), and Other (n=9). Native American, Multiracial and Other were combined into Multiracial/Other for analysis since the sample sizes were small.
3.1. Alpha Diversity
The Shannon Diversity Index across various ethnicities, analyzed using pairwise Wilcoxon tests with BH adjustment, showed significant differences (p < 0.05) between all groups (Figure 2). Additionally, a Kruskal-Wallis test considering the different levels confirmed these differences as highly significant (p < 0.05).
The samples were grouped into healthy and diseased categories to examine differences in diversity. The Wilcoxon test showed significance as well (p < 0.05). Grouping African Americans and non-African Americans also showed significant differences with the Wilcoxon test (p < 0.05), with AA showing lower diversity.
Simpson diversity also showed significant differences for ethnicity, as determined by the Kruskal-Wallis test, as well as pairwise comparisons using the Wilcoxon test (Figure 3). Health status barely reached significance (p = 0.05959). However, Simpson diversity for healthy AA and healthy non-AA showed a significant difference with a Wilcoxon test p-value of 0.000288. At the same time, while the mean was lower for AA compared to Non-AA the higher standard deviation points to greater heterogeneity within the AA population.
3.2. Beta Diversity
Beta diversity was analyzed across different ethnicities, comparing African Americans and non-African Americans, as well as healthy and diseased groups. The analysis used Principal Coordinate Analysis (PCoA) based on Bray-Curtis dissimilarity, with PERMANOVA conducted using 9999 permutations (see Figure 4). This permutational multivariate analysis of variance evaluated how various factors influenced microbial community composition, reaffirmed with 9,999 permutations.
The PERMANOVA results indicated that ethnicity was significantly associated with microbial composition (R2 = 0.0346, F = 7.952, p < 0.0001). Health status also had a significant effect (R2 = 0.00502, F = 6.745, p < 0.0001), as did African American status (R2 = 0.0038, F = 5.1035, p < 0.0001), sex (R2 = 0.00374, F = 5.0254, p < 0.0001), age (R2 = 0.01663, F = 22.607, p < 0.0001), and BMI (R2 = 0.00446, F = 5.9879, p < 0.0001). These findings suggest that microbial community composition is driven by a combination of all these factors.
To assess the homogeneity of dispersion among groups, a permutation test for homogeneity of multivariate dispersion was performed. The test revealed significant differences in dispersion for ethnicity (F = 32.537, p < 0.0001), health status (F = 31.921, p < 0.0001), age (F = 5.761, p < 0.0001), and BMI (F = 7.0923, p < 0.0001). However, differences in dispersion for African American status (F = 2.5386, p = 0.1108) and sex (F = 2.211, p = 0.1344) were not significant.
These results indicate that while all tested variables significantly influenced microbial community composition, some factors (such as ethnicity and health status) also showed significant variation in dispersion, suggesting differences in variability among groups. This is further strengthened by the Principal Coordinate Analysis (PCoA) of Bray-Curtis dissimilarities, which revealed clustering patterns based on both ethnicity and health status. The first two axes explained 16.7 % of the total variation (Axis 1: 10.5%, Axis 2: 6.2%).
3.3. Micorbial Composition
A taxonomic tree was constructed by adopting the workflow from a previously published method [29]. It presents the top 5 phyla across the 15 studies gives a quick overview of the composition of microbiota (Figure 5). Looking further into the composition required calculating relative abundances. Firmicutes (51.23%) were the most abundant bacteria followed by Bacteroidota (36.11%), Proteobacteria (4.04%), Actinobacteria (3.86%), Verrucomicrobiota (2.21%), and Euryarchaeota (1.77%). The remaining taxa constituted 0.78% of the total composition.
The analysis revealed distinct patterns in microbiome composition across ethnic groups. Firmicutes abundance was highest in Caucasian (Mean CLR: 0.449) and Asian (Mean CLR: 0.398) populations, while showing lower levels in Multiracial and Native American groups. Bacteroidota demonstrated peak abundance in Multiracial (Mean CLR: 0.518) and Hispanic/Latino (Mean CLR: 0.417) populations. Notably, the study’s sample sizes varied considerably, with Caucasian participants representing the largest group (n = 925) and Native Americans the smallest (n = 2), which limits statistical inference for the latter group. Verrucomicrobiota and Actinobacteriota remained consistently low across all ethnicities. Microbiome composition variability was most pronounced in Native American and Multiracial groups, suggesting potential genetic or environmental factors influencing bacterial community structures. Center Log-Ratio (CLR) transformation was employed to handle compositional data, providing a normalized view of bacterial abundance across different ethnic groups.
Further prevalence analysis revealed statistically significant differences among specific ethnic groups. The Wilcoxon pairwise comparisons showed: Caucasian vs. African American for Firmicutes (p = 9.187050×10⁻¹⁸), Bacteroidota (p = 2.053122×10⁻⁸), and Actinobacteriota (p = 2.426465×10⁻⁷); Asian vs. Caucasian for Proteobacteria (p = 7.817304×10⁻⁷) and Verrucomicrobiota (p = 6.707755×10⁻²⁷). Caucasians (shaded in gray in Table 1) consistently showed the highest prevalence across most phyla, with Firmicutes at 99.02%, Bacteroidota at 96.31%, Actinobacteriota at 92.40%, Proteobacteria at 88.93% and Verrucomicrobiota at 62%. Verrucomicrobiota demonstrated the most substantial inter-ethnic variation, from 24.10% in Asians to 43.75% in African Americans, and 62% in Caucasians. Multiracial individuals, and other groups were excluded from the analysis because their results did not reach significance and their sample sizes were relatively small.
Since Firmicutes and Bacteroidota were the predominant phyla observed, their ratio was also examined. Previous studies have linked the Firmicutes-to-Bacteroidota (F:B) ratio to obesity and its potential role as a disease biomarker. However, its reliability remains debated, as some studies suggest that the correlation is inconsistent, given the substantial variability in F:B ratios even among individuals within the same population due to various influencing factors [30]. Nevertheless, given the high abundance of these two phyla, omitting an analysis of their ratio would overlook potentially valuable insights. This analysis aimed to further explore such variability across different ethnic groups.
Analysis of the Firmicutes-to-Bacteroidetes (F:B) ratio across ethnic groups and disease status in our comprehensive dataset revealed interesting. The F:B ratio is presented on a log2 scale, with positive values indicating Firmicutes dominance and negative values indicating Bacteroidetes dominance. Asian populations exhibited the highest F:B ratio in healthy individuals, around 2.0, while Caucasian populations showed relatively high F:B ratios in both groups (Figure 6).
Other/Multiracial and Hispanic/Latino groups show the lowest F:B ratios, close to zero or negative, suggesting a higher prevalence of Bacteroidota compared to Firmicutes. However, these results might be influenced by a small sample size in these groups. In most ethnicities, the healthy (blue) group has a higher F:B ratio than the diseased (red) group. This difference is especially noticeable in Asian and Other/Multiracial populations.
The exception is Caucasians, where those with the disease show a slightly higher F:B ratio. Error bars (black lines) indicate substantial variation within each group. Other/Multiracial shows the highest variability, particularly in the disease group. Asian healthy individuals exhibit considerable variability, despite having the highest mean value.
Different ethnic backgrounds appear to have distinct baseline F:B ratios. Disease states appear to alter this ratio differently across different ethnicities. This suggests that ethnicity should be considered when using the F:B ratio as a biomarker. F:B ratio differences reached significance (p < 0.05) between ethnicities for both healthy and diseased individuals via the Wilcoxon test, although the sample sizes compared for Native American and Other/Multiracial groups are very small for each group. This data indicates that microbiome composition varies significantly by ethnicity and health status, suggesting that “normal” or “healthy” microbiome profiles may be ethnicity-specific, and interventions targeting the microbiome might need to be tailored accordingly. F:B ratio differences reached significance (p < 0.05) between the ethnicities for both healthy and disease via the Wilcoxon test although sample sizes compared for Native American and Other/Multiracial is very small for each group.
3.4. ANCOM-BC
The ANCOM-BC analysis was conducted on Healthy African Americans versus Healthy Non-Americans. This was to gain a better understanding of the differences of microbial composition when not confounded by disease status. The study identified 10 statistically significant taxa out of 31 analyzed, with notable variations in bacterial abundance across different general genres (Figure 7).
Genera showed substantial changes in their relative abundance. Dialister stood out as the most depleted taxon in the healthy African American group, with a log2 fold change of -2.056 and an extremely low p-value of 4.43e-41. Conversely, Clostridium sensu stricto 1 emerged as the most enriched genus, with a log2 fold change of +1.848 and a similarly significant p-value of 2.35e-21.
Most notable changes occurred within the Firmicutes phylum, especially in families such as Lachnospiraceae and Clostridiaceae. Although many taxa showed little variation, the genera with significant changes likely reflect meaningful shifts in microbiome composition. The volcano plot visually supported these results, with blue points indicating taxa that were depleted and red points showing taxa that were enriched in the healthy African American group.
These findings suggest potential ethnic-specific variations in microbiome composition, which may be influenced by genetic, dietary, or environmental factors. The extreme statistical significance of these variations warrants further investigation to understand their potential clinical or biological implications.
3.5. Machine Learning for Ethnicity Prediction
To address the issues of confounding variables and the multidimensional nature of microbial data, machine learning was employed to investigate whether ethnicity could be predicted based on the data. Four models were implemented including LightGBM, XGBoost, AdaBoost and Random Forest.
After training and validation steps, LightGBM performed the best in ethnicity prediction, followed by XGBoost, AdaBoost, and Random Forest. LightGBM and XGBoost performed with similar accuracy (Figure 8 and Table A1).
The LightGBM model showed variable performance across different ethnic groups. The confusion matrix reveals several important patterns (Figure 9). Caucasians demonstrated the highest prediction accuracy with 131 correct classifications. However, 8 African Americans, 6 Asians, 5 Hispanic/Latino individuals, 2 Multiracial individuals, and 1 individual of another race were incorrectly classified as Caucasian. African Americans achieved moderate prediction accuracy with 25 correct classifications, while 4 were misclassified as Asian and 8 as Caucasian. Asians demonstrated good prediction accuracy, with 27 correct classifications, although some misclassifications were observed across other groups. The Hispanic/Latino group demonstrated poor prediction performance, with only 5 correct classifications out of 13 total individuals. Multiracial very low prediction accuracy with only 1 correct classification out of 4 individuals. Finally, the Other group had no correct classifications for this category. Analysis of feature importance in the LightGBM model revealed several bacterial taxa as meaningful predictors of ethnicity from gut microbiome data (Table 2 and FigureA1). The most influential microbial feature was ASV1575, classified as Lachnoclostridium (family Lachnospiraceae), a genus within the Firmicutes phylum known to be involved in carbohydrate and protein metabolism [31].
The next most important bacterial predictors included four distinct Bacteroides species (ASVs 1451, 1514, 7189, and 18151), suggesting this genus plays a significant role in ethnicity-associated microbiome patterns. Additional contributors included Blautia species (ASVs 9672 and 1449), also from the Lachnospiraceae family, which are important butyrate producers. Other significant predictors represented diverse taxonomic groups: Alistipes (Rikenellaceae), members of the Ruminococcaceae family (ASVs 12682 and 1454, classified as UBA1819 and Subdoligranulum, respectively), and an uncultured bacterium from the RF39 order. This taxonomic distribution highlights the importance of Bacteroidetes and Firmicutes phyla, particularly members of the Bacteroidaceae, Lachnospiraceae, and Ruminococcaceae families, in distinguishing gut microbiome compositions between ethnic groups.
4. Discussion
In this study, the gut microbiome composition of African Americans was compared with that of other ethnicities to gain a better understanding of this population’s microbial profile. This investigation is the first to do a large-scale data collection and analysis focusing on the African American population. Despite the growing understanding of the gut microbiome’s crucial role in human health, large-scale initiatives have systematically underrepresented African Americans, creating a significant knowledge deficit that potentially impacts health equity and personalized medical interventions. Even after collecting datasets across 15 studies, African Americans represented only ~15% of the total dataset, while Caucasians represented ~60%, and the remaining ethnicities together represented ~25%.
Our analysis of the African American gut microbiome using the complete dataset uncovered notable taxonomic shifts with possible implications for host health. Alpha diversity analysis showed lower Shannon and Simpson indices in African Americans compared to non-African Americans. The Shannon index measures microbial richness and evenness, indicating that the African American gut community is dominated by fewer species with a less balanced distribution of abundant and rare organisms. The Simpson index, which is more sensitive to dominant species, also being lower, can suggest gut dysbiosis and increased disease susceptibility [32]. This is concerning, given that African Americans already face greater health disparities than their Caucasian counterparts. Additionally, beta-diversity analyses revealed significant ethnic differences in microbial composition. PERMANOVA demonstrated that ethnicity was significantly associated with microbiome variation, even when controlling for variables like sex, age, BMI, and health status. This indicates that ethnicity should be an important factor in microbiome studies and could serve as a useful comparison metric. Binary testing via PERMANOVA confirmed that being African American or not has a significant impact. Consequently, ethnicity and its influence on the gut microbiome of different groups, including African Americans, should be considered in health evaluations and tailored interventions.
At the same time, the test for homogeneity of multivariate dispersion revealed significant differences for ethnicity (F = 32.537, p < 0.0001). The dispersion effect suggests that variability within the groups themselves could be causing differences in the data. However, this underscores the need for more research and a deeper understanding of how gut microbiome varies in underrepresented groups as well. These findings contributed to the broader knowledge that microbial composition is shaped by multiple demographic and health factors, with ethnicity emerging as one of the strongest predictors. The influence of ethnicity, including African American status, highlighted the complex determinants of human microbiome structure.
Differential abundance analysis via ANCOM-BC also revealed significant findings. The significant increase in butyrate-producing bacteria, including Clostridium sensu stricto 1, Agathobacter, and [Eubacterium] siraeum group, aligns with previous research highlighting their essential role in intestinal health [33,34]. At the same time, more research is needed to determine which species of Clostridium sensu stricto are enriched in African Americans since studies have shown some species to be pathogenic in animals and plants [35]. The decreased abundance of most Bacteroides strains is positive because previous findings have demonstrated their enrichment in polyp-positive samples [36]. However, depleted Bacteroides cannot be considered completely positive either since they have a complex relationship within the gut, playing both a beneficial and harmful role as well [37]. Understanding the metabolomic role of the species present can be an avenue of research to elucidate this role.
The reduction in Dialister observed in our cohort is also notable since previous research has linked reduced Dialister abundance with depression [38]. Similarly, Dialister is one of the taxa besides Phascolarctobacterium that consumes succinate in the gut. During the breakdown of carbohydrates into short-chain fatty acids (SCFAs), succinate is an intermediate metabolite [39]. Depleted Dialister can point to lower levels of succinate being metabolized. which could lead to gut dysbiosis. Abnormally increased levels of succinate have been shown in IBD, Crohn’s disease (CD), and ischemia/reperfusion (I/R) [39]. Additionally, the decreased abundance of Christensenellaceae R-7 group warrants further investigation, as Brooks and colleagues identified this family as exhibiting significant ethnic-specific variations. These findings collectively suggest that the gut microbiome profile observed in our African American participants may reflect distinctive adaptations that could influence various health outcomes, including metabolic function, cognitive health, and inflammatory status.
The notable enrichment of Lachnospiraceae is also significant, as its family, Lachnospiraceae, plays a crucial role in SCFA production. This family is consistently associated with various diseases, including diabetes, IBD, CKD, liver disease, obesity, and metabolic syndrome [40]. The observed elevation in Bifidobacterium (genus under Actinobacteria) supports findings of higher Actinobacteria phyla presence in Black women compared to White women regardless of insulin sensitivity [41]. At the same time, one study showed association of abundance of Bifidobacterium with psychological stress [42]. While Bifidobacterium is considered important for gut health as well as immunity, the consistent association of these certain taxa with cognition and mental health warrants further examination [43]. It is also alarming that African Americans’ health may be disproportionately impacted, with microbial influences potentially exacerbating existing socioeconomic disparities.
The limited research on African American gut microbiomes poses a major obstacle to understanding healthcare comprehensively. Past studies have been sporadic and lack depth, failing to reflect the full microbiome diversity within this group. Our machine learning findings emphasize this challenge further. The top-performing model (LightGBM) showed a noticeable bias in prediction accuracy among different ethnic groups. It achieved high accuracy for Caucasian subjects but was less effective for minority groups, including African Americans, Hispanic/Latino, Multiracial, and Other categories. This trend indicates that microbiome signatures for Caucasian individuals might be more distinct or better represented in the training data.
This disparity in representation is reflected in our model metrics, explaining the observed gap between the relatively high overall accuracy (76.6%) and the lower macro-averaged precision, recall, and F1 scores on the validation set. The difficulty in accurately classifying underrepresented ethnic groups highlights a critical need for more diverse and representative microbiome datasets that better capture biological variation across all ethnic populations.
However, our feature importance analysis identified key bacterial taxa linked to ethnicity prediction, providing further biological context for the observed classification patterns. The prominence of Lachnoclostridium (ASV1575) as the top microbial feature matches our differential abundance results, which show increased butyrate-producing bacteria in African American participants. The importance of multiple Bacteroides ASVs is noteworthy given our finding of decreased abundance of most Bacteroides strains in African Americans compared to earlier studies.
Additionally, the importance of Blautia species (ASVs 9672 and 1449) highlights the potential relevance of butyrate-producing bacteria in ethnic microbiome differences, which may have implications for metabolic health disparities. The taxonomic distribution of predictive ASVs suggests that strain-level variations within the same genus contribute differently to ethnicity prediction, revealing microbial signatures that may be missed in broader taxonomic analyses. These findings not only enhance our understanding of ethnicity-associated microbiome patterns but also suggest promising directions for functional profiling studies that could reveal metabolic pathways differing between ethnic groups and potentially informed culturally tailored interventions.
Methodologically, the study used advanced computational techniques to analyze microbiome composition, highlighting the potential for more sophisticated approaches to understanding population-specific variations. The findings indicate that future research should prioritize diverse representation, develop standardized methods, and explore the complex relationships between genetics, environment, and microbiome composition in African American populations.
This research is critical to addressing health disparities and developing more personalized, equitable healthcare approaches. By illuminating the unique microbiome characteristics of African Americans, the study opens new avenues for understanding how microbial composition may influence health outcomes, potentially leading to more targeted prevention and treatment strategies that recognize the biological diversity within this population.
5. Conclusions
This research investigation signifies the first comprehensive meta-analysis of the gut microbiome with a specific focus on African Americans and ethnicity as a key feature. It serves as a valuable foundation for future research on underrepresented groups, aiding in the identification of microbial biomarkers that may contribute to health disparities.
Our feature importance analysis revealed taxonomic patterns, especially involving Lachnoclostridium, Bacteroides, and Blautia species. These findings merit further exploration through targeted culturing and experimental research to understand their functional roles across different ethnic groups. Additionally, taxa linked to cognition and mental health, like Dialister and Bifidobacterium, should be examined more closely. Conducting longitudinal studies to monitor the stability of these ethnicity-related microbiome signatures could help differentiate between genetic, cultural, and environmental factors influencing microbiome composition. Combining host genetic data with microbiome profiles may also shed light on how gene-microbe interactions contribute to health disparities observed among ethnic populations.
Additionally, intervention studies specifically designed for African American populations could evaluate whether culturally tailored dietary modifications might beneficially modulate the microbiome signatures identified in our analysis. The development of ethnic-specific reference ranges for gut microbiome composition would also enhance the clinical interpretation of microbiome data and potentially improve precision medicine approaches.
Beyond its immediate findings, this study underscores the importance of ongoing efforts to enhance representation in microbiome research and to allocate resources toward investigating underrepresented populations in biomedical science. The establishment of community-engaged research practices and partnerships with historically Black institutions could further enhance recruitment and retention of African American participants in microbiome studies, ultimately leading to a more equitable and comprehensive understanding of human microbiome diversity.
While this study offers a unique insight into the gut microbiome in African Americans, it is important to revisit its limitations. The meta-analysis included some methodological variations across the original studies selected. Additionally, despite efforts to include samples from underrepresented groups, the sample sizes were limited. Factors such as diet and socioeconomic status that can influence the gut microbiome were also not collected. Addressing these limitations in future research will help improve our understanding of ethnicity-associated microbiome patterns and their health implications.
Author Contributions
Conceptualization, R. P.; methodology, R. P., A. K.; software, R. P; A. K.; validation, R.P., A. K.; formal analysis, A. K.; investigation, A.K.; resources, R. P.; data curation, A. K.; writing—original draft preparation, A. K.; writing—review and editing, A. K.; R. P.; visualization, A. K.; supervision, R. P.; project administration, R. P.; funding acquisition, Y.Y. All authors have read and agreed to the published version of the manuscript.
Funding
This research received no external funding.
Institutional Review Board Statement
Not applicable.
Informed Consent Statement
Not Applicable.
Data Availability Statement
Model codes and data are available on GitHub.
Acknowledgments
We thank the Department of Computer Science for the financial and other support.
Conflicts of Interest
The authors declare no conflicts of interest.
References
- Leonard, J.M.; Toro, D.D. Defining the Microbiome Components (Bacteria, Viruses, Fungi) and Microbiome Geodiversity. Surg. Infect. 2023, 24, 208–212. [Google Scholar] [CrossRef]
- Zhang, Y.-J.; Li, S.; Gan, R.-Y.; Zhou, T.; Xu, D.-P.; Li, H.-B. Impacts of Gut Bacteria on Human Health and Diseases. Int. J. Mol. Sci. 2015, 16, 7493–7519. [Google Scholar] [CrossRef]
- Wang, X.; Chi, Y.; Song, S. Important Soil Microbiota’s Effects on Plants and Soils: A Comprehensive 30-Year Systematic Literature Review. Front. Microbiol. 2024, 15, 1347745. [Google Scholar] [CrossRef] [PubMed]
- Falkowski, P.G.; Fenchel, T.; Delong, E.F. The Microbial Engines That Drive Earth’s Biogeochemical Cycles. Science 2008, 320, 1034–1039. [Google Scholar] [CrossRef]
- Ferranti, E.P.; Dunbar, S.B.; Dunlop, A.L.; Corwin, E.J. 20 Things You Didn’t Know About the Human Gut Microbiome. J. Cardiovasc. Nurs. 2014, 29, 479–481. [Google Scholar] [CrossRef] [PubMed]
- Lee-Sarwar, K.A.; Lasky-Su, J.; Kelly, R.S.; Litonjua, A.A.; Weiss, S.T. Metabolome–Microbiome Crosstalk and Human Disease. Metabolites 2020, 10, 181. [Google Scholar] [CrossRef]
- Cheng, M.; Cao, L.; Ning, K. Microbiome Big-Data Mining and Applications Using Single-Cell Technologies and Metagenomics Approaches Toward Precision Medicine. Front. Genet. 2019, 10, 972. [Google Scholar] [CrossRef]
- Lewandowska-Pietruszka, Z.; Figlerowicz, M.; Mazur-Melewska, K. The History of the Intestinal Microbiota and the Gut-Brain Axis. Pathogens 2022, 11, 1540. [Google Scholar] [CrossRef]
- Shondelmyer, K.; Knight, R.; Sanivarapu, A.; Ogino, S. Ancient Thali Diet: Gut Microbiota, Immunity, and Health.
- Avuthu, N.; Guda, C. Meta-Analysis of Altered Gut Microbiota Reveals Microbial and Metabolic Biomarkers for Colorectal Cancer. Microbiol. Spectr. 2022, 10, e00013–22. [Google Scholar] [CrossRef] [PubMed]
- Brooks, A.W.; Priya, S.; Blekhman, R.; Bordenstein, S.R. Gut Microbiota Diversity across Ethnicities in the United States. PLOS Biol. 2018, 16, e2006842. [Google Scholar] [CrossRef]
- Vandoni, G.; D’Amico, F.; Fabbrini, M.; Mariani, L.; Sieri, S.; Casirati, A.; Di Guardo, L.; Del Vecchio, M.; Anichini, A.; Mortarini, R.; et al. Gut Microbiota, Metabolome, and Body Composition Signatures of Response to Therapy in Patients with Advanced Melanoma. Int. J. Mol. Sci. 2023, 24, 11611. [Google Scholar] [CrossRef]
- Callahan, B.J.; McMurdie, P.J.; Rosen, M.J.; Han, A.W.; Johnson, A.J.A.; Holmes, S.P. DADA2: High-Resolution Sample Inference from Illumina Amplicon Data. Nat. Methods 2016, 13, 581–583. [Google Scholar] [CrossRef]
- Whittaker, R.H. EVOLUTION AND MEASUREMENT OF SPECIES DIVERSITY. TAXON 1972, 21, 213–251. [Google Scholar] [CrossRef]
- Shannon, C.E. A Mathematical Theory of Communication.
- SIMPSON, E.H. Measurement of Diversity. Nature 1949, 163, 688–688. [Google Scholar] [CrossRef]
- Benjamini, Y.; Hochberg, Y. Controlling the False Discovery Rate: A Practical and Powerful Approach to Multiple Testing. J. R. Stat. Soc. Ser. B Methodol. 1995, 57, 289–300. [Google Scholar] [CrossRef]
- Bray, J.R.; Curtis, J.T. An Ordination of the Upland Forest Communities of Southern Wisconsin. Ecol. Monogr. 1957, 27, 325–349. [Google Scholar] [CrossRef]
- Paulson, J.N.; Stine, O.C.; Bravo, H.C.; Pop, M. Differential Abundance Analysis for Microbial Marker-Gene Surveys. Nat. Methods 2013, 10, 1200–1202. [Google Scholar] [CrossRef] [PubMed]
- Anderson, M.J. A New Method for Non-Parametric Multivariate Analysis of Variance. Austral Ecol. 2001, 26, 32–46. [Google Scholar] [CrossRef]
- Wang, L.-G.; Lam, T.T.-Y.; Xu, S.; Dai, Z.; Zhou, L.; Feng, T.; Guo, P.; Dunn, C.W.; Jones, B.R.; Bradley, T.; et al. Treeio: An R Package for Phylogenetic Tree Input and Output with Richly Annotated and Associated Data. Mol. Biol. Evol. 2020, 37, 599–603. [Google Scholar] [CrossRef] [PubMed]
- Yu, G.; Smith, D.K.; Zhu, H.; Guan, Y.; Lam, T.T. ggtree : An r Package for Visualization and Annotation of Phylogenetic Trees with Their Covariates and Other Associated Data. Methods Ecol. Evol. 2017, 8, 28–36. [Google Scholar] [CrossRef]
- Lin, H.; Peddada, S.D. Analysis of Microbial Compositions: A Review of Normalization and Differential Abundance Analysis. Npj Biofilms Microbiomes 2020, 6, 60. [Google Scholar] [CrossRef]
- Friedman, J.H. Greedy Function Approximation: A Gradient Boosting Machine. Ann. Stat. 2001, 29. [Google Scholar] [CrossRef]
- Freund, Y.; Schapire, R.E. A Decision-Theoretic Generalization of On-Line Learning and an Application to Boosting. J. Comput. Syst. Sci. 1997, 55, 119–139. [Google Scholar] [CrossRef]
- Chen, T.; Guestrin, C. XGBoost: A Scalable Tree Boosting System. In Proceedings of the Proceedings of the 22nd ACM SIGKDD International Conference on Knowledge Discovery and Data Mining; Association for Computing Machinery: New York, NY, USA, 2016; pp. 785–794. [Google Scholar]
- Ke, G.; Meng, Q.; Finley, T.; Wang, T.; Chen, W.; Ma, W.; Ye, Q.; Liu, T.-Y. LightGBM: A Highly Efficient Gradient Boosting Decision Tree. In Proceedings of the Advances in Neural Information Processing Systems; Guyon, I., Luxburg, U.V., Bengio, S., Wallach, H., Fergus, R., Vishwanathan, S., Garnett, R., Eds.; Curran Associates, Inc., 2017; Vol. 30. [Google Scholar]
- Bisong, E. Google Colaboratory. In Building Machine Learning and Deep Learning Models on Google Cloud Platform: A Comprehensive Guide for Beginners; Apress: Berkeley, CA, 2019; ISBN 978-1-4842-4470-8. [Google Scholar]
- Carcy, S.; Ostner, J.; Tran, V.; Menden, M.; Müller, C.L. MetaIBS—Large-Scale Amplicon-Based Meta Analysis of Irritable Bowel Syndrome 2024.
- Magne, F.; Gotteland, M.; Gauthier, L.; Zazueta, A.; Pesoa, S.; Navarrete, P.; Balamurugan, R. The Firmicutes/Bacteroidetes Ratio: A Relevant Marker of Gut Dysbiosis in Obese Patients? Nutrients 2020, 12, 1474. [Google Scholar] [CrossRef] [PubMed]
- Oliphant, K.; Allen-Vercoe, E. Macronutrient Metabolism by the Human Gut Microbiome: Major Fermentation by-Products and Their Impact on Host Health. Microbiome 2019, 7, 91. [Google Scholar] [CrossRef] [PubMed]
- Pickard, J.M.; Zeng, M.Y.; Caruso, R.; Núñez, G. Gut Microbiota: Role in Pathogen Colonization, Immune Responses, and Inflammatory Disease. Immunol. Rev. 2017, 279, 70–89. [Google Scholar] [CrossRef] [PubMed]
- Van Den Abbeele, P.; Belzer, C.; Goossens, M.; Kleerebezem, M.; De Vos, W.M.; Thas, O.; De Weirdt, R.; Kerckhof, F.-M.; Van De Wiele, T. Butyrate-Producing Clostridium Cluster XIVa Species Specifically Colonize Mucins in an in Vitro Gut Model. ISME J. 2013, 7, 949–961. [Google Scholar] [CrossRef]
- Muller, E.; Algavi, Y.M.; Borenstein, E. The Gut Microbiome-Metabolome Dataset Collection: A Curated Resource for Integrative Meta-Analysis. Npj Biofilms Microbiomes 2022, 8, 79. [Google Scholar] [CrossRef]
- Li, C.-J.; Zhang, Z.; Zhan, P.-C.; Lv, A.-P.; Li, P.-P.; Liu, L.; Li, W.-J.; Yang, L.-L.; Zhi, X.-Y. Comparative Genomic Analysis and Proposal of Clostridium Yunnanense Sp. Nov., Clostridium Rhizosphaerae Sp. Nov., and Clostridium Paridis Sp. Nov., Three Novel Clostridium Sensu Stricto Endophytes with Diverse Capabilities of Acetic Acid and Ethanol Production. Anaerobe 2023, 79, 102686. [Google Scholar] [CrossRef]
- Dadkhah, E.; Sikaroodi, M.; Korman, L.; Hardi, R.; Baybick, J.; Hanzel, D.; Kuehn, G.; Kuehn, T.; Gillevet, P.M. Gut Microbiome Identifies Risk for Colorectal Polyps. BMJ Open Gastroenterol. 2019, 6, e000297. [Google Scholar] [CrossRef]
- Wexler, H.M. Bacteroides : The Good, the Bad, and the Nitty-Gritty. Clin. Microbiol. Rev. 2007, 20, 593–621. [Google Scholar] [CrossRef]
- Cheung, S.G.; Goldenthal, A.R.; Uhlemann, A.-C.; Mann, J.J.; Miller, J.M.; Sublette, M.E. Systematic Review of Gut Microbiota and Major Depression. Front. Psychiatry 2019, 10, 34. [Google Scholar] [CrossRef]
- Wei, Y.; Ma, X.; Zhao, J.; Wang, X.; Gao, C. Succinate Metabolism and Its Regulation of Host-Microbe Interactions. Gut Microbes 2023, 15, 2190300. [Google Scholar] [CrossRef]
- Vacca, M.; Celano, G.; Calabrese, F.M.; Portincasa, P.; Gobbetti, M.; De Angelis, M. The Controversial Role of Human Gut Lachnospiraceae. Microorganisms 2020, 8, 573. [Google Scholar] [CrossRef] [PubMed]
- Price, C.A.; Jospin, G.; Brownell, K.; Eisen, J.A.; Laraia, B.; Epel, E.S. Differences in Gut Microbiome by Insulin Sensitivity Status in Black and White Women of the National Growth and Health Study (NGHS): A Pilot Study. PLOS ONE 2022, 17, e0259889. [Google Scholar] [CrossRef] [PubMed]
- Carson, T.L.; Wang, F.; Cui, X.; Jackson, B.E.; Van Der Pol, W.J.; Lefkowitz, E.J.; Morrow, C.; Baskin, M.L. Associations Between Race, Perceived Psychological Stress, and the Gut Microbiota in a Sample of Generally Healthy Black and White Women: A Pilot Study on the Role of Race and Perceived Psychological Stress. Psychosom. Med. 2018, 80, 640–648. [Google Scholar] [CrossRef] [PubMed]
- O’Callaghan, A.; Van Sinderen, D. Bifidobacteria and Their Role as Members of the Human Gut Microbiota. Front. Microbiol. 2016, 7. [Google Scholar] [CrossRef]
Figure 1.
Methodology Flowchart: Raw 16S rRNA sequencing data were collected, followed by data cleaning, metadata organization, and fastq files processing using QIIME2 and DADA2 analysis. Outputs included amplicon sequence variant (ASV) tables, taxonomy tables (aligned against the SILVA 138.1 reference database), and Phyloseq objects. These datasets were used for downstream analyses, including diversity assessment (alpha and beta diversity), visualization, statistical testing, and machine learning applications.
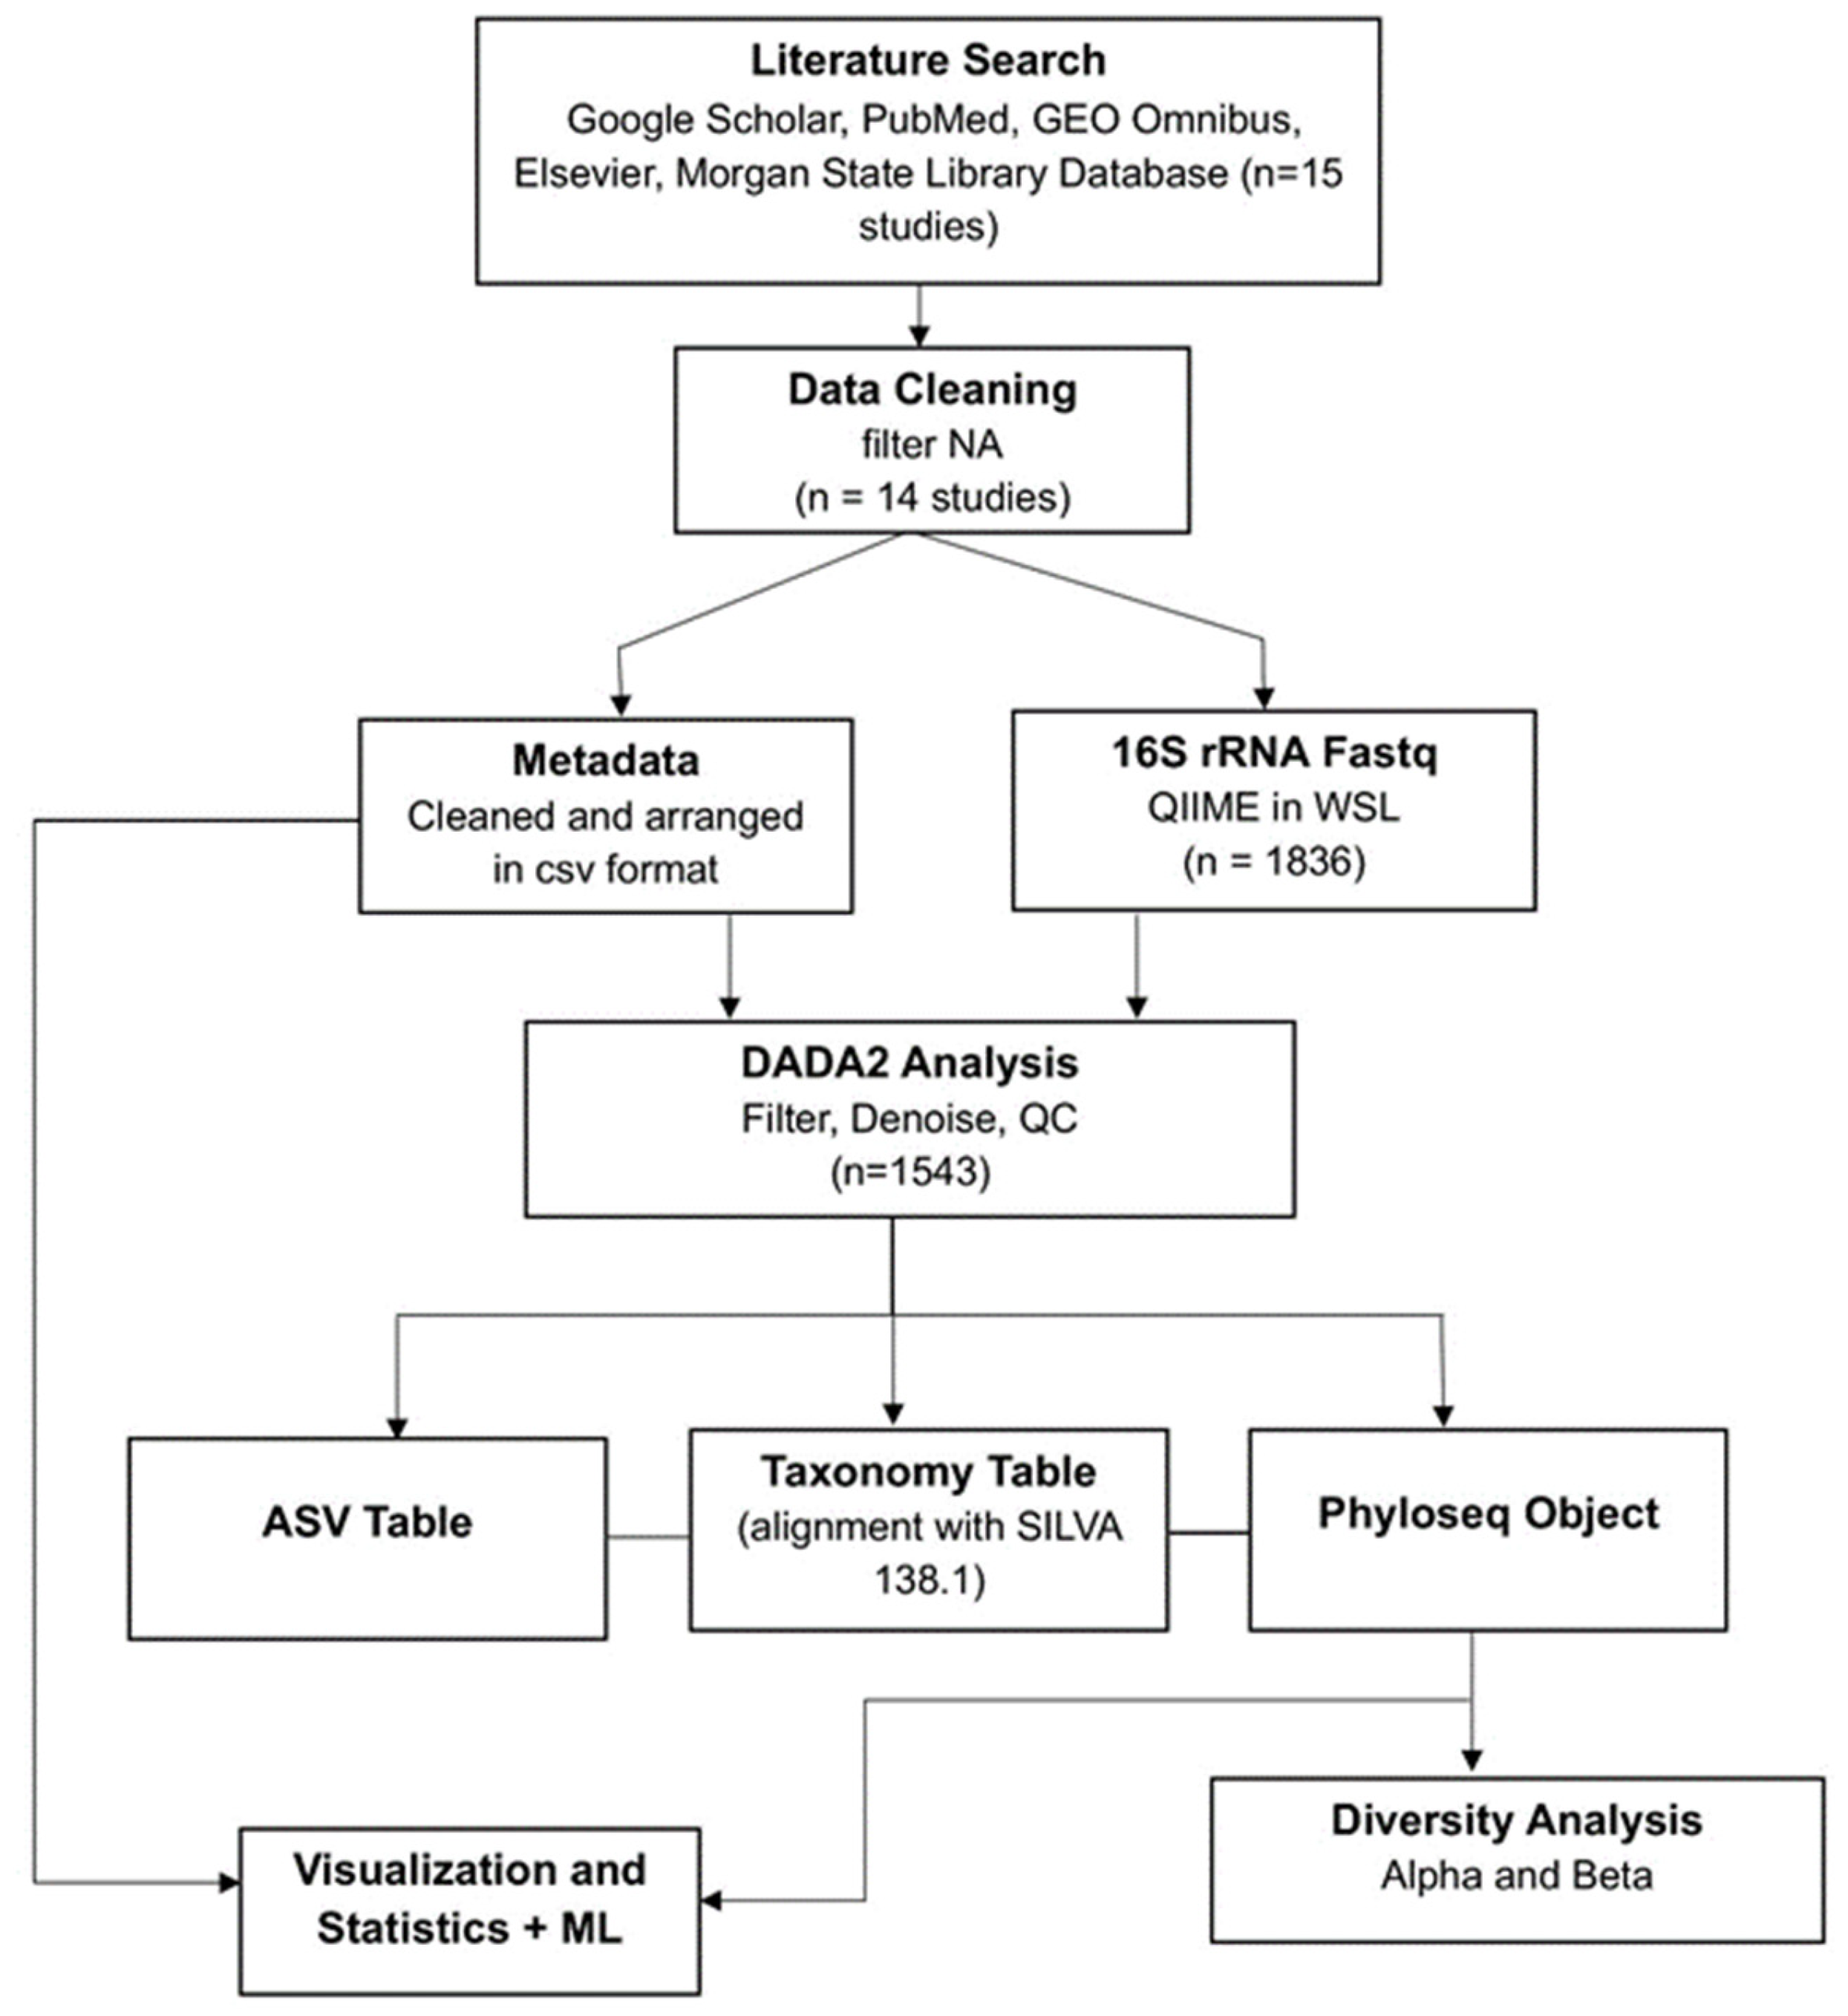
Figure 2.
Shannon Diversity across Ethnic Groups. Shannon diversity index, which measures both richness and evenness of microbial taxa, was calculated for each sample. Higher values indicate greater microbial diversity. Boxplots represent the median, interquartile range, and outliers for each ethnic group. Statistical significance between groups was assessed using Wilcoxon and Kruskal–Wallis tests. This analysis highlights potential differences in microbiome diversity associated with ethnicity.
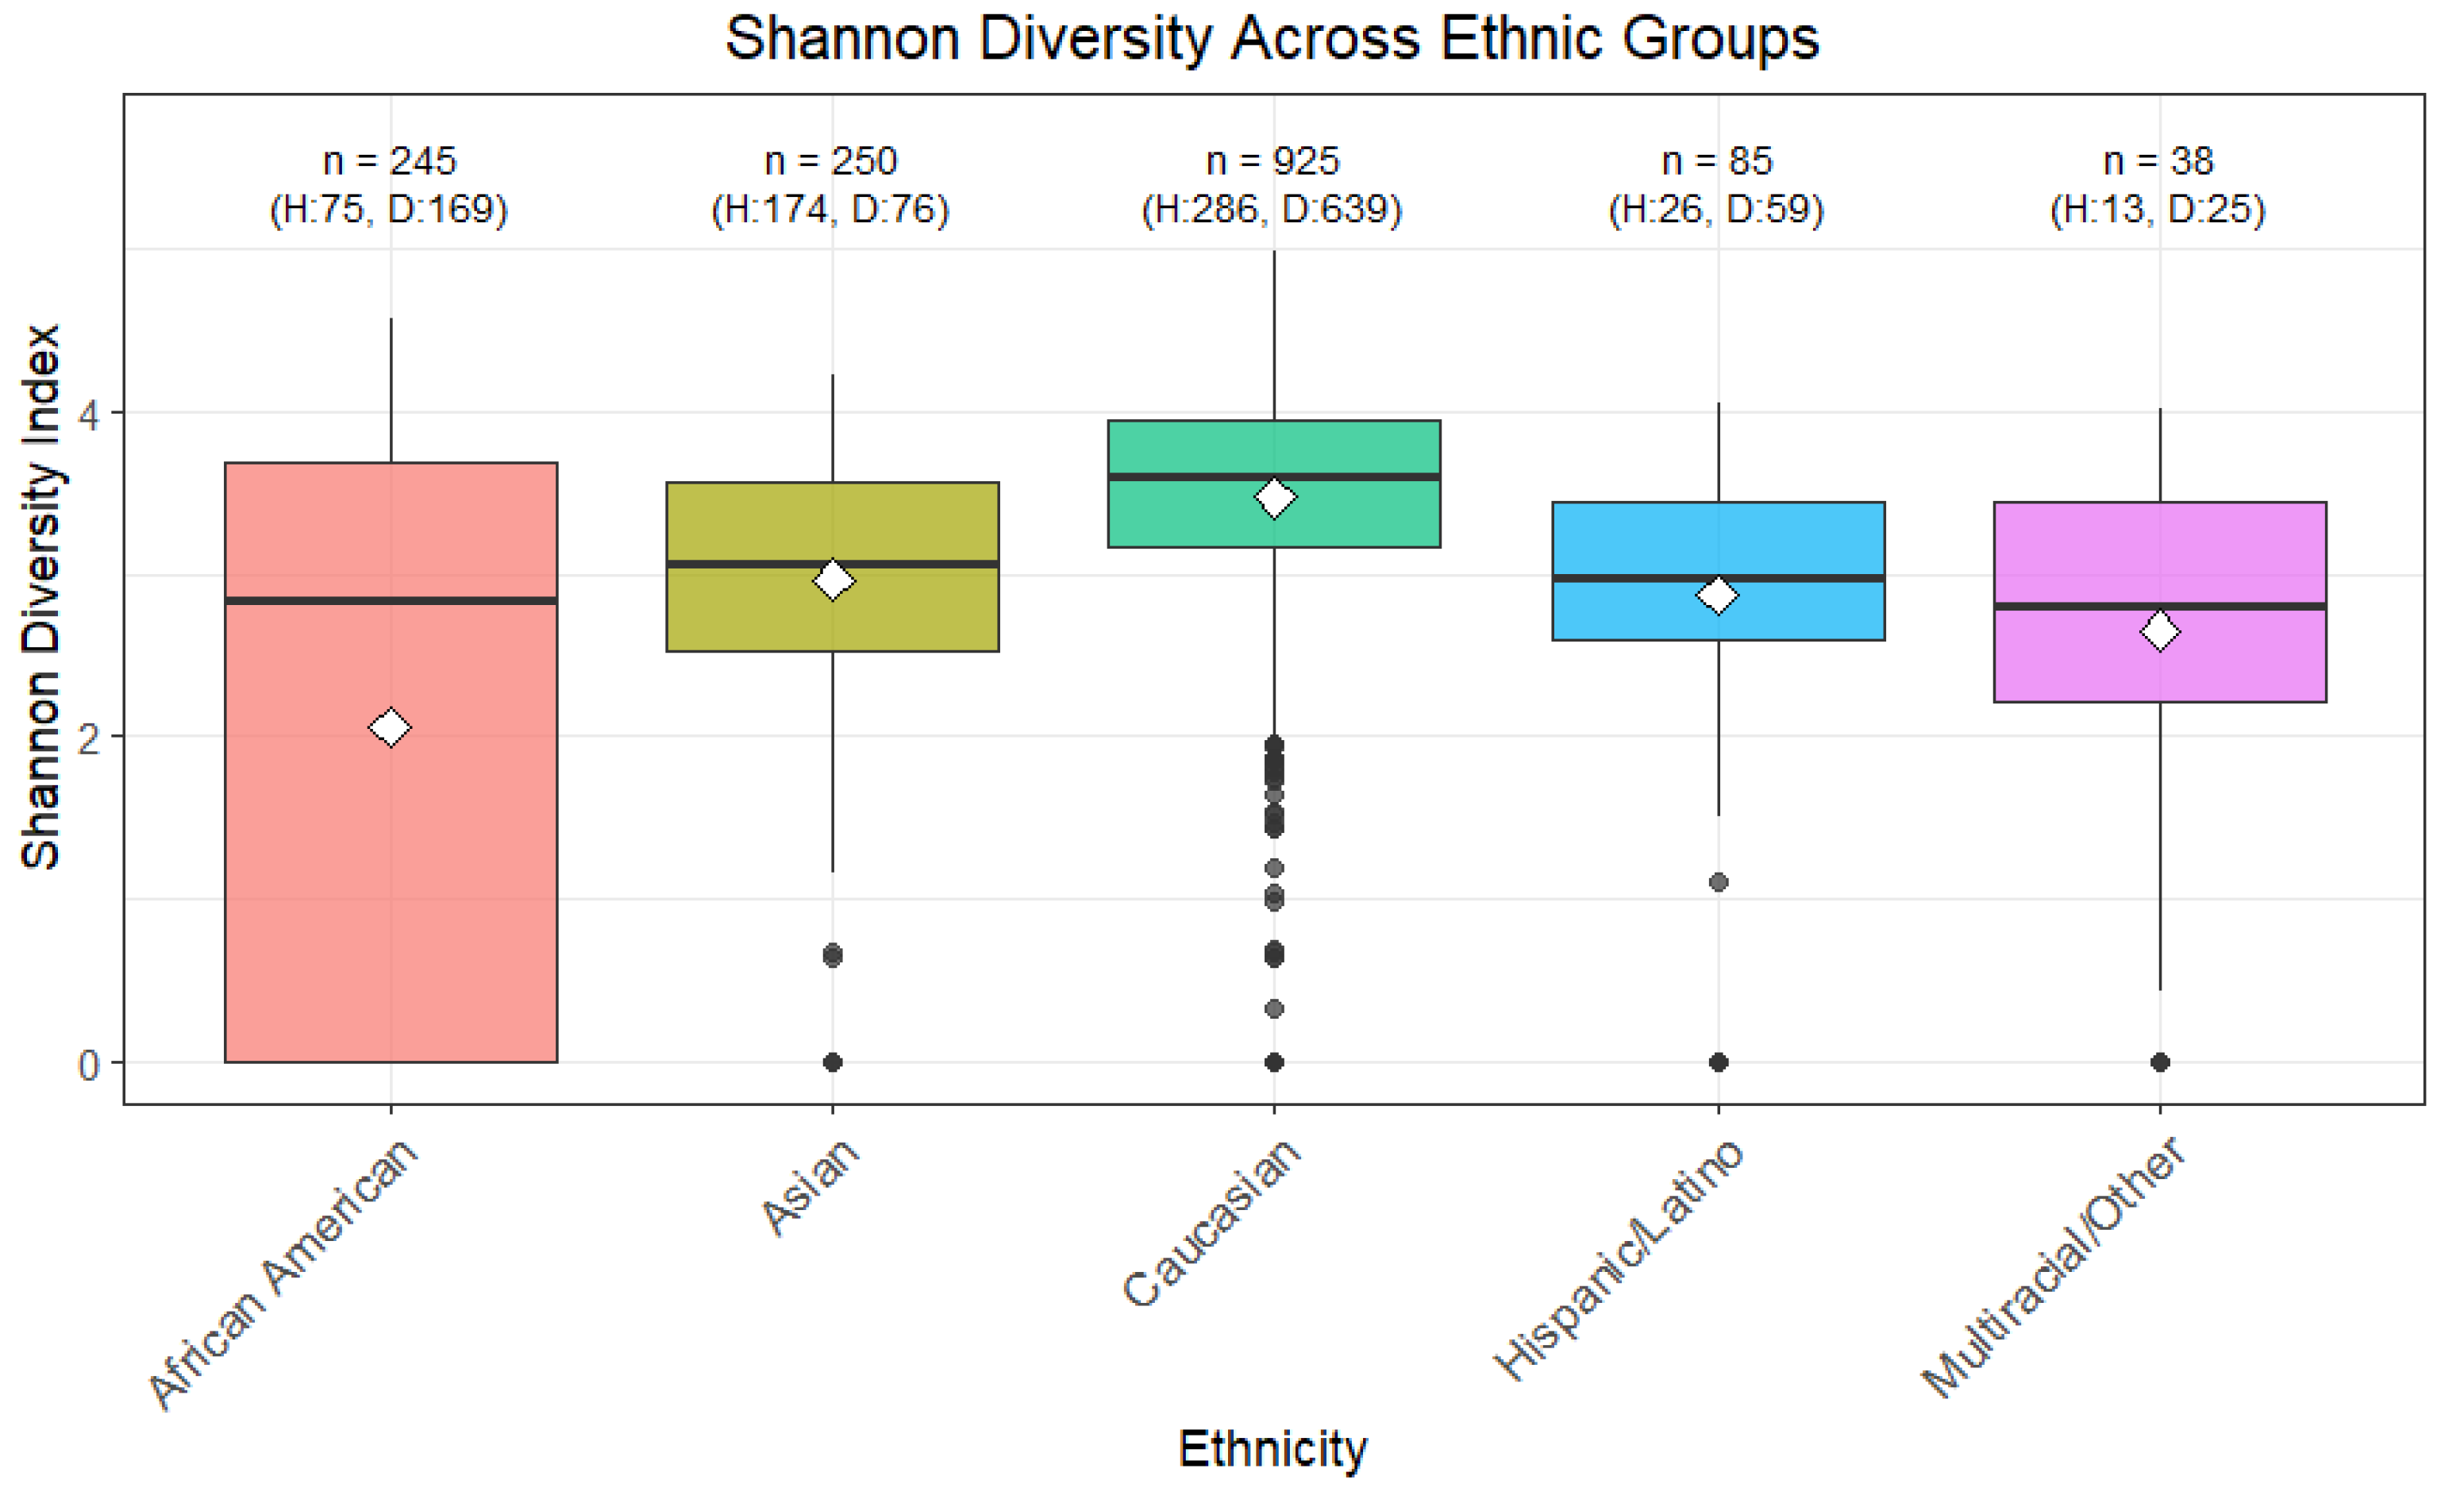
Figure 3.
Simpson Diversity across Ethnic Groups. The Simpson diversity index, which accounts for both richness and evenness of microbial taxa with greater emphasis on dominant species, was calculated for each sample. Higher values indicate higher diversity, with lower values reflecting dominance by a few taxa. Boxplots show the median, interquartile range, and outliers for each ethnic group. Statistical differences between groups were evaluated using Wilcoxon and Kruskal-Wallis tests. This visualization illustrates potential variations in microbial community structure associated with ethnicity.
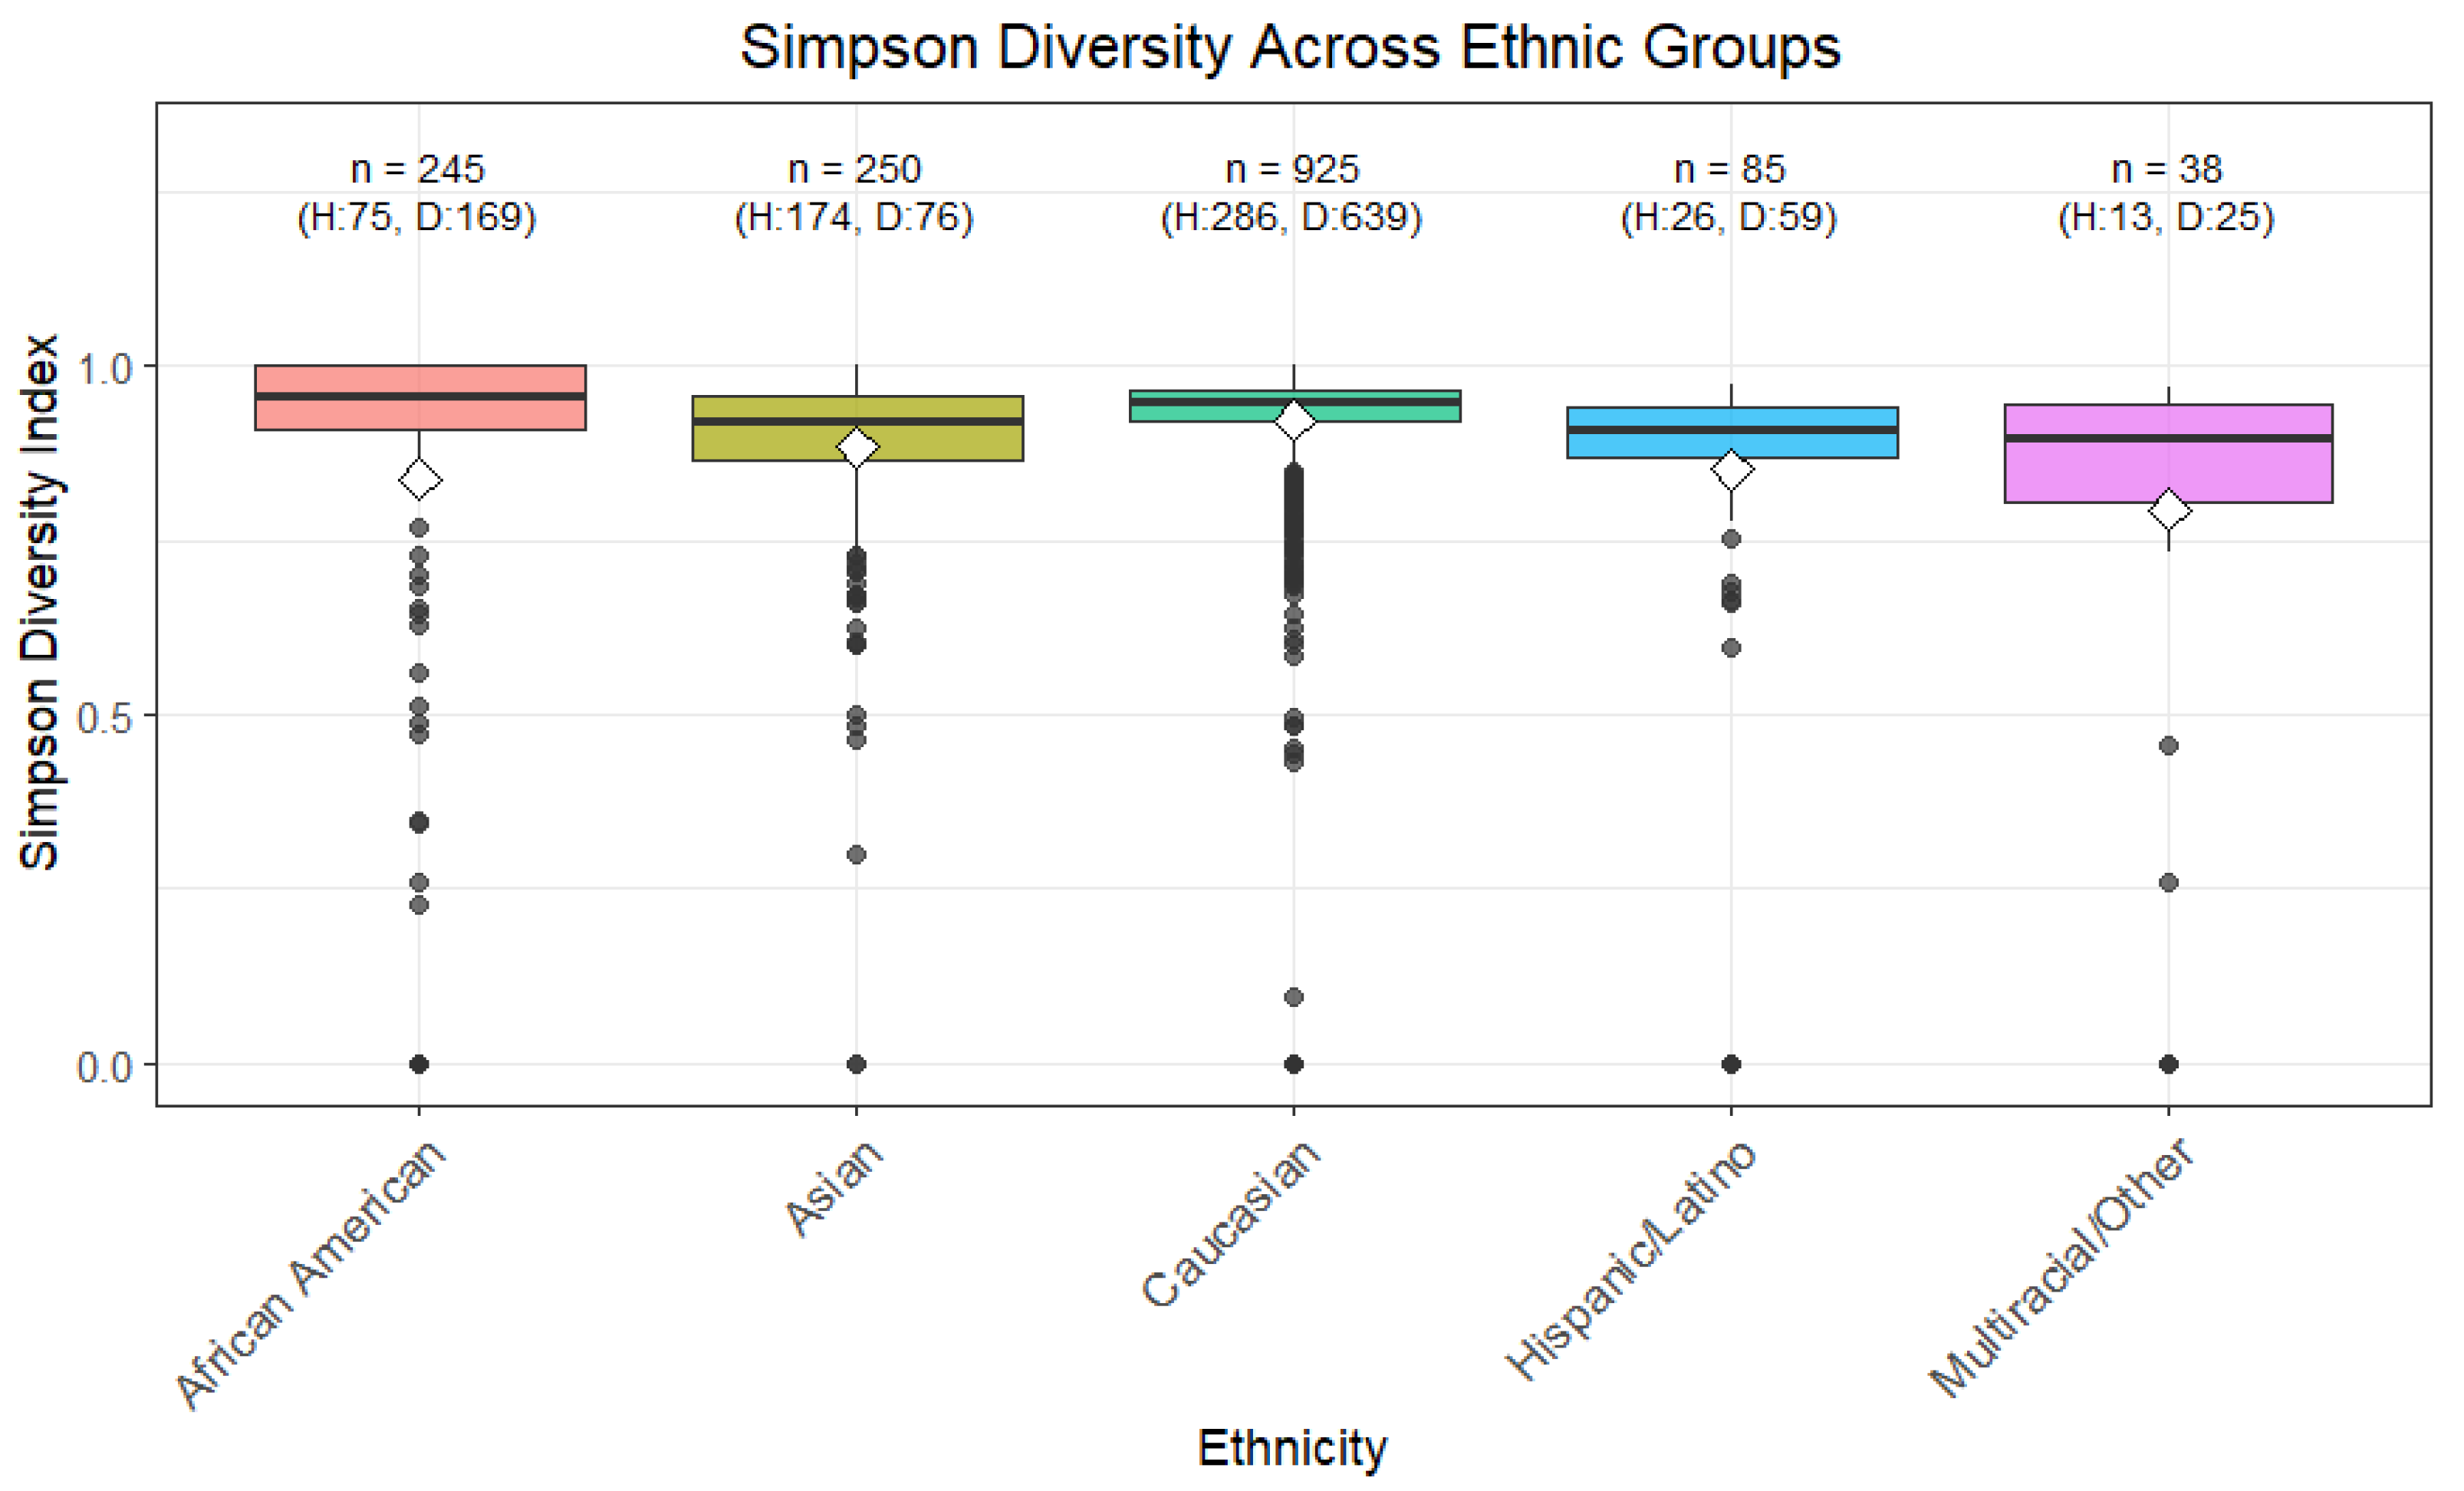
Figure 4.
PCoA Analysis of Microbial Composition based on Ethnicity. PCoA was performed based on Bray–Curtis dissimilarity to visualize differences in microbial community composition between samples. Each point represents an individual sample, colored according to ethnic group. Clustering patterns indicate similarity of microbial profiles within and between groups. Axes show the principal coordinates explaining the greatest variation in the dataset. Statistical significance of group separation was assessed using PERMANOVA. This analysis highlights potential differences in overall microbial community structure associated with ethnicity.
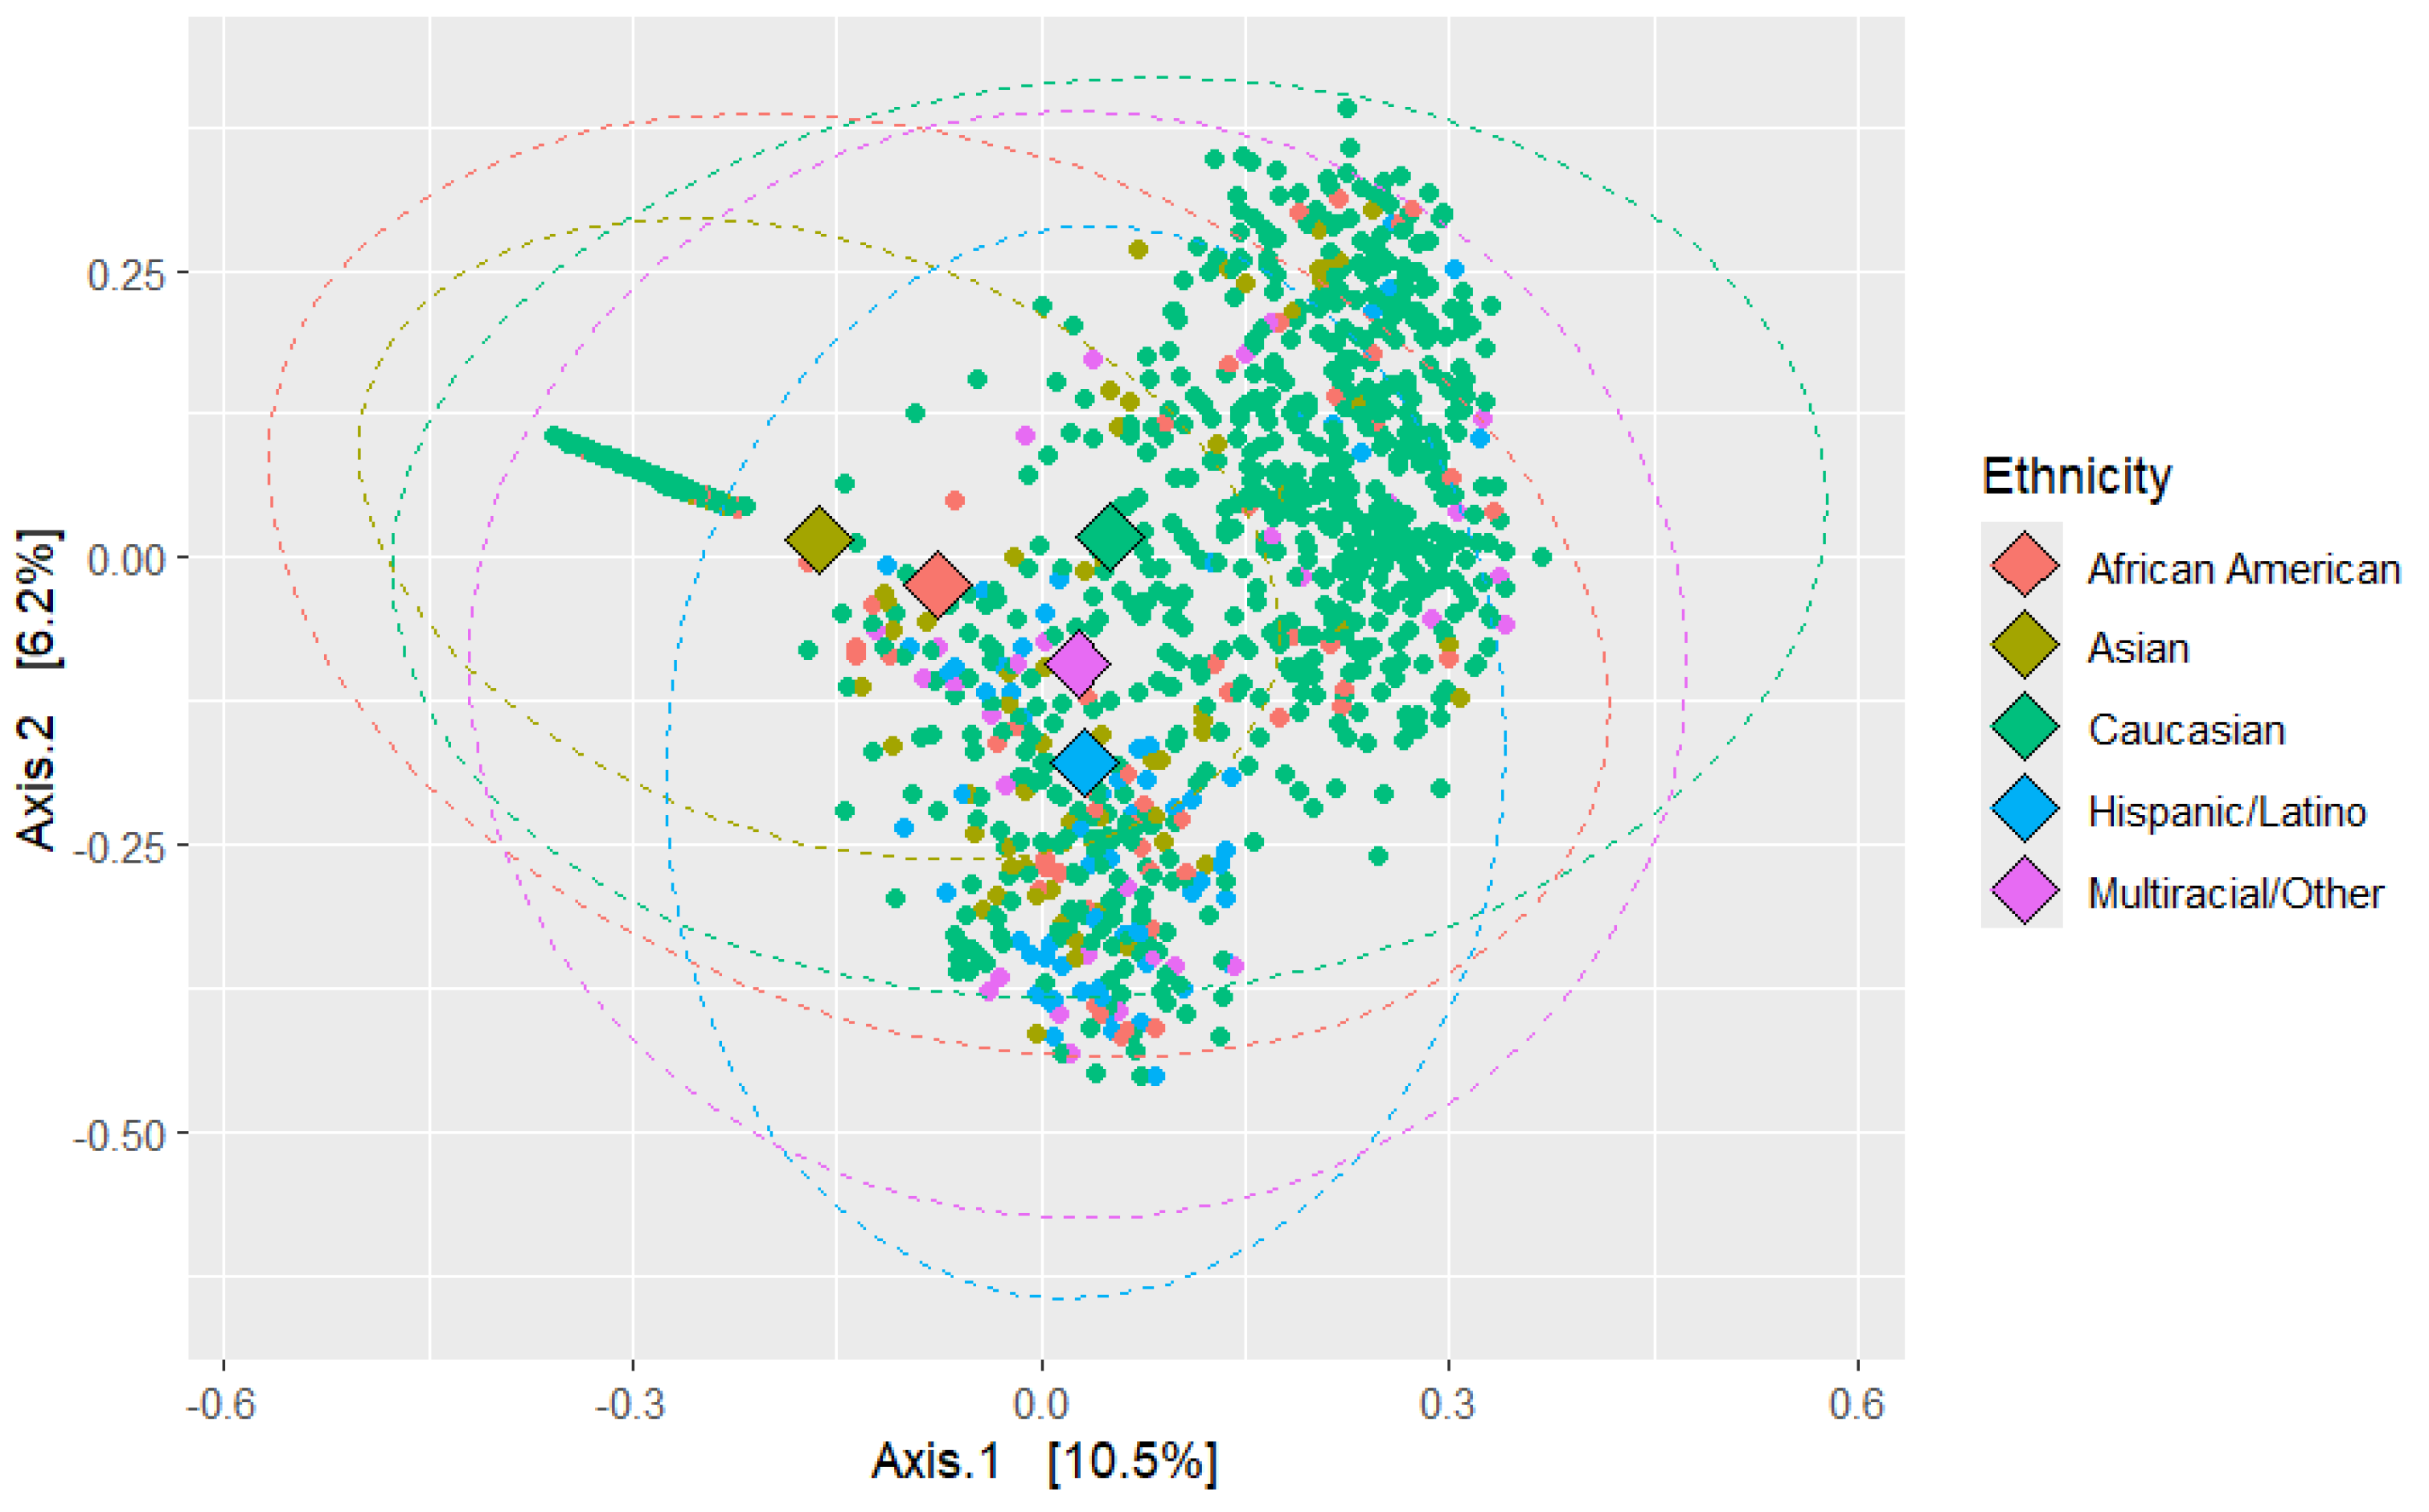
Figure 5.
Taxonomic Tree of Microbial Composition for Complete Dataset. The circular taxonomic tree displays phylogenetic relationships among microbial taxa identified in the dataset. Branches are colored according to phylum (Actinobacteriota, Bacteroidota, Firmicutes, Proteobacteria, Verrucomicrobiota, and others). The inner ring indicates the number of amplicon sequence variants (ASVs) per taxon (blue gradient), while the outer ring represents the number of studies in which each taxon was reported (orange gradient). This visualization highlights both taxonomic diversity and study representation across major microbial phyla. The tree construction approach was adopted from a previously published method.
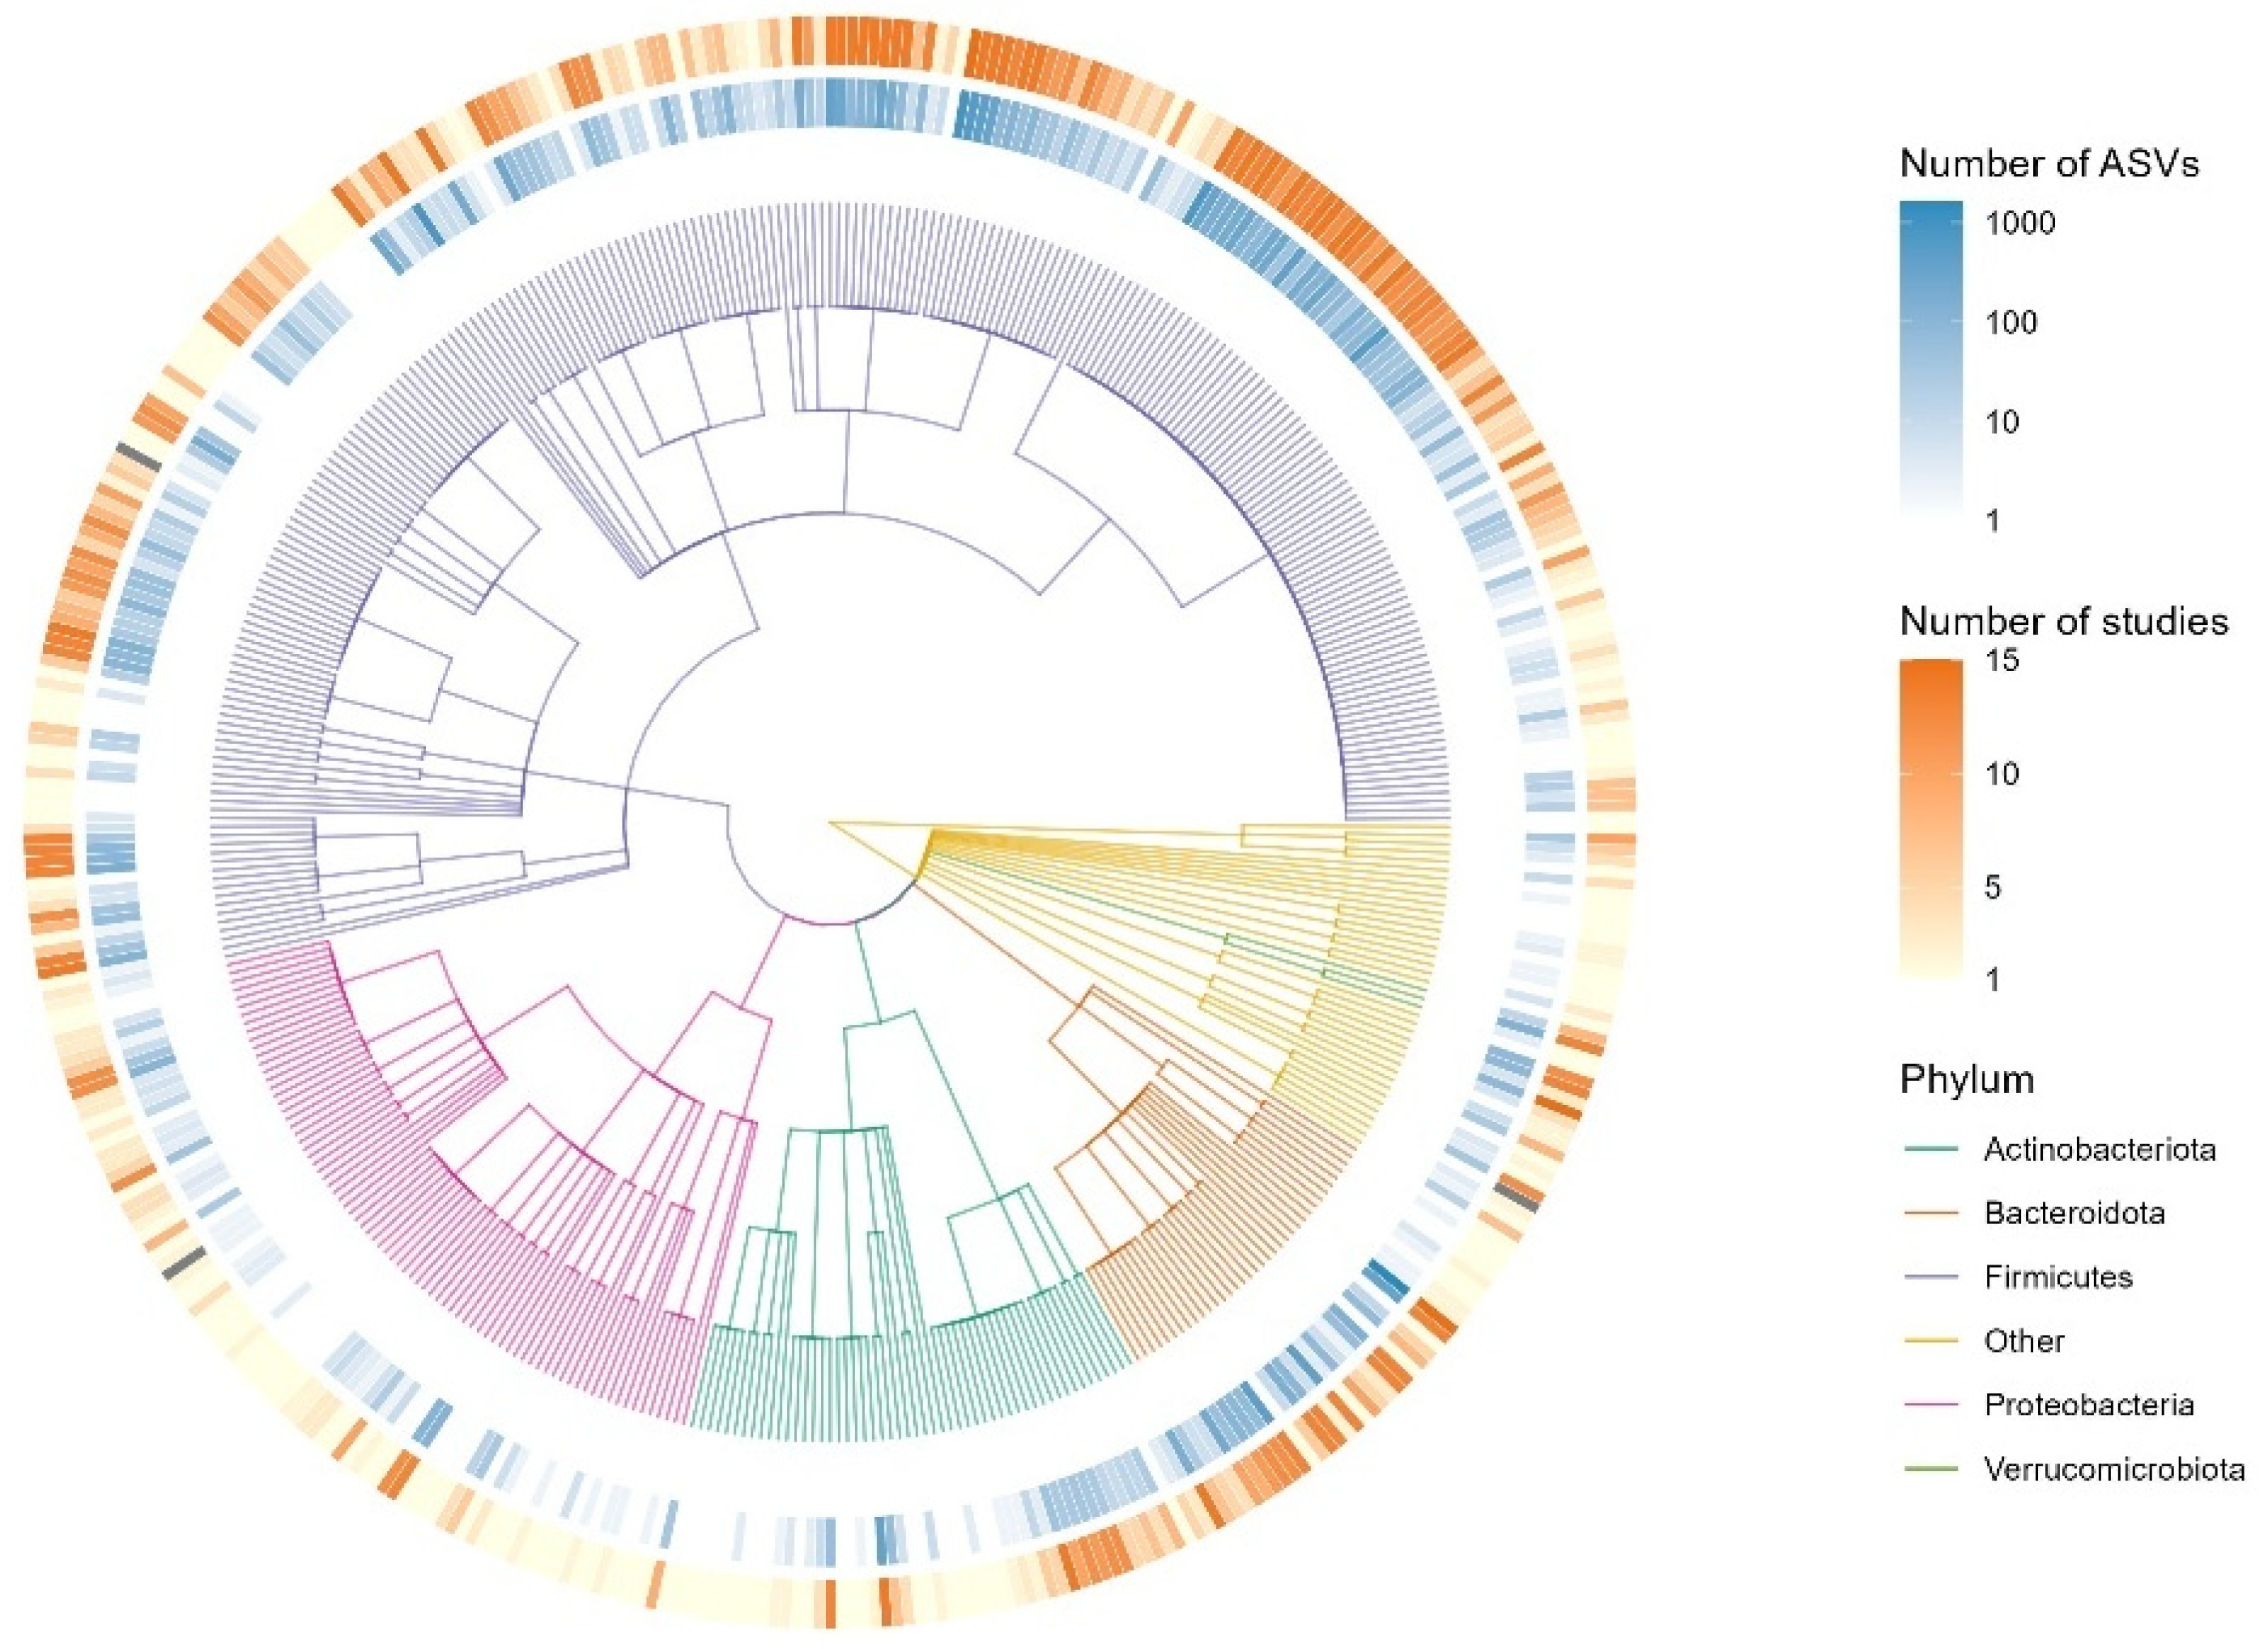
Figure 6.
F:B Ratio Comparison by Ethnicity and Disease Status. The mean log2-transformed F:B ratio was calculated for each ethnic group and stratified by health status (healthy vs. disease). Bars represent mean values, and error bars indicate the standard error of the mean. Sample sizes (n) for each group are shown above the bars. This visualization highlights differences in the F:B ratio across ethnicities and between health conditions.
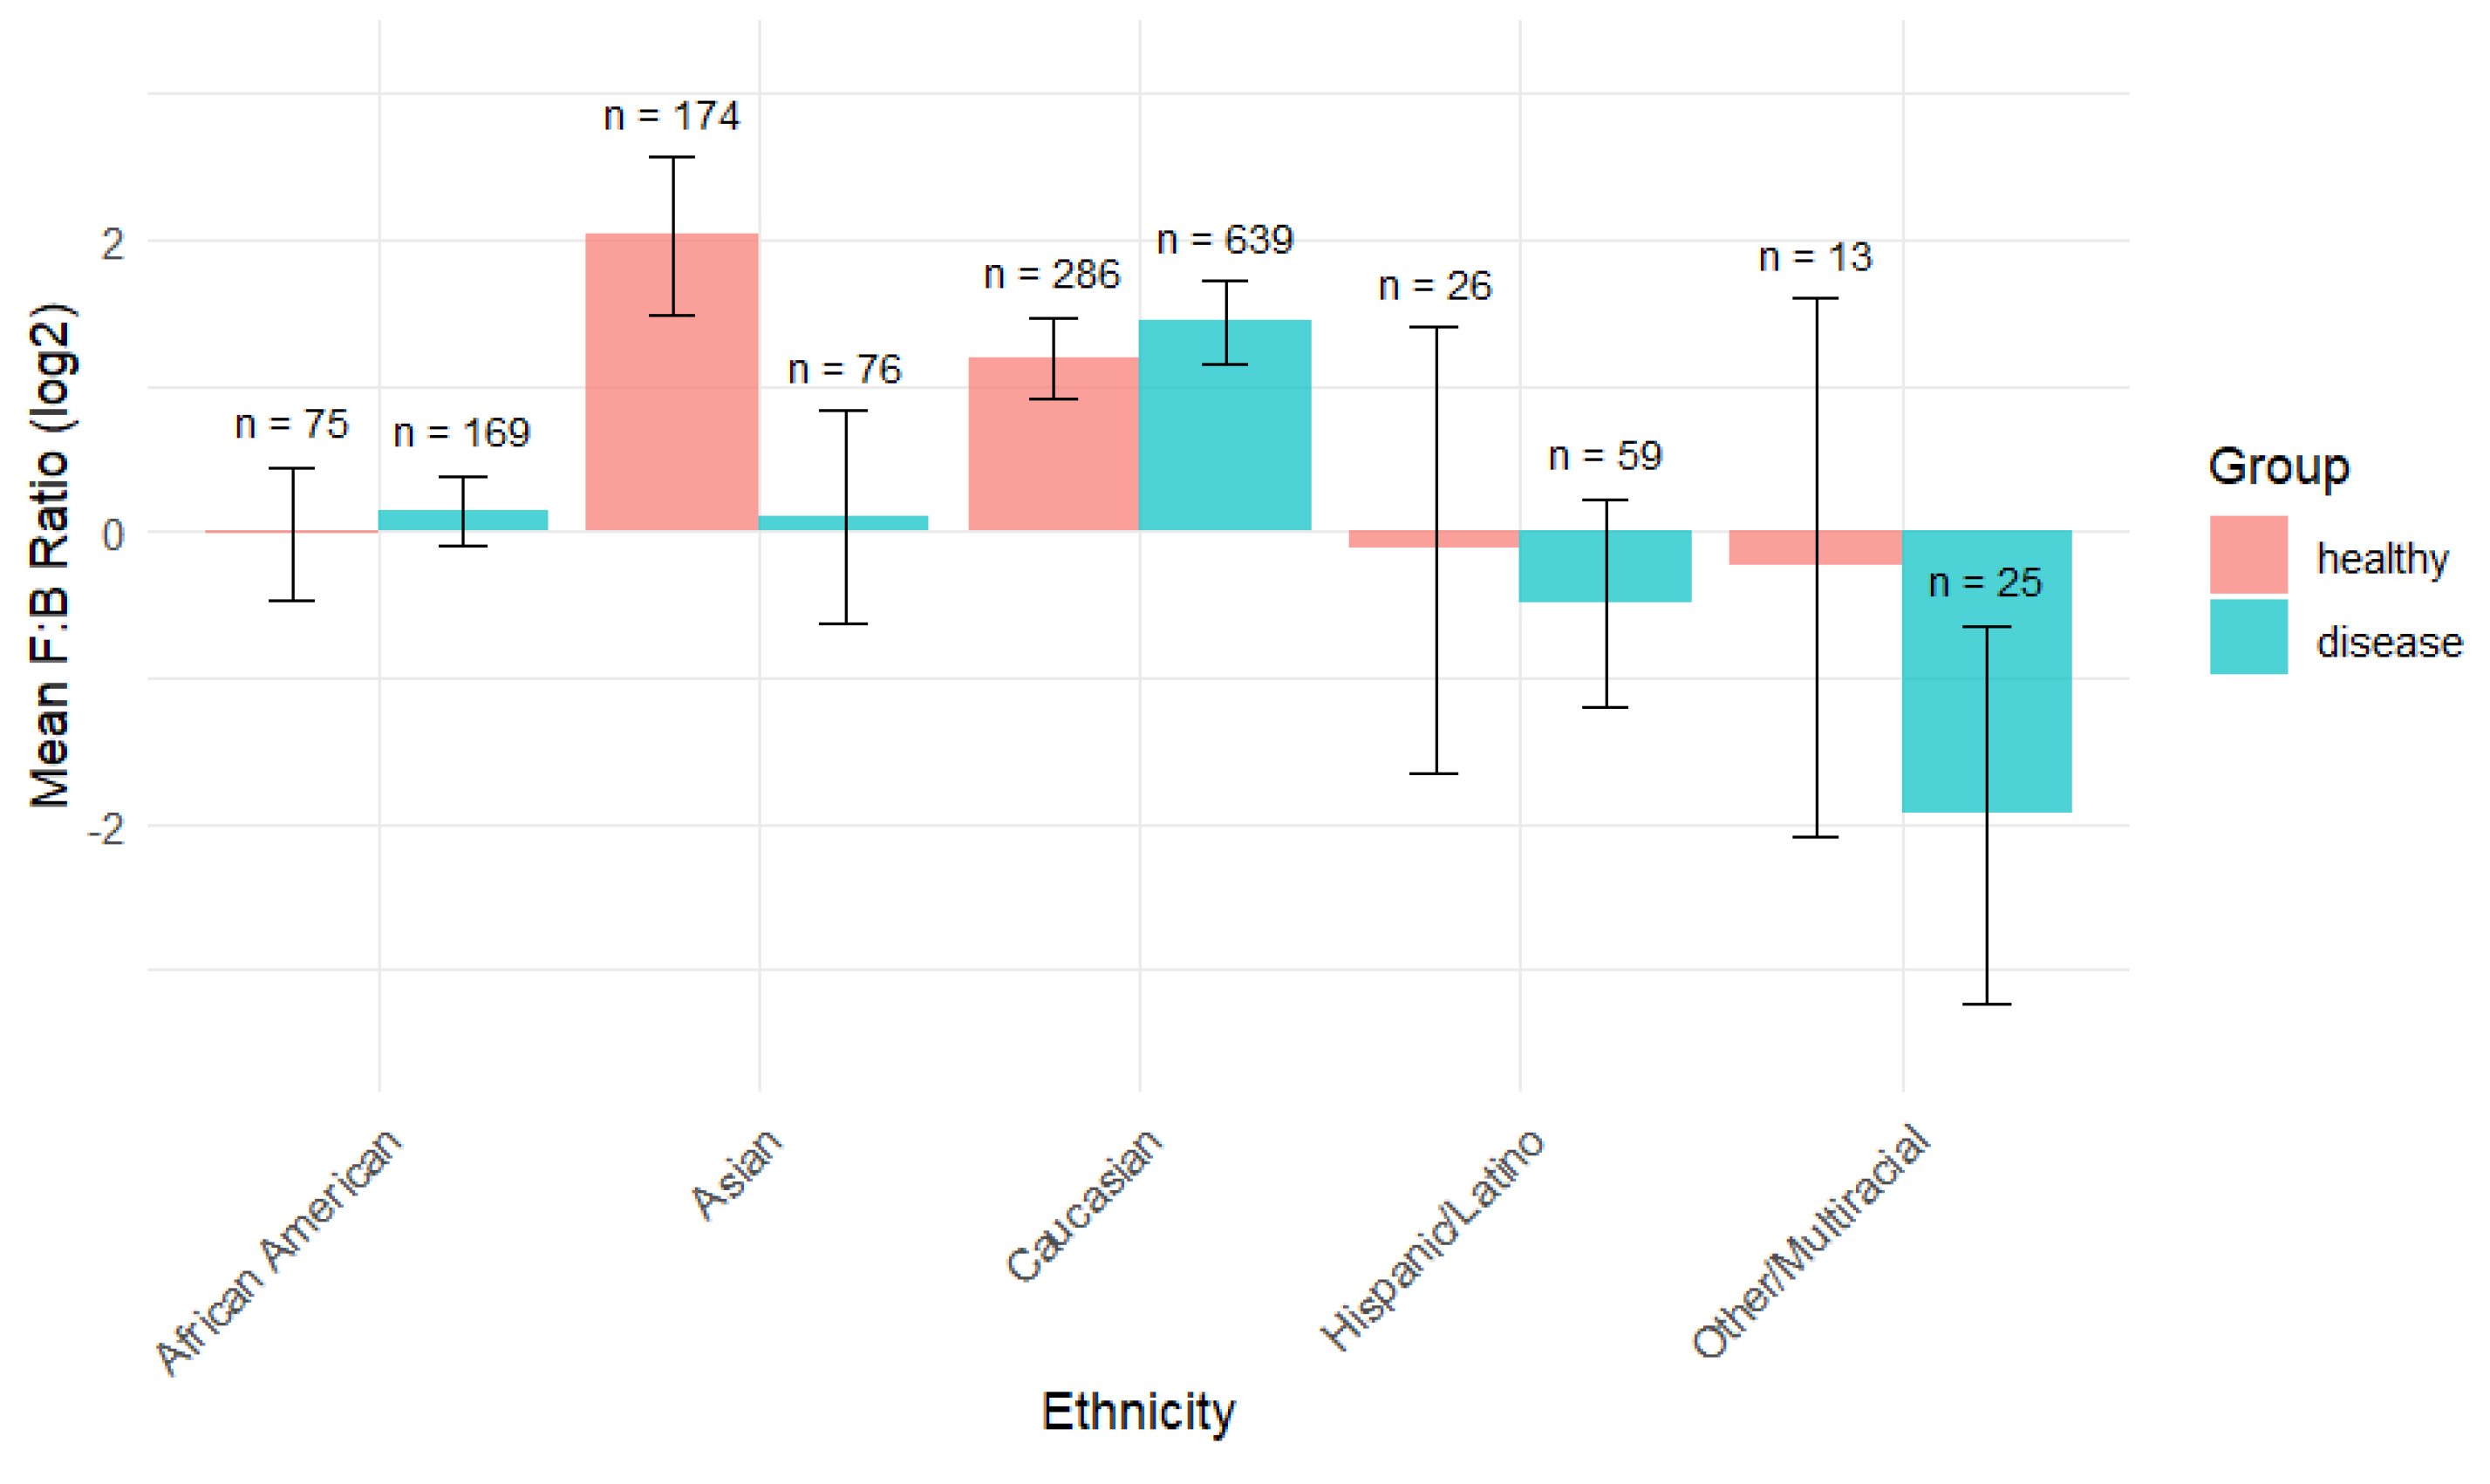
Figure 7.
Differentially abundant taxa in African Americans (AA) relative to Non-African Americans (Non-AA). Bar plot showing significant taxa with log2 fold change in relative abundance. Positive values (red bars) indicate taxa enriched in AA, whereas negative values (blue bars) represent taxa enriched in Non-AA. Error bars denote standard error of the mean. This analysis highlights key microbial taxa contributing to differences in community composition between groups.
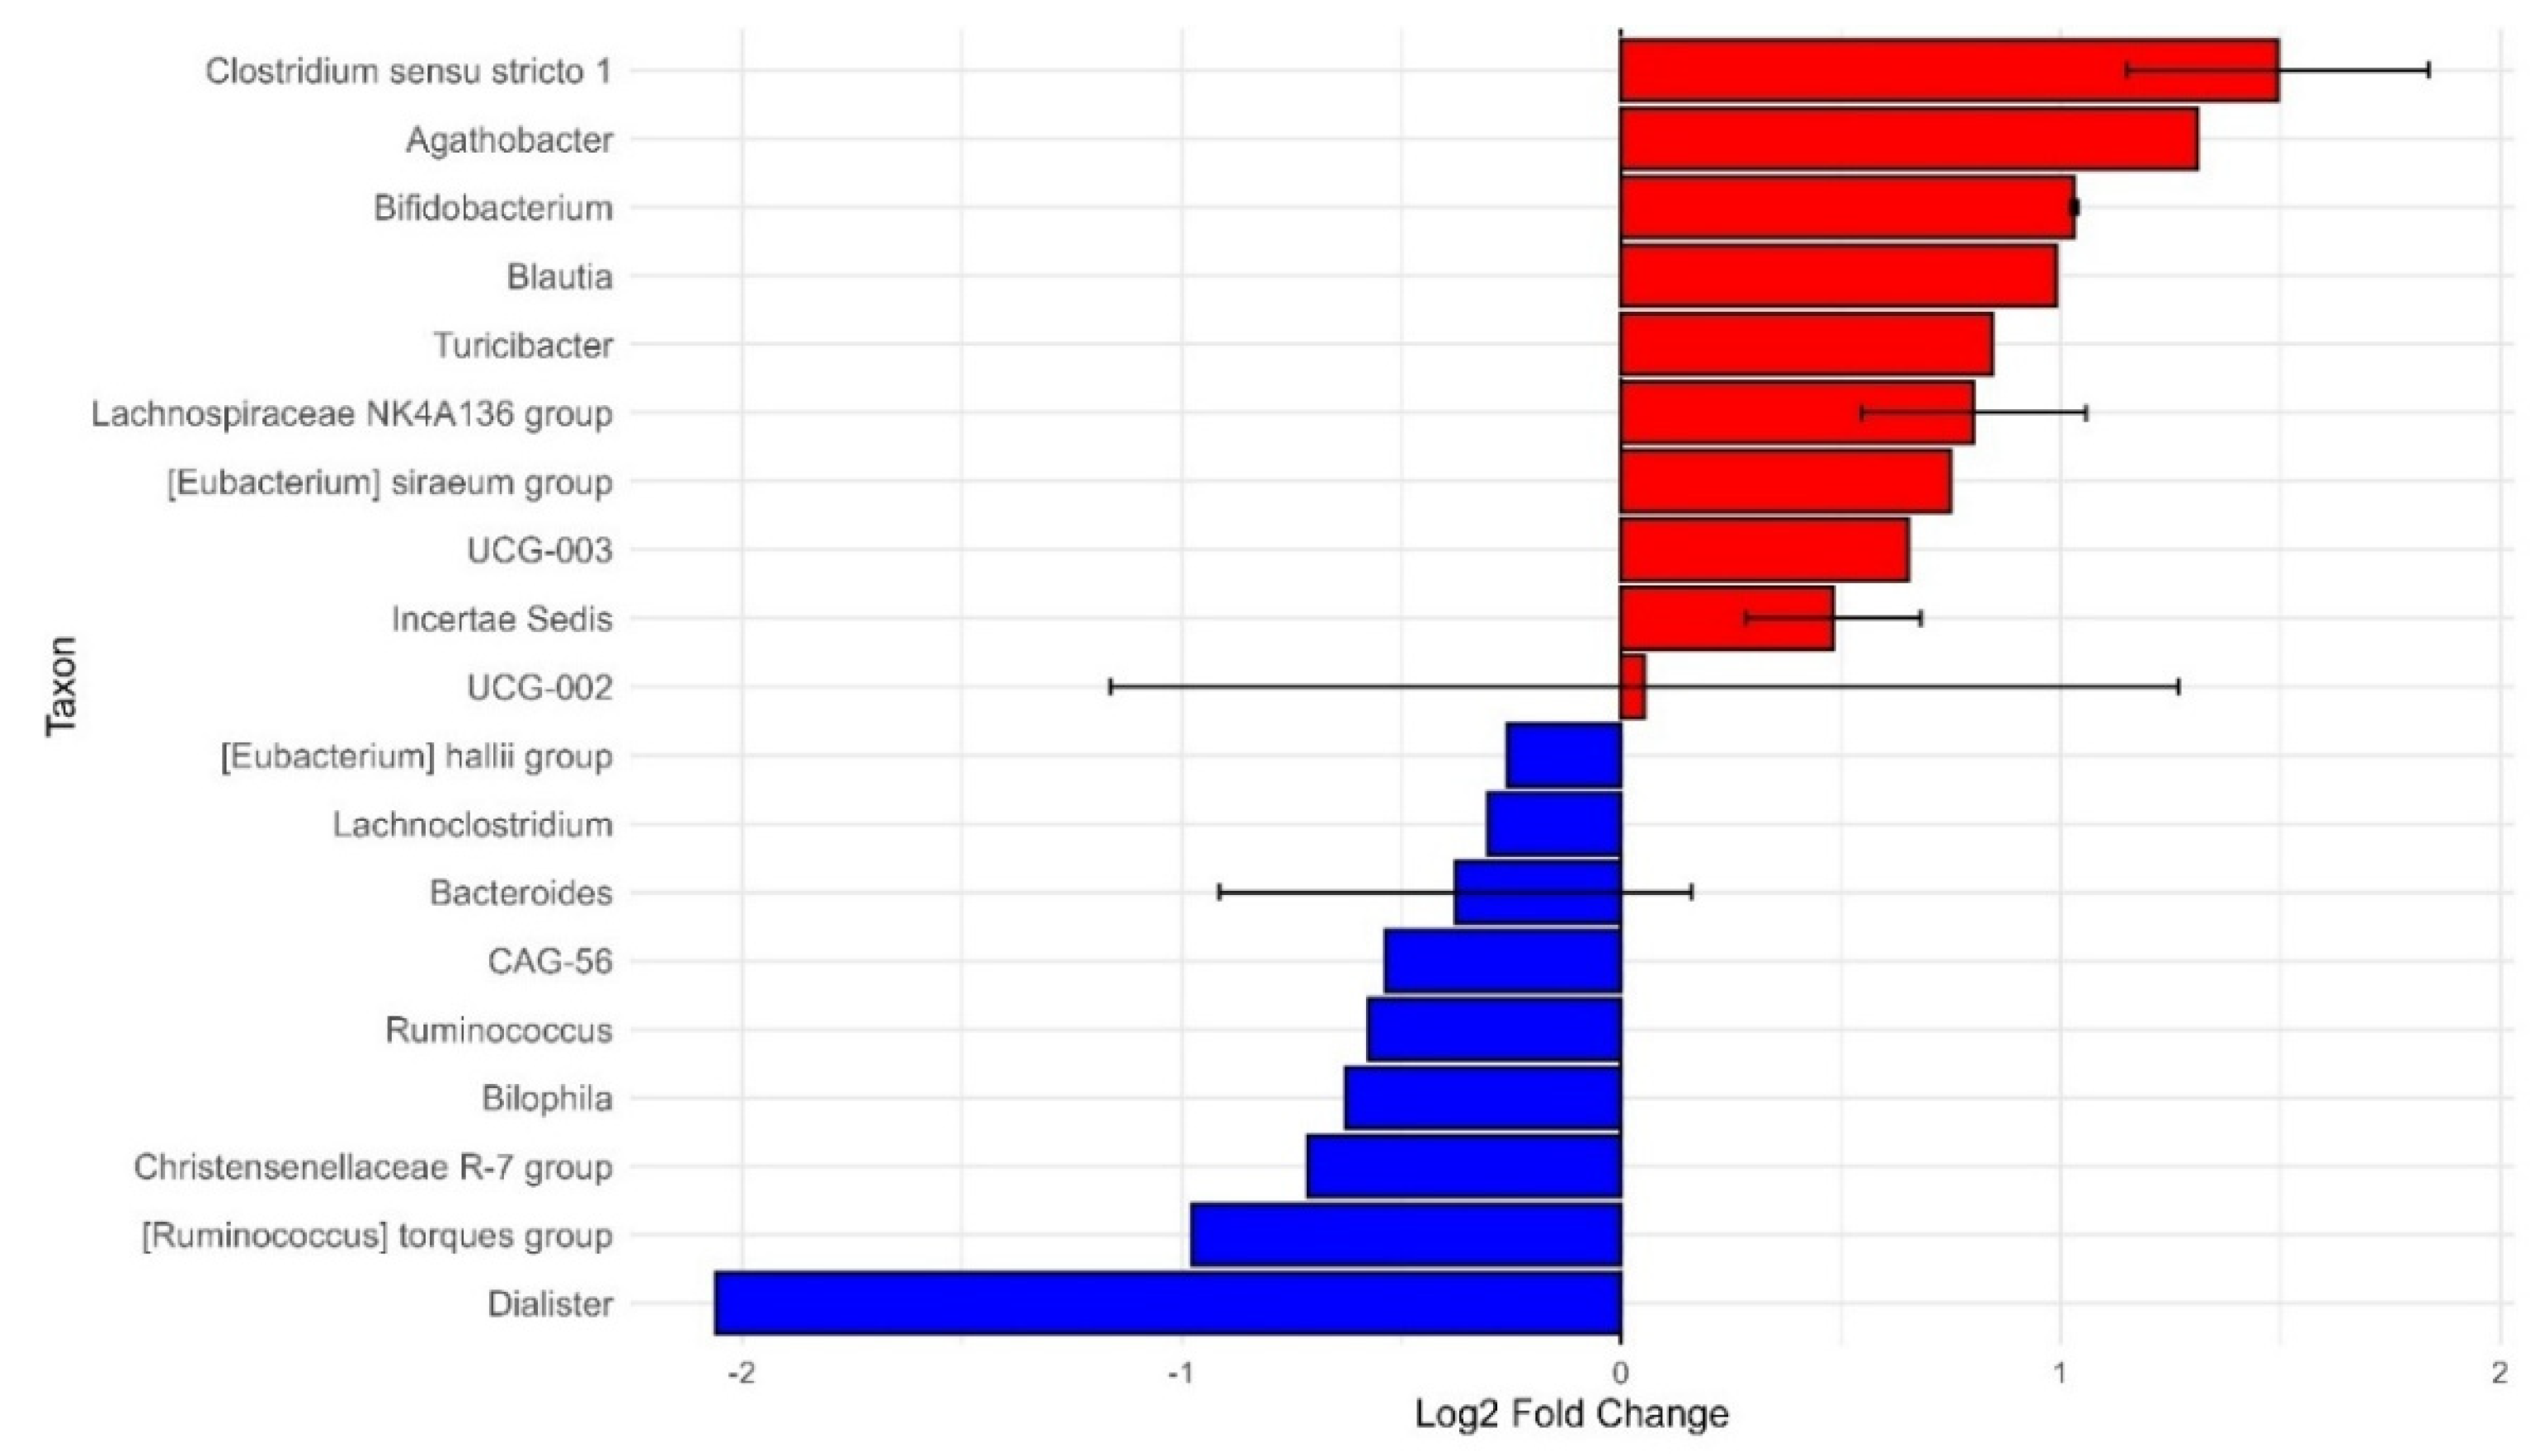
Figure 8.
Model Performance Comparison in Validation Set. Comparison is between LightGBM, XGBoost, AdaBoost, and RandomForest for validation set across multiple evaluation metrics. The x-axis represents the five key performance metrics: Accuracy, Precision (Macro), Recall (Macro), F1 Score (Macro), and AUROC. The y-axis displays the corresponding scores, allowing for a comparison of each model’s effectiveness.
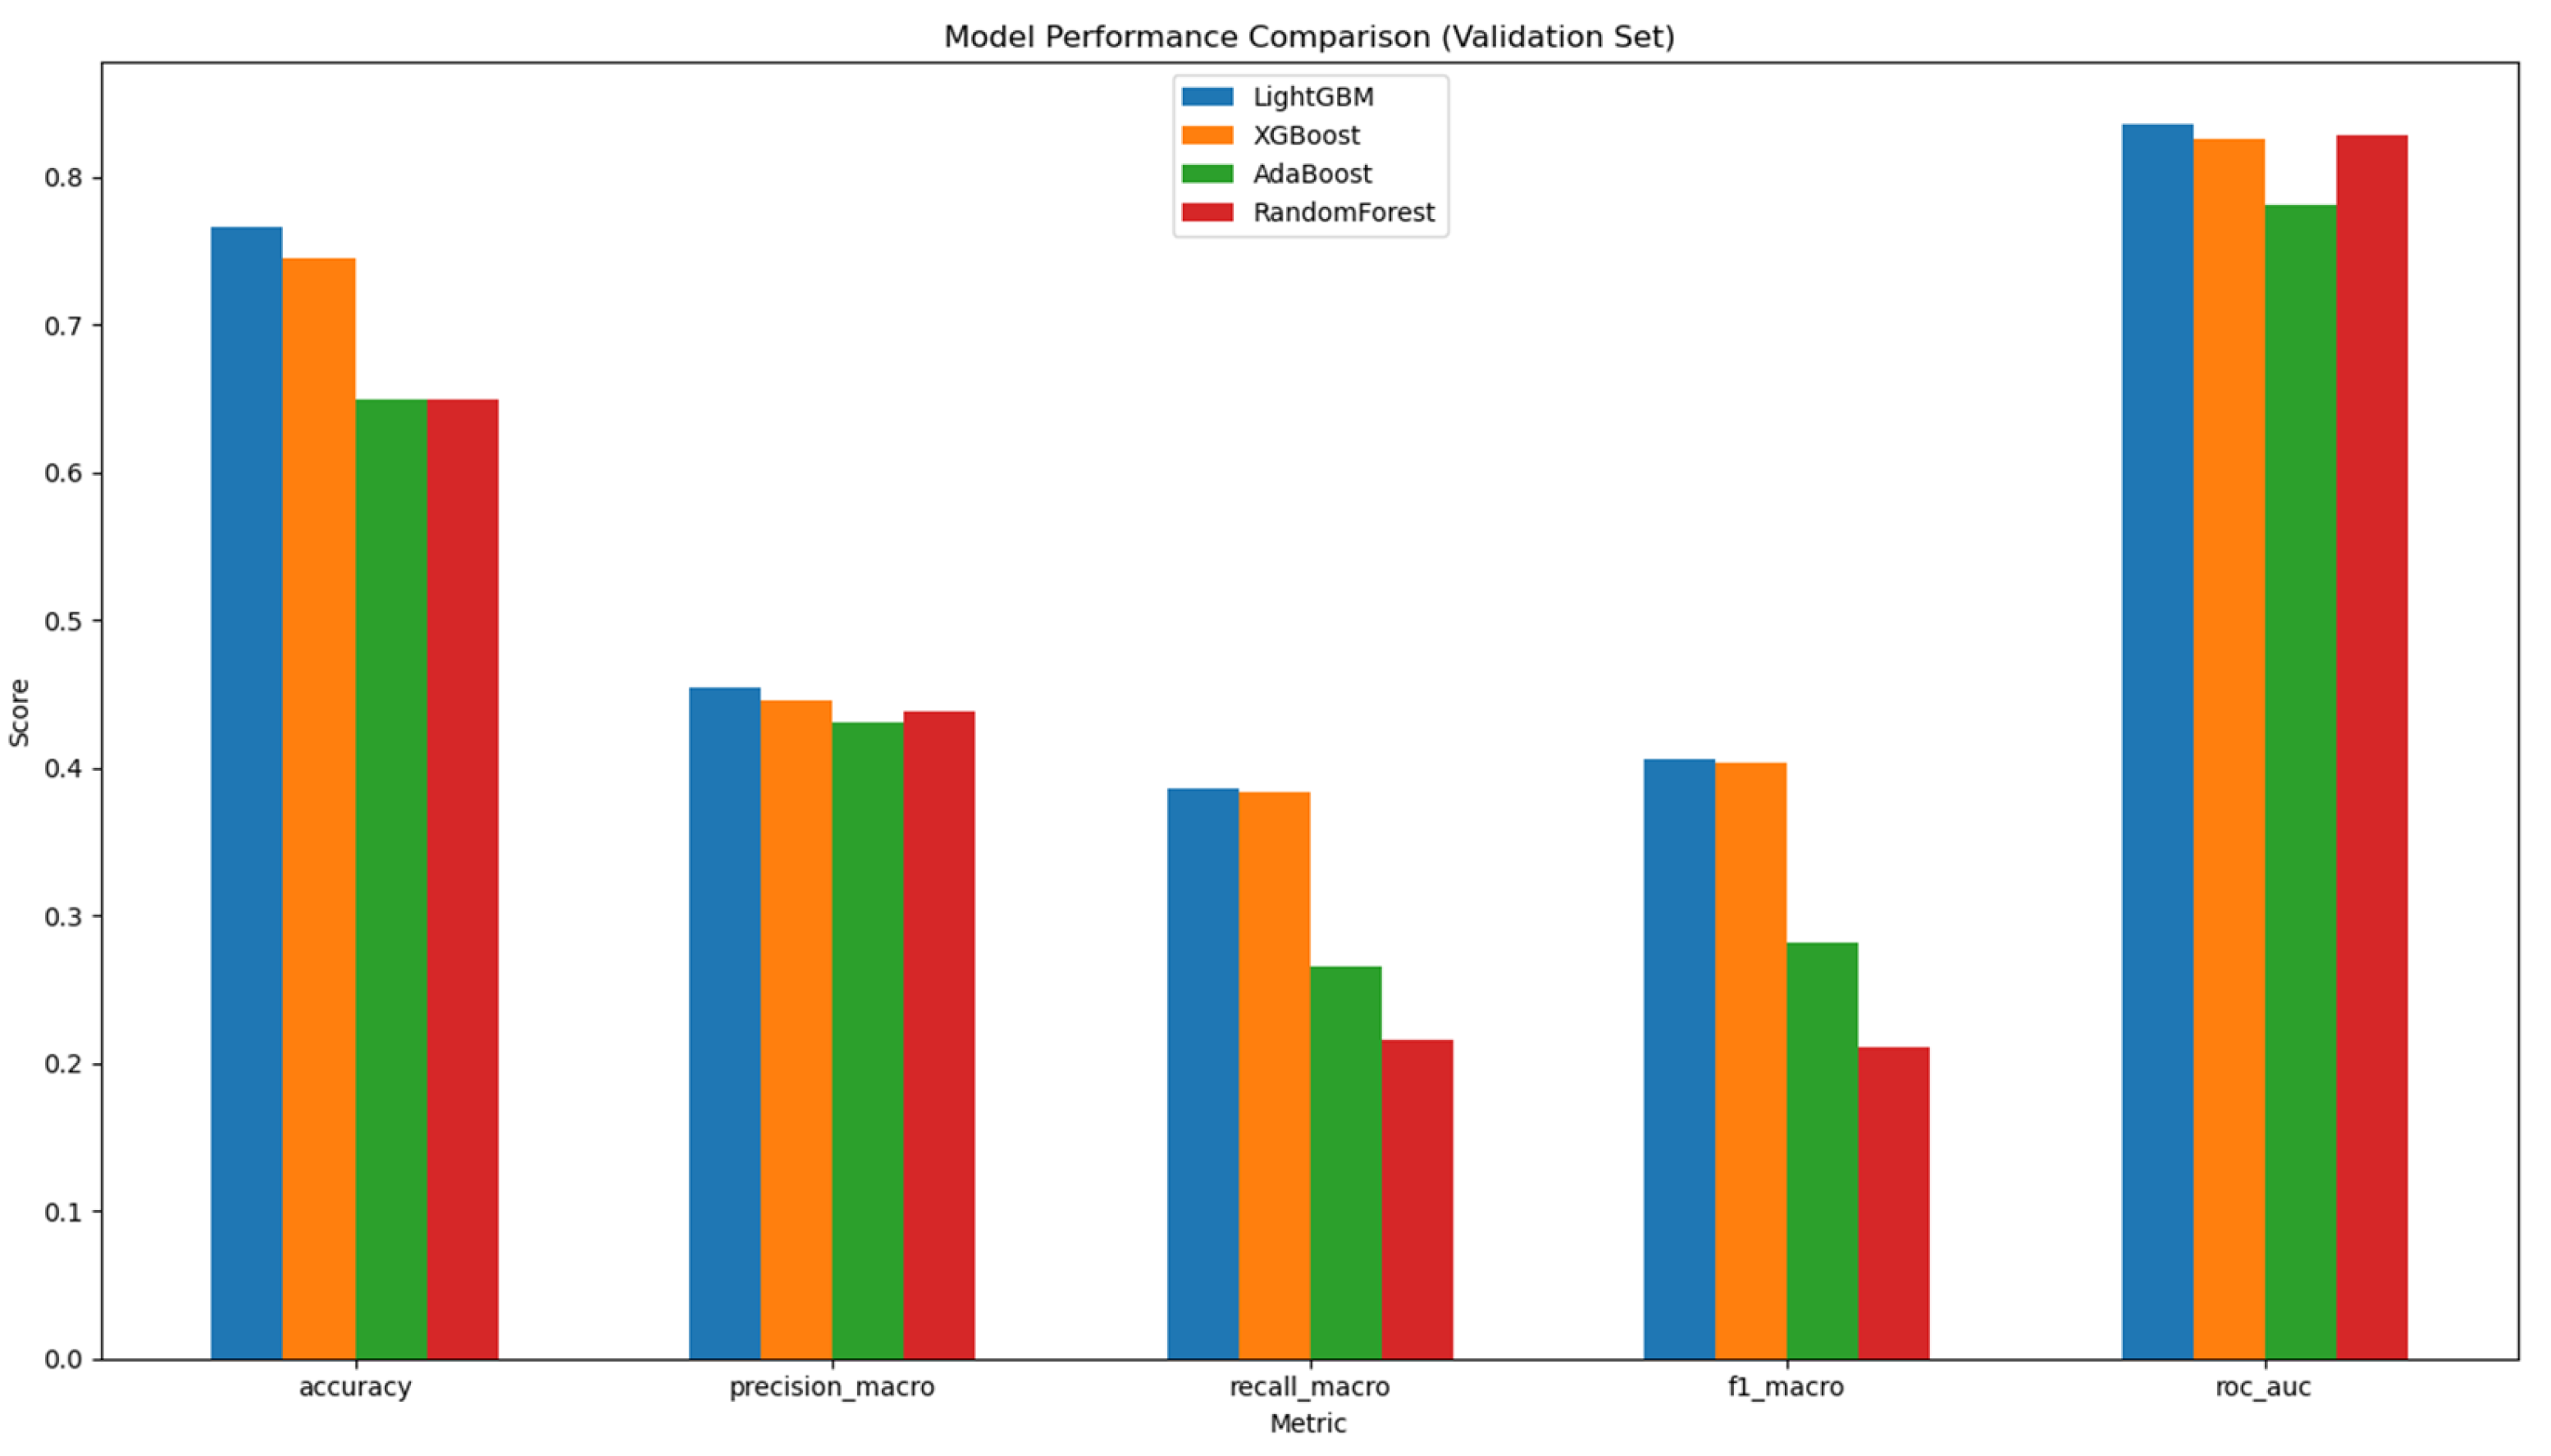
Figure 9.
Confusion Matrix visualization from LightGBM model on test set. The x-axis represents predicted ethnicity, and the y-axis represents the true ethnicity. The intensity of the color scale on the right corresponds to the number of instances the model could predict correctly or incorrectly. The model performed best for Caucasian (131 correct predictions).
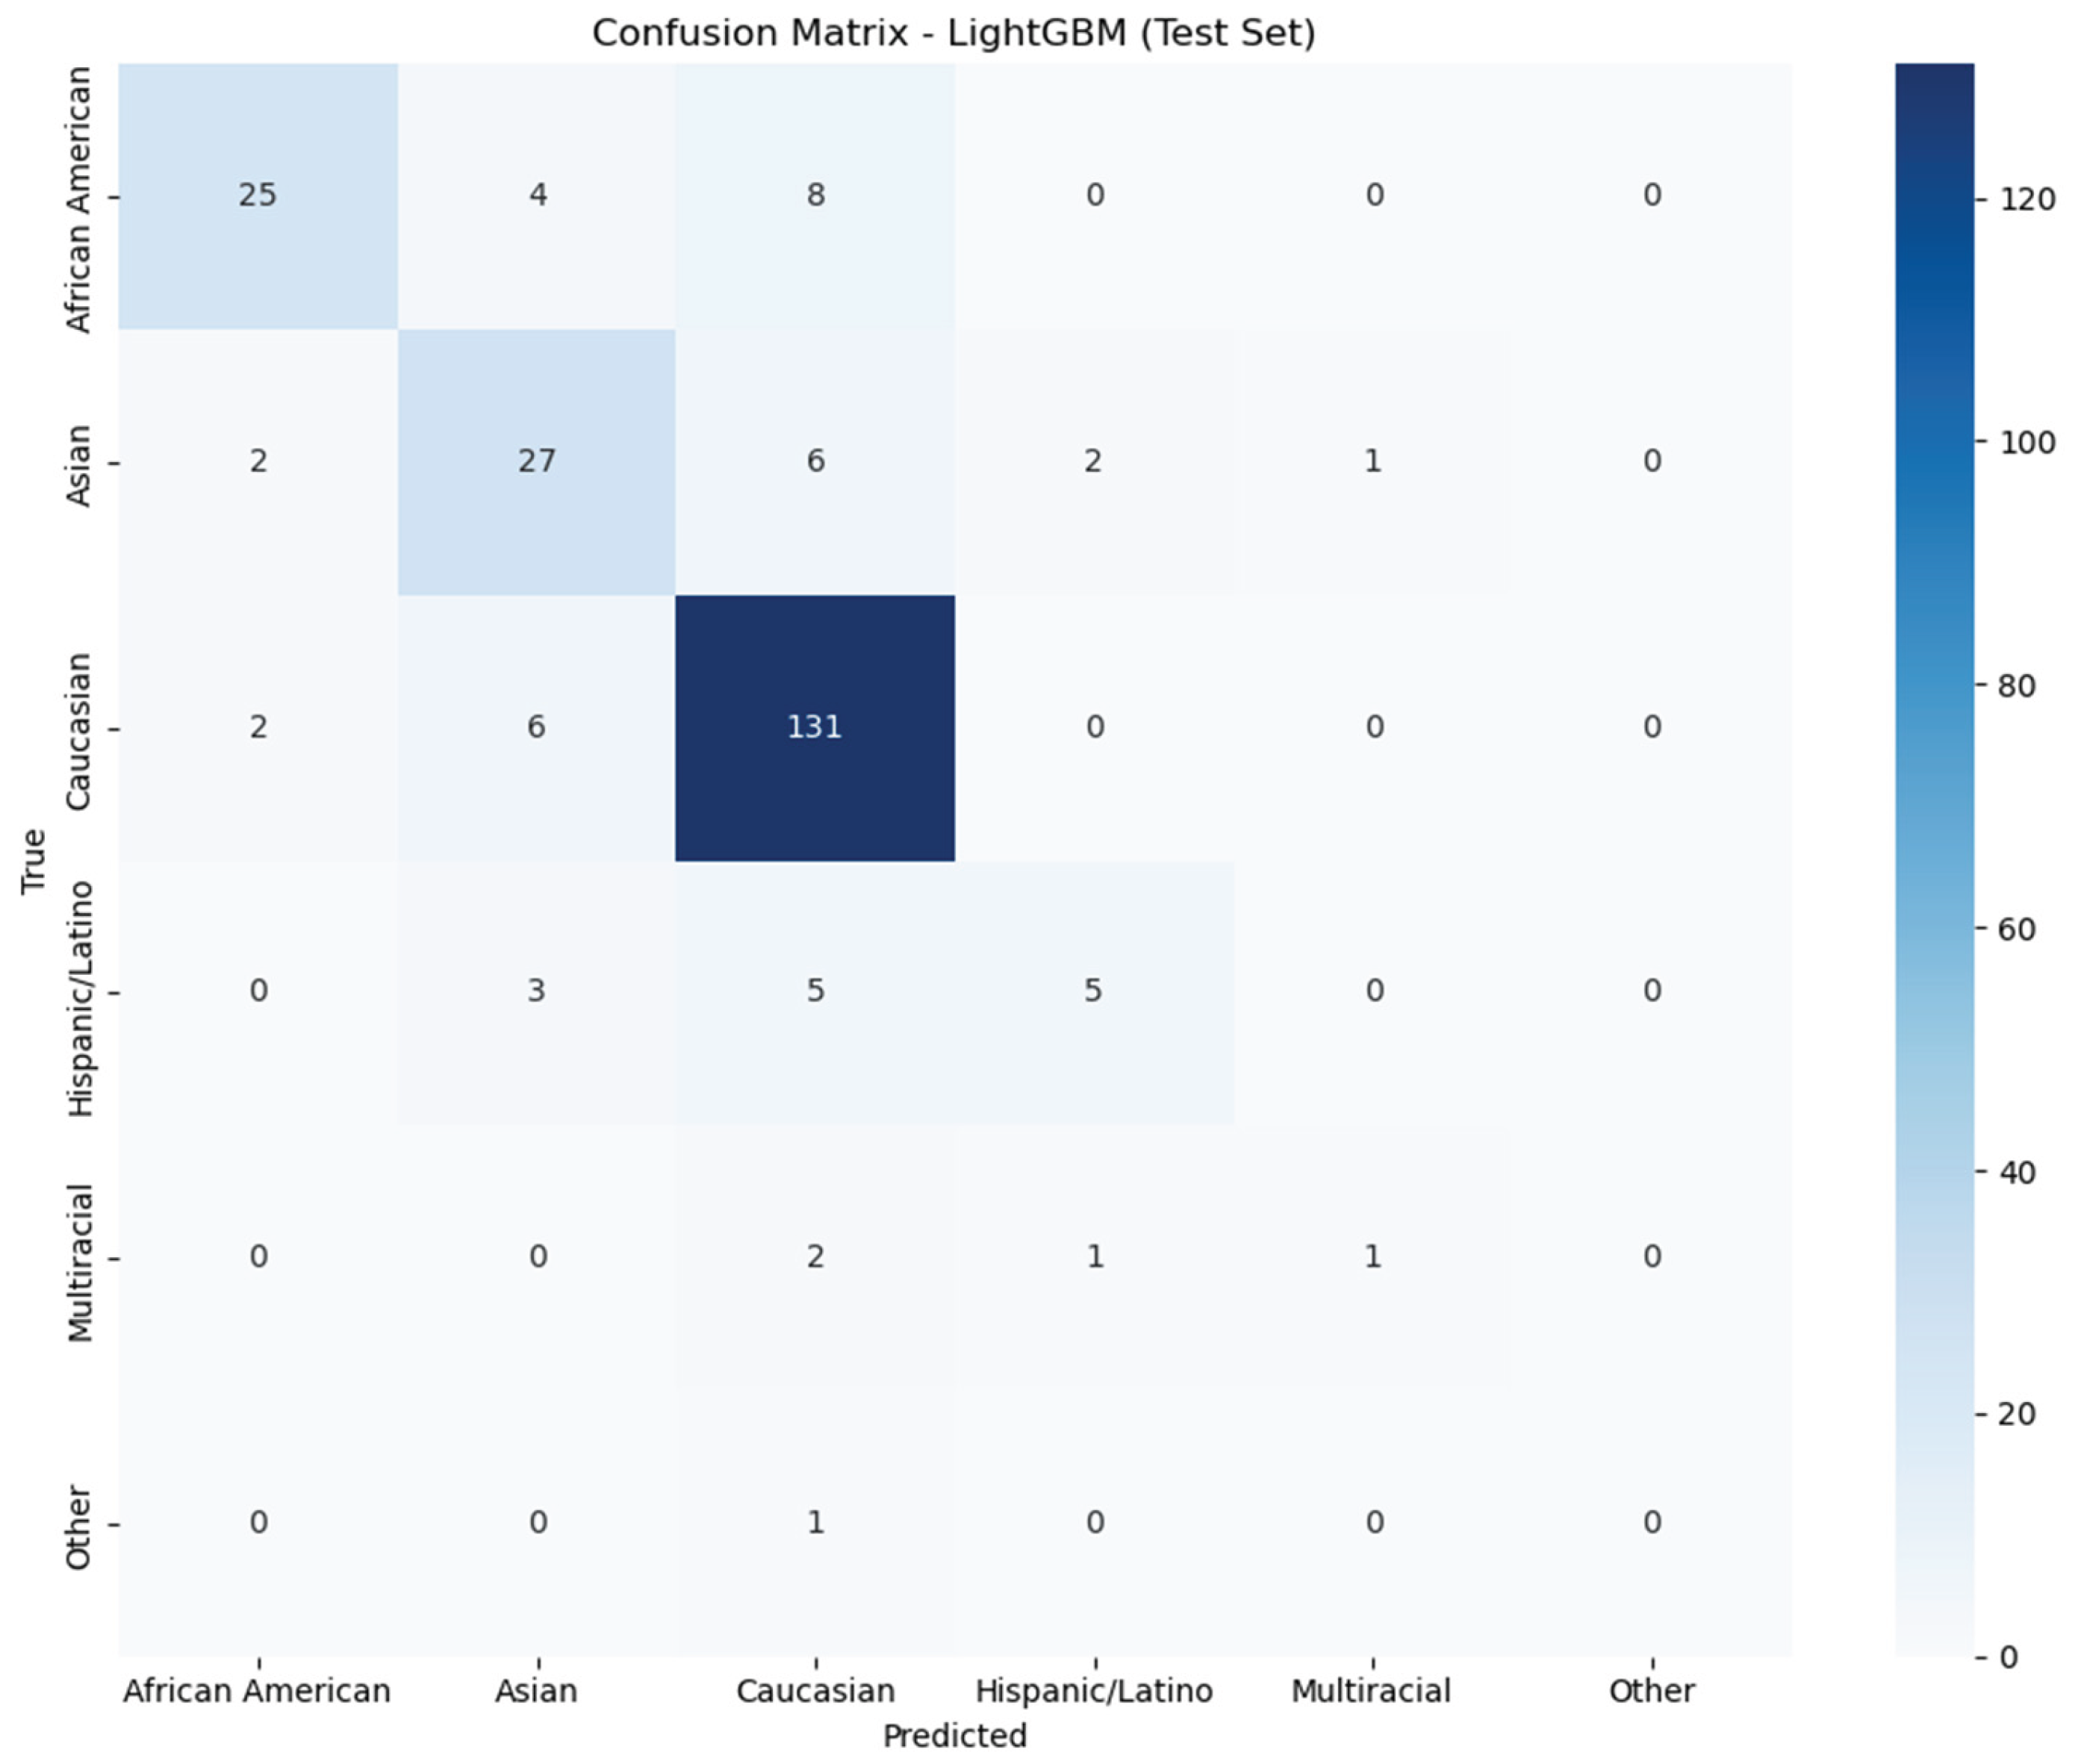

Table 1.
Prevalence Analysis of Top Phyla with Significant Pairwise Comparisons. The table shows prevalence (%) of the top five bacterial phyla among African American (AA), Asian (A), and Caucasian (C) groups. Coefficients (Coeff.*) indicate effect size from the pairwise comparison, with associated p-values (p val**). Significant differences were observed, with Firmicutes, Bacteroidota, and Actinobacteriota being more prevalent in Caucasians compared to African Americans, while Proteobacteria and Verrucomicrobiota were more prevalent in Asians compared to Caucasians.
| Taxon(Phylum) | AA | C | A | Coeff.* | p val** | Comparison |
|---|---|---|---|---|---|---|
| Firmicutes | 82.95 | 99.02 | 94.78 | 20.72 | 9.18705 × 10⁻¹⁸ | C vs AA |
| Bacteroidota | 84.09 | 96.31 | 90.76 | 4.93 | 2.053122 × 10-08 | C vs AA |
| Actinobacteriota | 78.41 | 92.4 | 87.15 | 3.34 | 2.426465 × 10-07 | C vs AA |
| Proteobacteria | 80.11 | 88.93 | 75.9 | 0.39 | 7.817304 × 10-07 | A vs C |
| Verrucomicrobiota | 43.75 | 62 | 24.1 | 0.19 | 6.707755 × 10⁻²⁷ | A vs C |
*Coeff.: effect size coefficient; *p val: adjusted p-value.
Table 2.
ASV features identified by ML model and corresponding Taxon relation. ASVs selected as important features by the ML model are listed with their taxonomic assignments at the kingdom, phylum, class, order, family, and genus levels. NA indicates taxa that could not be resolved at a given level.
| Kingdom | Phylum | Class | Order | Family | Genus | |
|---|---|---|---|---|---|---|
| ASV1575 | Bacteria | Firmicutes | Clostridia | Lachnospirales | Lachnospiraceae | Lachnoclostridium |
| ASV1451 | Bacteria | Bacteroidota | Bacteroidia | Bacteroidales | Bacteroidaceae | Bacteroides |
| ASV1514 | Bacteria | Bacteroidota | Bacteroidia | Bacteroidales | Bacteroidaceae | Bacteroides |
| ASV1450 | Bacteria | Firmicutes | Bacilli | RF39 | NA | NA |
| ASV7189 | Bacteria | Bacteroidota | Bacteroidia | Bacteroidales | Bacteroidaceae | Bacteroides |
| ASV9672 | Bacteria | Firmicutes | Clostridia | Lachnospirales | Lachnospiraceae | Blautia |
| ASV1449 | Bacteria | Firmicutes | Clostridia | Lachnospirales | Lachnospiraceae | Blautia |
| ASV1531 | Bacteria | Bacteroidota | Bacteroidia | Bacteroidales | Rikenellaceae | Alistipes |
| ASV12682 | Bacteria | Firmicutes | Clostridia | Oscillospirales | Ruminococcaceae | UBA1819 |
| ASV18151 | Bacteria | Bacteroidota | Bacteroidia | Bacteroidales | Bacteroidaceae | Bacteroides |
| ASV1454 | Bacteria | Firmicutes | Clostridia | Oscillospirales | Ruminococcaceae | Subdoligranulum |
Disclaimer/Publisher’s Note: The statements, opinions and data contained in all publications are solely those of the individual author(s) and contributor(s) and not of MDPI and/or the editor(s). MDPI and/or the editor(s) disclaim responsibility for any injury to people or property resulting from any ideas, methods, instructions or products referred to in the content. |
© 2025 by the authors. Licensee MDPI, Basel, Switzerland. This article is an open access article distributed under the terms and conditions of the Creative Commons Attribution (CC BY) license (http://creativecommons.org/licenses/by/4.0/).
Copyright: This open access article is published under a Creative Commons CC BY 4.0 license, which permit the free download, distribution, and reuse, provided that the author and preprint are cited in any reuse.


