Submitted:
19 September 2025
Posted:
22 September 2025
You are already at the latest version
Abstract
This study investigates the preferences and determinants of crop farmers' willingness to participate in flood insurance programs in Anambra State, Nigeria. Through a choice experiment, the study examines farmers' preferences for traditional inspection versus weather-based index inspection and identifies factors influencing their insurance decisions. Results reveal that while all surveyed farmers unanimously endorse participation in flood insurance programs, a slight majority express a preference for weather-based index inspection over traditional inspection. Factors such as monthly income, cooperative membership, access to credit, geographical proximity to traditional insurance offices, and receipt of climate change information significantly influence farmers' choice of insurance type. These findings underscore the importance of adapting insurance policies and interventions to meet the evolving needs and preferences of farmers. Policymakers and stakeholders are encouraged to enhance the accessibility and affordability of weather-based index insurance, leverage existing cooperative networks and financial institutions, and tailor interventions to address location-specific challenges. By addressing barriers such as affordability, accessibility, and awareness, policymakers and stakeholders can promote broader participation in flood insurance programs, thereby enhancing the resilience of agricultural communities to climate risks.
Keywords:
flood insurance
; weather-based index
; farmer preferences
; agricultural resilience
; choice experiment
1. Introduction
The escalating frequency and severity of flooding events have not only affected the livelihoods of farmers but also raised critical concerns concerning the sustainability and resilience of agricultural practices in Sub-Saharan Africa. Considering these challenges, the adoption of crop insurance emerges as a crucial risk management tool, yet its implementation and effectiveness remain a subject of debate and continuous adaptation (Al-Maruf et al., 2021). Globally, the economic losses associated with extreme weather events, particularly floods, have seen an exponential increase since the mid-20th century (World Metrological Organization, 2023). Jongman (2018) noted that in 2017 alone, losses from weather-related disasters exceeded USD 300 billion. In the United States, the Representative Concentration Pathway 8.5 climate models showed an increase in mean annual damages from $1.03 billion in the 1990 to $1.56 billion in the 2020 and predicts an increase to $2.88 billion in the 2090 (Corringham et al., 2022)
In Sub-Saharan Africa, a region heavily reliant on agriculture, droughts and floods account for a substantial portion of economic losses and fatalities due to disasters (Moges et al., 2019). In Nigeria, an estimated $668 billion in economic losses were caused by the flood disaster that struck several sections of Nigeria in 2022 (Federal Ministry of Humanitarian Affairs and Disaster Management, 2022). These includes damages to residential and nonresidential buildings, damages to infrastructure, productive sectors affected and farmlands and affecting above 4.9 million persons in the process including the study area. Anambra state, Southeast Nigeria saw one of the greatest flooding events in over 40 years in 2012 and again in 2022 due to significant rains that persisted for several days and the opening of dams. The flood continued for three months. Around 7.7 million people were impacted by the 2012 flood disaster, with over 2 million of them being internally displaced. The flood resulted in significant damage. More than 5000 people were physically hurt, more than 5900 homes were damaged, food crops and farmland were destroyed, and as a result, the region experienced widespread hunger and food insecurity (Nwosu, Archibong, & Nwangene, 2023). The economic toll of these disasters has been immense, with the 2022 flood alone resulting in estimated losses of USD 6.68 billion (Federal Ministry of Humanitarian Affairs and Disaster Management, 2022).
Future resilience will depend among other factors on the preferences and willingness of farmers in these flood-prone communities to participate and pay for crop insurance. In this context, crop insurance is recognized as a vital instrument for stabilizing farm income and promoting investment and technological adoption in agriculture (Kumar et al., 2011; Mahul and Stutley 2010). It transforms high, unpredictable losses into manageable, predictable premiums, sharing the burden of loss across producers (Musonda, 2012; Dragos and Mare, 2014). Moreover, crop insurance is seen as an essential mechanism for reducing vulnerability to climate unpredictability and enhancing resilience among rural communities (Cooper et al., 2008; Matsuda and Kurosaki, 2019).
Despite the apparent benefits of crop insurance, its implementation, particularly the traditional insurance model, has faced significant challenges in Nigeria. Factors such as bureaucratic hurdles, inadequate information, and inefficient triggering of insurance post-disaster have hindered the effectiveness of traditional crop insurance, failing to fully mitigate the impacts of flooding on farmers (Mondal et al., 2020; Patnaik & Narayanan, 2015). In contrast, weather index insurance (WII) has emerged as a promising alternative. It offers payouts based on objective indices, such as rainfall, measured at local weather stations or via satellite, circumventing many issues associated with traditional insurance (Jha and Gupta, 2021). This innovation significantly reduces transaction costs and risks for insurance firms, potentially lowering premiums and increasing accessibility. However, the effectiveness of WII is contingent on the availability of reliable weather and yield data, a significant challenge in developing nations like Nigeria (Clement et al., 2018; Maganga et al., 2021). The Global Index Insurance Facility (GIIF) has been instrumental in promoting WII, yet the uptake among smallholder farmers in developing economies remains limited due to poor awareness and understanding of the benefits of WII (World Bank Finance, 2020; GIIF Press Release, 2022). This highlights the need for effective strategies to enhance the resilience of smallholder farmers to climate variability and extreme weather events through improved insurance products and greater awareness.
Given this backdrop, the study aims to understand the preferences and willingness of farmers in flood-prone communities in Anambra State to participate in and pay for crop insurance. The focus is on evaluating the effectiveness of traditional insurance and WII models in mitigating the adverse effects of flooding on agricultural productivity and livelihoods. The study seeks to explore the factors influencing farmers' decisions regarding insurance, including their perception of risks, trust in insurance providers, and the role of government and private sector interventions. By doing so, it aims to contribute to the development of more effective, farmer-centric insurance solutions that can enhance the resilience of agricultural communities to the growing challenges posed by climate change and weather variability. The study achieved the following objectives: i) find out and describe the crop farmer’s previous experience regarding crop insurance and flood events in their area; ii) determine the type of insurance program they are willing to participate and the factors that influence the choice of insurance program.; and, iii) estimate preferences of crop farmers regarding policy options for crop insurance against flood and their willingness to pay for crop insurance.
This study contributes to the existing body of knowledge on agricultural risk management under the shadow of climate change. It fills a crucial gap in literature regarding the adoption of crop insurance in flood-prone areas, offering insights that are applicable to similar contexts globally. Moreover, this research aligns with the United Nations' Sustainable Development Goals, particularly Goal 2 (Zero Hunger) and Goal 13 (Climate Action), by exploring avenues to protect the agricultural sector from climate-induced risks, thus contributing to global efforts aimed at achieving food security and climate resilience (United Nations, 2015). The significance of the study extends across several critical dimensions, addressing both local and broader agricultural concerns in the face of increasing climate variability. By examining farmers' attitudes towards crop insurance, this study provides invaluable insights into potential risk management strategies that could alleviate the financial strain imposed by such climatic events. Furthermore, this study holds significant implications for policy formulation and strategic interventions. The limited uptake of crop insurance programs in Nigeria, partly due to poor farmer awareness and understanding (World Bank Finance, 2020; GIIF Press Release, 2022), underscores the necessity for informed policy-making that caters to the specific needs and circumstances of the agricultural sector. By shedding light on farmers' preferences and willingness to engage with crop insurance, this research can inform targeted interventions and policies that enhance the adoption of such insurance, thereby securing the financial sustainability of agricultural practices.
2. Traditional Vs. Weather Index-Based Crop Insurance
Many crop farmers do subscribe to traditional insurance; this type of insurance provides protection against the financial loss that can occur when weather events, such as flooding, cause damage to crops. The insurance can cover the cost of repairing or replacing damaged crops, as well as any income that the farmer would have earned if the crop had not been damaged. It is an important tool for protecting farmers from the risk of weather-related losses, and many farmers chose to subscribe to this type of insurance. The traditional insurance has been in use over the years by both government and private insurance companies to provide insurance services to farmers at the coastal region and along water ways including farmers in flood prone communities (Mondal et al., 2020). This approach has failed to offer the best way for farmers to adapt to the risk of weather variability over the years, with several factors hampering the insurance product to fully mitigate the impacts of flooding on the farmers (Mondal et al., 2020). Factors like distance to weather offices, bureaucracy involved, poor inspection, inadequate insurance information, failure of government and private insurance companies to trigger insurance after farmers have encountered losses have reduced the efficiency of the traditional insurance (Patnaik & Narayanan 2015).
Weather index insurance is a relatively new tool for farmers to help control risk. Instead of paying out depending on the loss to farmers crop production, it pays out based on an index, like rainfall, measured at a local weather station or by satellite (Jha and Gupta, 2021). Many underlying issues that render traditional insurance unfeasible are resolved by these subtle distinctions. WII does not require a visit to the farmer's field to determine premium or assess damages. Instead, the insurance pays out if the amount of rainfall exceeds a predetermined threshold. By drastically lowering the transaction costs and risks for the insurance firm, this invention decreases insurance rates and improves accessibility (Jha & Gupta, 2021). Because weather index-based crop insurance has typical product design features and local knowledge, it can help reduce the adverse selection problem caused by asymmetric information. This is especially true when determining risk level does not depend on policyholder behavior or information (Rao, 2011, Hill, and Vigneri 2014, Stein, 2018 and Adjabui et al., 2019).
Indexes can be built to depend on many weather factors, or they can be based on a range of different variables to hedge different kinds of risk. For example, wind farms are interested in wind-based hedges because they seek protection against wind-related blackouts and construction businesses that could have to cease operations in the event of strong winds. Both the hydropower generating, and agriculture industries employ rain-based hedging. For ski resorts and the ski equipment business, hedges dependent on snow are crucial. Hedges based on other variables, such the amount of sunshine or the temperature of the sea surface, are equally feasible (Ahmed et al., 2020). Area yield indices, combinations of weather events like snow and temperature (Carter et al., 2015) inadequate or damaging wind (from hurricanes), and tropical events like typhoons or earthquakes, to be reported using the Richter scale database, are other examples of index contracts that can be applied to the agriculture sector. Instruments based on indexes might have various shapes. Contract classification may also be done according to several payout standards: (a). Zero /One contract. The payout rate would be 100% if the threshold is exceeded; (b) Proportional payment schedule. The contract's author may decide to pay a certain amount for one millimeter of rain that falls below the strike. (c) Layered payment structure. There are various established thresholds, and a certain percentage payment is made once one of them is exceeded. (Ahmed et al., 2020).
India is a prime example of a developing nation using a commercial weather index to provide crop insurance. This product was initially made available by general insurance provider ICICI Lambard through the Andhra Pradesh microfinance institution BASIX. Farmers have been able to purchase weather index-based insurance products from the company since 2003. These policies insure against crop growth phase losses due to excessive rainfall during harvest and as well as insufficient rainfall during sowing period (Stein, 2018 and Falco et al., 2021). In seven Indian states, it is currently operating as a financially feasible insurance product (Adjabui et al., 2019). Another illustration is the Mexican government's FONDEN/FAPRACC, which was established in 1995 with the goal of providing effective safety nets for relief and rehabilitation. FAPRACC used data from nearby weather stations to prototype a weather index insurance product in 2002 that was based on the likelihood of droughts. It obtained reinsurance coverage in 2004 and paid its first claim of $10.5 million in 2005 as a result of the drought index's activation. 16 percent of the entire value coverage was paid out in indemnity. As part of their safety net policy, the government funded a portion of the program's expenses (Alderman and Haque, 2007). Crop insurance based on weather indexes is currently in use in several developing nations worldwide. ACP (Africa, Caribbean, and Pacific States) secretariat and the European Commission signed a deal in 2007 to establish the GIIF (Global Index Insurance Facility), which offers weather index insurance facilities to farmers in ACP nations (GIIF, 2012). Roughly 100,000 farmers in nine countries received insurance facilities from it up until August 2012 (GIIF, 2012). The European Commission provided an initial fund of 24.5 million euros, the Japanese government contributed 2 million, and the Dutch Ministry of Foreign Affairs contributed 0.5 million (GIIF, 2012). With the exception of India, all insurance schemes (TWI and WII) in developing nations are still in their infancy or early stages of growth. Justifying the program's impact, sustainability, and market penetration at this point is difficult.
3. Research Methodology
3.1. Study Area
Anambra State is the study location (Figure 2). The state was purposively selected since it has the highest rate of flooding among the states in the Southeast zone and it was among the 12 most flooded states in Nigeria in 2012 (World Bank and FGN, 2012). The state was founded on August 27, 1991, and is situated in Nigeria's Southeast Geopolitical Zone. Based on the 2006 census data (National Population Commission, 2006), the area is 4,416 square kilometers, and the population is 4,182,000. Its average temperature is roughly 27°C, and it typically rains between 152 and 203 cm. Anambra State receives a lot of rainfall each year—1,400 mm in the north and 2,500 mm in the south—but it falls mostly in one season, from November to February, when there are around four months without rain (Obiekwe & Ugwumba, 2016). 21 Local Government Areas (LGAs) make up Anambra State (see Figure 1). There are four agricultural zones in the state: Onitsha, Aguata, Anambra,Awka. Aguata zone (Aguata, Orumba North and South, and Nnewi north and south) has five blocks, Anambra zone (Anambra east and west, Oyi and Ayamelum) has four blocks, Awkazone (Awka north and south, Njikoka and Donukofia) has four blocks, and Onitsha zone (Onitsha north and south, Oyi and Ekwusigo) has four blocks.
Figure 3 presents the map of Anambra State showing drainage and elevation. The state is divided into two primary landform regions: low plains to the west, north, and east of the highlands, and a moderately elevated highland zone that spans much of the southern part of the state via the Omambara River (Nwike & Ugwumba, 2015). The Niger, Omambara, Mamu, Idemili, Nkisi, Ulasi, and Oyi rivers are some of the state's principal bodies of water. Five large rivers and their tributaries drain the state. Nwadukwe (2000); Ajayi & Nwalieji (2010) list these as the River Niger, Omambara River, Mamu/Ezu River, Idemili River, and River Ulasi. Smaller perennial streams like the Oyi, Nkisi, and Obizi exist in addition to these. Ponds and lakes can be found in inland valleys; the Agulu lake drains several cities in the state. In the more frequently wet locations, the soils are suitable for rice, yam, cassava, and corn in the three LGAs that were purposively selected for the research. The state has a combination of vegetation types, including tropical rainforests, savannas, and mangrove swamps along its coastal areas. The dense rainforests harbor a plethora of flora, including towering trees such as mahogany and obeche, alongside a diverse array of shrubs, vines, and ferns. In the savanna regions, tall grasses dominate the landscape, interspersed with scattered trees such as acacias and baobabs. Along the riverbanks and wetlands, mangrove forests thrive, providing vital habitats for various aquatic and avian species. The vegetation of Anambra State not only contributes to its scenic beauty but also sustains numerous ecological functions and supports the livelihoods of local communities through agriculture, forestry, and tourism.
3.2. Sampling Procedure, Data. and Ethics Declarations
The study employed a combination of multi-stage purposive and random sampling procedure for the selection of respondents for the study. In the first stage, three LGAs were purposive selected from the list of LGA in the State. The LGAs were purposively selected because they contain the major flood-prone communities and which also experienced heavy flooding in both the 2012 and 2022 flood disasters. The LGA’s are Ayamelum, Anambra East, and Anambra West. From the three LGAs, communities that were highly prone to floods and experienced heavy flooding in 2012 and 2022 were purposely selected. The communities were determined through the help of the community leaders, the Ministry of Agriculture and State FADAMA office. The communities are Umueje, Umuelum, Ifite-Ogwari and Umumbo in Ayamelu LGA, the communities in Anambra East are Otuocha and Enugwu-out and the communities in Anambra West are Umueze-Anam, Ezi-Anam and Umuoba. From the list of community members, 100 respondents were randomly selected, giving a total 600 respondents used for the study.
All ethical considerations for this study were thoroughly reviewed and approved by the Ethics Committee of the University of Nigeria. The committee granted ethical clearance for the conduct of the research. Informed consent was obtained from all participants involved in the study. Detailed explanations of the study's objectives, potential risks, and benefits were provided both verbally and in written form to ensure clear understanding. Participants were given the opportunity to ask questions before signing the consent form, thereby ensuring that their participation was fully voluntary and informed. A semi-structured questionnaire where the options from the design of the choice experiment were included in the choice card offered to the respondent was developed. The questionnaire has sections covering perceptions / knowledge about climate change, flooding events and coping strategies, previous insurance uptake, willingness to pay and weather index insurance and socio-economic characteristics of respondents. Discrete choice card was designed into 12 scenarios, split into two, six scenarios for household A and another six scenarios for household B.
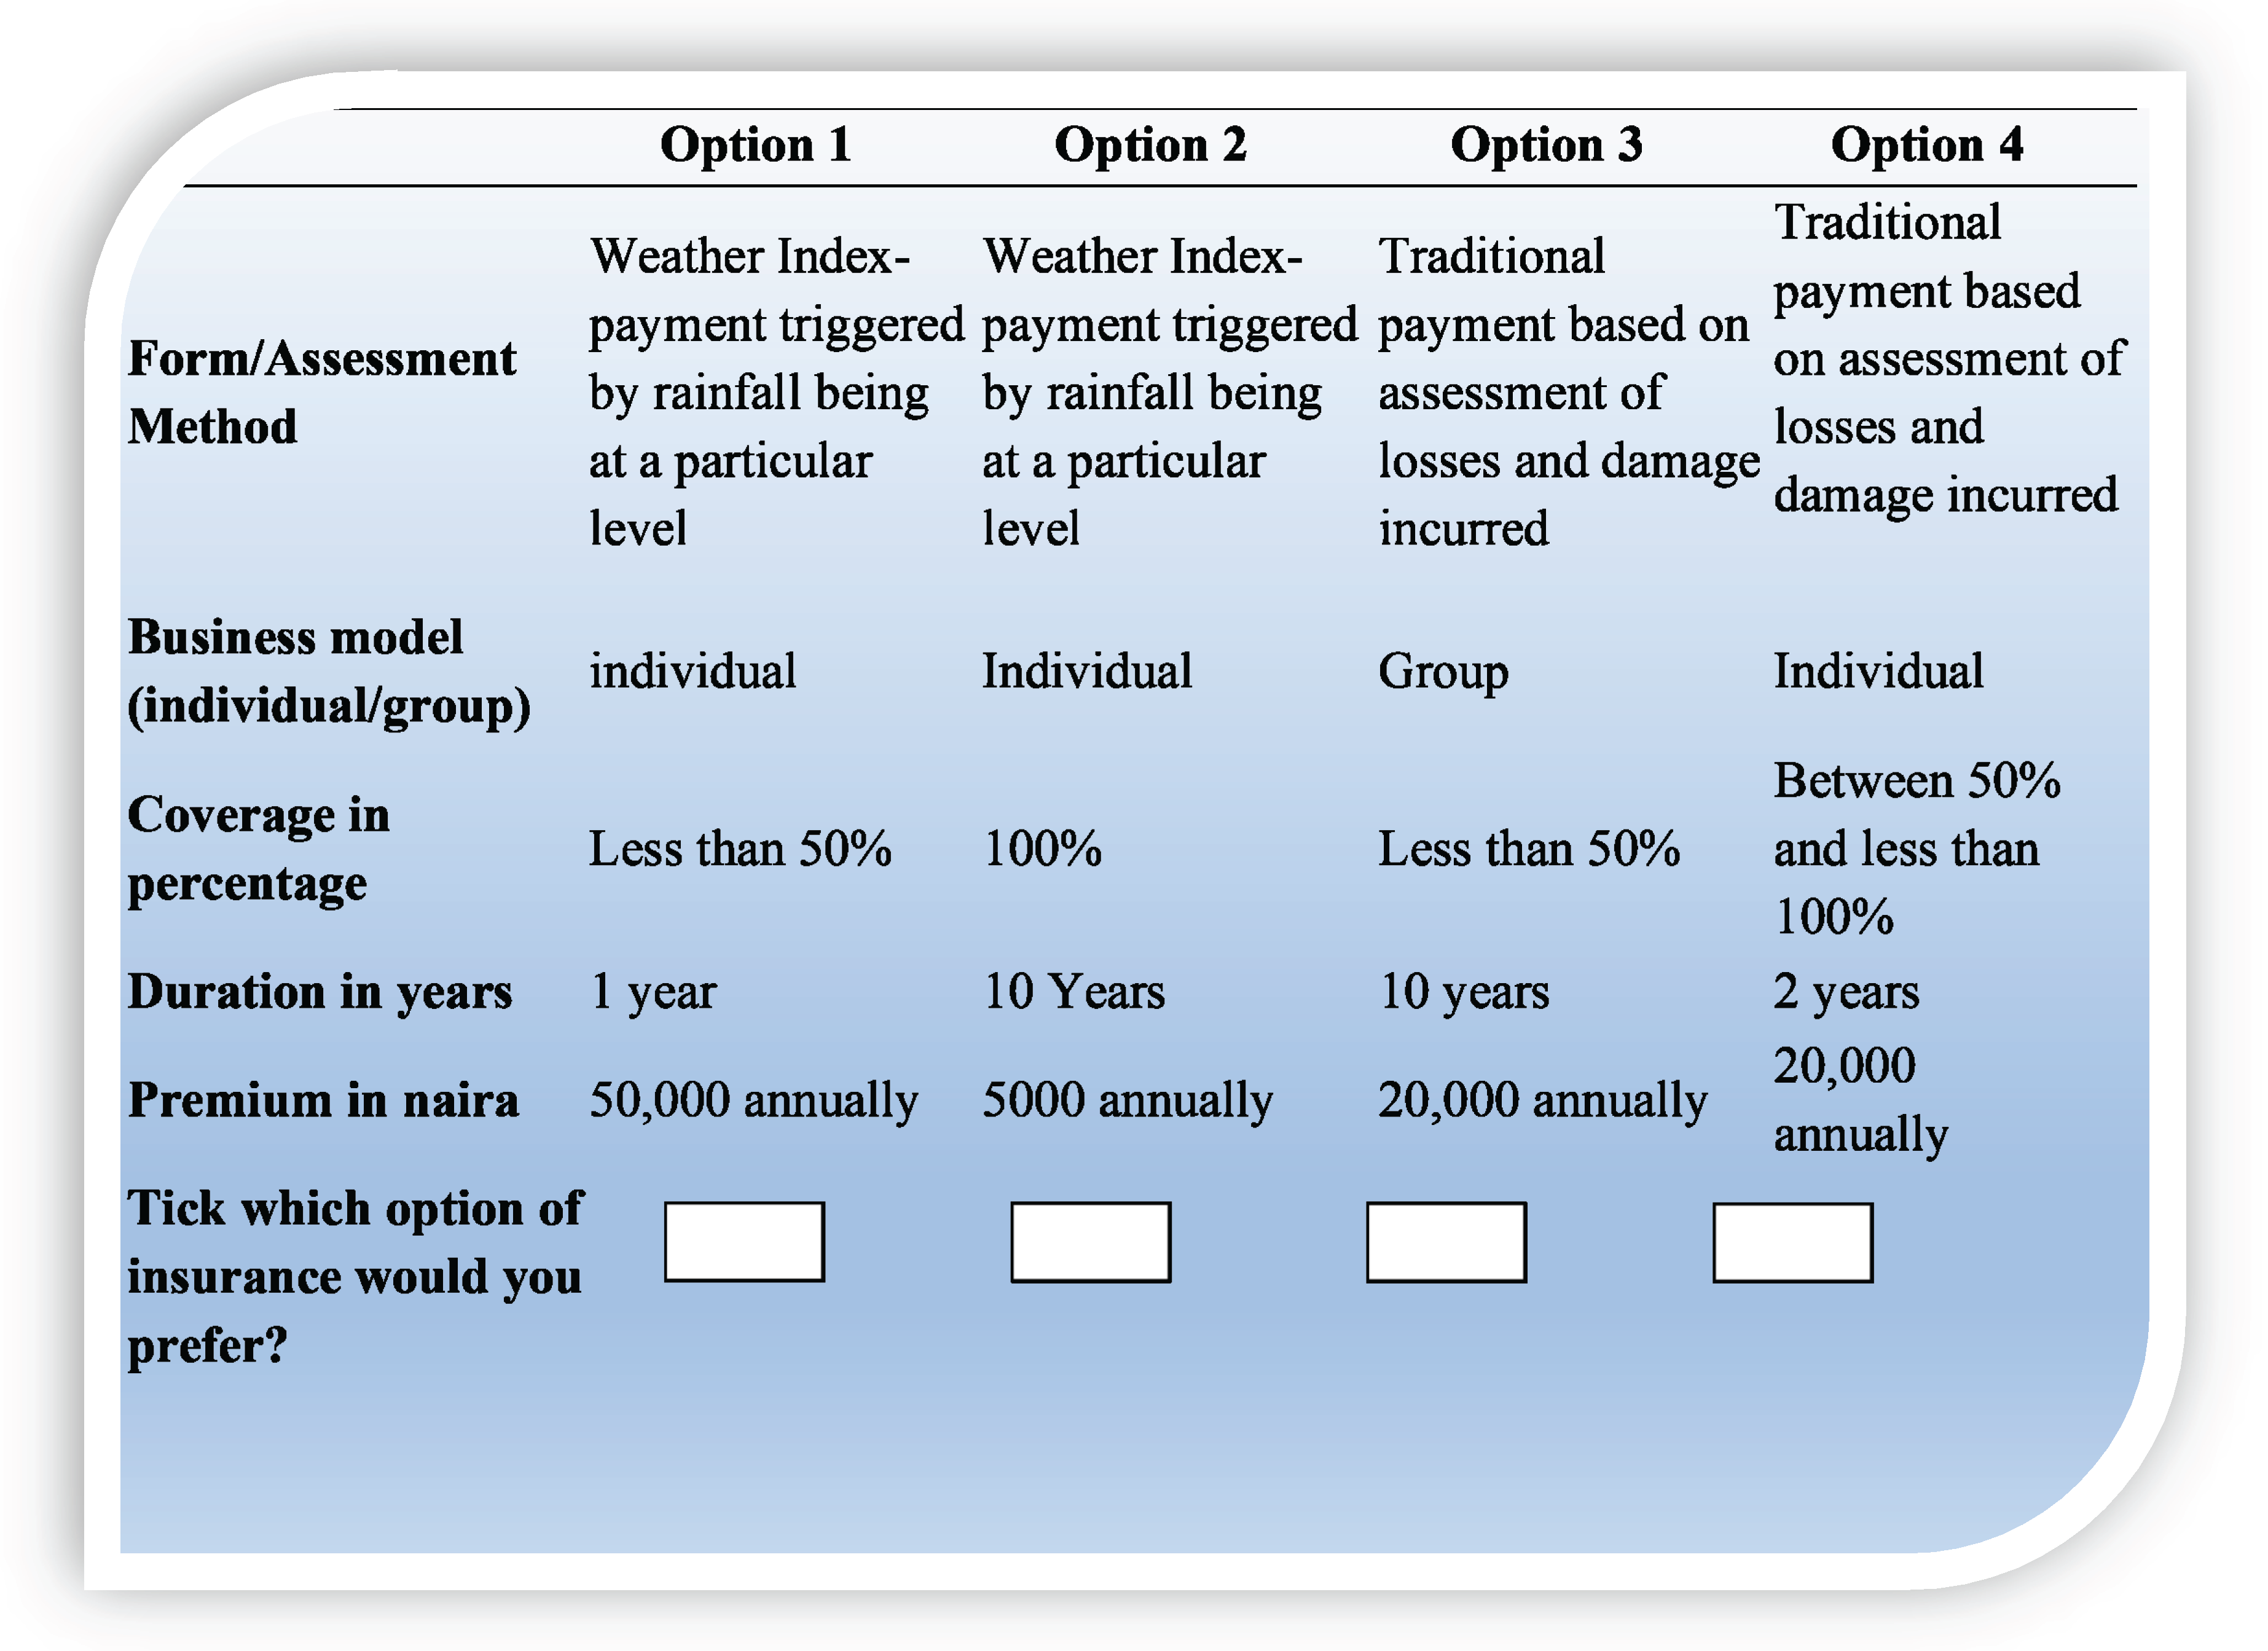
Households A and B had six scenarios each. A scenario has four choice options; each option was made up of five attributes for the farmers to read and comprehend the scenarios to enable them to select a preferred option. The respondents also helped to explain the options to the farmers when they asked for an explanation.The selection of attributes and their options involved a literature review and qualitative research approach, including focus group discussion (FGD) / key informant interviews (WHO et al., 2012). First, through literature search, we identified and compiled an exhaustive list of attributes based on the dimensions of weather index insurance (WII) options available to the farmers. Secondly, we conducted four focus group discussions: one each at Ifite-Ogwari and Umuerum in Ayamelum LGA, Otuocha Aguleri in Anambra East LGA and one at Umueze-Anam Anambra west LGA from 10th October, 2022 to 14th October, 2022. The discrete choice card was designed with Ngene software and backed with relevant literature. The discrete choice scenarios card with choice set offered to the respondents had five generic alternatives of policy options (option 1, 2, 3 and 4); this was to make sure that respondents concentrated on attributes. (Alpizar et al., 2001). Table 3.1 shows a sample of the choice card. We pre-tested the questionnaire in a pilot study. The pilot survey lasted for three days between 12thJanuary, 2023 to 14th January 2023. A community, Otuocha Aguleri, was purposively selected for the pilot study. Thirty households were randomly selected and used for the pilot study. The information from the pilot study was used to update the questionnaire to reflect the actual situation in the study area.
Figure 4.
A sample of the choice card offered to farmers.
We used computer-aided personal interviewing (CAPI) with the “survey solution” (World Bank, 2016) as the software for data collection. We obtained the consent of the respondents before the interview. Respondents who did not provide consent were not interviewed. Another respondent who gave consent and who was randomly selected was used as a replacement. As noted earlier, for the choice card, we gave each respondent (1) six choice scenarios (1-6) and gave respondent (2) another six choice scenarios (7-12); this was to ensure complete randomization of the discrete choice questions sampled and the whole data collected. The changes in climatic conditions, which have contributed immensely to flooding, were explained to the respondents, made up of predominantly FADAMA rice and cash crop farmers, before they were presented with choice scenarios. We used trained M.Sc. students of the Department of Agricultural Economics University of Nigeria Nsukka and officers of the National Bureau of Statistics (NBS) who are professionals in data collection and familiar with the study area in the data collection. The data collection after the pilot study lasted for 3 weeks from 5thMay, 2023 to 22nd May 2023.
3.3. Data Analysis and Model Specification
Utility-Based Framework
To understand the preferences and willingness of farmers in flood-prone communities in Anambra State regarding crop insurance participation and payment, we employ a utility-based framework. Let U denote the utility function, which captures the satisfaction or well-being of farmers derived from different combinations of attributes associated with crop insurance programs.
The utility function can be represented in Equation 1:
U = f(X1, X2,...,Xn)
Where X1, X2,...,Xn are the attributes influencing farmers' decisions regarding crop insurance participation (Table 1).
Discrete Choice Experiment (DCE)
A discrete choice experiment (DCE) is employed to elicit farmers' preferences and willingness to participate in and pay for crop insurance. In a DCE, farmers are presented with hypothetical scenarios representing different combinations of attributes related to crop insurance programs. They are then asked to choose their preferred option from each scenario.
Let Vij represent the utility derived by farmer i from choosing alternative j in a given choice set. The utility Vij can be expressed in equation 2:
Vij = β0+β1X1ij + β2X2ij +...+ βnXnij + εij
Where:
β0 is the intercept term
β1,β2,...,βn are the coefficients associated with attributes X1,X2,...,Xn
X1ij,X2ij,...,Xnij represent the levels of attributes in choice set j for farmer i
εij is the random error term capturing unobservable factors influencing the choice
The probability Pij that farmer i chooses alternative j can be modeled using the multinomial logit (MNL) model (Eqn. 3):
Where J is the total number of alternatives in each choice set.
Conditional Probit Model
Furthermore, we employ a conditional probit regression model to analyze the determinants of crop farmers' preferences regarding policy options. The conditional probit model is a statistical regression model used to analyze binary outcome data, particularly in cases where there is a potential correlation or grouping structure in the data. It is an extension of the standard probit model that allows for the inclusion of additional explanatory variables, including categorical variables, and accounts for potential correlations among observations (Wooldridge, 2010).
In the context of this study on the preferences and willingness of farmers to participate and pay for crop insurance, the conditional probit model was used to analyze the likelihood of farmers choosing to participate in crop insurance based on various factors, such as policy options, socio-economic characteristics, and past experiences with floods.
The implicit equation for the conditional probit regression model can be represented in Eqn. 4:
Where:
represents the latent variable capturing the unobservable preference of farmers for crop insurance.
X1, X2,…, Xnr epresent the independent variables, such as policy options, socio-economic factors, and other relevant variables.
β0, β1,…, βn are the coefficients to be estimated.
ϵ represents the error term, assumed to follow a standard normal distribution.
The explicit representation of the conditional probit model (Eqn 5) involves transforming the latent variable Y∗ into a binary outcome variable Y indicating whether the farmer chooses to participate in crop insurance or not. This transformation is done using the cumulative distribution function (CDF) of the standard normal distribution
P(Y = 1|X1, X2, …, Xn) = Φ(β0 + β1X1 +β2X2 + … + βnXn)
Where:
represents the probability of a farmer choosing to participate in crop insurance given the values of the independent variables.
is the cumulative distribution function of the standard normal distribution.
β0, β1,…, βn are the coefficients estimated from the model.
To estimate the conditional probit regression model, one would use Maximum Likelihood Estimation (MLE) techniques. The coefficients would be estimated to maximize the likelihood function, which measures the probability of observing the actual choices made by farmers given the values of the independent variables. In the study, the independent variables (policy options, socio-economic factors, etc.) were derived from the choice experiment survey, and the dependent variable (participation in crop insurance) was based on the choices made by farmers in response to the hypothetical scenarios presented in the survey. By estimating the conditional probit regression model, one can analyze the preferences of crop farmers regarding policy options for crop insurance against floods and their willingness to pay for crop insurance, considering the various factors influencing their decision-making process.
4. Results and Discussion
4.1. Determinants of Willingness of Crop Farmers to Participate in the Different Flood Insurance Types
We first present the result of the willingness of crop farmers to participate in a flood insurance program and the choice of traditional on weather index (Table 2). The unanimous endorsement of flood insurance participation by all surveyed farmers, totaling 100%, underscores the recognition among agricultural stakeholders of the vital role insurance plays in managing the risks associated with flooding. The intriguing aspect of the data emerges when examining the types of insurance programs farmers are open to participating in. Approximately 47.66% of respondents express a preference for traditional inspection-based insurance, a model deeply rooted in historical agricultural practices. This inclination suggests that a considerable portion of farmers may find comfort and familiarity in conventional insurance approaches, potentially influenced by their past experiences or existing perceptions of the reliability of this method. Contrastingly, the remaining 52.34% of respondents express a preference for weather-based index inspection. This marks a shift towards more contemporary and innovative insurance models, aligning with the trend discussed in studies by Jha& Gupta (2021) and Cooper et al. (2008). The appeal of weather-based index inspection lies in its potential to reduce transaction costs, increase accessibility, and offer a more objective and efficient mechanism for determining payouts, as highlighted in the literature.
The results from the Probit Regression Model (Table 3) provide a comprehensive understanding of the factors influencing crop farmers' inclination to participate in either traditional inspection or weather-based index inspection. Monthly income emerged as a significant positive predictor, corroborating existing research that underscores the pivotal role of economic factors in shaping farmers' attitudes towards insurance. The positive relationship between income and choice implies that wealthier farmers may be more inclined to invest in weather-based index inspection, as suggested by Clarke et al. (2020).
Cooperative membership emerges as a strong determinant, positively influencing farmers' willingness to participate in weather-based index inspection flood insurance. The positive association between the access to credit and the willingness to participate in flood insurance resonates with the literature highlighting the enabling role of financial resources in risk management decisions (Akudugu et al., 2019; Mahul & Skees, 2007). Farmers with access to credit may perceive weather-based index inspection as a viable strategy to safeguard their investments and repay debts in the event of crop losses (Chantarat et al., 2018). The distance from the farm to the market emerges as a noteworthy factor, with a positive impact on farmers' willingness to participate in weather-based index inspection flood insurance. This reflects the intricate interplay between geographical factors and choice of insurance type, as explored in studies such as Eriksen et al. (2015). Farmers closer to traditional insurance offices are more likely to opt for traditional insurance. Policymakers and insurance providers should consider the spatial dimension in tailoring interventions to address location-specific challenges and opportunities.
The influence of the receipt of climate change information on farmers' willingness to participate in flood insurance aligns with research emphasizing the pivotal role of reliable information channels. Farmers that receive climate change information are more likely to take weather-based index inspection than those farmers who do not receive climate change information. (Nhemachena et al., 2014). The positive impact of prior participation in workshop or training on weather-based index inspection highlights the learning curve associated with insurance decisions. Farmers with prior exposure may have experienced the benefits of participating in weather-based index inspection workshop, which fosters a positive attitude towards future participation (Giné et al., 2008). This finding emphasizes the need for targeted educational initiatives to familiarize farmers with weather-based index inspection and their potential advantages. Trust in insurance providers and perceptions of insurance efficacy, extensively discussed in the literature, may influence farmers' decisions but were not explicitly addressed in this model (Baidu-Forson, 1999; Turvey et al., 2015).
4.2. Preferences of Crop Farmers Regarding Policy Options for Crop Insurance Against Flood
The analysis of Willingness to Pay (WTP) results, as outlined in Table 4, provides valuable insights into the amount farmers are willing to give up or pay to switch from a 10-year insurance plan to a 2-year insurance plan, while maintaining the same coverage level. Negative values for WTP indicate that farmers are willing to pay less for the 2-year insurance plan compared to the 10-year insurance plan, or they are not willing to give up as much to switch to the 2-year plan while positive values for WTP indicate that farmers are willing to pay more for the 2-year insurance plan compared to the 10-year insurance plan. WTP values for the 2-year duration (-29662.378) are compared with the WTP values for the 10-year duration (-46220.961). From the result, crop farmers are willing to give up 29,662.378 to switch from a 10-year to a 2-year insurance plan. This echoes the findings of Mahul and Stutley (2010) on the role of coverage duration in influencing farmers' participation in insurance programs.
The value of 19957.927 represents the amount the farmers are willing to pay or give up to have 100% insurance coverage compared to having coverage between 50% and 100%. The willingness of farmers to pay more for 100% coverage indicates a strong preference for risk management. This suggests that farmers are willing to invest more to mitigate the risks associated with crop production, indicating the importance they place on safeguarding their income against potential losses. The finding underscores the importance of investing in agricultural resilience measures, such as improved crop management practices, early warning systems, and infrastructure development. By complementing insurance coverage with proactive risk mitigation strategies, farmers can further enhance their ability to withstand adverse events and maintain sustainable livelihoods.Top of Form This aligns with the argument presented by Musonda (2012) and Dragos and Mare (2014) that higher coverage percentages are perceived as more effective in mitigating risks and providing financial security to farmers. The slightly lower positive WTP value for the 50%-100% coverage category (15501.114) indicates a nuanced preference for extensive coverage, corroborating the findings of studies emphasizing the importance of tailoring insurance options to suit the specific needs of agricultural communities (Cooper et al., 2008; Matsuda and Kurosaki, 2019).
Examining group identification and weather identification, the negative WTP value for group identification (-6043.3518) implies a potential decrease in willingness to pay for group insurance. This finding resonates with challenges identified by Mondal et al. (2020) and Patnaik and Narayanan (2015) related to bureaucratic hurdles and inefficiencies associated with traditional group insurance models in agricultural contexts. Similarly, the negative value for weather identification (-14406.942) underscores the role of climate-related awareness in influencing farmers' willingness to pay, aligning with findings on the importance of reliable weather data in the success of weather index insurance (Clement et al., 2018; Maganga et al., 2021). The WTP values align with existing literature, emphasizing the dynamic nature of farmers' preferences for insurance coverage duration and extent, and the influence of group and weather-related factors. This analysis contributes to the ongoing discourse on developing effective, farmer-centric insurance solutions that address the diverse needs and challenges faced by agricultural communities in the context of climate change and weather variability.
The results from the conditional logit regression model, as presented in Table 5, offer valuable insights on how the various policy options will influence crop farmers' willingness to participate in different flood insurance programs. The coefficients associated with various policy options provide a nuanced understanding of the determinants shaping farmers' decisions in the context of insurance preferences. The premium coefficient (-6.54) reveals a significant negative association with farmers' willingness to pay for a particular insurance policy combination, indicating that as the premium increases, farmers exhibit a decreasing inclination to participate. This aligns with findings in the literature that emphasize the sensitivity of farmers to the cost of insurance as a crucial factor affecting their willingness to enroll (Mahul & Stutley, 2010).
The coefficients for insurance duration shed light on the temporal aspect of farmers' preferences. A negative association is observed for all three duration categories (10 years, 5 years, and 2 years), suggesting that as the insurance duration decreases, farmers are generally more inclined to participate. Longer insurance durations are often linked to higher premiums, potentially explaining this negative relationship (Kumar et al., 2011). Regarding insurance coverage, the positive coefficient for 100% coverage (0.1305) indicates a favorable influence on farmers' willingness to participate. This corresponds with the literature emphasizing that comprehensive coverage is an attractive feature for farmers seeking effective risk management (Musonda, 2012). The coefficient for the 50%-100% coverage category (0.1013) is also positive but with a slightly lower magnitude, suggesting a positive influence, albeit to a lesser extent than full coverage. This preference aligns with studies highlighting farmers' varying risk preferences and the importance of tailored insurance products (Dragos and Mare, 2014). Interestingly, the coefficients for group identification and weather identification are not statistically significant. The absence of a clear influence from these variables suggests that group-based insurance and farmers' identification with weather-related issues may not be significant drivers of their willingness to participate in flood insurance programs in this context.
5. Discussion and Conclusion
The unanimous endorsement of flood insurance participation by all surveyed farmers underscores the recognized importance of insurance in managing the risks associated with flooding. However, the notable finding emerges when examining farmers' preferences for insurance types, with a slight majority expressing a preference for weather-based index inspection over traditional inspection. This shift towards more innovative insurance models aligns with contemporary trends in literature, highlighting the appeal of weather-based index inspection in reducing transaction costs and offering more objective payout mechanisms (Bucheli, et al., 2022; Aggarwal, Vyas, Thornton, 2019). One implication of these results is the need for policymakers and insurance providers to adapt their strategies to meet the evolving preferences of farmers. While traditional inspection has been a longstanding approach deeply rooted in historical agricultural practices, the increasing interest in weather-based index inspection suggests a growing acceptance of innovative insurance models. Therefore, there is an opportunity to leverage this trend by enhancing the accessibility and affordability of weather-based index insurance, thereby encouraging broader participation among farmers.
Furthermore, the factors identified in the Probit Regression Model as significant predictors of farmers' inclination towards weather-based index inspection offer valuable insights for designing targeted interventions. For instance, the positive association between monthly income and choice of insurance type suggests that wealthier farmers may be more inclined to opt for weather-based index inspection. This highlights the importance of ensuring equitable access to insurance products and implementing measures to support vulnerable farmers with limited financial resources. Moreover, the finding regarding the influence of geographical factors on farmers' choice of insurance type emphasizes the need for location-specific interventions. Tailoring insurance programs to address the unique needs and constraints of farmers based on their proximity to traditional insurance offices can enhance the effectiveness and accessibility of insurance products in different regions.
The conditional probit model further reveals critical insights into the policy options influencing crop farmers preferences regarding weather-based insurance. The results indicate a strong negative relationship between premium costs and farmers' willingness to pay for insurance. This aligns with existing literature and result of the probit model that underscores the sensitivity of farmers to the cost of insurance premiums as a primary factor affecting their enrollment decisions (Mahul & Stutley, 2010). High premiums can be a significant barrier to participation, especially for smallholder farmers with limited financial resources. This finding is consistent with Kumar et al. (2011), who noted that the cost of insurance is a critical determinant of its uptake among farmers in developing countries. The negative coefficients associated with longer insurance durations (10 years, 5 years, and 2 years) suggest that farmers are more inclined to participate in insurance programs with shorter durations. This preference may be attributed to the higher premiums often associated with longer-term policies, which can be financially burdensome (Kumar et al., 2011). Furthermore, the positive coefficient for 100% insurance coverage highlights the appeal of comprehensive insurance plans that offer full protection against losses. This finding supports Musonda (2012), who emphasized that comprehensive coverage is a crucial feature for farmers seeking effective risk management solutions.
Interestingly, the study found that group identification and weather identification were not significant factors influencing farmers' willingness to participate in flood insurance programs. This contrasts with some studies suggesting that group-based insurance schemes can enhance trust and cooperation among farmers, thereby increasing uptake (Clement et al., 2018). This finding is likely due to the fact that might lack sufficient awareness and understanding of how group-based insurance schemes and weather identification mechanisms function (Cooper et al., 2008). In some contexts, farmers may have experienced or perceived issues of mistrust and mismanagement in group-based schemes (Matsuda & Kurosaki, 2019. If previous experiences with cooperative efforts or group initiatives were negative, farmers might be skeptical about the efficacy and reliability of group-based insurance. This skepticism can reduce the attractiveness of such schemes, despite their potential benefits. The effectiveness of group-based and weather index insurance schemes is often enhanced by strong policy and institutional support. In the absence of robust government policies and institutional frameworks that promote and support these schemes, farmers might not perceive them as viable options (Cooper et al., 2008; Mahul & Stutley, 2010).
These findings have important implications for the design and implementation of agricultural insurance programs in flood-prone areas. Policymakers and insurance providers need to consider the affordability of premiums and the structure of insurance durations to make these programs more accessible and appealing to farmers. The positive reception of comprehensive coverage indicates a demand for insurance products that offer robust protection against losses, which can help stabilize farm incomes and promote investment in agricultural technologies. Moreover, the limited impact of group-based and weather identification factors suggests a need for targeted awareness campaigns and educational initiatives to improve farmers' understanding of the benefits of crop insurance and the specific risks posed by weather variability. Enhancing farmers' knowledge and trust in insurance providers can be critical to increasing participation rates.
In bridging the gap between these critical findings and future research directions lies a pressing need for comprehensive policy frameworks and strategic interventions. Firstly, policymakers and insurance providers must engage in collaborative efforts to address the affordability of premiums and the structural complexities of insurance durations. By devising flexible pricing models and offering customizable insurance packages, these programs can become more accessible and attractive to farmers, thereby fostering increased participation rates. Furthermore, recognizing the demand for comprehensive coverage underscores the importance of designing insurance products that provide robust protection against a wide range of losses. This not only stabilizes farm incomes but also encourages investment in agricultural technologies, driving sustainable growth in flood-prone regions. Additionally, the imperative for targeted awareness campaigns and educational initiatives cannot be overstated. By empowering farmers with knowledge about the benefits of crop insurance and the specific risks posed by weather variability, these efforts can enhance trust in insurance providers and alleviate barriers to participation. Through a concerted focus on these areas, policymakers, researchers, and stakeholders can pave the way for more resilient and sustainable agricultural systems, poised to withstand the challenges of an increasingly uncertain climate landscape.
While this study has provided valuable insights into farmers' decision-making processes and the factors influencing their choices, there are still significant gaps that warrant further investigation. Specifically, there is a need for future research to investigate the specific barriers hindering the adoption of weather index insurance (WII) and other innovative insurance models in developing countries. These barriers could include factors such as lack of awareness, trust issues, and infrastructural limitations. Additionally, exploring the role of government and private sector interventions in supporting the uptake of crop insurance can offer valuable insights for policy formulation and strategic planning. By examining the effectiveness of different interventions, future research can provide policymakers with evidence-based recommendations to enhance the accessibility and effectiveness of agricultural insurance programs in flood-prone regions.
Author Contributions
All authors have made substantial contributions to the manuscript and qualify for authorship as per the ICMJE guidelines. Kalu Uche Felix and Chukwuma Otum Ume conceptualized the study and designed the research framework. Chukwuma Otum Ume, Ebere Amaechina, and Nnaemeka Chukwuone were responsible for data collection, statistical analysis, and interpretation of the results. Kalu Uche Felix drafted the initial manuscript with significant input from Chukwuma Otum Ume. Ebere Amaechina and Nnaemeka Chukwuone critically reviewed the manuscript for intellectual content, providing substantive revisions and feedback. All authors reviewed and approved the final version of the manuscript for submission and publication. All authors agree to be accountable for all aspects of the work, ensuring accuracy and integrity in the research and its reporting.
Funding
This work was supported by the Environment for Development (EfD) Sweden under the grant number EfD/MS1516.
Data Availability Statement
The data that support the findings of this study are openly available in Zenodo at http://doi.org10.5281/zenodo.14639331, reference number 14639331.
Conflicts of Interest
No potential conflict of interest was reported by the author(s).
References
- Abebe, H.T., and A. Bogale. 2014. Willingness to pay for rainfall-based insurance by smallholder farmers in Central Rift Valley of Ethiopia:The case of Dugda and Mieso Woredas. Asia Pac. J. Energy Environ. 1: 117–152. [Google Scholar] [CrossRef]
- Abugri, S.A., J. Amikuzuno, and E.B. Daadi. 2017. Looking out for a better mitigation strategy: Smallholder farmers’ willingness to pay fordrought-index crop insurance premium in the Northern Region of Ghana. Agric. Food Secur. 6: 71. [Google Scholar] [CrossRef]
- Aditya, K., A. Kishore, and M.T. Khan. 2020. Exploring farmers’ willingness to pay for crop insurance products: A case of weather-basedcrop insurance in Punjab India. Agr. Econ. Res. Rev. 33: 135–146. [Google Scholar] [CrossRef]
- Adjabui, J.A., P.R. Tozer, and D.I. Gray. 2019. Willingness to participate and pay for index-based crop insurance in Ghana. Agric. Financ.Rev 79: 491–507. [Google Scholar] [CrossRef]
- Aggarwal, P., S Vyas, P Thornton, and B M Campbell. 2019. How much does climate change add to the challenge of feeding the planet this century? Environ. Res. Lett., 14 043001. [Google Scholar] [CrossRef]
- Agresti, Alan. 2015. Foundations of Linear and Generalized Linear Models. New York: Wiley: pp. 183–186. ISBN 978-1-118-73003-4. [Google Scholar]
- Agroasemex, *!!! REPLACE !!!*. 2006. The Mexican Experience in the Development and Operation of Parametric Insurances Applied to Agriculture.
- Ahmed, S., C. McIntosh, and A. Sarris. 2020. The impact of commercial rainfall index insurance: Experimental evidence from Ethiopia. Am.J. Agric. Econ. 102: 1154–1176. [Google Scholar] [CrossRef]
- Aizaki, H., J. Furuya, T. Sakurai, and S.S. Mar. 2021. Measuring farmers’ preferences for weather index insurance in the Ayeyarwady Delta, Myanmar: A discrete choice experiment approach. Paddy Water Environ. 19: 307–317. [Google Scholar] [CrossRef]
- Akter, S., T.J. Krupnik, and F. Khanam. 2017. Climate change skepticism and index versus standard crop insurance demand in coastalBangladesh. Reg. Environ. Chang. 17: 2455–2466. [Google Scholar] [CrossRef]
- Akter, S., T.J. Krupnik, F. Rossi, and F. Khanam. 2016. The influence of gender and product design on farmers’ preferences for weatherindexedcrop insurance. Glob. Environ. Chang. 38: 217–229. [Google Scholar]
- Akudugu, M. A., H. Alhassan, and A. Normanyo. 2019. Social capital and access to credit: A study of rural farmers in Northern Ghana. International Journal of Social Economics 46, 5: 677–697. [Google Scholar]
- Alberini, A., and J. Cooper. Application of contingent valuation method indeveloping countries. FAO Economic and Social Development Paper 146.2000.17. IPCC. Summary.
- Aldermann, H., and T. Haque. 2007. Insurance Against Covariate Shocks. The Role of Index-Based Insurance in Social Protection in Low-Income Countries of Africa. World Bank Working Paper no. 95. [Google Scholar]
- Aldrich, John H., Forrest D. Nelson, Adler, and E. Scott. 1984. Linear Probability, Logit, and Probit Models. Sage: pp. 48–65. ISBN 0-8039-2133-0. [Google Scholar]
- Al-Maruf, A., S.A. Mira, T.N. Rida, M.S. Rahman, P.K. Sarker, and J.C. Jenkins. 2021. Piloting a weather-index-based crop insurancesystem in Bangladesh: Understanding the challenges of financial instruments for tackling climate risks. Sustainability 13: 8616. [Google Scholar] [CrossRef]
- Ayele, G. K. 2011. The impact of selected small-scale irrigation schemes onhousehold income and the likelihood of poverty in the Lake Tana Basin ofEthiopia.
- Bucheli, J., N. Conrad, S. Wimmer, T. Dalhaus, and R. Finger. 2022. Weather insurance in European crop and horticulture production. Climate Risk Management 41: 100525. [Google Scholar] [CrossRef]
- Baidu-Forson, J. 1999. Factors influencing adoption of land-enhancing technology in the Sahel: Lessons from a case study in Niger. Agricultural Economics 21, 3: 241–256. [Google Scholar]
- Barnett, B.J., and O. Mahul. 2007. Weather index insurance for agriculture and rural areas in lower-income countries. Am. J. Agric. Econ. 89: 1241–1247. [Google Scholar] [CrossRef]
- Barrett, C. B., B. J. Barnett, M. R. Carter, S. Chantarat, J. W. Hansen, A. G. Mude, D.E. Osgood, J. R. Skees, C. G. Turvey, and M. N. Ward. 2007. Poverty Traps and Climate Risk: Limitations and Opportunities of Index-Based Risk Financing. Prepared for the Policy Roundtable on Climate Risk, Poverty Traps and Index-Based Financing, hosted by the International Research Institute for Climate and Society, Columbia University, September. [Google Scholar]
- Belissa, T.K., R. Lensink, and M. Van Asseldonk. 2022. Risk and ambiguity aversion behavior in index-based insurance uptake decisions:Experimental evidence from Ethiopia. J. Econ. Behav. Organ. 2020, 180, 718–730. Sustainability 14: 14558 17 of 17. [Google Scholar]
- Bhise, V. B., S. S. Amphore, and S. H. Jagdale. 2007. Performance of Agriculture Insurance Schemes in India. Paper prepared for presentation at the 101st EAAE Seminar “Management of Climate risks in Agriculture” Berlin, Germany, July 5-6. [Google Scholar]
- Binswanger-Mkhize, H.P. 2012. Is there too much hype about index-based agricultural insurance? J. Devel. Stud. 48: 187–200. [Google Scholar] [CrossRef]
- Budhathoki, N.K., J.A. Lassa, S. Pun, and K.K. Zander. 2019. Farmers’ interest and willingness-to-pay for index-based crop insurance inthe lowlands of Nepal. Land Use Policy 85: 1–10. [Google Scholar] [CrossRef]
- Cafiero, C., F. Angelucci, F. Capitanio, and M. Vollaro. 2007. Index based compensation for weather risk in the Italian agriculture. A feasibility study based on actual historic data. Paper prepared for presentation at the 101st EAAE Seminar ‘Management of Climate Risks in Agriculture’, Berlin, Germany, July 5-6. [Google Scholar]
- Carter, M. R., F. Galarza, and S. Boucher. 2007. Underwriting Area-based Yield Insurance to Eliminate ‘Risk Rationing’ and Crowd-in Credit Supply and Demand”. Paper presented at the International Conference on Rural Finance Research “Moving Results into Policies and Practice, FAO Headquarters, Rome, 19-21 March. [Google Scholar]
- Carter, M.R., P. D. Little, T. Mogues, and W. Negatu. 2007. Poverty Traps and Natural Disasters in Ethiopia and Honduras. World Development 35, 5: 835–856. [Google Scholar] [CrossRef]
- Carter, M.R., L. Cheng, and A. Sarris. 2016. Where and how index insurance can boost the adoption of improved agricultural technologies. J. Dev. Econ. 118: 59–71. [Google Scholar] [CrossRef]
- Review of willingness-to-pay methodologies;Centre for International Economics, 2001.
- Chambers, R. G. 1989. Insurability and Moral Hazard in Agricultural Insurance Markets. Amer. J. Agr. Econ. 71: 604S16. [Google Scholar] [CrossRef]
- Chantarat, S., C. B. Barett, A. G. Mude, and C. G. Turvey. 2017. Using Weather Index Insurance to Improve Drought Response for Famine Prevention. American Journal of Agricultural Countries: Washington D.C. [Google Scholar]
- Chantarat, S., A. G. Mude, C. B. Barrett, and M. R. Carter. 2018. Designing index-based livestock insurance for managing asset risk in northern Kenya. Journal of Risk and Insurance 85, 2: 399–420. [Google Scholar] [CrossRef]
- Choice Metrics Ngene Features www.choice-metrics.com, Retrieved 2015-11-04.
- Clarke, D., R. Fu, and Y. Shi. 2020. Agricultural insurance for sustainable agricultural development and poverty alleviation: A case study in China. Land Use Policy 91: 104374. [Google Scholar]
- Clarke, D.J., and D. Grenham. 2013. Microinsurance and natural disasters: Challenges and options. Environ. Sci. Policy 27: S89–S98. [Google Scholar] [CrossRef]
- Clement, F., J. K. Kanyanga, and S. Jambwa. 2018. Weather index insurance and shock coping: Evidence from Kenya's smallholders. World Development 104: 88–103. [Google Scholar]
- Clement, K.Y., W.W. Botzen, R. Brouwer, and J.C. Aerts. 2018. A global review of the impact of basis risk on the functioning of and demandfor index insurance. Int. J. Disaster Risk Reduct. 28: 845–853. [Google Scholar] [CrossRef]
- Cole, S., X. Giné, J. Tobacman, P. Topalova, R. Townsend, and J. Vickery. 2013. Barriers to household risk management: Evidence fromIndia. Am. Econ. J. Appl. Econ. 5: 104–135. [Google Scholar] [CrossRef] [PubMed]
- Cole, S.A., and W. Xiong. 2017. Agricultural insurance and economic development. Annu. Rev. Econom 9: 235–262. [Google Scholar] [CrossRef]
- Collier, B., S. Dercon, M. Fafchamps, J. W. Gunning, A. Oduro, and M. Wenner. 2009. Impact Evaluation of the Productive Social Safety Net in North East Ethiopia. CSAE Working Paper WPS/2009-03. Centre for the Study of African Economies, University of Oxford.
- Cooper, P. J., J. Dimes, K. P. Rao, B. Shapiro, and B. Shiferaw. 2008. Coping better with current climatic variability in the rain-fed farming systems of sub-Saharan Africa: An essential first step in adapting to future climate change? Agriculture, Ecosystems & Environment 126, 1-2: 24–35. [Google Scholar]
- Corringham, T. W., J. McCarthy, T. Shulgina, A. Gershunov, D. R. Cayan, and F. M. Ralph. 2022. Climate change contributions to future atmospheric river flood damages in the western United States. Scientific Reports 12, 1: 1–9. [Google Scholar] [CrossRef]
- Dischel, B. Seeding a Rain Market. Journal of Environmental Finance, September 2000. Economist Intelligence Unit Country profiles web siteEconomics 89 (Number 5, 2007: 1262–1268.
- Doss, C. 2001. Designing Agricultural Technology for African Women Farmers: Lessons from 25 Years of Experience. World Development 29, 12: 2075–2092. [Google Scholar] [CrossRef]
- Dougherty, J.P., J.E. Flatnes, R.A. Gallenstein, M.J. Miranda, and A.G. Sam. 2020. Climate change and index insurance demand: Evidencefrom a framed field experiment in Tanzania. J. Econ. Behav. Organ. 175: 155–184. [Google Scholar] [CrossRef]
- Dragos, S. D., and C. Mare. 2014. Impact of weather index insurance on development of agricultural land in Romania. Procedia Economics and Finance 8: 246–252. [Google Scholar]
- Enjolras, G., and P. Sentis. 2011. Crop insurance policies and purchases in France. Agr. Econ. 42: 475–486. [Google Scholar] [CrossRef]
- Eriksen, S. E., K. Brown, and P. M. Kelly. 2015. The dynamics of vulnerability: Locating coping strategies in Kenya and Tanzania. The Geographical Journal 181, 4: 348–359. [Google Scholar] [CrossRef]
- Falco, C., V. Rotondi, D. Kong, and V. Spelta. 2021. Investment, insurance and weather shocks: Evidence from Cambodia. Ecol. Econ. 188: 107115. [Google Scholar] [CrossRef]
- FAO. 2011. The State of Food and Agriculture 2010-2011. Food and Agriculture Organization of the United Nations. [Google Scholar]
- Fisher, M., and E.R. Carr. 2015. The influence of gendered roles and responsibilities on the adoption of technologies that mitigate droughtrisk: The case of drought-tolerant maize seed in eastern Uganda. Glob. Environ. Chang. 35: 82–92. [Google Scholar] [CrossRef]
- Fonta, W.M., S. Sanfo, A.M. Kedir, and D.R. Thiam. 2018. Estimating farmers’ willingness to pay for weather index-based crop insuranceuptakeinWest Africa: Insight from a pilot initiative in Southwestern Burkina Faso. Agric. Food Econ. 6: 11. [Google Scholar] [CrossRef]
- Fox, K.M., S. Nelson, T.R. Frankenberger, and M. Langworthy. 2018. Climate change adaptation in Ethiopia. In Resilience: The Science ofAdaptation to Climate Change. Elsevier: Amsterdam, The Netherlands: pp. 253–265. [Google Scholar]
- Furuya, J., S.S. Mar, A. Hirano, and T. Sakurai. 2021. Optimum insurance contract of flood damage index insurance for rice farmers inMyanmar. Paddy Water Environ. 19: 319–330. [Google Scholar] [CrossRef]
- Giné, X., R. Townsend, and J. Vickery. 2008. Patterns of rainfall insurance participation in rural India. World Bank Econ. Rev. 22: 539–566. [Google Scholar] [CrossRef]
- Haile, K.K., E. Nillesen, and N. Tirivayi. 2020. Impact of formal climate risk transfer mechanisms on risk-aversion: Empirical evidencefrom rural Ethiopia. World Devel 130: 104930. [Google Scholar] [CrossRef]
- Hansen, J. W., W. Baethgen, D. Osgood, P. Ceccato, and R. Kinuthia Ngugi. 2007. Innovations in Climate Risk Management: Protecting and Building Rural Livelihoods in a Variable and Changing Climate. Submitted to <i>Journal of Semi-Arid Tropical Agricultural Research</i>. Invited paper for the ICRISAT 35th Anniversary symposium, "Climate-Proofing Innovation for Poverty Reduction and Food Security, November 22-24. [Google Scholar]
- Harwood, J., R. Heifner, K. Coble, J. Perry, and A. Somwaru. 1999. Managing Risk in Farming: Concepts, Research, and Analysis. In Agr. Econ. Rep. No. 774. USDA/Economic Research Service: Washington, DC, March. [Google Scholar]
- Hazell, P., and J. Skees. 2005. Insuring against Bad Weather recent Thinking. Published by: Kentucky, US: GlobalAgRisk, Inc, January. [Google Scholar]
- Hess, U., and J. Syroka. 2005. Weather-based Insurance in Southern Africa The Case of Malawi. In Agriculture and Rural Development Discussion Paper. The World Bank: vol. 13. [Google Scholar]
- Hill, R.V., J. Hoddinott, and N. Kumar. 2013. Adoption of weather-index insurance: Learning from willingness to pay among a panel ofhouseholds in rural Ethiopia. Agric. Econ. 44: 385–398. [Google Scholar] [CrossRef]
- Hoddinott, J. 2006. Shocks and Their Consequences across and within Households in Rural Zimbabwe. Journal of Development Studies 42, 2: 301–321. [Google Scholar]
- Hossain, M.S., G.M. Alam, S. Fahad, T. Sarker, M. Moniruzzaman, and M.G. Rabbany. 2022. Farmers’ willingness to pay for flood insurance as climate change adaptation strategy in northern Bangladesh. J. Clean. Prod., 130584. [Google Scholar] [CrossRef]
- Jewson, S., A. Brix, and C. Ziehmann. 2005. Weather Derivative Valuation. The Meteorological, Statistical and Mathematical Foundations. Cambridge University Press. [Google Scholar]
- Jha, A., and A. Gupta. 2021. Weather index-based crop insurance in India: Perceptions and problems. International Journal of Disaster Risk Reduction 56: 102094. [Google Scholar]
- Jha, S., and A. Gupta. 2021. Weather Index Insurance: An Alternative to Traditional Crop Insurance. International Journal of Management, Technology, and Social Sciences (IJMTS) 6, 1: 1–9. [Google Scholar]
- Jin, J., W. Wang, and X. Wang. 2016. Farmers’ risk preferences and agricultural weather index insurance uptake in rural China. Int. J.Disaster Risk Sci. 7: 366–373. [Google Scholar] [CrossRef]
- Johnson, L. 2013. Building Resilient Agricultural Systems: Risk Management and Risk Mitigation in the Agricultural Sector. In Rural Business-Cooperative Service. USDA. [Google Scholar]
- Jolliffe, I. T., Principal Component Analysis Second Edition Springer Statistics, 2002, R. E. Just, L. Calvin, and J. Quiggin. 1999. Adverse Selection in Crop Insurance. Amer. J. Agr.Econ 81: 834S49. [Google Scholar]
- Jongman, B. 2018. Recent developments in flood risk assessment. Current Opinion in Environmental Sustainability 35: 26–33. [Google Scholar]
- Kleinbaum, D. G., K. Dietz, M. Gail, M. Klein, and M. Klein. 2002. Logistic regression. Springer: Berlin, Germany. [Google Scholar]
- Kling, A., F. Ruez, and J. Russ. 2011. The impact of stochastic volatility on pricing, hedgingand hedge efficiency of variable annuity guarantees. Astin Bulletin 41. [Google Scholar]
- Liu, X., Y. Tang, J. Ge, and M.J. Miranda. 2019. Does experience with natural disasters affect willingness-to-pay for weather index insurance?Evidence from China. Int. J. Disaster Risk Reduct. 33: 33–43. [Google Scholar] [CrossRef]
- Luce, R. Duncan. 1959. Conditional logit analysis of qualitative choice behavior. New York: John Wiley & Sons. [Google Scholar]
- Maganga, A.M., L.S. Chiwaula, and P. Kambewa. 2021. Parametric and non-parametric estimates of willingness to pay for weather indexinsurance in Malawi. Int. J. Disaster Risk Reduct. 62: 102406. [Google Scholar] [CrossRef]
- Mahul, O., and C. Stutley. 2010. Government support to agricultural insurance: Challenges and options for developing countries. The World Bank Research Observer 25, 2: 157–184. [Google Scholar]
- Mahul, O., and J. Skees. 2007. The World Bank Group’s support for weather index insurance. Agricultural Finance Review 67, 2: 235–250. [Google Scholar]
- Menard, S. 2002. Applied Logistic Regression Analysis, 2nd ed. Sage Publications, Inc.: Thousand Oaks, CA, USA. [Google Scholar]
- Moges, S.A., G.S. Gebrie, G. Habtamu, and L. Raschid-Sally. 2019. Built Environment, flooding regime change, and its effect on adaptationto climate change in the cities of developing countries: Learning a lesson from Addis Ababa City, Ethiopia. In Extreme Hydrologyand Climate Variability. Elsevier: Amsterdam, The Netherlands: pp. 445–456. [Google Scholar]
- Mondal, M. S., and T. Das. 2020. Factors influencing the adoption of crop insurance in India: A review. International Journal of Management Studies 7, 1: 36–41. [Google Scholar]
- Musonda, F. 2012. The adoption and impact of weather-index insurance: Evidence from small-scale farmers in Ethiopia. Agricultural Economics 43, 2: 201–210. [Google Scholar]
- NEMA. 2023. NEMA south east zone latest press release on flood incidents. Available online: https//reliefweb.int/report/nigeria/2023-flood-nema-south-east-zonal-office-takes-flood-sensitization-programme-awgu-lga-enugu-state.
- Nhemachena, C., R. Mano, S. Mudombi, and P. Munguambe. 2014. Climate variability and change or multiple stressors? Farmer perceptions regarding threats to livelihoods in Zimbabwe and Zambia. Environment, Development and Sustainability 16, 1: 123–138. [Google Scholar]
- Nwosu, U. S., G. A. Archibong, and A. S. Nwangene. 2023. Geospatial data analysis for flood and erosion characterisation: a case study of southern Anambra Nigeria. International Journal of Advanced Academic Research 8, 8: 13–32. [Google Scholar]
- Olayemi, A. O., A. A. Adepoju, and K. K. Bolarinwa. 2018. Analysis of Income Inequality and Rural Poverty of Farming Households in Kwara State, Nigeria. Journal of Agricultural Economics, Extension and Rural Development 5, 2: 160–169. [Google Scholar]
- Oxford English Dictionary, 3rd ed. s.v. probit (article dated June 2007): Bliss, C. I. (1934). "The Method of ProbitsScience.79 (2037): 38–39. Bibcode:1934Sci....79...38B. doi:10.1126/science.79.2037.38. PMID 17813446. These arbitrary probability units have been called 'probits'. Orthogonal Arrays. support.sas.com. Retrieved 2015-11-04.
- Patnaik, U., and S. Narayanan. 2015. A review on index-based crop insurance: The case of India. Journal of Agribusiness in Developing and Emerging Economies 5, 1: 40–58. [Google Scholar]
- Platteau, J.-P., O. De Bock, and W. Gelade. 2017. The demand for microinsurance: A literature review. World Devel 94: 139–156. [Google Scholar] [CrossRef]
- Poulton, C., J. Macartney, and D. Mukuka. 2018. Can Smallholder Fruit and Vegetable Production Improve Household Food Security? Evidence from Zambia. Food Security 10, 4: 1031–1052. [Google Scholar]
- Rao, S., and J. Richard. 2006. Introduction to biostatistics and research methods, 4th ed. New Delhi: Prentice-Hall of India Private limited. [Google Scholar]
- Shynkarenko, R. 2007. Introduction of Weather Index Insurance in Ukraine – Obstacles and Opportunities. Paper prepared for presentation at the 101st EAAE Seminar “Management of Climate risks in Agriculture” Berlin, Germany, July 5-6. [Google Scholar]
- Skees Jerry, R., and J. Barnett Barry. 2006. Enhancing Micro Finance Using Index-Based Risk Transfer Products. Agricultural Finance Review 66: 235–50. [Google Scholar] [CrossRef]
- Skees Jerry, R., J. Hartell, and A. J. Murphy. Using Index-Based Risk Transfer Products to Facilitate Micro Lending in Peru and Vietnam. American Journal of Agricultural Economics 89: Number 5–2007. [CrossRef]
- Stein, D. 2018. Dynamics of demand for rainfall index insurance: Evidence from a commercial product in India. World Bank Econ. Rev. 32: 692–708. [Google Scholar]
- Stoppa, A., and U. Hess. 2003. Design and Use of Weather Derivatives in Agricultural Policies: The Case of Rainfall Index Insurance in Morocco. Contributed paper presented at the International Conference Agricultural policy reform and the WTO: where are we heading? Capri (Italy), June 23-26. [Google Scholar]
- Tabachnick, B. G., and L. S. Fidell. 2007. Using multivariate statistics, 5th ed. [Google Scholar]
- Turvey, C. G. 2001a. Weather Derivatives for Specific Event Risks in Agriculture. In Rev.Agr. Econ. Ukraine: World Bank Working Paper: vol. 23, pp. 333–351. [Google Scholar]
- Turvey, C. G., J. Yu, and M. P. Meuwissen. 2015. Crop insurance in China: The role of economics, policies and technology in re-designing an old risk mitigation scheme. China Agricultural Economic Review 7, 2: 167–183. [Google Scholar]
- Ward, P., D.J. Spielman, D. Ortega, N. Kumar, and S. Minocha. 2020. Demand for complementary financial and technological tools formanaging drought risk. Econ. Devel. Cult. Chang. 68: 607–653. [Google Scholar] [CrossRef]
- Wasson, R. J., J. D. Olden, and N. L. Poff. 2020. Dynamic conservation for floodplain river ecosystems. Frontiers in Ecology andthe Environment 18, 7: 394–402. [Google Scholar]
- World Bank. 2005. Managing Agricultural Production Risk. Innovations in Developing.
- World Bank. 2019. Agricultural Cooperatives. Available online: https://www.worldbank.org.
- World Metrological Organization. 2023. Economic costs of weather-related disasters soars but early warnings save lives. Available online: https://wmo.int/media/news/economic-costs-of-weather-related-disasters-soars-early-warnings-save-lives.
Figure 2.
Map of Anambra State Nigeria; Source: Authours.
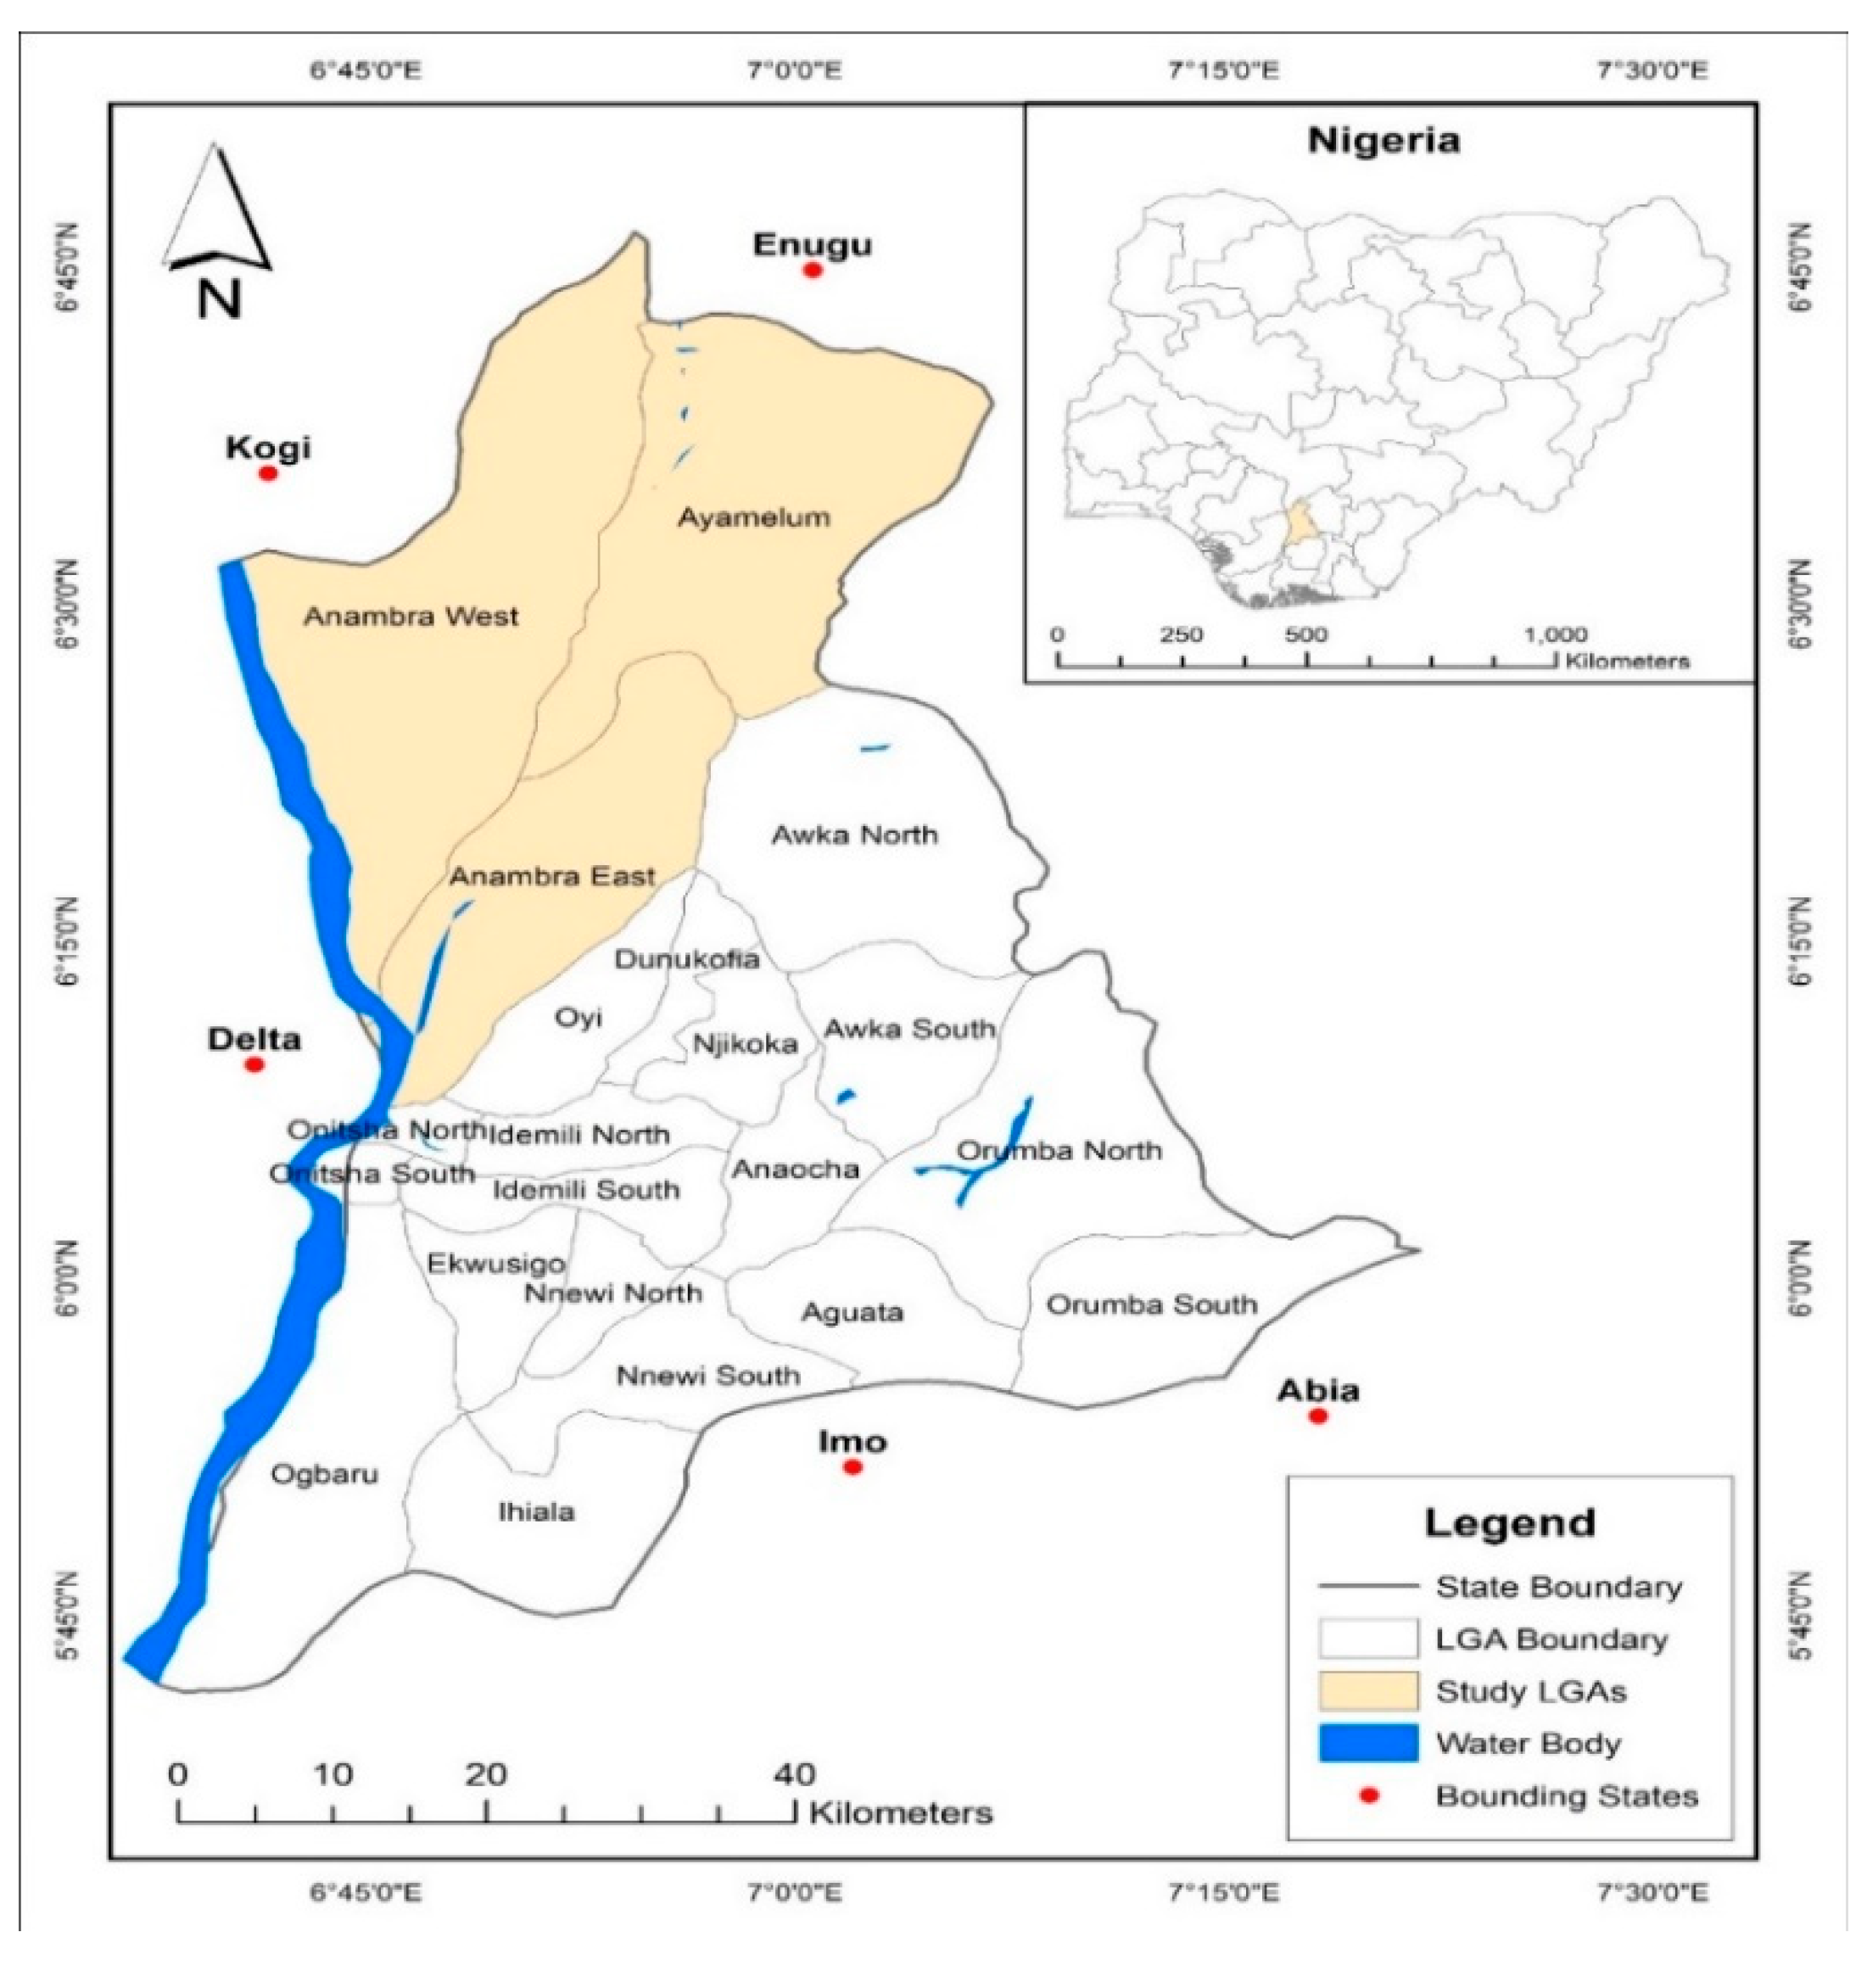
Figure 3.
Map of Anambra State showing drainage and elevation; Source: authour’s.
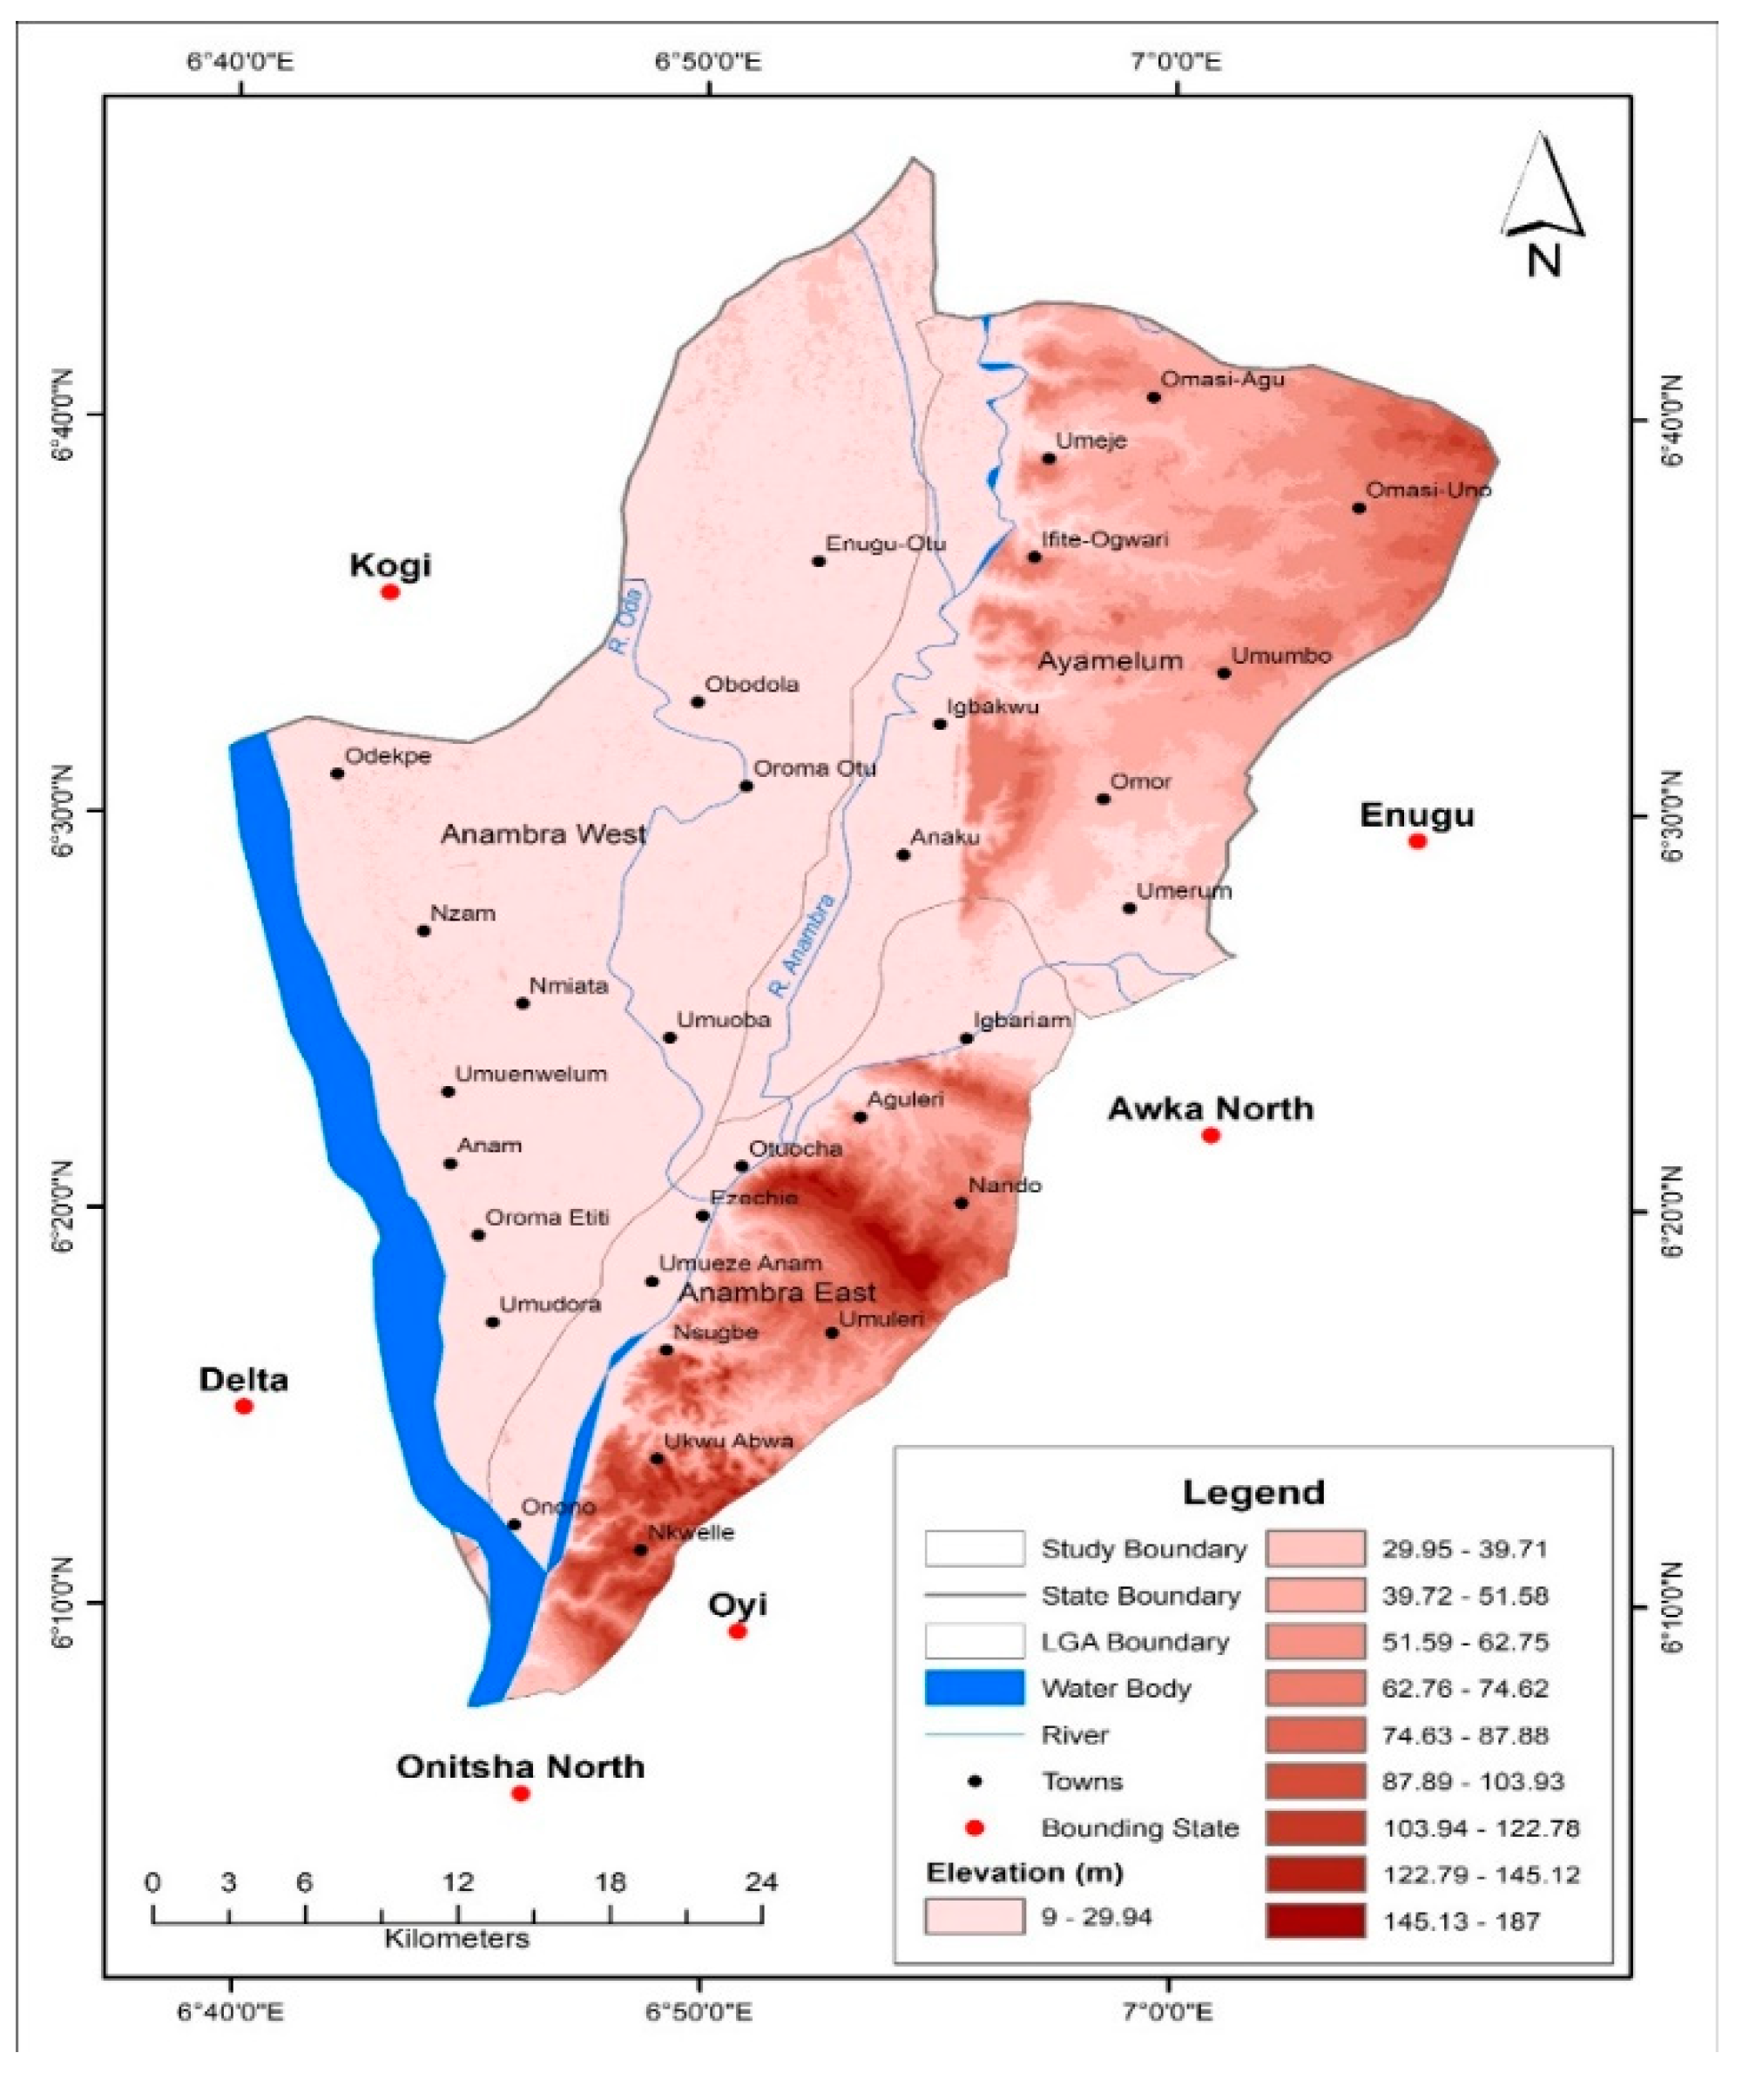

Table 1.
Variables and Definitions used in the Probit Regression Model of Factors influencing crop farmer’s willingness to participate in a flood insurance program.
Table 1.
Variables and Definitions used in the Probit Regression Model of Factors influencing crop farmer’s willingness to participate in a flood insurance program.
| Variables | Definition | Nature |
|---|---|---|
| Gender (Gander) | Gender of the respondent | Dummy variable (Male = 1, 0 otherwise) |
| Monthly income | Amount of money earned by the respondents monthly | Continuous |
| Cooperative membership | Membership in a cooperative | Dummy variable (Yes = 1, No = 0) |
| Belong to a group besides a cooperative | Membership in other groups besides cooperatives | Dummy variable (Yes = 1, No = 0) |
| Years of farming experience | Number of years the respondent has been farming | Continuous |
| Distance from farm to market | Distance in kilometres from the farm to the nearest market | Continuous |
| Access to credit facility | Access to credit for agricultural purposes | Dummy variable (Yes = 1, No = 0) |
| Household size | Number of people in the respondent's household | Continuous |
| Receive climate change information | Receipt of information regarding climate change | Dummy variable (Yes = 1, No = 0) |
| Reception of flood early warning information | Receipt of early warning information about floods | Dummy variable (Yes = 1, No = 0) |
| Participated in training or workshop on climate change | Participation in training or workshops related to climate change | Dummy variable (Yes = 1, No = 0) |
Table 2.
Willingness of crop farmers to participate in a flood insurance program.
| Parameters | Frequency | Percentage |
|---|---|---|
| Willingness of crop farmers to participate in a flood insurance program | ||
| Yes | 598 | 100.00 |
| No | Nil | Nil |
| Types of insurance program willing to be participated | ||
| Traditional inspection | 285 | 47.66 |
| Weather-based index inspection | 313 | 52.34 |
Source: Field Survey (2023).
Table 3.
Probit Regression Model of Factors influencing crop farmer’s choice of insurance type.
| Variables | Coefficient | Standard Error |
Z score | ρ> /z/ |
|---|---|---|---|---|
| Gander | -0.1180577 | 0.1297467 | -0.91 | 0.363 |
| Monthly income | 8.01e-07 | 4.04e-07 | 1.98 | 0.048 |
| Cooperative membership | 0.5767461 | 0.1682309 | 3.43 | 0.001 |
| Belong to a group besides a cooperative | -0.2859153 | 0.1311982 | -2.18 | 0.029 |
| Years of farming experience | 0.0068967 | 0.0125832 | 0.55 | 0.584 |
| Distance from farm to market | 0.0212855 | 0.0061533 | 3.46 | 0.001 |
| Number of years of farming experience | -0.006646 | 0.00433805 | -1.52 | 0.129 |
| access to credit facility | 0.3776326 | 0.1699015 | 2.22 | 0.026 |
| Household size | -0.0041446 | 0.0219112 | -0.19 | 0.850 |
| Receive climate change information | 0.4245831 | 0.1461698 | 2.90 | 0.004 |
| Reception of flood early warning information | 0.1758326 | 0.1660635 | 1.06 | 0.290 |
| Participated in training or workshop on climate change | 0.4398808 | 0.1329045 | 3.31 | 0.001 |
| Constant | -1.293469 | 0.3412534 | -3.79 | 0.000 |
| Number of Observations | 580 | |||
| LR Chi 2 (12) | 86.61 | |||
| Prob> Chi2 | 0.0000 | |||
| Pseudo R2 | 0.1079 | |||
| Log Likelihood | -358.22207 |
Source: Field Survey (2023).
Table 4.
shows the willingness of crop farmers to pay for crop insurance.
| Variables | Duration 10years | Duration 5years | Duration 2years | Coverage 100% | Coverage 50%-100% | Group | Weather Identification No |
|---|---|---|---|---|---|---|---|
| Willingness to pay | -46220.961 | -22617.236 | -29662.378 | 19957.927 | 15501.114 | -6043.3518 | -14406.942 |
| Lower level | -68662.992 | -40064.009 | -46373.891 | -3252.4542 | -6802.7006 | -18058.843 | -27239.277 |
| Upper level | -23778.93 | -5170.4633 | -12950.865 | 43168.308 | 37804.93 | 5972.1392 | -1574.607 |
Source: Field Survey (2023).
Table 5.
Factors influencing crop farmers’ preferences regarding policy options.
| Choice | Coefficient | Standard Error |
Z score | ρ> /z/ |
|---|---|---|---|---|
| Premium | -6.54 | 1.57 | -4.16 | 0.000 |
| Insurance duration (10years) | -.3022 | 0.0573 | -5.27 | 0.000 |
| Insurance duration (5years) | -.1478 | 0.0701 | -2.11 | 0.035 |
| Insurance duration (2years) | -.1939 | 0.0591 | -3.28 | 0.001 |
| Insurance coverage (100%) | 0.1305 | 0.0559 | 2.33 | 0.020 |
| Insurance coverage (50%-100%) | 0.1013 | 0.0604 | 1.63 | 0.093 |
| Group | -.0358 | 0.0431 | -0.92 | 0.360 |
| Weather identification No | -.09420 | 0.0415 | -2.26 | 0.024 |
| Constant | 0.075 | 0.0401 | 1.88 | 0.060 |
| Number of observations | 13,920 | |||
| LR chi2(9) | 91.10 | |||
| Prob> Chi2 | 0.0000 | |||
| Pseudo R2 | 0.0094 | |||
| Log Likelihood | -4778.7554 |
Source: Field Survey (2023).
Disclaimer/Publisher’s Note: The statements, opinions and data contained in all publications are solely those of the individual author(s) and contributor(s) and not of MDPI and/or the editor(s). MDPI and/or the editor(s) disclaim responsibility for any injury to people or property resulting from any ideas, methods, instructions or products referred to in the content. |
© 2025 by the author. Licensee MDPI, Basel, Switzerland. This article is an open access article distributed under the terms and conditions of the Creative Commons Attribution (CC BY) license (https://creativecommons.org/licenses/by/4.0/).
Copyright: This open access article is published under a Creative Commons CC BY 4.0 license, which permit the free download, distribution, and reuse, provided that the author and preprint are cited in any reuse.


