Submitted:
19 September 2025
Posted:
22 September 2025
You are already at the latest version
Abstract
Consumer preferences for beef are increasingly driven by a desire for hygienic and nutritious meat with excellent organoleptic qualities. This paper investigates the impact of cattle breed on key quality attributes—colour, marbling, and tenderness—central to consumer choice. Six different bovine breeds were taken into consideration: German Red Pied, Piemontese, Chianina, Angus, Holstein and a Polish crossbreed. The muscle taken into consideration was the Longissimus thoracis et lumborum. Colorimetric assessments, marbling evaluations, fatty acid profiling, and tenderness measurements, were conducted on meat cuts from each breed. Results revealed that Chianina, Holstein, and the Polish crossbreed exhibited distinct colour characteristics, with Chianina displaying notably brighter meat. Angus emerged as the most marbled breed, while Chianina and Piemontese showed lower marbling. Total lipids content was correlated with visible marbling. Tenderness assessments identified Angus and Holstein as the most tender breeds. The study's findings contribute to a proposed grading scale for colour, marbling, and tenderness, offering potential labelling infographics to assist consumers in making informed choices based on individual preferences and needs. These insights underscore the importance of breed-specific information on labels to enhance consumer understanding and facilitate more informed purchasing decisions.
Keywords:
cattle breeds
; consumer choice
; labelling infographics
; meat quality
1. Introduction
Consumers show an ever-increasing sensitivity to the quality of beef they purchase, preferring hygienic and nutritious meat of excellent organoleptic qualities (tenderness, juiciness, flavour). Beef with good sensory properties is what consumers desire, so beef industry must supply meat with these attributes on a consistent and uniform basis [1]. Consumer choice is strongly influenced by the appearance of the meat at the point of sale as well as by the information on the label. The provision of food information in Europe is regulated by Reg. 1169/2011. It indicates that to achieve a high level of consumer health protection and ensure their right to information, it is appropriate to ensure that consumers are adequately informed about the foods they consume, bearing in mind that consumer choices can be influenced, among other things, by health, economic, environmental, social and ethical considerations. Food law aims, as a general principle, to provide a basis for allowing consumers to make informed choices in relation to the foods they consume and to prevent any practice capable of misleading the consumer [2]. For the optional labelling of meat, there are regulatory provisions that must be controlled by recognized third-party bodies and having scientifically validated values regarding tenderness, marbling and colour to be included on the label is certainly an added value for beef producers and sellers.
Current labelling systems for beef primarily communicate origin or production practices, but rarely provide consumers with objective, scientifically validated information about key eating quality traits such as tenderness, marbling, or colour. This lack of standardization and reliance on subjective or unverified claims limits the ability of consumers to make fully informed choices and may result in unmet expectations regarding eating quality at the point of consumption. Furthermore, the absence of harmonized scientific metrics in labelling makes it difficult for producers to differentiate high-quality products and for consumers to compare options meaningfully, potentially undermining trust in the labelling system. Incorporating scientifically measured, instrumentally validated metrics into labelling would address these gaps by offering transparent, reliable, and comparable information that directly reflects the sensory quality of beef. Such a scientifically grounded labelling system would empower consumers to select products that meet their preferences, support fair competition among producers, and align with regulatory goals of accuracy and transparency in food information. Therefore, there is a clear need to develop and evaluate labelling systems based on robust scientific standards for meat quality, as addressed in the present study. In fact, many labelling systems focus on origin or production practices and do not provide standardized, scientifically validated information about eating quality traits such as tenderness, marbling, or colour [3,4]. Moreover subjective or unverified claims can mislead consumers and undermine trust in labelling [5]. The absence of harmonized scientific metrics makes it difficult for consumers to make informed choices and for producers to differentiate high-quality products and subjective or unverified claims can mislead consumers and undermine trust in labelling [5-7]. The absence of harmonized scientific metrics makes it difficult for consumers to make informed choices and for producers to differentiate high-quality product and overly complex or inconsistent information on labels can result in confusion and unmet consumer expectations [8]. Instead, objective methods, such as instrumental measurement of tenderness and marbling, improve accuracy and consistency, supporting better consumer guidance and market transparency [3,9,10]. The use of scientifically measured metrics can provide reliable, comparable information that directly reflects the sensory quality of beef [4,9,10] and incorporating scientific standards into labelling aligns with regulatory goals of accuracy, transparency, and consumer protection [4,5,11]. In fact, studies highlight that consumers value transparent and trustworthy information, and that objective labelling can enhance confidence and satisfaction [6,8].
Characteristics such as colour, marbling and tenderness of the meat significantly influence the consumer's choices, its overall eating satisfaction and therefore its attitude to buy the same product again [12,13]. Breed is an important factor that can influence beef quality because it has an impact on the main muscle and fat components, as well as on muscle structure and meat physiology [14,15].
Many aspects of meat quality and meat appearance can be measured instrumentally. However, reliable and standardized methodology are not available at the moment and often more subjective approach are used, such as scores of trained taste panellists. The morphological property of beef such as general appearance, meat colour and visible fat, contribute to the visual appeal of the product and strongly influence consumer’s choices [12]. At the time of purchase, meat and fat colour are critical indicators of freshness and quality for consumers [16]. In general, consumers tend to prefer bright red meat colour and white fat colour, which are more desirable than dark meat and yellow fat [17].
The term marbling refers to the visible fat found between muscle fibre bundles within the meat cut. Marbling is usually assessed in meat cuts obtained from the 5th to the 13th rib on the carcass. Intramuscular fat deposits unevenly throughout the body, increasing towards the neck and decreasing toward the tail. High marbling level is generally associated with better beef tenderness, juiciness, flavour, and overall palatability [18,19]. However, in many studies evaluating marbling and palatability, tenderness level varied among samples [20]. The marbling score, which is the amount and distribution of intramuscular fat, is one of the most dominating determinants in Korean, Japan, and United States Department of Agriculture (USDA) quality grading for beef [21].
Tenderness is a very important quality trait for beef which determines consumer’s satisfaction, repeat purchase and willingness-to-pay high prices [22]. Tenderness of meat is influenced by various factors (aging time, type of cut, presence of connective tissue and fat). The most commonly used method to scientifically quantify the degree of tenderness of meat is to measure the force required to cut a standard-sized piece of meat with special tools. It is a method that evaluates the mechanical resistance of meat and is widely recognized on a scientific level. The most popular among these methodologies are the Warner-Bratzler method and its variations [23].
Meat labelling plays a crucial role in informing consumers about the origin, quality, and safety of meat products. Voluntary labelling allows producers to provide additional information beyond the mandatory requirements, such as details about animal welfare, production methods, or environmental impact. While mandatory labelling requirements are outlined in Regulation (EU) No 1169/2011 on the provision of food information to consumers, which ensures transparency regarding origin and nutritional content, voluntary labels often include claims like "grass-fed" or "antibiotic-free." These claims are regulated by national laws, such as the EU Regulation (EC) No 834/2007 for organic labelling, which ensures that voluntary claims meet specific criteria for accuracy and reliability. Additionally, quality claims, such as "certified tender" or "premium grade," are subject to specific standards and certifications, ensuring that these labels reflect the true quality of the product. This regulatory framework ensures that consumers can make informed choices while protecting producers from misleading claims.
There are examples of infographics to help the consumer make the correct choice, for instance infographics are widely used on food packaging and in stores to help consumers understand the spiciness of chili peppers and related products. Among the most effective and studied methods are the combination of Scoville Heat Units (SHU) and visual symbols - typically, images of chili peppers - to communicate heat levels at a glance. Not everyone is familiar with the Scoville scale, so visual cues make it easier for all consumers to gauge spiciness. Symbols and numbers allow shoppers to compare products easily without reading detailed descriptions. Clear labelling helps people select products that match their taste preferences and tolerance for heat. Infographics combining Scoville Heat Units and chili pepper symbols are a proven, consumer-friendly way to communicate the spiciness of chili products, helping people make quick and informed choices. [24-26]. A similar approach has been proposed for the bitterness of chocolate [27].
The objective of this study was to compare meat quality characteristics of different cattle breeds and to evaluate the feasibility of identifying objective and measurable meat quality characteristics clearly referable to objective standards. This with the aim of classifying the product on sale on the basis of the characteristics most commonly evaluated by the consumer such as colour, marbling and tenderness and to hypothesize a series of infographics for the label that help the consumer in the product’s choice.
2. Materials and Methods
2.1. Experimental Design
Six different bovine breeds were taken into consideration: German Red Pied, Piemontese, Chianina, Angus, Holstein and a Polish crossbreed.
For each breed, the meat distributor selected animals from a pool of 446 farms located in Germany (85), Italy (230), Poland (34) Argentina (97) and from a pool of approximately 50.000 animals for German Red Pied (approximately 8000 animals in 85 farms), Piemontese (approx 8000 animals in 120 farms), Chianina (approx. 1300 animals in 23 farms), Angus (approx. 22000 animals in 97 farms), Holstein (approx. 11000 animals in 87 farms) and Polish crossbreed (approx. 1000 animals in 34 farms). The meat distributor selected animals based on a combination of visual assessment, carcass grading systems, and data-driven evaluations. The process typically involved the following key steps:
1) on-farm selection (live animal assessment): before slaughter, distributors or procurement specialists evaluated live cattle based on:
i) Body Condition Score (BCS) with and Ideal BCS (3–4 on a 5-point scale) to ensure proper fat cover without excess waste;
ii) conformation and muscularity with animals should with well-developed muscle mass, particularly in the loin, rump, and shoulder;
iii) mobility & health without signs of lameness, disease, or stress,
iv) weight & age with slaughter targets (500–700 kg live weight, 12–24 months old);
2) at the slaughterhouse (final selection) additional checks have been done:
i) fat cover evaluation to reject excessively lean or overly fat animals;
ii) conformation grading to assess muscle development using the SEUROP grading system (S, E, U, R only accepted);
3) traceability Tags & RFID (Radio Frequency Identification) chips to ensure that animals meet sourcing standards (organic, antibiotic-free, etc.);
4) genetic and feed data for feeding history and genetic markers for tenderness;
5) post-slaughter (meat selection), carcasses have been graded based on the parameter suggested in this work, namely colour, tenderness and marbling.
From the distributor, an Italian subsidiary of a big German Horeca (hotellerie-restaurant-café) company, we received cuts from German Red Pied (63 animals in 7 shipments), Piemontese (117 animals in 13 shipments), Chianina (63 animals in 7 shipments), Angus (63 animals in 7 shipments), Holstein (18 animals in 2 shipments) and Polish crossbreed (63 animals in 7 shipments) for a total of 387 animals. All animals involved in the study were therefore (se point 1, iv above) uncastrated male animals aged from 12 months to less than 24 months with a live weight between 500-700 kg (category A according to the European classification). From each animal ( n = 387), three meat cuts were obtained (for a total of 1152 cuts) and each cut was analysed in triplicate. The muscle taken into consideration was the Longissimus thoracis et lumborum (LTL) (recommended terminology for the muscle commonly designated as Longissimus dorsi). The commercial name of the cut of meat is entrecôte, or boneless rib, obtained from the last six ribs of the loin. Each cut was subjected to analysis to determine colour, tenderness and marbling as described below. The time elapsed between the animal’s slaughter and the cutting of meat was standardized (approximately 4 days). All samples were skin-packed after cutting and sent to the laboratory. At the arrival, they were stored at refrigeration temperature (0-4 °C) and in the dark for a standardized period of time (approximately 10 days between packaging and analysis, except for the Angus) (Table 1).
2.2. Colorimetric Analysis
The «ColourMeter RGB Colourimeter» app (White Marten GmbH, Stuttgart, Germany) was used to measure colour of the samples using an iPhone XS running iOS 13.7, as described by the authors in previously published works [28]. The conventional colorimeters (such as the one described below) are designed to determine the colour of a single point in a uniform area. In this case, we chose to measure the average colour of the sample in order to replicate the consumer’s perception. The «ColourMeter RGB Colourimeter» app was calibrated against a reference colorimeter, a Minolta CR 200 Chroma Meter (Konica Minolta Inc. Tokyo, Japan). Briefly, the Minolta CR 200 Chroma Meter was used to measure a series of red/reddish calibration plates (specifically, the CR-A47 DP, CR-A47 R, and CR-A47 B) in conjunction with a standard white plate in order to determine the CIELAB L* (lightness), a* (redness), and b* (yellowness) colour spaces, and the results were used to calibrate the readout of the «ColourMeter RGB Colourimeter» app. The Minolta CR 200 Chroma Meter was set to measure under the CIE Standard Illuminant D65. D65 is approximately equivalent to the average midday light in Western Europe/Northern Europe, which includes both direct sunlight and diffused light from a clear sky. Hence, it is also referred to as a daylight illumination and has a correlated colour temperature of approximately 6500 K. The light used to illuminate the calibration plates for the «ColourMeter RGB Colourimeter» app was, therefore, a source of 6500 K light (Godox Led 64, Godox, Shenzhen, China) under controlled conditions in a photographic light box. The CIELAB system describes colours visible to the human eye according to their hue and chroma (position on the a* and b* axes) and their lightness, L*, which corresponds to a position on a black-to-white scale.
2.3. Marbling
To determine the marbling of the samples, the cuts of meat were photographed in a professional photographic set up illuminated with 6500 K leds. The camera (Nikon D850) was mounted on a fixed stand to have a standard distance between the objective and the sample. The images thus obtained were processed using Adobe Photoshop CS 6 (version 13.0 x64) on MacBook Pro Mid 2012 (2.7 GHz Intel Core 7 with card NVIDIA GeForce GT 650M 1GB graphics). A square area of 750x750 pixels was selected in each image and the number of white pixels was calculated. The percentage of white pixels in this square area provided an indication of the quantity of visible infiltrated fat. This approach is similar to many methodologies of computerized image analysis for the marbling classification described in scientific literature [29-31].
2.4. Lipid Extraction and Fatty Acid Analysis
FAME (fatty acid methyl esters) standard mixture, the SupelcoTM 37 component FAME, was obtained from Supelco (Bellefonte, PA, USA). All solvents and reagents were of analytical grade and were purchased from Carlo Erba Reagents (Milan, Italy). The production of deionized water (>18 MW cm resistivity) was carried out by a Milli-Q SP Reagent Water System (Millipore, Bedford, MA, USA). Total lipids were extracted from meat samples with chloroform/methanol (2:1, v/v) [32] and subjected to methanolic transesterification using 2N methanolic KOH and hexane [33]. The obtained FAME were analysed by HRGC, using a DANI 1000DPC gas-chromatograph (Norwalk, CT, USA) equipped with a split-splitless injector and a flame ionization detector (FID). The separation of FAME was achieved by a fused silica WCOT capillary column CP-Select CB for FAME (50 m × 0.25 mm i.d., 0.25 μm f.t.; Varian, Superchrom, Milan, Italy) while a Clarity integration software (DataApex Ltd., Prague, Czech Republic) was used for acquiring and processing the chromatographic data. The oven temperature was held at 160 °C for 2 min, then was programmed at 4 °C/min to 225 °C and held for 5 min. The injector and the FID temperatures were set at 250 °C. Carrier gas [1] flow rate was set at 1 mL/min. Fatty acids were identified by comparing the retention times of their methyl esters with standard FAME mixture, the Supelco™ 37 component FAME. The analytical precision was verified as reported by Piccinetti et al. [34]. The fatty acid compositions have been expressed as weight percent (area normalization).
2.5. Tenderness
A Sauter FL 100 digital dynamometer was used to measure tenderness (Sauter Italia, Cinisello Balsamo, Milan, Italy) mounted on a test bench for measurements of traction and compression with digital calliper (Sauter Italia, Milan). The methodology applied is a modified version of the Warner-Bratzler method, which is the most commonly used method for instrumentally measure the tenderness of meat. Briefly, from each slice of meat six cubes measuring 1.5 cm2 were collected using a hand-hold coring device that was oriented parallel to the longitudinal orientation of muscle fibres. Three cubes were used to measure the resistance to the application of a compressive force (applied through the use of a flat head for the dynamometer) while the other three were used to measure the resistance of the sample to the application of a shear force (applied with a wedge-shaped head), both with a head speed of 250 mm/min. Forces were applied perpendicular to fibre orientation The resistance curve to the force applied was digitally recorded for each sample and the peak force was used for statistical analysis.
2.6. Statistical Analysis
The study employed a completely randomized design (CRD). Animals from each of the six cattle breeds (German Red Pied, Piemontese, Chianina, Angus, Holstein, and Polish crossbreed) were randomly selected as independent experimental units. No blocking factors or repeated measures were incorporated, ensuring all measurements (colour, marbling, tenderness) were taken under identical conditions per animal.
Statistical analysis was performed using the Kruskal-Wallis test to compare differences among cattle breeds, followed by Dunn’s multiple comparisons. Analyses were conducted in GraphPad Prism 8.4.3 (GraphPad Software, Boston, MA, USA). Dunn’s test presents adjusted P values for each pairwise comparison, indicating which breed pairs differ significantly. The graphical display of the results was obtained with Prism 8.4.3 software for Mac OS.
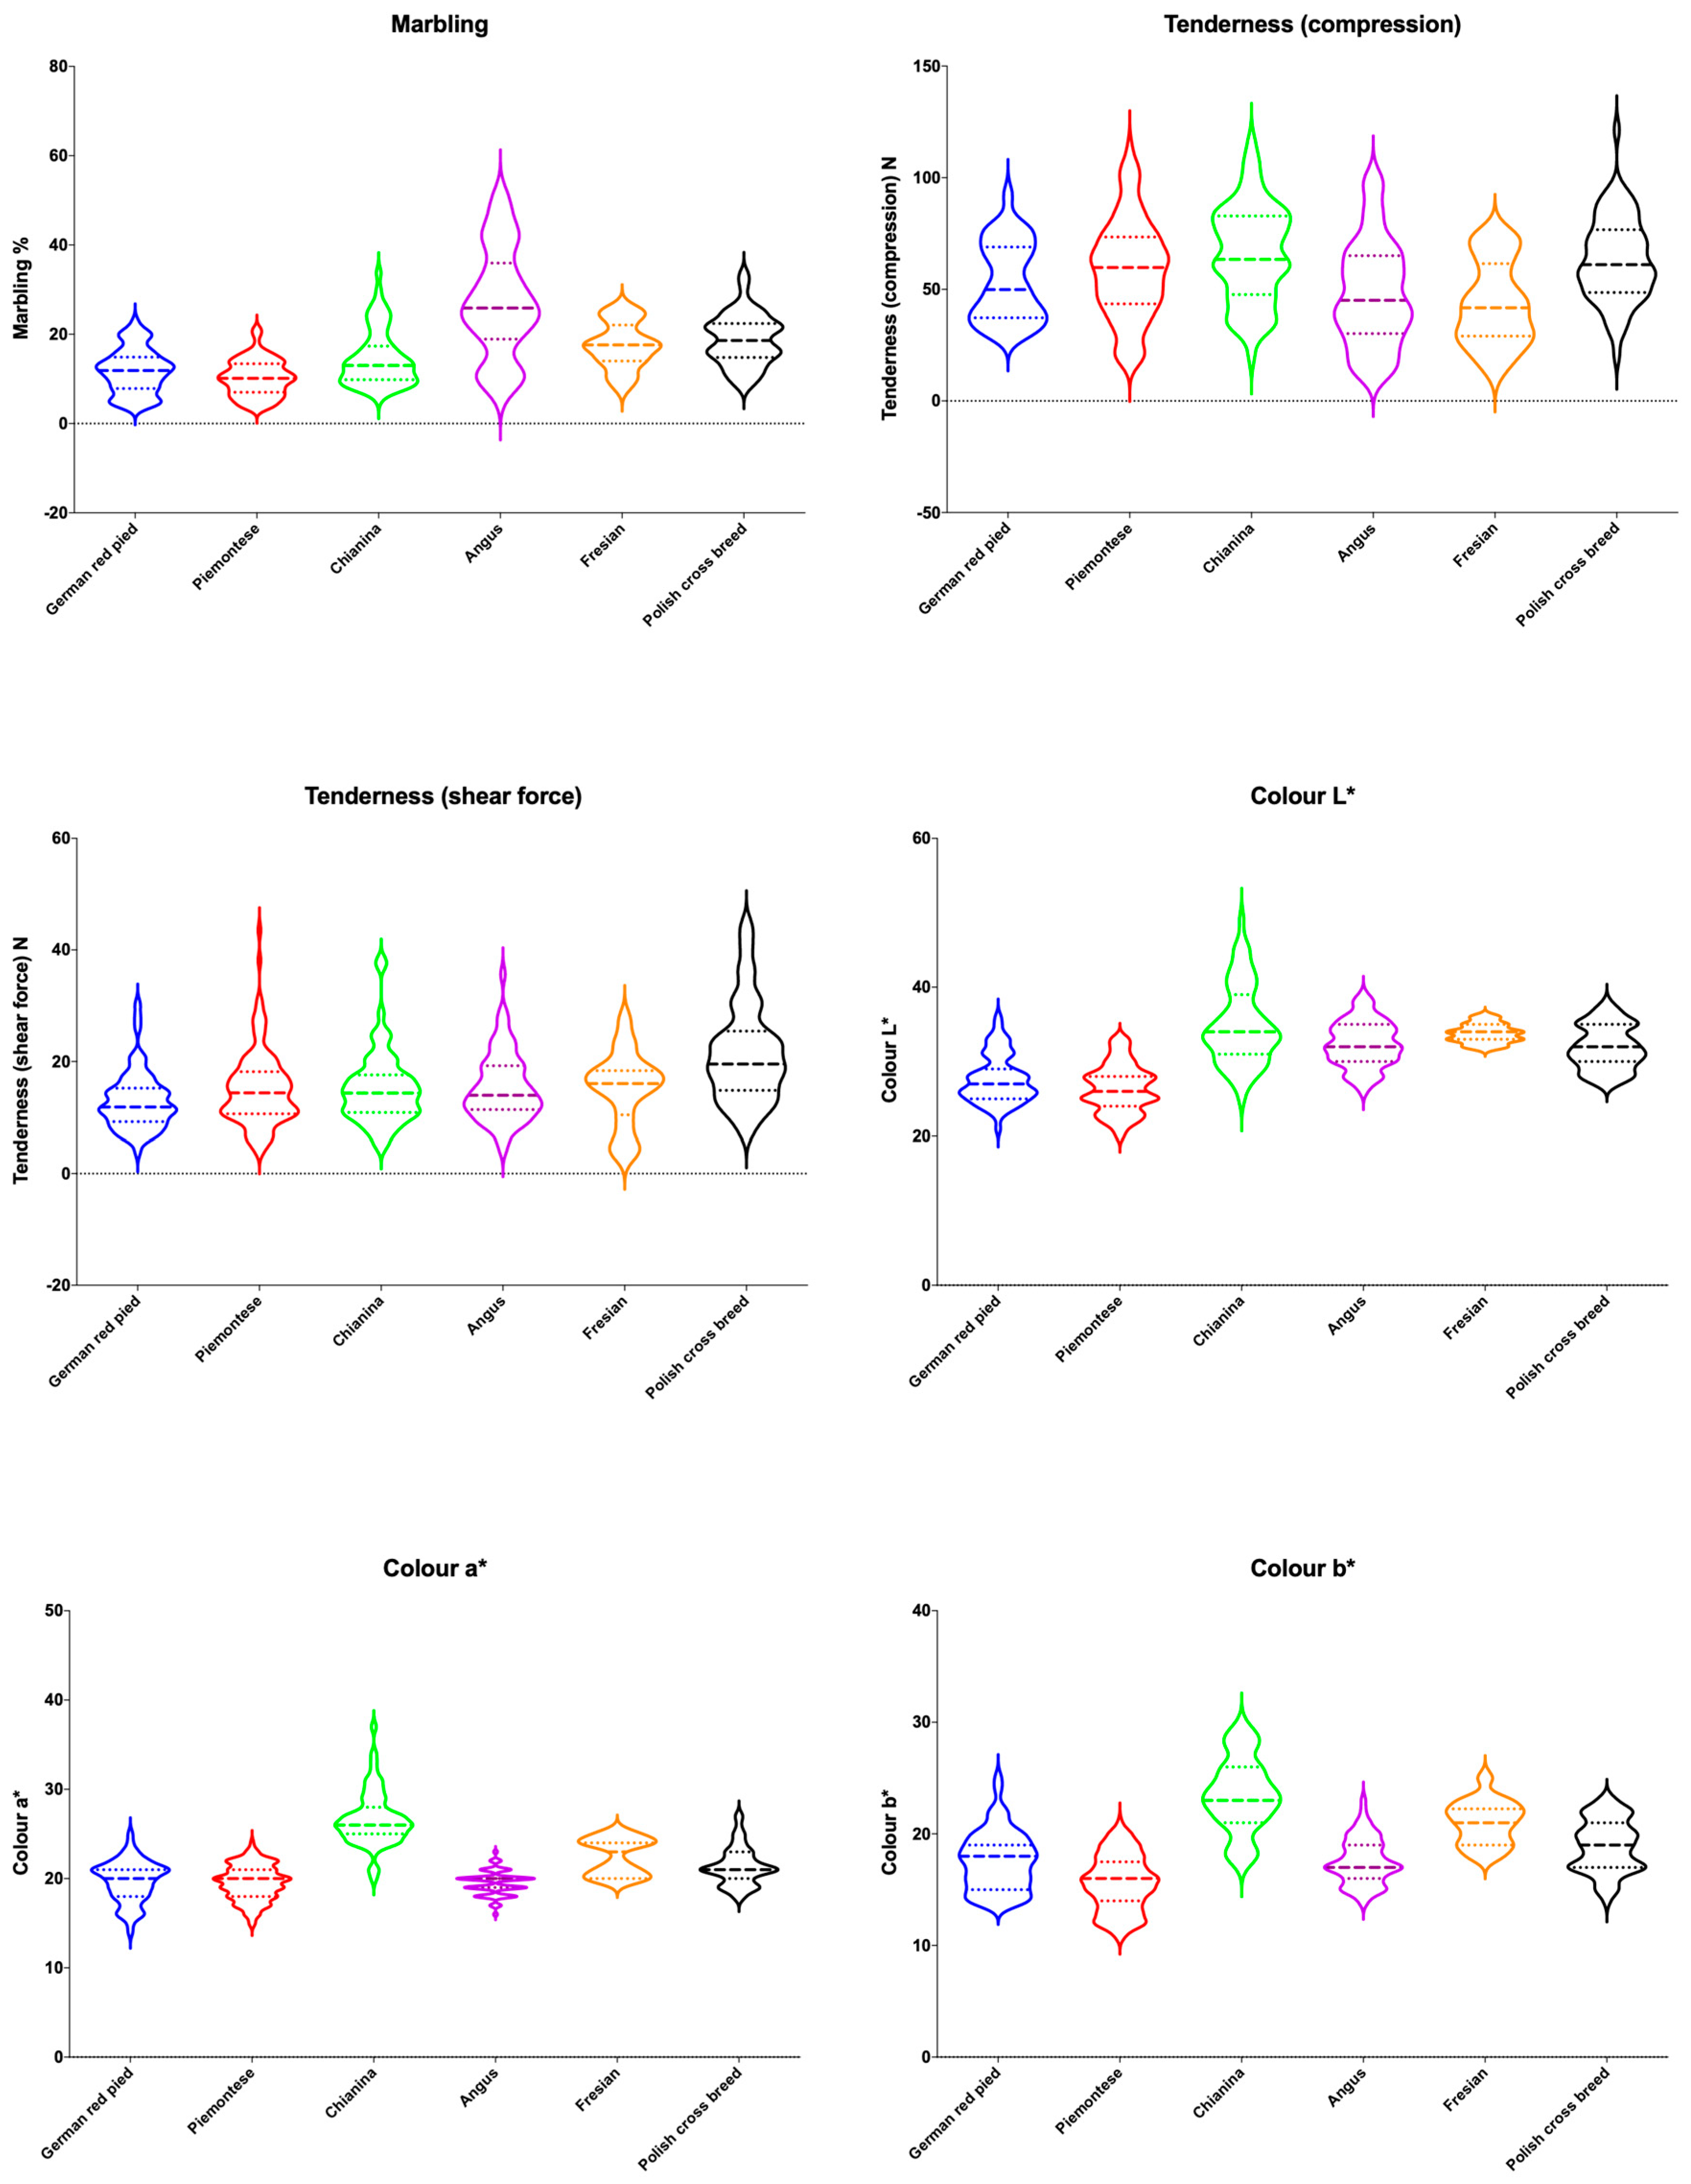
The violin plots in Figure 1 show shows the frequency (density) of data points at any given value (width of the violin at each value). Wider sections indicate more data points, while narrower sections show fewer. Moreover, they include lines for the median (center line) and the first and third quartiles (the lower and upper lines).
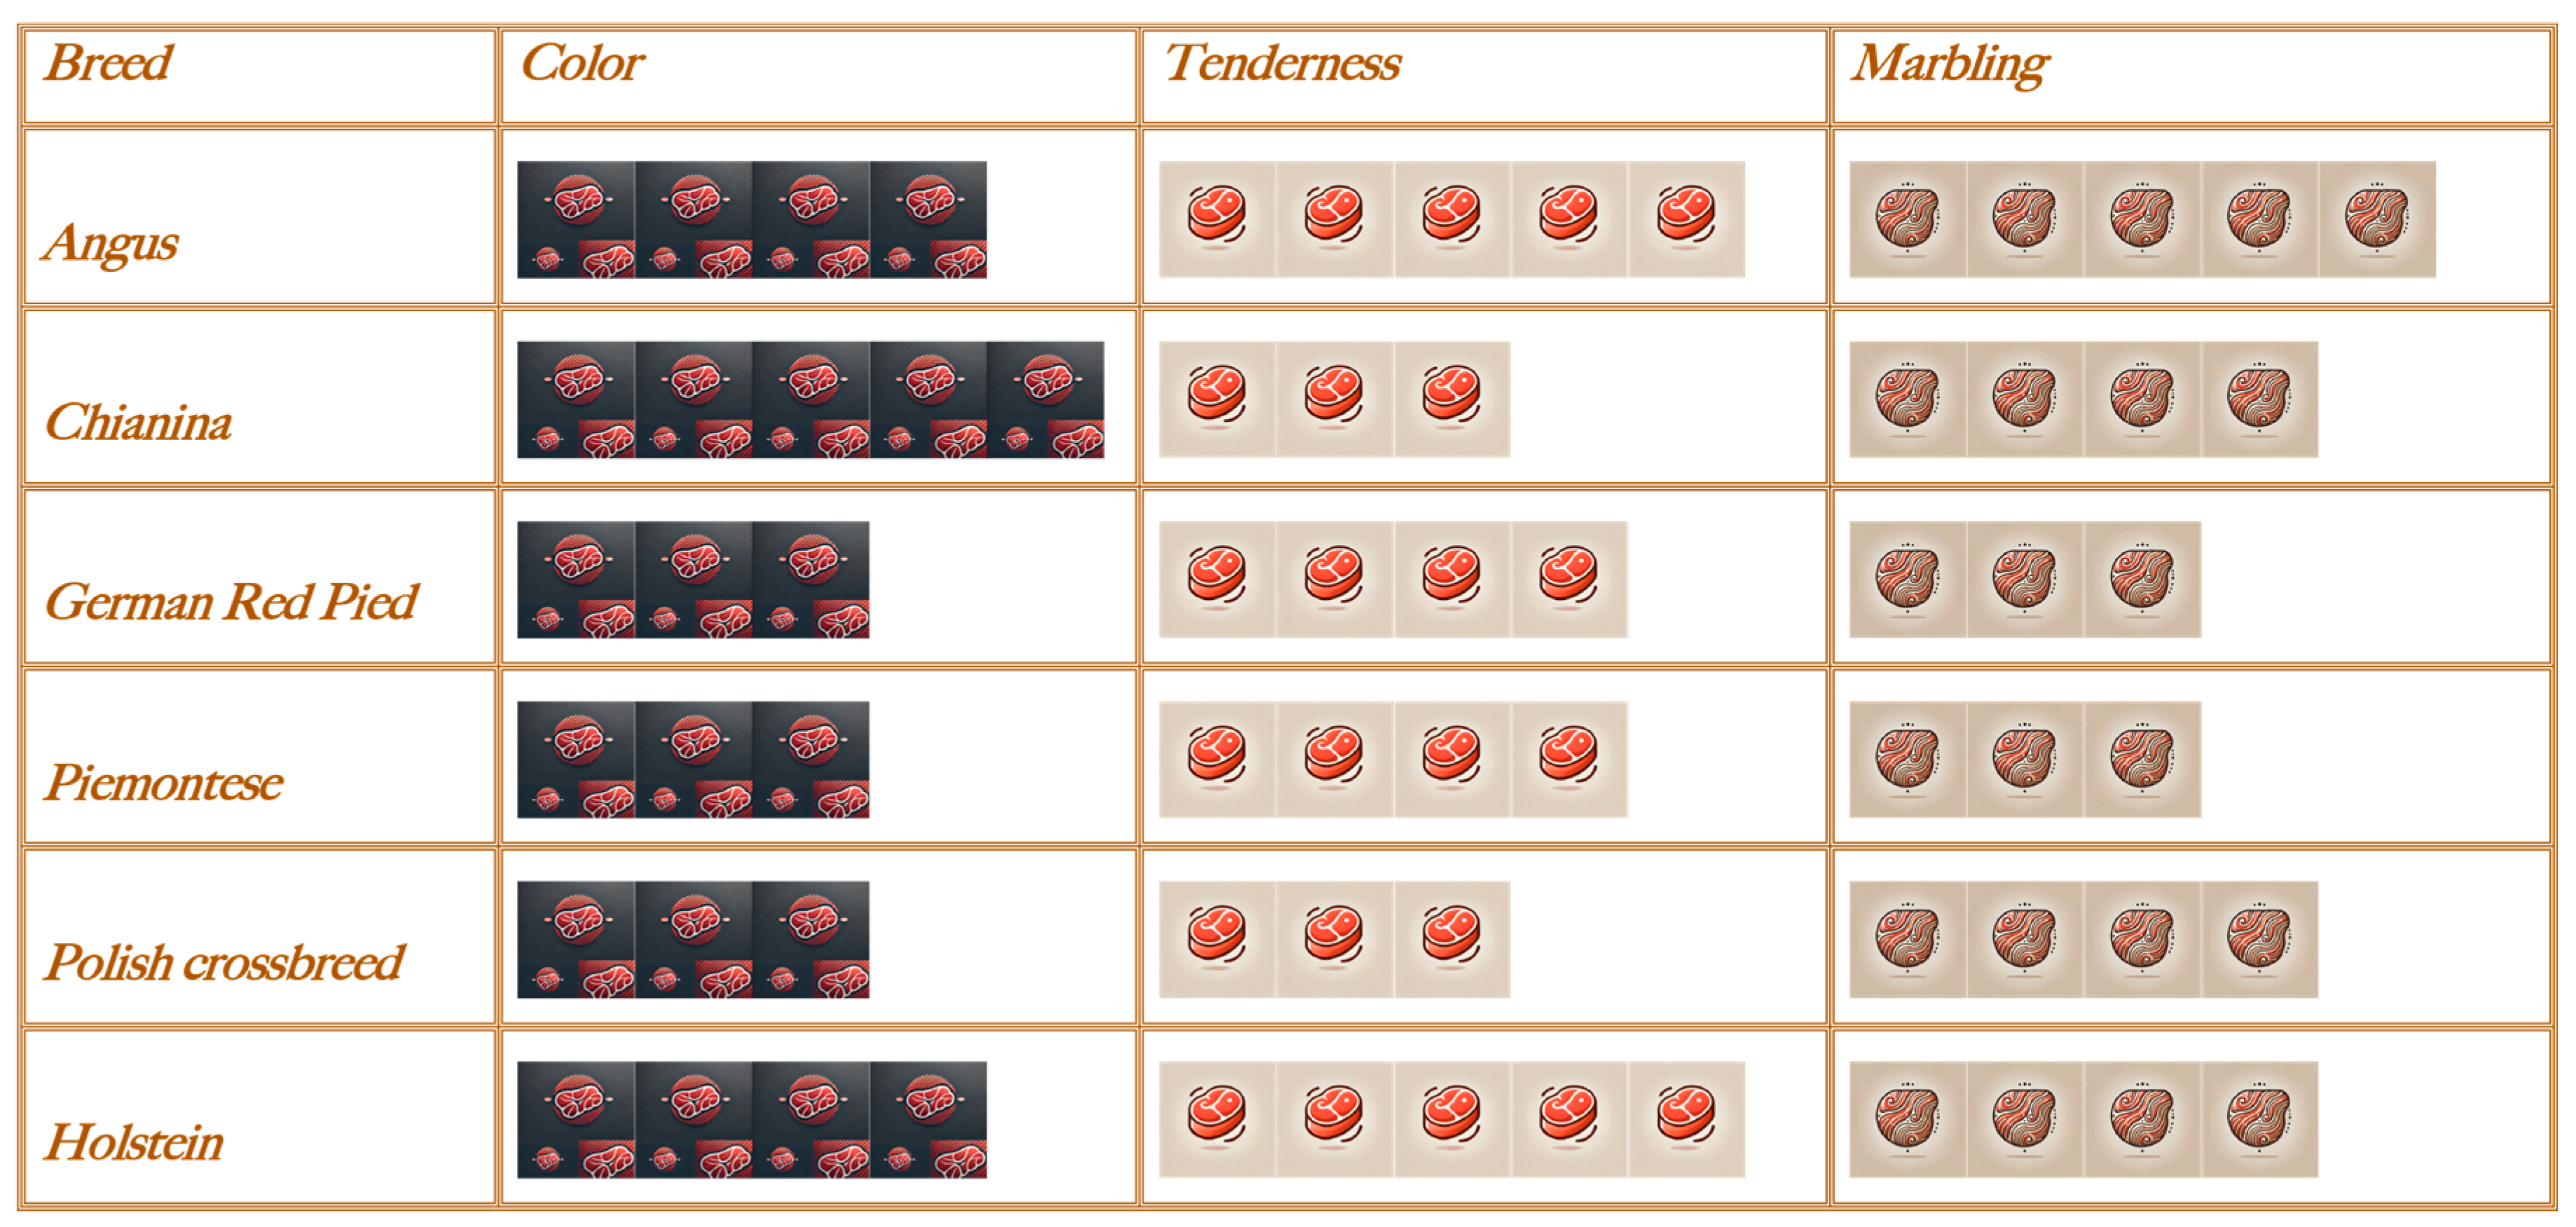
2.7. Labelling System
Data obtained from this work (Table 2) were transformed into a 5-level scale using the formula below, using the reciprocal for tenderness values (were the lower the value, the higher the score):
x = vp * 5 / vmax
where
x: 5-level scale value
vp: value for any given parameter
vmax: the highest values for any given parameter
The scores where then converted into a simple infographic (Figure 3)
3. Results
3.1. Colorimetric Analysis
Results of the colorimetric analysis are reported in Table 2 and in Figure 1. The colorimetric analysis highlighted how meat of the Chianina, Holstein and Polish crossbreed breeds are significantly redder than the others, showing higher a* coordinate values (26.64±3.02, 22.44±2.04 and 21.37±2.11 respectively). Regarding the value of the b* coordinate, which indicates the tendency towards yellow or cyan (higher values yellow, lower values cyan), the same three breeds (Chianina, Holstein and Polish crossbreed) showed higher values (23.49±3.24, 21.00±1.94 and 18.92±2.33 respectively). Finally, the meat of the Chianina (34.79±5.30), Angus (32.33±3.05) and Holstein (33.78±1.26) breeds appears brighter, showing higher L* coordinate values, especially when compared with German Red Pied (27.64±3.24) and Piemontese (26.39±3.18), with a darker shade.
Figure 1.
Violin plots showing data distribution of the results obtained.
3.2. Marbling, Total Lipids and Fatty Acids Profile
Results of the marbling and total lipids evaluation are reported in Table 2 and in Figure 1. The meat of the Angus (27.01±12.09) was the most marbled, followed by the Polish crossbreed (18.83±5.75), Holstein (17.51±5.18) and Chianina (14.60±6.28), and finally by German Red Pied (11.80±4.96) and Piemontese (10.23±4.05), with statistically significant differences. As for the total lipids content, expressed as a % of the total weight of the sample, the highest value was detected for Chianina (6.30±1.94), followed by Holstein (5.81±2.48) and Angus (5.35±2.61), then by Polish crossbreed (4.81±1.62) and finally by German Red Pied (3.09±0.67) and Piemontese (2.63±0.44). Regarding the total lipids content, the statistical analysis highlighted a good correlation with the visible marbling (Figure 2). Results of the analysis of the fatty acid profile are reported in Table 3. Differences, although not always statistically significant, were detected in the content in omega 3 fatty acids, with higher percentages in Piemontese and German Red Pied breeds and lower levels in Chianina and Holstein breeds, with the Angus at an intermediate level. Concerning omega 6 fatty acids, the highest content was detected in Polish crossbreed, followed by Holstein, Piemontese, Chianina, Angus and finally German red pied. In general, saturated fats, in particular myristic, palmitic and stearic fatty acids, represented 45 - 48% of total lipids, monounsaturated fats represented 35-45% and polyunsaturated fats 5%. The most represented polyunsaturates were linoleic and linolenic acid, while the monounsaturates were mainly represented by oleic acid
Total lipids = 2.176 + .144 *marbling; R = .583; R2 = .34
3.3. Tenderness
As regard tenderness, results are reported in Table 2 and in Figure 1. The lowest value of resistance to the application of a compressive force was recorded for Holstein (43.44±18.75 N), followed by Angus (48.04±23.30 N), German Red Pied (53.35±17.77 N), Piemontese (59.23±22.17 N), Polish crossbreed (63.23±18.71 N) and Chianina (66.18±21.61). With average values of 43.44 and 48.04 N, the meat of Angus and Holstein breeds were found, with statistically significant differences, to be the most tender in the compression test, while, with values of 63.23 and 66.18 N, respectively, the meat of the Polish crossbreed and Chianina breeds are the most consistent. Intermediate values were recorded for German Red Pied and Piemontese. Similar, but more levelled, results were highlighted in the shear force test. The lowest value was recorded for German Red Pied (12.98±5.16 N), followed by Piemontese (15.22±6.69 N), Chianina (15.24±6.49 N), Holstein (15.26±6.63 N), Angus (15.42±6.12 N) and Polish crossbreed (21.62±8.86).
4. Discussion
The relationship between breed and beef quality has long been discussed. Many different breed-dependent factors have been positively or negatively associated to beef quality, such as age at physiological maturity, grow path, muscle structure, amount, composition and distribution of intramuscular fat and content of connective tissue [35]. A well-known example is Wagyu breed, which produce meat characterized by intense marbling, flavor and juiciness [36]. Genetic selection for cattle led to a clear differentiation between meat and dairy breeds, with meat producing breeds often associated to higher quality meat when compared to dairy breeds. The age of physiological maturity is another important parameter breed-dependent that strongly influence meat quality: in fact, the deposition of intramuscular fact starts after the deposition of subcutaneous fat, when the animal matures. Therefore, early maturing breeds such as Angus, shows higher levels of intramuscular fat if compared with breeds that mature later when slaughtered at the same age [1]. This study demonstrates that breed has a significant impact on key beef quality traits, specifically colour, marbling, and tenderness. The observed differences among breeds are not only statistically significant but also biologically meaningful, reflecting underlying genetic and physiological mechanisms that govern muscle development, fat deposition, and meat quality.
The higher intramuscular fat content and marbling observed in Angus samples compared to Holstein and Piemontese are consistent with the breed’s earlier physiological maturity and genetic predisposition for fat deposition. Early-maturing breeds such as Angus tend to deposit intramuscular fat sooner, resulting in greater marbling and, consequently, enhanced juiciness and flavour. In contrast, later-maturing breeds may produce leaner meat when slaughtered at the same age, as intramuscular fat deposition occurs later in their growth trajectory. These findings align with previous research highlighting the role of breed in determining the timing and extent of fat accumulation within muscle tissue [37-41]. The fatty acid profiles further illustrate breed-specific differences. Angus beef exhibited a higher proportion of oleic acid (C18:1n-9 + n7) and a lower proportion of linoleic acid (C18:2n-6) compared to Holstein, while Piemontese animals had a notably lower C18:2n-6 content than reported in the literature. These variations can be attributed to genetic factors influencing the activity of enzymes such as stearoyl-CoA desaturase, which modulate the synthesis and composition of fatty acids in muscle. The higher monounsaturated fatty acid content in Angus may contribute not only to marbling but also to the palatability and nutritional profile of the meat [37-39,41-44]. The amount of fat in a meat sample is determined by chemical methods but this approach measures more than the intramuscular fat visible to the human eye. Many studies have investigated the relationship between marbling perceived by human eye and the amount of fat in the sample, generally reporting a good correlation between the two even if the magnitude of this correlation is debated. Such variability could be explained on the basis of different chemical extraction methods for lipids as well as different methods to assess the amount of visible fat [45]. The good correlation observed in our study is consistent with a study by Konarska et al., which reported a moderate correlation between visible marbling and intramuscular fat percentage [46]. The fatty acid profile of meat can vary between different cattle breeds due to genetic, physiological, and environmental factors [15]. Phospholipids represent a higher proportion of total fat in breeds with a lower amount of lipids in the muscle: therefore, this breeds usually have higher proportions of Poly-Unsatured Fatty Acids (PUFA) [47]. Differences in the portioning of body fat between dairy and beef breed are also reported in literature, with dairy breeds having more non-visible fat and less subcutaneous fat [48]. Results obtained in this study corroborate this thesis considering that Holstein showed the second highest values for total lipids. In a study by Warren et al. [48], beef fatty acid composition of Aberdeen Angus cross and Holstein–Friesian breeds were compared. This study reported that the amounts of neutral lipid and phospholipid in longissimus muscle were not very different and consequently proportions of many fatty acids were also quite similar. In our study, while the total amount of lipids was similar between Angus and Holstein, differences were observed in the fatty acid profile: in particular, Angus samples showed higher concentrations of C18:1n-9 + n7 (35.9% vs 27.7%) and lower concentrations of C18:2n-6 (7.9% vs 15.7%). As regards Holstein and Piemontese, the concentration of the major fatty acids (palmitic, stearic, oleic and linoleic) expressed as percentage of the total found in our study is consistent with other works. It is worth noticing the percentage of C18:2n-6 in Piemontese animals which in our study is lower than reported in literature (10.2 % compared to 16.8 % and 27.4 %) [49]. The only statistically significant differences were observed for C17:1 and C18:1 n9+n7 between German Red Pied (higher values) and Holstein (lower values) at the Kruskal-Wallis test, followed by Dunn’s multiple comparisons (p < 0.05).
Tenderness, a critical determinant of consumer satisfaction, also varied among breeds. The use of a modified Warner-Bratzler method allowed for the assessment of tenderness in raw meat, reflecting the characteristics available to consumers at the point of purchase. The variability in tenderness across breeds can be explained by differences in muscle fibre composition and connective tissue content, both of which are influenced by genetic selection for meat or dairy production. Breeds selected for meat production often exhibit muscle structures that favour greater tenderness, whereas dairy breeds may have higher connective tissue content, resulting in firmer meat [41,50-52]. The strong correlation observed between visually assessed marbling and chemically measured intramuscular fat supports the validity of using visual cues as practical indicators of eating quality for consumers. However, the strength of this relationship can be affected by the methods used for fat extraction and visual assessment, as noted in previous studies [52-54]. Tenderness is considered the single most important factor for consumer’s perception of beef quality. It is widely accepted that beef tenderness is a rather inconsistent characteristic, with huge variation between breeds, animals, meat cut and many other variables. This inconsistency is recognized as one of the main problems for beef industry around the world [55]. The variability of beef tenderness evaluation is also linked to the difficulty in the development of a standardized, repeatable and reliable method to objectively assess this characteristic at laboratory level [22]. Researchers have systematically attempted to determine the most repeatable and accurate method to assess beef tenderness. To date, the Warner-Bratzler method and its variations are recognized as the best approach to measure beef tenderness [56]. For the purpose of the present study, a modified version of the Warner-Bratzler method was used. In particular, samples were not cooked before tenderness measurement. The cooking method, temperature and time for meat samples in the original methodology can be modified depending on the hypothesis investigated in each experiment and impact the final results [23]. The aim of the present study was to classify beef on the basis of characteristics that can be evaluated at the time of purchase and to hypothesize a series of infographics for the label. Therefore, cooking is a process that happens later, depends on the consumer’s preference and it is independent of the original beef characteristics. Other examples of applications of modified versions of the Warner-Bratzler method on non-cooked beef can be found in literature [57,58].
Visual appearance is the first level of beef quality perceived by the consumer. Meat colour greatly influence visual appearance of beef as well as the consumer’s choice. Bright red beef is associated with freshness and higher quality while paler or darker beef is often perceived as near spoilage or lower quality [59]. The red colour of meat is due to the conversion of deoxymyoglobin into oxymyoglobin, which has a red color, after exposure to oxygen. A prolonged exposure to oxygen brings to the activation of oxidative metabolism and the accumulation of free radical by-products which are responsible for the oxidation of myoglobin in into metmyoglobin and the consequent brown coloration of meat [60-62]. Studies reported that the majority of the variability observed in beef color is related to a* and L* coordinates in conjunction, with a* coordinate that account for oxidation state and pigmentation. On the other hand, the level of intramuscular fat content and the redox state is more related to b* coordinate [15].
These breed-specific differences in meat quality traits provide a scientific foundation for the development of an objective labelling model. The proposed labelling system, based on standardized, instrumentally measured attributes such as colour, marbling, and tenderness, addresses current gaps in consumer information. By translating complex biological variability into clear, actionable information, the labelling model enables consumers to make more informed choices according to their preferences for attributes like tenderness or marbling. This approach also supports transparency and fair competition among producers, as it rewards the production of higher-quality beef based on measurable criteria rather than subjective claims. The integration of an infographic or grading scale into beef labelling has practical implications for both consumers and the industry. Visual tools can distil complex data into accessible formats, helping consumers quickly identify products that meet their needs and preferences at the point of sale. Such a system aligns with regulatory goals for accuracy and transparency in food information, while also enhancing consumer trust and satisfaction. The usefulness of an infographic in this context cannot be overstated. By visually presenting complex information, such as breed characteristics, fat content, tenderness, and marbling, an infographic can simplify these factors for the consumer. This visual guide can help consumers make more informed decisions at the point of purchase, allowing them to understand the key traits of the beef they're considering, such as its potential tenderness or marbling. With this tool, consumers can easily navigate the often-overwhelming array of beef options, making their purchasing decisions more straightforward and based on clear, easily digestible information [63].
Figure 3.
Infographic for the three main parameters considered: color, tenderness and marbling.
5. Conclusions
The proposed labelling model, grounded in standardized and instrumentally measured attributes, offers a transparent and reliable framework for conveying complex quality information to consumers. Such a system has the potential to empower consumers to make informed choices tailored to their preferences, enhance trust in beef products, and promote fair competition among producers by rewarding measurable quality improvements. Furthermore, integrating clear and accessible visual tools, such as infographics, into labelling can bridge the gap between scientific data and consumer understanding, simplifying the purchasing process and supporting regulatory goals of accuracy and transparency.
Ultimately, by translating biological diversity into actionable consumer information, this approach advances both market transparency and the overall consumer experience, paving the way for more informed, confident, and satisfying choices in the beef marketplace.
Author Contributions
Conceptualization, BCG and LC.; methodology, BCG.; software, LG and MMB validation, BCG, FB, FI, formal analysis, EC, LG investigation, MT and CT.; resources, CT data curation, SEA, MM, GG; writing—original draft preparation, LG, writing—review and editing, BCG and MK visualization, JGD.; supervision, MZ and CS project administration, BCG; funding acquisition, CT All authors have read and agreed to the published version of the manuscript.”
Funding
This work has been funded by the European Union - NextGenerationEU under the Italian Ministry of University and Research (MUR) National Innovation Ecosystem grant ECS00000041 - VITALITY. We acknowledge Università degli Studi di Perugia and MUR for support within the project Vitality.
Institutional Review Board Statement
All samples were obtained from commercial cuts intended for the market. The animals had been reared for meat production in compliance with EU regulations (Regulations 853/2004, 625/2017, 627/2019, and 624/2019), transported to slaughterhouses under Regulation 1/2005, and slaughtered according to Regulation 1099/2009. As this research involved commercially available cuts and did not require us housing or handling of live animals, it was exempt from animal care approval.
Conflicts of Interest
Declare conflicts of interest or state “The authors declare no conflicts of interest.”
References
- Liu, J., et al. Consumer Perception of Beef Quality and How to Control, Improve and Predict It? Focus on Eating Quality. Foods (Basel, Switzerland) 2022, 11. [CrossRef]
- Anonymus. Regulation (EU) No 1169/2011 of the European Parliament and of the Council of 25 October 2011 on the provision of food information to consumers. 2011.
- Shi, Y., et al. A Review on Meat Quality Evaluation Methods Based on Non-Destructive Computer Vision and Artificial Intelligence Technologies. Food Sci Anim Resour 2021, 41, 563-588. [CrossRef]
- Hocquette, J.F., et al. Opportunities for predicting and manipulating beef quality. Meat Sci 2012, 92, 197-209. [CrossRef]
- Raulet, M., et al. Construction of beef quality through official quality signs, the example of Label Rouge. Animal 2022, 16 Suppl 1, 100357. [CrossRef]
- Bernués, A., et al. Labelling information demanded by European consumers and relationships with purchasing motives, quality and safety of meat. Meat Science 2003, 65, 1095-1106. [CrossRef]
- Gellynck, X., et al. Pathways to increase consumer trust in meat as a safe and wholesome food. Meat Sci 2006, 74, 161-171. [CrossRef]
- Stranieri, S.; Banterle, A. Consumer Interest in Meat Labelled Attributes: Who Cares? International Food and Agribusiness Management Review 2015, 18, 21-38.
- Allen, P. Recent developments in the objective measurement of carcass and meat quality for industrial application. Meat Sci 2021, 181, 108601. [CrossRef]
- Mateescu, R.G., et al. Strategies to predict and improve eating quality of cooked beef using carcass and meat composition traits in Angus cattle. Journal of animal science 2016, 94, 2160-2171. [CrossRef]
- Anonymus. Requirements for grading terms on meat product labeling. USDA, U.S.D.o.A., Ed. USDA: Washington, DC 20250 2018.
- Grunert, K.G., et al. Consumer perception of meat quality and implications for product development in the meat sector—a review. Meat Science 2004, 66, 259-272. [CrossRef]
- Pethick, D., et al. Improving the nutritional, sensory and market value of meat products from sheep and cattle. Animal 2021, 15, 100356.
- Gagaoua, M., et al. Reverse phase protein arrays for the identification/validation of biomarkers of beef texture and their use for early classification of carcasses. Food Chemistry 2018, 250, 245-252. [CrossRef]
- Xie, X., et al. Effect of cattle breed on meat quality, muscle fiber characteristics, lipid oxidation and Fatty acids in china. Asian-Australasian journal of animal sciences 2012, 25, 824-831. [CrossRef]
- Smith, G.C., et al. Economic implications of improved color stability in beef. Antioxidants in muscle foods nutritional strategies to improve quality 2000, 397-426.
- Ardeshiri, A.; Rose, J.M. How Australian consumers value intrinsic and extrinsic attributes of beef products. Food Quality and Preference 2018, 65, 146-163. [CrossRef]
- Emerson, M.R., et al. Effectiveness of USDA instrument-based marbling measurements for categorizing beef carcasses according to differences in longissimus muscle sensory attributes. Journal of animal science 2013, 91, 1024-1034. [CrossRef]
- Hunt, M.R., et al. Consumer assessment of beef palatability from four beef muscles from USDA Choice and Select graded carcasses. Meat Science 2014, 98, 1-8. [CrossRef]
- Corbin, C.H., et al. Sensory evaluation of tender beef strip loin steaks of varying marbling levels and quality treatments. Meat Sci 2015, 100, 24-31. [CrossRef]
- Schumacher, M., et al. Fat Deposition and Fat Effects on Meat Quality-A Review. Animals : an open access journal from MDPI 2022, 12. [CrossRef]
- Warner, R.D., et al. Meat tenderness: advances in biology, biochemistry, molecular mechanisms and new technologies. Meat Science 2022, 185, 108657. [CrossRef]
- Warner, R., et al. Meat Tenderness: Underlying Mechanisms, Instrumental Measurement, and Sensory Assessment. Meat and Muscle Biology 2021, 4. [CrossRef]
- Crapnell, R.D.; Banks, C.E. Electroanalytical overview: the pungency of chile and chilli products determined via the sensing of capsaicinoids. Analyst 2021, 146, 2769-2783. [CrossRef]
- Zheng, Y.-M., et al. The relationship between Scoville Units and the suprathreshold intensity of sweeteners and Sichuan pepper oleoresins. Journal of Sensory Studies 2021, 36, e12699. [CrossRef]
- Zhu, Y., et al. Multi-dimensional pungency and sensory profiles of powder and oil of seven chili peppers based on descriptive analysis and Scoville heat units. Food Chemistry 2023, 411, 135488. [CrossRef]
- McClure, A.P., et al. Optimizing consumer acceptability of 100% chocolate through roasting treatments and effects on bitterness and other important sensory characteristics. Current Research in Food Science 2022, 5, 167-174. [CrossRef]
- Grispoldi, L., et al. A study on the application of natural extracts as alternatives to sodium nitrite in processed meat. Journal of Food Processing and Preservation 2022, 46, e16351. [CrossRef]
- Cheng, W., et al. Marbling Analysis for Evaluating Meat Quality: Methods and Techniques. Comprehensive Reviews in Food Science and Food Safety 2015, 14, 523-535. [CrossRef]
- Lee, B., et al. Comparison of marbling fleck characteristics between beef marbling grades and its effect on sensory quality characteristics in high-marbled Hanwoo steer. Meat Science 2019, 152, 109-115. [CrossRef]
- Lee, S., et al. Determination of Intramuscular Fat Content in Beef using Magnetic Resonance Imaging. Journal- Faculty of Agriculture Kyushu University 2015, 60, 157-162. [CrossRef]
- D'Arco, G., et al. Composition of meat and offal from weaned and fattened rabbits and results of stereospecific analysis of triacylglycerols and phosphatidylcholines. Journal of the Science of Food and Agriculture 2012, 92, 952-959. [CrossRef]
- Maurelli, S., et al. Enzymatic Synthesis of Structured Triacylglycerols Containing CLA Isomers Starting from sn-1,3-Diacylglycerols. Journal of the American Oil Chemists' Society 2009, 86, 127-133. [CrossRef]
- Piccinetti, C.C., et al. Malnutrition may affect common sole (Solea solea L.) growth, pigmentation and stress response: Molecular, biochemical and histological implications. Comparative Biochemistry and Physiology Part A: Molecular & Integrative Physiology 2012, 161, 361-371. [CrossRef]
- Bonny, S., et al. Chapter 10 - Quality Assurance Schemes in Major Beef-Producing Countries. In New Aspects of Meat Quality, Purslow, P.P., Ed. Woodhead Publishing: 2017. pp. 223-255. [CrossRef]
- Motoyama, M., et al. Wagyu and the factors contributing to its beef quality: A Japanese industry overview. Meat Science 2016, 120, 10-18. [CrossRef]
- Sakowski, T., et al. Genetic and Environmental Determinants of Beef Quality-A Review. Front Vet Sci 2022, 9, 819605. [CrossRef]
- Papanikolopoulou, V., et al. Impact of Breed and Slaughter Hygiene on Beef Carcass Quality Traits in Northern Greece. Foods (Basel, Switzerland) 2025, 14. [CrossRef]
- Tan, Z.; Jiang, H. Molecular and Cellular Mechanisms of Intramuscular Fat Development and Growth in Cattle. Int J Mol Sci 2024, 25. [CrossRef]
- Kostusiak, P., et al. Relationship between Beef Quality and Bull Breed. In Animals, 2023; Vol. 13.
- Park, S.J., et al. Genetic, management, and nutritional factors affecting intramuscular fat deposition in beef cattle - A review. Asian-Australasian journal of animal sciences 2018, 31, 1043-1061. [CrossRef]
- Tyra, M., et al. Association between subcutaneous and intramuscular fat content in porcine ham and loin depending on age, breed and FABP3 and LEPR genes transcript abundance. Mol Biol Rep 2013, 40, 2301-2308. [CrossRef]
- Ramani, A., et al. Comparative analysis of fatty acid profiles in indigenous cattle breeds: A comprehensive evaluation. . Int. J. Adv. Biochem. Res. 2024, 8, 378-381. [CrossRef]
- Liu, T., et al. Fatty Acid Profile of Muscles from Crossbred Angus-Simmental, Wagyu-Simmental, and Chinese Simmental Cattles. Food Sci Anim Resour 2020, 40, 563-577. [CrossRef]
- Pannier, L., et al. Prediction of chemical intramuscular fat and visual marbling scores with a conveyor vision scanner system on beef portion steaks. Meat Science 2023, 199, 109141. [CrossRef]
- Konarska, M., et al. Relationships between marbling measures across principal muscles. Meat Science 2017, 123, 67-78. [CrossRef]
- Wood, J.D., et al. Fat deposition, fatty acid composition and meat quality: A review. Meat Science 2008, 78, 343-358. [CrossRef]
- Warren, H.E., et al. Effects of breed and a concentrate or grass silage diet on beef quality in cattle of 3 ages. I: Animal performance, carcass quality and muscle fatty acid composition. Meat Sci 2008, 78, 256-269. [CrossRef]
- Brugiapaglia, A., et al. Fatty acid profile and cholesterol content of beef at retail of Piemontese, Limousin and Friesian breeds. Meat Sci 2014, 96, 568-573. [CrossRef]
- Choe, J.H., et al. Estimation of Sensory Pork Loin Tenderness Using Warner-Bratzler Shear Force and Texture Profile Analysis Measurements. Asian-Australasian journal of animal sciences 2016, 29, 1029-1036. [CrossRef]
- Warner, R., et al. Meat Tenderness: Underlying Mechanisms, Instrumental Measurement, and Sensory Assessment. Meat and Muscle Biology 4(2), 17, 2021, 4, 1–25.
- Herrera, N.J., et al. The Relationship between Marbling, Superoxide Dismutase, and.
- Beef TendernessBeef Tenderness. Nebraska Beef Cattle Reports 2018.
- Benli, H.; Yildiz, D.G. Consumer perception of marbling and beef quality during purchase and consumer preferences for degree of doneness. Anim Biosci 2023, 36, 1274-1284. [CrossRef]
- Conter, M. Recent advancements in meat traceability, authenticity verification, and voluntary certification systems. Italian journal of food safety 2024, 14. [CrossRef]
- Špehar, M., et al. Beef quality: factors affecting tenderness and marbling. Stočarstvo 2008, 62, 463-478.
- Silva, D.R.G., et al. Comparison of Warner-Bratzler shear force values between round and square cross-section cores for assessment of beef Longissimus tenderness. Meat Science 2017, 125, 102-105. [CrossRef]
- Marrone, R., et al. Effects of Feeding and Maturation System on Qualitative Characteristics of Buffalo Meat (Bubalus bubalis). Animals 2020, 10, 899.
- Smaldone, G., et al. Microbiological, rheological and physical-chemical characteristics of bovine meat subjected to a prolonged ageing period. Italian journal of food safety 2019, 8, 8100. [CrossRef]
- Brewer, M.S., et al. Measuring pork color: effects of bloom time, muscle, pH and relationship to instrumental parameters. Meat Sci 2001, 57, 169-176. [CrossRef]
- Corlett, M.T., et al. Consumer Perceptions of Meat Redness Were Strongly Influenced by Storage and Display Times. Foods (Basel, Switzerland) 2021, 10. [CrossRef]
- Renerre, M. Biochemical Basis of Fresh Meat Color: Review. In Proceedings of Proceedings of the 45th International Congress of Meat Science and Technology; pp. 344-352.
- Cenci-Goga, B.T., et al. New Trends in Meat Packaging. Microbiology Research 2020, 11, 56-67.
- O'Brien, K.D., et al. The Meat of the Matter: The Effect of Science-based Information on Consumer Perception of Grass-fed Beef. Journal of Applied Communications 2003, 107.
Figure 2.
Bivariate scattergram with regression plot of marbling and total lipids.
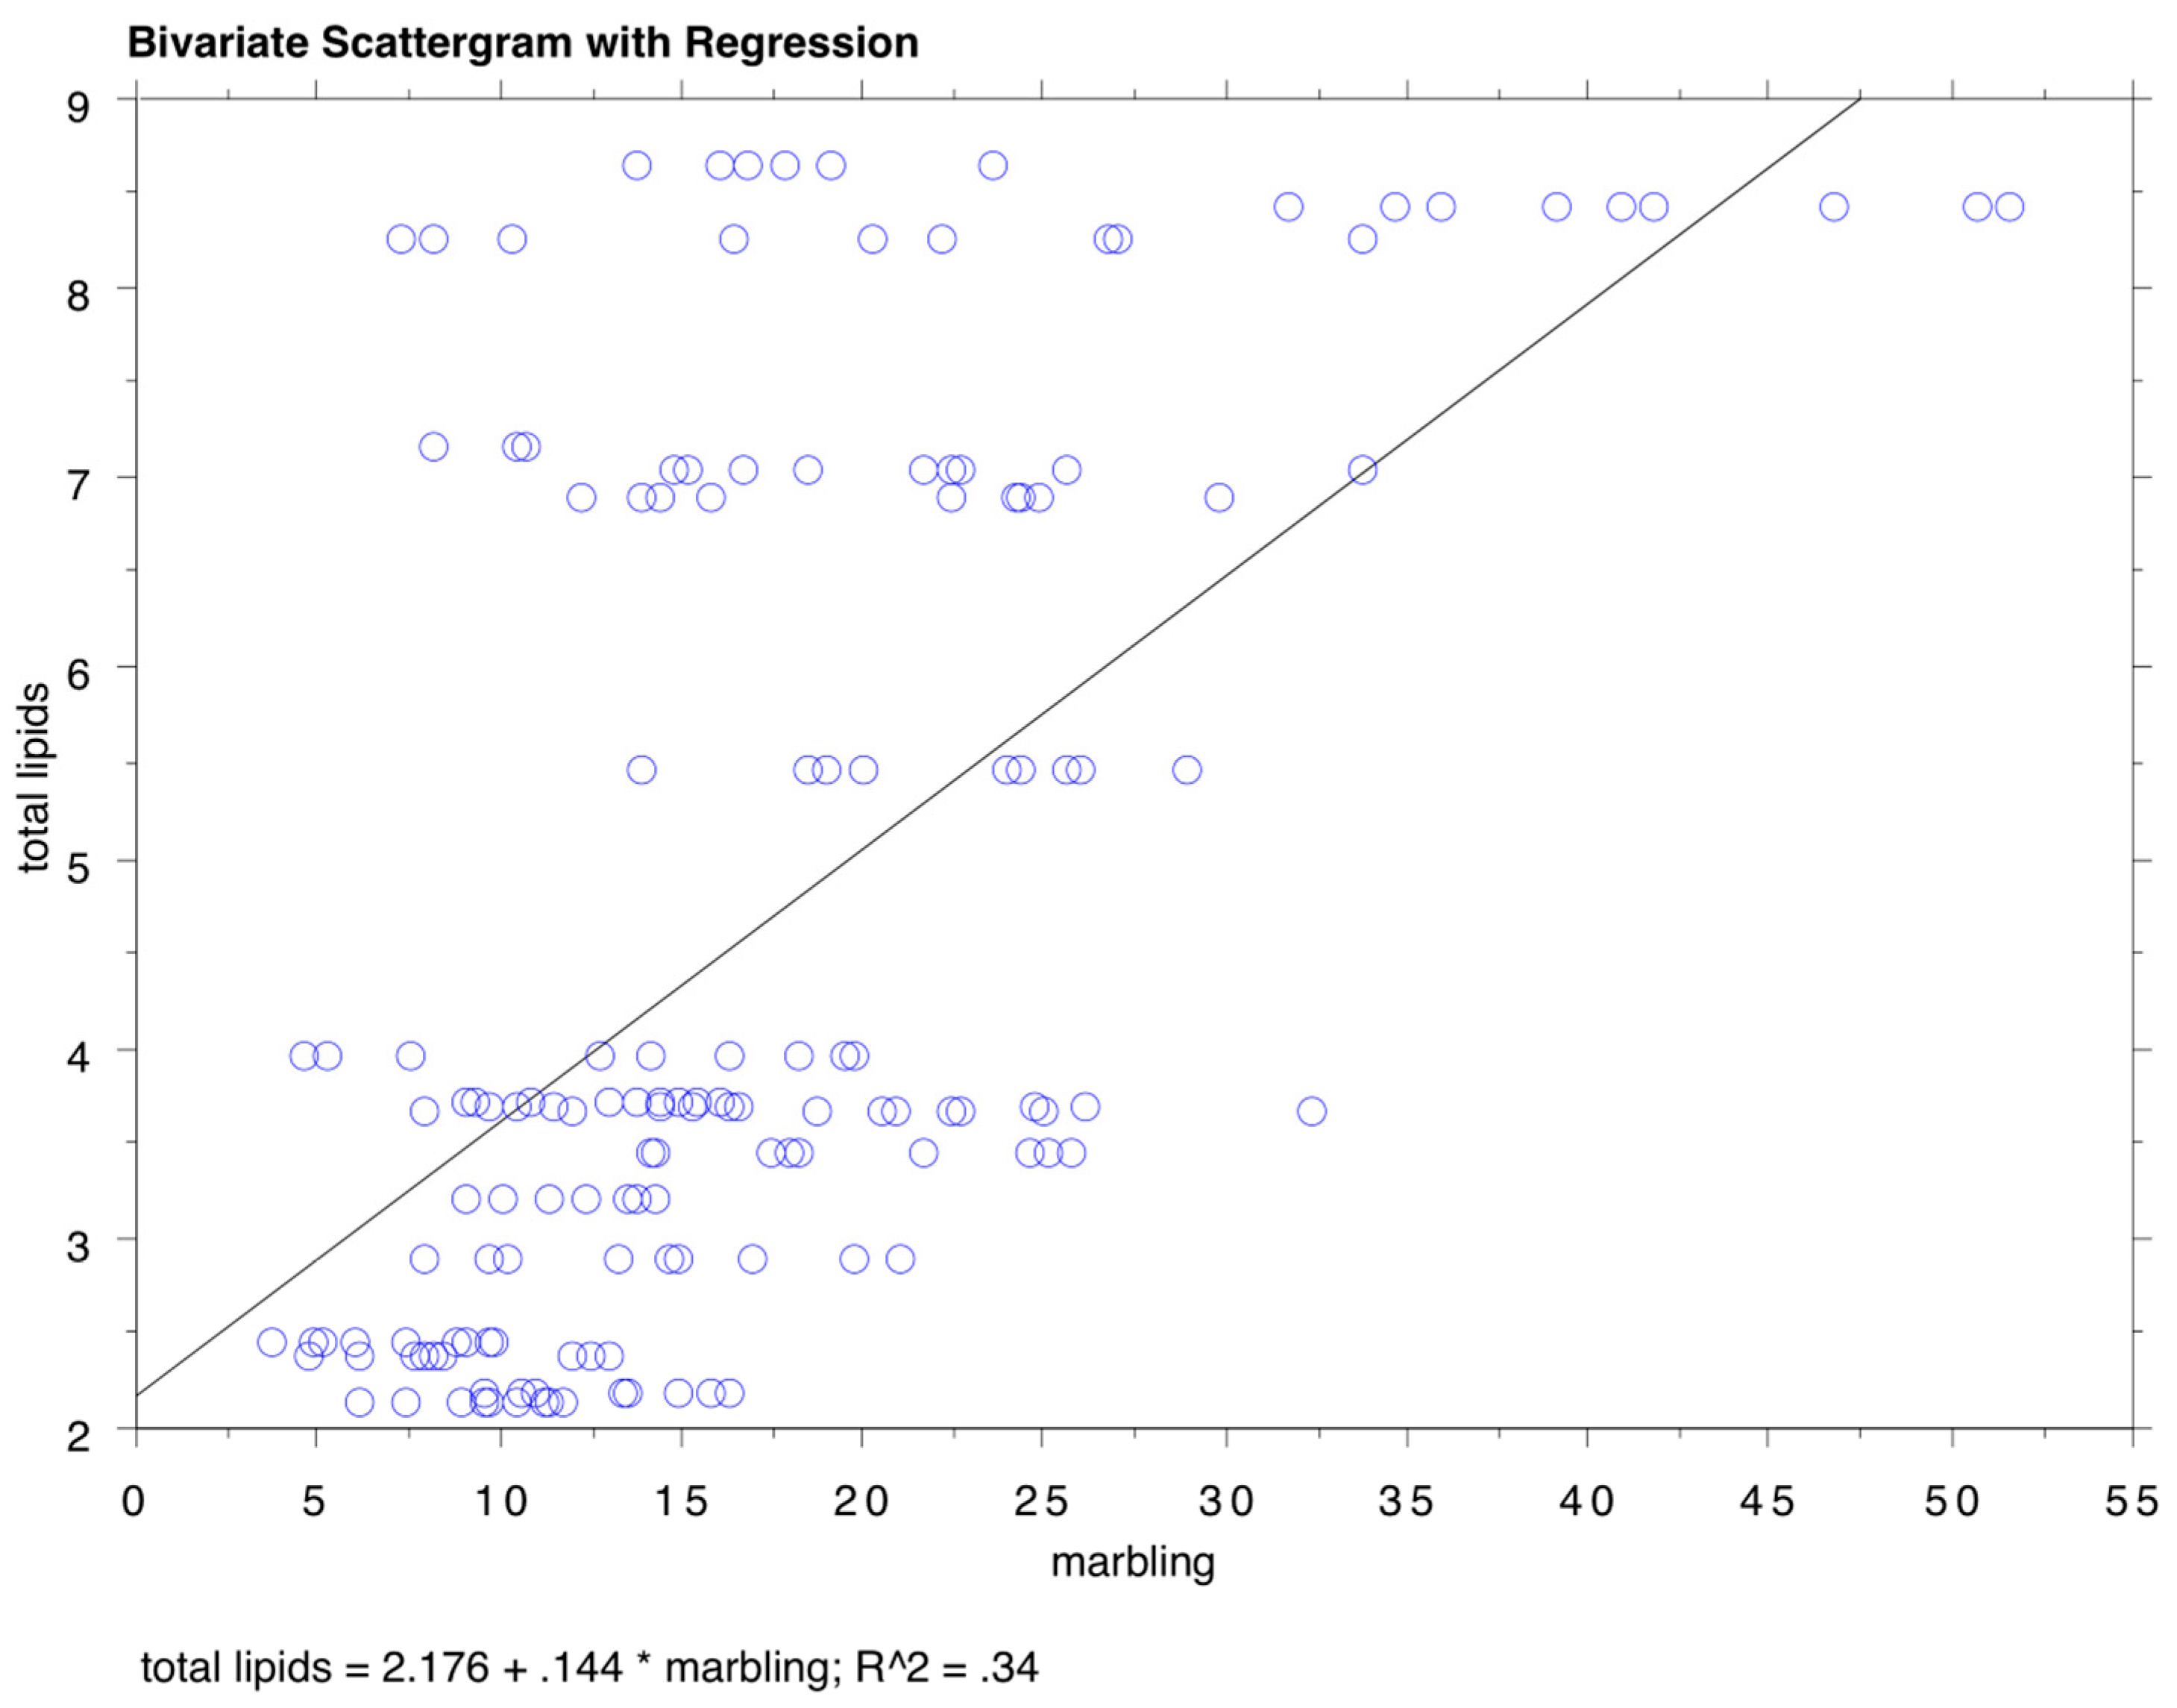

Table 1.
Time from slaughter to analysis (days).
| from slaughter to cutting/packaging | from cutting/packaging to arrival at the lab | from arrival to analysis | from packaging to analysis | ||||||||
| mean | sd | mean | sd | mean | sd | mean | sd | ||||
| Angus (n = 7 shipments) | 4,29 | 1,70 | 26,71 | 44,01 | 9,00 | 2,65 | 35,71 | sd | |||
| Chianina (n = 7 shipments) | 5,00 | 1,15 | 0,00 | 0,00 | 9,00 | 0,00 | 9,00 | 42,90 | |||
| German Red Pied (n = 7 shipments) | 3,86 | 1,68 | 3,43 | 1,40 | 7,71 | 0,49 | 11,14 | 0,00 | |||
| Piemontese(n = 13 shipments) | 3,77 | 0,83 | 3,08 | 1,44 | 6,92 | 1,85 | 10,00 | 1,35 | |||
| Polish crossbreed (n = 7 shipments) | 3,71 | 1,25 | 0,57 | 0,53 | 12,00 | 0,00 | 12,57 | 1,15 | |||
| Holstein (n = 2 shipments) | 4,00 | 0,00 | 1,00 | 0,00 | 7,50 | 4,95 | 8,50 | 0,53 | |||
Table 2.
Results of colorimetric, tenderness, marbling and total lipids evaluations, expressed as mean, standard deviation (sd), minimum and maximum value.
Table 2.
Results of colorimetric, tenderness, marbling and total lipids evaluations, expressed as mean, standard deviation (sd), minimum and maximum value.
| L* | a* | b* | ||||||||||
| mean | sd | min | max | mean | sd | min | max | mean | sd | min | max | |
| Angus | 32,33 b | 3,05 | 26,00 | 39,00 | 19,46 c | 1,35 | 16,00 | 23,00 | 17,54 c | 2,04 | 14,00 | 23,00 |
| Chianina | 34,79 b | 5,30 | 25,00 | 49,00 | 26,64 a | 3,02 | 20,00 | 37,00 | 23,49 b | 3,24 | 17,00 | 30,00 |
| Holstein | 33,78 b | 1,26 | 32,00 | 36,00 | 22,44 b | 2,04 | 20,00 | 25,00 | 21,00 bd | 1,94 | 18,00 | 25,00 |
| German Red Pied | 27,64 a | 3,24 | 21,00 | 36,00 | 19,71 c | 2,30 | 14,00 | 25,00 | 17,57 c | 2,61 | 14,00 | 25,00 |
| Piemontese | 26,39 a | 3,18 | 20,00 | 33,00 | 19,55 c | 1,93 | 15,00 | 24,00 | 15,59 a | 2,48 | 11,00 | 21,00 |
| Polish crossbreed | 31,89 b | 2,95 | 27,00 | 38,00 | 21,37 b | 2,11 | 18,00 | 27,00 | 18,92 cd | 2,33 | 14,00 | 23,00 |
| tenderness (compression)1 | tenderness (shear force)1 | |||||||||||
| mean | sd | min | max | mean | sd | min | max | |||||
| Angus | 48,04 a | 23,30 | 11,90 | 99,90 | 15,42 b | 6,12 | 4,20 | 35,65 | ||||
| Chianina | 66,18 b | 21,61 | 20,70 | 115,80 | 15,24 b | 6,49 | 4,90 | 37,90 | ||||
| Holstein | 43,44 ac | 18,75 | 14,60 | 73,05 | 15,26 ab | 6,63 | 3,35 | 27,50 | ||||
| German Red Pied | 53,35 acd | 17,77 | 27,85 | 93,80 | 12,98 b | 5,16 | 3,95 | 30,25 | ||||
| Piemontese | 59,23 bc | 22,17 | 15,65 | 114,15 | 15,22 b | 6,69 | 4,00 | 43,55 | ||||
| Polish crossbreed | 63,23 bd | 18,71 | 20,55 | 121,45 | 21,62 a | 8,86 | 7,45 | 44,20 | ||||
| marbling2 | total lipids3 | |||||||||||
| mean | sd | min | max | mean | sd | min | max | |||||
| Angus | 27,01 b | 12,09 | 6,12 | 51,54 | 5,35 bc | 2,61 | 2,15 | 8,43 | ||||
| Chianina | 14,60 cd | 6,28 | 5,69 | 33,70 | 6,30 b | 1,94 | 3,72 | 8,27 | ||||
| Holstein | 17,51 bc | 5,18 | 8,13 | 25,73 | 5,81 b | 2,48 | 3,45 | 8,65 | ||||
| German Red Pied | 11,80 ad | 4,96 | 3,74 | 22,80 | 3,09 ac | 0,67 | 2,40 | 3,97 | ||||
| Piemontese | 10,23 a | 4,05 | 3,00 | 21,41 | 2,63 a | 0,44 | 2,20 | 3,22 | ||||
| Polish crossbreed | 18,83b | 5,75 | 7,93 | 33,72 | 4,81b | 1,62 | 3,68 | 7,05 | ||||
L*, a*, b*: colorimetric coordinates; 1tenderness expressed in Newton (N); 2visible marbling expressed in % on the total surface of the sample; 3total lipids expressed as a % of the total weight of the sample. Different letters in the same column indicate means with statistically significant differences (p < 0.05).
Table 3.
Fatty acid composition. Results are expressed as mean, standard deviation (sd), minimum and maximum value.
Table 3.
Fatty acid composition. Results are expressed as mean, standard deviation (sd), minimum and maximum value.
| Angus | Chianina | German Red Pied | Piemontese | Polish crossbreed | Holstein | |||||||||||||||||||
| mean | sd | min | max | mean | sd | min | max | mean | sd | min | max | mean | sd | min | max | mean | sd | min | max | mean | sd | min | max | |
| C14:0 | 1,81 | 0,46 | 1,39 | 2,3 | 2,11 | 0,52 | 1,59 | 2,63 | 1,27 | 0,15 | 1,13 | 1,43 | 1,91 | 0,55 | 1,37 | 2,46 | 2,17 | 0,18 | 1,96 | 2,28 | 2,64 | 0,39 | 2,2 | 2,96 |
| C14:1 | 0,37 | 0,3 | 0,18 | 0,71 | 0,45 | 0,07 | 0,4 | 0,53 | 0,25 | 0,03 | 0,22 | 0,28 | 0,49 | 0,1 | 0,38 | 0,56 | 0,33 | 0,03 | 0,31 | 0,37 | 0,36 | 0,02 | 0,35 | 0,38 |
| C15:0 | 0,44 | 0,22 | 0,27 | 0,69 | 0,7 | 0,15 | 0,54 | 0,84 | 0,44 | 0,12 | 0,34 | 0,58 | 0,43 | 0,18 | 0,23 | 0,57 | 0,33 | 0,13 | 0,24 | 0,48 | 0,45 | 0,01 | 0,44 | 0,46 |
| C15:1 | 0,17 | 0,04 | 0,14 | 0,21 | 0,26 | 0,1 | 0,19 | 0,37 | 0,16 | 0,01 | 0,15 | 0,16 | 0,17 | 0,06 | 0,11 | 0,22 | 0,15 | 0,06 | 0,11 | 0,22 | 0,16 | 0,01 | 0,15 | 0,17 |
| C16:0 | 24,3 | 1,29 | 23,4 | 25,8 | 24,7 | 4,92 | 20,6 | 30,2 | 22,7 | 1,6 | 21,3 | 24,5 | 25 | 2,96 | 21,8 | 27,6 | 25,4 | 2,37 | 23 | 27,7 | 25,9 | 0,54 | 25,4 | 26,4 |
| C16:1n-9 | 0,26 | 0,05 | 0,21 | 0,31 | 0,28 | 0,02 | 0,26 | 0,3 | 0,24 | 0,02 | 0,22 | 0,26 | 0,23 | 0,09 | 0,15 | 0,33 | 0,17 | 0,03 | 0,14 | 0,2 | 0,28 | 0,03 | 0,25 | 0,31 |
| C16:1n-7 | 3,21 | 0,77 | 2,71 | 4,1 | 2,96 | 0,44 | 2,46 | 3,25 | 3,09 | 0,11 | 3,03 | 3,22 | 4,29 | 0,55 | 3,7 | 4,78 | 3,13 | 0,19 | 2,99 | 3,34 | 2,82 | 0,39 | 2,44 | 3,22 |
| C17:0 | 0,97 | 0,22 | 0,82 | 1,22 | 1,26 | 0,25 | 0,97 | 1,41 | 0,93 | 0,18 | 0,76 | 1,12 | 0,75 | 0,16 | 0,57 | 0,85 | 0,69 | 0,34 | 0,44 | 1,07 | 0,79 | 0,08 | 0,7 | 0,84 |
| C17:1 | 1,11 ab | 0,18 | 0,91 | 1,23 | 1,19 ab | 0,29 | 0,96 | 1,52 | 1,62 b | 0,09 | 1,56 | 1,73 | 1,02 ab | 0,08 | 0,93 | 1,08 | 0,79 ab | 0,32 | 0,56 | 1,16 | 0,62 a | 0,09 | 0,53 | 0,71 |
| C18:0 | 15,8 | 2,41 | 13,9 | 18,5 | 18,2 | 2,04 | 16,3 | 20,4 | 14,4 | 1,16 | 13,1 | 15,1 | 12,8 | 1,21 | 11,5 | 13,9 | 12,5 | 1,62 | 11,2 | 14,4 | 16,6 | 0,77 | 15,9 | 17,4 |
| C18:1 trans | 1,19 | 0,74 | 0,51 | 1,98 | 0,96 | 0,55 | 0,32 | 1,29 | 0,83 | 0,23 | 0,57 | 1 | 0,73 | 0,15 | 0,56 | 0,83 | 0,71 | 0,24 | 0,46 | 0,93 | 1,15 | 0,4 | 0,73 | 1,53 |
| C18:1n-9 + n7 | 35,9 ab | 5,2 | 31 | 41,3 | 33,3 ab | 2,57 | 30,9 | 36 | 40 b | 3,04 | 36,5 | 42,1 | 33,5 ab | 4,53 | 30 | 38,6 | 30,5 ab | 1,87 | 29 | 32,6 | 27,7 a | 0,95 | 26,6 | 28,4 |
| C18:2n6 | 7,87 | 1,26 | 6,47 | 8,9 | 10,1 | 4,89 | 4,7 | 14,3 | 6,02 | 1,67 | 4,87 | 7,94 | 10,2 | 3,42 | 7,39 | 14 | 13,8 | 3,65 | 9,68 | 16,7 | 15,7 | 1,48 | 14,7 | 17,4 |
| C18:3n3 | 1,21 | 0,76 | 0,33 | 1,65 | 0,59 | 0,19 | 0,44 | 0,8 | 1,59 | 0,63 | 1,23 | 2,32 | 0,92 | 0,4 | 0,48 | 1,27 | 0,88 | 0,75 | 0,41 | 1,74 | 0,71 | 0,21 | 0,57 | 0,95 |
| 9c, 11t CLA | 0,28 | 0,04 | 0,24 | 0,32 | 0,24 | 0,14 | 0,12 | 0,39 | 0,22 | 0,01 | 0,21 | 0,23 | 0,21 | 0,06 | 0,16 | 0,27 | 0,15 | 0,01 | 0,14 | 0,15 | 0,34 | 0,17 | 0,15 | 0,46 |
| C20:1 | 0,23 | 0,04 | 0,18 | 0,26 | 0,23 | 0,17 | 0,12 | 0,43 | 0,22 | 0,07 | 0,15 | 0,29 | 0,18 | 0,05 | 0,13 | 0,23 | 0,13 | 0,01 | 0,12 | 0,13 | 0,12 | 0,04 | 0,1 | 0,17 |
| 20:3n6 | 0,86 | 0,14 | 0,74 | 1,02 | 0,61 | 0,03 | 0,58 | 0,64 | 0,89 | 0,39 | 0,6 | 1,33 | 1,14 | 0,52 | 0,72 | 1,73 | 1,64 | 0,99 | 0,56 | 2,49 | 0,55 | 0,12 | 0,44 | 0,67 |
| C20:4n6 | 2,62 | 1,1 | 1,83 | 3,88 | 1,57 | 0,73 | 1,03 | 2,4 | 2,43 | 1,38 | 1,38 | 3,99 | 3,73 | 2,54 | 2,13 | 6,66 | 5,56 | 3,04 | 2,34 | 8,38 | 2,56 | 0,29 | 2,25 | 2,81 |
| C20:5 n3 | 0,53 | 0,37 | 0,22 | 0,93 | 0,08 | 0,07 | 0 | 0,13 | 0,85 | 0,58 | 0,45 | 1,52 | 0,67 | 0,43 | 0,29 | 1,14 | 0,24 | 0,15 | 0,11 | 0,41 | 0,12 | 0,05 | 0,08 | 0,17 |
| C22:5n3 | 0,86 | 0,62 | 0,37 | 1,55 | 0,2 | 0,18 | 0 | 0,33 | 1,51 | 1 | 0,73 | 2,64 | 1,44 | 1,26 | 0,47 | 2,87 | 0,7 | 0,32 | 0,39 | 1,03 | 0,4 | 0,16 | 0,27 | 0,58 |
| C22:6n3 | 0,05 | 0,08 | 0 | 0,14 | 0,01 | 0,01 | 0 | 0,02 | 0,35 | 0,34 | 0,12 | 0,74 | 0,22 | 0,17 | 0,09 | 0,42 | 0,05 | 0,04 | 0 | 0,08 | 0,03 | 0,04 | 0 | 0,08 |
Different letters in the same row indicate means with statistically significant differences (p < 0.05).
Disclaimer/Publisher’s Note: The statements, opinions and data contained in all publications are solely those of the individual author(s) and contributor(s) and not of MDPI and/or the editor(s). MDPI and/or the editor(s) disclaim responsibility for any injury to people or property resulting from any ideas, methods, instructions or products referred to in the content. |
© 2025 by the authors. Licensee MDPI, Basel, Switzerland. This article is an open access article distributed under the terms and conditions of the Creative Commons Attribution (CC BY) license (http://creativecommons.org/licenses/by/4.0/).
Copyright: This open access article is published under a Creative Commons CC BY 4.0 license, which permit the free download, distribution, and reuse, provided that the author and preprint are cited in any reuse.


