
Submitted:
19 September 2025
Posted:
19 September 2025
You are already at the latest version
Abstract
In this work, a protocol for rice yield data management was established, comprising phases and routines for data collection, cleansing, calibration, homogenization, filtering, analysis, and visualization. Establishment of a protocol was found necessary, considering the different data sources, conditions, regulations, methods, and units employed each time for monitoring rice yield. The data were collected from yield monitors mounted on harvesters, covering extensive cultivated areas in the Axios River Plain, Greece, over a period of eight years. The data were stored, processed, and analyzed within a geographic information system (GIS), while the resulting enhanced yield maps were communicated to the farmers through a farm management information system (FMIS) available on the web. Analysis of the yield data indicates higher yields -both in production and monetary terms- in those rice farms where site-specific fertilization was applied, compared to the farms with conventional, uniform fertilization. The resulting protocol has become a functional part of a commercial precision agriculture service.
Keywords:
yield monitors
; precision agriculture
; rice yield
1. Introduction
Traditionally, crop yield was monitored very coarsely using volume or weight measurements when the commodity was delivered to the buyer—for example, a weighed wagon or truckload at delivery. Over time, the measurement systems have transitioned from volume-based to weight-based. Currently, yield monitors estimate the flow of the commodity through a harvester and merge this information with other sensor data, such as GPS and moisture content, to compute yield (Figure 1) [Fulton et al., 2017].
Presently, yield monitoring systems are available for grains (such as corn, wheat, and oats), soybeans, cotton, and sugarcane. For several other crops—such as peanuts, potatoes, forages, and fruits—yield monitoring systems are still in the experimental stage [Fulton et al., 2017]. The yield monitoring market segment accounted for the largest share of the precision agriculture industry, representing over 42% in 2024.
Precision agriculture is defined as a management practice that meets crop needs through differential applications based on location, time, and processes [Karydas, 2025]. A key benefit of site-specific management techniques -such as adjusting seed rates, pesticide applications, fertilizers, and tillage as a field is worked- is knowing the precise yield at every location [Johannsen et al., 2005]. Site-specific fertilization can lead to a more efficient use of nutrients, potentially reducing nutrient runoff and greenhouse gas emissions. This is an increasingly important topic in modern agriculture.
Yield monitors record the mass of harvested grain and the area from which it was harvested. However, the area is not fixed and depends on header width and harvester speed. The overall accuracy of the calculated yield depends on how well the moisture and mass or volume sensors are calibrated, as well as the accuracy of the differential global positioning system (DGPS) receiver.
Yield monitors enable not only mapping and estimating yield but also provide valuable information for a variety of management purposes, including (Fulton et al., 2019):
- Estimation of the amount of nutrients removed by the harvested crop.
- Estimation of profitability [Lambert and Lowenberg-DeBoer, 2000].
- Delineation of management zones.
- Analysis of the impacts of different experimental treatments.
- Evidence provision to a farmer in terms of scientific data as a backed proof for low-yielding zones notified from before by the farmer [Tsouvalis et al. 2000].
However, to ensure sensor accuracy, routine checks and calibrations before harvest are necessary. These include visual inspections to detect equipment damage or obstructions, sensor tests to verify accurate moisture level detection, and calibration to synchronize yield monitor data with actual moisture content and correctly recorded header swath, especially when changes occur during harvest. Proper inspection and calibration maintain yield data consistency and accuracy.
Despite these measures, uncertainties in yield data derived from harvesters remain significant [Lyle et al. 2019]. Therefore, additional data sources -such as harvest weighing and remote sensing- become necessary to extract reliable information on yield performance, either at the field scale or site-specifically. Moreover, several geospatial techniques may be required to remove artifacts from the yield data set.
The overall aim of this work was to establish a protocol for comprehensive rice yield data management. More specific objectives include:
- Identifying all possible sources of rice yield data, e.g., yield monitors, field measurements, remote sensing, institutional reports, etc.
- Assessing the reliability and accuracy of rice yield data from harvesters.
- Exploring the necessity for post-processing rice yield data from harvesters, including cleansing, homogenization, calibration, etc.
- Homogenizing rice yield data derived from different harvesters to enable comparisons between fields and across years.
2. Study Area
The study area is located in the Axios River Plain, Greece, where rice has been cultivated since classical times [Sallare, 1993]. The fields are well distributed, mainly throughout the eastern part of the plain, covering every year an extent of about 750 hectares, with the majority belonging to eight different rice farmers (Figure 1).
The Axios River Plain, a low-lying coastal area of 22,400 hectares, is the main rice production zone in Greece. The climate of the area is typically Mediterranean, with temperate summers suitable for rice cultivation—even for indica-type genotypes. The mean annual precipitation and temperature are 440 mm and 15.8 °C, respectively [Hijmans et al., 2005; Fick et al., 2017], while the mean annual reference evapotranspiration is 1,040 mm [Allen et al., 2005; Aschonitis et al., 2017].
The area is irrigated from the Axios River dam. Water is supplied to the fields through an open and extensive collective irrigation network, while drainage is managed through a network that discharges water into the Thermaikos Gulf using pump stations.
The alluvial soils of the plain are mostly silty clay, poorly drained soils classified as Typic Xerofluvents [NAGREF 2003], i.e., recent floodplain soils developed under Mediterranean climatic conditions (moist cold winters and dry warm summers) (USDA 1999). Recent experiments conducted by Litskas et al. (2014) have indicated that salinity levels are quite low to imply any soil degradation hazard. This fact can be attributed to the good drainage of the soils and thus the adequate performance of regional water management.
The local cropping system includes rice as monocrop, with 1/4 of the area rotated with maize, alfalfa, or cotton. Sowing is carried out in mid-May, while harvesting is carried out in late September to early October, depending on grain moisture levels (which must be between 19% and 21%). The plain produces an average yield of 10 t/ha, the highest recorded in Greece, with the official national yield average at 8.89 t/ha [Ricepedia 2017], or even lower (7.70 t/ha) according to the Joint Research Centre reports [JRC/MARS, 2024].
3. Data and Methods
The protocol for the rice yield data management was shaped gradually over the years; harvesting in Greece takes place during autumn.
A series of geospatial function types were followed consistently every year; specifically: a) data collection, b) data ingestion, c) data corrections, d) data transformations, e) data merging, f) data conversion, g) data unification, h) data enhancement, i) data calibration, j) data exploration, k) data classification, and l) data display. These function types can be found in different steps through the overall management, either in the data preprocessing or the data analysis phase.
3.1. Data Preprocessing
The rice yield data were recorded by four different types of yield monitors mounted on harvesters, namely: a Claas 600, a Claas Lexion 8700 TT, a John Deere S7-70, and a New Holland.
Then, the recorded data were extracted from the yield monitors in shapefile format, either by exporting the data files from the harvester’s computer to a USB memory, or by downloading the files directly from the respective vendors’ web platforms. Subsequently, the data sets were imported field by field into the study’s GIS.
Some of the recorded yield layers were projected in the WGS84 coordinate system, while others had no defined projection (reported as using an "unknown system"). In all cases, the yield layers were ultimately projected to the WGS84 system; having in a GIS all spatial layers projected to a single coordinate system is a prerequisite for spatial comparisons and other geospatial functionalities.
Upon visualization of the data set in the GIS, it was observed that some yield measurements were recorded as point-type data, while others were polygon-type data. The polygon-type data covered almost the entire surface with quasi-equally sized parallelograms of about 50 m2 each; whereas the point data consisted of continuous recordings along the harvesters’ routes, with points spaced approximately one meter apart along each route and about 7 meters apart between the routes (Figure 2).
The overall arrangement and level of detail of each yield data set, however, depended on the industrial standards of each yield monitor and the specific task setup. As it was evident, the regular arrangement (both for point and polygon type measurements) was disrupted whenever harvesters performed irregular maneuvers, turns, or changes in speed.
In the case of polygon-type yield data, the layers were first repaired for geometry errors, a necessary step before further processing. Many polygon layers exhibited self-intersections and similar topological errors in many of their features. In addition to that, the features smaller than 30 m2 were filtered as unrealistic measurements, i.e., they were considered as noise. In most cases, after clearing the noisy features, the yield values would fit to a quasi-normal frequency distribution pattern (Figure 3).
From the different yield data layers inserted into the study’s GIS, it became apparent that, in several cases, the yield monitors were not switched off during transitions from field to field. As a result, they recorded numerous zero values during their movement out of the fields.
In addition to these zero values, many abnormally high yield values were also observed (e.g. 249010 t/ha), which would violate the true yield data. Therefore, the removal of these abnormal values was found to be essential for further data processing and analysis.
Such abnormal values would typically be filtered out by yield monitor systems onboard harvesters for visualization purposes, i.e., for yield maps displayed on the monitor. However, these values were retained in the numerical files exported or downloaded from the monitoring systems.
Specific thresholds in order to exclude abnormally high values within the GIS -and thus approximate a quasi-normal distribution- were determined through a trial-and-error approach. As a general rule, an upper threshold was set at 20 tonnes per hectare (t/ha). Noticeably, the removal of abnormally high values in the polygon-type yield data had already been accomplished -at least, partially- by the small features filtering (i.e., those less than 30 square meters) applied previously.
3.2. Data Analysis
The cleared homogenized point-grid data of every year were converted to raster yield maps using the Inverse Distance Weighted (IDW) interpolation. Then, the yield surfaces were calibrated according to the available weighing data per field, derived from the farmers’ in-situ records (Figure 4).
The discrepancies in the yield data recorded by the yield monitors from in-situ weighting data ranged from 3.4% to 9.3% each year; the minimum value was 0.7% and the maximum value was 27.8%. This was expected as an effect of lack or insufficient calibration of the yield monitors for cultivar or seed humidity prior to recording.
Descriptive statistics were calculated both as a whole and per farmers’ group; three groups were identified:
- i.
- one implementing precision fertilization in Axios River Plain (denoted as PrecAg);
- ii.
- another non-implementing precision fertilization in Axios River Plain (denoted as Non-PrecAg), and
- iii.
- the generic group of rice farmers all over Greece, as reported by JRC/MARS (denoted as JRC).
For the first two groups, the yield figures were derived from yield monitors mounted on harvesters, whereas for the generic group (JRC), the yield figures were estimated using indirect methods (remote sensing and local reporting). It must be noted, though, that the spatio-temporal range of available data was different for the various groups: 185 hectares on average were available for the PrecAg group collected in the period 2017-24, 750 hectares on average for the Non-PrecAg group collected in the period 2020-24, and 25,000 hectares on average for the JRC group collected in the period 2014-24 (Table 1).
From the yield figures, it can be understood that for the period 2020-24 (when data were available for all the studied groups), the average yield for the PrecAg group was 9.87 t/ha, steadily higher than the average yield of the Non-PreAg group (9.11 t/ha), and the average yield of the JRC group (7.68 t/ha). Although reasoning for these differences is out of scope of this study, the significance of the observation -i.e., that the precision fertilization applications resulted in higher yields than the conventional fertilization applications- cannot be neglected [Karydas et al. 2025] (Figure 5).
Heterogeneity analysis was performed at the within-field scale for the two first farmer groups (PrecAg group vs. Non-PrecAg group) per year; that was not possible for the JRC-group, considering that the data of this group were not available per field. Τhe coefficient of variation (CV) was used as a standardized measure of heterogeneity degree at the field scale (or global variance).
For the PrecAg group, the CV was ranging from 6.1% to 15.4%, with an average 8.6% for the entire period from 2017 to 2024. The minimum within-field heterogeneity was 0.7% and was observed in 2024, whereas the maximum one was 47.9% and was observed in 2023. For the Non-PrecAg group, the CV was by about 14% higher than the PrecAg group, i.e., about 9.8% .
A methodology appropriate for detecting local variance (in contrast to the global variance) in raster surfaces is segmentation. Segmentation is defined as the process of surface division into spatially continuous, disjoint, and homogeneous regions, called objects [Blaschke 2010].
Using segmentation, the within-zone variation can be minimized, while at the same time the between-zone variation is maximized, thus indicating the optimal scale for management zone delineation within a precision agriculture framework. Karydas (2019) developed a methodology for optimal scales selection in raster data using fractal geometry, which was tested both to image and non-image data sets [Karydas and Jiang 2020].
In order to segment the yearly yield data, the Segment Mean Shift segmentation algorithm -embedded in ArcGIS- was used. Segment Mean Shift is a non-statistical method, grouping neighboring pixels into objects based on spectral similarity and spatial proximity. Spectral detail refers to the sensitivity to differences in pixel values (the “color” or “feature space” distance); whereas, spatial detail refers to the influence of pixel location and proximity (the “image space” distance) [ArcGIS 2023].
The the following parameterization was followed for the segmentation of rice yield surface raster data set of Axios Plain (Figure 6):
- i.
- Spectral detail=10;
- ii.
- Spatial detail=15;
- iii.
- Minimum segment size=20 pixels
The above parameters are only indicative, having been determined through a trial-and-error approach. They may seem appropriate for the specific yield data set, but they may not be for another; thus, they could be altered for a different case-study.
The segmentation maps of every year may be used for visual identification of the heterogeneity degree of the rice fields; and thus, assisti in delineating new -or updating pre-existing- management zones for the forthcoming precision agriculture applications. At least, they may assist in further exploration of heterogeneity sources, i.e., support variability interpretation.
Using the cleared point-grid yield data (i.e., those from which raster yield surfaces were created), the spatial autocorrelation for the entire data set was examined, using the Moran's Index as a metric. The examination resulted in a clearly clustered pattern (Moran's Index: 0,542528). Similar results were taken also for narrower geographic scales (i.e., for parts of the study fields); for example, a sub-area indicated by the 1/4 and the 1/28 of the entire study area resulted in similar clustered patterns (Moran's Index: 0,600178 and 0,750476, respectively).
Since 2022, the cleared, calibrated yield maps have been regularly communicated to the farmers for precision agriculture purposes, through a cloud-based farm management information platform (FMIS), namely ifarma [Paraforos et al., 2017]. The data in ifarma are displayed in terms of classified maps using the equal interval algorithm (Figure 7).
The functionalities of the platform for yield maps display -together with other map types, such as soil, nutrient needs, and satellite monitoring-, has been embedded into ifarma as a discrete module, operating autonomously, while the registered user has the possibility to take advantage of the overall facilities provided by ifarma [Karydas et al., 2023].
4. Results
The standardization of rice yield management in this work resulted in a clear and strict protocol, which comprises distinct descriptors for each of the various sub-processes and concepts.
In an information retrieval system, a descriptor is a word or a characteristic feature used to identify an item (such as a subject or document) [Cambridge University Press & Assessment, 2025]. An Information Retrieval System (IRS) is designed to help users search, retrieve, and rank relevant data from large datasets; these systems are widely used in enterprise solutions among others [ML Journey, 2025].
In the current protocol, each of the descriptors corresponds to a specific sub-process or phase of rice yield data management; specifically to: a) data organization, b) data enhancement, c) data homogenization, d) data analysis, and e) data visualization.
The major part of the descriptors comprise geospatial functions conducted within a GIS environment; ArcGIS was employed for this work. Five descriptors were defined according to the functions conducted throughout the entire data management procedure:
- a)
- DATA ORGANIZATION DESCRIPTOR, which serves a set of functions for data collection from the various rice yield monitors, their ingestion in a common geodatabase, and their projection to WGS84.
- b)
- DATA CURATION DESCRIPTOR, which serves a set of functions for geometry repair of rice yield data and cleansing them from various outliers and abnormal values, through spatial filtering.
- c)
- DATA HOMOGENIZATION DESCRIPTOR, which serves a set of functions for data conversion from polygon to point type, layer merging and unification, unit conversion into a single one (t/ha), transformation of the irregular point grids into regular ones (5x5m), their final transformation into raster layers with IDW interpolation, and their calibration with in-situ weighting records.
- d)
- DATA ANALYSIS DESCRIPTOR, which serves a set of functions for exploring data through descriptive stats and autocorrelation, calculated from the vector data and yield surface segmentation calculated from the raster data.
- e)
- DATA VISUALIZATION DESCRIPTOR, which serves a set of functions for displaying yield data in raster format -either original or classified- within the GIS and in vector format after transferring to the ifarma platform.

Table 2.
The entire set of the protocol descriptors related to the different phases, data types, GIS commands, and parameters.
Table 2.
The entire set of the protocol descriptors related to the different phases, data types, GIS commands, and parameters.
| Nr | DESCRIPTOR | Function | Layers | Data Type | Commands | Parameters |
|---|---|---|---|---|---|---|
| 1 | ORGANIZATION | Collection | YIELD(s) | POINT/POLYGON | Copy/Download | From yield monitors |
| 2 | Ingestion | YIELD(s) | POINT/POLYGON | Add Data | ||
| 3 | Transformation | YIELD(s) | POINT/POLYGON | Project | WGS84 [WKID=32634] | |
| 4 | CURATION | Correction | YIELD(s) | POLYGON | Repair Geometry | Esri |
| 5 | Correction | YIELD(s) | POLYGON | Add Field | AREA[m2] | |
| 6 | Correction | YIELD(s) | POLYGON | Select by Attributes | AREA<30m2 | |
| 7 | Correction | YIELD(s) | POLYGON | Delete Selected | ||
| 8 | HOMOGENIZATION | Transformation | YIELD(s) | POLYGON | Feature to Point | Inside |
| 9 | Merging | YIELD(s) | POINT | Merge | ||
| 10 | Conversion | YIELD | POINT | Add Field | YIELD[t/ha] | |
| 11 | Conversion | YIELD | POINT | Calculate Field | YIELD=[yield fields] | |
| 12 | Unification | YIELD | POINT | Delete Field(s) | All FIELDS except YIELD | |
| 13 | Transformation | YIELD->GRID | POINT | Spatial Join | Join one to one; Closest geodesic | |
| 14 | Enhancement | GRID/FIELDS | POINT | Select By Location | Within | |
| 15 | Enhancement | GRID | POINT | Switch Selection | ||
| 16 | Enhancement | GRID | POINT | Delete Selected | ||
| 17 | Calibration | GRID | POINT | Select by Attributes | 0<YIELD<=20 [t/ha] | |
| 18 | Transformation | GRID->SURFACE | POINT | IDW Interpolation | Output cell size=5m, Power=2, Number of Points=12 | |
| 19 | Calibration | SURFACE->MEAN | RASTER | Zonal Statistics | Mean | |
| 20 | Calibration | MEAN | RASTER | Raster Calculator | Cor-Factor=In-situ-weight/MEAN; SURFACE=Cor-Factor*SURFACE | |
| 21 | ANALYSIS | Classification | SURFACE | RASTER | Segmentation | Spectral detail=20; Spatial detail=20; Minimum segment=1pxl |
| 22 | Exploration | GRID | POINT | Descriptive Stats | ||
| 23 | Exploration | GRID | POINT | Autocorrelation | ||
| 24 | VISUALIZATION | Classification | GRID | POINT | Expoirt to CSV | To ifarma |
5. Discussion
As a result of a series of processes followed for managing yield data related to different data sources, conditions, regulations, methods, and units, a protocol was established, comprising data collection, cleansing, calibration, homogenization, filtering, analysis, and visualization.
The core of the technologies and methods of the protocol are related to a geographic information system (GIS), used as a visualization, editing, and analysis tool; while the communication of the yield maps to the farmers was conducted through a farm management information system (FMIS).
All the data used for the establishment of the protocol were real from a variety of rice fields spread in an extensive area and cultivated with different varieties. Thus, the protocol was developed and validated simultaneously.
Compared to the inherent variability of the soil and spectral properties in a specific subject of the study fields -approx. a surface of 120 hectares-, the yield variability was found significantly lower on average; specifically:
- The soil properties derived from soil sampling and interpolation, were found with a within-field variability of about 33.7% on average [Karydas et al. 2020].
- The spectral properties, derived from satellite imagery, were found with a within-field variability of about 35.3% on average [Karydas et al. 2020].
- The yield, derived from yield monitors mounted on the harvesters, was found with a within-field variability of about 8.6% on average.
The above findings indicate that in most cases farmers achieve to manage cultivation resources (soil, water, fertilizers, etc.) towards promoting uniformity of their fields, through appropriate farming practices. The clustered character of the yield recordings according to the autocorrelation findings (Moran's Index: 0,542528) is in accordance with the low variability figures.
The within-field uniformity in the cases where precision agriculture was used was found only slightly higher than where it was not used. This result combined with the fact of higher yields for precision agriculture applications (on average) indicates that precision agriculture methodologies contribute to the improvement of low- and high-performance zones equally.
The quantitative, undisputed, extensive and diachronic nature of the recorded yield data sets permitted their use as input in the development of fertilization predictive algorithms by Iatrou et el. (2022). The authors developed a rice yield prediction model using machine learning methods, based (apart from yield data) on soil data, satellite imagery, climatic data, and farming practices, thus achieving to provide rice growers with optimal N-rate recommendations through precision agriculture applications [Van Arendonk et al. 2021].
Apart from fertilization, which is the most profound parameter influencing yield, though, a number of other (known or less known) parameters influencing yield were also identified in the study area over the years, including -according to farmers’ observations and notifications [Chauhan et al. 2014, De La Cruz et al. 2020]:
- Bad tillage and tractor traces, which either compact surface soil or create crust.
- Rapidly drained or flooded locations, due to very sandy soils or ground lowering, respectively.
- Presence of several obstacles, such as electricity column or trees, which affect the passes in the nearby locations.
- Presence of birds under protection, such as flamingos, as a major part of the study area is inside a Ramsar site; these birds may destroy part of the production.
- Weed infestations.
- Spraying of weed management substances, which may affect the crop.
Tsouvalis et al. (2000) suggest that precision agriculture technology must be considered as a social process that fundamentally changes how farmers interact with their land and with external experts and not merely a matter of adoption.
While clustering and unsupervised classification of the yield data was a straight-forward method for exploration and visualization, it was not found appropriate for zone delineation. The occurrence of random high or low clusters here and there, revealed random management or application abnormalities, thus indicating non-systematic sources of variation.
Instead, segmentation was used -and generally is suggested- for the purposes of zone delineation. This method is proved to correspond better to more inherent variation factors, such as soil properties, weed infestations, or other problematic areas. Segmentation of yield data was used for refining the initial soil sampling scheme, which was based solely to satellite image patterns detected in the crop diachronically [Karydas et al. 2020].
The provision and visualization of yield data on a cloud-based platform (like ifarma) promotes farmers’ education, training, and the perceived value of precision agriculture services. The incorporation of the new protocol within a complete service by the end-user was found to be a critical factor for its success.
The protocol could expanded and enhanced by integrating farmers’ expertise and qualitative data, on issues such as:
- Tillage and compaction issues on specific areas of poor tillage.
- Irrigation problems, such as waterlogged or rapidly drained spots.
- Weed and pest outbreaks that can be correlated with low-yield spots in the yield maps.
The protocol was not the result of an autonomous process, but it was developed as a functional part of a commercial precision agriculture service [Karydas et al. 2025]. This service was designed following background research and pilot activities taking place since 2016, while it has been tested successfully under true operational conditions, with essential feedback from the farmers.
Towards further automation, the problematic sites and suspected reasoning could be integrated into the protocol in a more objective and quantitative manner, by incorporating field observations or pictures recorded in the farm management system to the ANALYSIS and VISUALIZATION descriptors.
6. Conclusion
A protocol for managing rice yield data derived from harvesters was found necessary and efficient in order to carry out all visualization, editing, and analysis procedures in order to extract rational and robust conclusions about rice cultivation in an area. The protocol is necessary, because without the suggested steps, the output could obviously be biased or even fault; and it is efficient, because the conclusions extracted are verified by different sources, farmers’ experience, and time.
This protocol follows a clear geospatial approach, with a geographic information system (GIS) at the centre of the procedural tier.
The specific aims of this work were fully accomplished, as it achieved to:
- Identify all possible sources of rice yield data; specifically rice yield monitors of different types, in situ measurements, and institutional reports based on satellite imagery and farmers’ communication.
- Assess the reliability of rice yield data recorded by harvesters as high, with an accuracy ranging between 91.7 and 96.6% yearly; only one extreme was noticed on a field basis.
- Verify the necessity for post-processing rice yield data from harvesters, including organization, curation, homogenization, analysis, and visualization.
The protocol could be further improved by incorporating farmers’ and experience in the relevant descriptors. This seems realistic if consider that the protocol has been developed as part of a precision agriculture service currently available in the market.
Acknowledgments
Cordial thanks to all the farmers who permitted the use of their data for this study: Konstantinos Kravvas, Panagiotis & Nikolaos Goutas, Petros Kipouros, Dimitrios, Fotakidis, Christos Fotakidis, Alexandros Kravvas, Periklis Kravvas, and Achilleas Kampouris.
References
- Allen, R.G.; Walter, I.A.; Elliott, R.; Howell, T.; Itenfisu, D.; Jensen, M. The ASCE Standardized Reference Evapotranspiration Equation; Final Report (ASCE-EWRI); Environmental and Water Resources Institute (EWRI)/American Society of Civil Engineers (ASCE): Reston, VA, USA, 2005. [Google Scholar]
- Arslan, S., & Colvin, T. S. (2002). Grain yield mapping: Yield sensing, yield reconstruction, and errors. Precision Agriculture, 3, 135-154.
- Aschonitis, V.G.; Papamichail, D.; Demertzi, K.; Colombani, N.; Mastrocicco, M.; Ghirardini, A.; Castaldelli, G.; Fano, E.-A. High-resolution global grids of revised Priestley-Taylor and Hargreaves-Samani coefficients for assessing ASCE-standardized reference crop evapotranspiration and solar radiation. Earth Syst. Sci. Data 2017, 9, 615–638. [Google Scholar]
- Blaschke, T. Object based image analysis for remote sensing. ISPRS J. Photogramm. Remote. Sens. 2010, 65, 2–16. [Google Scholar] [CrossRef]
- Cambridge University Press & Assessment, 2025: https://dictionary.cambridge.org/us/dictionary/english/descriptor.
- Chauhan, B. S., et al. (2014). Integrated weed management in rice cultivation. In M. S. Kang (Ed.), Handbook of Maize and Rice Production (pp. 211-236). CRC Press.
- Chrisman, N. R. (1991). Spatial data quality: from concept to application. Technical Paper 91-1. University of Washington, Department of Geography.
- De La Cruz, Salvador, J.S.M., Manalo, R.M.E., Mangaliman, R.S. (2020). Impact of bird damage on rice production: A review. Philippine Journal of Crop Science, 45(1), 1-10.
- Esri (2023). How Segment Mean Shift works. ArcGIS Pro Documentation.
- Fick, S.E.; Hijmans, R.J. WorldClim 2: New 1-km spatial resolution climate surfaces for global land areas. Int. J. Climatol. 2017, 37, 4302–4315. [Google Scholar] [CrossRef]
- Fulton, J., Hawkins, E., Taylor, R., Franzen, A. (2017). Yield Monitoring and Mapping. Chapter in Precision Agriculture Basics, Book Editor(s):D. Kent Shannon, David E. Clay, Newell R. Kitchen. ACSESS publications, Madison, 5585 Guilford Rd. WI 53711-5801, pp. 63-78. (ISBN: 978-0-89118-366-2 (print), ISBN: 978-0-89118-367-9 (online). [CrossRef]
- Hijmans, R.J.; Cameron, S.E.; Parra, J.L.; Jones, P.G.; Jarvis, A. Very high resolution interpolated climate surfaces for global land areas. Int. J. Climatol. 2005, 25, 1965–1978. [Google Scholar] [CrossRef]
- Iatrou, M.; Karydas, C.; Tseni, X.; Mourelatos, S. Representation Learning with a Variational Autoencoder for Predicting Nitrogen Requirement in Rice. Remote Sens. 2022, 14, 5978. [Google Scholar] [CrossRef]
- Johannsen, C.J.; Carter, P.G. SITE-SPECIFIC SOIL MANAGEMENT, Editor(s): Daniel Hillel, Encyclopedia of Soils in the Environment, Elsevier, 2005, Pages 497-503, ISBN 9780123485304. [CrossRef]
- Joint Research Centre/Monitoring Agriculture ResourceS (JRC/MARS), 2024; https://agri4cast.jrc.ec.europa.eu/bulletinsarchive.
- Karydas, C. G. (2019). Optimization of multi-scale segmentation of satellite imagery using fractal geometry. International Journal of Remote Sensing, 41(8), 2905–2933. [CrossRef]
- Karydas, C.; Jiang, B. Scale Optimization in Topographic and Hydrographic Feature Mapping Using Fractal Analysis. ISPRS Int. J. Geo-Inf. 2020, 9, 631. [Google Scholar] [CrossRef]
- Karydas, C.; Iatrou, M.; Iatrou, G.; Mourelatos, S. Management Zone Delineation for Site-Specific Fertilization in Rice Crop Using Multi-Temporal RapidEye Imagery. Remote Sens. 2020, 12, 2604. [Google Scholar] [CrossRef]
- Karydas, C., Chatziantoniou, M., Stamkopoulos, K., Iatrou, M., Vassiliadis, V., Mourelatos, S. (2023). Embedding a new precision agriculture service into a farm management information system - points of innovation. Smart Agricultural Technology, 4, 100175.
- Karydas, C.; Iatrou, M.; Mourelatos, S. An Innovative Process Chain for Precision Agriculture Services. Computers 2025, 14, 234. [Google Scholar] [CrossRef]
- Kharel, T., Swink, S. N., Youngerman, C., Maresma, A., Czymmek, K. J., Ketterings, Q. M., & Hubbard, V. (2018). Processing/cleaning corn silage and grain yield monitor data for standardized yield maps across farms, fields, and years. Ithaca, NY, USA: Cornell University, utrient Management Spear Program, Departmet of Animal Science. Retrieved August 19, 2020.
- Lambert, D. M., & Lowenberg-DeBoer, J. (2000). Economic analysis of site-specific management versus uniform management. Journal of Agricultural and Resource Economics, 25(1), 263-278.
- Litskas, V.D., Aschonitis, V.G., Lekakis, E.H., Antonopoulos, V.Z. (2014). Effects of land use and irrigation practices on Ca, Mg, K, Na loads in rice-based agricultural systems. Agricultural Water Management, 132(31): 30–36.
- Lyle, G.K. Johnson, B.E., Johnson, A.M H., Humburg,C. L. (2019). On-the-go data quality control for yield monitors. Transactions of the ASABE, 62(4), 939–947.
- ML Journey; Website (Last accessed 26-05-2025): https://mljourney.com/information-retrieval-system-examples/ N.AG.RE.F. (National Agriculture Research Foundation-Institute of Soil Science). Soil Map of Thessaloniki Region-Area of Gallikos and Axios Rivers; Institute of Soil Science: Thessaloniki, Greece, 2003; pp. 137–138.
- Paraforos, D.S., Vassiliadis, V., Kortenbruck, D., Stamkopoulos, K., Ziogas, V., Sapounas, A.A., Griepentrog, H.W., (2017). Multi-level automation of farm management information systems, Comput. Electron. Agric. 14, 504–514.
- Ricepedia (2017). URL: http://ricepedia.org/index.php/greece (original source: FAOSTAT) (last access: 18-January-2017).
- Sallare, R. (1993). The Ecology of the Ancient Greek World, Cornell Univ. Press, p. 23, ISBN 0801426154.
- Tsouvalis, J., Seymour, S., & Watkins, C. (2000). Exploring Knowledge-Cultures: Precision Farming, Yield Mapping, and the Expert–Farmer Interface. Environment and Planning A: Economy and Space, 32(5), 909-924. https://doi.org/10.1068/a32138 (Original work published 2000.
- Van Arendonk, J., Van,T.C., Van der Werf, W. (2021). Machine learning for crop yield prediction and nitrogen management. Frontiers in Plant Science, 12, 650519.
- Zion Market Research (2025). Website: Precision Farming Market Size, Share, Growth and Forecast 2032; URL: https://www.zionmarketresearch.com/report/precision-farming-market#:~:text=The%20yield%20monitoring%20segment%20is%20anticipated%20to%20report,landlord%20negotiations%2C%20and%20track%20records%20for%20food%20safety.
Figure 1.
The study area, located mainly in the Axios River Plain, Greece; right: the frame of the study area; left: the study fields, mainly distributed in the eastern sector of the plain.
Figure 1.
The study area, located mainly in the Axios River Plain, Greece; right: the frame of the study area; left: the study fields, mainly distributed in the eastern sector of the plain.
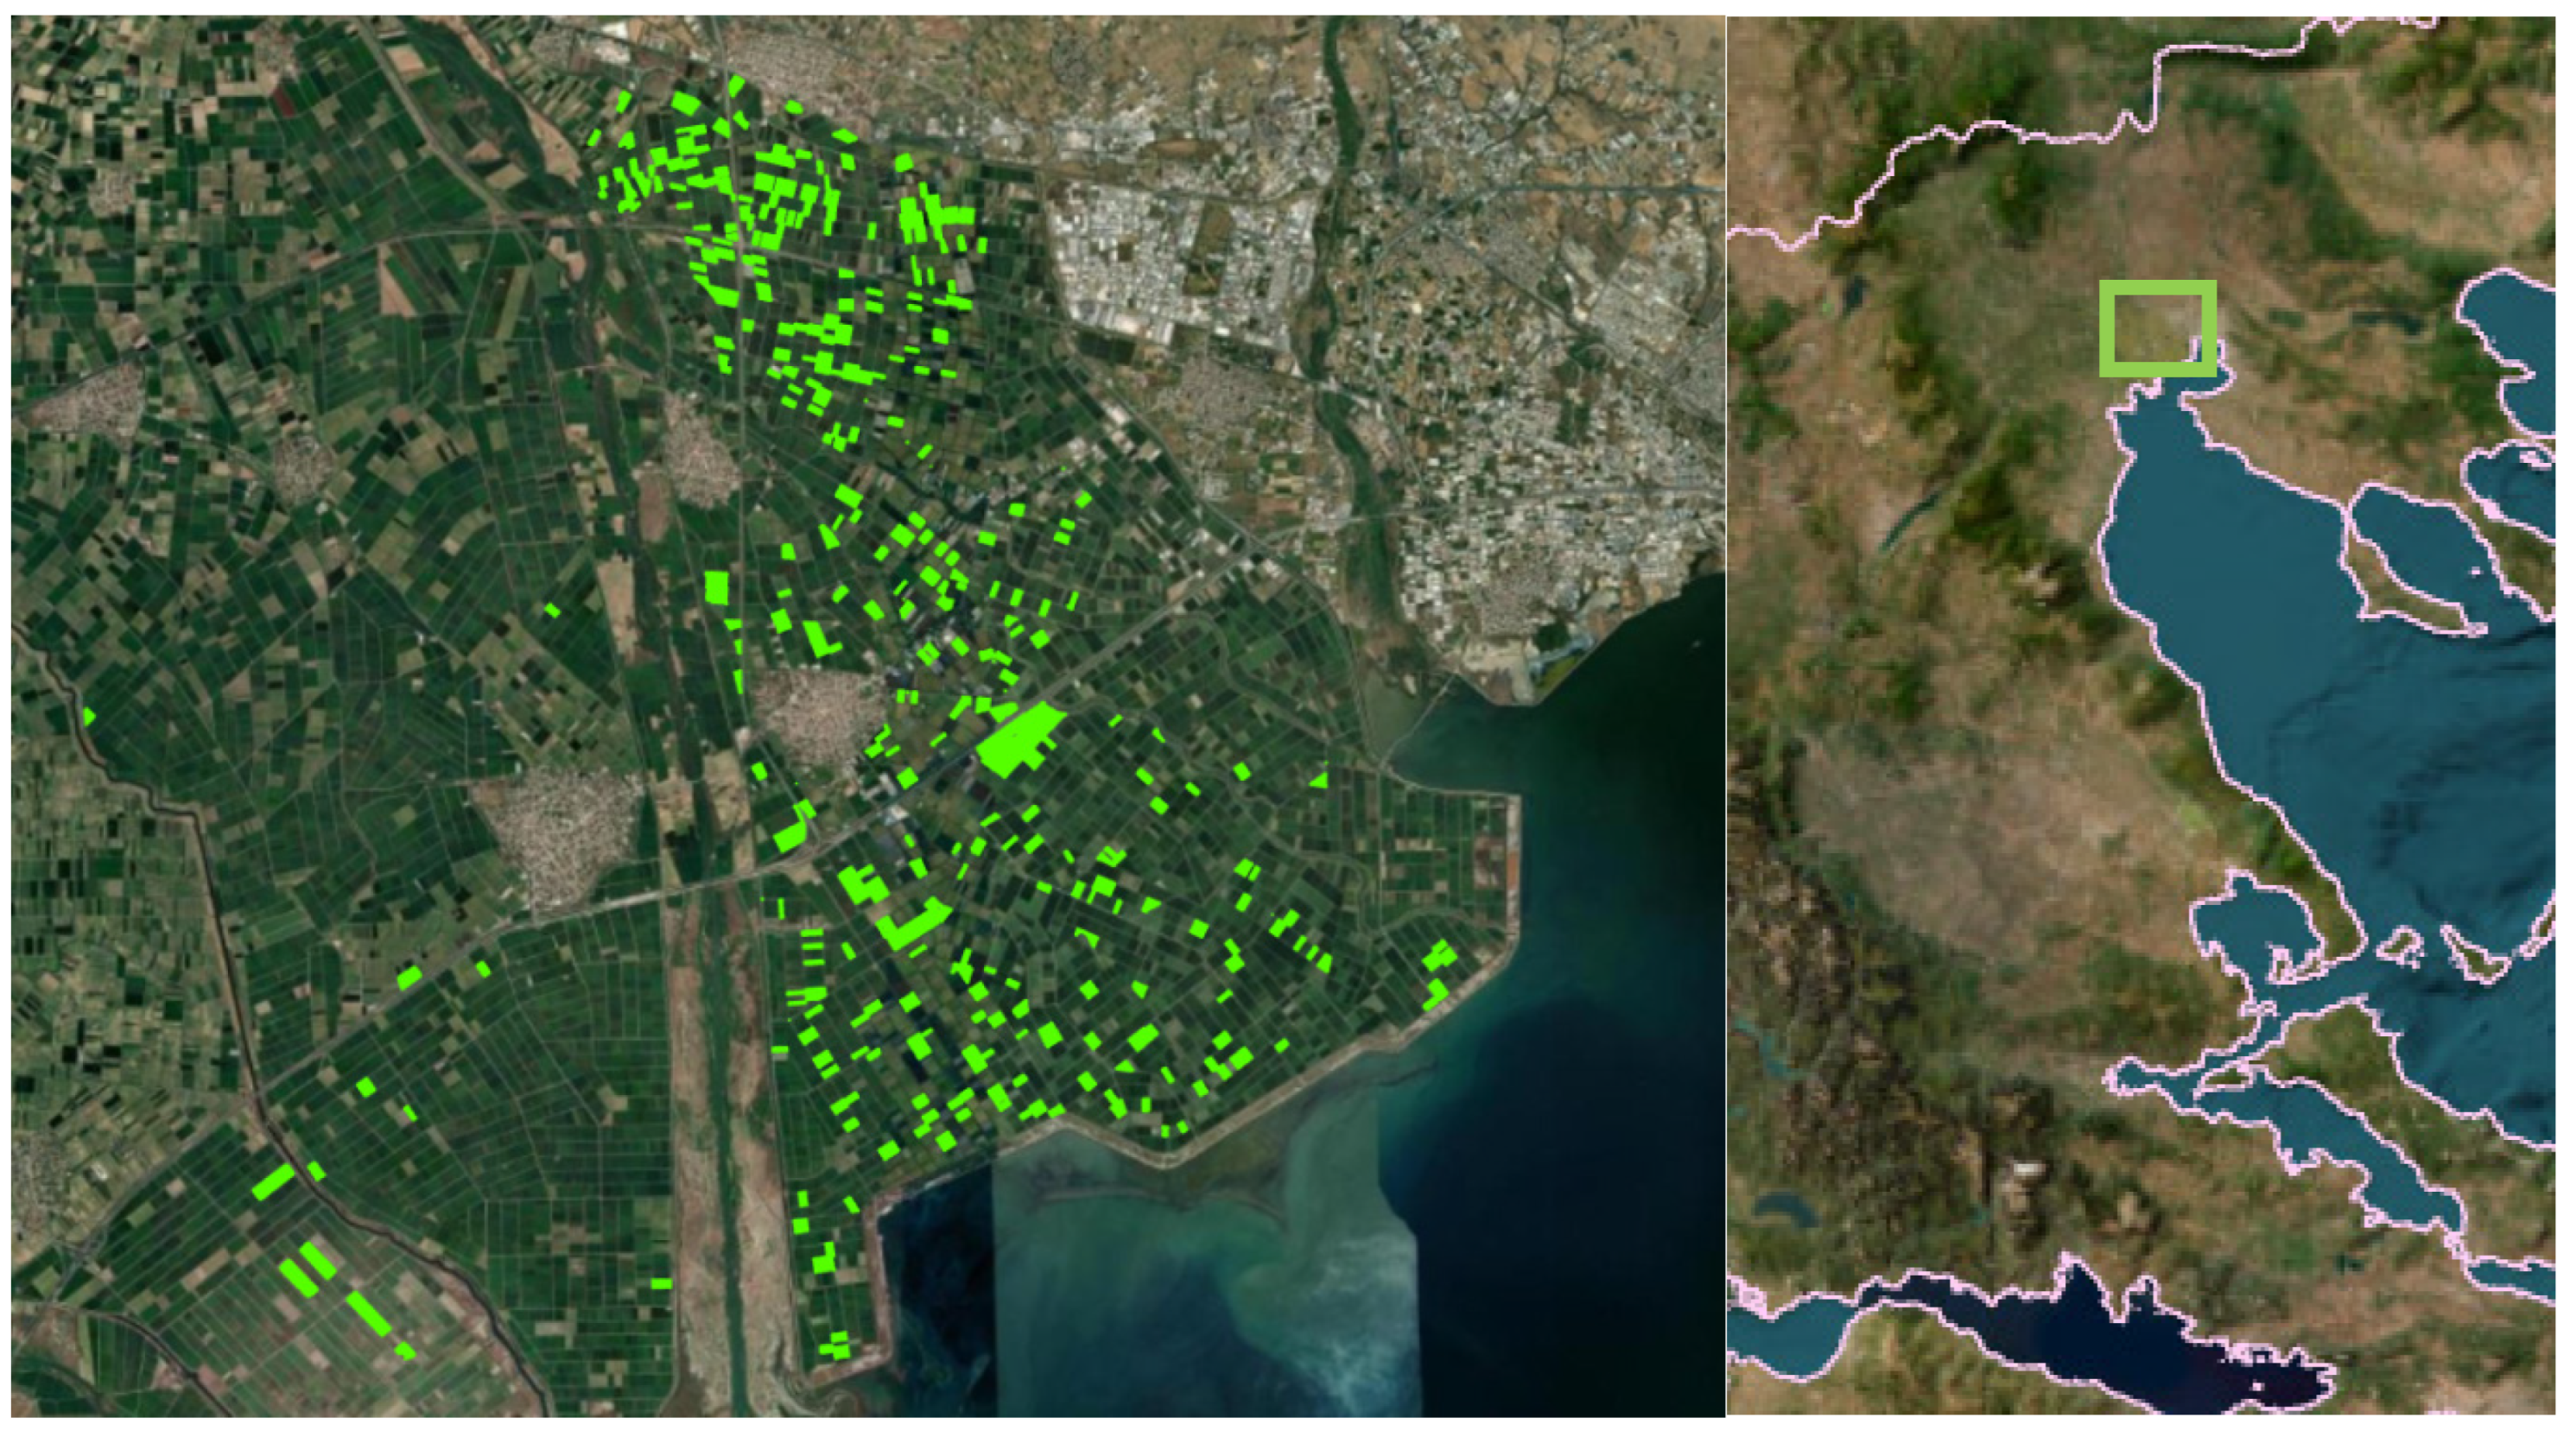
Figure 2.
Different vector data types of yield recordings after insertion into the study’s GIS; upper side: point data type; bottom side: polygon data type.
Figure 2.
Different vector data types of yield recordings after insertion into the study’s GIS; upper side: point data type; bottom side: polygon data type.
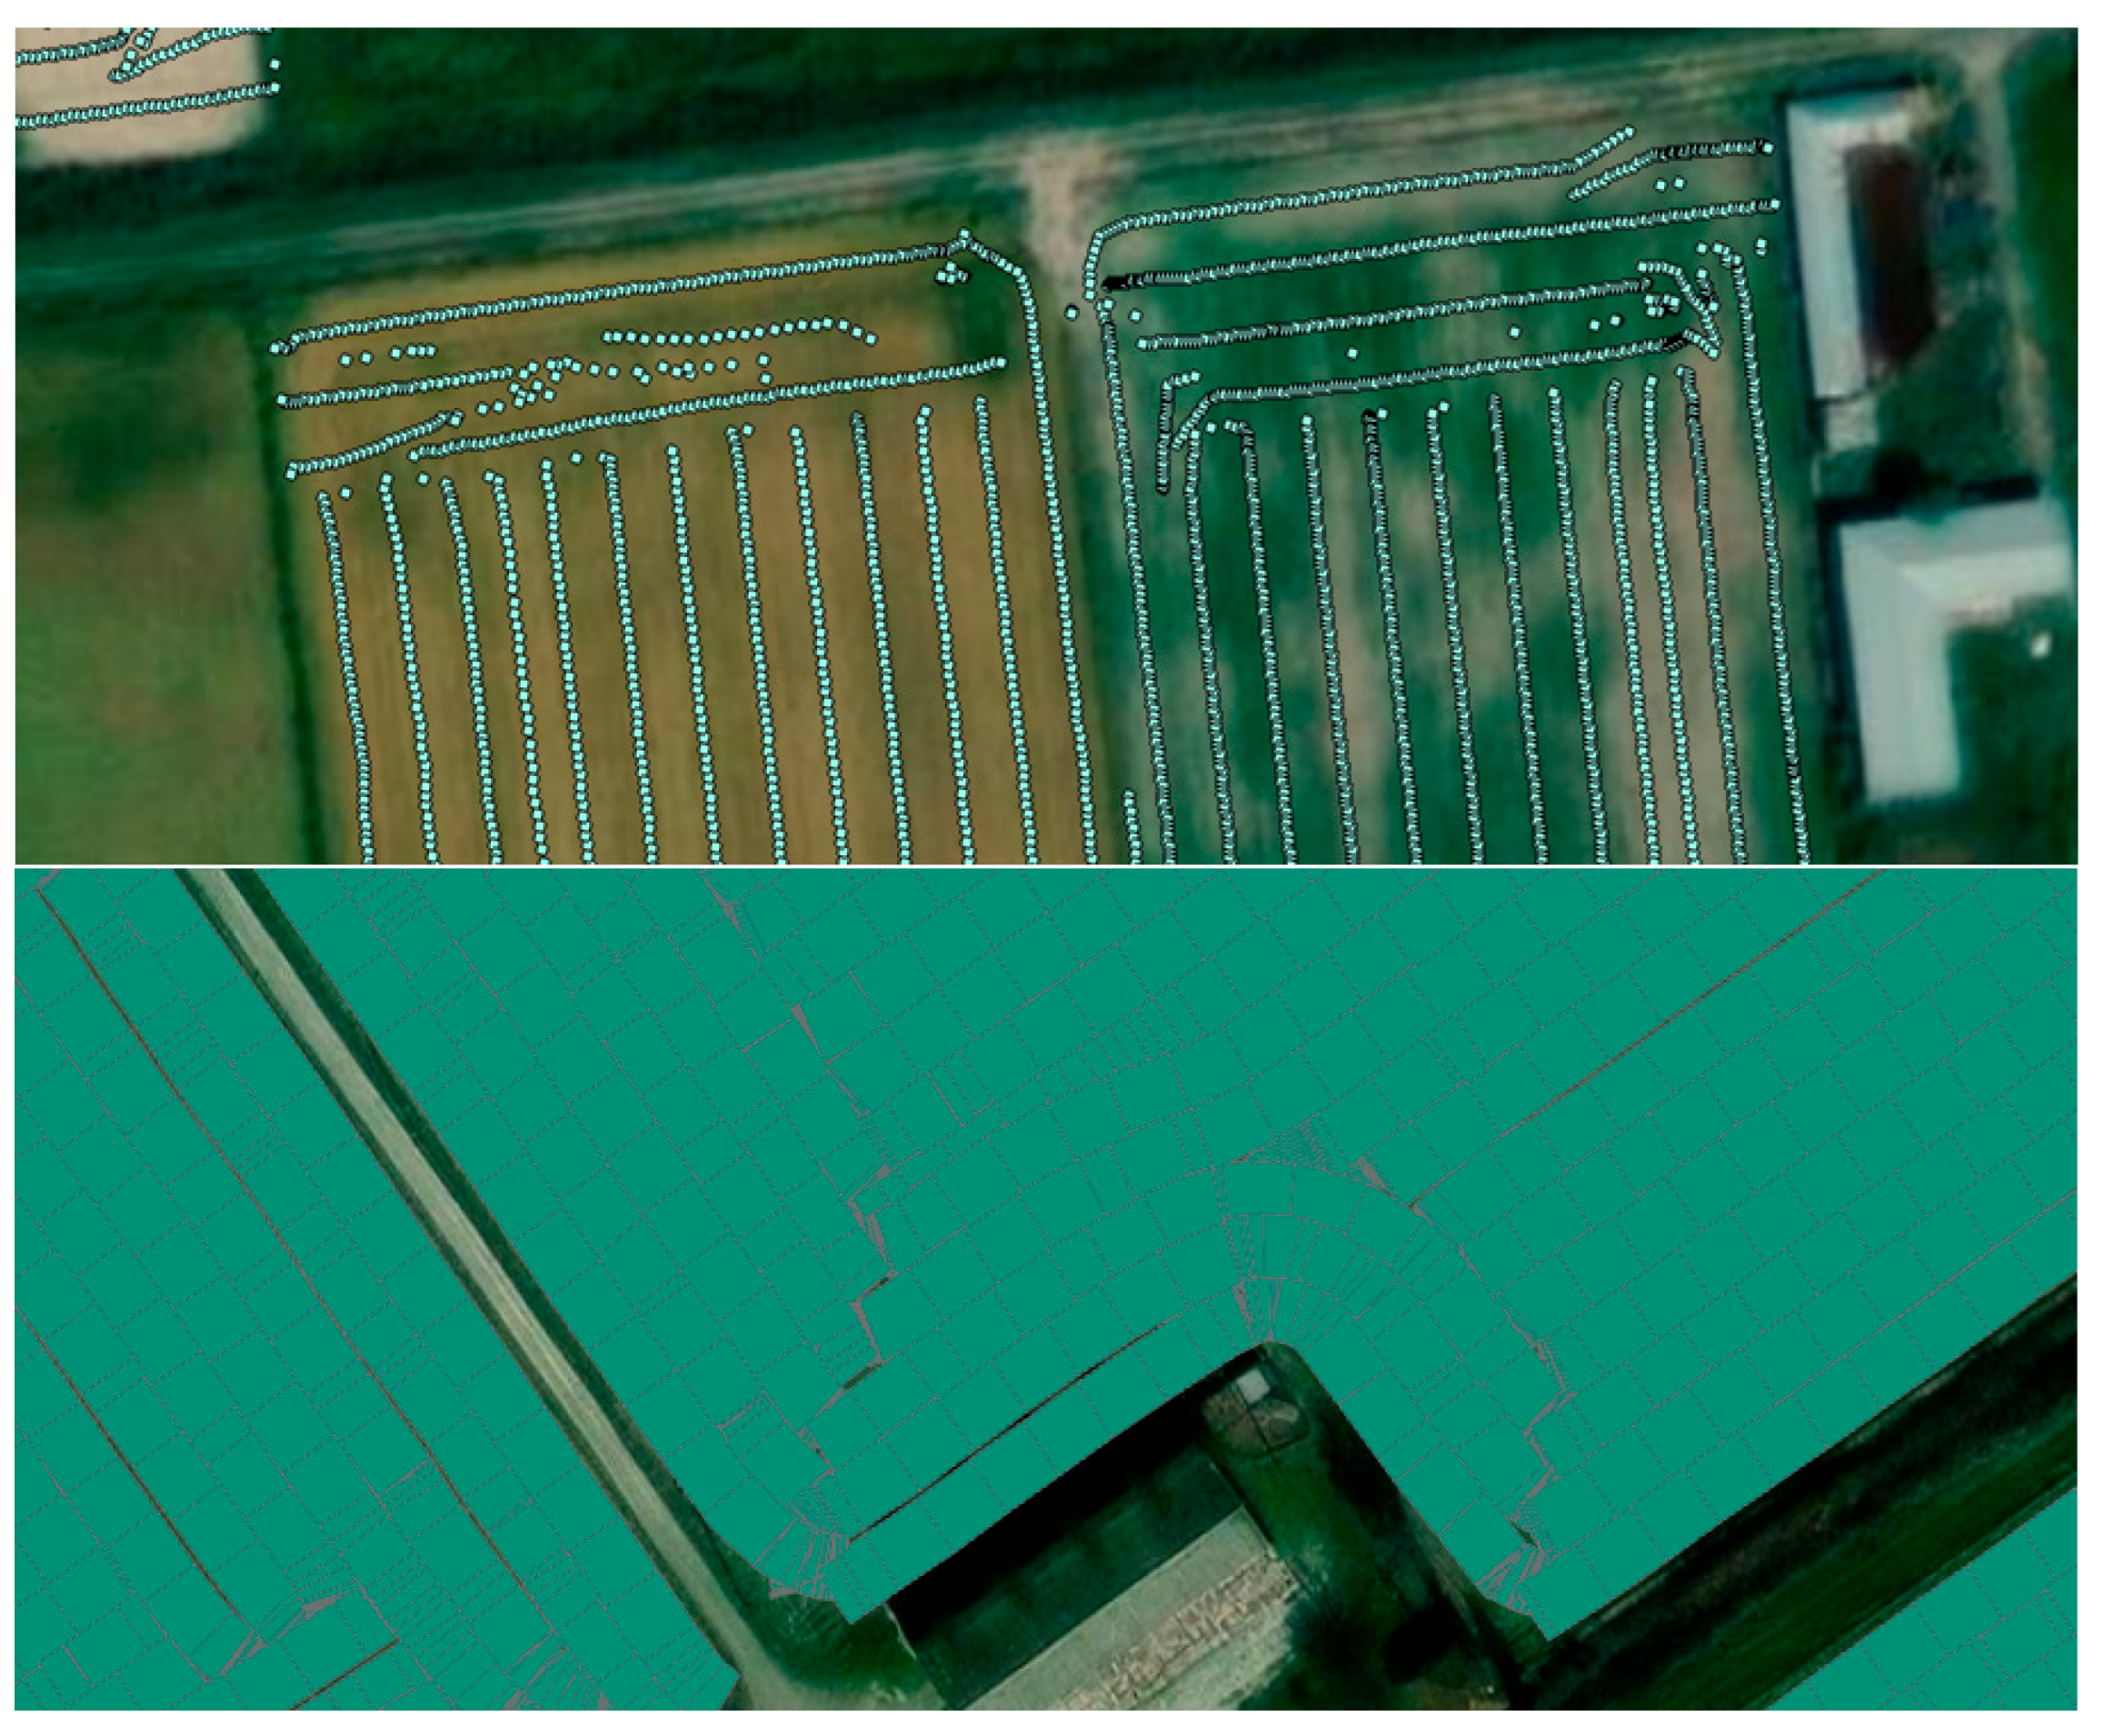
Figure 3.
Clearing of a yield data set by filtering out features smaller than 30 m2, resulting in a quasi-normal distribution pattern. Up-left: features smaller than 30 m2 are highlighted; up-right: the statistics of the original (left column) and the cleared (right column) measurements; bottom: the frequency distribution of the cleared measurements.
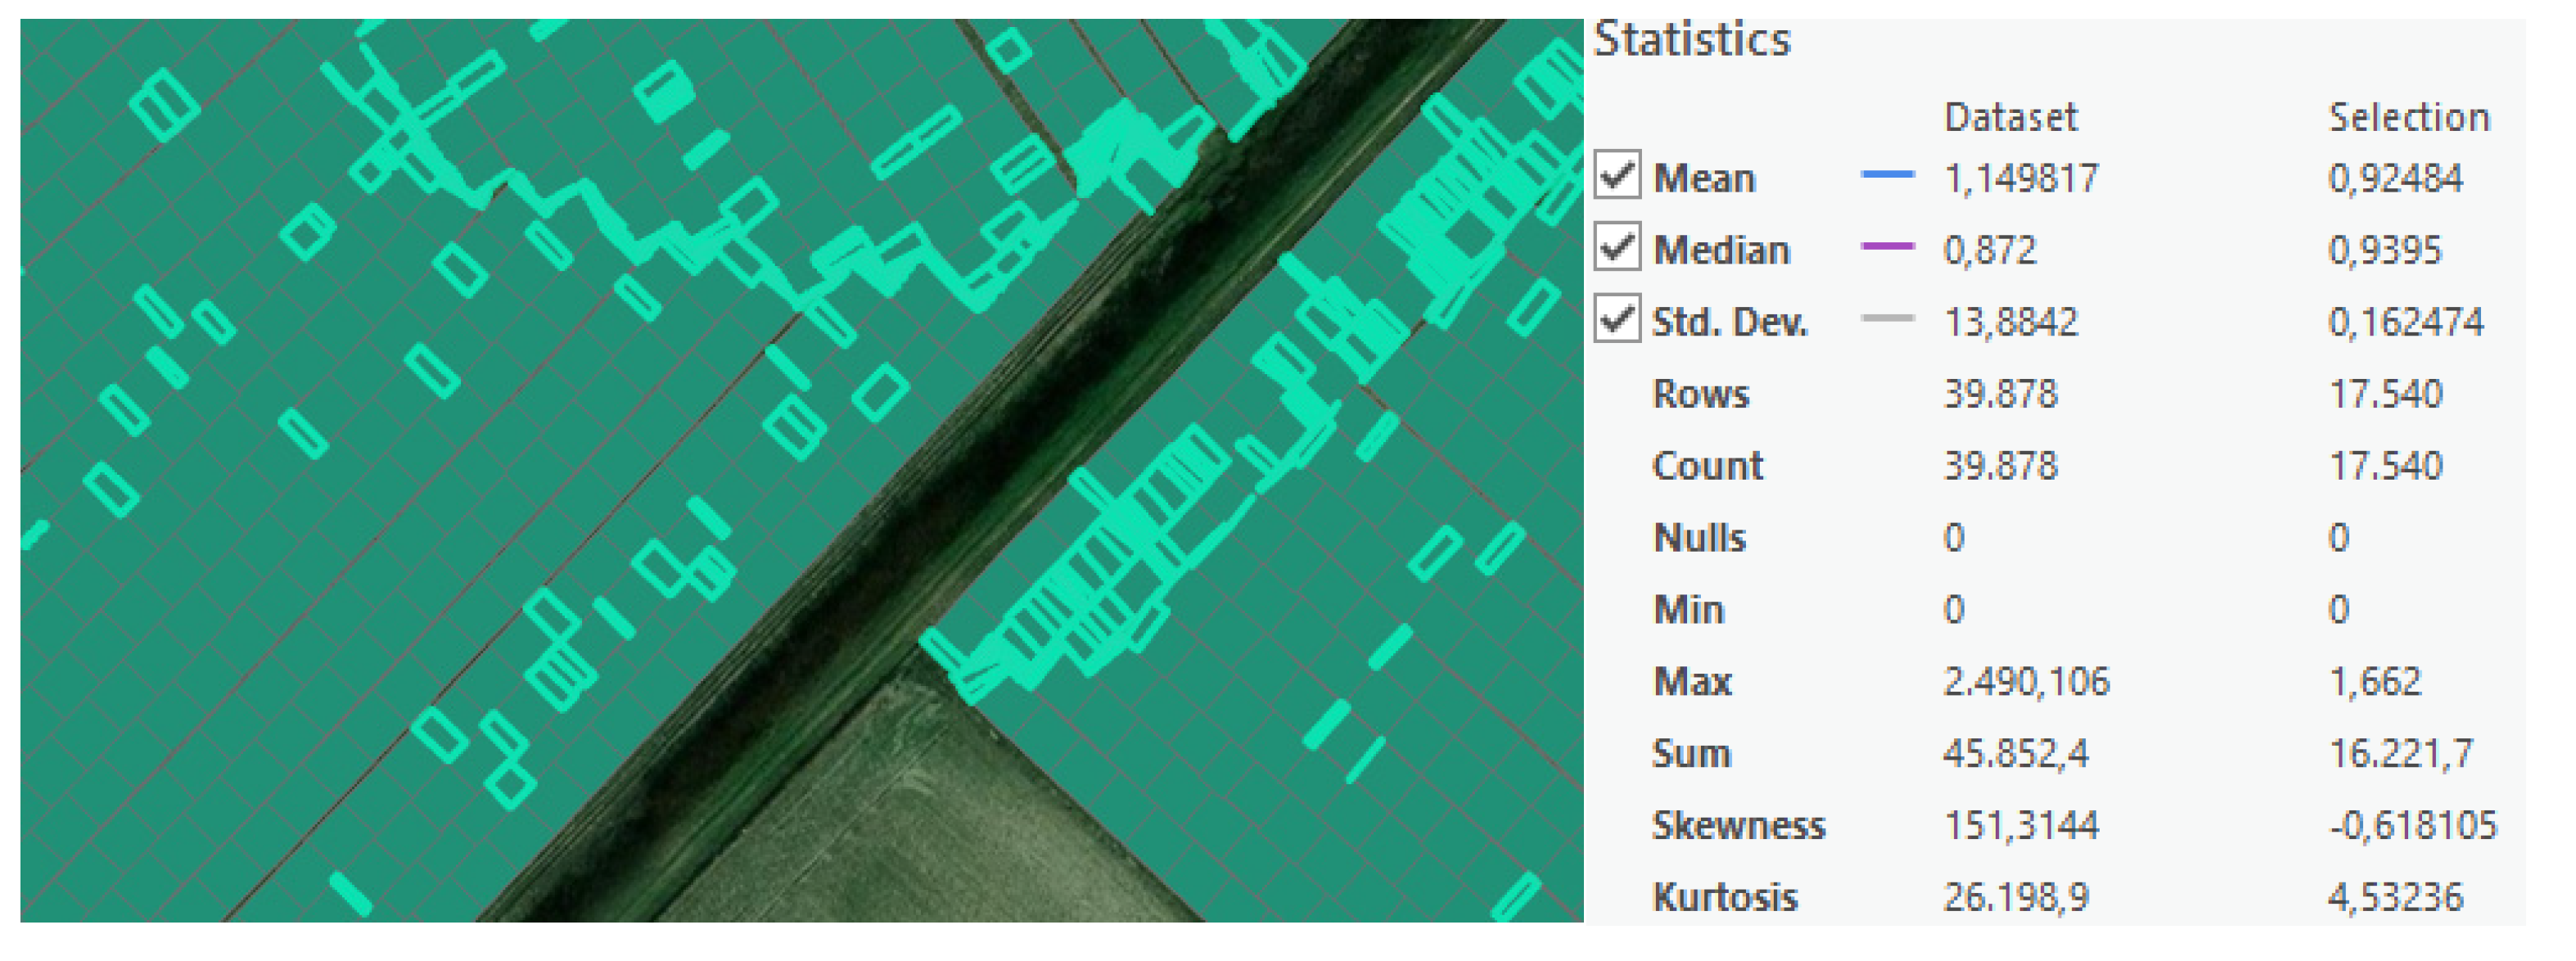
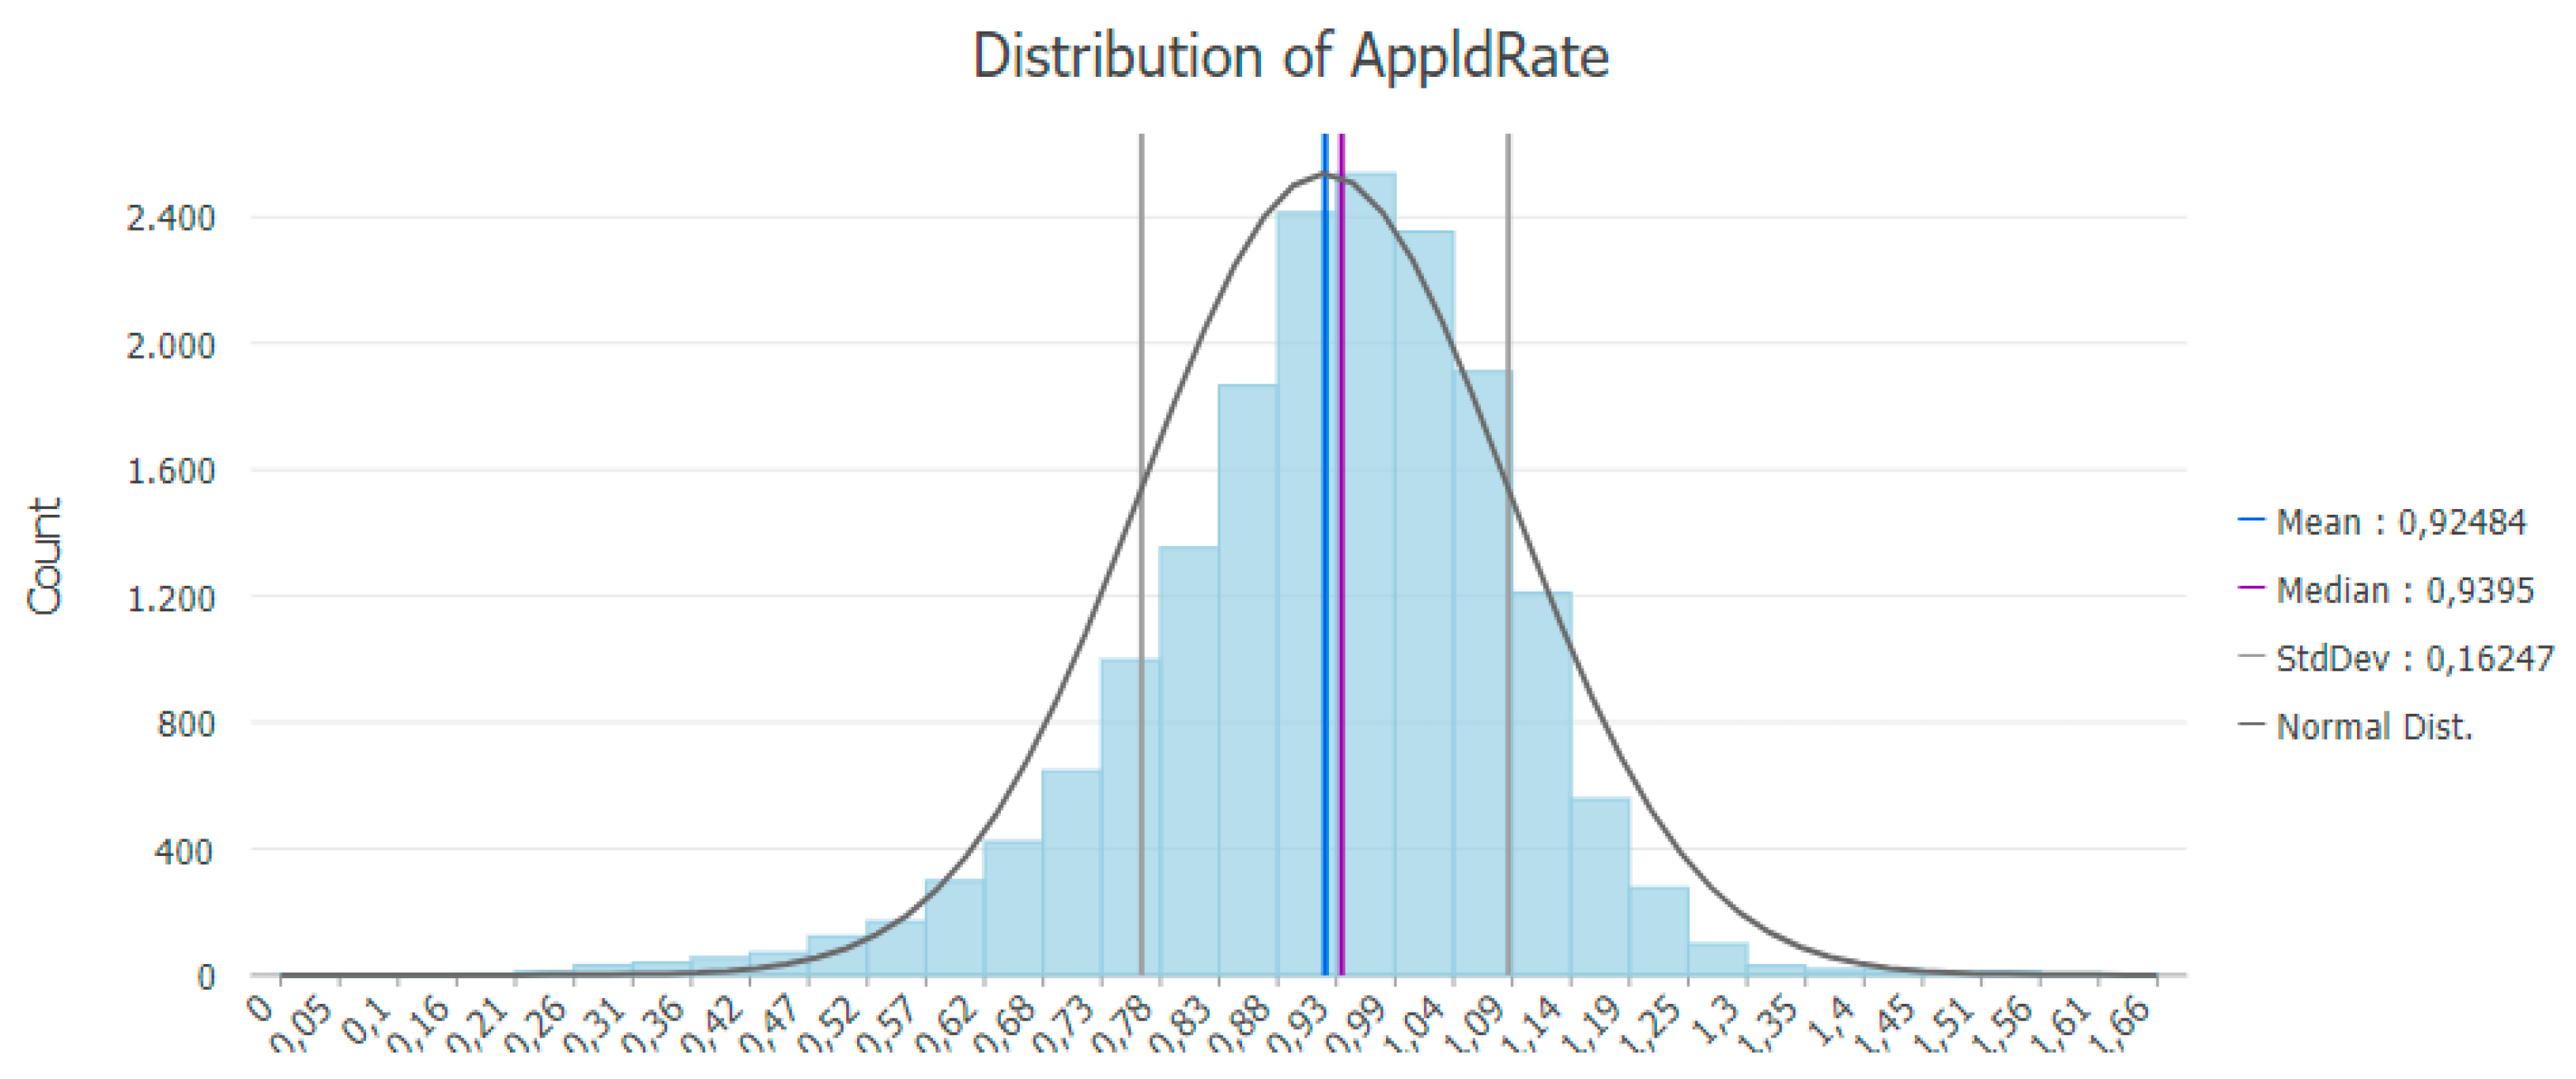
Figure 4.
Raster yield data layer, derived from the cleared point data layer, with IDW interpolation at 5 meters spatial resolution (before calibration).
Figure 4.
Raster yield data layer, derived from the cleared point data layer, with IDW interpolation at 5 meters spatial resolution (before calibration).
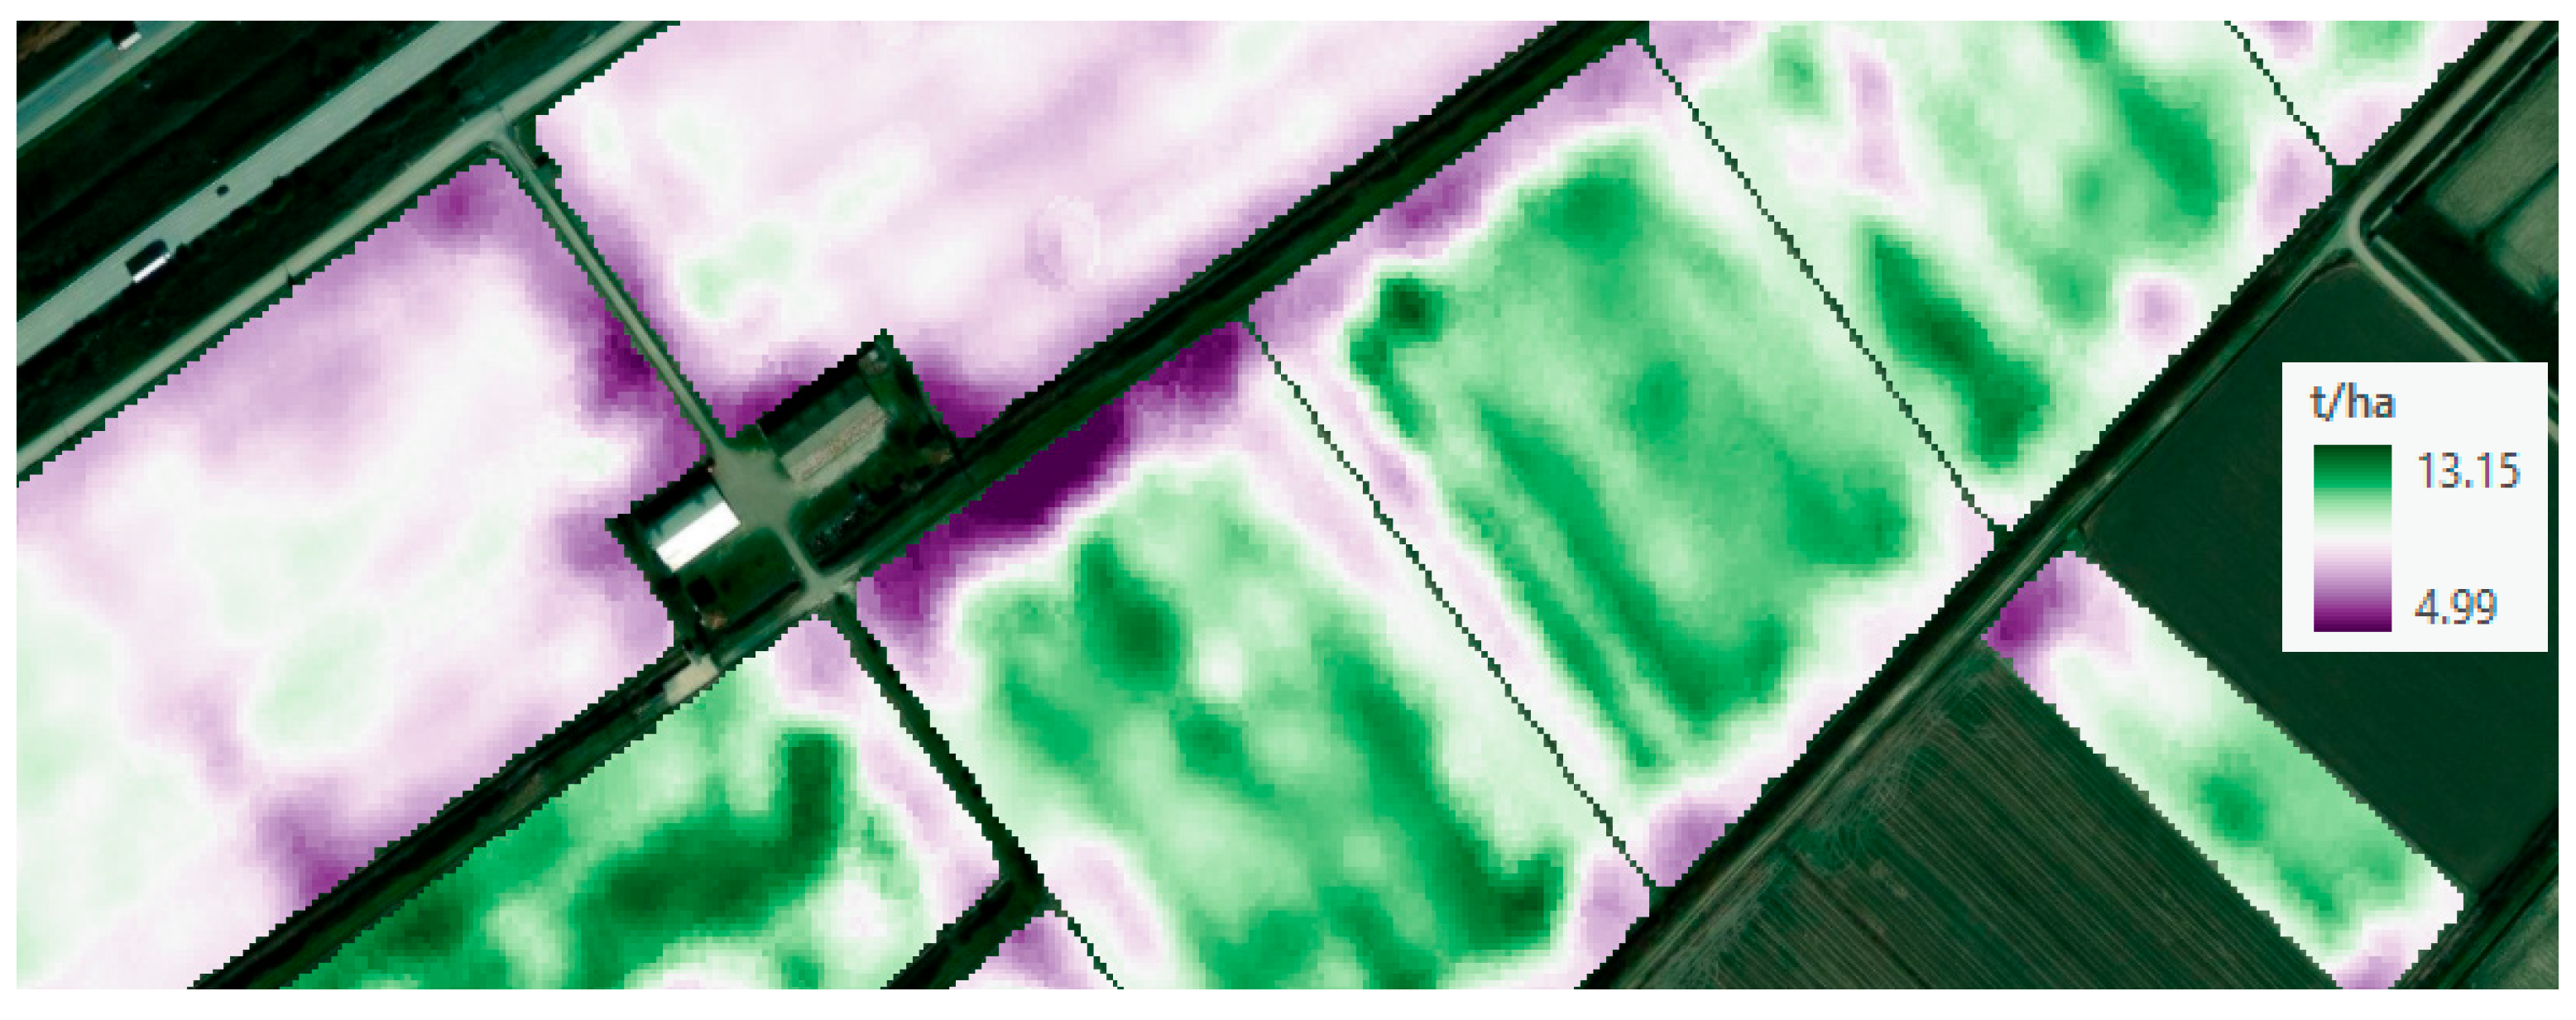
Figure 5.
Yield average values plotted against years for different farmer groups: PrecAg (implementing precision fertilization), Non-PrecAg (not-implementing precision fertilization), and the Greek average (as reported by JRC/MARS).
Figure 5.
Yield average values plotted against years for different farmer groups: PrecAg (implementing precision fertilization), Non-PrecAg (not-implementing precision fertilization), and the Greek average (as reported by JRC/MARS).
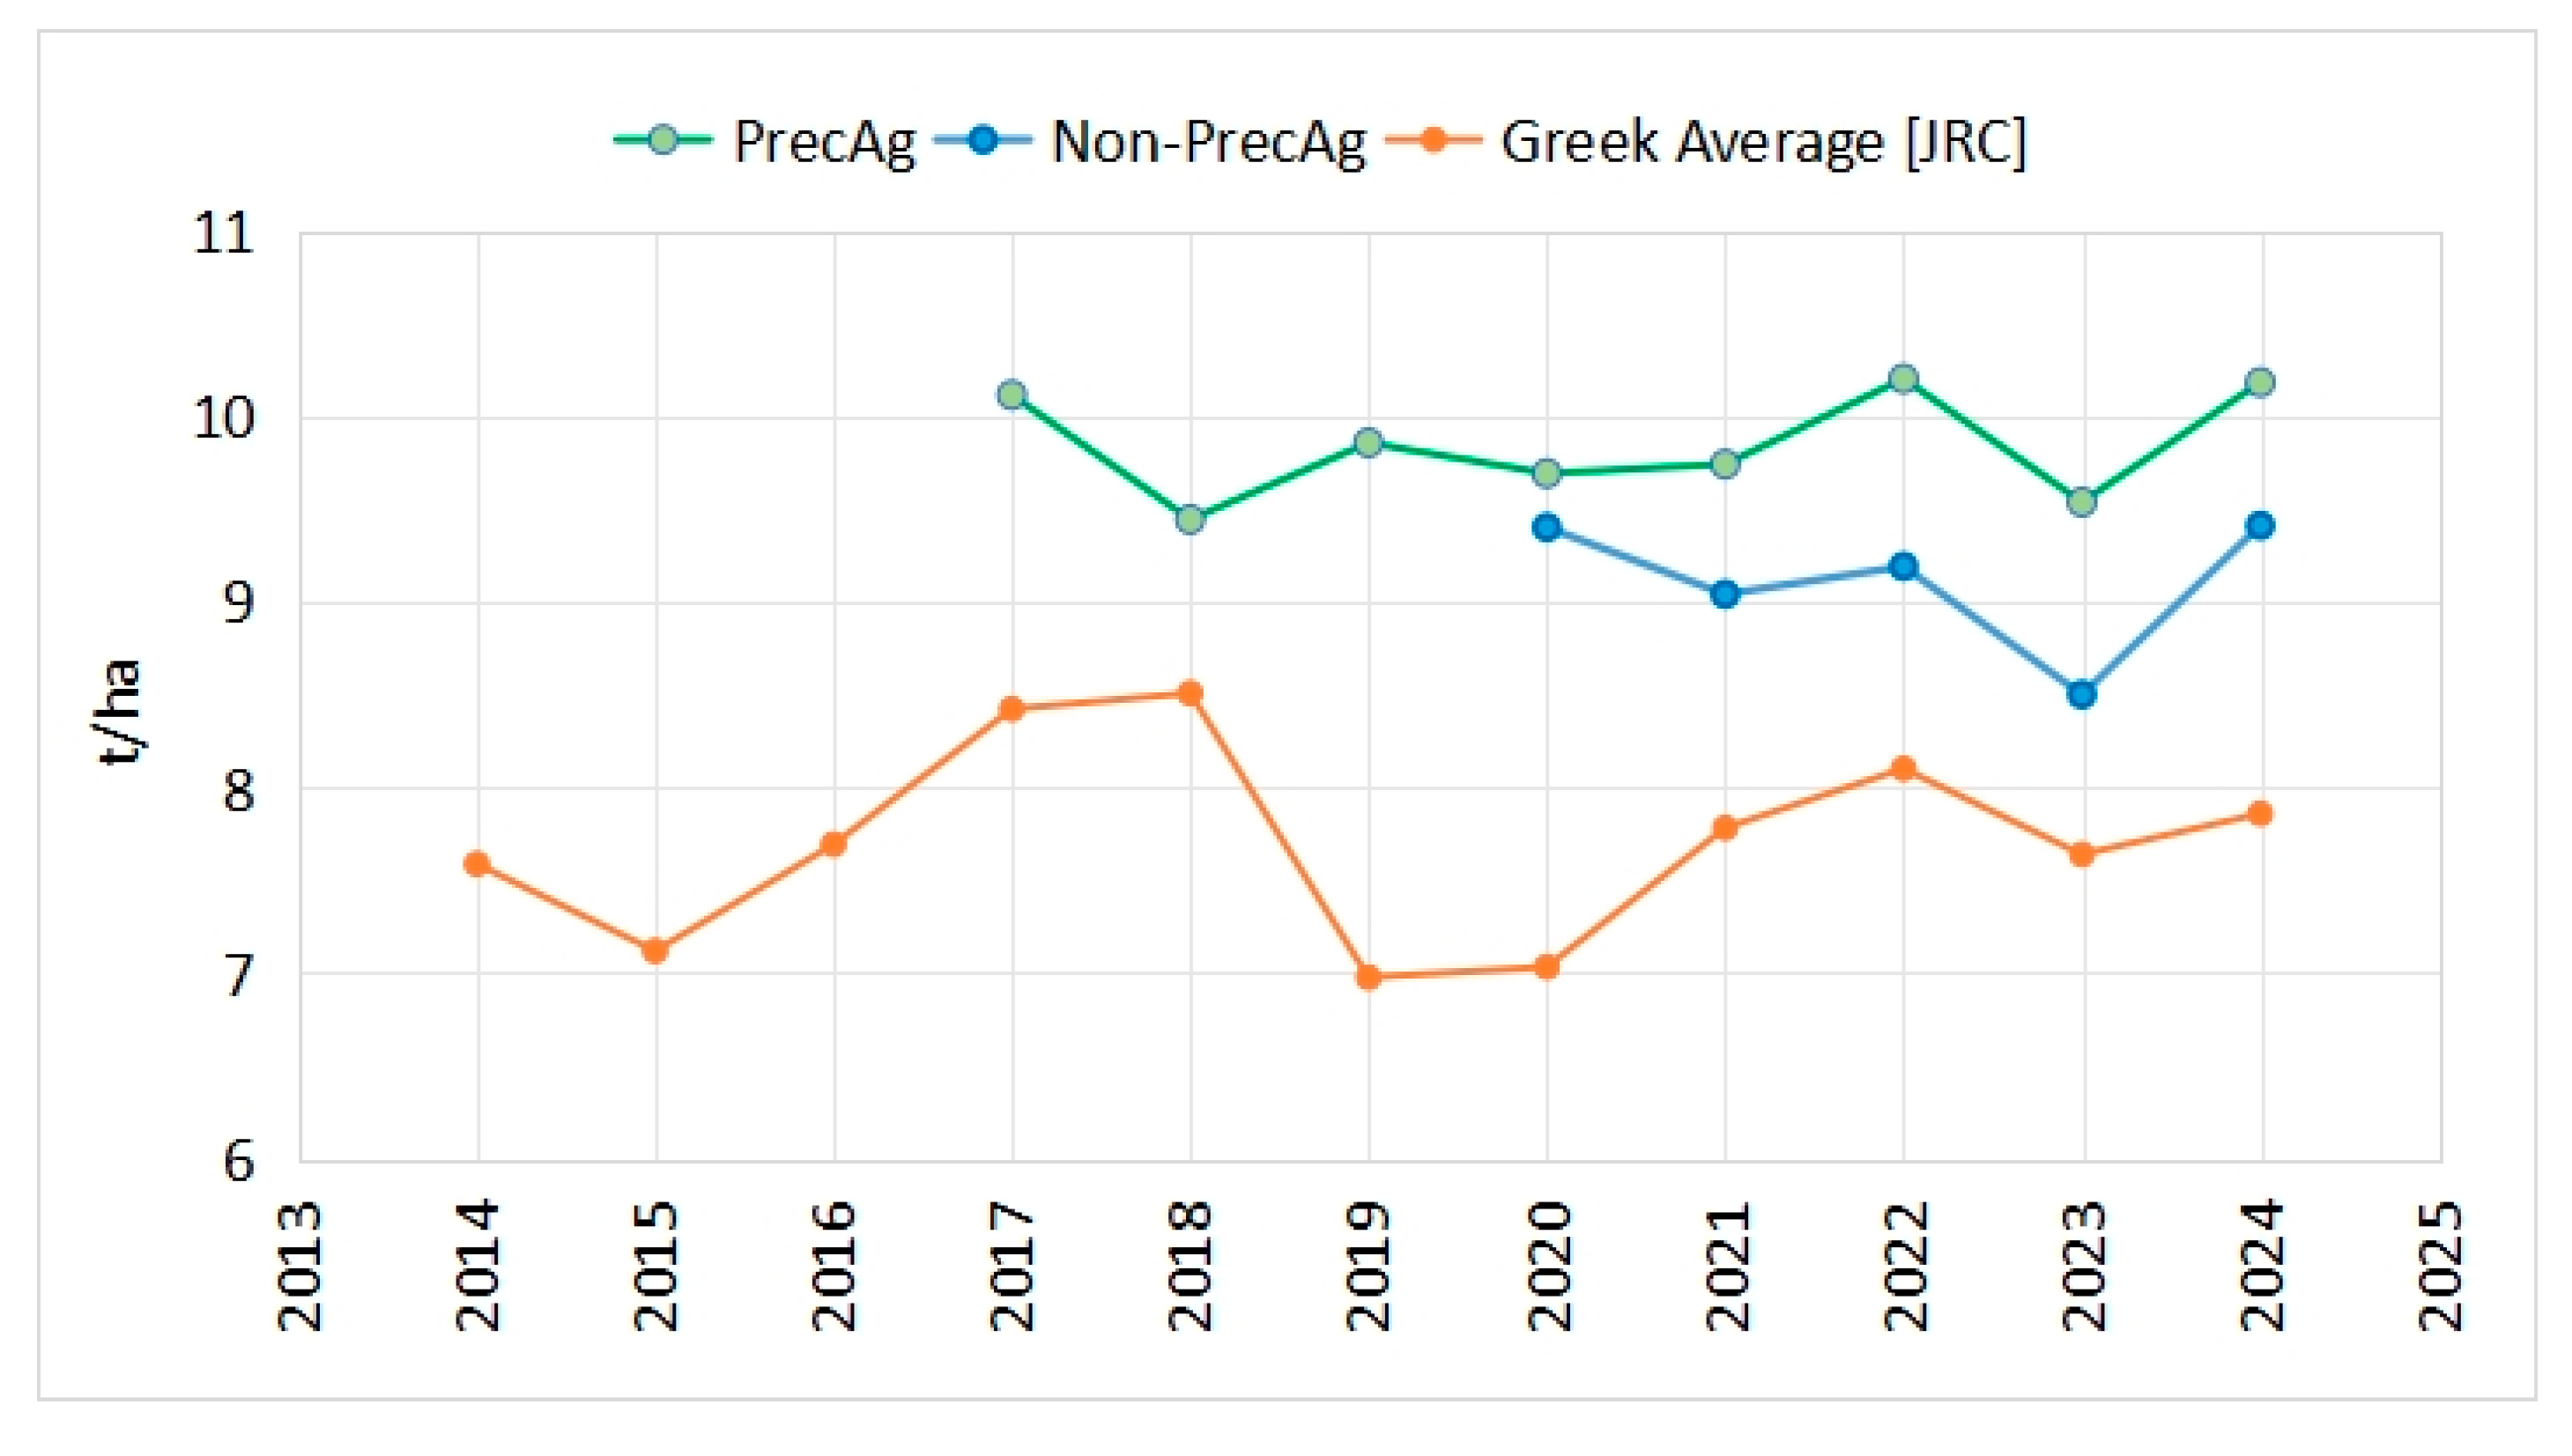
Figure 6.
A part of the rice yield map of 2021 after segmentation with the Segment Mean Shift algorithm (embedded in ArcGIS); the outlines of the produced segmetns are denoted by the black polygons overlaid on the original raster surface.
Figure 6.
A part of the rice yield map of 2021 after segmentation with the Segment Mean Shift algorithm (embedded in ArcGIS); the outlines of the produced segmetns are denoted by the black polygons overlaid on the original raster surface.
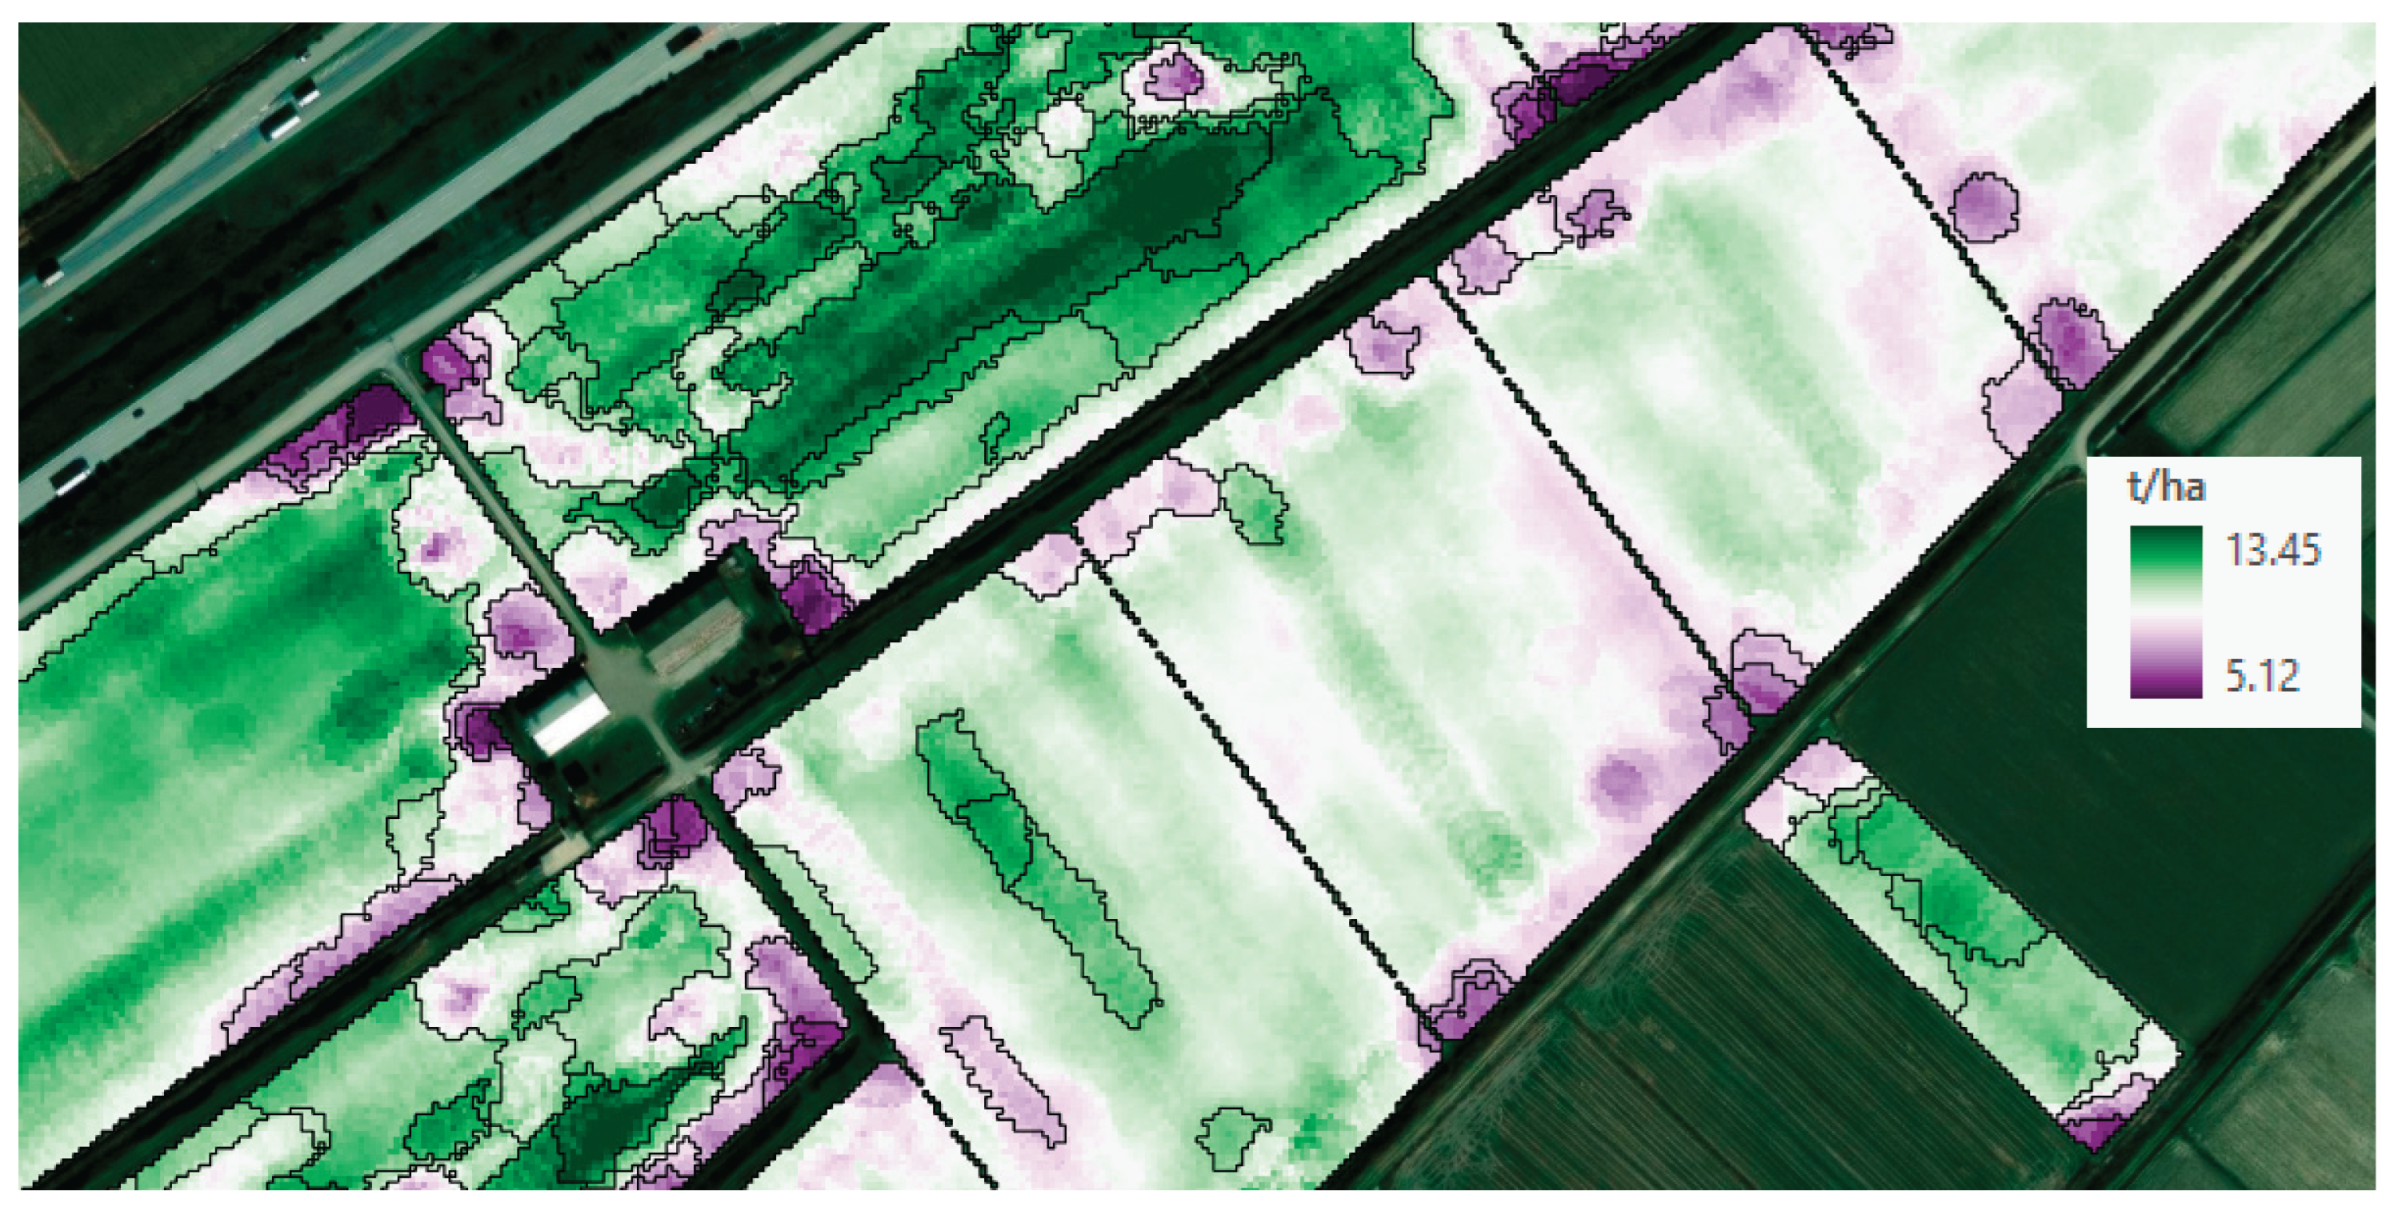
Figure 7.
Visualization of the yield map in ifarma FMIS platform’s precision agriculture module; version in Greek language and standards: yield units represent tonnes per 10-1 hectares.
Figure 7.
Visualization of the yield map in ifarma FMIS platform’s precision agriculture module; version in Greek language and standards: yield units represent tonnes per 10-1 hectares.
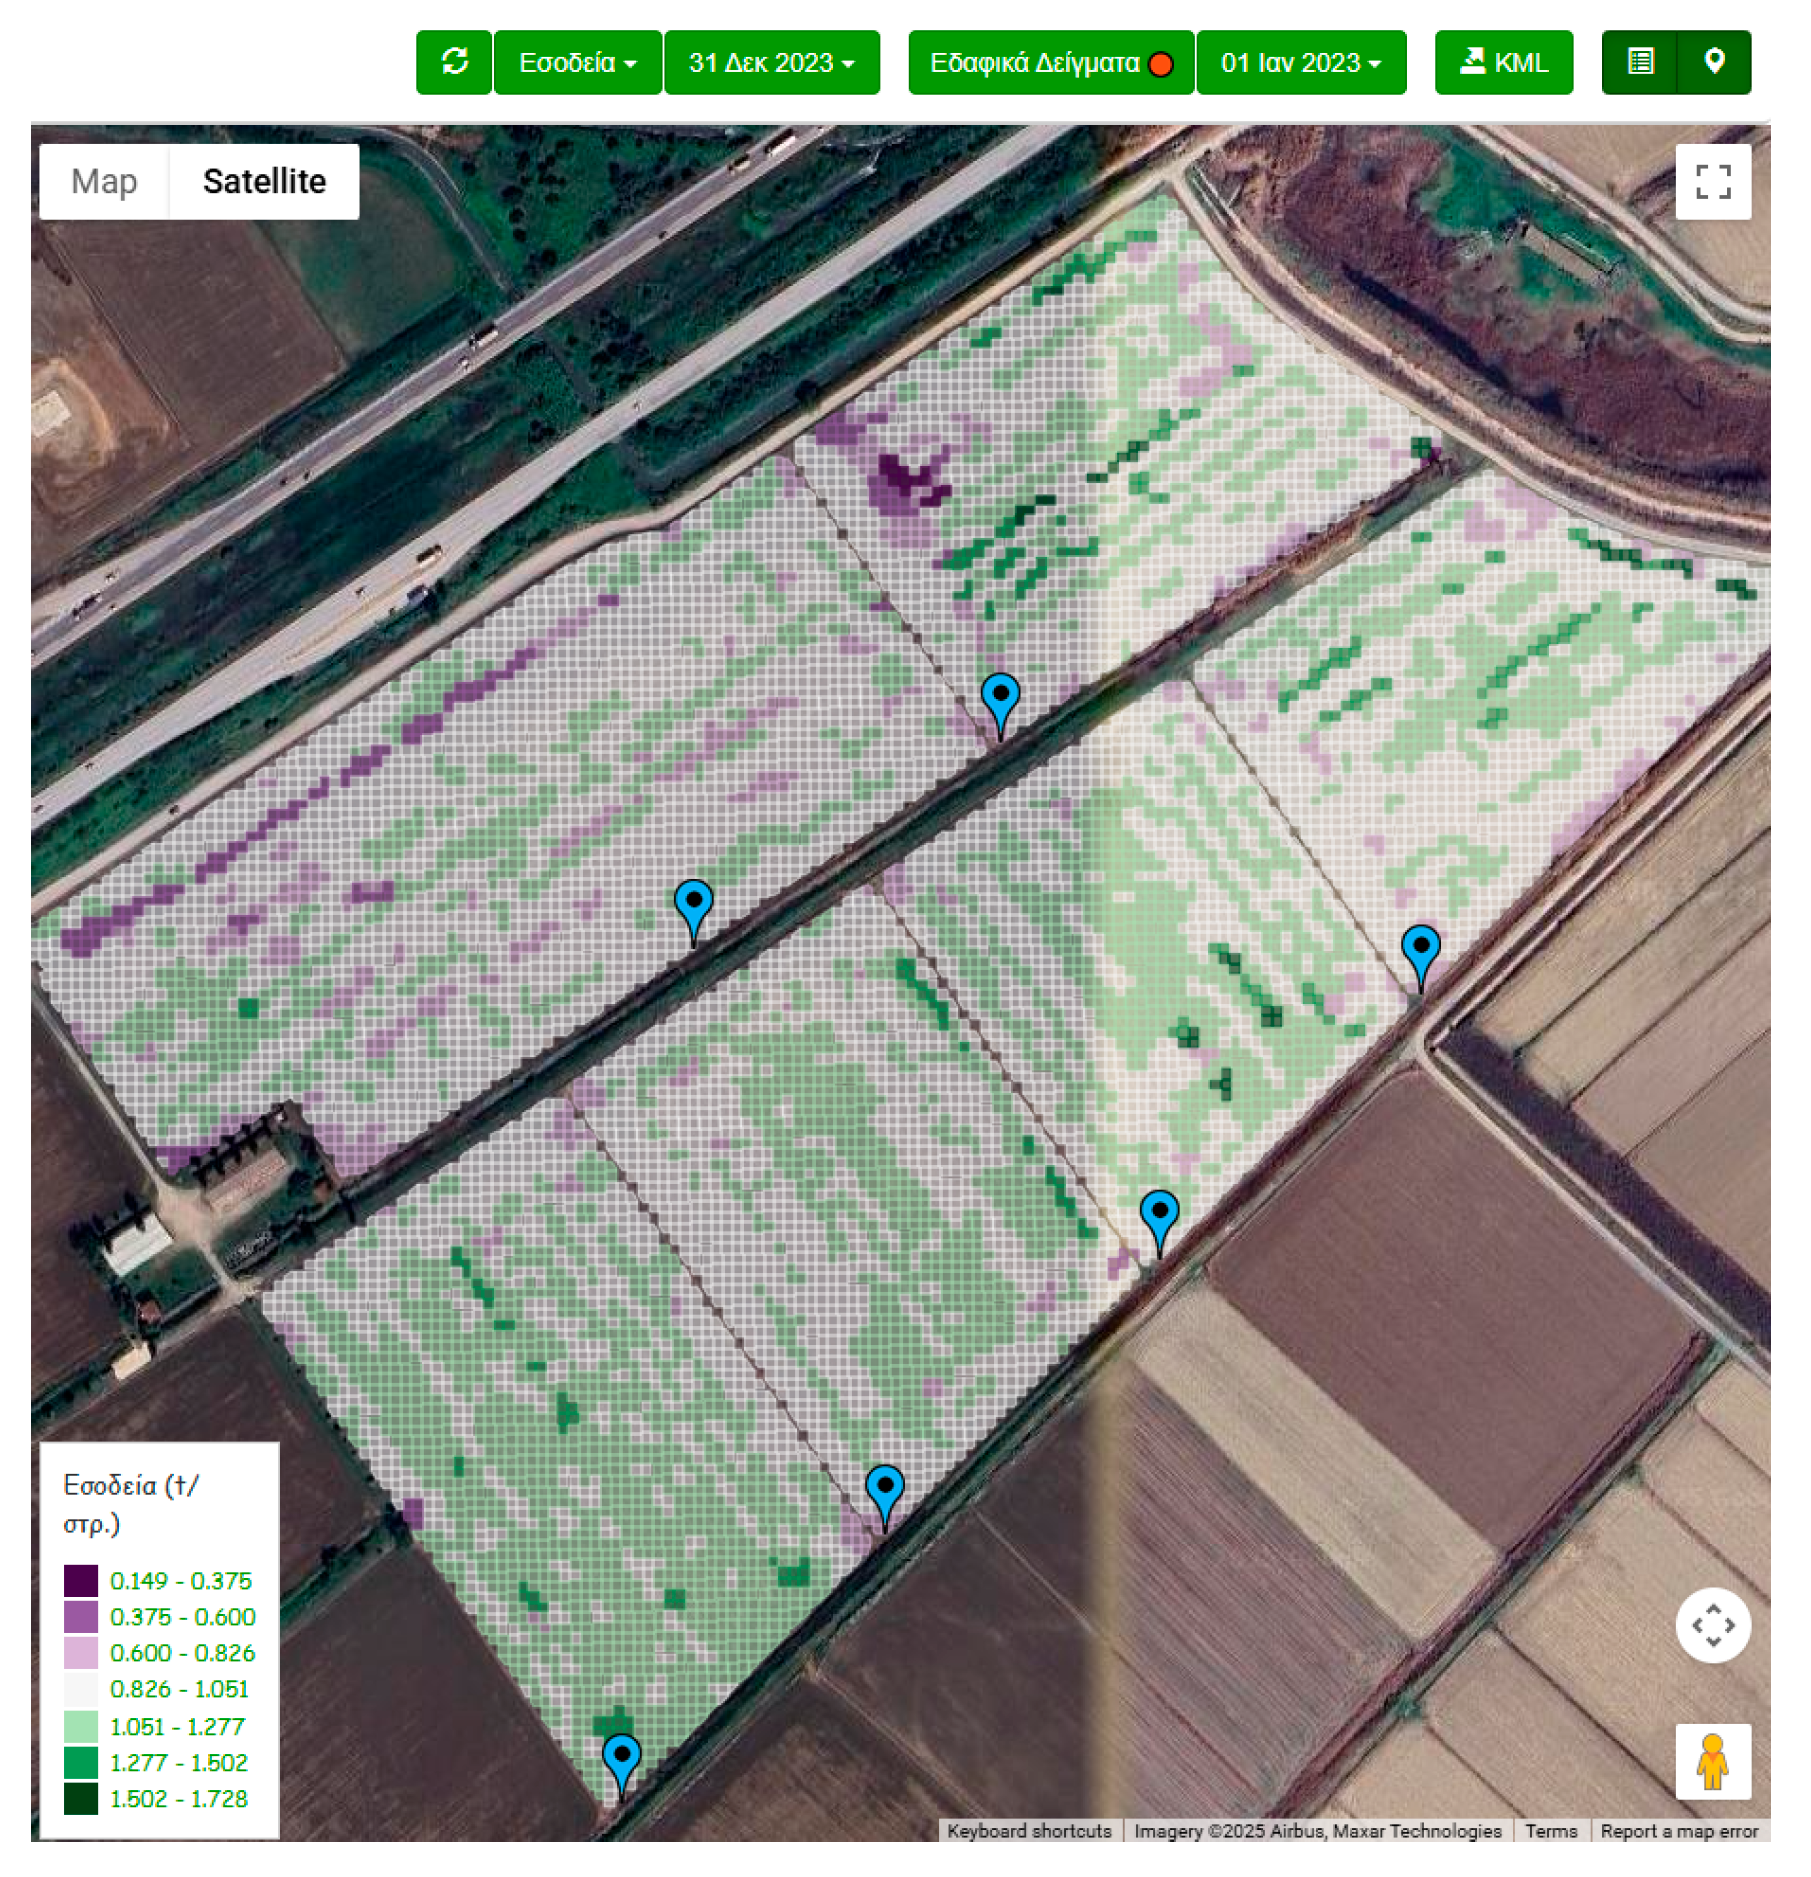
Table 1.
Post-calibration average rice yield values for the PrecAg and the Non-PrecAg groups (derived from yield monitors mounted on harvester); for comparison, the national average in Greece (derived from JRC reports).
Table 1.
Post-calibration average rice yield values for the PrecAg and the Non-PrecAg groups (derived from yield monitors mounted on harvester); for comparison, the national average in Greece (derived from JRC reports).
| Year | PrecAg | Non-PrecAg | JRC |
|---|---|---|---|
| 2014 | 8,85 | - | 7,59 |
| 2015 | 9,00 | - | 7,12 |
| 2016 | 8,20 | - | 7,69 |
| 2017 | 10,11 | - | 8,42 |
| 2018 | 9,44 | - | 8,51 |
| 2019 | 9,86 | - | 6,98 |
| 2020 | 9,69 | 9,40 | 7,04 |
| 2021 | 9,74 | 9,04 | 7,78 |
| 2022 | 10,20 | 9,19 | 8,10 |
| 2023 | 9,54 | 8,50 | 7,64 |
| 2024 | 10,18 | 9,41 | 7,86 |
| Avrg[2014-23] | 9,53 | N/A | 7,70 |
| Avrg[2020-24] | 9,87 | 9,11 | 7,68 |
| Std[2020-24] | 0,30 | 0,37 | 0,40 |
| CV[2020-24] | 3,1% | 4,1% | 5,2% |
Disclaimer/Publisher’s Note: The statements, opinions and data contained in all publications are solely those of the individual author(s) and contributor(s) and not of MDPI and/or the editor(s). MDPI and/or the editor(s) disclaim responsibility for any injury to people or property resulting from any ideas, methods, instructions or products referred to in the content. |
© 2025 by the authors. Licensee MDPI, Basel, Switzerland. This article is an open access article distributed under the terms and conditions of the Creative Commons Attribution (CC BY) license (http://creativecommons.org/licenses/by/4.0/).
Copyright: This open access article is published under a Creative Commons CC BY 4.0 license, which permit the free download, distribution, and reuse, provided that the author and preprint are cited in any reuse.


