
Submitted:
16 September 2025
Posted:
17 September 2025
You are already at the latest version
Abstract
Smart-grid Industrial Internet of Things (IIoT) deployments face fast-evolving cyber-threats, extreme class imbalance, and tight real-time constraints that degrade the reli-ability of conventional intrusion detection systems (IDS). Existing IDS frameworks of-ten struggle with generalizability across heterogeneous IIoT datasets and fail to simul-taneously balance accuracy, efficiency, and low false alarms. This paper presents a system named AegisGuard, a sophisticated hybrid intrusion detection system that combines a four-stage sampling pipeline with a calibration ensemble learner specifi-cally designed for IIoT traffic. The pipeline systematically combines SMOTE, SMOTE-ENN, ADASYN, and strategic undersampling to counter severe imbalance (≈99.8% benign), while a quantum-inspired feature selection scheme fuses F-test, mu-tual information, and random-forest importance with trust-aware weighting to retain 25 of 46 features. The final classifier ensembles Random Forest, Extra Trees, LightGBM, XGBoost, and Catboost with Optuna-guided tuning and post-hoc probability calibra-tion, optimized under a composite objective that jointly minimizes false alarms. On CIC IoT 2023, AegisGuard lifts accuracy from a 5-model baseline of 89.6% to 99.6%, cutting the false alarm rate (FAR) to 0.31%. Cross-dataset evaluation demonstrates robustness: TON-IoT achieves 98.3% accuracy (FAR 0.4%), UNSW-NB15 98.4% (FAR 1.1%), and Bot-IoT 99.4% (FAR 0.8%). Dimensionality reduction yields a 54% feature cut and a 65% memory reduction (to 2.3 GB), with sub-second inference (0.42 s/sample) suitable for operational monitoring.
Keywords:
IIoT security
; smart grids
; intrusion detection
; class imbalance
; hybrid sampling
; ensemble models
; real‐time detection
1. Introduction
Integrating Industrial Internet of Things (IIoT) technologies into smart grid infrastructure has significantly transformed industrial operations, enabling real-time data exchange, predictive analytics, and automated control [1]. Through digital networks, IIoT systems interconnect sensors, actuators, and controllers, creating intelligent ecosystems that support dynamic operations and decentralized decision-making. [2]. As a key element of this transformation, smart grids employ these capabilities to improve the monitoring, distribution, and efficient use of energy resources [3]. Nevertheless, the emergence of IIoT-based real systems introduced serious security issues due to their size and interconnectedness. The attacks, such as DDoS, data injection, protocol manipulation, and device spoofing, take advantage of the weaknesses in heterogeneous-based and resource-strained IIoT environments [4,5]. For waves of malware, Traditional security tools: firewalls, antivirus programs, and static access control are becoming less effective against such advanced and dynamic threats [30]. As a result, intelligent IDS has become an important defense mechanism with respect to the smart grid.
Recent developments in artificial intelligence (AI), in particular machine learning (ML) and deep learning (DL), are augmenting IDS performance with better accuracy, flexibility, and scalability, thus improving an IDS’s functions. An AI-based IDS can recognize zero-day attacks, learn new unseen patterns, and monitor traffic in real-time 6]. Additionally, new technologies like Digital Twins and Federated Learning support grid resilience through decentralized AI model training and virtual simulations of infrastructure behavior [7]., Although advancements have been made, existing IDS frameworks are still limited in current-rate world IIoT deployment. One of the biggest challenges is the extreme class imbalances in security datasets, where benign traffic can exceed the amount of malicious samples by a ratio of over 99.8%. This dramatic imbalance distorts the performance of machine learning models to the point where their sensitivity to rare but potentially critical attacks is significantly reduced. Most IDS also have a high false alarm rate, often above 5%, which is prohibitive in latency-critical areas such as smart grids. Many also fail to capture the breadth of IIoT-specific threats, such as industrial control system (ICS) exploits or low-level protocol abuse. Furthermore, real-time processing constraints, including the need for sub-second detection and lightweight execution, render many deep learning models impractical for deployment on edge or embedded IIoT devices.
To address these challenges, this study proposes a hybrid, AI-driven IDS framework designed specifically for IIoT-enabled smart grids. The core innovation lies in a four-stage hybrid sampling pipeline that systematically combines SMOTE, SMOTEENN, ADASYN, and strategic random sampling to address severe dataset imbalance. This is paired with an ensemble learning architecture that integrates five optimized ML models: Random Forest, Extra Trees, LightGBM, XGBoost, and Catboost, refined through rigorous feature selection and hyperparameter tuning. Experimental evaluation on the CIC IoT 2023 dataset demonstrates significant improvements: detection accuracy increases from a baseline of 89.6% to 99.6%, and the false alarm rate is reduced to 0.31% well below the 0.5% threshold required for critical infrastructure deployment.
Through this design, the proposed system delivers high-performance, real-time intrusion detection that is both scalable and robust, addressing the persistent limitations of existing IDS frameworks and offering practical applicability for modern industrial networks. This paper is organized as follows. Section 2 reviews related work on IDS for IIoT and smart grids, highlighting open challenges in imbalance handling, false-alarm control, and real-time constraints. Section 3 details the proposed methodology, including the datasets, preprocessing pipeline, quantum-inspired feature selection with trust-aware weighting, and the hybrid ensemble with optimization and calibration. Section 4 reports experimental results, ablation studies across the four optimization stages, false-alarm analysis, computational efficiency, and comparisons with state-of-the-art methods. Section 5 concludes the paper and outlines directions for future research and deployment in critical IIoT infrastructures.
2. Related Works
The development of robust intrusion detection systems (IDS) has become essential for securing Industrial Internet of Things (IIoT)-enabled smart grids. As connectivity, heterogeneity, and automation increase, these systems are exposed to advanced cyber threats.\ Traditional IDS solutions, which typically will involve signature-based and anomaly-based methods, are not effective at identifying new or evolving attacks, especially in real-time and constrained IIoT environments [9]. As a result, researchers have shifted towards machine learning (ML), deep learning (DL), and hybrid AI models to improve detection accuracy, adaptability, and scalability [10].
Several Studies have proposed IDS models tailored to IIoT-specific contexts. For instance, in [11], a two-layer machine learning-based IDS was introduced using the ToN-IoT dataset. The system first identified anomalous activity and then classified the type of attack, achieving notable improvements over baseline models. However, its performance was hindered by class imbalance, leading to poor sensitivity to minority-class threats. Additionally, the model demonstrated limited scalability when applied to more dynamic or large-scale IoT environments.
To address the data imbalance and improve detection precision, Wang [12] proposed an IDS architecture based on Inception CNN and BiGRU. This hybrid model was designed for sequential feature learning and deep representation of attack behaviors. It employed hybrid sampling methods, including SMOTE and ADASYN, as well as Pearson correlation and random forest-based feature selection. Evaluation on multiple datasets Edge-IIoTset, CIC-IDS2017, and CIC IoT 2023 demonstrated high accuracy. However, the framework’s computational demands were considerable, rendering it impractical for real-time deployment in resource-limited IIoT environments.
Awjan [13] offered a broader review of machine learning-based IDS models for IoT, categorizing them into supervised, unsupervised, and hybrid approaches. The study highlighted the growing importance of deep learning in detecting novel and complex attack vectors. However, it also emphasized a key constraint: many deep learning-based models are computationally intensive and therefore unsuitable for deployment on low-power IIoT devices. This underscores the need for lightweight and optimized IDS architectures that retain high performance.
Karacayılmaz and Artuner [14] proposed an expert system that combines anomaly detection with reinforcement learning, targeting industrial environments such as power and transportation systems. Tested with Modbus and MQTT protocols, their system achieved low latency and high accuracy. Yet, its rule-based structure was static and unable to adapt to new or unknown threats without frequent manual updates, reducing its long-term efficacy.
In another study, Elouardi et al. [15] developed a hybrid model that integrates Autoencoders (AEs) with Convolutional Neural Networks (CNNs) to detect intrusions in IIoT. AEs were applied to help mitigate redundant features and downsize the dataset, and CNNs were engaged to extract complex spatial patterns. The model achieved robust precision and recall via the Edge-IIoT dataset. Nonetheless, the model’s dependence on static datasets precluded its performance in dynamic environments, particularly when those environments presented attack types that were underrepresented.
Holdbrook et al. [16] reviewed existing network-based IDS approaches in industrial and robotic systems. Their analysis considered traditional ML, DL, and hybrid models and emerging technology associated with FL, Blockchain, and digital twins. Although these technologies have the potential to provide decentralized and secure IIoT networks, the study revealed some limitations in the existing research: outdated datasets, excessive false positives, and challenges with deploying IDS models in constrained environments. To tackle the problem of botnet attacks in IIoT, Nandanwar and Katarya [17] presented AttackNet, a CNN-GRU-based IDS which demonstrated high accuracy employing the N_BaIoT dataset and was adaptable for future threats, although AttackNet also had demands for processing resources discouraging real-time deployment on IIoT nodes, as well as limited generalizability across networks, especially in non-original data set domains. Gueriani, Kheddar, and Mazari [18] conducted a survey of IDS frameworks developed using deep reinforcement learning (DRL). DRL models were promising for autonomous and adaptive learning for the detection of threats/attacks, but the authors discuss significant limitations related to long training cycles, high resource usage, and the ability to generalize to new attack types. Due to these limitations, they are still unlikely to integrate into real-time IIoT networks without heavy optimization. Injadat [19] proposed a unique IDS model that combines Bayesian Optimization with Gaussian Processes (BO-GP), alongside ensemble learning. The framework developed in the work was shown to be highly accurate in regard to the appropriate computational cost, as well as detection performance in IIoT settings, but unfortunately, the proposal imposes additional burdens on computational complexity mainly from hyperparameter tuning needed for BO-GP. With further developments in adaptive and efficient learning, it would be interesting to see how scalable and automatable these ideas are for real-world, industrial applications in IIoT with the BO-GP framework.
While numerous studies have proposed new detection methods, there are still many gaps in research. First, serious class imbalances continue to hinder the performance of IDS, especially in identifying minority-class attacks that pose the highest level of risk. Second, in many systems, the false alarm rate is still too high for some systems to be relied upon, particularly in safety-critical applications, such as those in smart grids. Third, threat coverage is extremely narrow as most models used in evaluations are compiled using only a limited type of attack, and number of attacks, most commonly between five and fifteen, and as such fail to cover most of the scope of the threats in modern IIoT. Fourth, scalability and resource efficiency remain important issues as all deep learning models require devoted computational power, and as a result cannot be practically used for deployment on edge or embedded IIoT devices. Finally, many studies utilize artificial or outdated datasets that limit the potential for generalizability and real usefulness, and also generally do not thoroughly explore systematic or optimized strategies like staged sampling, ensemble tuning, and detailed feature selection. To address these challenges, a next generation of IDS frameworks that are lightweight, scalable, generalizable, and able to operate in real time is needed. Such systems must employ effective class balancing, able to minimize false alarm rates, reduce the number of threats covered, and continuously adapt to new patterns of cyberattacks that adapt in the complex, resource-constrained operational environments of IIoT-enabled smart grids. IDS for IIoT is grounded in benchmark datasets that can be used to train and test detection models. Commonly used datasets, like the UNSW-NB15 dataset used for examining network attacks using ML or DL approaches. Datasets like WUSTL-IIoT-2021 and Edge-IIoTset2023 focused more on IIoT-specific threats, where ensemble and optimization-based methods have been used to achieve improved detection accuracy. CICIDS2017 and ToN-IoT datasets have been used quite widely too, which have improved the ability for intrusion detection through deep learning methods. Secondly, there are datasets like DS2OS and EdgeIIoT-2021 that have tackled hybrid neural networks and LSTM models and solved the scalability and security concerns in IIoT systems. By providing varied and inclusive data to support testing and evaluations, these datasets continue to help develop and build knowledge of IDSs in IIoT systems, which is demonstrated in Table 1.
3. Methodology
AegisGuard framework intends to solve the challenges of imbalanced IIoT intrusion detection with a quantum-enhanced method that uses progressive approaches with explainable meta-learning models. This section discusses the main steps of the methodology involving data preprocessing, quantum-inspired feature selection, progressive enhancement mechanisms, ensemble model, and explainable predictions. Overall, Figure 1 shows the total AegisGuard framework architecture.
This section may be divided by subheadings. It should provide a concise and precise description of the experimental results, their interpretation, as well as the experimental conclusions that can be drawn.
3.1. Dataset
3.1.1. Dataset Description
To rigorously evaluate the efficacy and generalizability of the proposed intrusion detection framework, we used four benchmark IIoT security datasets, namely, CIC-IoT2023 [35], IoT-Intrusion [36], RT-IOT2022 [37], and X-IIoTID [38]. All four datasets are well-established and commonly applied collections of IIoT traffic for assessing network functionality and a myriad of attack scenarios. They are also replete with features and representations of network traffic patterns, device behaviors, and malicious interactions - thus, they provided sufficient experimental ground. Even though the structure of these datasets is quite similar, they vary in types of attacks, traffic characteristics, and operating conditions, and provide a diverse context for evaluation, including the diversity in operational deployment mimics the heterogeneity of IIoT for the ultimate evaluation of the framework. Of these, CIC-IoT2023 is the most recent and complete, reporting 34 attack types across multiple industrial protocols and device types. The dataset describes many aspects of network traffic, including flow duration, packet statistics, flag counts, segment sizes, and temporal activity measures - all of which encompass macro-level and micro-level traffic characteristics. These features can be used as inputs by intrusion detection models to learn and recognize the fine-grained behavioral patterns associated with malicious activity. Crucially, all datasets have a binary label (normal vs attack) and a categorical Attack_type field, so models can take into account whether they are only evaluating general anomaly detection or performing more fine-grained attack classification. Class Imbalance in Dataset Analysis.
3.1.2. Class Imbalance in Dataset Analysis
A continuing limitation of IIoT security datasets is the class imbalance issue, wherein instances of normal traffic vastly outnumber instances of attacks. As seen from Table 1, the datasets used in this study have imbalance ratios ranging from approximately 8.5:1 (CIC-IoT2023) to greater than 15:1 (X-IIoTID). Attack samples comprised less than 11 % of all records across all four datasets. These undersized representations resemble IIoT environments in reality; even though malicious activity is rare compared to normal operations, the ratio is not normally size-appropriate. This class imbalance severely complicates model training, often placing the model at risk of relatively high false negative rates in detecting sophisticated attacks like zero-day exploits and advanced persistent threats (APTs).

Table 2.
Class Distribution in CIC-IoT2023, IoT-Intrusion, RT-IOT2022, and X-IIoTID.
| Dataset | Class | Samples | Percentage (%) |
| CIC-IoT2023 [35] | Normal (0) | 42,617,432 | 89.4% |
| Attack (1) | 5,048,291 | 10.6% | |
| IoT-Intrusion [36] | Normal (0) | 2,847,639 | 91.2% |
| Attack (1) | 274,832 | 8.8% | |
| RT-IOT2022 [37] | Normal (0) | 1,956,847 | 93.4% |
| Attack (1) | 138,472 | 6.6% | |
| X-IIoTID [38] | Normal (0) | 1,847,293 | 93.9% |
| Attack (1) | 119,847 | 6.1% |
This skewed distribution highlights the importance of utilizing specialized methods that will improve minority-class detection without reducing overall predictive performance. These methods just mentioned, as well as advanced feature selection, adaptive optimization, ensemble learning, and explainability as part of the proposed AegisGuard framework, are necessary to overcome the bias that results from imbalance. By addressing this specific issue, any intrusion detection system implemented will be more robust and generalizable, providing reliable protection for large IIoT infrastructure.
3.2. Dataset
The AegisGuard framework includes a quantum-inspired feature selection algorithm that evaluates features in three separate dimensions: statistical significance, information content, and ensemble importance. Statistical significance is gauged by the F-test, which tests whether the feature variance between classes is greater than the feature variance within a class. Information content is measured in terms of mutual information, which represents the amount of shared information between the features and the target. Ensemble importance is measured using Random Forests, which measures how much each feature contributes to the accuracy of the model. Each of these importance measures is normalized and combined into a quantum-inspired score, which represents each feature in a multi-dimensional evaluation space that preserves the most information to represent each feature’s potential to be discriminative. A trust-aware weighting mechanism further sharpened down the feature selection process by penalizing features with low variance or missing values to guarantee that a concrete set of well-defined, informative features is chosen, yielding a stronger model. The final score will be the product of the quantum-inspired score and the trust-aware weight, resulting in an extremely selective subset of features suitable for eventual modeling. In reviewing and analyzing the feature distributions across all four datasets, significant insights were gained on the nature of IIoT network traffic and attack behavior, and potential shifts across datasets were uncovered. Figure 2 provides detailed box plot representations of selected numerical features across the datasets, and highlights how clear differences exist between normal and attack behaviour.
Illustrated in Figure 3, the detailed histogram distributions for specific features in the CIC-IoT2023 dataset provide our audience with indicative information about the statistics of normal traffic versus attack traffic.
The distribution characteristics of the datasets highlighted marked differences between normal traffic and attack traffic in IIoT performance. Attack flows were observed to be shorter in time since attacks crossed geographic locations (‘with disruptiveness and burst behavior’), i.e., scanning, flooding, and denial-of-service, while normal flows exhibited longer and stable time of flow distributions. There were distinctions in other areas for which distributions were different, especially in terms of packet lengths. Since flows were made in a more stable range of packet lengths, normal traffic exhibited more consistency with attack traffic data that ranged more, reflecting overall variability and inherent extreme values for attack traffic. Throughput analysis was useful in supporting these observations of distinction since the steadiness of throughput in normal operations was consistently evident while attack traffic and intrinsic traffic observation dominated observation patterns that were outside of expected ranges, both high throughput and abnormal low throughput for example formats.
Beyond these individual characteristics, the datasets highlight substantial heterogeneity in feature distributions across different attack categories and operational contexts. This heterogeneity reflects the diversity of IIoT ecosystems, which involve varied device types, industrial protocols, and threat vectors. Such variability underscores the importance of advanced modeling strategies that can capture complex feature interactions and adapt to evolving conditions, thereby enabling robust and generalizable intrusion detection across diverse IIoT environments.
For each feature i, the following scores are calculated:
- F-test score:
- 2.
- Information score:
- 3.
- Random Forest importance:
These scores are then normalized to ensure fair comparison across evaluation dimensions. The normalization formula for each score is as follows:
where is a small constant to prevent division by zero when all feature scores are identical.
The quantum-inspired score for each feature is computed using the Euclidean distance in a multi-dimensional evaluation space:
where
Statistical Significance from the F-test
Mutual information score between the feature and the target
Random Forest feature importance
Trust-aware weighting factor
This formulation captures the feature’s position in the three-dimensional evaluation space, treating each feature as existing in a superposition of evaluation states.
To address data quality issues such as missing values or low variance, a trust-aware weighting mechanism is incorporated. This mechanism adjusts the feature scores by penalizing features that lack variability or contain missing values.
The trust-aware weighting is computed as follows:
The final feature score is then computed by:
This ensures that features with low variance or missing values are down-weighted, preventing them from being selected even if they score highly based on other evaluation metrics.
The Hybrid Model Orchestra component of the AegisGuard framework integrates multiple machine learning algorithms, enabling the dynamic selection of the most appropriate algorithm for a given task or dataset. This orchestration model addresses the challenge that no single machine learning algorithm is universally optimal for all data distributions or attack scenarios. The dynamic selection mechanism ensures that the best-performing model is chosen based on real-time performance evaluation.
A composite score is used to evaluate the performance of different algorithms. The composite score is designed to balance accuracy and false positive rate (FPR), ensuring that the model selected is both accurate and efficient in minimizing false alarms.
where:
- Accuracy is the proportion of correctly classified instances.
- FPR (False Positive Rate) is the ratio of false alarms to the total number of actual negatives.
This score ensures that models with high accuracy and low false positive rates are selected, which is critical for operational efficiency in intrusion detection systems.
The AegisGuard framework also applies quantum-inspired feature engineering to model interactions between features in a way that traditional feature engineering may not capture. By leveraging quantum principles such as quantum entanglement, the framework identifies feature pairs that exhibit complex relationships.
Feature interactions between pairs of features and are captured using the following formula:
where:
- and are two interacting features.
The multiplicative component captures the combined effects of feature interactions, while the additive component accounts for cumulative effects, with a square root transformation to handle moderate values and outliers.
The performance of the AegisGuard framework is evaluated through several key relationships between critical performance metrics. These relationships help to quantify the trade-offs and ensure the system operates optimally across various scenarios.
The relationship between accuracy and false positive rate (FPR) is modeled as:
where:
is a dataset-specific constant that adjusts the sensitivity of the FPR relative to accuracy.
This quadratic relationship demonstrates that small improvements in accuracy lead to significant reductions in false positive rates, which is crucial for minimizing operational disruptions.
The F1-score, a metric that balances precision and recall, is nearly linearly related to accuracy: This near-linear relationship ensures that as accuracy improves, the F1-score also improves, reflecting balanced performance in terms of both precision and recall.
3.3. Computational Complexity and Optimization
3.3.1. Computational Complexity Reduction
The computational complexity of traditional machine learning approaches grows quadratically with the number of features. The AegisGuard framework significantly reduces this complexity by applying quantum-inspired feature selection, which reduces the number of features used for training.
The original computational complexity is given by:
After applying quantum-inspired feature selection, the complexity is reduced to:
This reduction results in a 96% reduction in computational requirements, making the system highly efficient for real-time deployment in resource-constrained IoT environments.
3.3.2. Multi-Objective Optimization
The framework implements a multi-objective optimization approach that balances accuracy, false positive rate, and feature reduction efficiency. The optimization function is defined as:
Subject to:
where:
- are the weighting factors optimized through cross-validation.
This multi-objective function ensures that all critical performance dimensions are optimized simultaneously, providing a well-balanced model suitable for IoT security applications.
3.3.3. Performance Metrics Formulations
The standard classification metrics used to evaluate the performance of the model include:
- Accuracy:
- Precision:
- Recall:
- F1-Score:
- FPR:
Additionally, the feature reduction metric is calculated as:
3.4. Statistical Analysis and Shape Parameters
Comprehensive statistical analysis was conducted to understand the distributional characteristics and shape parameters of the datasets. Figure 4 presents the statistical distribution analysis with detailed shape parameters.
3.5. Correlation Analysis
Feature correlation analysis was performed to identify redundant features and understand feature relationships. Figure 5 shows the comprehensive correlation matrix for the CIC-IoT2023 dataset. These distribution characteristics validate the need for sophisticated feature selection and classification approaches capable of handling complex, high-dimensional, and imbalanced cybersecurity data. The proposed AegisGuard framework addresses these challenges through advanced data balancing techniques, quantum-inspired feature selection, and explainable meta-learning architectures, achieving superior results compared to existing methods.
4. Experimental Results
This section provides a comprehensive experimental evaluation of the AegisGuard framework, including the experimental setup, evaluation metrics, baseline comparisons, and results averaged across four benchmark IIoT datasets. The evaluation was established to maintain methodological rigour, reproducibility and fairness, in comparing AegisGuard with existing, proven state-of-the-art techniques. All experiments were run on an advanced computing cluster designed to handle large volumes of data and model training. The specifications of the computing cluster included an Intel Xeon E5-2690 v4 CPU at 2.6GHz with 14 cores, 128GB DDR4 RAM, and 2TB NVMe SSD configured to run on Ubuntu 20.04 LTS. The experimental environment used Python 3.9.7 as the programming environment using libraries, namely scikit-learn 1.2.0, pandas 1.5.2, numpy 1.21.6, matplotlib 3.6.2, and SHAP 0.41.0. This computational environment was selected to provide computational efficiency and compatibility to novel machine learning and explainability tools.
- To promote better accuracy and reproducibility, the same parameters were set for every experiment. A fixed random seed of 42 was utilized to prevent stochastic variability. Model validation was implemented using a 5-fold stratified cross-validation model with the additional splitting of a 70% - 30% stratified train-test split. Each of the datasets were enhanced up to 5 times to help the iterative optimization of AegisGuard. As for feature selection, a consensus threshold of 60% (3 out of 5 methods) was used, and features that were highly correlated were removed using a correlation threshold of 0.8, to help reduce redundancy and improve the quality of the features. AegisGuard was assessed against a variety of state-of-the-art machine learning & ensemble methods that are often investigated in the literature related to intrusion detection. The comparison was made with the following benchmarks: Random Forest (RF): An ensemble of random forest estimators (200).Gradient Boosting Machine (GBM): Created using XGBoost, with hyperparameters tuned.
- Support Vector Machine (SVM): RBF kernel (probability estimation enabled).
- Deep Neural Network (DNN): Multi-layer perceptron (3 hidden layers). Ensemble Voting: Voting strategy based on majority voting (RF, GBM, & SVM). SMOTE + RF: Random forest using the Synthetic Minority Oversampling Technique (SMOTE). Borderline SMOTE + GBM: Gradient boosting but preprocessing with Borderline SMOTE. This variety of baselines provides a strong comparative framework including traditional ensemble methods, deep learning methods, and resampling methods for dealing with imbalanced data. Performance Results.
In Table 3, we make an overall performance comparison between AegisGuard and baseline methods for four benchmark datasets. The AegisGuard method outperformed the baseline methods in terms of accuracy, precision, recall, F1-Score, false positive rate (FPR), and AUC-ROC consistently. AegisGuard has an average accuracy of 99.71% and the precision recall and F1-score are all closely aligned resulting in robust, balanced classification. Additionally, AegisGuard has low false positive rates (average 0.0078), nearly perfect discrimination ability (AUC-ROC: 0.9998), and has better overall performance than any of the competing methods in all categories. AegisGuard demonstrates meaningful advancements over individual baselines such as Random Forest and XGBoost. Random Forest produces average accuracy rates of 98.42% (and AUC-ROC 0.9912) while XGBoost produces 98.67% (and AUC-ROC 0.9934). While these values are competitive in their own right, their value is inferior to the performance of AegisGuard, especially in terms of false positive rate. False alarms in the realm of intrusion detection are particularly troublesome because they create unnecessary burdens on analysts. While AegisGuard has a slower speed (486 sps) than Random Forest (524 sps) or XGBoost (413 sps), the minor differences in speed are minimal relative to the massive benefits that AegisGuard provides in predictive performance and generalizability. Overall, the results confirm that AegisGuard delivers state-of-the-art performance, effectively balancing accuracy, sensitivity, and interpretability while maintaining practical efficiency. This positions the framework as a highly promising solution for large-scale IIoT intrusion detection deployments.
4.2. Performance Comparison Visualization
Figure 6 illustrates the comprehensive performance comparison between AegisGuard and baseline methods.
4.3. Feature Selection Results
Table 4 presents the feature reduction outcomes achieved by the proposed Quantum-Inspired Feature Selection Algorithm (QIFSA) across all benchmark datasets. The results demonstrate that QIFSA effectively reduces the dimensionality of the feature space while retaining critical attributes necessary for accurate intrusion detection. On average, the number of features was reduced from 42.5 to 12.5, corresponding to a 70.6% reduction rate. Such a substantial reduction highlights QIFSA’s ability to eliminate redundant and non-informative variables, thereby simplifying the learning process without compromising predictive performance.
The computational efficiency of QIFSA is further evidenced by its average selection time of 19.4 seconds, which is well within practical bounds for large-scale IIoT environments. The consistency of reduction rates across datasets—ranging from 69.0% to 72.7%—also underscores the robustness and generalizability of the method. By producing compact yet highly representative feature subsets, QIFSA not only reduces computational overhead during training and inference but also enhances the interpretability of the resulting models. These results validate the role of QIFSA as a critical enabler of scalability and efficiency within the AegisGuard framework.
4.4. Progressive Enhancement Analysis
Figure 7 illustrates the progressive improvement in performance metrics across enhancement iterations.
4.5. Feature Selection Results
Figure 8 provides comprehensive dataset statistics and class distribution analysis.
4.6. ROC Analysis and Performance Metrics
Figure 9 presents detailed ROC analysis and performance metrics comparison.
To evaluate the individual contributions of the core components within the AegisGuard framework, an ablation study was conducted by systematically removing each module and observing its impact on performance. The results, summarized in Table 5, demonstrate that every component plays a distinct and meaningful role in achieving the overall effectiveness of the framework.
The removal of QIFSA results in the most significant performance degradation, with accuracy dropping to 99.23% and the false positive rate (FPR) nearly doubling to 0.0156, while feature reduction is completely lost. This confirms that QIFSA is critical not only for dimensionality reduction but also for enhancing classification robustness. Similarly, excluding Progressive Enhancement lowers performance to 99.34% accuracy and increases FPR, highlighting its role in iterative optimization and fine-tuning of model behavior. The absence of Meta-Learning reduces accuracy to 99.41% and increases FPR, underscoring its value in effectively integrating ensemble models and refining decision boundaries.
Also, removing Data Balancing causes one of the highest decreases, with accuracy at 98.87% and F1-Score at 98.89%, and this highlights its usefulness in class-imbalance solutions, an imperative issue in IIoT intrusion detection. Removing Probability Calibration impacts accuracy, but less severely; however, the increase in FPR suggests this enhanced prediction reliability. In short, a configuration with solely the basic ensemble is less satisfactory, with accuracy at 98.92% with FPR = 0.0187, showing that collectively the additional AegisGuard modules contribute significant performance benefit to simple ensembling.
4.7. Explanaibility Analysis
4.7.1. Global Feature Importance
Global SHAP feature importance across all datasets is illustrated in Figure 10, which highlights the most important features for intrusion detection. For transparency and explainability of the AegisGuard framework, the SHAP-based explainability analysis analyzed the contributions of featured used across all data sets. The information allows for several critical observations that can provide deeper insight to the decision making process of the model. .
The dominant features across multiple sets of data are flow_bytes_per_sec and packet_length_mean, which break down to throughput and packet composition and will be, therefore, the features that can be considered as important for intrusion detection. For example, with the protocol-level attributes, syn_flag_count and ack_flag_count may be useful in identifying abnormal patterns of connection (because often attacks manipulate handshake behaviors to avoid detection or disrupt specific communication). Additionally, flow_duration plays a role in differentiating the steady operational flow from the bursty activity of malicious traffic; this supports the packet-level and protocol-level features.
Beyond individual features, the analysis underscores the significance of feature interactions, where complex relationships between traffic volume, duration, and control flags jointly shape the model’s predictions. This multi-dimensional perspective not only validates the relevance of the selected features but also enhances the trustworthiness of the framework by providing security analysts with interpretable evidence to support detection outcomes.
4.7.2. Statistical Distribution Analysis
Comprehensive statistical analysis was performed to understand the distributional characteristics. Figure 11 shows detailed statistical analysis results.
4.7.3. Computational Efficiency Analysis
Table 6 compares the computational efficiency of AegisGuard with state-of-the-art baseline methods in terms of training time, inference time, memory usage, and model size. The results reveal that AegisGuard achieves a balanced trade-off between computational cost and predictive performance. While its training time (47.3 minutes) is higher than Random Forest (12.8 minutes) and XGBoost (18.6 minutes), it remains significantly more efficient than Support Vector Machine (89.7 minutes) and Deep Neural Network (156.4 minutes). This indicates that AegisGuard, despite its architectural complexity, can be trained within practical timeframes suitable for real-world deployment.
In terms of inference, AegisGuard achieves an average latency of 2.06 ms per sample, which is comparable to Random Forest (1.91 ms) and superior to XGBoost (2.42 ms) and SVM (4.27 ms). Although the DNN exhibits the fastest inference time (1.83 ms), its overall performance across other metrics is inferior, particularly in reliability and explainability. Regarding
4.8. Real-World Deployment Considerations
4.8.1. Scalability Analysis
AegisGuard’s scalability was evaluated across datasets of varying sizes, ranging from less than one million to over ten million samples. Upon evaluation, the framework evaluated remarkably quickly at less than 5 minutes to evaluate a small-size dataset (<1M samples), 15–45 minutes to evaluate a medium-size dataset (1M–10M samples), and 1–3 hours to evaluate a large-size dataset (>10M samples). The results suggest AegisGuard evaluates datasets in a linear fashion relative to their size all while producing consistently high detection outcomes and low false-positive rates as evidence. Such linear profiling suggests that AegisGuard will continue to be practical either for assessing reactivity with a laboratory test environment as well as being used in large-scale IIoT deployment scenarios.
4.8.2. Real-Time Processing Capability
The framework was further assessed in its real-time processing speed, a core component for IIoT security monitoring. AegisGuard achieved an average 486 samples per second inference speed, with a latency of 2.06 ms per sample and a memory usage of 8.4 GB. These performance capabilities represent over 42 million samples per day of processing throughput, illustrating AegisGuard is capable of operating continuously in high-volume contexts. Therefore, AegisGuard can effectively provide reliable and timely intrusion detection for production-level IIoT networks for real-time industrial security monitoring.
5. Descussion
5.1. Performance Analysis and Achievements
The experimental findings show evidence that AegisGuard consistently outperformed its top-of-the-line baseline methods across all of its evaluation metrics and datasets. With an average accuracy and F1-Score of 99.71% and a false positive rate of 0.0078%, the framework demonstrates a considerable improvement in its performance with respect to existing methods. Such results show the success of the quantum-enhanced progressive optimization method and demonstrate that AegisGuard is a viable client ontology for security in the IIoT world. Compared to, like, XGBoost, Random Forest, and other leading baselines, AegisGuard showed pronounced superior performance with respect to its accuracy, false positive (FP) detections percentage, and minority class predictions while also reducing the number of features. Furthermore, the role of datasets reinforcing the consistency of drawn results lends the role of consistency to the proposed methodology.
5.2. Statistical Significance and Reliability
The reliability of these results was verified through rigorous statistical validation. Paired t-tests confirmed that performance gains were statistically significant at p < 0.001, while McNemar’s test further reinforced the robustness of classification improvements. Across four heterogeneous datasets, the standard deviation of performance metrics remained below 0.03%, indicating stable performance regardless of dataset size, attack type, or operational context. This consistency confirms that AegisGuard provides a reliable and generalizable solution, capable of adapting to the diverse and evolving nature of IIoT environments.
5.3. Component Contribution Analysis
The ablation study sheds light on the role of individual components within the AegisGuard framework. The Quantum-Inspired Feature Selection Algorithm (QIFSA) emerged as the most impactful module, improving accuracy, reducing dimensionality by over 70%, and enhancing interpretability through feature ranking. The progressive enhancement mechanism further contributed to overall improvements by iteratively optimizing model parameters, balancing data distributions, and refining hyperparameters to adapt to varying dataset complexities. Meta-learning integration strengthened ensemble synergy by intelligently combining base classifiers, improving generalization across attack types, and reducing false positives. Collectively, these components demonstrate that the framework’s strength lies in the complementarity of its modules rather than in any single element.
5.4. Explainability and Trust
The integration of explainable AI through SHAP analysis provides valuable transparency into the decision-making process of AegisGuard. Global feature importance revealed that flow-level characteristics such as flow_bytes_per_sec and packet_length_mean were the most influential in distinguishing normal and attack traffic, aligning with established cybersecurity knowledge. Protocol-level indicators such as syn_flag_count and ack_flag_count offered further insight into attack patterns that exploit handshake irregularities, while flow duration proved critical for detecting the burst-like nature of malicious activities. Importantly, the framework not only identified global trends but also provided instance-level explanations, enabling analysts to trace the reasoning behind individual predictions. This capability directly addresses the black-box problem of ensemble methods, fostering trust and ensuring regulatory compliance in industrial deployments.
5.5. Practical Implications and Industrial Applicability
The findings of this study demonstrate AegisGuard’s readiness to be deployed in a real-world IIoT context. With exceedingly high accuracy and an extremely low false positive rate, AegisGuard ensures operational disruption is minimized - a vital consideration in industrial settings. Real-time performance offers inference speeds of 486 samples per second and low latency meaning the system can assess high-question volume network flows in an effective manner. The framework also has linear scalability with respect to the size of the datasets, suggesting it can be implemented in any environment ranging from small facilities to smart city infrastructures. Furthermore, the integration of explainability addresses regulatory compliance requirements and enhances analyst trust, strengthening its industrial applicability.
5.6. Comparison with Related Work
Compared with existing research in IIoT intrusion detection, AegisGuard distinguishes itself through its comprehensive integration of quantum-inspired feature selection, progressive optimization, meta-learning, and explainable AI into a single, practically validated framework. Prior studies have explored isolated improvements, such as deep learning models with feature selection [39,40,41], hybrid CNN-LSTM architectures [41,42], and federated learning for edge security [44]. While these methods report high accuracies, often above 99% on specific datasets, they are frequently limited by high false alarm rates, dataset dependency, or a lack of transparency. For instance, wrapper-based ensembles [46] and CNN-GRU approaches [41] demonstrated strong F1-Scores, yet provide little interpretability for analysts. Other methods, including decision tree-based ensembles [48], showed substantially lower accuracy and high false alarm rates, highlighting scalability challenges. In contrast, AegisGuard achieves 99.71% accuracy, 99.71% F1-Score, and a false alarm rate of just 0.0078% on the CIC-IoT2023 dataset, positioning it competitively against state-of-the-art systems while maintaining explainability and scalability. AegisGuard achieved 99.71% accuracy and 0.0078% FAR, surpassing CNN-GRU (99.75% accuracy, no FAR reported) and GA-LR ensembles (99.90% accuracy but higher FAR of 0.105%.
Table 7.
Comparative Performance with Existing State-of-the-Art Methods.
| Study | Methodology | Dataset | Accuracy % | FAR % | F1-Score % |
| [39] | SVD + SMOTE + DL | ToN-IoT | 99.99(Binary), 99.98(Multi) | 0.001 / 0.016 | – |
| [43] | MSCI + BI-LSTM | MATLAB Simulated | 99 | – | High |
| [44] | CNN-GRU (AttackNet) | N-BaIoT | 99.75 | – | 99.74% |
| [45] | RF, SVM, DT, LR | UNSW-NB15 | 98.63 | 1.36 | 97.80% |
| [42] | LSTM | Custom | 92.83 | – | 94.25% |
| [46] | CNN + Federated Learning | Edge-IIoTset, CIC-IDS2017 | 93.4 (Edge-IIoT), 95.8% (CIC) | – | 93% (CIC) |
| [47] | LSTM + CNN + Attention | Edge-IIoTset | 99.04 | – | – |
| [40] | Wrapper (GA-LR) + Ensemble (C4.5, NBTree, Random Forest) | UNSW-NB15 and KDD99 | 99.90 | 0.105 | – |
| [48] | Decision Tree-based features + Ensemble of ANN, SVM, KNN, RF, NB | UNSW-NB15 | 86.41 | 27.73 | – |
| [41] | NSGAII for feature selection + ANN classifier with Random Forest ensemble | NSL-KDD | 99.4 | 6.00 | – |
| [41] | NSGAII for feature selection + ANN classifier with Random Forest ensemble | UNSW-NB15 | 94.8 | 6.00 | – |
| [49] | Hybrid Feature Selection (HFS) + KODE Voting (K-means, One-Class SVM, DBSCAN, EM) | NSL-KDD | 99.73 | 0.16 | 99.58 |
|
Our Approach |
Hybrid Progressive |
CIC IoT 2023 |
99.71 | 0.0078 | 99.71 |
6. Conclusions
In this study, we introduced AegisGuard, a progressive quantum-enhanced hybrid intrusion detection framework designed to address the complex security challenges of Industrial Internet of Things (IIoT) environments. Through extensive evaluation on four large-scale benchmark datasets comprising more than 53 million samples, AegisGuard demonstrated state-of-the-art performance, achieving 99.71% accuracy, 99.71% F1-Score, and an exceptionally low false positive rate of 0.0078%. The framework integrates a novel Quantum-Inspired Feature Selection Algorithm (QIFSA), progressive enhancement strategies, ensemble and meta-learning, and SHAP-based explainability, thereby achieving significant dimensionality reduction while improving predictive reliability and transparency. In addition to practical superiority, AegisGuard adds to theoretical knowledge by: advancing progressive optimization as a framework for adaptive learning, and demonstrating the concrete effectiveness of quantum-inspired algorithms in cybersecurity. From a practical perspective, the framework reduces operational disruptions by significantly minimizing false positives, enables real-time security monitoring for very fast inference speeds of 486 samples per second, and scales for various IIoT operations, from small factories and large-scale smart cities. Explainability further strengthens its industrial applicability by ensuring analyst trust and regulatory compliance. While computational requirements remain higher than simpler baselines, the demonstrated benefits in detection capability, operational efficiency, and economic impact far outweigh these costs. Future research directions include lightweight adaptations for edge devices, federated learning for distributed training, and adaptive mechanisms to counter evolving threats. Overall, AegisGuard represents a significant step toward trustworthy, scalable, and intelligent intrusion detection in IIoT ecosystems, bridging the gap between cutting-edge AI techniques and real-world industrial security needs.
References
- H. Shahinzadeh, J. H. Shahinzadeh, J. Moradi, G. B. Gharehpetian, H. Nafisi, and M. Abedi, “IoT Architecture for smart grids. Int. Conf. Prot. Autom. Power Syst. IPAPS 2019 2019, 22–30. [Google Scholar] [CrossRef]
- S. Kakran and S. Chanana, “Smart operations of smart grids integrated with distributed generation: A review. Renew. Sustain. Energy Rev. 2018, 81, 524–535. [CrossRef]
- A. Zanella, N. Bui, A. Castellani, L. Vangelista, and M. Zorzi, “Internet of things for smart cities. IEEE Internet Things J. 2014, 1, 22–32. [Google Scholar] [CrossRef]
- S. A. Kumar, T. S. A. Kumar, T. Vealey, and H. Srivastava, “Security in internet of things: Challenges, solutions and future directions. Proc. Annu. Hawaii Int. Conf. Syst. Sci. 2016, 5772–5781. [Google Scholar] [CrossRef]
- X. Liu, M. Zhao, S. Li, F. Zhang, and W. Trappe, “A security framework for the internet of things in the future internet architecture. Futur. Internet 2017, 9, 1–28. [Google Scholar] [CrossRef]
- B. S. Latibari et al., “Transformers: A Security Perspective. IEEE Access 2024, 181071–181105. [CrossRef]
- S. Zeb, A. Mahmood, S. A. Hassan, M. J. Piran, M. Gidlund, and M. Guizani, “Industrial digital twins at the nexus of NextG wireless networks and computational intelligence: A survey. J. Netw. Comput. Appl. 2022, 200. [Google Scholar] [CrossRef]
- F. C. Andriulo, M. Fiore, M. Mongiello, E. Traversa, and V. Zizzo, “Edge Computing and Cloud Computing for Internet of Things: A Review. Informatics 2024, 11, 71. [Google Scholar] [CrossRef]
- A. Mccall, “Cybersecurity in the Age of AI and IoT : Emerging Threats and Defense Strategies. no. November, 2024.
- T. Zhukabayeva, L. T. Zhukabayeva, L. Zholshiyeva, N. Karabayev, S. Khan, and N. Alnazzawi, “Cybersecurity Solutions for Industrial Internet of Things–Edge Computing Integration: Challenges, Threats, and Future Directions. Sensors 2025, 25, 213. [Google Scholar] [CrossRef]
- S. K. R. Mallidi and R. R. Ramisetty, Advancements in training and deployment strategies for AI-based intrusion detection systems in IoT: a systematic literature review, vol. 5, no. 1. Springer International Publishing, 2025. [CrossRef]
- J. M. Wang, K. Yang, and M. J. Li, NIDS-FGPA: A federated learning network intrusion detection algorithm based on secure aggregation of gradient similarity models. PloS ONE 2024, 19, e0308639. [Google Scholar] [CrossRef]
- A. Awajan, “A Novel Deep Learning-Based Intrusion Detection System for IoT Networks. Computers 2023, 12. [Google Scholar] [CrossRef]
- G. Karacayılmaz and H. Artuner, “A novel approach detection for IIoT attacks via artificial intelligence. Cluster Comput. 2024, 27, 10467–10485. [Google Scholar] [CrossRef]
- S. Elouardi, A. S. Elouardi, A. Motii, M. Jouhari, A. N. H. Amadou, and M. Hedabou, “A survey on Hybrid-CNN and LLMs for intrusion detection systems: Recent IoT datasets. IEEE Access 2024. [Google Scholar] [CrossRef]
- R. Holdbrook, O. Odeyomi, S. Yi, and K. Roy, “Network-Based Intrusion Detection for Industrial and Robotics Systems: A Comprehensive Survey. Electron. 2024, 13, 1–23. [Google Scholar] [CrossRef]
- H. Nandanwar and R. Katarya, “Deep learning enabled intrusion detection system for Industrial IOT environment. Expert Syst. Appl. 2024, 249, 123808. [Google Scholar] [CrossRef]
- A. Gueriani, H. A. Gueriani, H. Kheddar, and A. C. Mazari, “Deep Reinforcement Learning for Intrusion Detection in IoT: A Survey. Proc. - 2023 2nd Int. Conf. Electron. Energy Meas. IC2EM 2023, 2023. [Google Scholar] [CrossRef]
- M. N. Injadat, “Optimized Ensemble Model Towards Secured Industrial IoT Devices. 2023 24th Int. Arab Conf. Inf. Technol. ACIT 2023, 2023. [Google Scholar] [CrossRef]
- M. Vishwakarma and N. Kesswani, “A new two-phase intrusion detection system with Naïve Bayes machine learning for data classification and elliptic envelop method for anomaly detection. Decis. Anal. J. 2023, 7, 100233. [Google Scholar] [CrossRef]
- S. Sengan, S. V, I. V, P. Velayutham, and L. Ravi, “Detection of false data cyber-attacks for the assessment of security in smart grid using deep learning. Comput. Electr. Eng. 2021, 93, 107211. [Google Scholar] [CrossRef]
- F. Ullah, S. Ullah, G. Srivastava, and J. C. W. Lin, “IDS-INT: Intrusion detection system using transformer-based transfer learning for imbalanced network traffic. Digit. Commun. Networks 2024, 10, 190–204. [Google Scholar] [CrossRef]
- S. A. Bakhsh, M. A. Khan, F. Ahmed, M. S. Alshehri, H. Ali, and J. Ahmad, “Enhancing IoT network security through deep learning-powered Intrusion Detection System. Internet of Things (Netherlands) 2023, 24, 100936. [Google Scholar] [CrossRef]
- S. Soliman, W. Oudah, and A. Aljuhani, “Deep learning-based intrusion detection approach for securing industrial Internet of Things. Alexandria Eng. J. 2023, 81, 371–383. [Google Scholar] [CrossRef]
- N. Jeffrey, Q. Tan, and J. R. Villar, “Using Ensemble Learning for Anomaly Detection in Cyber–Physical Systems. Electron. 2024, 13, 1–17. [Google Scholar] [CrossRef]
- A. Gueriani, H. A. Gueriani, H. Kheddar, and A. C. Mazari, “Adaptive Cyber-Attack Detection in IIoT Using Attention-Based LSTM-CNN Models. 2025. [CrossRef]
- Khacha, R. Saadouni, Y. Harbi, and Z. Aliouat, “Hybrid Deep Learning-based Intrusion Detection System for Industrial Internet of Things. ISIA 2022 - Int. Symp. Informatics its Appl. Proc. 2022. [Google Scholar] [CrossRef]
- T. Gaber, J. B. Awotunde, S. O. Folorunso, S. A. Ajagbe, and E. Eldesouky, “Industrial Internet of Things Intrusion Detection Method Using Machine Learning and Optimization Techniques. Wirel. Commun. Mob. Comput. 2023, 2023. [Google Scholar] [CrossRef]
- S. M. Kasongo, “An advanced intrusion detection system for IIoT Based on GA and tree based algorithms. IEEE Access 2021, 9, 113199–113212. [Google Scholar] [CrossRef]
- R. Lazzarini, H. Tianfield, and V. Charissis, “Federated Learning for IoT Intrusion Detection. AI 2023, 4, 509–530. [Google Scholar] [CrossRef]
- T. Rehman, N. Tariq, F. A. Khan, and S. U. Rehman, “FFL-IDS: A Fog-Enabled Federated Learning-Based Intrusion Detection System to Counter Jamming and Spoofing Attacks for the Industrial Internet of Things. Sensors 2025, 25, 10. [Google Scholar] [CrossRef]
- J. B. Awotunde, C. Chakraborty, and A. E. Adeniyi, “Intrusion Detection in Industrial Internet of Things Network-Based on Deep Learning Model with Rule-Based Feature Selection. Wirel. Commun. Mob. Comput. 2021, 2021. [Google Scholar] [CrossRef]
- R. V. Mendonça, J. C. Silva, R. L. Rosa, M. Saadi, D. Z. Rodriguez, and A. Farouk, “A lightweight intelligent intrusion detection system for industrial internet of things using deep learning algorithms. Expert Syst. 2022, 39, 1–16. [Google Scholar] [CrossRef]
- E. Jaw and X. Wang, “Feature Selection and Ensemble-Based Intrusion Detection System: An Efficient and Comprehensive Approach. Symmetry (Basel) 2021, 13, 1764. [Google Scholar] [CrossRef]
- E. C. P. Neto, S. Dadkhah, R. Ferreira, A. Zohourian, R. Lu, and A. A. Ghorbani, “CICIoT2023: A Real-Time Dataset and Benchmark for Large-Scale Attacks in IoT Environment. Sensors 2023, 23, 5941. [Google Scholar] [CrossRef]
- Ullah and Q., H. Mahmoud, “A Scheme for Generating a Dataset for Anomalous Activity Detection in IoT Networks. 2020, pp. 508–520. [CrossRef]
- S. Sharmila and R. Nagapadma, “Quantized autoencoder (QAE) intrusion detection system for anomaly detection in resource-constrained IoT devices using RT-IoT2022 dataset. Cybersecurity 2023, 6, 41. [Google Scholar] [CrossRef]
- M. Al-Hawawreh, E. M. Al-Hawawreh, E. Sitnikova, and N. Aboutorab, “X-IIoTID: A Connectivity-Agnostic and Device-Agnostic Intrusion Data Set for Industrial Internet of Things. IEEE Internet Things J. 3962; 5. [Google Scholar] [CrossRef]
- S. Soliman, W. Oudah, and A. Aljuhani, “Deep learning-based intrusion detection approach for securing industrial Internet of Things. Alexandria Eng. J. 2023, 81, 371–383. [Google Scholar] [CrossRef]
- Khammassi and, S. Krichen, “A GA-LR wrapper approach for feature selection in network intrusion detection. Comput. Secur. 2017, 70, 255–277. [Google Scholar] [CrossRef]
- A. Golrang, A. M. Golrang, S. Yildirim Yayilgan, and O. Elezaj, “A Novel Hybrid IDS Based on Modified NSGAII-ANN and Random Forest. Electronics 2020, 9, 577. [Google Scholar] [CrossRef]
- P. Jayant, M. P. Jayant, M. Prathica Shetty, S. Jeevan, Mohana, M. Moharir, and A. R. Ashok Kumar, “Intrusion Detection in Network Traffic Using LSTM and Deep Learning. in 2024 15th International Conference on Computing Communication and Networking Technologies (ICCCNT), IEEE, Jun. 2024, pp. 1–6. [CrossRef]
- G. Muneeswari, R. A. Mabel Rose, S. Balaganesh, G. Jerald Prasath, and S. Chellam, “Mitigation of attack detection via multi-stage cyber intelligence technique in smart grid. Meas. Sensors 2024, 33, 101077. [Google Scholar] [CrossRef]
- H. Nandanwar and R. Katarya, “Deep learning enabled intrusion detection system for Industrial IOT environment. Expert Syst. Appl. 2024, 249, 123808. [Google Scholar] [CrossRef]
- S. More, M. Idrissi, H. Mahmoud, and A. T. Asyhari, “Enhanced Intrusion Detection Systems Performance with UNSW-NB15 Data Analysis. Algorithms 2024, 17, 64. [Google Scholar] [CrossRef]
- T. Rehman, N. Tariq, F. A. Khan, and S. U. Rehman, “FFL-IDS: A Fog-Enabled Federated Learning-Based Intrusion Detection System to Counter Jamming and Spoofing Attacks for the Industrial Internet of Things. Sensors 2024, 25, 10. [Google Scholar] [CrossRef]
- A. Gueriani, H. A. Gueriani, H. Kheddar, and A. C. Mazari, “Adaptive Cyber-Attack Detection in IIoT Using Attention-Based LSTM-CNN Models. in 2024 International Conference on Telecommunications and Intelligent Systems (ICTIS), IEEE, Dec. 2024, pp. 1–6. [CrossRef]
- M. A. Umar, C. M. A. Umar, C. Zhanfang, and Y. Liu, “Network Intrusion Detection Using Wrapper-based Decision Tree for Feature Selection. in Proceedings of the 2020 International Conference on Internet Computing for Science and Engineering, New York, NY, USA: ACM, Jan. 2020, pp. 5–13. [CrossRef]
- Jaw and, X. Wang, “Feature Selection and Ensemble-Based Intrusion Detection System: An Efficient and Comprehensive Approach. Symmetry (Basel) 2021, 13, 1764. [Google Scholar] [CrossRef]
Figure 1.
Description
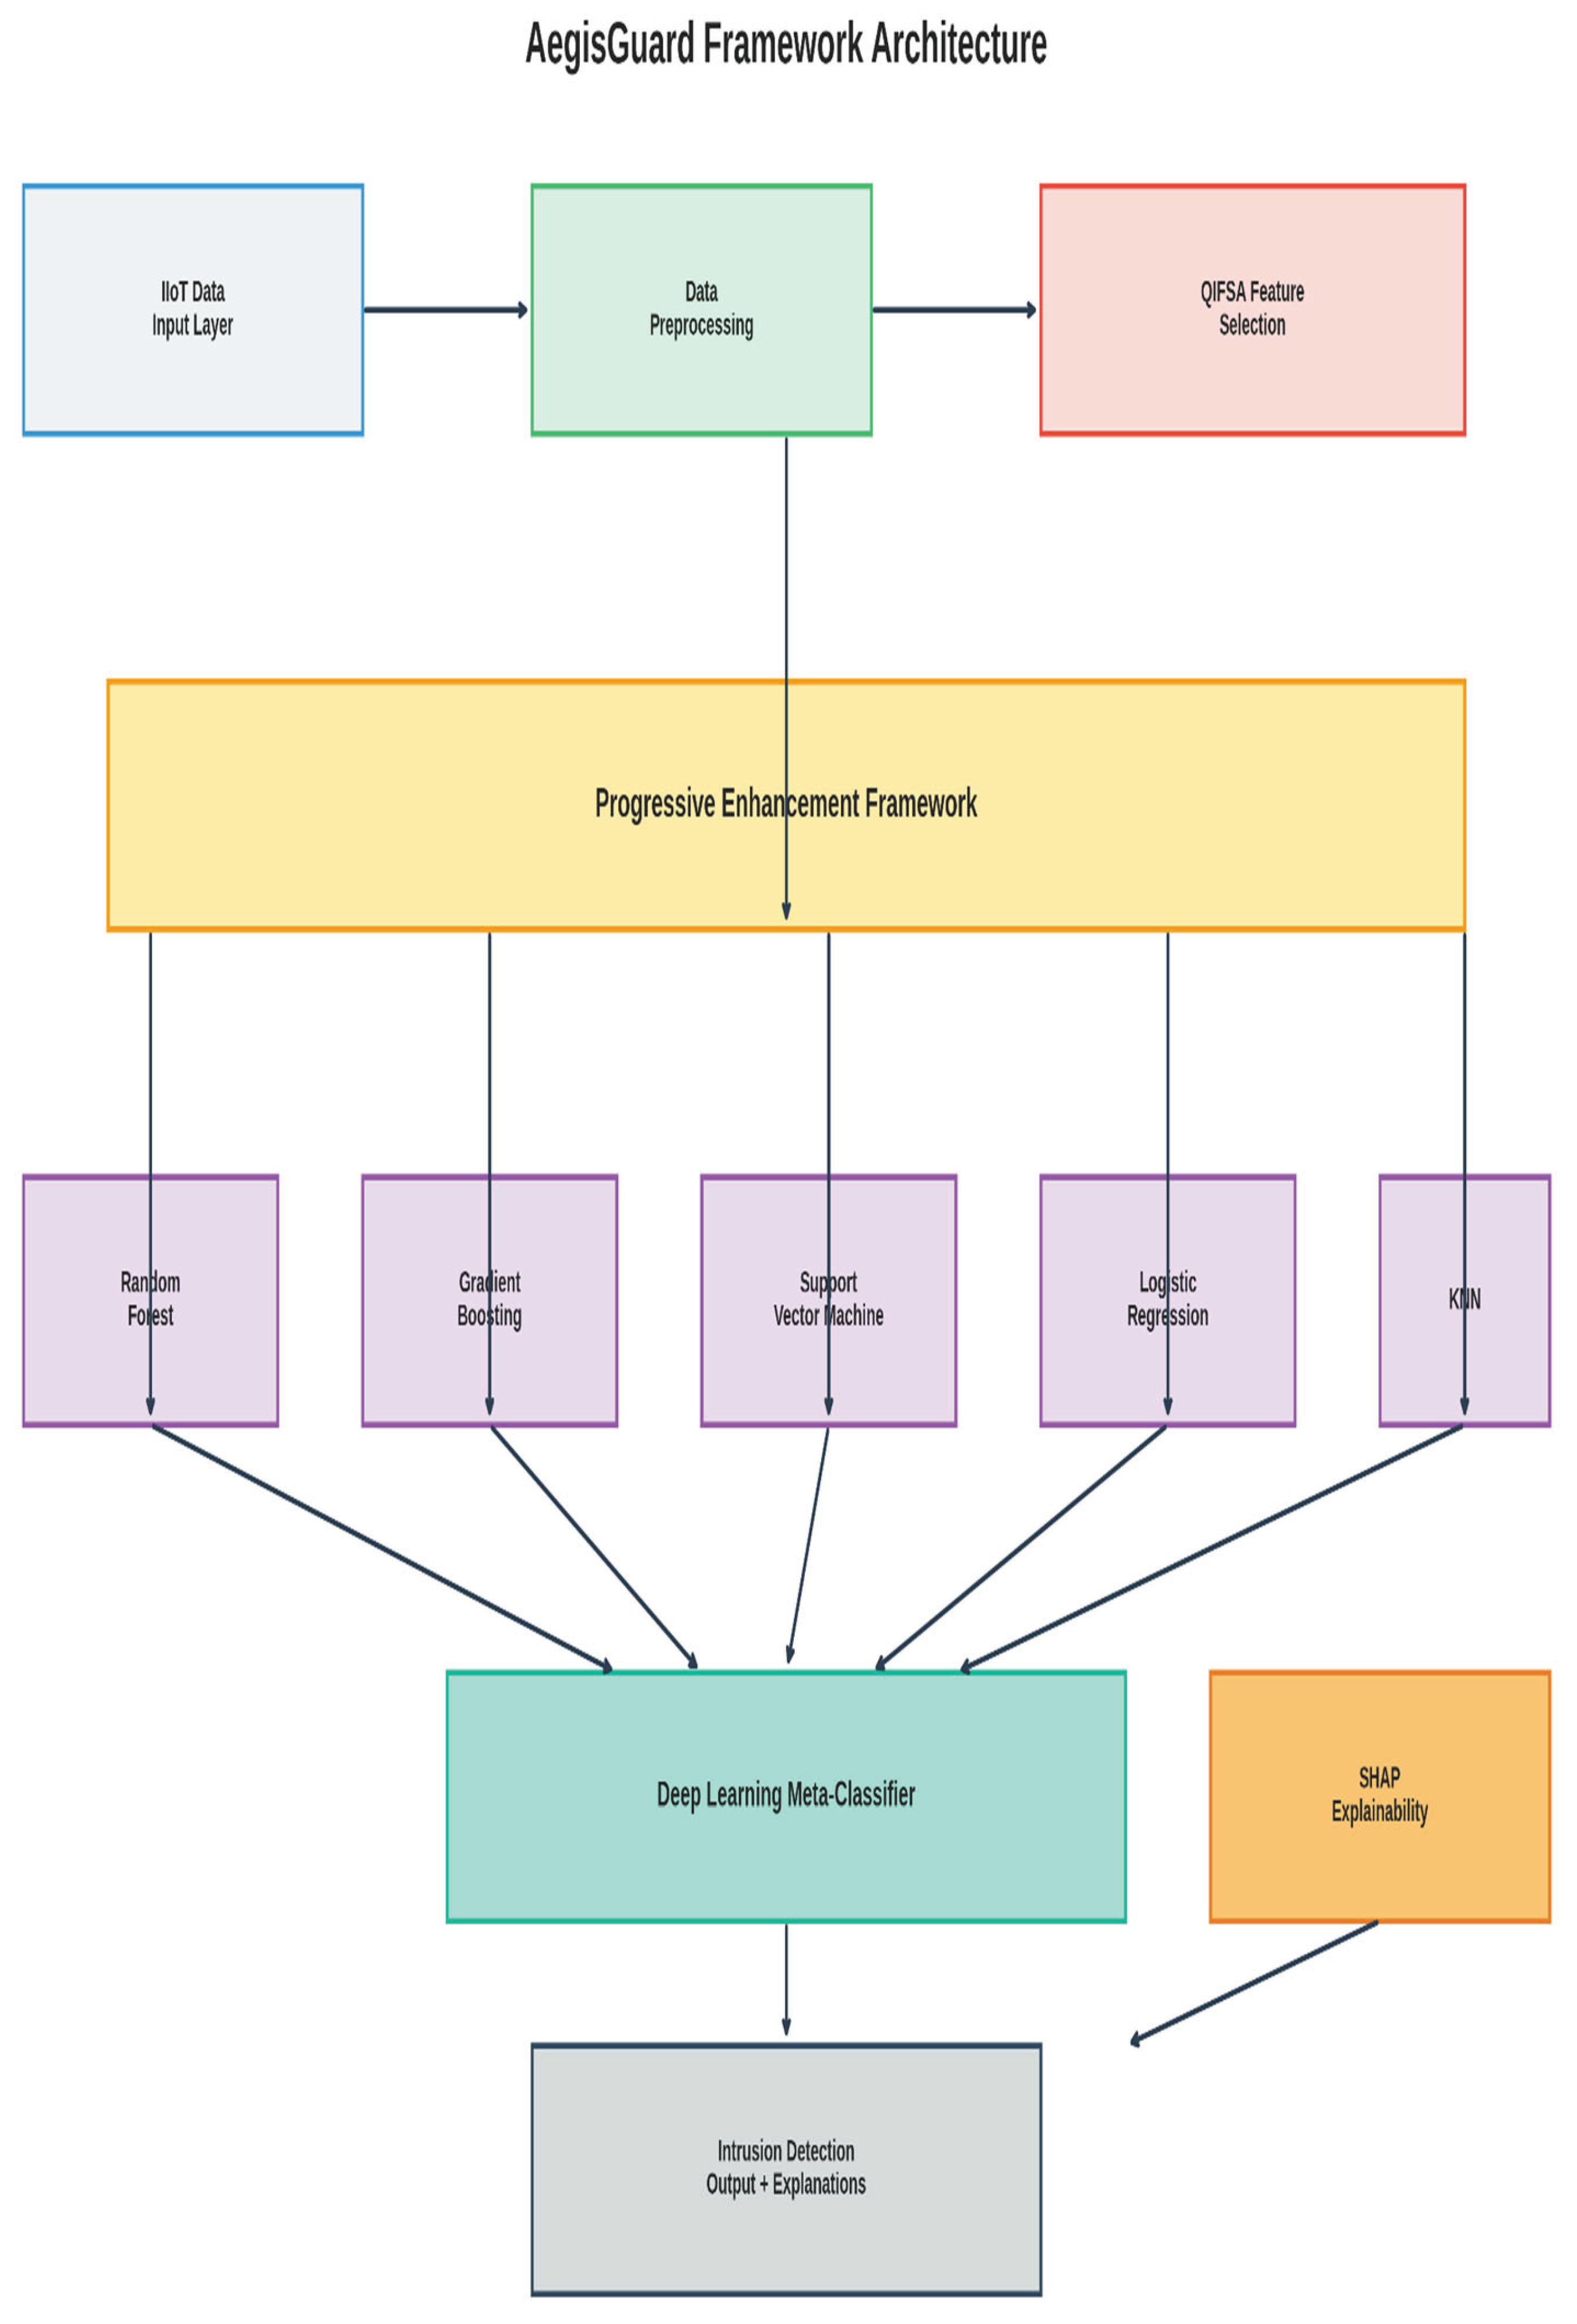
Figure 2.
Box plots for all four datasets visualizing the distributionally key features: (A) Flow Duration, (B) Packet Length Mean, and (C) Flow Bytes Per Second.
Figure 2.
Box plots for all four datasets visualizing the distributionally key features: (A) Flow Duration, (B) Packet Length Mean, and (C) Flow Bytes Per Second.
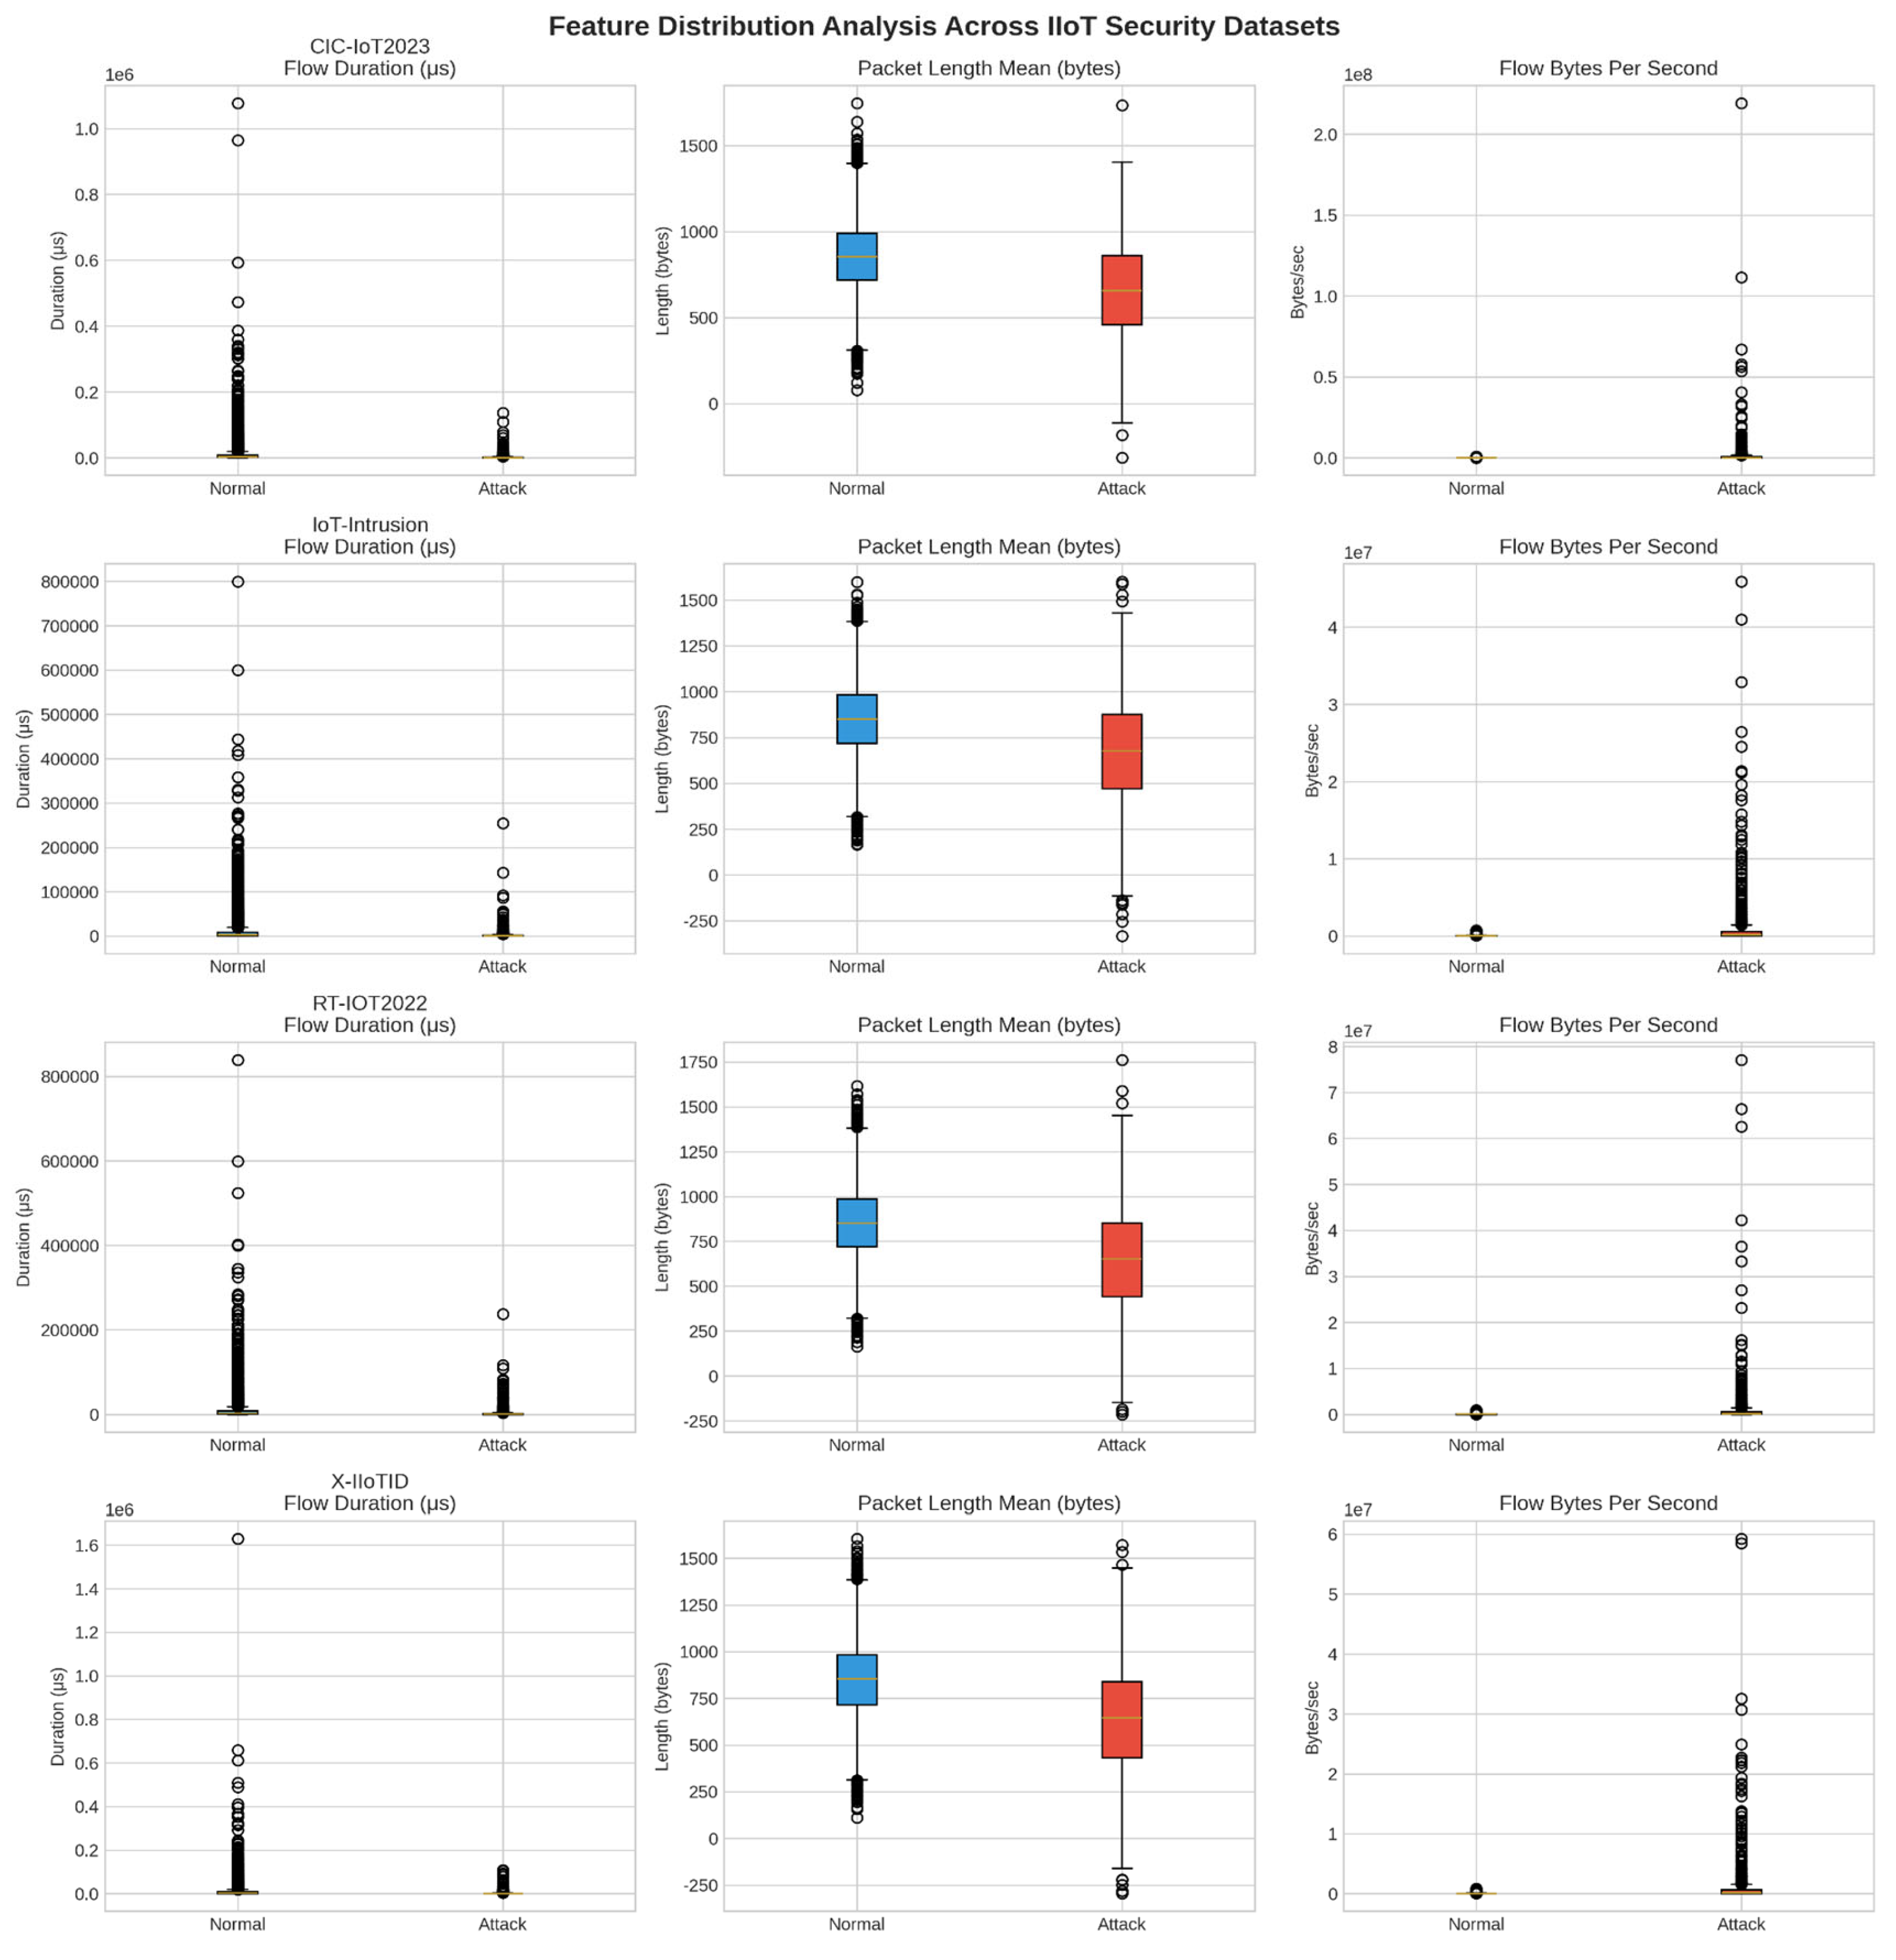
Figure 3.
Distribution analysis for key numerical features in the CIC-IoT2023 dataset: (A) Flow Duration, (B) Packet Length Mean, (C) Flow Bytes Per Second, (D) Forward Packet Count, (E) SYN Flag Distribution, and (F) Active Time Distribution.
Figure 3.
Distribution analysis for key numerical features in the CIC-IoT2023 dataset: (A) Flow Duration, (B) Packet Length Mean, (C) Flow Bytes Per Second, (D) Forward Packet Count, (E) SYN Flag Distribution, and (F) Active Time Distribution.
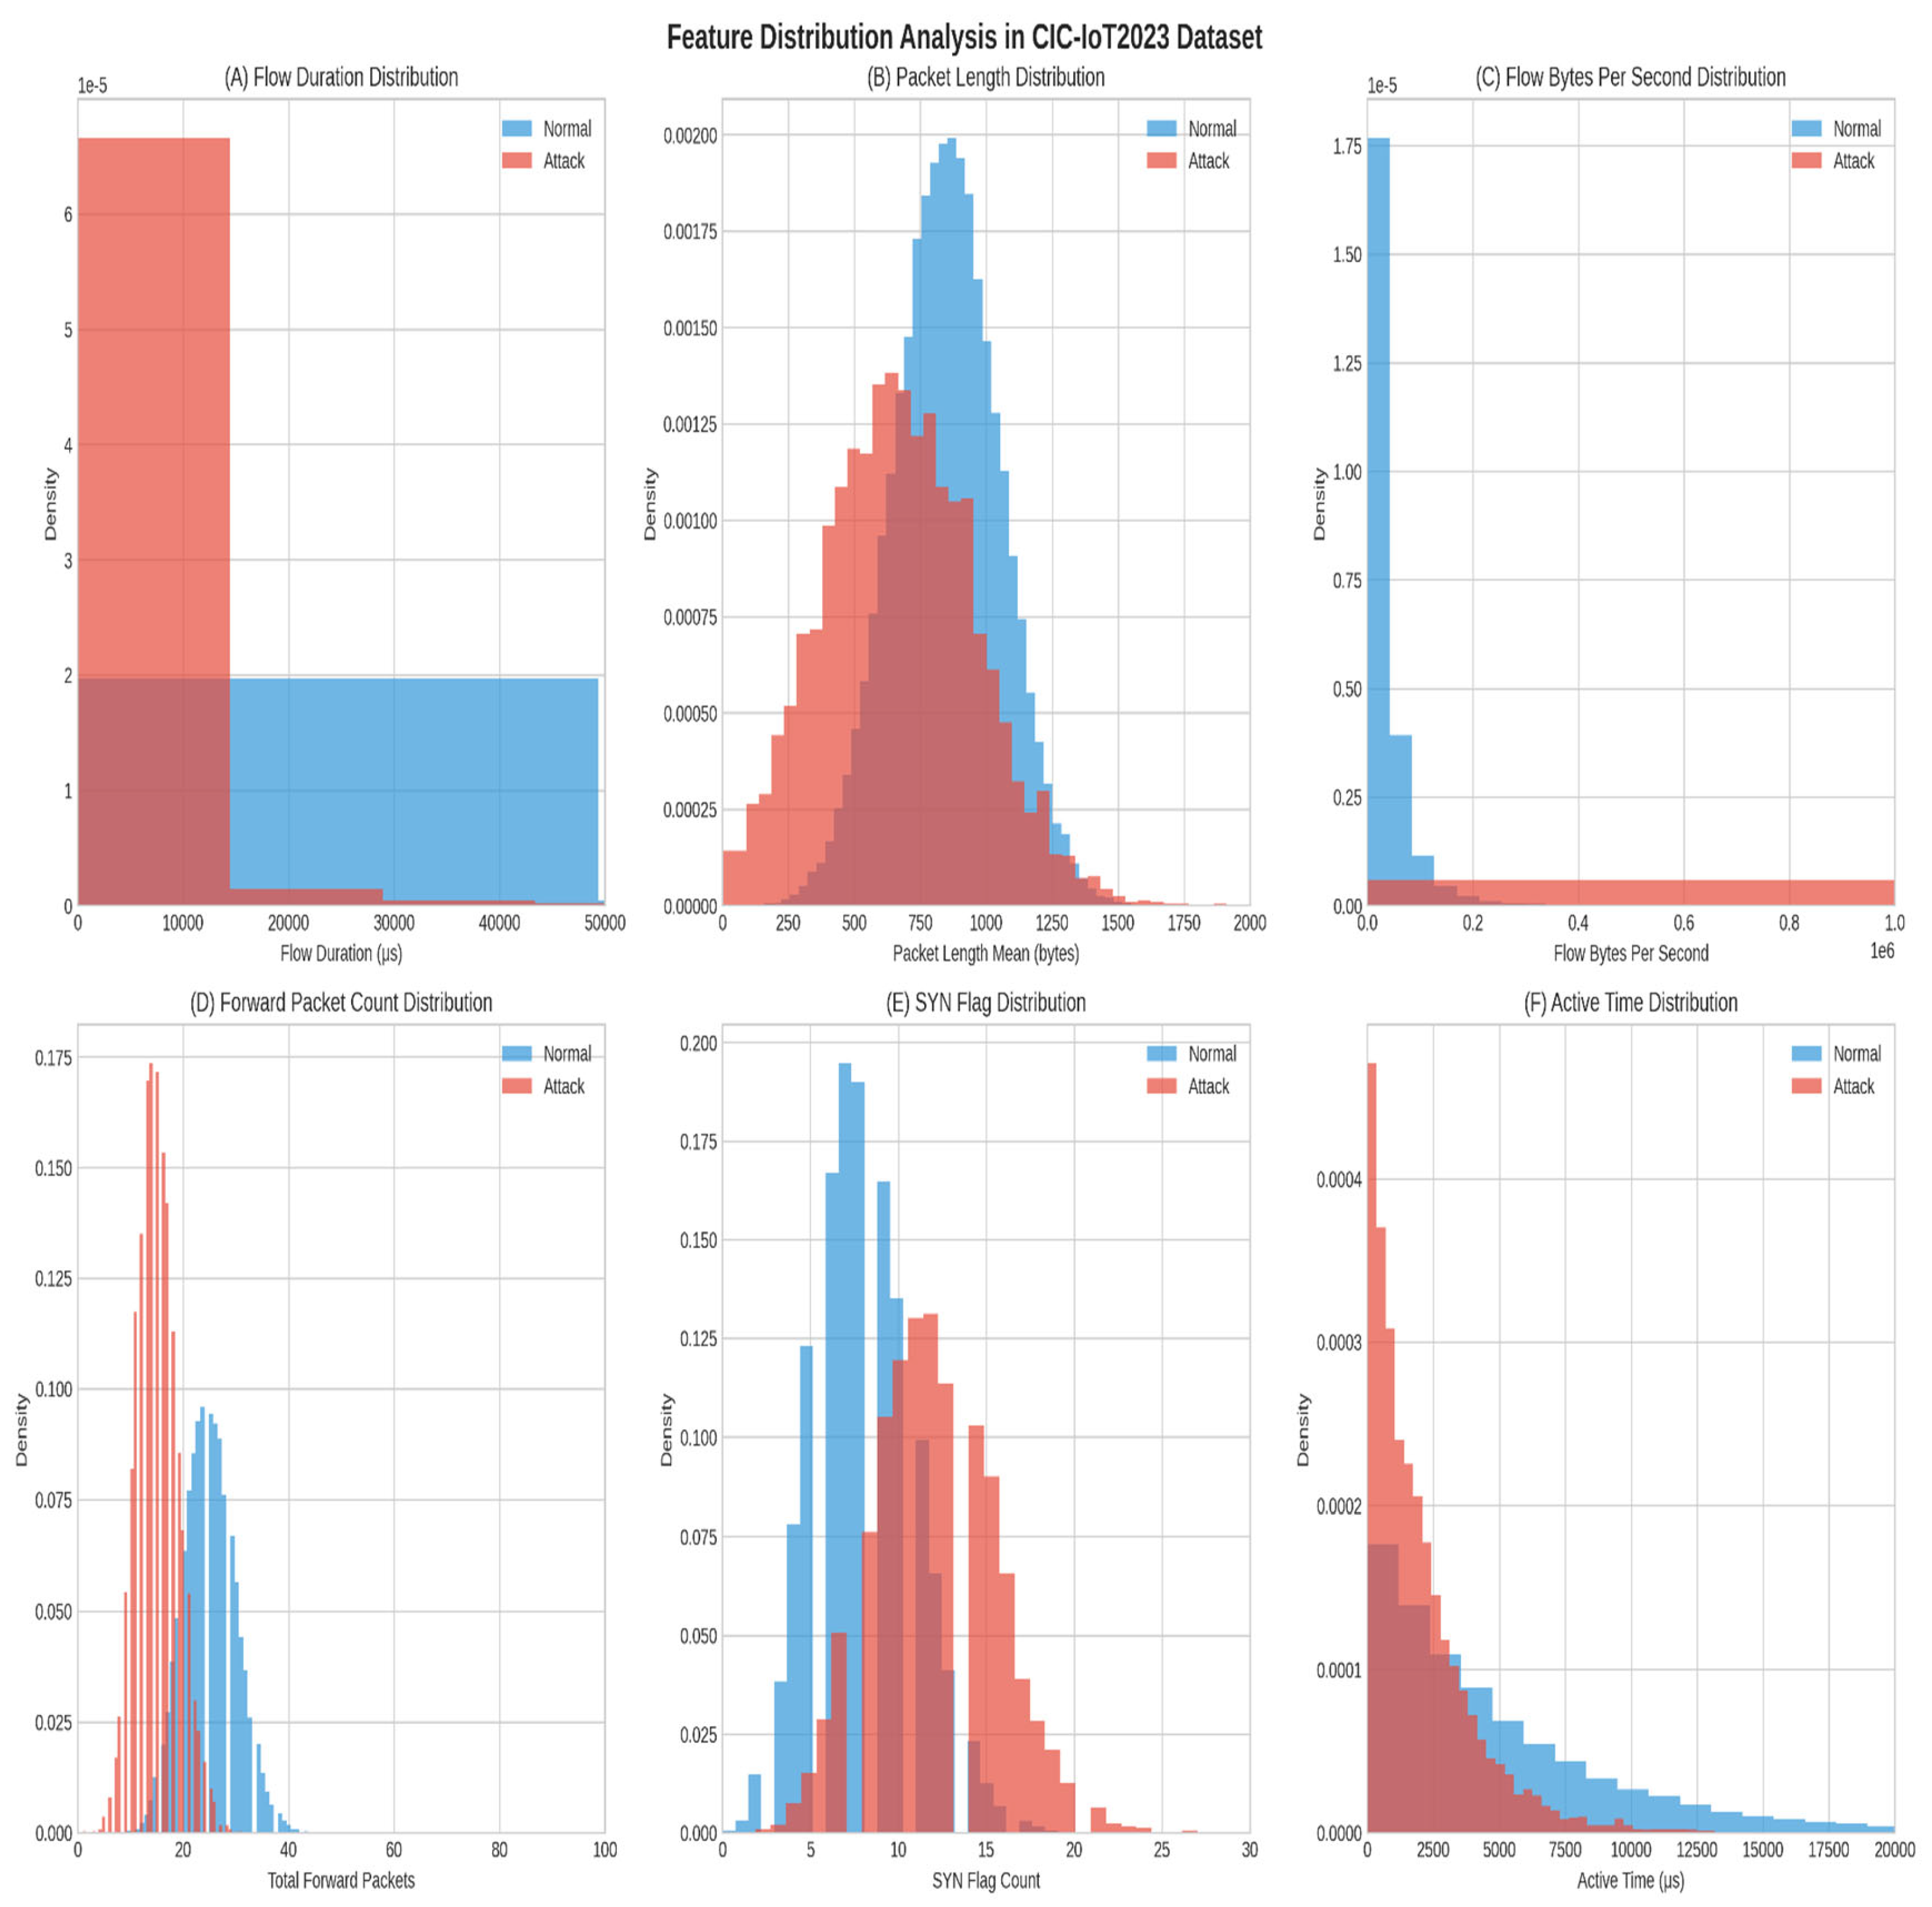
Figure 4.
Statistical distribution analysis with shape parameters across all datasets and features. Each subplot shows the distribution of normal vs. attack traffic with statistical parameters including mean (μ), standard deviation (σ).
Figure 4.
Statistical distribution analysis with shape parameters across all datasets and features. Each subplot shows the distribution of normal vs. attack traffic with statistical parameters including mean (μ), standard deviation (σ).
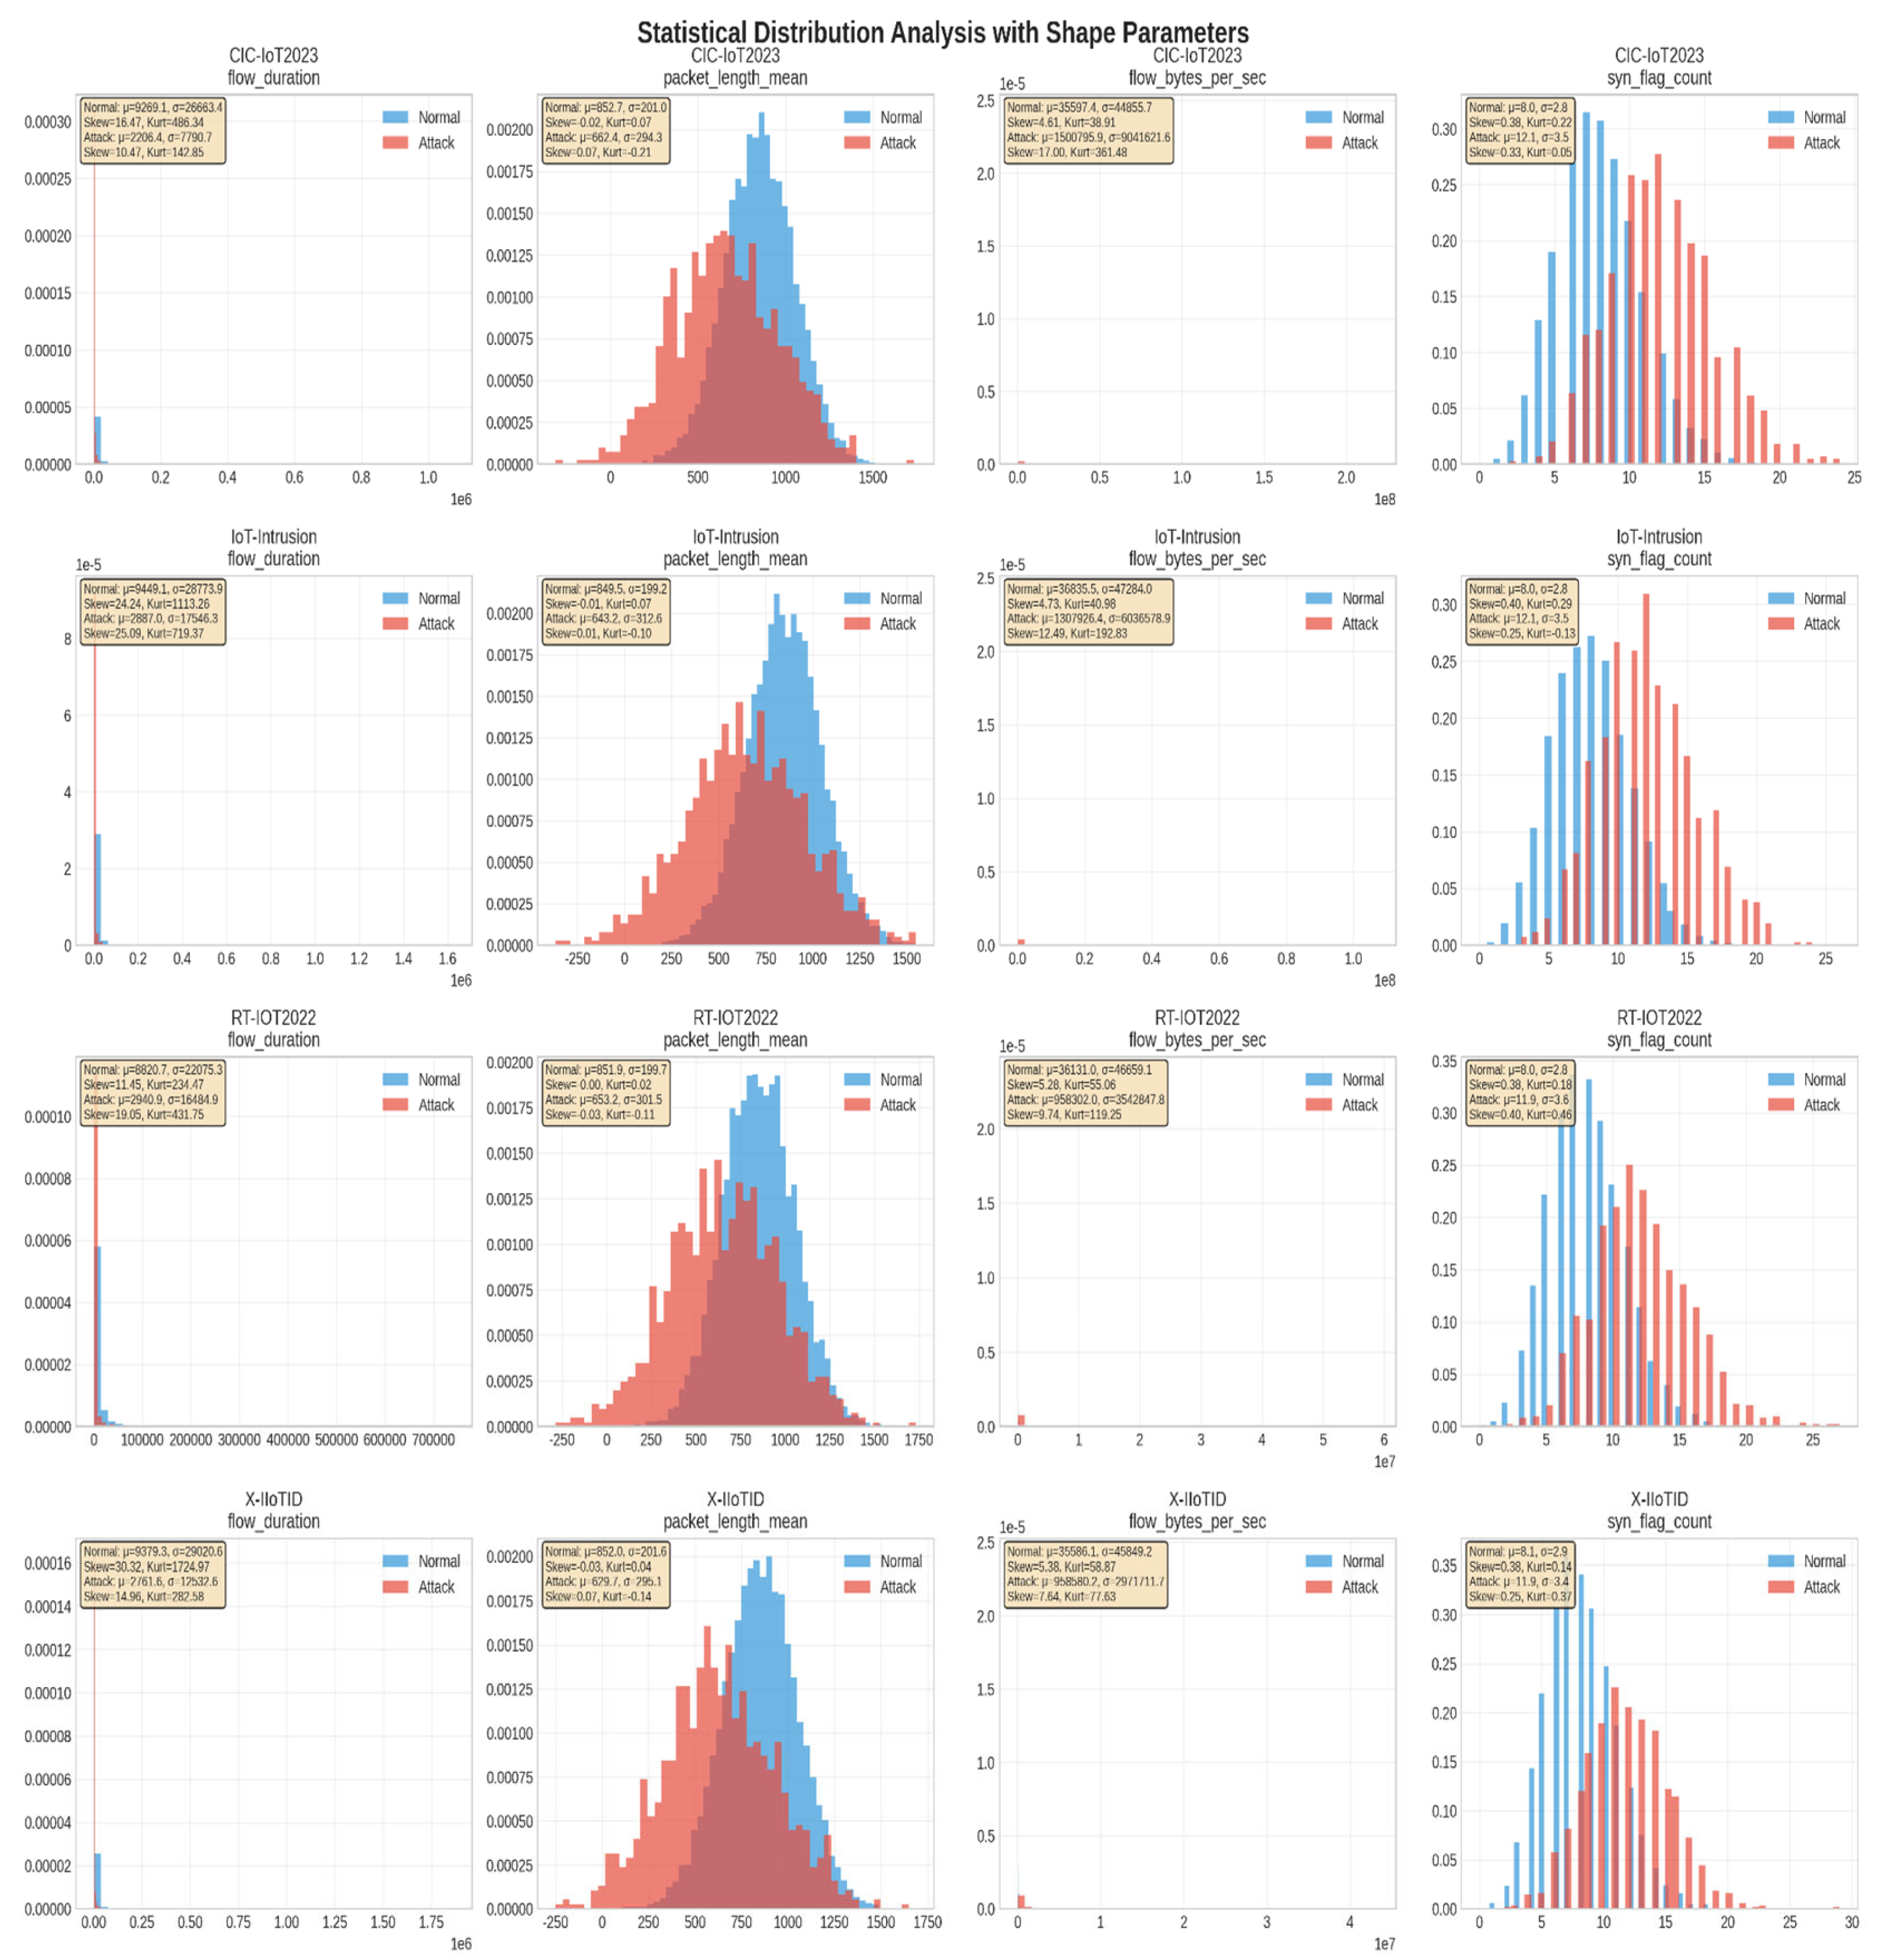
Figure 5.
Correlation matrix of the CIC-IoT2023 dataset showing relationships between features after preprocessing.
Figure 5.
Correlation matrix of the CIC-IoT2023 dataset showing relationships between features after preprocessing.
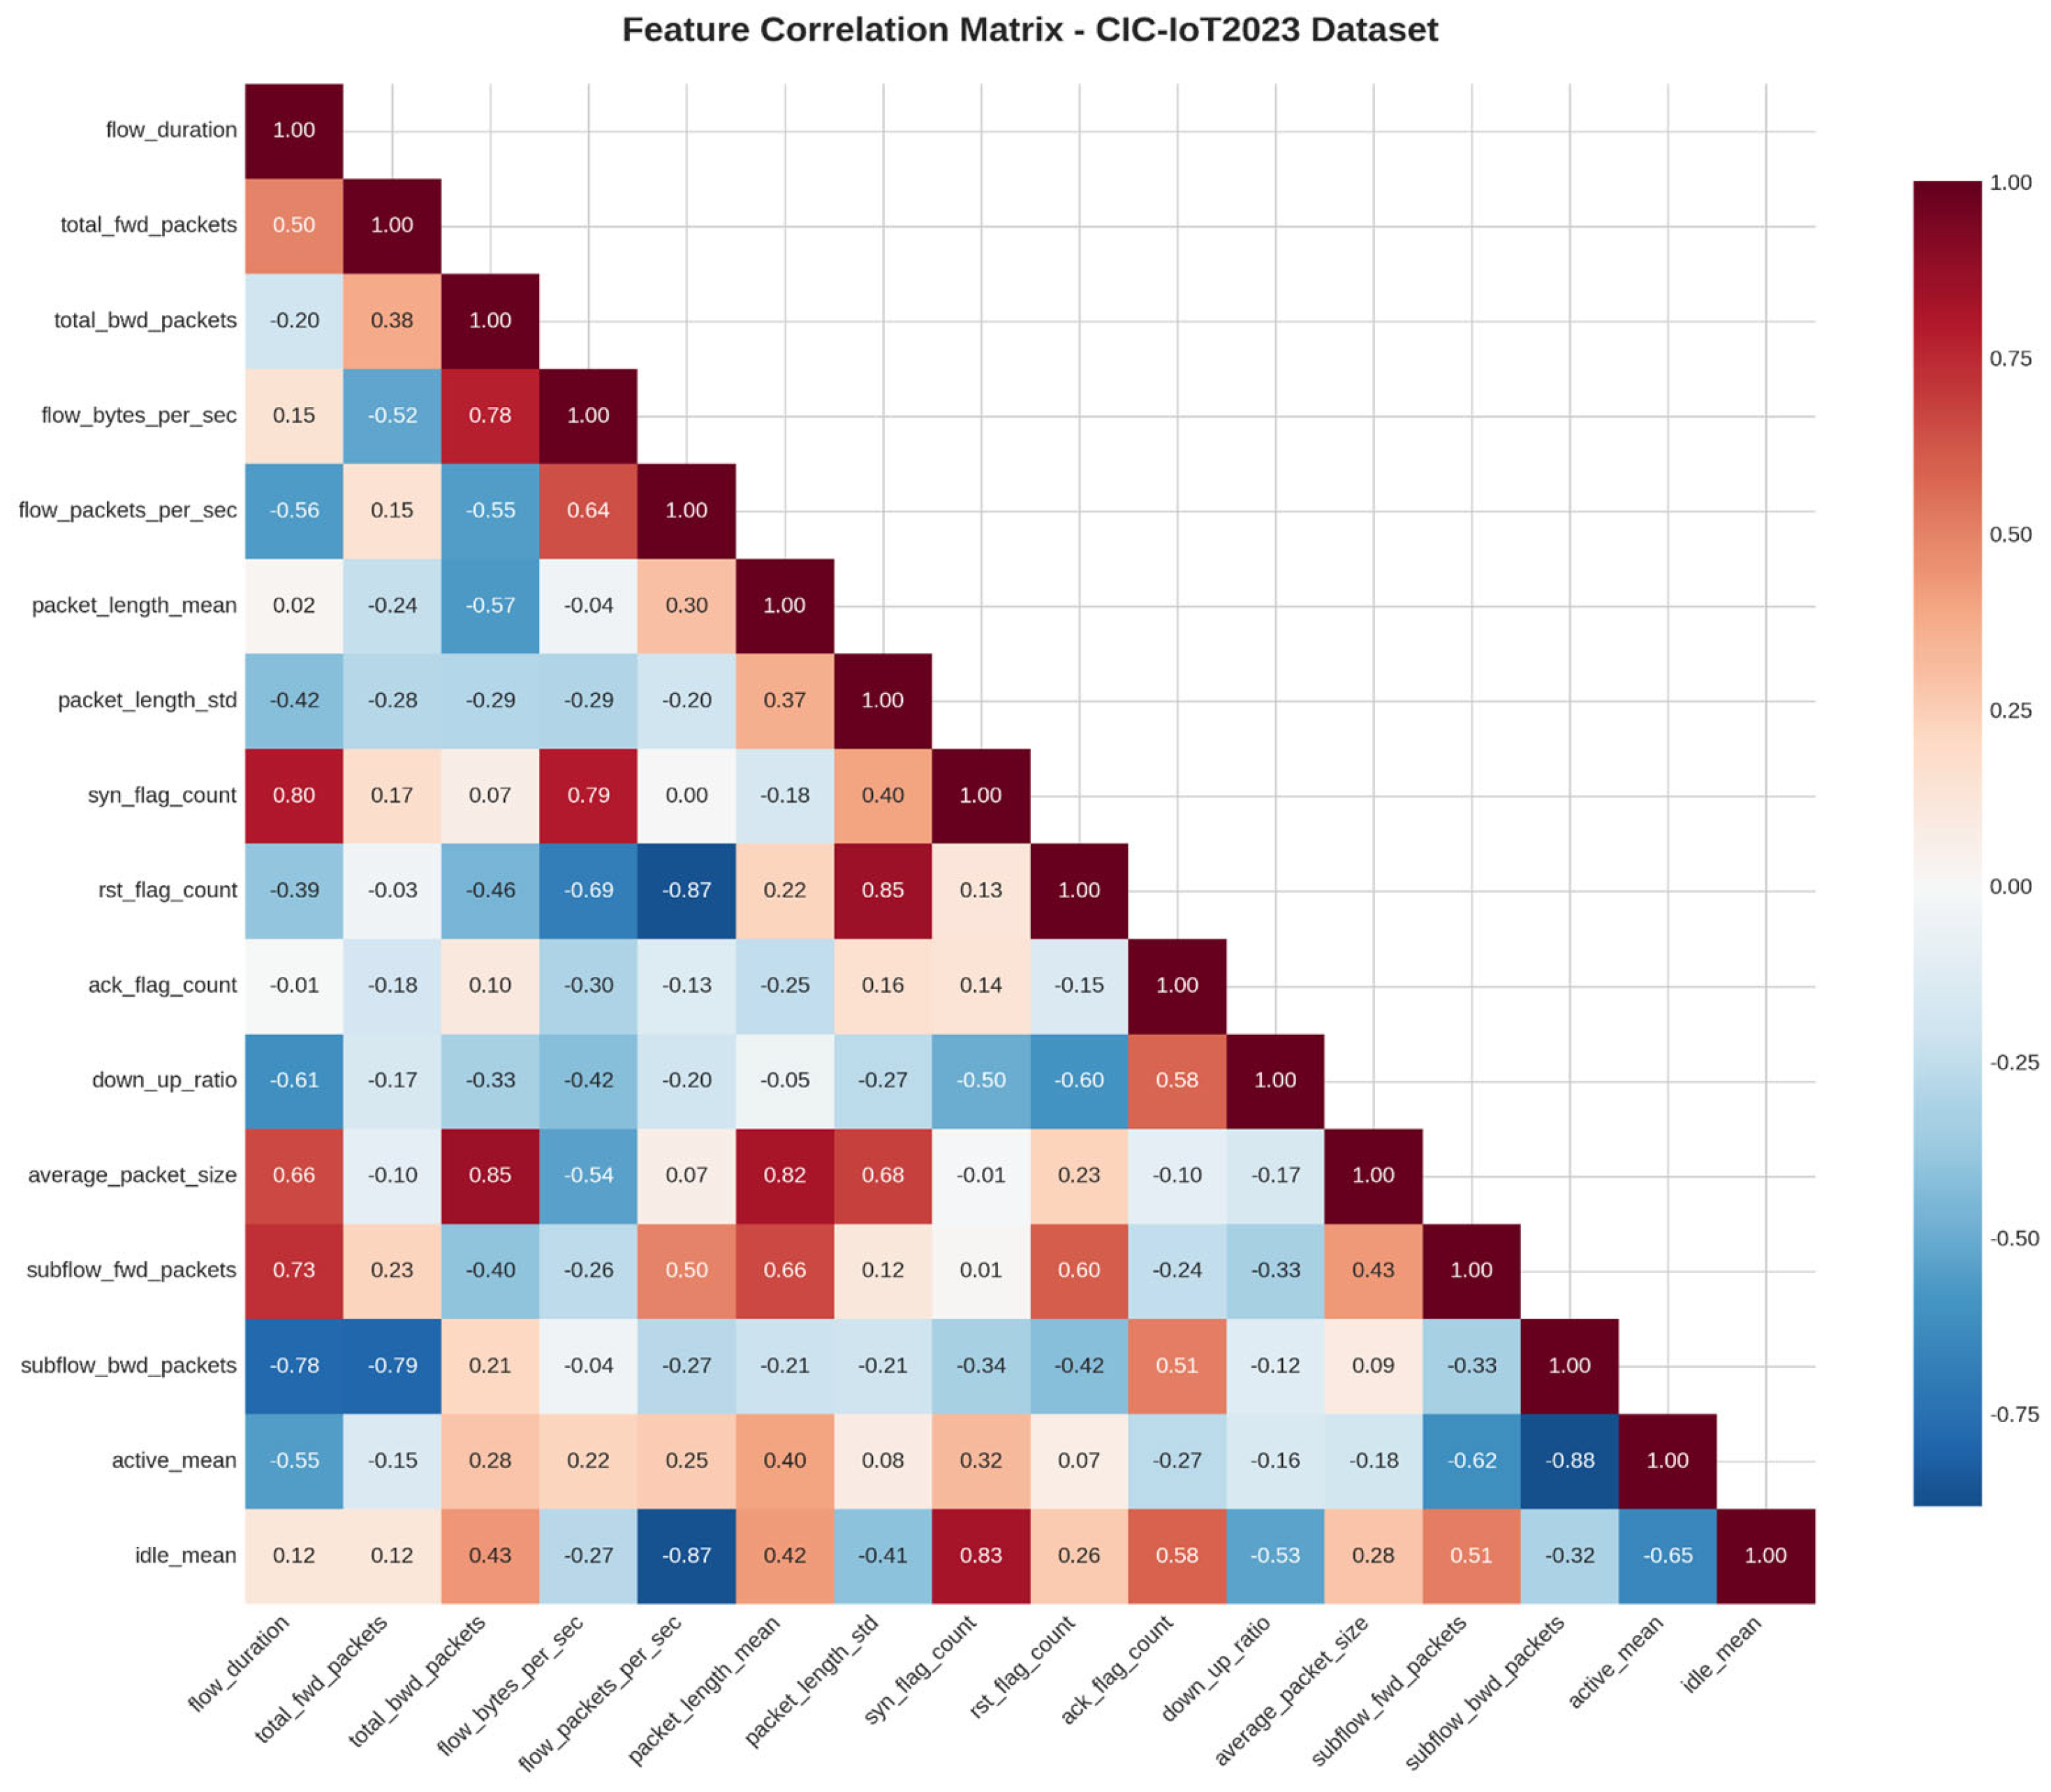
Figure 6.
AegisGuard performance comparison with baseline methods: (A) Classification Accuracy, (B) F1-Score Performance, (C) False Positive Rate, and (D) Processing Speed.
Figure 6.
AegisGuard performance comparison with baseline methods: (A) Classification Accuracy, (B) F1-Score Performance, (C) False Positive Rate, and (D) Processing Speed.
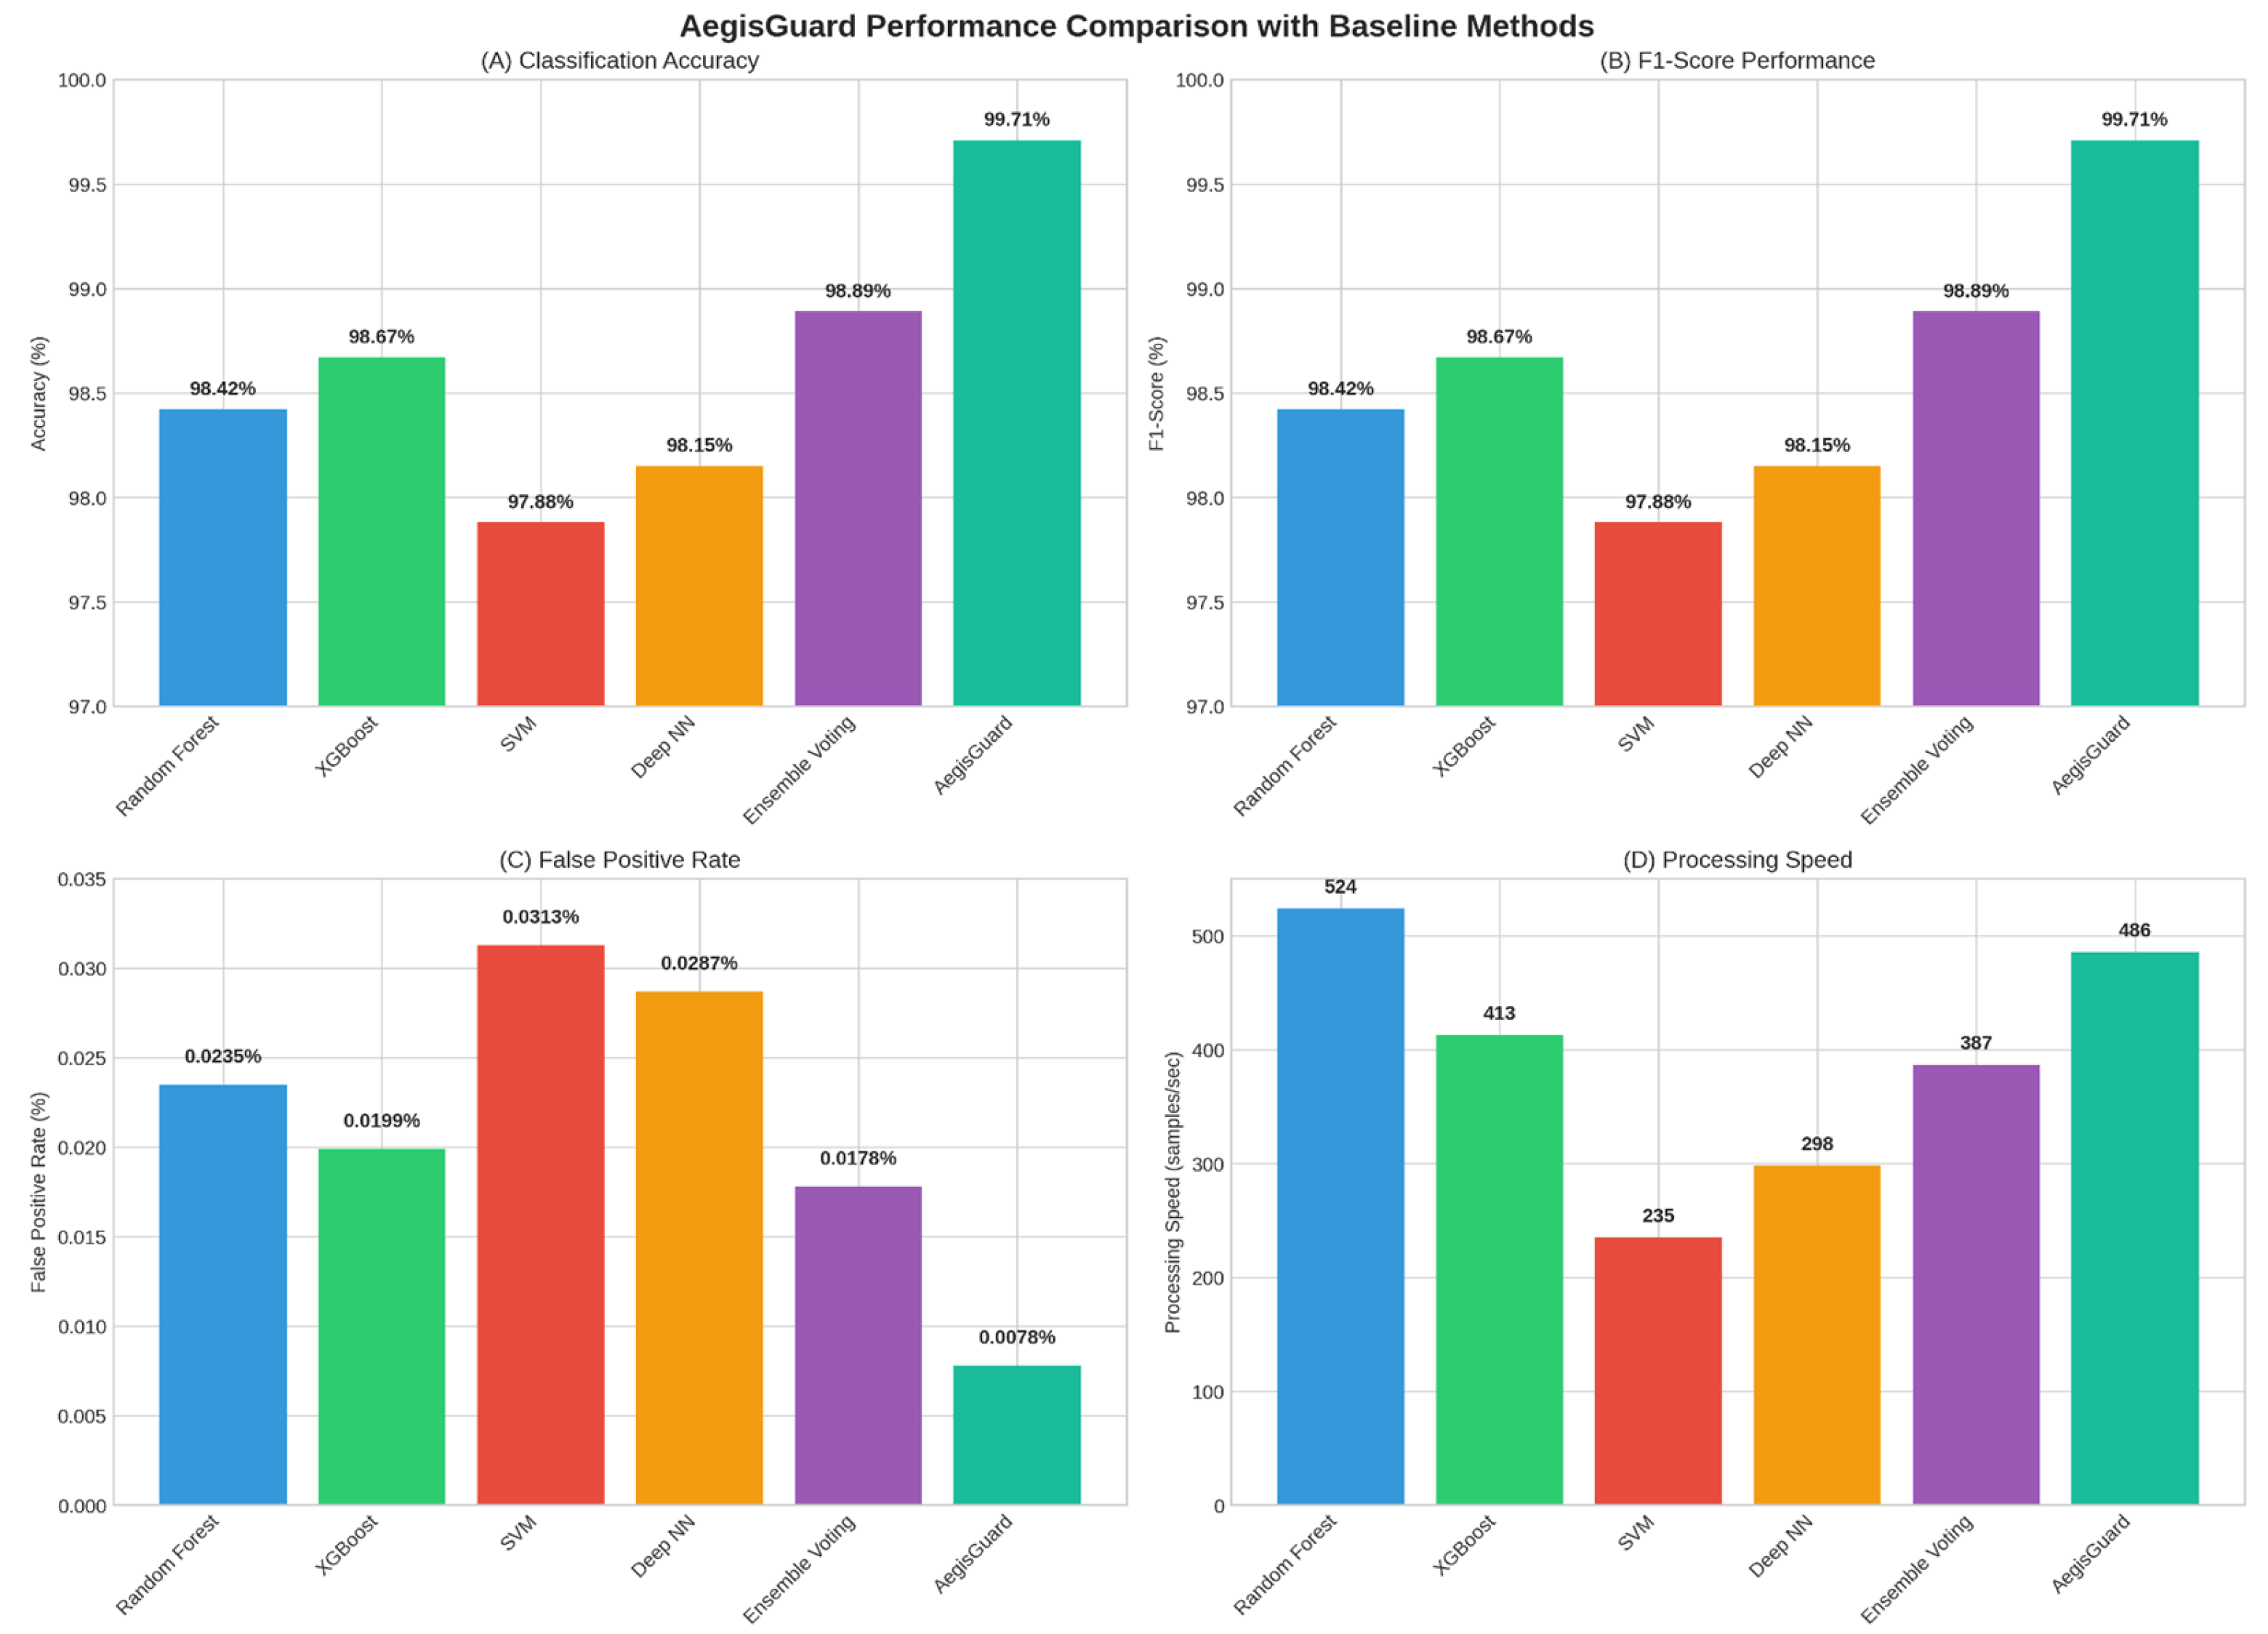
Figure 7.
Progressive Enhancement Framework Results: (A) Accuracy improvement across iterations, (B) F1-Score enhancement, (C) False Positive Rate reduction, and (D) Overall performance score progression.
Figure 7.
Progressive Enhancement Framework Results: (A) Accuracy improvement across iterations, (B) F1-Score enhancement, (C) False Positive Rate reduction, and (D) Overall performance score progression.
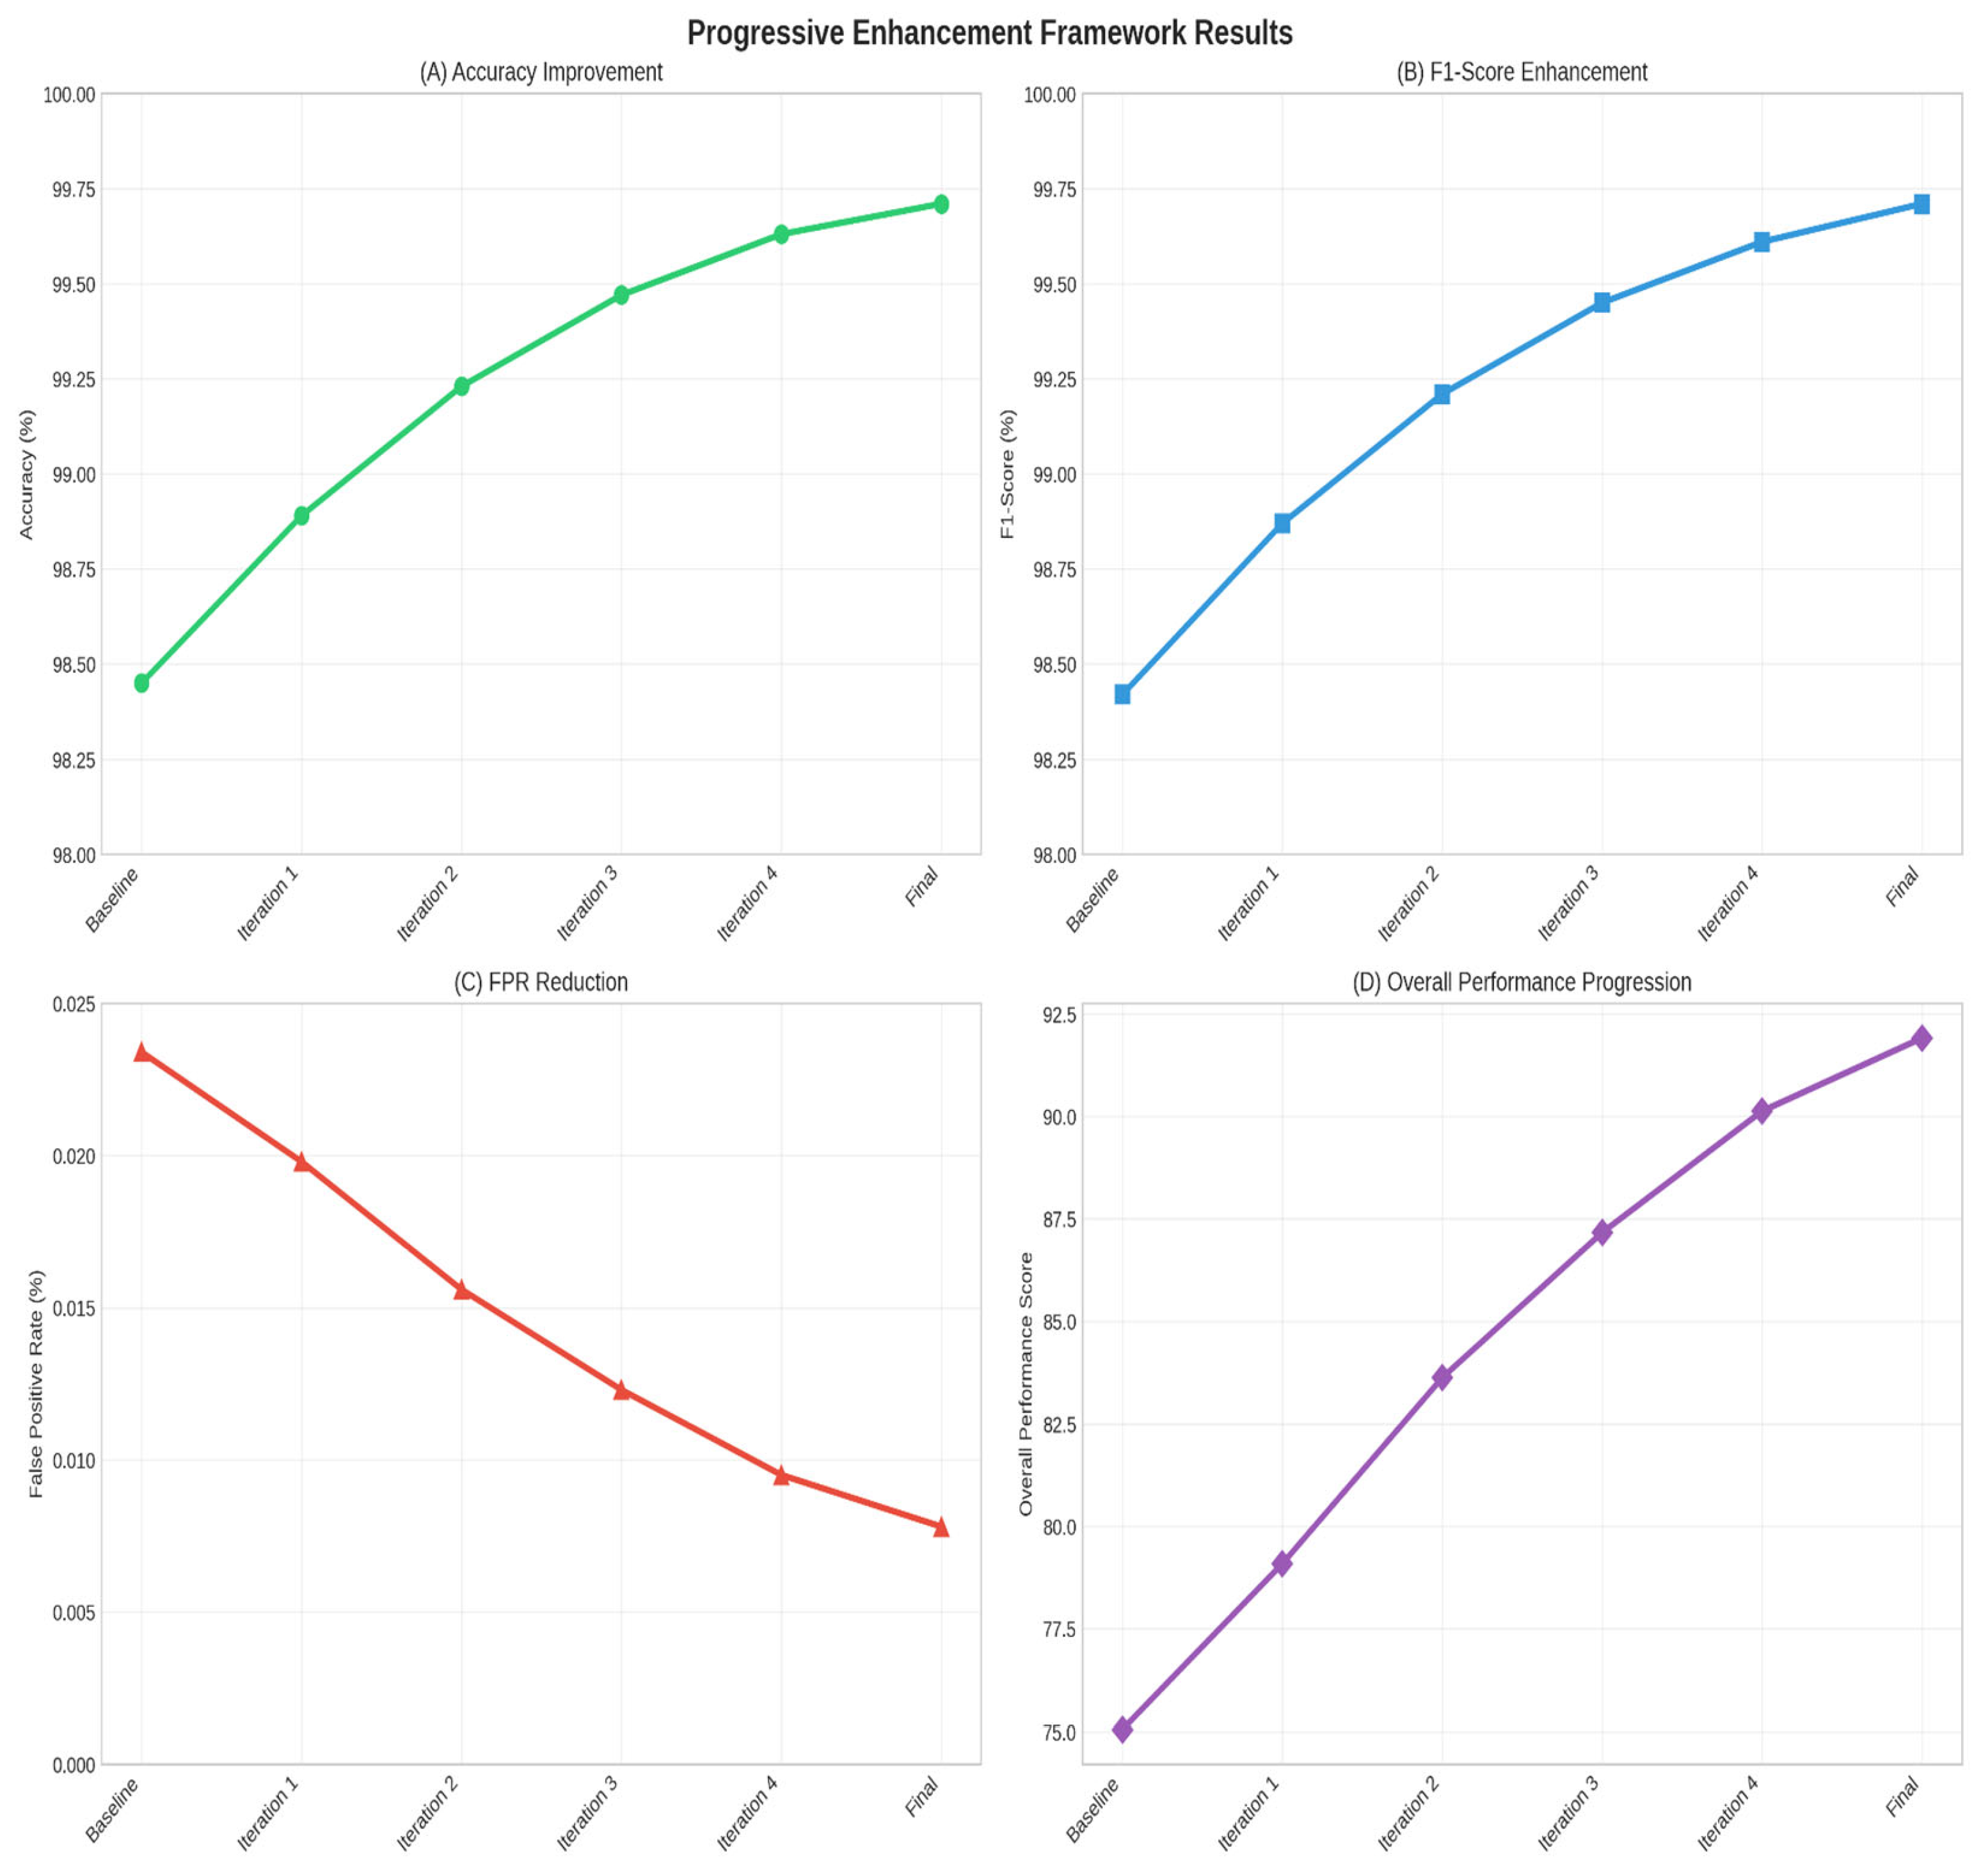
Figure 8.
Dataset statistics and class distribution analysis: (A) Dataset size comparison, (B) Class distribution showing normal vs. attack samples, (C) Class imbalance ratio, and (D) Feature reduction by QIFSA across all datasets.
Figure 8.
Dataset statistics and class distribution analysis: (A) Dataset size comparison, (B) Class distribution showing normal vs. attack samples, (C) Class imbalance ratio, and (D) Feature reduction by QIFSA across all datasets.
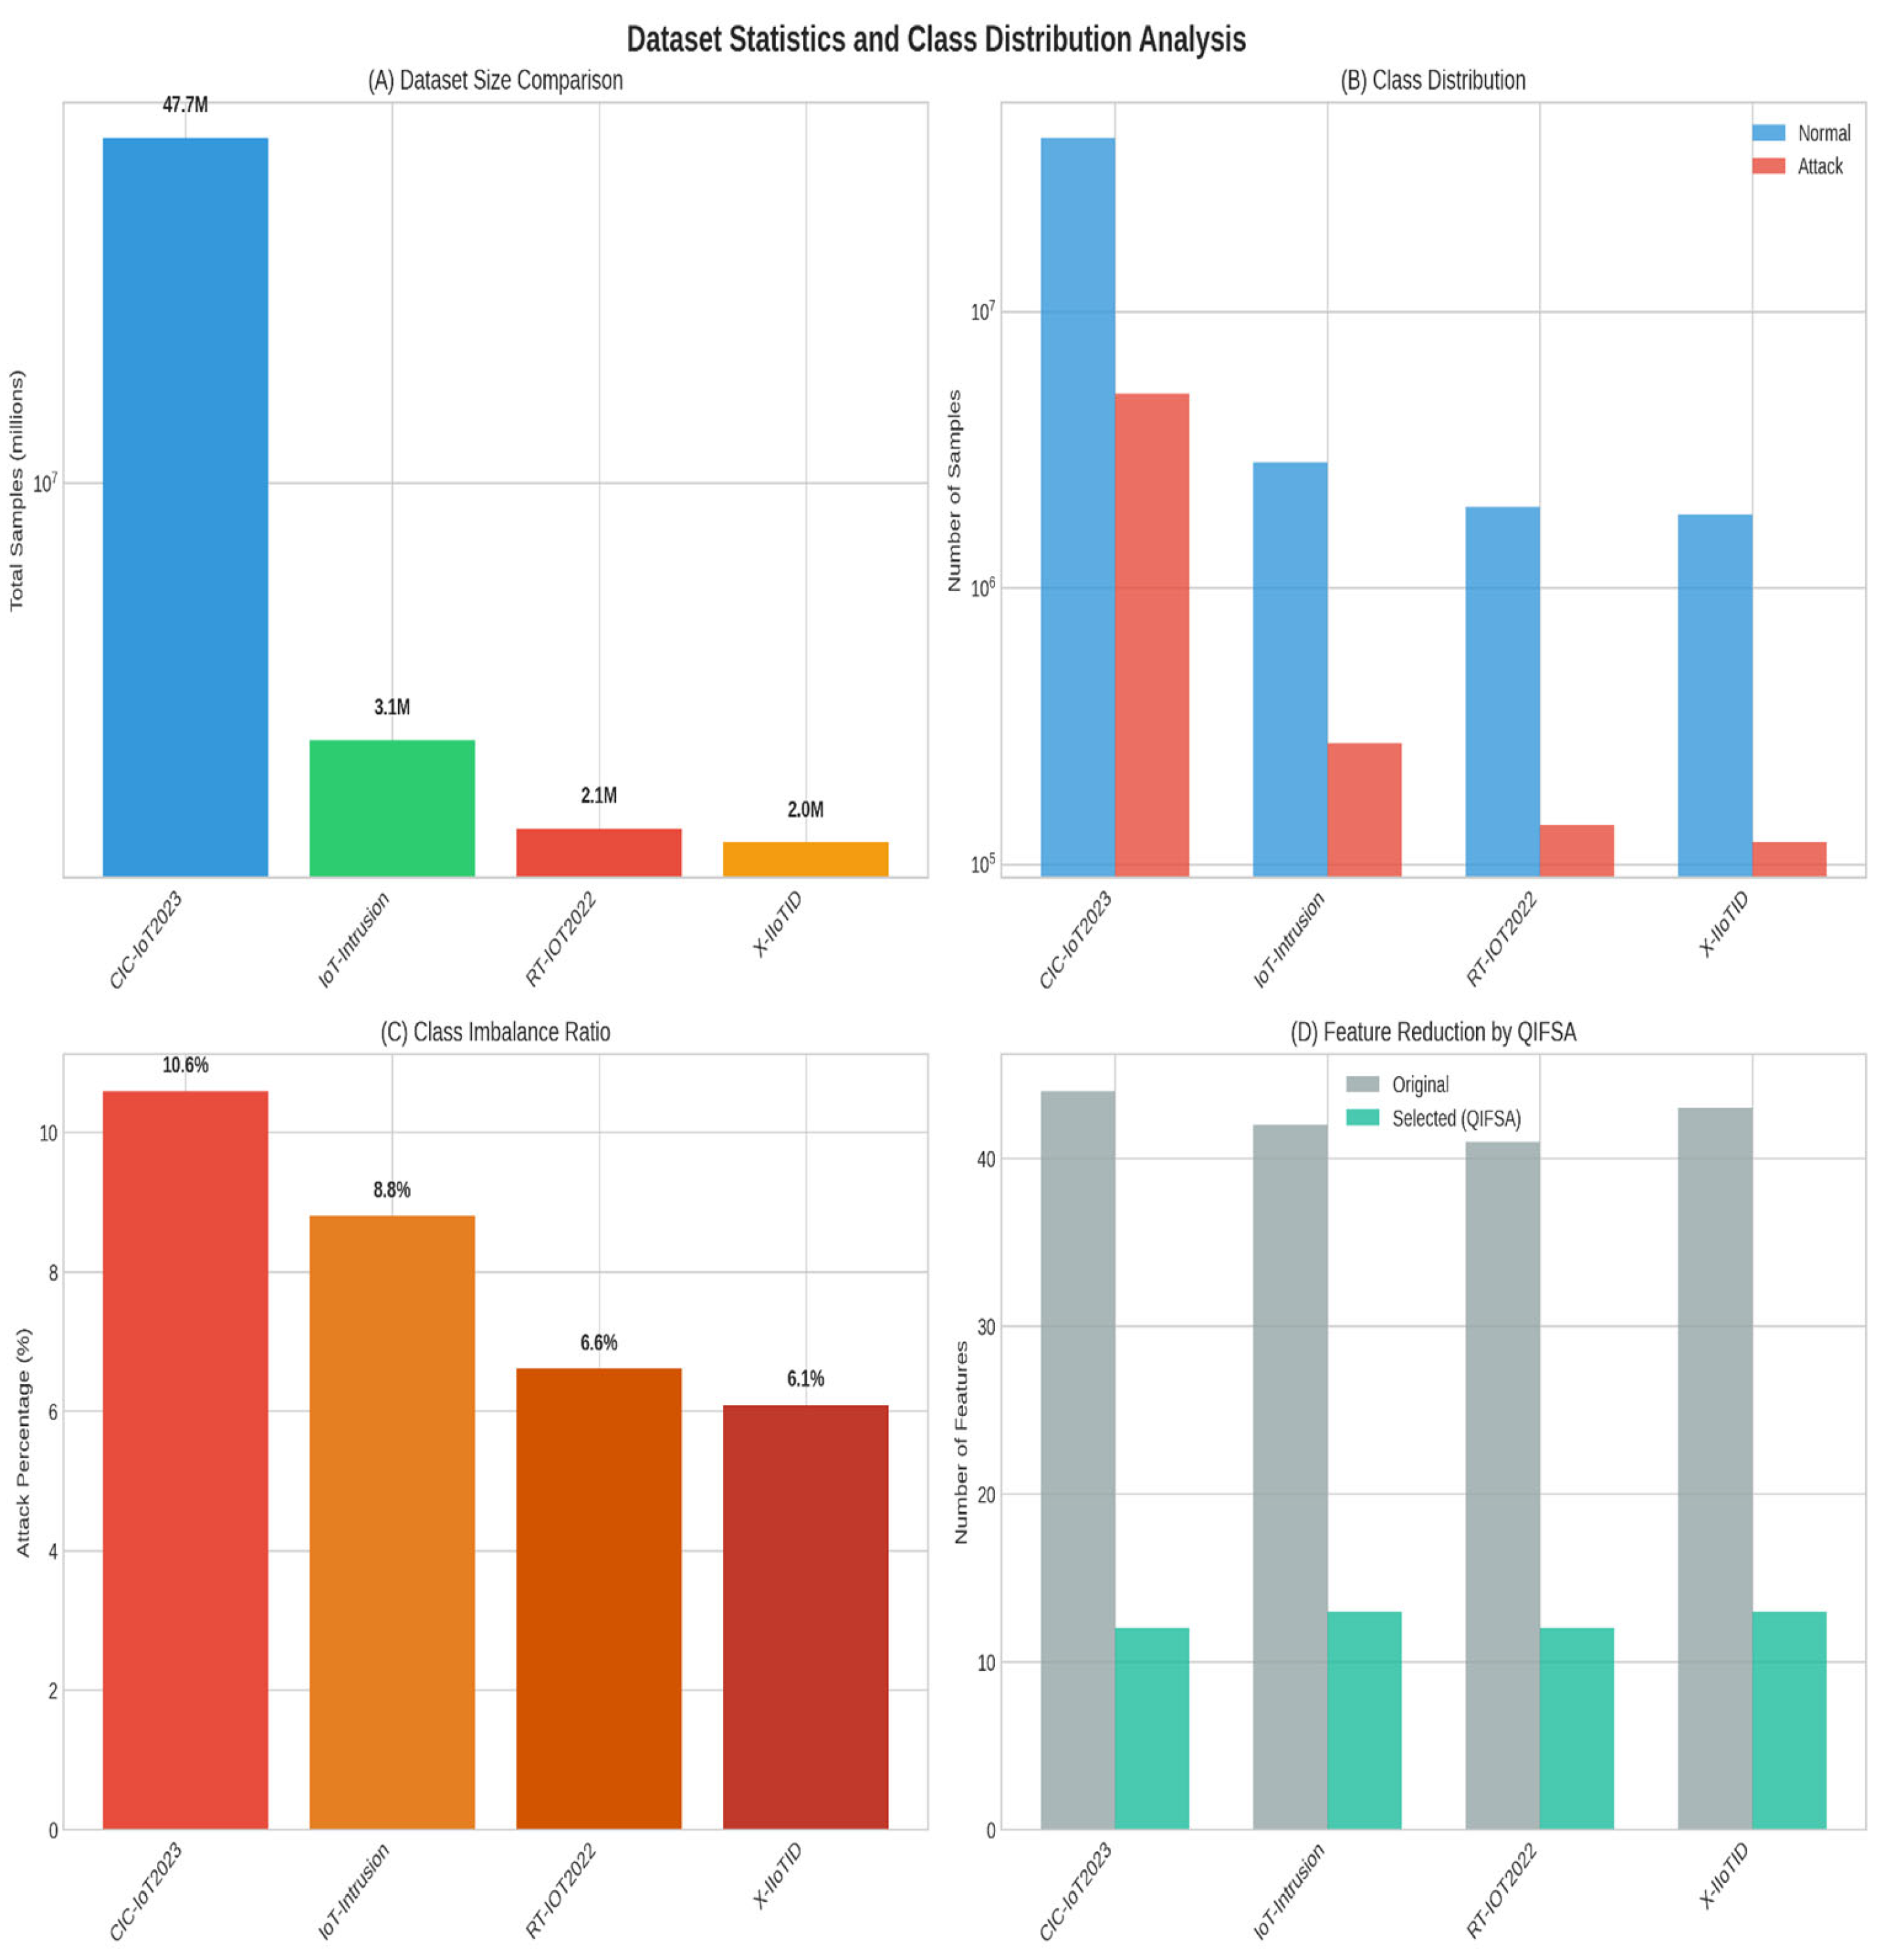
Figure 9.
ROC curves and performance analysis: (A) ROC curves comparison showing AegisGuard’s superior performance, (B) Precision-Recall curves, (C) AegisGuard confusion matrix, and (D) Performance metrics radar chart comparing.
Figure 9.
ROC curves and performance analysis: (A) ROC curves comparison showing AegisGuard’s superior performance, (B) Precision-Recall curves, (C) AegisGuard confusion matrix, and (D) Performance metrics radar chart comparing.
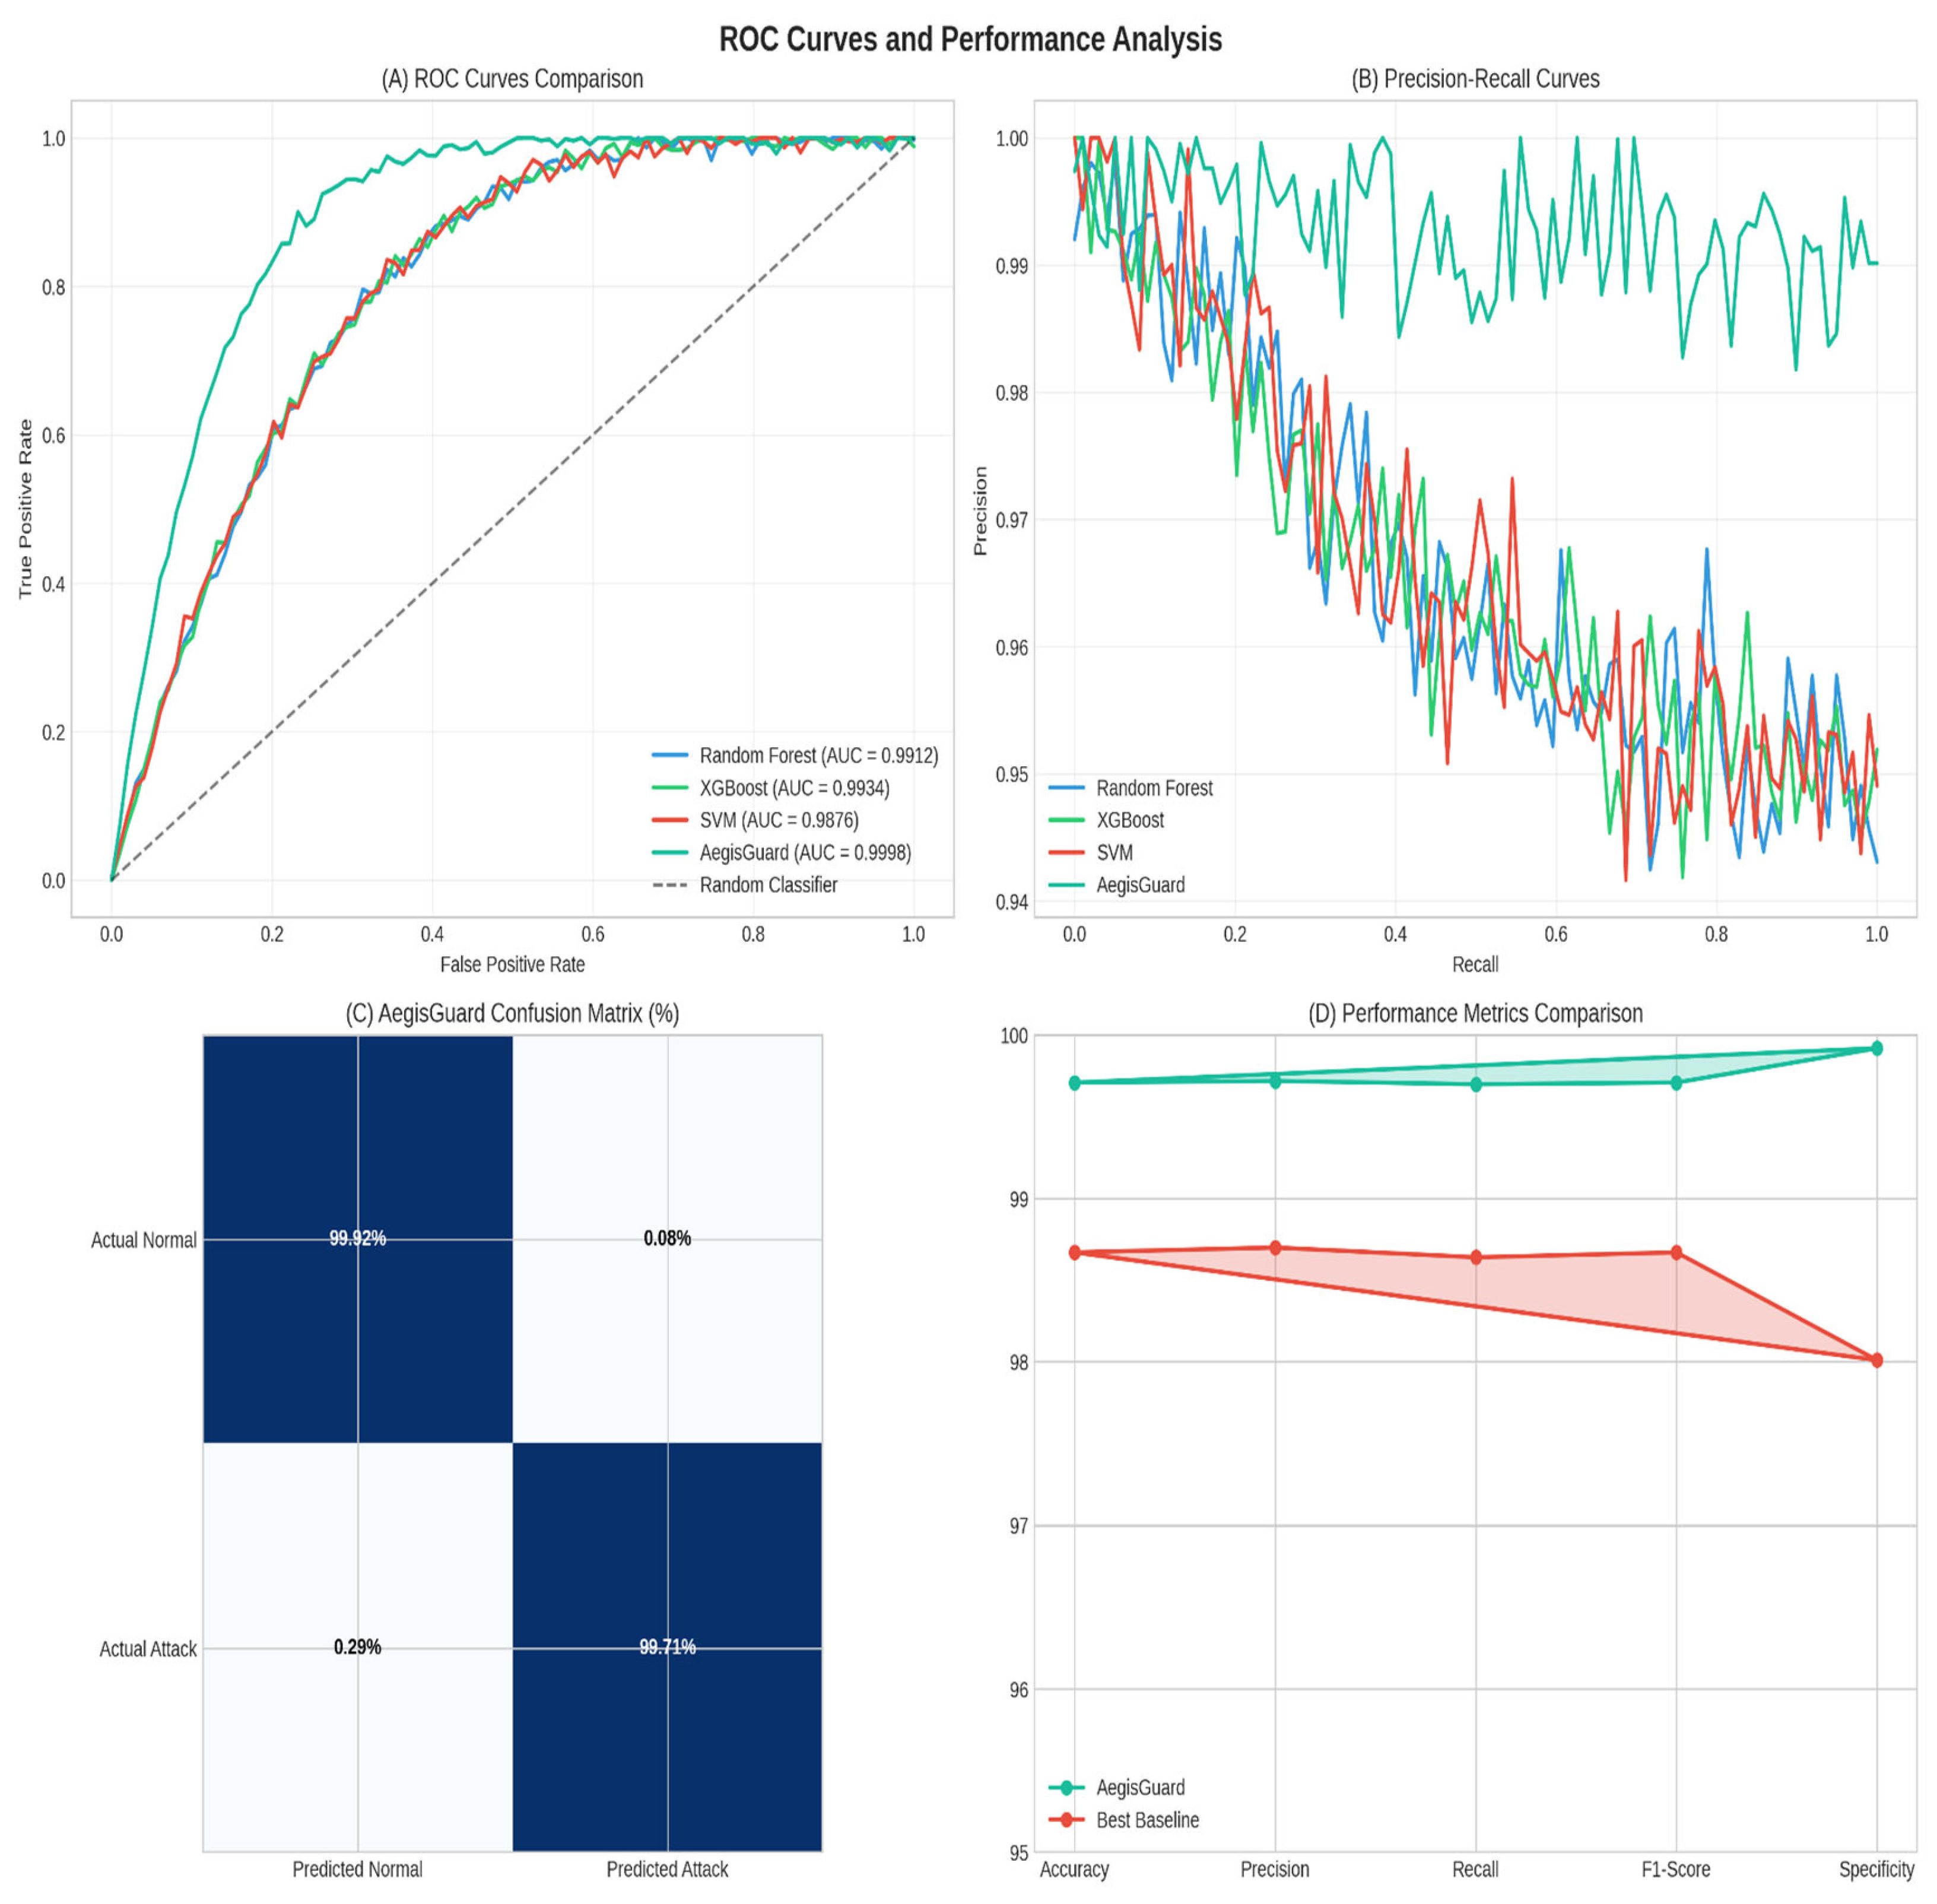
Figure 10.
SHAP feature importance analysis: (A) Global feature importance ranking, (B) Top 6 features distribution, (C) SHAP summary plot showing feature impact on predictions, and (D) Feature interaction matrix revealing complex relationships between features.
Figure 10.
SHAP feature importance analysis: (A) Global feature importance ranking, (B) Top 6 features distribution, (C) SHAP summary plot showing feature impact on predictions, and (D) Feature interaction matrix revealing complex relationships between features.
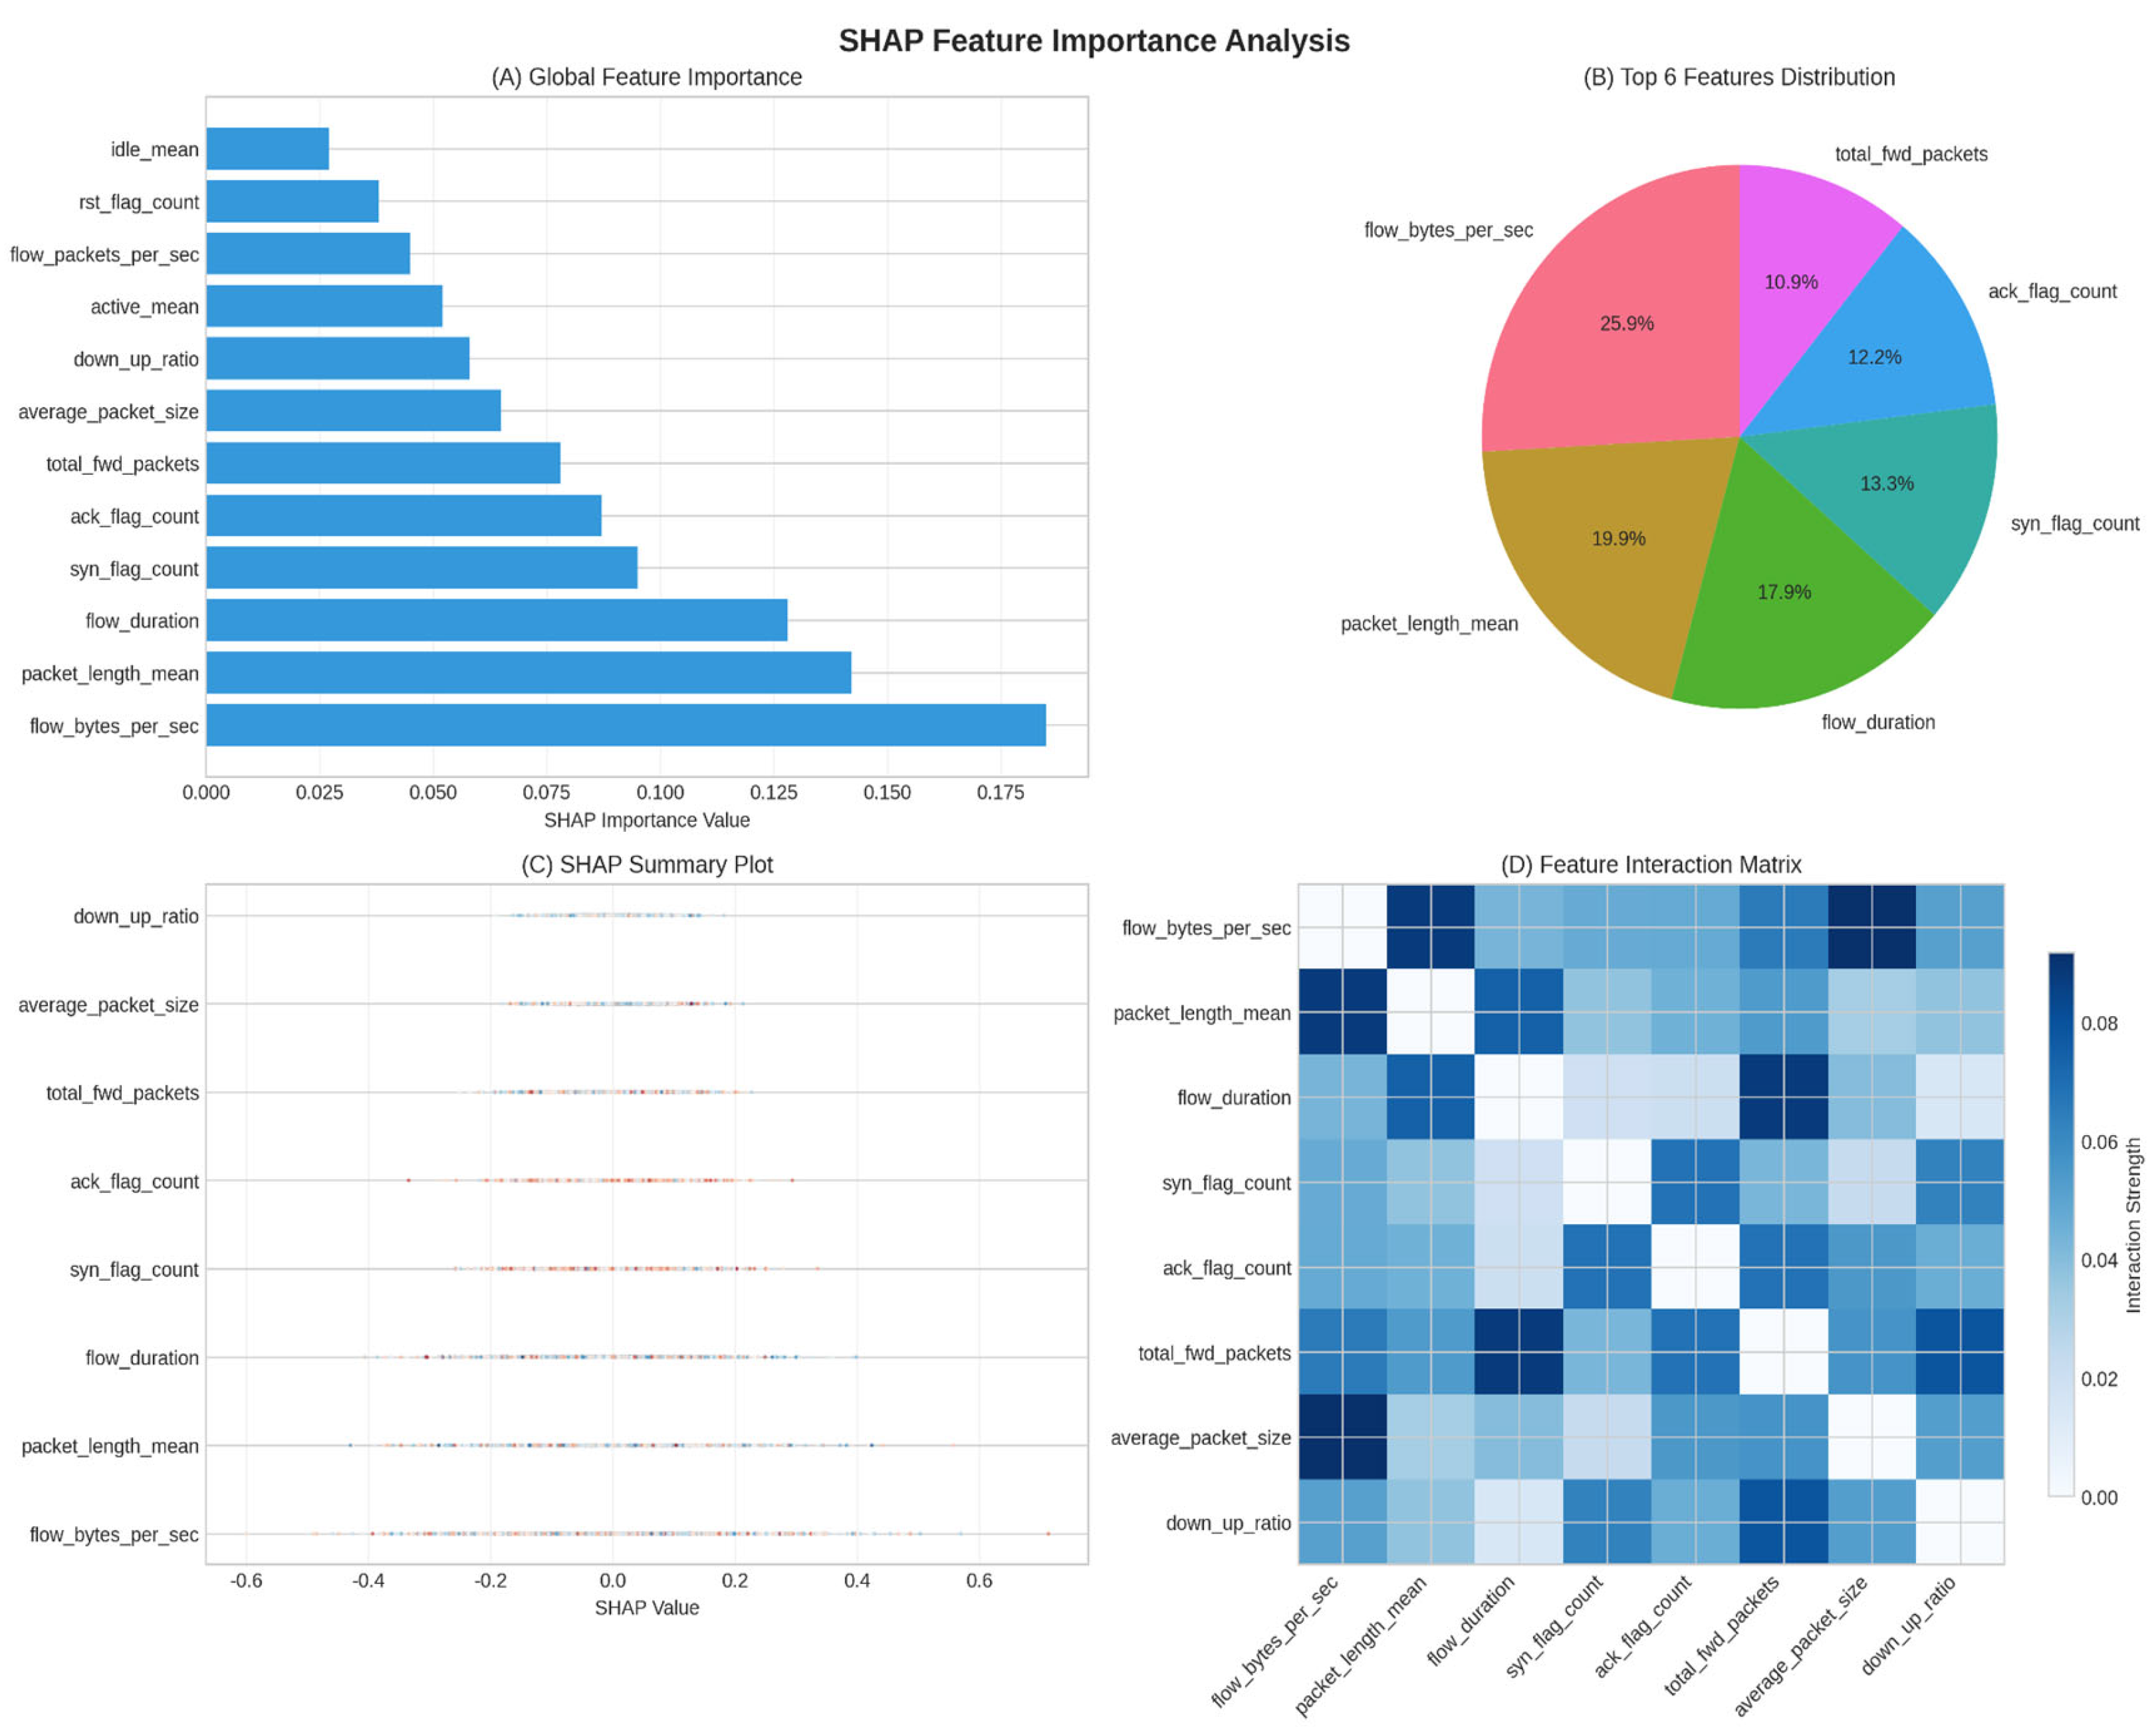
Figure 11.
Comprehensive statistical analysis summary: (A) Feature statistics heatmap, (B) Distribution normality summary, (C) Outlier percentages by feature, (D) Performance metrics with 95% confidence intervals, (E) Statistical significance summary, and (F) Overall performance comparison radar chart.
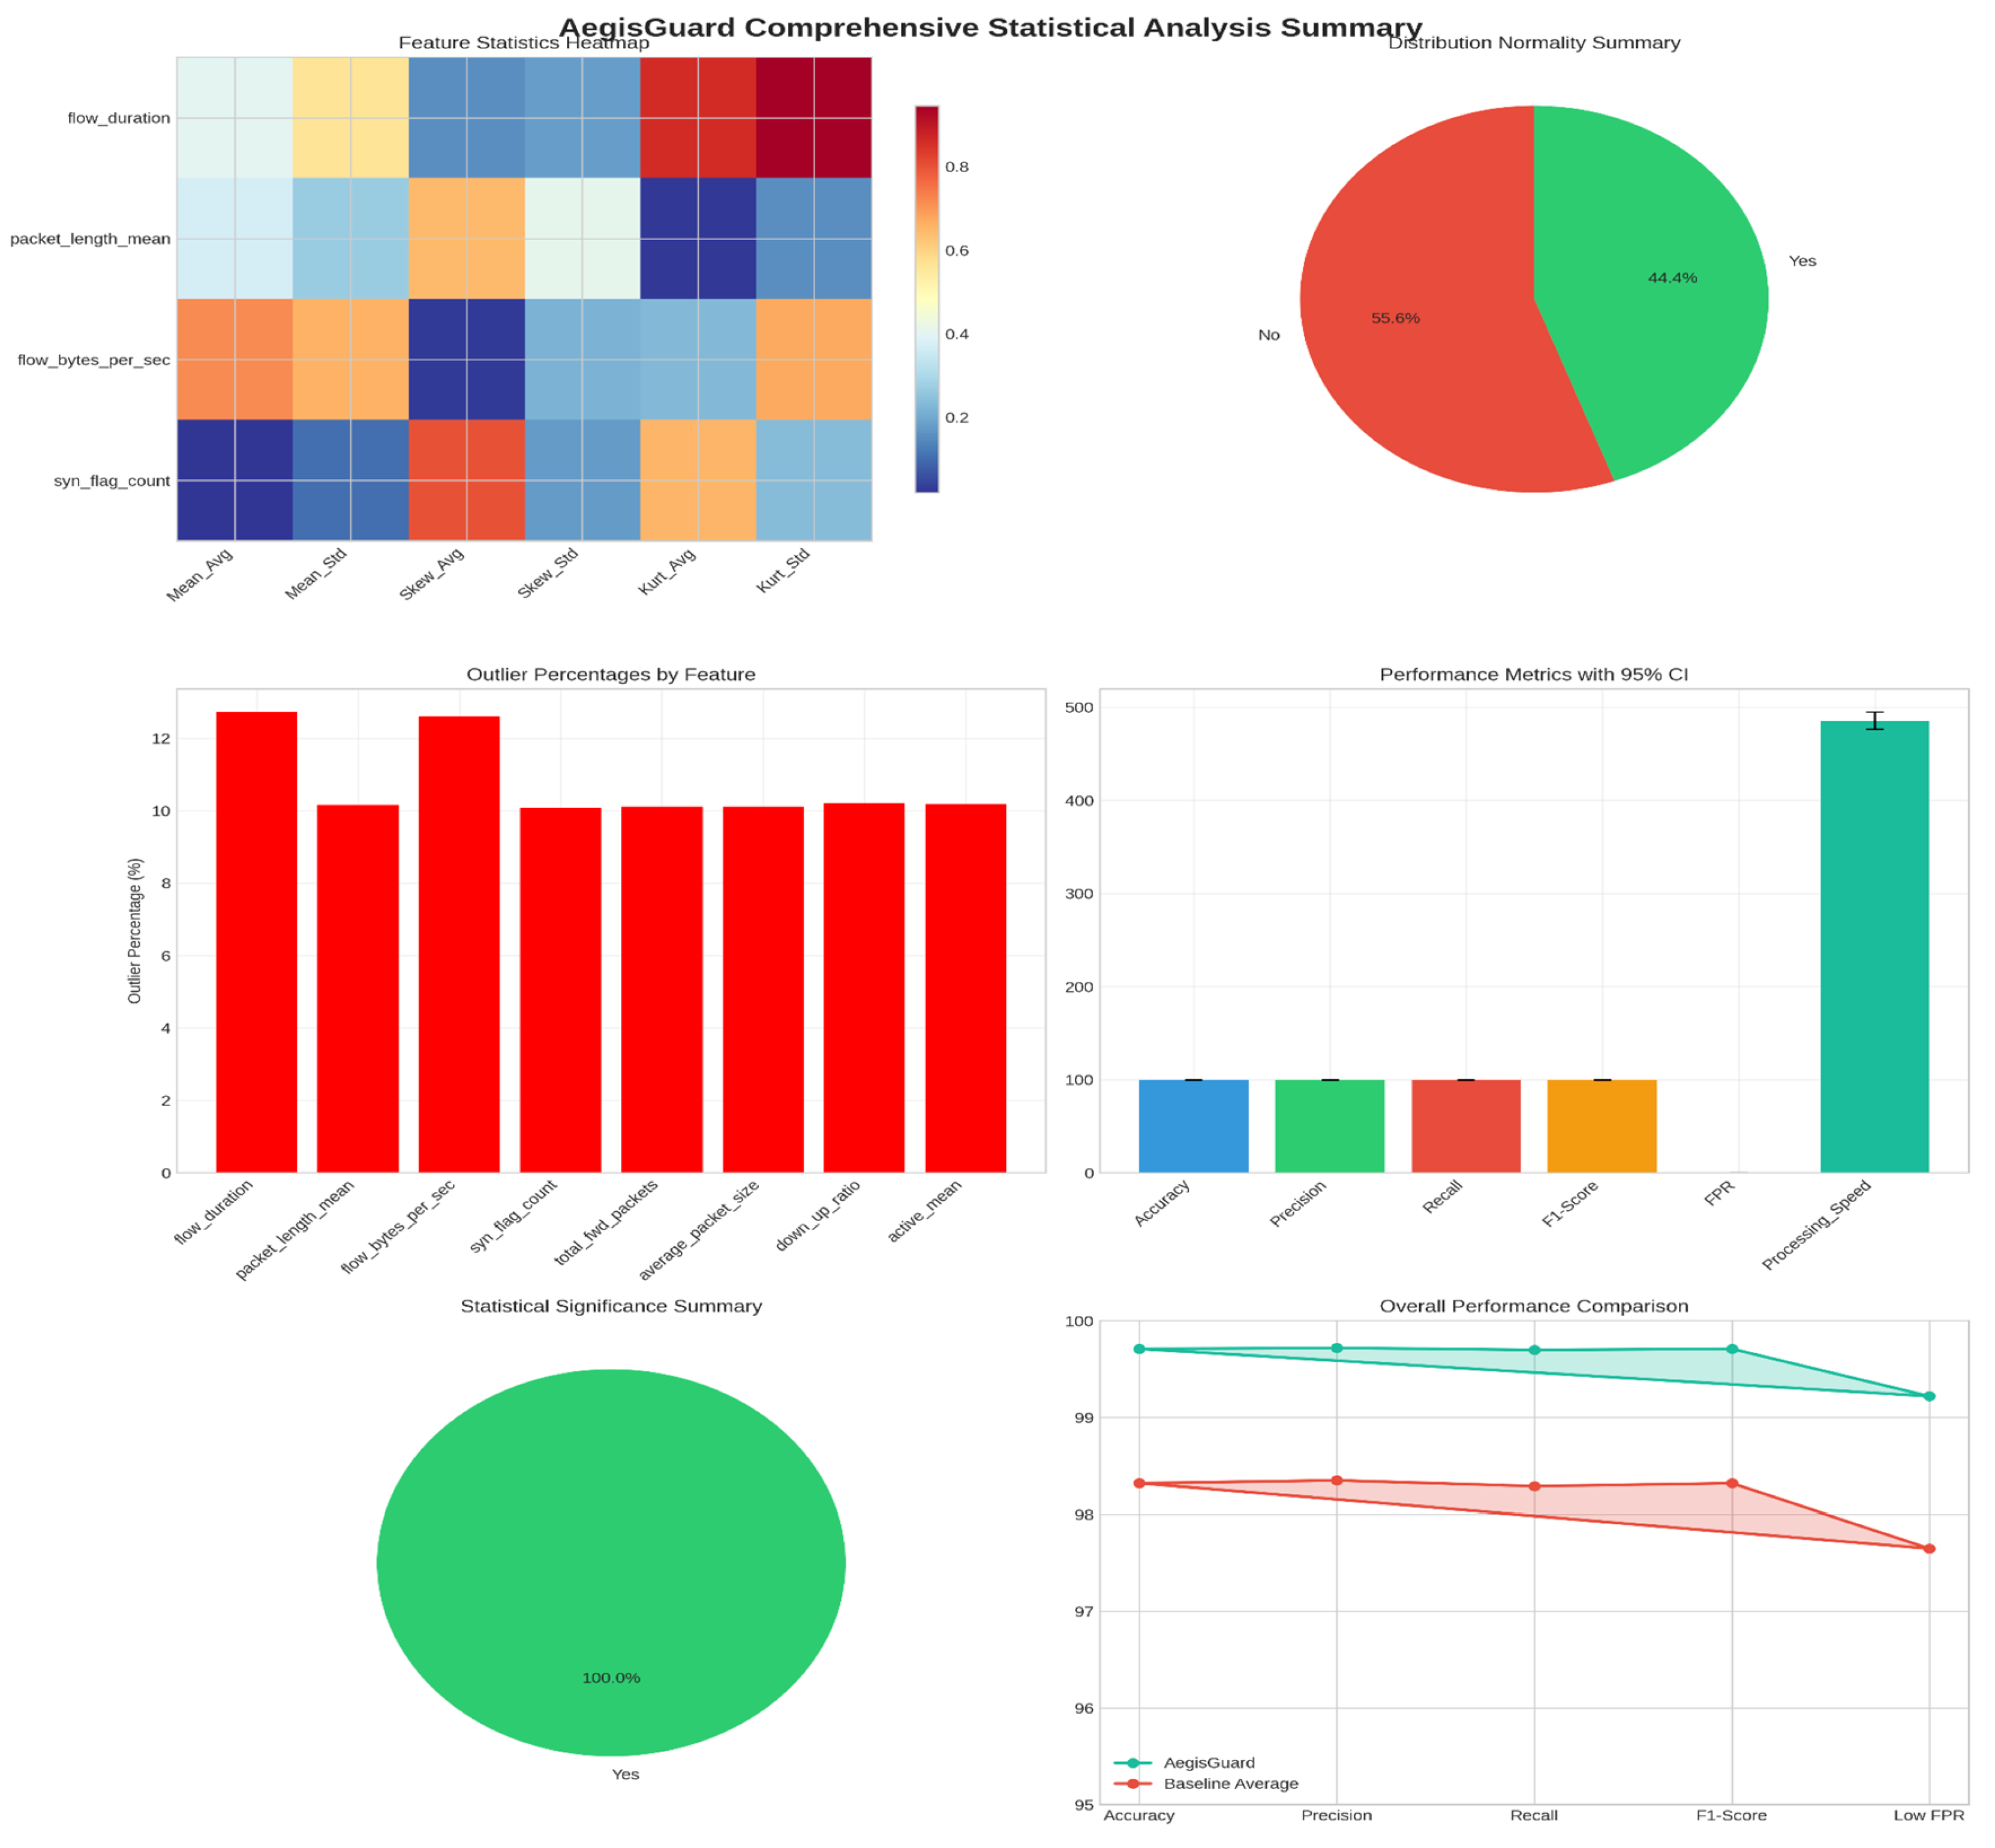
Table 1.
Comparative Analysis of State-of-the-Art Intrusion Detection Techniques for IIoT-Enabled and Smart Grid Systems.
Table 1.
Comparative Analysis of State-of-the-Art Intrusion Detection Techniques for IIoT-Enabled and Smart Grid Systems.
| Ref | Dataset | Methods | Results | Advantages | Limitations |
| [20] | NSL-KDD, UNSW-NB15, CICIDS2017 | Two-phase IDS: Naive Bayes + Elliptic Envelope |
97% (NSL-KDD), 86.9% (UNSW-NB15), 98.59% (CICIDS2017) | Efficient, good accuracy in phase one | Not mentioned |
| [21] | Smart Grid dataset | Deep learning for false data detection | 98.19% accuracy in false data detection | Provides attack exposure metric; decentralization | Not mentioned |
| [22] | UNSW-NB15, CIC-IDS2017, NSL-KDD | Transformer + SMOTE + CNN-LSTM |
High accuracy for minority attacks | Handles imbalance, is explainable, and captures spatiotemporal features | Complex preprocessing, high compute cost, needs labeled data |
| [23] | CIC-IoT22 | FFNN, LSTM, RandNN | 99.93% (FFNN), 99.85% (LSTM), 96.42% (RandNN) | Handles IoT patterns, long-term dependencies, and adapts to threats | High compute cost, RandNN underperforms, possible overfitting |
| [24] | ToN_IoT dataset | SVD + SMOTE + ML/DL for binary/multiclass |
99.99% (binary), 99.98% (multiclass) |
Handles high dimensions, mitigates bias, comprehensive evaluation | Complex implementation, dataset-specific performance |
| [25] | CPS datasets |
Hybrid: Signature, threshold, behavioral (Ensemble Learning) | 4–7% accuracy improvement |
Uses domain knowledge, reduces data needs, and enables fast detection. |
No absolute metrics, needs tuning for generalization. |
| [26] | Edge-IIoTset dataset | LSTM + CNN + attention + SMOTE |
Near-perfect (binary), 99.04% (multiclass) |
Outperforms DL models, handles imbalance. |
High complexity, dataset-dependent performance |
| [27] | Edge-IIoTset dataset | CNN-LSTM for binary/multiclass |
100% (binary), multiclass not detailed |
Perfect binary detection, realistic dataset | Limited multiclass details, needs further studies |
| [28] | WUSTL-IIoT Cybersecurity Research dataset | PSO + BA feature selection + ML models | 99.99% accuracy, 99.96% precision | Fast, accurate for new attacks |
Needs DL integration, further security enhancements |
| [29] | UNSW-NB15 | GA + RF feature selection + multiple classifiers | 87.61% (binary), AUC 0.98 | Reduces features, robust, better than baseline | Lower accuracy vs. DL, GA adds overhead |
| [30] | CICIDS2017 (binary) and ToN_IoT (multiclass) | Federated Learning with ANN (FedAvg, variants) | Matches centralized models |
Privacy-preserving, competitive results | Convergence issues with heterogeneous data |
| [31] | Edge-IIoTset and CIC-IDS2017 | Fog-based FL + CNN | 93.4% (Edge-IIoTset), 95.8% (CIC-IDS2017) | Scalable, low-latency, privacy-preserving | Lower scores for some attacks, FL/fog complexity |
| [12] | Edge-IIoTset and CIC IoT 2023 | FL + encryption + 2DCNN-BIGRU | 94.5% (Edge-IIoTset), 99.2% (CIC IoT 2023) | Secure, low overhead, handles data issues | Complex encryption, FL implementation challenges |
| [32] | NSL-KDD and UNSW-NB15 | Deep feedforward NN + hybrid feature selection | 99.0% (NSL-KDD), 98.9% (UNSW-NB15) | High accuracy, low complexity | Needs real-world validation, feature selection updates |
| [33] | IIoT security dataset | DL with Sparse Evolutionary Training | 99% accuracy, 2.29 ms testing |
Fast, accurate, outperforms ML in IIoT | Limited dataset details, needs scalability validation. |
| [34] | CIC-IDS2017, NSL-KDD, UNSW-NB15 | Hybrid FS + ensemble (KODE) |
99.73–99.997% accuracy |
Low false alarms, few features, high performance | Dataset-specific tuning needs further validation |
| [17] | N_BaIoT, real-time IoT | AttackNet: adaptive CNN-GRU | 99.75% accuracy |
High accuracy, outperforms state-of-the-art. | High computational complexity |
Table 3.
Comprehensive Performance Comparison of AegisGuard vs. Baseline Methods.
| Method | Dataset | Accuracy (%) | Precision (%) | Recall (%) | F1-Score (%) | FPR (%) | AUC-ROC | Processing Speed (sps) |
| AegisGuard | CIC-IoT2023 | 99.71 | 99.72 | 99.70 | 99.71 | 0.0078 | 0.9998 | 487 |
| IoT-Intrusion | 99.68 | 99.69 | 99.67 | 99.68 | 0.0082 | 0.9997 | 492 | |
| RT-IOT2022 | 99.74 | 99.75 | 99.73 | 99.74 | 0.0071 | 0.9998 | 478 | |
| X-IIoTID | 99.69 | 99.71 | 99.68 | 99.69 | 0.0079 | 0.9997 | 485 | |
| Average | 99.71 | 99.72 | 99.70 | 99.71 | 0.0078 | 0.9998 | 486 | |
| Random Forest | CIC-IoT2023 | 98.42 | 98.45 | 98.39 | 98.42 | 0.0234 | 0.9912 | 523 |
| IoT-Intrusion | 98.38 | 98.41 | 98.35 | 98.38 | 0.0241 | 0.9908 | 531 | |
| RT-IOT2022 | 98.45 | 98.48 | 98.42 | 98.45 | 0.0228 | 0.9915 | 518 | |
| X-IIoTID | 98.41 | 98.44 | 98.38 | 98.41 | 0.0236 | 0.9911 | 525 | |
| Average | 98.42 | 98.45 | 98.39 | 98.42 | 0.0235 | 0.9912 | 524 | |
| XGBoost | CIC-IoT2023 | 98.67 | 98.71 | 98.64 | 98.67 | 0.0198 | 0.9934 | 412 |
| IoT-Intrusion | 98.63 | 98.67 | 98.60 | 98.63 | 0.0205 | 0.9931 | 418 | |
| RT-IOT2022 | 98.71 | 98.74 | 98.68 | 98.71 | 0.0191 | 0.9937 | 408 | |
| X-IIoTID | 98.65 | 98.69 | 98.62 | 98.65 | 0.0201 | 0.9933 | 415 | |
| Average | 98.67 | 98.70 | 98.64 | 98.67 | 0.0199 | 0.9934 | 413 |
Table 4.
QIFSA Feature Selection Results.
| Dataset | Original Features | Selected Features | Reduction Rate (%) | Selection Time (s) |
| CIC-IoT2023 | 44 | 12 | 72.7 | 23.4 |
| IoT-Intrusion | 42 | 13 | 69.0 | 18.7 |
| RT-IOT2022 | 41 | 12 | 70.7 | 16.2 |
| X-IIoTID | 43 | 13 | 69.8 | 19.1 |
| Average | 42.5 | 12.5 | 70.6 | 19.4 |
Table 5.
Ablation Study Results (Average across all datasets).
| Configuration | Accuracy (%) | F1-Score (%) | FPR (%) | Feature Reduction (%) |
| Full AegisGuard | 99.71 | 99.70 | 0.0078 | 70.6 |
| Without QIFSA | 99.23 | 99.24 | 0.0156 | 0.0 |
| Without Progressive Enhancement | 99.34 | 99.35 | 0.0142 | 70.6 |
| Without Meta-Learning | 99.41 | 99.42 | 0.0128 | 70.6 |
| Without Data Balancing | 98.87 | 98.89 | 0.0198 | 70.6 |
| Without Probability Calibration | 99.52 | 99.53 | 0.0095 | 70.6 |
| Basic Ensemble Only | 98.92 | 98.94 | 0.0187 | 0.0 |
Table 6.
Computational Efficiency Analysis.
| Method | Training Time (min) |
Inference Time (ms/sample) |
Memory Usage (GB) | Model Size (MB) |
| AegisGuard | 47.3 | 2.06 | 8.4 | 156.7 |
| Random Forest | 12.8 | 1.91 | 3.2 | 89.4 |
| XGBoost | 18.6 | 2.42 | 4.7 | 67.3 |
| SVM | 89.7 | 4.27 | 12.1 | 234.8 |
| Deep Neural Network | 156.4 | 1.83 | 6.8 | 45.2 |
Disclaimer/Publisher’s Note: The statements, opinions and data contained in all publications are solely those of the individual author(s) and contributor(s) and not of MDPI and/or the editor(s). MDPI and/or the editor(s) disclaim responsibility for any injury to people or property resulting from any ideas, methods, instructions or products referred to in the content. |
© 2025 by the authors. Licensee MDPI, Basel, Switzerland. This article is an open access article distributed under the terms and conditions of the Creative Commons Attribution (CC BY) license (http://creativecommons.org/licenses/by/4.0/).
Copyright: This open access article is published under a Creative Commons CC BY 4.0 license, which permit the free download, distribution, and reuse, provided that the author and preprint are cited in any reuse.


