

Submitted:
15 September 2025
Posted:
17 September 2025
Read the latest preprint version here
Abstract
Sustainable and resilient hydrologic urban ecosystem services rely on connectivity among gray, green, and blue infrastructures. Yet, few of these services are quantified nor readily translated to inform management and policy regarding hydrologic connectivity. We eval-uated typically extensive and contiguous vacant parcels in the River Rouge, and Detroit River watersheds, which nominally drain the west, east sides of Detroit MI (USA), respec-tively. To gauge gray, green, blue connectivity, we measured parcel soil hydraulics as in-filtration and drainage rates, collected soil taxonomic data, and identified the depth of the groundwater table. Hydraulic data was sorted by an intuitive “stoplight” approach, with green, yellow, orange, red categories signaling hydrologic prospects, limitations, and gen-eralized management. With notable exceptions as green or yellow summary ratings, gray-green connectivity was limited due to variability in fill soil source, type, and layering. Blue assets as groundwater and river courses are largely decoupled from green due to perched water tables, and gradients altered by adjacent freeway dewatering. This assessment process can serve to optimally allocate city resources under what are highly variable hydrologic conditions, and toward effectively and efficiently sustaining ecosystem services where they are most strongly rendered among gray, green, and blue water regimes.
Keywords:
urban hydrology
; ecosystem services
; vacant land
; infiltration
; drainage
; groundwater
; blue infrastructure
; green infrastructure
; gray infrastructure
1. Introduction
The challenge of maintaining effective stormwater and wastewater infrastructure is common to global cities, where impervious surfaces have replaced pervious areas, which themselves have been reduced in their extent and continuity [1]. The predominance of impervious areas and their characteristic direct conversion of precipitation to runoff outpaces attempts at management [2]. At the same time, conurbations diminish the role of natural hydrologic losses associated with pervious vegetated land covers, which include interception-abstraction, infiltration, percolation, and evapotranspiration [3]. To limit flooding and maintain mobility and infrastructure, excessive stormwater runoff volume is routed to sewer collection and conveyance infrastructure. The aging and breakdown of sewer infrastructure and uncertainty in hydroclimate regimes [4] jointly affect sewer capacity and often lead to more frequent and severe system overflows. Among gray (i.e., “hard” infrastructure as engineered pipes, pumps, storage) and green (i.e., leveraging natural or engineered plant-soil systems to infiltrate and store runoff) management of wastewater and stormwater, the latter has attracted a great deal of attention to mitigate the hydrologic impacts of gray infrastructure, and toward improved stormwater-wastewater management [5] and adaptation to a changing hydroclimate [6]. Reconnection with hydrologic losses of abstraction, infiltration, percolation, evapotranspiration, and connectivity to groundwater and streamflow can create both losses and storages [3], which may sustain system capacity and its resilience as recovery from an impactful runoff flooding event. We approach the urban hydrologic cycle more broadly, and in terms of a connected continuum described by Kaushal and Belt [7]. In this framing, potential connections in the urban hydrologic cycle can span across gray, green and blue. Blue assets are defined here as landscape connectivity with groundwater and their dynamic connection with river courses.
The natural and built environments interact to generate ecosystem services [8] as benefits to humans. The post-urban soil ecosystem has been found to render regulating services as runoff mitigation through infiltration; supporting services as soil moisture to support flora, and hence habitat for fauna; and provisioning services as recharging the water table to connect landscapes with surface waters. These post-urban landscapes are often both extensive and contiguous – features of green infrastructure – carrying forward the potential for maximizing the rendering of services [9]. By way of example, at least 20 percent of Detroit MI land area is vacant and vegetated. Yet it is unclear the extent to which hydrologic ecosystem services can connect landscapes to water resources across the broader blue-green-gray hydrologic continuum [3]. These are management opportunities that bring together elements of coupled gray-green, blue-green infrastructures to render ecosystem services from post-urban landscapes such as these vacant remnant spaces.
Much of the research related to green stormwater infrastructure (GSI) has focused on site suitability and placement of GSI. The effectiveness of any given GSI installation depends in great part on GSI extent and continuity approaching or exceeding that of the runoff management challenge [2] Miller. Equally critical is a matching between GSI and host site hydrologic processes and mechanisms. Our survey of the literature showed that the gray, green, and blue domains are often studied in the context of modeling with data drawn from spatial databases that have widely varying levels of resolution and completeness insofar as representation of hydrologic processes [3,10]. Parcel-level hydrologic data to ground truth management aspirations is notably absent. Where community values were elicited to site blue-green infrastructures in eastern CAN, Lacroix et al. [11] found significant tradeoffs between larger, less-resolved spatial datasets versus key data available at the finer scale of single or multiple contiguous parcels. In a physical modeling approach, Cavadini et al. [6] used a calibrated combined sewer system network model to test different combinations of blue-green infrastructure (BGI) for their potential to decrease CSO activation volume and frequency. The catchment hydrology throughout the study was estimated by way of numerous assumptions for important hydrologic processes. Using the city of Detroit as a case study for their multicriteria green infrastructure planning model, Meerow and Newell [9] incorporated estimates of the Rational Method C coefficient to scale relative peak runoff from vacant land, though relied on coarse estimation of this lumped parameter, and did not specify a particular precipitation event. The performance of rainfall-runoff models is overall highly dependent on the spatial resolution of LULC and soil hydrologic data such that each regulate runoff generation and its routing. Despite the merits of these studies, each tend toward the presumptive and speculative with regard to the selection of vacant land for both their hydrologic capacities and to focus management needs. This is also to say that there are fewer resources spent on actually measuring the hydrologic capacities of landscapes to survey potential connections among gray, green, and blue infrastructures. In order to estimate connectivity among regimes and assets, we use field measurements to assess the various hydrologic roles played by vacant parcels in the larger urbanized water cycle. In practical terms, these data will offer a range of variability in hydrologic services and if properly communicated, can clarify whether post-urban parcels should be: conserved because they render a high level hydrologic services; managed because there are some deficiencies in services, or redeveloped (i.e., parcel is essentially impervious area) with contemporary low-impact development standards.
A persistent challenge to data-driven management and policy making is the translation and communication of measured data for improved environmental management, policy, and their outcomes. For example, the Brazos Valley WaterSmart (bvwatersmart.tamu.edu; accessed Sept 13 2025) utilizes measured water use data and other factors to signal where and when landscape watering is called for. This signaling is visualized in real time by resident ratepayers with a stoplight approach (green: needs watering, red: does not need watering). In this way, behavioral cues are used to effectively conserve scarce groundwater resources. We utilize a similar approach to translate and visualize the options available for vacant land use insofar as maximizing regulating ecosystem services as runoff mitigation (as elimination or disconnection of impervious areas, gray infrastructure) and restoring some degree of connectivity between the landscape (green) and deeper water cycles (blue). In this study, we parsed vacant land parcels with different hydrologic capacities into “stoplight” categories (green, yellow, orange, red) that communicate best uses for sustained rendering of ecosystem services in post-urban landscapes, and survey the potential for blue-green infrastructure as coupling between these catchment areas with their respective river reaches in the city of Detroit MI.
2. Site Description and Methods
Unconsolidated surficial deposits and bedrock geology of the Detroit area are summarized by Hoard et al. [12]. These deposits are dominated by glacial, lacustrine, and glacio-fluvial sediments consisting of clay- and silt-sized sediments with thicknesses ranging from about 30 to 48 m (100 to 150 ft). Beneath the unconsolidated deposits, low permeability limestones and shales of Devonian age serve as the limiting factor for deep drainage within this urbanized hydrologic system. The humid continental climate of southeastern Michigan is strongly affected by the Great Lakes and monthly daily mean air temperatures range from 25.5 °Fahrenheit (F; −3.6 °C) in January to 73.6 °F (23.1 °C) in July. Annual precipitation averages about 890 mm and is evenly distributed throughout the year. We study the westside landscapes to the east of the Upper Reach of the River Rouge (where it enters Redford Township at Eliza Howell Park), which is not channelized, and eventually joins the Main Branch and outlets to the Detroit River. The land surface elevation ranges from approximately 182 m (NAVD88, nearest the Rouge River) to 198 m (597 to 649 ft) in the interior. The eastside nominally drains to the Detroit River, which drains to the south and into Lake Erie. The range of land elevation of the eastside catchment area spans approximately from 190 m at the western extent of our samplings to 179 m at the eastern coastal sampling point (625 to 586 ft).
Land use – land cover (LULC) types in our sample set included residential and commercial vacant lots, parks, and public right of way. The terrain in Detroit is generally gently sloping to flat topography that is inclined to the southeast at a gradient of less than 0.2 m km-1 (ft mi-1). An initial list of potential vacant sites was supplied by the City of Detroit (ca. 180 sites), which we uploaded to a geographic information system, printed maps, and then did a windshield survey of each parcel in February 2013. We eliminated a large number of sites due to a lack of safe access, or the structure was still on the lot. From the remaining available sites, we maximized geographic coverage to capture larger-scale variation in urbanized soil hydrology of Detroit, and then addressed smaller-scale variation in areas on the westside and eastside where available locations were denser (Figure 1). The final site selection was optimized on transit times among sites at an average pace of 3-4 sites per day for a 5-day workweek spent on each of the west and east sides of Detroit. This process led to a sample group that was stratified into denser and sparser coverage based on the combination of random factors including: availability, restrictions due to safety concerns, and permission to enter.
Field campaigns were conducted in 2013, 2016, and 2023. In spring 2013, we investigated a total of 37 residential parcels or parks, each set on soil fill material. Distributed among the west (e.g., Brightmoor, Grandmont) communities in Detroit were 19 sites to the east of where the Upper Branch of the River Rouge descends from Redford Township and crosses Interstate 96 to the Main Branch of the River Rouge, eventually emptying to the Detroit River downstream of the eastside study areas. In 2013, we assessed 15 sites across several eastside communities (Hamtramck, Jefferson- Chalmers, Osborn, Poletown East), draining to the Detroit River in its course between Detroit MI and Ontario CAN. In October 2016, we assessed another set of eastside locations (5 parcels and 1 park, Hamtramck, Poletown East) (Figure 1). Follow-up measurements (infiltration and drainage only) were made in 2023 on a 10 percent sub-sample of sites previously assessed in 2013 (n = 3).
Deep-soil borings were taken in all 2013 assessments with direct-push soil sampling equipment (Geo-Probe, Salinas KS USA), and their full taxonomic characterization (including soil textural class, color, evidence of anthropogenic activity and artifacts, water table depth at the time of assessment). Measurements were performed at the center of each parcel representing the most recently disturbed portion of the lot where the structure was demolished, the basement excavated, the volume backfilled with human altered, human transported (HAHT) soils, finish grading, and finally revegetation via an intentional turf seeding (e.g., Schedonorus arundinaceus) and a re-emergent floral community composed of volunteer species. Landscape cover was uniformly vegetated and its coverage was at least 90%. This approach captured considerable variation in HAHT fill soils and its regulation of hydrologic properties across the continuum of parcels. For parks, right-of-way, and other unbounded parcels, we used the centroid of the area permitted for access as a reference point to set out equidistant measurement points along a line transect.
For all assessments (2013, 2016, 2023), we made field measurements of infiltration – the movement of water from the surface into underlying soils – and then the rate at which infiltrated water moved through a saturated soil matrix and subsoil as a proxy for drainage rate. We estimated infiltration as hydraulic conductivity (K) measured with a tension infiltrometer (Mini-Disk Infiltrometer, METER, Pullman WA USA). This measurement was made in at least four locations in each vacant parcel, along a transect from front to rear of the parcel, with assessment within and outside of the demolition envelope. The tension infiltrometer was set to a pressure head of -2 cm, placed on the soil surface (coarse organic matter brushed away, if necessary), and a time series of inflow rates were recorded at 0, 1, 2, 3, 4, 5, 10, 15, 20 minutes, or until a consecutive three equal drops in water level at equal time intervals indicated the quasi-steady infiltration rate (cm hr-1) at the specified tension. We used recommended manufacturer procedures to calculate K(-2 cm), which are based on the methods employed by Shuster et al. [13]. The slightly unsaturated measurement condition of K(-2 cm) simulates soil infiltration under early onset rainfall conditions, and is thereby conservative. We measured subsurface saturated K in the centroidal, backfilled area of a parcel and used this as a proxy to estimate drainage rate. A constant head permeameter (Amoozemeter, ksatinc.com) was set to maintain a 20-25 cm depth of water in a borehole augered to a depth just above the shallowest restrictive layer (i.e., 1 to 1.5 m), which was determined by observation of the deep soil borings. Inflow to the borehole was observed at 0, 1, 2, 3, 4, 5, 10, 15, 20 min., or until three equal drops in water level at equal time intervals were observed. This quasi-steady inflow rate (cm hr-1) was transformed to saturated K(0 cm) to estimate drainage rate [13]. The numerical ranges (bins) for data were set according to nominal expectations for stormwater management using gray-green hydrology. The lowest end of the color scales (i.e., red) for both infiltration and drainage rates is set at ≤ 1.27cm hr-1 (or, ½ inch hr-1). Based on observation of precipitation (rainfall, snowmelt) over several seasons, the near-complete vegetative cover and flat parcel aspect will fully abstract this depth of precipitation that falls in one hour. These are by nature the most frequent storm events and have among the lowest total event rainfall depths and lower average intensities [14]. Furthermore, using a subset of the Detroit data used here, Herrmann et al. [15] established that ca. 90 percent of warm-season rainfall events would be completely abstracted in the average post-urban vacant parcel. The next higher bin starts at 1.28 cm hr-1 and ends at ≤ 2.54 cm hr-1 (or, 1 in. hr-1), and so on, using 2.54 cm hr-1 to delineate between lower and higher ranges of both infiltration, drainage rate. For larger storms, the infiltration rate is known, and if rainfall rate exceeds infiltration, runoff is produced by infiltration excess as shallow sheet flow.
We characterized connectivity between green and blue assets (groundwater, surface waters) with measured depth to the saturated soil layer, and its Munsell soil color to estimate legacy moisture regime as temporary or persistent. This depth was identified by inspection of deep soil borings as the shallowest saturated layer of the soil profile. As a part of our soil taxonomy procedures, a Munsell soil color guide was used to classify the color of each distinct layer of the soil profile. Each color chip is named by its hue (e.g., 10YR (Yellow-Red)), value (e.g., lightness, 3/), and chroma (strength of coloration, /3). The soil color under their natural condition estimated whether the soil moisture regime was wetter or drier. A gray (10YR 5/1) to pale brown (10YR 6/2) soil color indicated wetter, long-term reducing conditions. Likewise, if the soil was in the reddish-yellow-brown range (2.5YR 6/4), this would indicate a drier or temporarily wetter soil moisture regime like that found in a groundwater table closer to the surface that is formed (or, perched) over a slowly-permeable or impermeable soil layer.
3. Results and Discussion
3.1. Sorting Infiltration and Drainage Data by Stoplight Signals
The gray to green hydrologic process in the vacant, post-urban landscape is driven by precipitation falling on impervious surfaces like roads, alleys, and other paved areas that drain to the sewer system; and vegetated vacant lots, parks, and right-of-way. Through serial demolition to control blight, impervious areas as sidewalks, roofs, driveways, and other related infrastructure have been removed. Unmaintained roadways have weathered and now have substantial depression storage, which can limit the amount of runoff that flows into outlets, which are also unmaintained, collapsed, and clogged. The City of Detroit is on a combined sewer system, which collects both septic and stormwater flows in the same pipe. For vacant parcels, although the residential sewer lateral has been disconnected from the neighborhood-level trunk wastewater conveyance, a subsurface hydrologic connection remains between the parcel and buried wastewater infrastructure. There is little impervious area left connected to the sewer system. Parcel level infiltration and drainage data were mapped on their own axes, and their symbology assigned as per numerical bins corresponding to increasingly restrictive hydrologic conditions as green, yellow, orange, and red “lights” (Figure 2). By way of example, mapping field data onto this framing, parcels with green lights for infiltration and drainage metrics are high functioning regarding hydrologic ecosystem services like regulation of stormwater runoff, and connectivity with blue assets. At the other extreme, red lights for both metrics direct the user to consider redevelopment of what is largely an impermeable parcel that minimally cycles rainfall or snowmelt inputs. The orange, yellow lights warn of higher infiltration rates without proper capacity to percolate this water, and inform that slow infiltration is relatively easier to remedy than slow drainage, respectively. Note that yellow and orange signals are interchanged for drainage status. This arrangement emphasizes the impact of lower drainage rates on limiting connectivity and hydrologic services, as per the difficulty involved in improving drainage rates.
For westside parcels (Figure 3), the majority of infiltration rates ranked in the red (12 out of 17), with fewer orange (2), yellow (2), and green (1). The range of soil textures spans across finer clay loams to the coarsest texture, loamy sand. We expected slow infiltration with the finer textures, though even these exhibited a wider range in stoplight status than we had expected. Surprisingly, different parcels with the same coarser surface soil textures had contrasting infiltration rates. A fine sandy loam (fsl) soil has predominantly fine sands, which approach the size of silts, and should have a comparatively slower infiltration rate than an ordinary sandy loam [16]. Yet, adjacent parcels (Figure 3) with fsl textures have red and green infiltration status, which may be due to the manner in which the soils were compacted during backfill operations, aggravating the tendency of fine sands to pack more densely and limiting infiltration. With few exceptions, drainage rates commonly exhibit a red status, further limiting water cycling. Our observations on the westside were similar to those on the eastside (Figure 4). The east coastal catchment had generally finer soil textures than the westside, 16 out of 20 sites were at a red status, yellow (3), orange (1). Drainage on the eastside also varied widely across parcels, with some notable opportunities to leverage yellow and green drainage statuses. We returned to three sites in 2023 and repeated infiltration and drainage measurements. Infiltration rates measured in 2023 (Leander ca. 3.3, 0.5, and 0.5 cm hr-1, respectively) were categorically like those from 2013 (Leander, McClellan, Maheras Gentry Park at 4.0, 0.4, and 0.7 cm hr-1, respectively) though drainage recently measured an approximately up to several orders of magnitude higher at two sites (Leander: 23.5 than 2.5, and McClellan 2.5 than 0.1 cm hr-1). We speculate that ongoing weathering at the surface and compaction from regular mowing may have degraded soil structure over the decade thereby limiting recovery of infiltration capacities. In the same period, deepening root systems and cycles of root system expansion and senescence may have improved soil drainage rate by way of increased macroporosity.
Overall, and qualitatively speaking, there is no spatial pattern in infiltration nor drainage rates, which is attributed to the random, non-standard sourcing of soil backfill material. The major factor governing parcel-level infiltration and drainage was HAHT soil texture and layering of backfilled soil material. Given that there were differences in infiltration at sites with the same soil texture, the manner in which soil was placed during backfill operations is a likely factor influencing infiltration rates. Final grading would serve to limit infiltration from the surface to the depth of the excavation. Drainage rate would be diminished by typical backfill processes, which involve individual lifts of soil being compacted after placement. The overall demolition process, backfill soil sourcing, and its placement are all factors that can change the ecosystem services rendered by a vacant lot [17].
There were no parcels where hydrologic conditions signaled green for both infiltration and drainage. If there were, these would be recognized as Passive Green Infrastructure (PGI) [18], which would render a full suite of regulating, supporting, and provisioning ecosystem services without further management. In general, parcels sorting into the yellow quadrant showed the greatest potential for restorative management to improve infiltration [10]. Soil management as cover cropping can increase soil organic matter, tilth, weed control (the native Junegrass Koeleria macrantha; or otherwise Red Clover Trifolium pratense; Oats Avina sativa), and create deeper rooting zones (e.g., Buckwheat, Fagopyrum esculentum) that can likewise facilitate drainage and deeper percolation. Selective tillage can be employed to break up slaked surface soils and subsurface hardpan (i.e., argillic horizons) and still retain soil structure. All of these management approaches improve infiltration rates over time and shift the parcel into the green quadrant. For the orange quadrant, low drainage rate will limit the percolation allowed by favorable infiltration. This condition may predispose the parcel toward runoff production via saturation excess. The shallower the profile, the less precipitation it takes to fill limited water holding capacity, so that the profile saturates from the bottom up. For parcels sorting into the predominant red category, restoration of infiltration may be possible, though at the very least, and like its orange counterpart, remedying drainage limitations would be wholly resource intensive (e.g., soil excavation and replacement) and thereby cost-prohibitive. The red parcels act as impervious surface and best suited for new development utilizing low-impact development technologies and techniques.
3.2. Connecting the Green to the Blue, Identification of Groundwater Tables
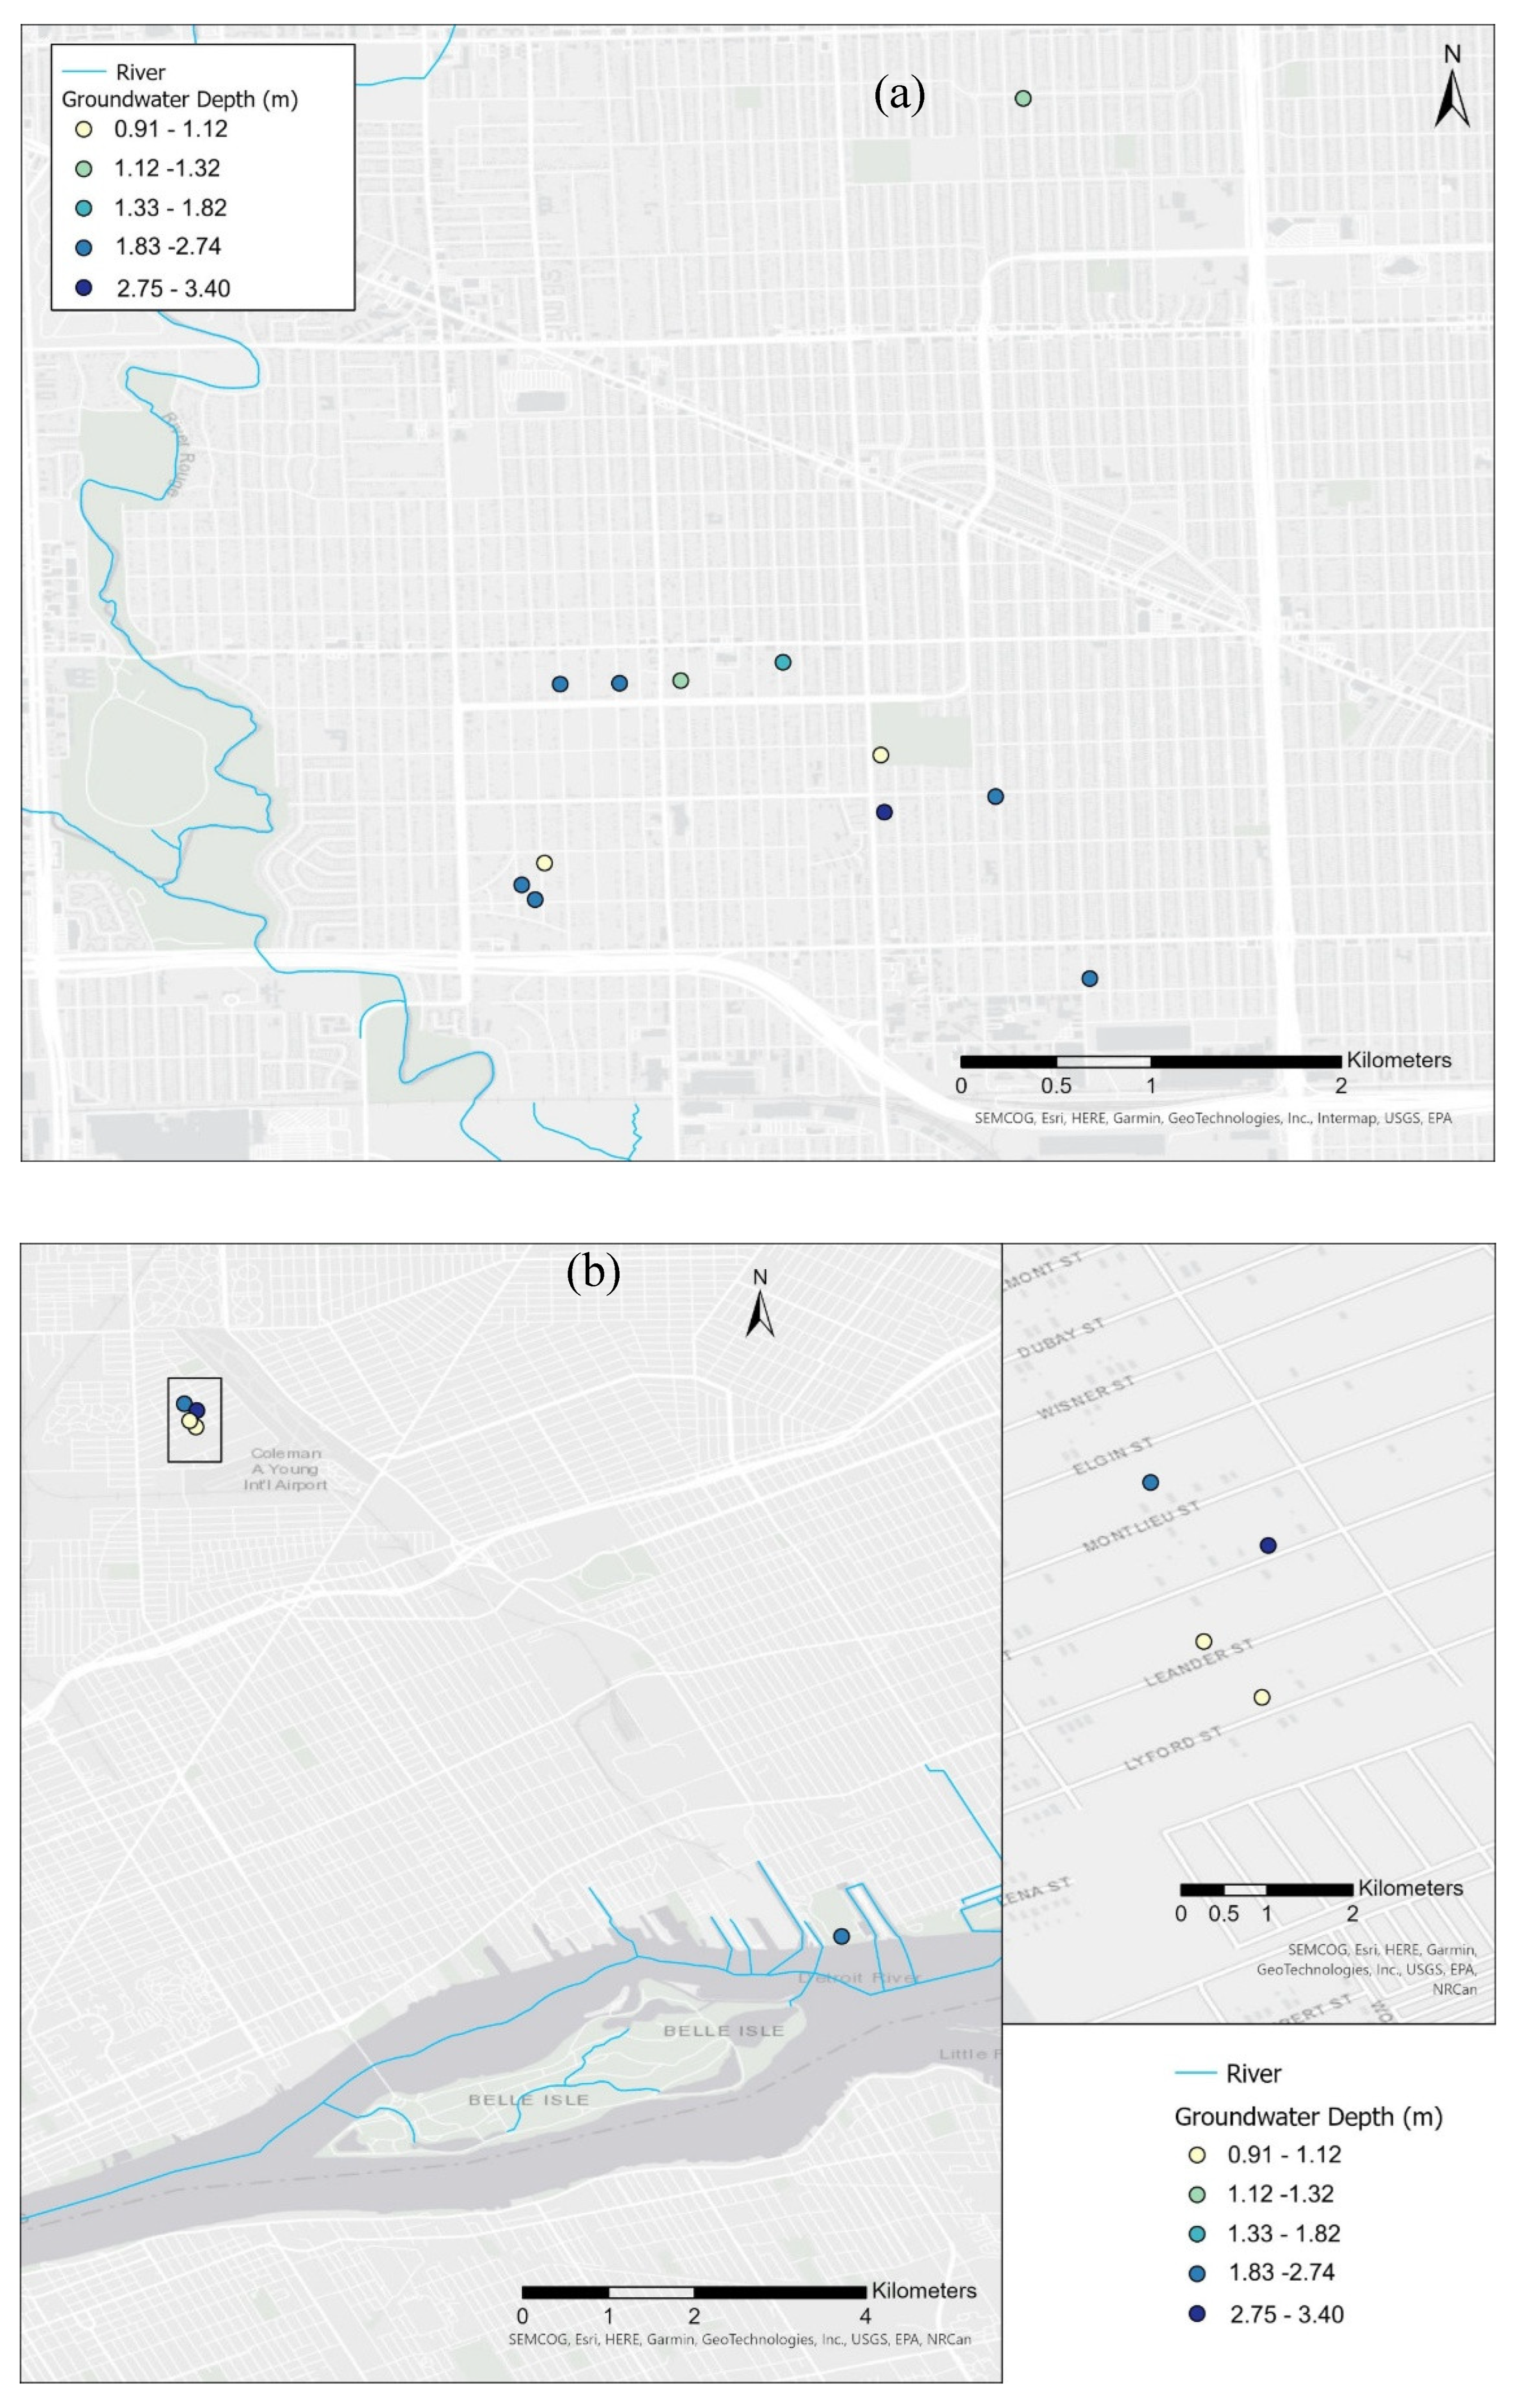
The green to blue hydrologic process is represented by the depth of the apparent groundwater table (Figure 5) and its corresponding soil color. In general, the spatial reach of a water table becomes more extensive (versus localized) with increased depth. The deeper groundwater resources are then more likely to interact with the adjacent blue assets, which include the westside Upper Branch of the River Rouge. A shallower (or perched) water table sits on an impermeable or slowly-permeable soil layer or lens. Human-altered human-transported (HAHT) soil material filled the top 2-3m of the basement excavations. As we learned earlier, these new, mixed soils drive variation in soil and hydrologic properties, even among parcels nearby each other. Soil redoximorphic status in saturated soils is associated with coloration of reduced, iron-rich illitic clay minerals, which is indicated by soil colors in the gray range. We observed water tables in either the more surficial HAHT fill material, or much deeper in partially-weathered bedrock as C horizons or regolith (Figure 5). With few exceptions, observed saturated zones of soil cores exhibited soil colors related to reducing conditions. The deeper saturated soil layers had colors that ranged from light gray (10YR 7/1) to pale brown (10YR 6/3), which indicates a persistent wet soil moisture status. For the shallower water tables, these are likely perched nearer to the surface, with some degree of aeration, and a wetness regime that is more recent or at least not as persistent to the deeper saturated zones. Soil redoximorphic cues in these zones were more oxidized, and consequently had light yellow brown color (2.5YR 6/4) to very dark gray (10YR 3/1). This range of soil color is attributed to the relatively recent development of a perched water table after demolition (ca. 40 years) and backfill with HAHT material, compared to lighter gray soils observed in deeper saturated zones, which have likely been wet for thousands of years. For the westside parcels, we found water tables predominantly clustered in the southern half of the study catchment, distributed among the full range of depth categories (Figure 5a). On the eastside, observation of water tables was sparser and separated by distance than that on the westside, depth was highly variable in the northwest cluster, and the hydraulic head at the site adjacent to the Detroit River (Maheras Gentry Park) was measured 175.3 m, slightly above the average Detroit River stage of 174.7 m, which was lower than normal in 2013 (Figure 5b). This may indicate connectivity between the two, though this was a one-time measurement and thus no dynamic relationship could be established.
Additional sources of drainage from parcels are through their prior connection (via the residential sewer lateral pipe) such that all parcels are located adjacent to the neighborhood block-level combined sewer trunkline; and leakage from aged, pressurized drinking water pipes. This trunkline is at least ca. 100 years old and increasingly in a state of hydraulic exchange with the surrounding subsurface strata. A difference in hydraulic head between the pipe and water table will dictate whether groundwater inflows to the pipe through cracks and separated joints [3], or if pressure conditions in the pipe force exfiltration to a drier or cavitated soil bedding surrounding the pipe. Non-revenue drinking water losses may not be discovered for years, and add to soil moisture, groundwater, and as they are located above sewer pipes, can potentially enter into sewer pipes themselves. On the other hand, perching may prevent shallow saturated layers from moving into fractured pipes that are placed deeper into the soil strata (i.e., 4-6 m). More generally, evapotranspiration losses during the warm growing season diminish the amount of precipitation available for percolation [19]. This seasonal effect would then be expected to more strongly affect the local water tables more proximate to the surface and subject to capillary fringe effects and root uptake of soil moisture, which are estimated to extend to 2 m depth.
The Upper Reach of the River Rouge and the Detroit River courses are each highly urbanized. To different degrees, each river course is at turns isolated and influenced by their watershed areas (where the parcels are located), water table dynamics, and stormwater management in the freeway transit corridors. These features of urban karst interrupt both subsurface flow pathways and groundwater directional gradients [3,7]. Both the west (Interstate 96) and east (Interstate 94) freeway networks have pumped drainage systems that are in the paths between the parcels and their corresponding river reaches. These systems lower the proximate groundwater table (dewatering), and during stormflow, pump stormwater runoff from the freeways to the local combined sewer system. Groundwater directional gradients have been distorted by obstructions dewatering. The extent of these impacts on groundwater gradients in the Upper River Rouge catchment is largely uncharacterized due to a dearth of groundwater monitoring data. However, the eastside had the benefit of a dense well field in what was known as the Recovery Park complex (42.369652, -83.043198). Hoarde et al. [12] found that the groundwater directional gradient was primarily from the SE to NW direction, directing groundwater away from the Detroit River.
There is correspondence between sites with yellow or green drainage status and observation of deeper (not perched) saturated soil layers that, given their soil color, are generally permanent. These sites would be most likely to percolate and recharge deeper groundwater resources. It is possible that with correction of low infiltration rates, parcels in the yellow quadrant would allow percolation to the shallower perched water tables. Even in the case of parcels that are designated orange, the large-scales imply a longer-term (ca. 50-100 years) process, where percolate may actually reach deep water tables. For these reasons, blue-green groundwater connectivity can engage in a losing and gaining dynamic with the River Rouge and Detroit River. Given infiltration and drainage limitations, soil layering, dewatering and redirection of groundwater directional gradients, each can act to regulate the temporal scale and overall dynamic of these connections.
4. Conclusions
The year 1950 marked peak population in Detroit (>1.8M residents). This suggests that at that time total impervious surface area was at a maximum, vacant areas at a minimum, and sewer system capacity was fully utilized in a different hydroclimatic regime. With vacant land area now at a maximum, there is much opportunity to properly leverage this land mass toward connectivity among gray, green and blue infrastructures and gain ecosystem services. The thresholds for stoplight signaling are conservative and in all likelihood, there is more capacity for abstraction and infiltration on vacant parcels.
Since there is no discernable pattern in parcel level infiltration, drainage data pairs and proximate soil textural class, we suggest that parcels be assessed prior to any major decisions. This data-driven approach would prevent lost opportunities to conserve-preserve parcels that signal green, identify and manage yellow areas, and engage in a no-regret consideration of low-impact development in parcels that sorted into the orange or red quadrants. The LID approach may appropriately consider water features as wet ponds, small wetlands, etc. according to community preferences. This field campaign was a 50,000 USD (2025) investment in establishing range of variability in soil hydrologic conditions across post-urban landscapes in Detroit MI. A single green infrastructure practice (e.g., rain garden) would cost at least 10,000 USD to install. Given our survey, there is a high probability that the rain garden would be placed on a parcel (or parcels) with a red hydrologic status. Any further investment on a red or orange parcel would be risky with regard to the effectiveness in maximizing gray-green-blue connectivity. We posit that hydrologic regulating services directly affect cultural services (e.g., aesthetics). If GSI is not effective (e.g., overflowing, plant mortality, odors, breeding ground for disease vectors and pests (e.g., mosquitoes, Aedes, Culex, Anopheles spp.)), then cultural ES are compromised as lost social capital and damage to a sense of well-being. It is also arguable that if GSI structure is such that any of its functions are compromised, then the benefits of habitat (provisioning ES), or nutrient cycling and storage (supporting ES) are also lost.
The connection between green landscape and blue riverine assets as groundwater is not likely widespread. Blue-green connectivity is qualitative and estimated to be dominated by the larger regional network that would support (as an ES) ecological flows in river courses. We rely here entirely on soil boring data to make generalizations on groundwater connectivity. What underlies any aspect of this analysis is that there is a great deal of variation in groundwater flow direction, which is attributed to what is a highly disturbed, urbanized regional strata, with many influences on groundwater directional gradients. These data deficits should be the focus of a different long-term field campaign.
We suggest that straightforward assessment such as that employed in this work could be customarily done to classify best uses of urbanized landscapes, provide feedback to the demolition contractor community to improve their procedures, inform planning for sustainable, net-zero runoff communities, and to maximize ecosystem services to the larger urban environment and its floral and faunal communities. We conclude there are positive hydrological impacts of vacant lots as functional ecosystems, and investments to enhance rendering ecosystem services will impart further hydrological benefits to a conurbation.
Author Contributions
Conceptualization, W.D.S., R.M.G., T.S., A.S., S.P.; methodology, W.D.S.; formal analysis, W.D.S., R.M.G.; investigation and fieldwork, W.D.S, T.S., A.S., S.P.; writing—original draft preparation, W.D.S.; writing—review and editing, W.D.S., R.M.G., T.S., A.S., S.P.; visualization, W.D.S., R.M.G.; supervision, W.D.S.; project administration, W.D.S. All authors have read and agreed to the published version of the manuscript.
Funding
No external funding was used in the development of this manuscript.
Data Availability Statement
The 2013, 2016 data is published in a publicly available USEPA archive. Data have been deposited in the Environmental Protection Agency Science Hub repository (https://catalog.data.gov/harvest/about/epa-sciencehub doi: https://doi.org/10.23719/1407673). Last accessed Sept. 10 2025).
Acknowledgments
Wayne State University rests on Waawiyaataanong, also referred to as Detroit, the ancestral and contemporary homeland of the Three Fires Confederacy. These sovereign lands were granted by the Ojibwe, Odawa, Potawatomi, and Wyandot nations, in 1807, through the Treaty of Detroit. Wayne State University affirms Indigenous sovereignty and honors all tribes with a connection to Detroit.
Conflicts of Interest
The authors declare no conflicts of interest.
Abbreviations
The following abbreviations are used in this manuscript:
| MI | Michigan |
| GSI | Green Stormwater Infrastructure |
| CAN | Canada |
| BGI | Blue-green Infrastructure |
| CSO | Combined Sewer Overflow |
| LULC | Land Use Land Cover |
| USDA | United States Department of Agriculture |
| HAHT | Human Altered, Human Transported |
| PGI | Passive Green Infrastructure |
| cl | Clay loam |
| fsl | Fine sandy loam |
| l | Loam |
| ls | Loamy sand |
| scl | Sandy clay loam |
| sl | Sandy loam |
| sicl | Silty clay loam |
| sil | Silt loam |
| USGS | United States Geological Survey |
| SE | Southeast |
| NW | Northwest |
| LID | Low Impact Development |
| USD | United States Dollars |
| ES | Ecosystem Services |
References
- Klimanova, O.; Illarionova, O.; Grunewald, K.; Bukvareva, E. Green Infrastructure, Urbanization, and Ecosystem Services: The Main Challenges for Russia’s Largest Cities. Land 2021, 10, 1292. [Google Scholar] [CrossRef]
- Miller, A.J.; Welty, C.; Duncan, J.M.; Baeck, M.L.; Smith, J.A. Assessing Urban Rainfall-runoff Response to Stormwater Management Extent. Hydrological Processes 2021, 35, e14287. [Google Scholar] [CrossRef]
- Oswald, C.J.; Kelleher, C.; Ledford, S.H.; Hopkins, K.G.; Sytsma, A.; Tetzlaff, D.; Toran, L.; Voter, C. Integrating Urban Water Fluxes and Moving beyond Impervious Surface Cover: A Review. Journal of Hydrology 2023, 618, 129188. [Google Scholar] [CrossRef]
- Stevenson, S.; Coats, S.; Touma, D.; Cole, J.; Lehner, F.; Fasullo, J.; Otto-Bliesner, B. Twenty-First Century Hydroclimate: A Continually Changing Baseline, with More Frequent Extremes. Proc. Natl. Acad. Sci. U.S.A. 2022, 119, e2108124119. [Google Scholar] [CrossRef]
- Hendricks, M.D.; Dowtin, A.L. Come Hybrid or High Water: Making the Case for a Green–Gray Approach toward Resilient Urban Stormwater Management. J American Water Resour Assoc 2023, 59, 885–893. [Google Scholar] [CrossRef]
- Cavadini, G.B.; Rodriguez, M.; Nguyen, T.; Cook, L.M. Can Blue–Green Infrastructure Counteract the Effects of Climate Change on Combined Sewer Overflows? Study of a Swiss Catchment. Environ. Res. Lett. 2024, 19, 094025. [Google Scholar] [CrossRef]
- Kaushal, S.S.; Belt, K.T. The Urban Watershed Continuum: Evolving Spatial and Temporal Dimensions. Urban Ecosyst 2012, 15, 409–435. [Google Scholar] [CrossRef]
- Ecosystems and Human Well-Being: Synthesis; Millennium Ecosystem Assessment (Program), Ed.; Island Press: Washington, DC, 2005; ISBN 978-1-59726-040-4.
- Meerow, S.; Newell, J.P. Spatial Planning for Multifunctional Green Infrastructure: Growing Resilience in Detroit. Landscape and Urban Planning 2017, 159, 62–75. [Google Scholar] [CrossRef]
- Ren, X.; Guo, Z.; Li, Q.; Zhou, Z.; Chen, X.; Liao, J. Integrating Hydrological and Economic Assessments of Soil Infiltration Enhancement for Urban Flood Resilience. Science of The Total Environment 2025, 1000, 180383. [Google Scholar] [CrossRef] [PubMed]
- Lacroix, S.; Kuller, M.; Gougeon, G.; Petrucci, J.; Lemieux-Chalifour, F.; Rioux, A.; Dagenais, D.; Bichai, F. Can We Stop Reinventing the Wheel in Blue-Green Infrastructure Planning? Using Value-Focused Thinking to Enable Transferability of a Multicriteria Planning Support System. Landscape and Urban Planning 2024, 252, 105188. [Google Scholar] [CrossRef]
- Hoard, C.J.; Haefner, R.J.; Shuster, W.D.; Pieschek, R.L.; Beeler, S. Full Water-Cycle Monitoring in an Urban Catchment Reveals Unexpected Water Transfers (Detroit MI, USA). J American Water Resour Assoc 2020, 56, 82–99. [Google Scholar] [CrossRef] [PubMed]
- Shuster, W.D.; Schifman, L.; Kelleher, C.; Golden, H.E.; Bhaskar, A.S.; Parolari, A.J.; Stewart, R.D.; Herrmann, D.L. K in an Urban World: New Contexts for Hydraulic Conductivity. J American Water Resour Assoc 2021, 57, 493–504. [Google Scholar] [CrossRef] [PubMed]
- Bell, C.D.; Spahr, K.; Grubert, E.; Stokes-Draut, J.; Gallo, E.; McCray, J.E.; Hogue, T.S. Decision Making on the Gray-Green Stormwater Infrastructure Continuum. J. Sustainable Water Built Environ. 2019, 5, 04018016. [Google Scholar] [CrossRef]
- Herrmann, D.L.; Shuster, W.D.; Garmestani, A.S. Vacant Urban Lot Soils and Their Potential to Support Ecosystem Services. Plant Soil 2017, 413, 45–57. [Google Scholar] [CrossRef]
- Schifman, L.A.; Shuster, W.D. Comparison of Measured and Simulated Urban Soil Hydrologic Properties. J. Hydrol. Eng. 2019, 24. [Google Scholar] [CrossRef] [PubMed]
- Shuster, W.D.; Burkman, C.E.; Grosshans, J.; Dadio, S.; Losco, R. Green Residential Demolitions: Case Study of Vacant Land Reuse in Storm Water Management in Cleveland. J. Constr. Eng. Manage. 2015, 141. [Google Scholar] [CrossRef]
- Shuster, W. D., M. Pavao-Zuckerman, A. L. Mayer, D. L. Herrmann, and L. A. Schifman. “Defining Passive Green Infrastructure: An Ecosystem Services Perspective to Make It Count.” Journal of Sustainable Water in the Built Environment 8, no. 3 (2022): 02522001. [CrossRef]
- Haefner, Ralph J., Christopher J. Hoard, and William Shuster. Hydrologic Study of Green Infrastructure in Poorly Drained Urbanized Soils at RecoveryPark, Detroit, Michigan, 2014–21. Scientific Investigations Report. US Geological Survey, 2024. [CrossRef]
Figure 1.
(a) Site location summary, (b) westside parcels in the River Rouge watershed, and (c) eastside locations in the Detroit River watershed. Note that several neighborhoods on the west and east sides are sampled more densely.
Figure 1.
(a) Site location summary, (b) westside parcels in the River Rouge watershed, and (c) eastside locations in the Detroit River watershed. Note that several neighborhoods on the west and east sides are sampled more densely.
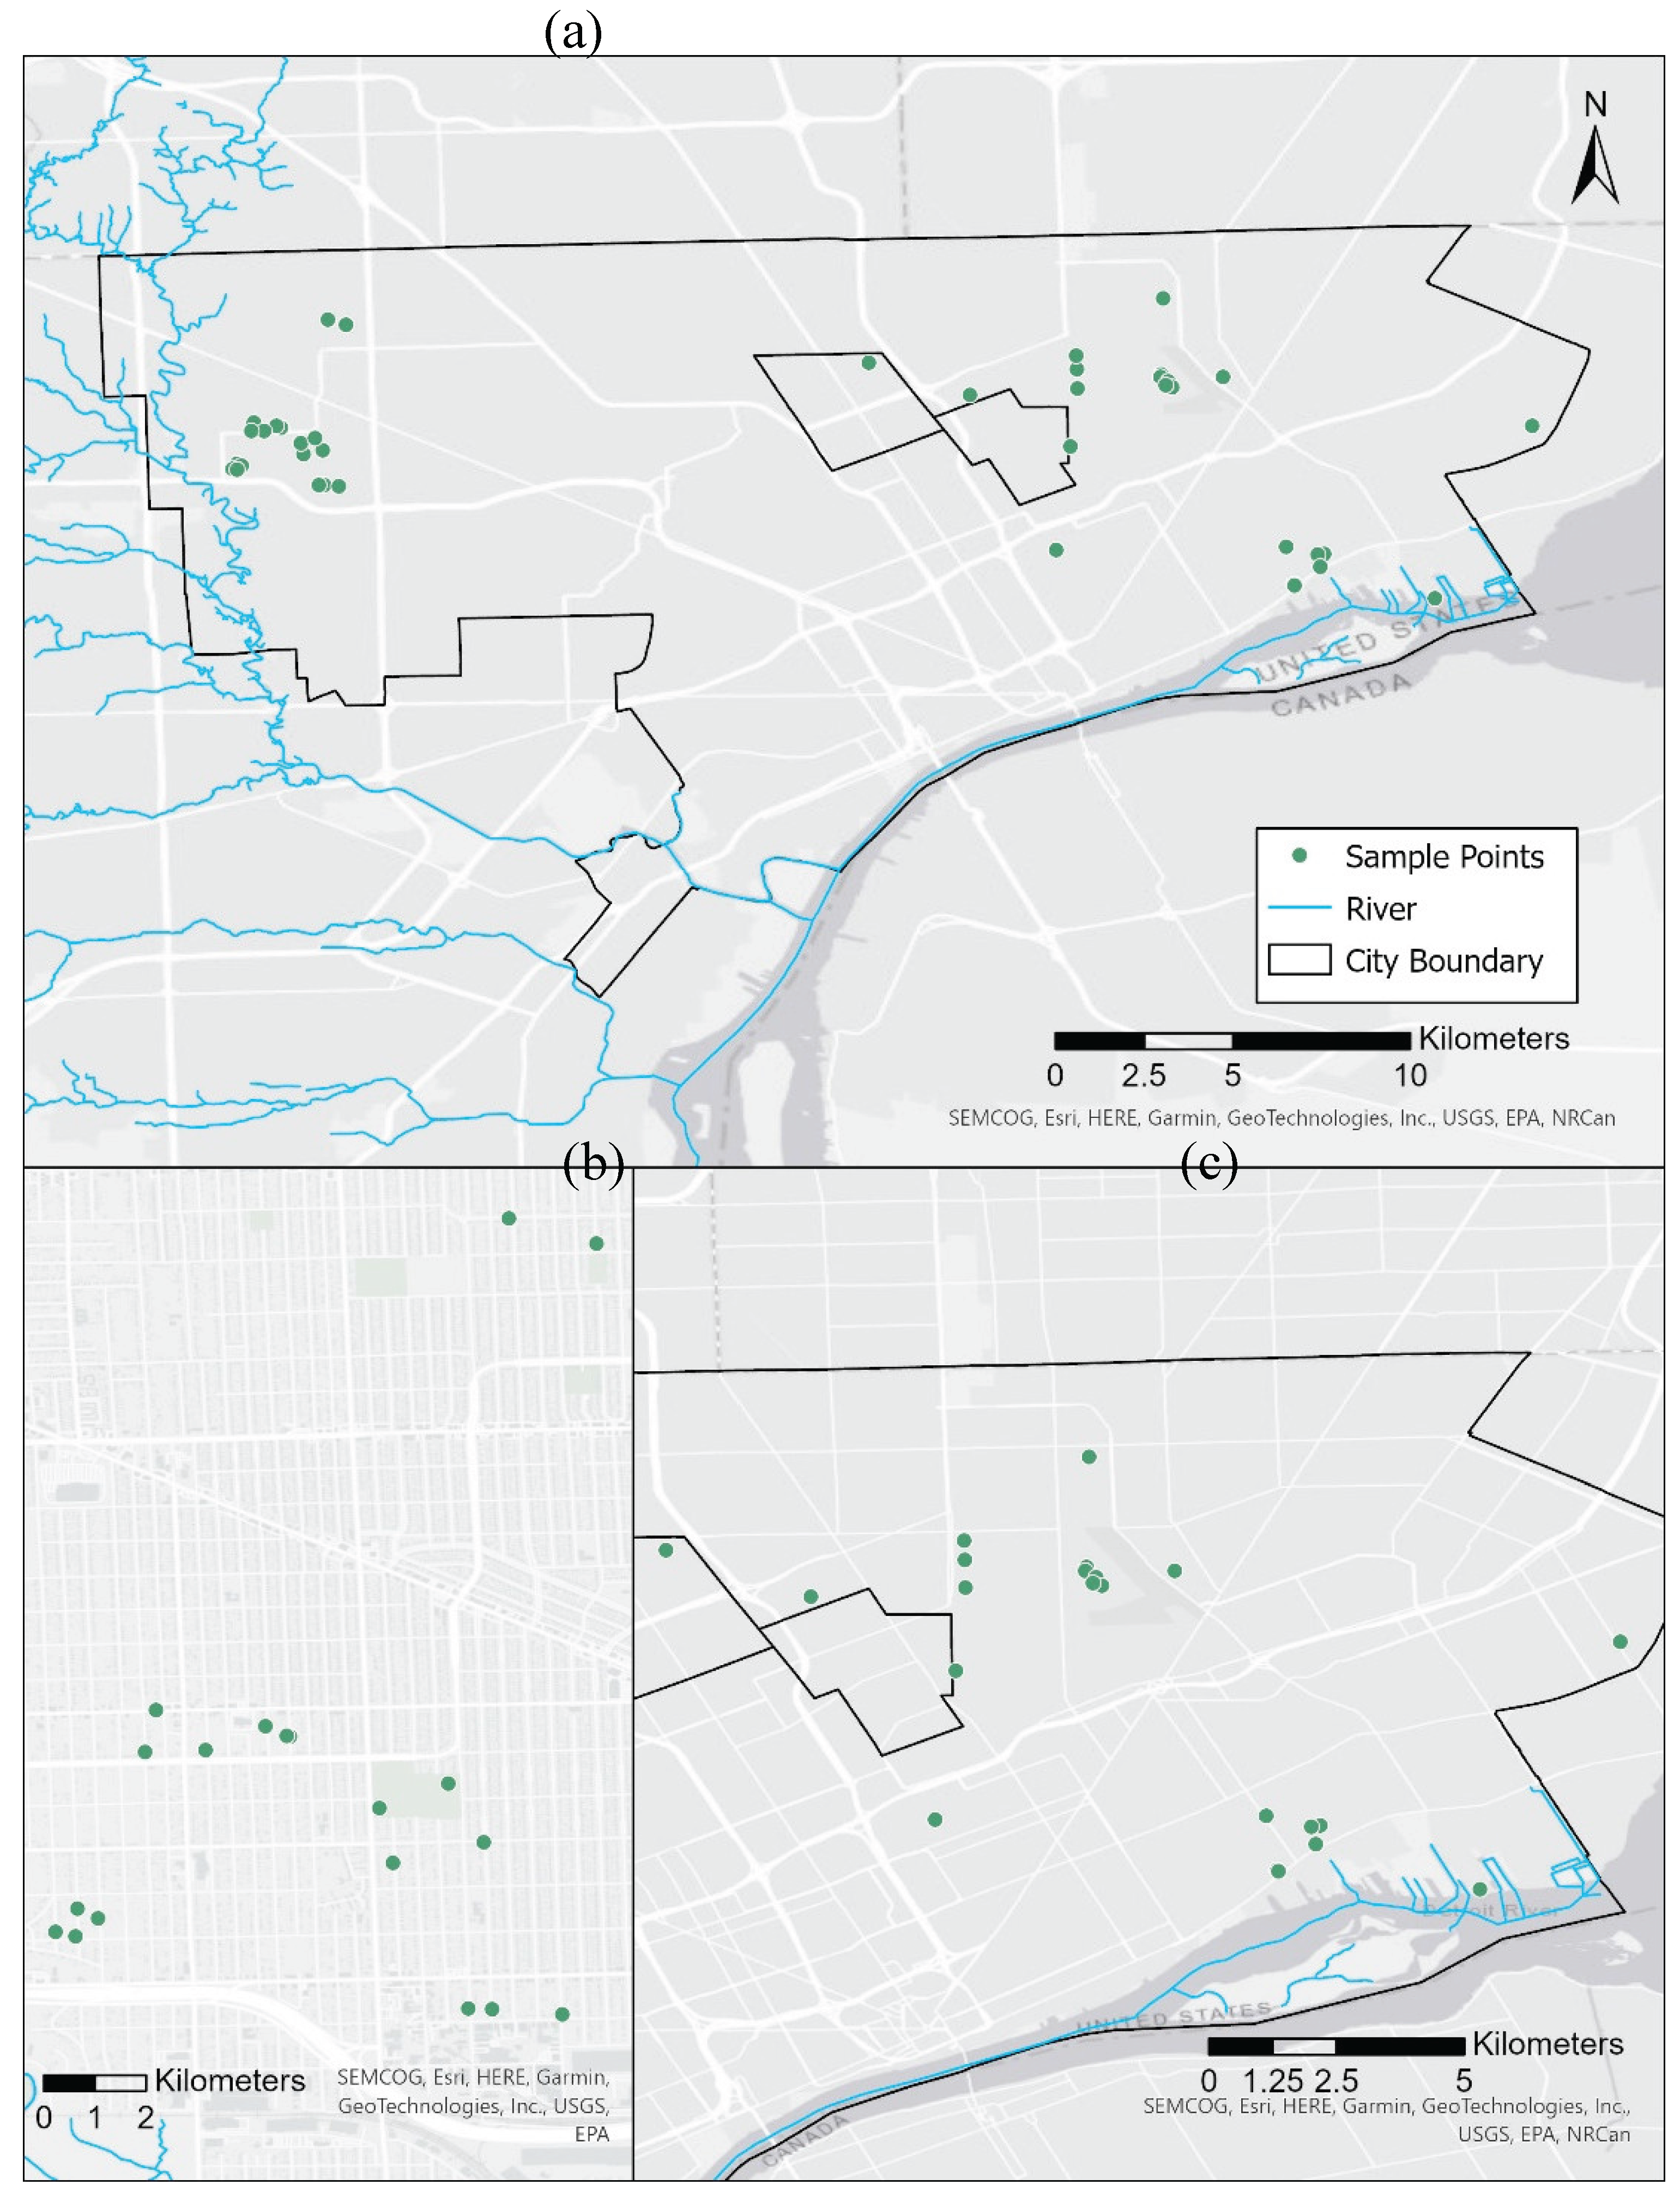
Figure 2.
Summary stoplight approach to sorting infiltration and drainage rate field data. The descriptions embedded in each color field are worded for clear communication of prospects and limitations of observed parcel-level hydrology and, where applicable (Orange, Yellow), options for restorative management of parcel landscapes.
Figure 2.
Summary stoplight approach to sorting infiltration and drainage rate field data. The descriptions embedded in each color field are worded for clear communication of prospects and limitations of observed parcel-level hydrology and, where applicable (Orange, Yellow), options for restorative management of parcel landscapes.
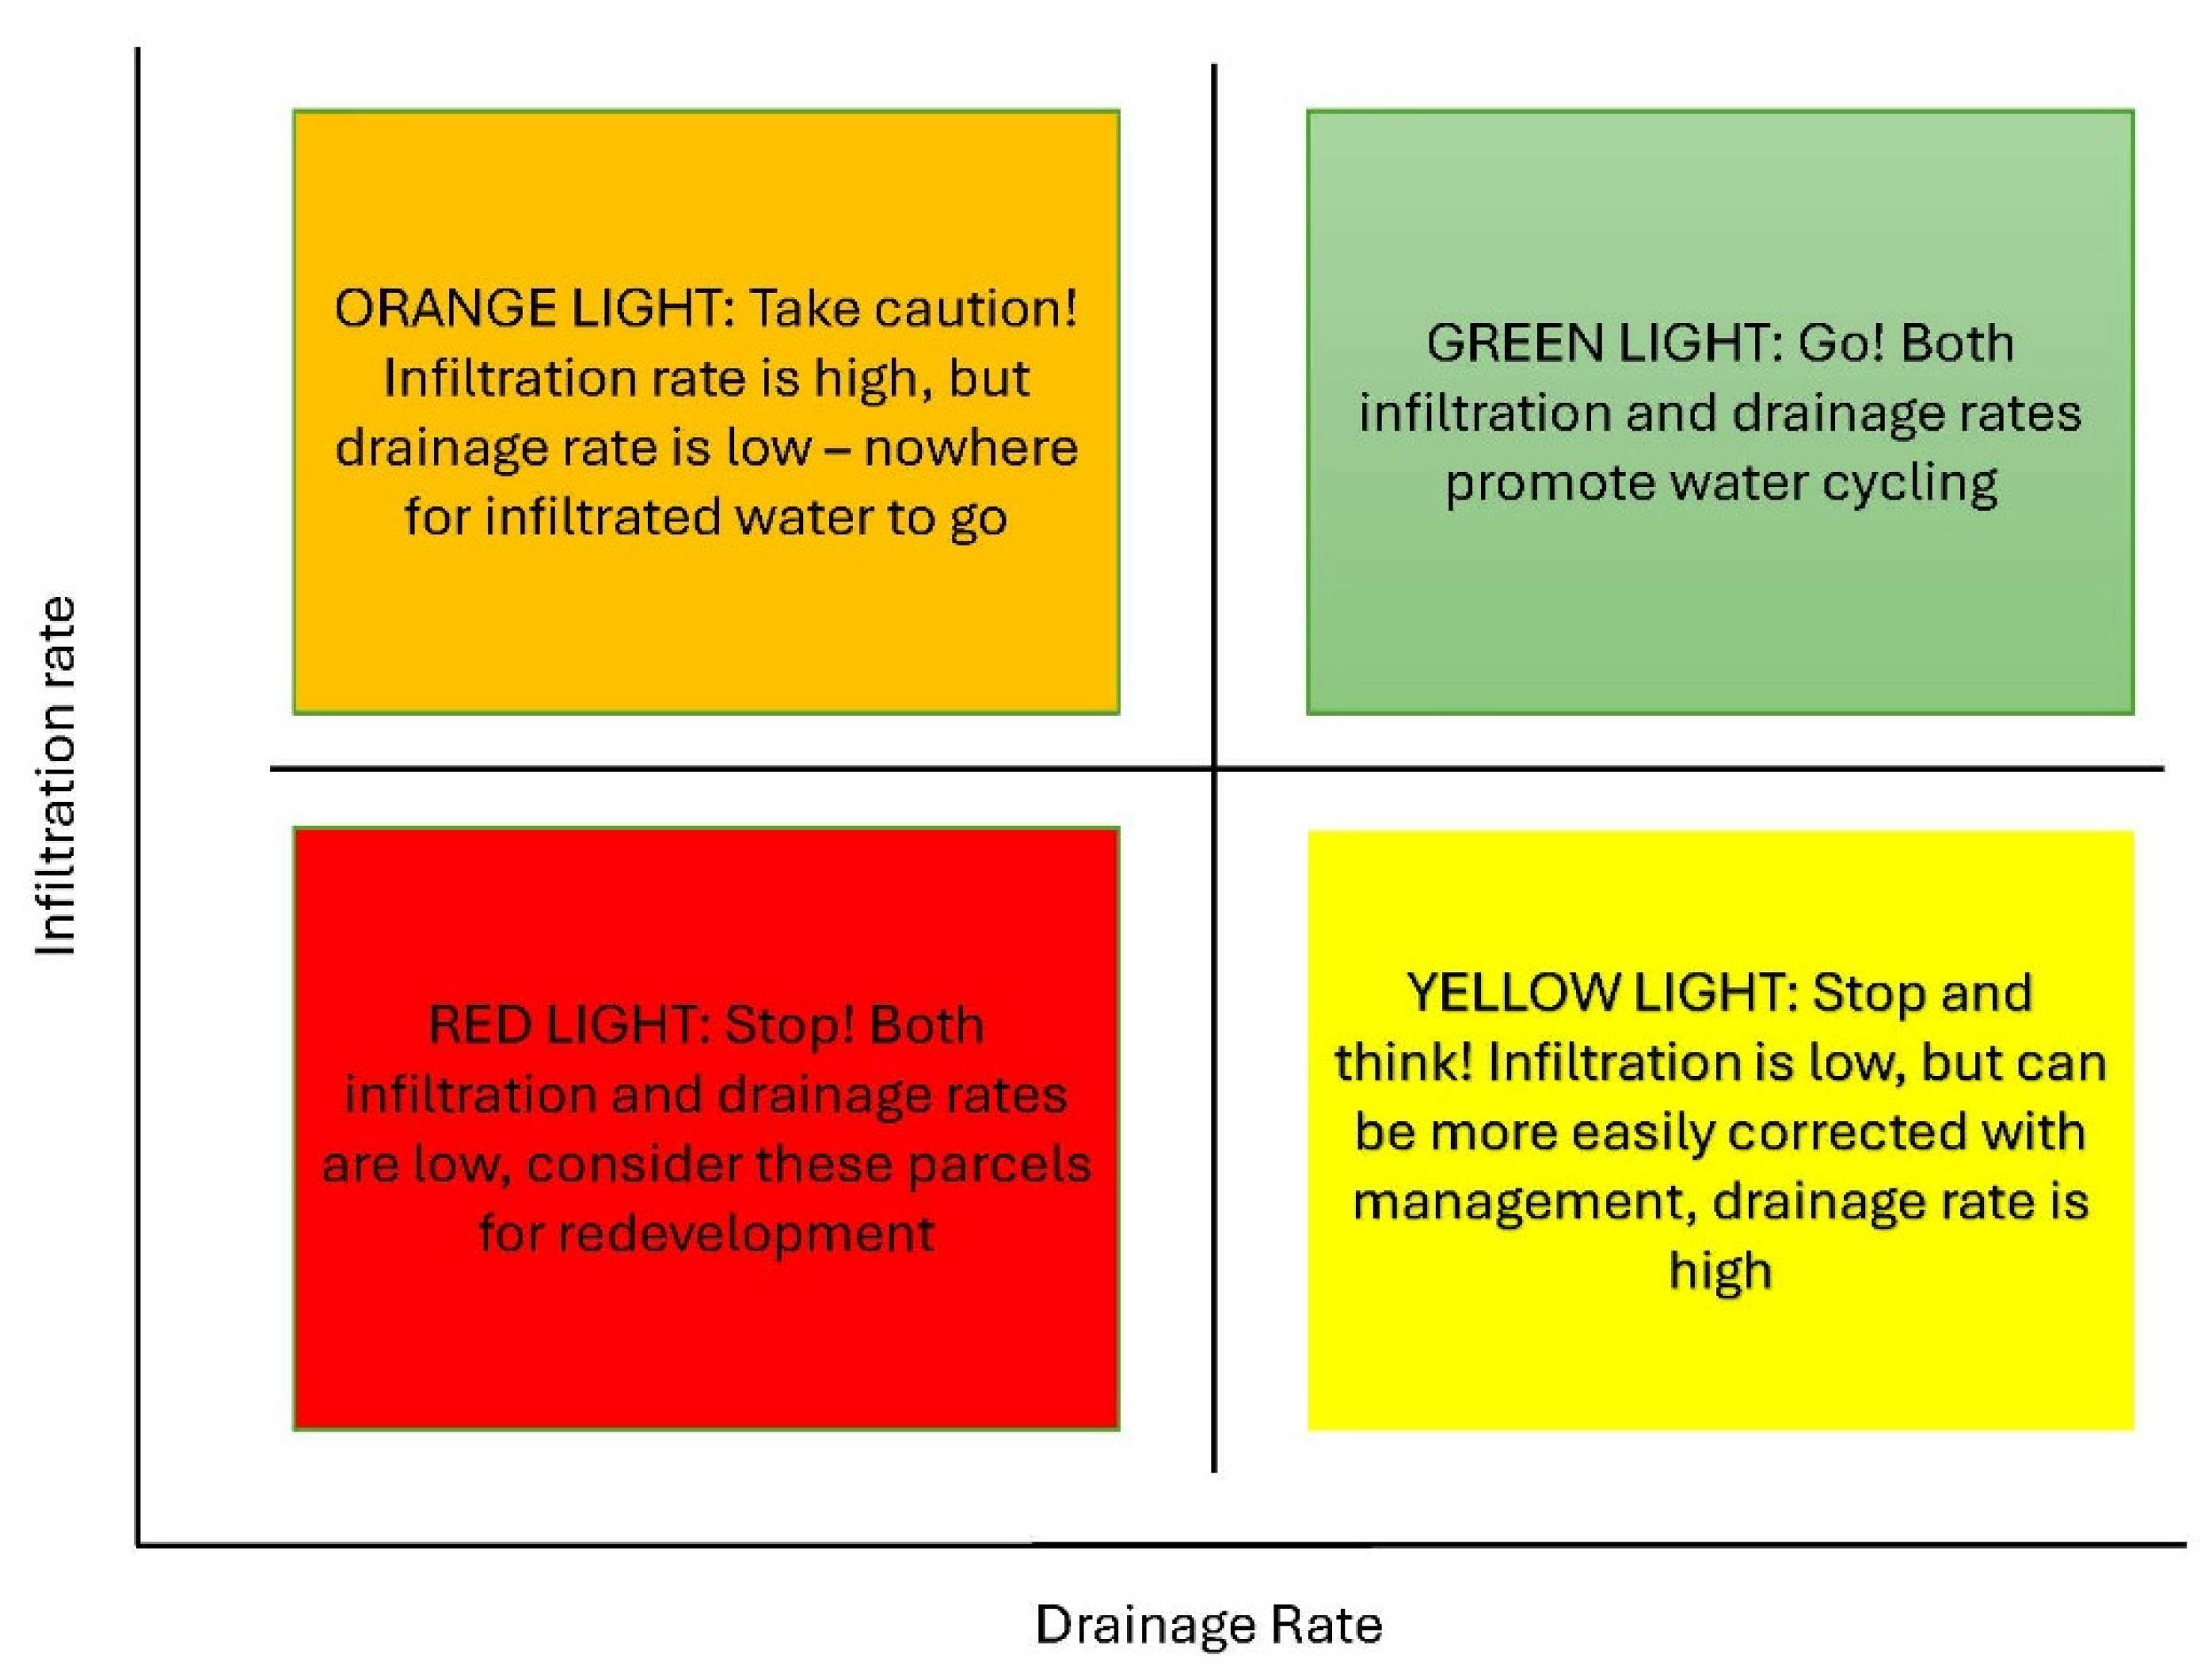
Figure 3.
Westside Detroit River Rouge (Upper Branch) watershed with parcel locations and symbology according to infiltration rate (outer circle), and drainage rate (inner circle). Text abbreviations are soil textural class for surface soils (cl = clay loam, fsl = fine sandy loam, l = loam, ls = loamy sand, scl = sandy clay loam, sl = sandy loam).
Figure 3.
Westside Detroit River Rouge (Upper Branch) watershed with parcel locations and symbology according to infiltration rate (outer circle), and drainage rate (inner circle). Text abbreviations are soil textural class for surface soils (cl = clay loam, fsl = fine sandy loam, l = loam, ls = loamy sand, scl = sandy clay loam, sl = sandy loam).
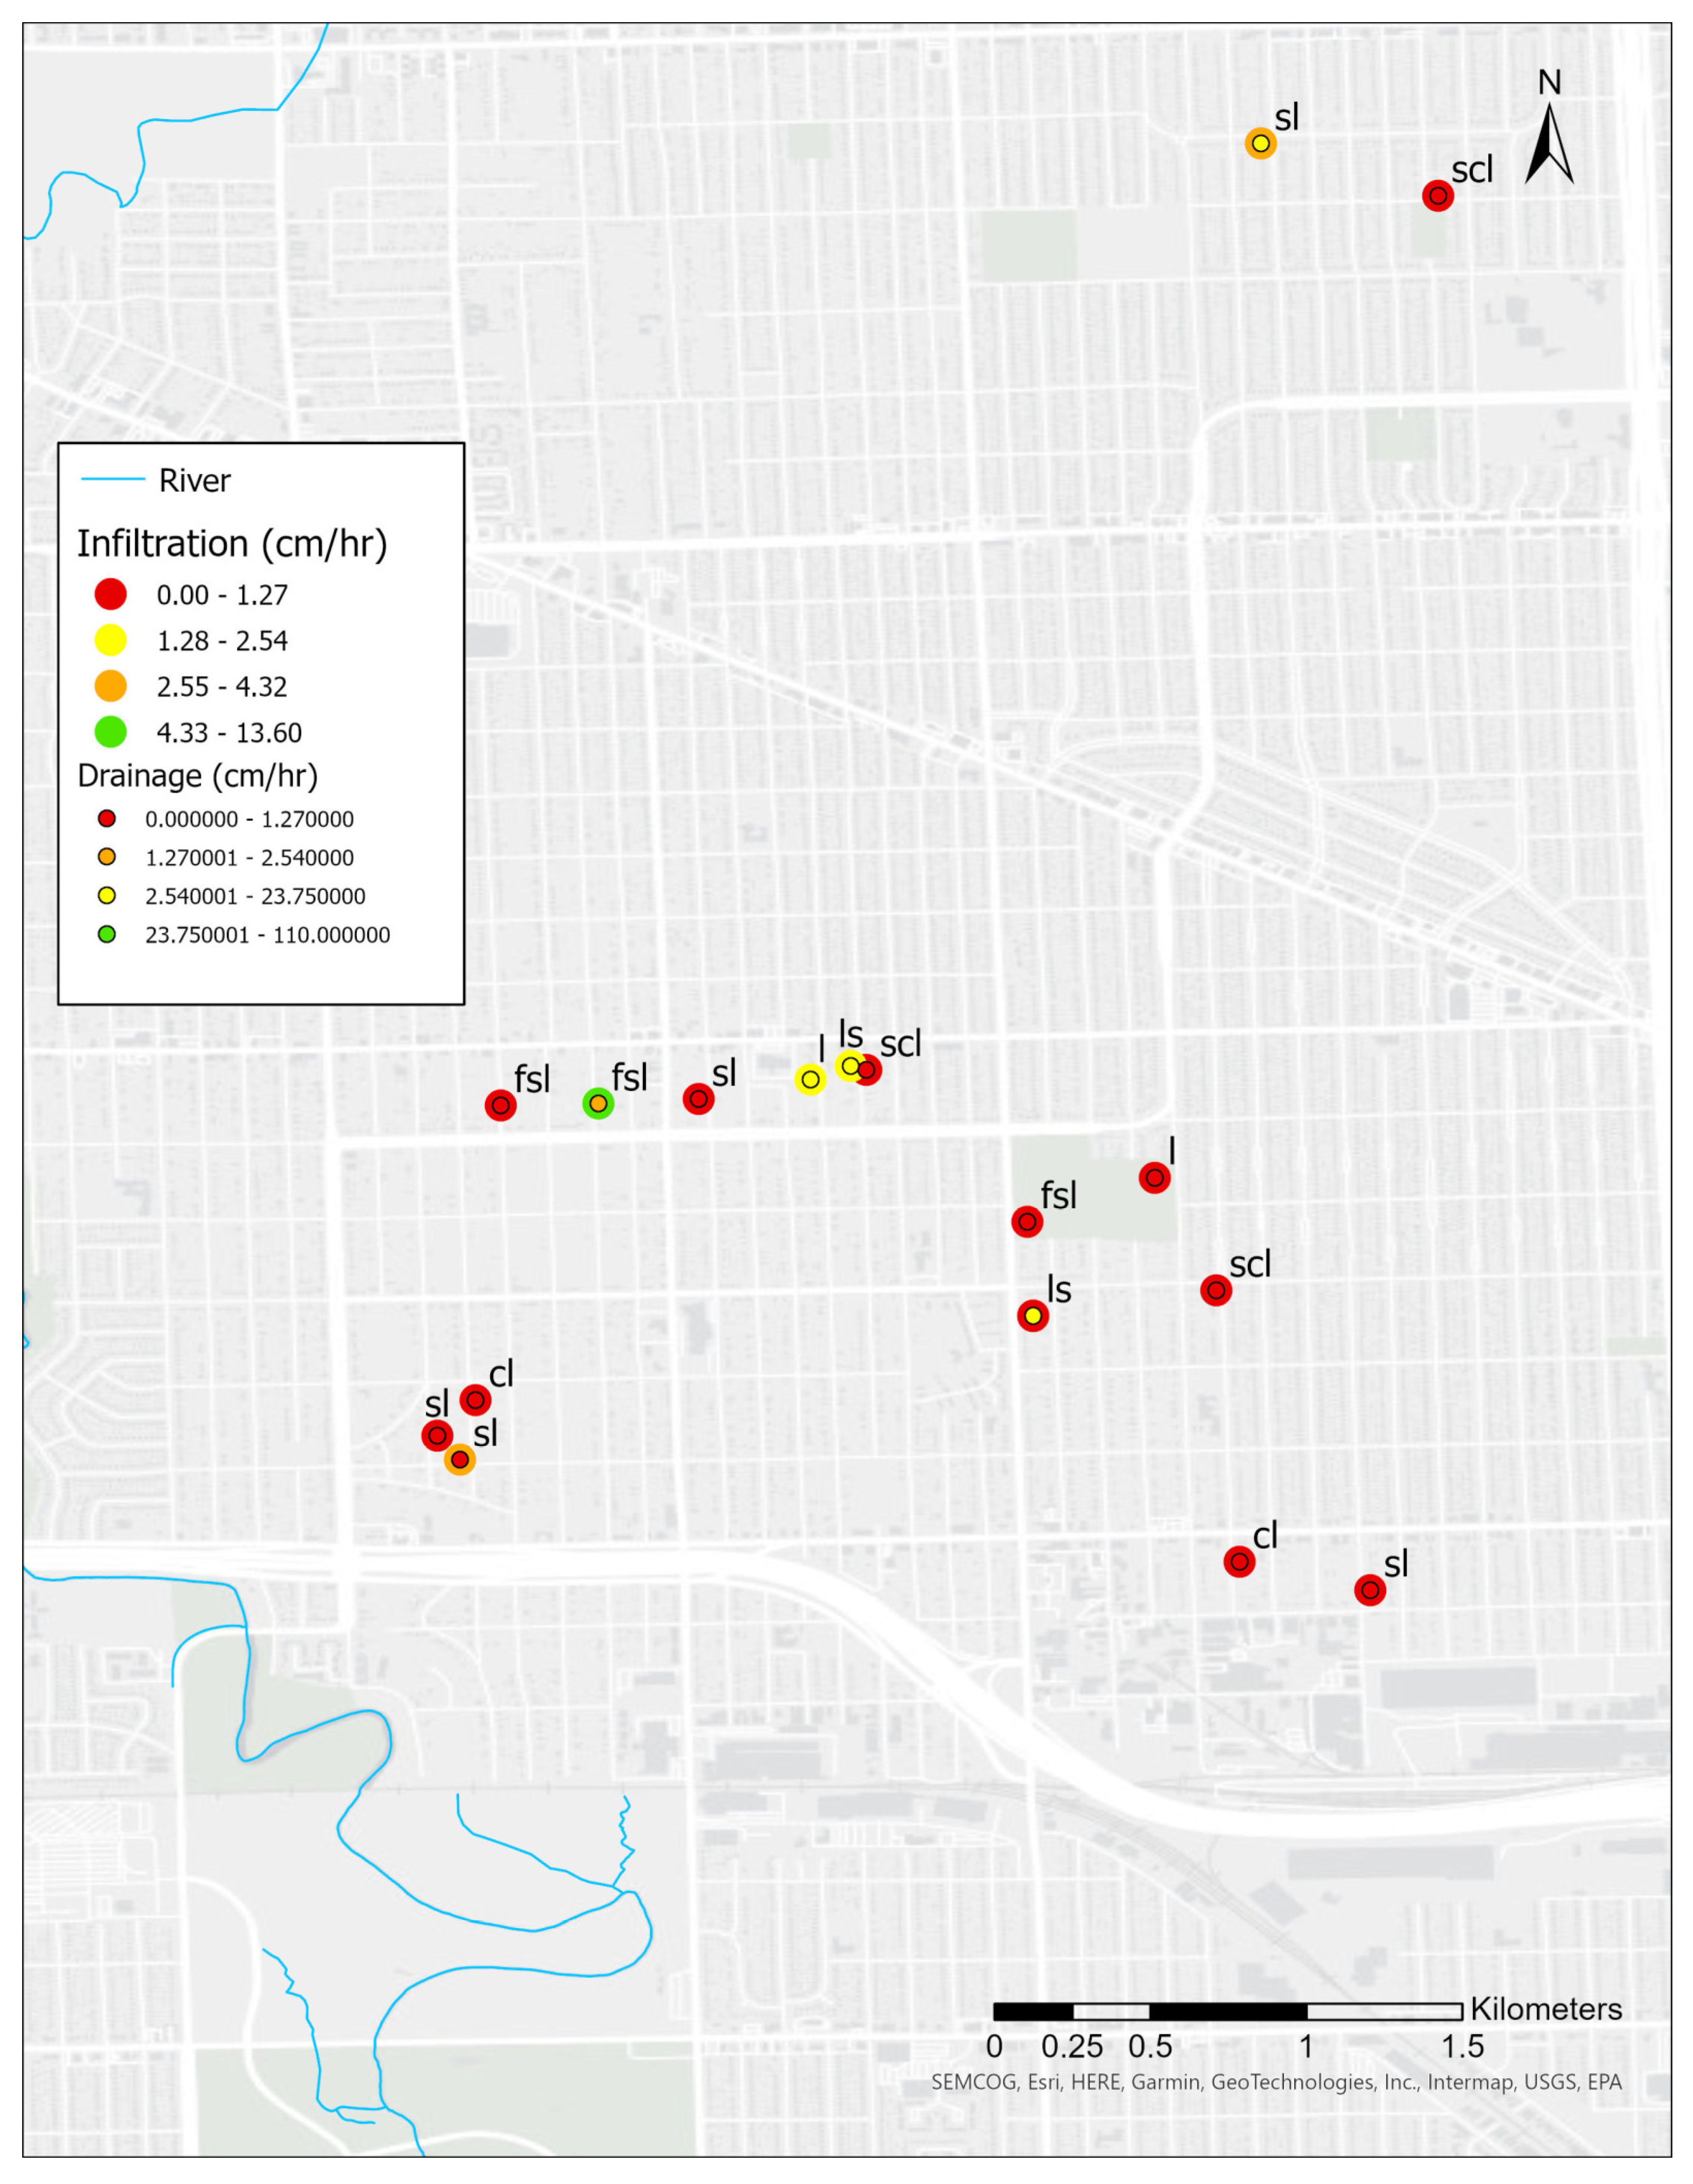
Figure 4.
Eastside Detroit River watershed with parcel locations and symbology according to infiltration rate (outer circle), and drainage rate (inner circle). Text abbreviations are soil textural class for surface soils (cl = clay loam, fsl = fine sandy loam, l = loam, ls = loamy sand, scl = sandy clay loam, sicl = silty clay loam, sil = silt loam, sl = sandy loam).
Figure 4.
Eastside Detroit River watershed with parcel locations and symbology according to infiltration rate (outer circle), and drainage rate (inner circle). Text abbreviations are soil textural class for surface soils (cl = clay loam, fsl = fine sandy loam, l = loam, ls = loamy sand, scl = sandy clay loam, sicl = silty clay loam, sil = silt loam, sl = sandy loam).
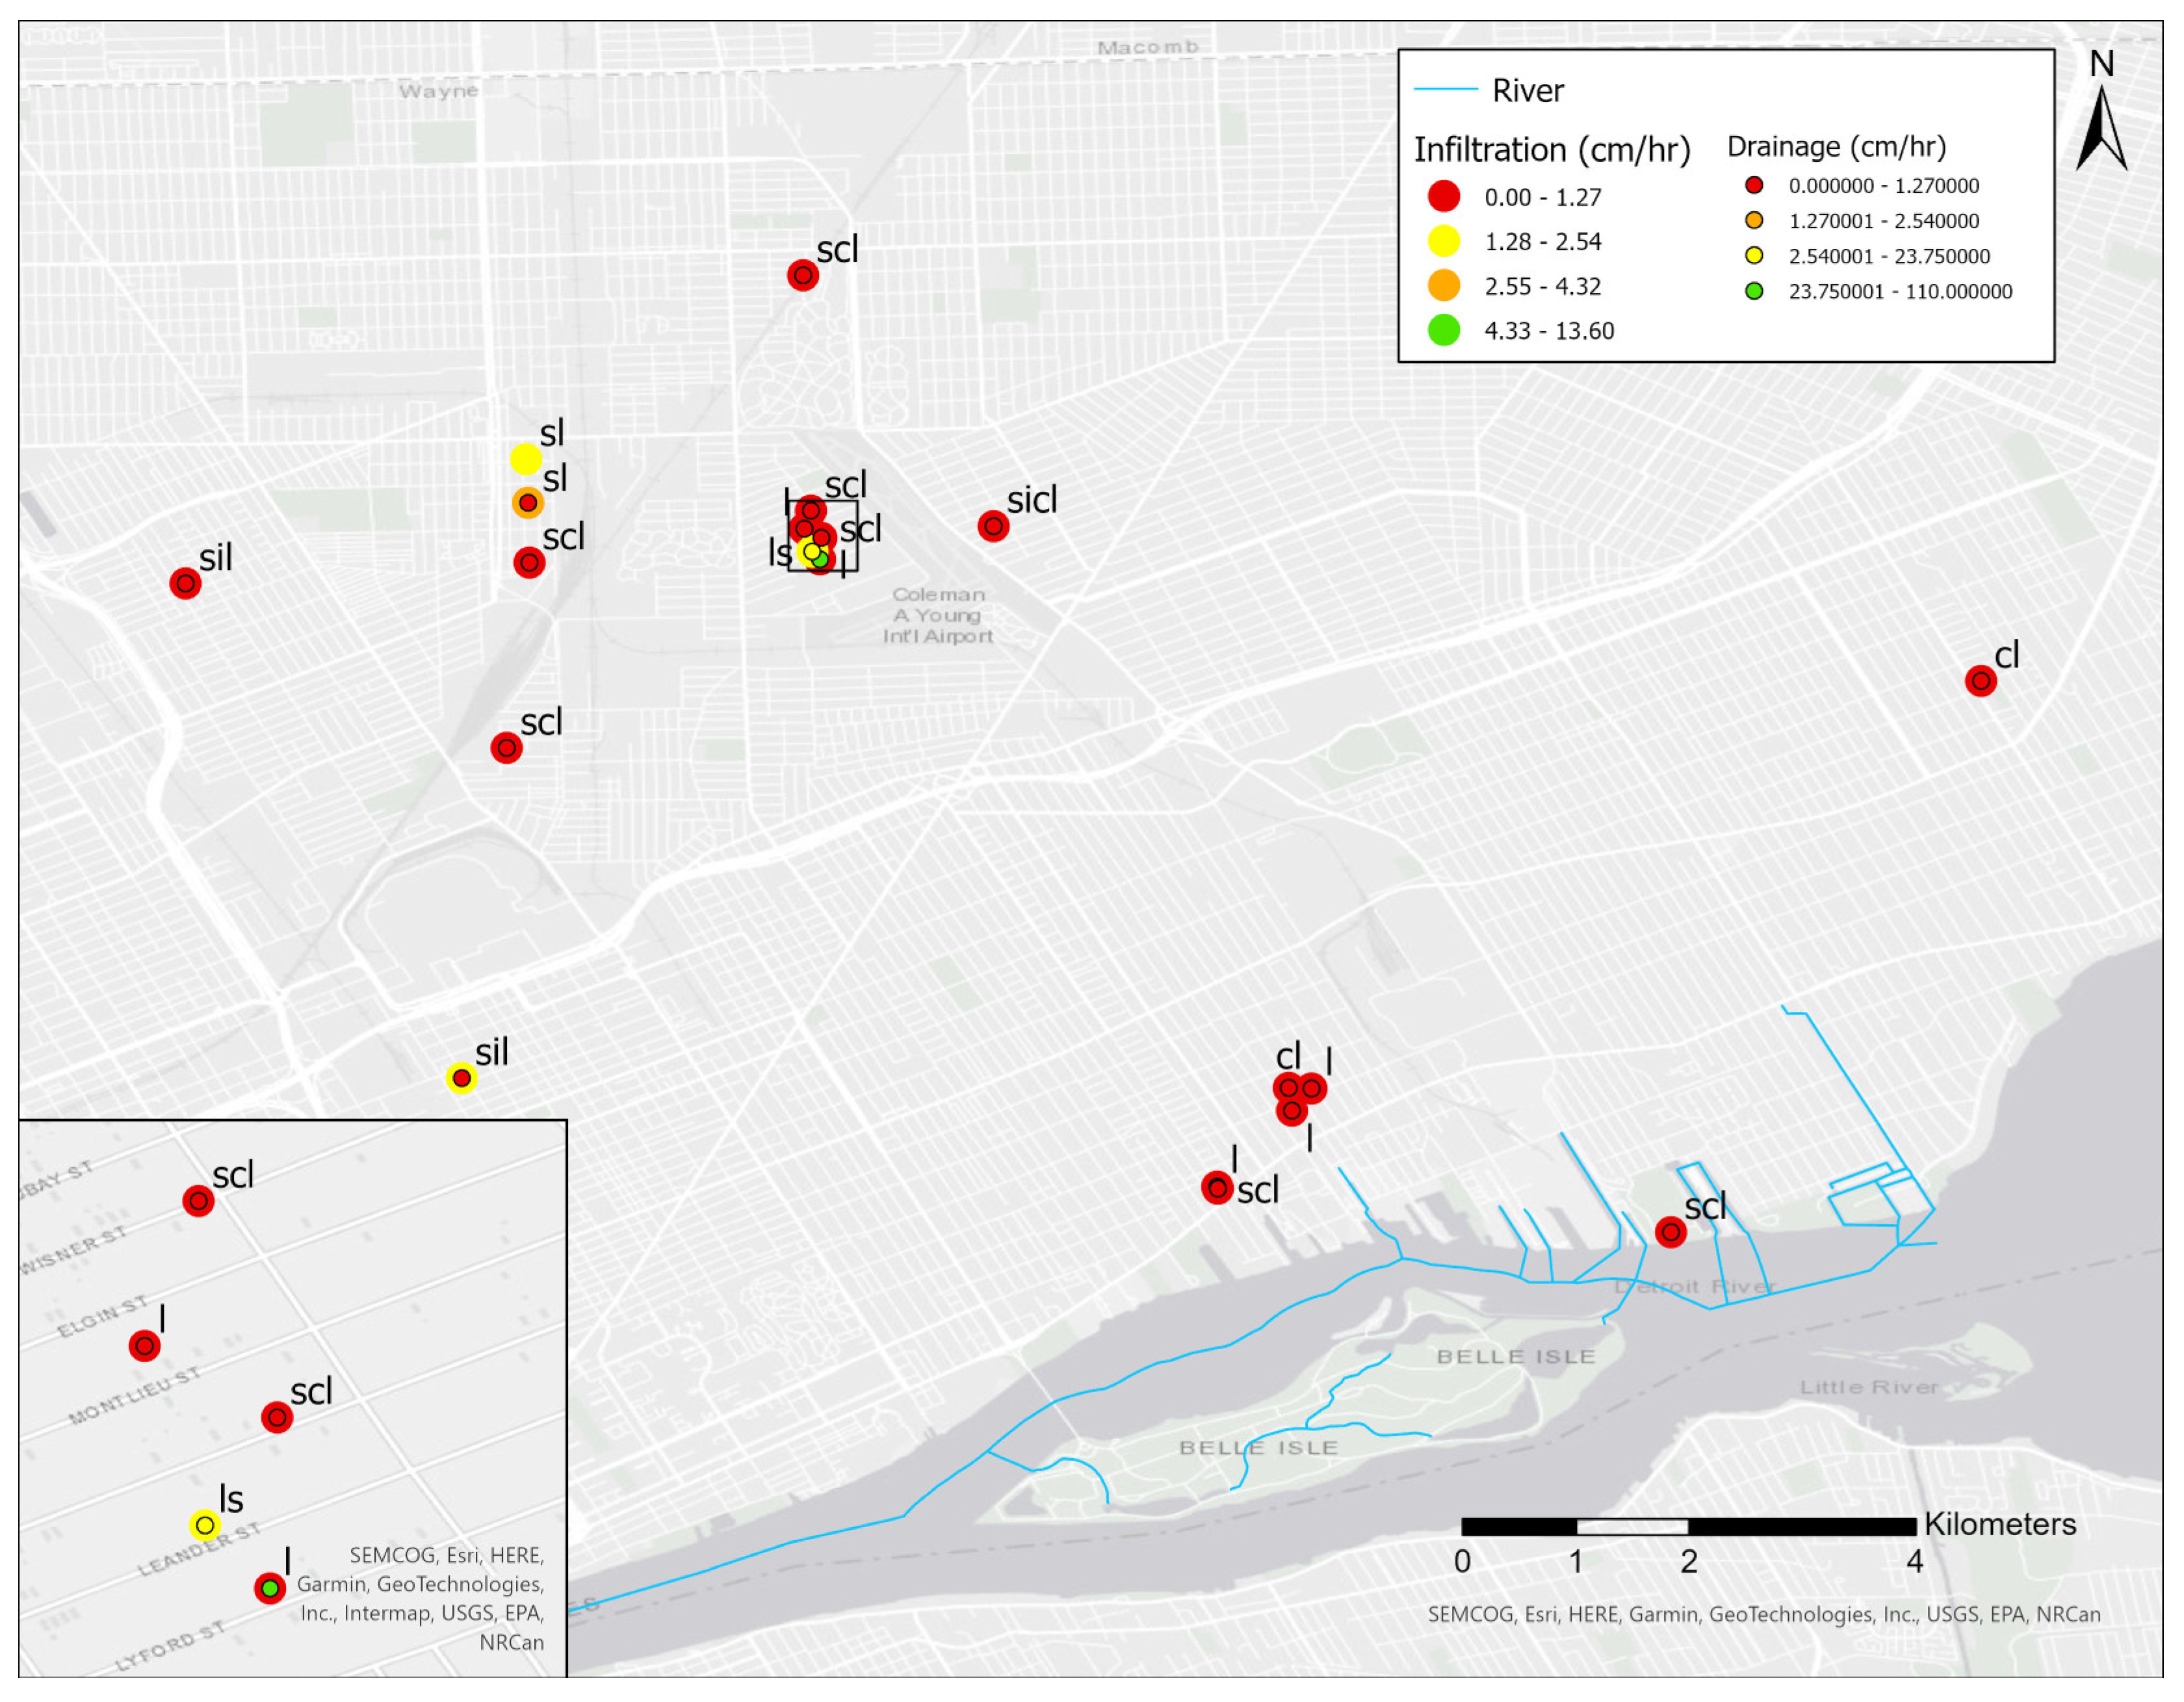
Figure 5.
Groundwater depths observed at parcel scale for: a) the westside River Rouge (Upper Branch) catchment, and b) the eastside Detroit River catchment.
Figure 5.
Groundwater depths observed at parcel scale for: a) the westside River Rouge (Upper Branch) catchment, and b) the eastside Detroit River catchment.
Disclaimer/Publisher’s Note: The statements, opinions and data contained in all publications are solely those of the individual author(s) and contributor(s) and not of MDPI and/or the editor(s). MDPI and/or the editor(s) disclaim responsibility for any injury to people or property resulting from any ideas, methods, instructions or products referred to in the content. |
© 2025 by the authors. Licensee MDPI, Basel, Switzerland. This article is an open access article distributed under the terms and conditions of the Creative Commons Attribution (CC BY) license (http://creativecommons.org/licenses/by/4.0/).
Copyright: This open access article is published under a Creative Commons CC BY 4.0 license, which permit the free download, distribution, and reuse, provided that the author and preprint are cited in any reuse.