Submitted:
16 September 2025
Posted:
17 September 2025
You are already at the latest version
Abstract
In the production of stainless steel, chromium losses, particularly in the Electric Arc Furnace (EAF) phase, pose a challenge. This study addresses these issues by reviewing and analyzing the thermodynamics of the Fe-Cr-C-O system, highlighting discrepancies in existing literature regarding Gibbs free energies, interaction parameters, and other thermodynamic data. We developed a simple to use thermodynamic model to simulate the oxidation process using established data from scientific literature. The model calculates the equilibrium solubilities of chromium and carbon, showing how process variables like temperature, partial pressure of carbon monoxide, and silicon concentration influence chromium oxidation. The findings confirm that higher temperatures and the presence of silicon significantly reduce chromium loss by favoring carbon oxidation over chromium. The research concludes by providing practical guidelines for minimizing chromium losses in EAFs, such as protecting scrap with carbon, silicon, and aluminum; controlling oxygen intake; and ensuring a high melt temperature during decarburization. These guidelines aim to improve the economic efficiency and sustainability of stainless steel production.
Keywords:
steelmaking
; thermodynamics
; stainless steel
; electric arc furnace (EAF)
; decarburization
; oxidation of steel melt
1. Introduction
The production of stainless steel is strongly dependent on the loss of chromium during the steelmaking process. The yield of chromium has been continuously improved by the adoption of advance technologies, mainly vacuum-based. Chromium is a key element in stainless steels, as they typically contain more than 10 wt. % Cr. The high chromium content provides good resistance against corrosion. Chromium is typically alloyed to the steel melt in the form of ferrochromium. Ferrochromium is available in several forms that typically vary in carbon content, from 8 wt. % to less than 0.1 wt. %. The lower the carbon content, the more expensive the ferrochromium. The low carbon contents, however, are essential for the steel’s corrosion resistance. But to make the steel production economical most steelmakers use the less expensive high carbon ferrochromium and achieve the lower carbon contents through the decarburisation process. The decarburisation process is essentially the removal of carbon through the introduction of oxygen that reacts with the dissolved carbon in the steel melt. The stainless steelmaking process is usually divided into two stages (duplex steelmaking process). The first stage consists of scrap melting and addition of ferrochromium in the EAF (electric arc furnace) and oxygen blowing to lower the carbon content without significant chromium oxidation. The second phase is intended to lower the carbon content to its final level, and this is carried out in an AOD (argon oxygen decarburisation) or VOD (vacuum oxygen decarburisation), where the decreased carbon monoxide partial pressure is used to favour carbon oxidation over that of other elements [1,2,3,4,5,6,7,8,9]. During the production of chromium alloyed steels, an astonishing 97 % percent of all chromium losses are attributed to the EAF production phase. This can be mitigated by the right approach to the melting process, oxidation of the stainless steel melt, and slag reduction, and thus improve the production economics [6,10,11,12,13].
Because of the great importance of stainless steels, numerous publications have concerned the thermodynamics of the Fe-Cr-C oxidation and the reduction of chromium oxides. But when one closely examines the available literature, inconsistencies and deviations in the thermodynamic calculations can be noticed. The differences arise due to the use of different energy values in the calculations of reactions and the different interpretations of thermodynamic processes during the production of stainless steels [1,3,4,9,14,15,16,17].
The main purpose of the work was to collect literature data from other authors, which were considered in the calculations of chromium losses in the process of making stainless steels. In addition, the aim of the work was to highlight the important points to reduce the loss of chromium in the stainless steel production process and to determine thermodynamic guidelines during the production process.
2. Thermodynamic Characteristics of Chromium and Carbon Oxidation
The greatest losses of chromium occur during the melting of the scrap material in the EAF in the stainless steels production process. When we talk about losses, we mean the oxidation of chromium, whereby the formed chromium oxide binds and dissolve into slag and is difficult to reduce it. The source of oxygen during the melting process can be an oxidized, moist scrap material, air intrusion through the door of the EAF, excessive oxidation of the steel melt, or last but not least, an incorrect ratio between natural gas and oxygen [3,4,5,18,19]. The reaction of chromium oxidation can be written as Equation (1):
A low carbon content should be reached when producing stainless steels, which can be most easily achieved by oxidation of the dissolved carbon. Oxidation of the dissolved carbon in liquid steel melt can be written as Equation (2):
From the given Equations, we can conclude that both carbon and chromium are oxidized during melting, and which reaction will preferentially take place depends on the activity and conditions in the furnace. Equations (1) and (2) can be combined and written as follows:
Now the equilibrium between chromium and carbon oxidation can be calculated. Table 1 shows the values for the standard enthalpy (ΔH°), entropy (ΔS°), and Gibbs free energy (ΔG°) at 1873 K for Equation [3] according to different literature sources [1,4,9,14,15,16,17,20,21]. When calculating Gibbs free energies, the initial and final states of elements and compounds are important, the reactions must be accurately described. Equation [3] shows that carbon and chromium were/are dissolved in the liquid iron solution, therefore the Gibbs free energy of elements dissolution (ΔGdis) should be considered. According to some authors [4,9,16,20], only standard enthalpies and entropies of formation were considered in calculating the Gibbs free energy. Wang et al. [15], Ma et al. [17], and Heikkinen et al. [14] on the other hand include in their calculations the energy used to dissolve C and Cr into the iron solution (ΔHdis, ΔSdis). When considering the required energy to dissolve C and Cr in an iron solution, the values from Sigworth et al. [22] were taken, it was necessary to consider the standard state used (Raoultain, Henrian, and 1 wt. % standard state).
In Table 1, calculated values based on given data from literature sources are marked with 1,2,3. When calculating the Gibbs free energies, Wang et al. [15] and Ma et al. [17] took into account the energy required to dissolve solids C and Cr and considered the 1 wt. % standard state in the calculations. Heikkinen et al. [14] also took into account the dissolution energy of carbon and chromium when calculating the Gibbs free energy, except that they considered the dissolution energy of chromium in the liquid state, and performed the calculations according to the Henrian standard state. Table 2 gives the values for the enthalpy (ΔHdis), entropy (ΔSdis), and calculated Gibbs free energy (ΔGdis) for the infinite dilution of C and Cr in liquid iron from different states at a temperature of 1873 K.
When calculating the Gibbs free energy (ΔG), the reaction constant (K) must also be taken into account, so we can write the expanded expression for calculating the Gibbs free energy:
Where T and R represent the temperature and the gas constant, K3 is the constant of Equation [3], pCO represents partial pressure of carbon monoxide, aCr, aC, are activities of chromium, carbon, and chromium oxide, respectively.
In multicomponent melts, as in alloy steels, the activity coefficient of solute i is affected by the alloying elements for which Wagner’s formalism can be written. The activity of elements can be calculated using different standard states if we take the 1 wt. % standard state, Wagner’s formalism is written with the following expressions [23]:
Where, , are the activity and the activity coefficient of element i in the iron solution, using 1 wt. % standard state, and are the first-order self-interaction parameter of the element i and first-order interaction parameter of element j on element i in dilute liquid iron, respectively. [wt. % i] and [wt. % j] is the weight percent of the dissolved element i and j, respectively. The values of interaction parameters , , and also vary in different references and are given in Table 3 [5,19,22,24,25,26].
Figure 1 gives the equilibrium solubility of chromium and carbon in a liquid iron considering Gibbs free energies taken from the literature (Table 1). In addition to the Gibbs free energies listed in Table 1, the dissolution energies (ΔGdis) of the elements in the liquid iron melt were used to calculate the equilibrium solubility (from the solid state to dissolved in liquid iron, taking into account 1 wt. % standard state). As the summation of the Gibbs free energy increases, the equilibrium solubility of chromium in the liquid iron melt decreases, thus, for example, the equilibrium concentration of chromium at 0.8 wt. % C and 1600 °C according to Carboni et al. [16] is 22.35 wt. % Cr and according to Heikkinen et al. [14] is 16.85 wt. % Cr. The values for enthalpy and entropy were taken from the HSC 8.0 software database for further calculations. The curve obtained from these values shows an approximate mean value. With data from HSC 8.0, the equilibrium value of chromium is 19.60 wt. % Cr at 0.8 wt. % C and 1600 °C.
Figure 2 shows the equilibrium concentration curves of C and Cr using the Gibbs free energy from the HSC 8.0 database at 1600 °C and different values of the interaction parameters , , and . When choosing the interaction parameters, there are also discrepancies between the authors, as can be seen from Table 3. The result of using different interaction parameters for Equation [3] are curves with different slopes, as can be seen from Figure 2. The equilibrium solubility of chromium is the highest when interaction parameters according to Ghosh et al. [5], Seetharaman et al. [19] and JSPS (The Japan Society for the Promotion of Science) [25] were used. The lowest equilibrium solubilities are given by calculations using interaction parameters according to Total Materia [26]. For further calculations, the interaction parameters according to Sigworth et al. [22], whose curve in Figure 2 shows an approximate median value.
In metallurgy, it is practical to calculate activity according to the 1 wt. % standard state, as the concentrations of elements in solutions are usually given in weight percentages. Using the 1 wt. % standard state is much more practical from the point of view of engineering practice since no conversion and adjustment of parameters is required. However, for more accurate calculations it is necessary to calculate with mole fractions (X). Wagner [23] and later Lupis and Elliott [27] proposed the following notation for calculating activity coefficients:
Where , are the activity and the activity coefficient of element i, using Henrian standard state, is the zero-order activity coefficient, is the first-order interaction parameter of the influence of element j on element i for calculation taking into account mole fractions (X), Xi, Xj are the mole fractions of element i and j in the solution, respectively. The first-order interaction parameter can be calculated from the interaction parameter of the 1 wt. % standard state [22,27]:
Where Mj is the molar mass of element j, M1 is the molar mass of the solvent element of the solution, and is the first-order interaction parameter of the 1 wt. % standard state.
Expression (9) describes well the state of diluted solutions which is described by Henry’s law, but the activity and activity coefficient deviate as the concentration of alloying elements in the solution increases. Therefore, Pelton and Bale [28,29], Ma et al. [17] proposed modification of the interaction parameter formalism and added the solvent activity coefficient () to Equation [9] and thus enabled a more accurate calculation of the activity at higher concentrations. Pelton and Bale [28,29] wrote the following expressions:
Figure 3 shows the equilibrium solubility curves of chromium and carbon in iron solution, taking into account 1 wt. % standard state, Henrian standard state, and modified Henrian standard state for calculating the activity coefficient of the elements. The results were calculated according to the given expressions and then converted to percent by weight. When calculating with the 1 wt. % standard state, the solubility of chromium is higher than in the case of calculation with mole fractions. When calculating with mole fractions, there is no significant difference in the equilibrium solubility of Cr and C at low concentrations (up to 0.2 wt. % C), but with an increase in the carbon concentration, the equilibrium solubility of chromium increases faster, taking into account the solvent activity coefficient. Direct links between the solubility of carbon and chromium using the ThermoCalc program were unable to be calculated. The data is protected, and such a display is not possible.
Figure 4a,b show the dependence of carbon and chromium activity on the molar fraction of the element in the iron solution with 15 wt. % Cr or 1 wt. % C at 1600 °C. Activities were calculated according to Raoultain, Henrian, and 1 wt. % standard state. In the calculation according to Pelton and Bale [28,29] and Ma et al. [17], it involves modified calculations based on Henry’s standard state, taking into account the activity of the solvent. The diagrams also show the activity of the C and Cr in the solution determined by the ThermoCalc program using the TCFE12 database. The activity of carbon in the melt is challenging to determine and poses a problem, as indicated by the results obtained using the ThermoCalc program. Determining activity according to the standard state of 1 wt. % is exceptionally imprecise; activities sharply increase even at low concentrations of both C and Cr. Calculations of activity using other models yield values that are comparable to each other.
Based on Figure 3 and Figure 4, it can be observed that as the solubility of C decreases, the solubility of Cr also decreases. In other words, this implies that during oxidation, in addition to the combustion of carbon, there is also the combustion of chromium. Stainless steels typically contain a low concentration of carbon, necessitating intensive oxidation, leading to significant chromium losses. These chromium losses can be reduced by selecting an appropriate oxidation temperature and configuration, as outlined in the following. Calculations of the equilibrium solubility of chromium and carbon as a function of temperature, the activity of chromium oxide, the partial pressure of carbon monoxide, and the activity of dissolved elements in the stainless steel melt were made to show the influence of individual parameters on the solubility of chromium and carbon in the steel melt. Based on the results of the calculations the process window for managing the production of stainless steel melt with as little chromium loss as possible and greater process and economic efficiency can be determined. In the following calculations, the enthalpy and entropy values from the HSC 8.0 database were used, and the interaction parameters and the dissolution energies of the elements were calculated from the data taken according to Sigworth et al. [22].
Figure 5 shows the equilibrium solubility curves of chromium and carbon between temperatures 1550 and 1800 °C. As the temperature increases, the equilibrium concentration of carbon decreases. From a thermodynamic point of view, the influence of temperature is logical, since at higher temperatures gaseous phases (CO) are more stable, while metal oxides (Cr2O3) are less and less stable and break down into lower oxidation states. A large difference appears in the equilibrium values for the lowest and highest calculated temperature at 15 wt. % Cr, which amounts to 1.21 wt. % C at 1550 °C and 0.28 wt. % C at 1800 °C. Decarburization of steels with an elevated chromium concentration in the EAF is advisable to conduct at an elevated temperature to minimize chromium losses. When melting scrap material, which already contains a high percentage of chromium, precautions should be taken to prevent oxidation.
Figure 6 shows the curves of equilibrium concentrations of C and Cr for different activities of chromium oxide. As the proportion of chromium oxide increases in the slag, its activity increases until it begins to precipitate in solid form and its activity is equal to 1. The equilibrium solubility of chromium in liquid iron is lower at lower activities of chromium oxide, which can be concluded that in the initial stages of melt oxidation, due to the lower the activity of chromium oxide, the more intensive oxidation of chromium takes place. At the smallest calculated activity of chromium oxide, = 0.01, the equilibrium value of carbon at 15 wt. % Cr and 1600 °C is equal to 2.24 wt. % C, on the other hand the concentration of carbon at the activity of chromium oxide = 1 is equal to 0.91 wt. % C.
Figure 7 shows the influence of the partial pressure of carbon monoxide (CO) on the equilibrium solubility of C and Cr. By constantly removing the gaseous product from the system, which is achieved by lowering the pressure, the direction of the reaction is favoured towards the formation of the gaseous phase. In our case, by lowering the partial pressure of CO, the carbon oxidation is accelerated and the solubility of chromium in the liquid iron is increased. In the EAF, it is not possible to influence the gas pressure above the level of the melt, but the procedure is used in subsequent steps when the steel melt is processed in VOD and AOD converters. Figure 7 shows that the equilibrium solubility of chromium increases drastically with decreasing pCO, which is why the oxidation of carbon in the further steps of processing the steel melt is extremely fast and efficient.
From the notation of Wagner’s formalism, it is clear that by mixing alloying elements into the solution, the activity of the selected elements is directly influenced. Silicon has a positive influence on the activity of carbon = 0.08 and a negative influence on the activity of chromium = –0.0043 [22]. Increasing the concentration of silicon in the solution on the one hand increases the activity of carbon, while on the other hand, the activity of chromium is decreased, therefore, increasing the concentration of silicon in the iron solution increases the solubility of chromium in the melt and directs the balance of Equation (3) towards the oxidation of carbon. Figure 8 shows the effect of silicon concentration on the equilibrium solubility of C and Cr in the iron solution. At the maximum calculated concentration of silicon, i.e., 2 wt. % Si, and 15 wt. % Cr at 1600 °C, the equilibrium solubility of carbon is 0.72 wt. % C, at 0 wt. % Si and the equilibrium value of carbon is 0.91 wt. % C at 15 wt. % Cr.
The value of the interaction parameter of oxygen to carbon and oxygen to chromium is comparable and negative in both cases ( = –0.34 and = –0.14 [22]). Therefore, the addition of oxygen does not have much effect on changing the equilibrium solubility of carbon and chromium in the iron solution. Figure 9 shows the calculated equilibrium solubility curves of chromium and oxygen at different oxygen concentrations in the solution.
In addition to the interaction parameters and activity of the elements in the solution, the oxidation reactions of other elements and their Gibbs free energies should also be discussed. Figure 10 shows the curves of Gibbs free energies as a function of temperature for the oxidation of various alloying elements. The diagram in Figure 10 indicates that the oxidation of carbon increases with temperature, as confirmed by the diagram in Figure 5. Decarburization of the stainless steel melt is advisable to carry out at high temperatures. The Gibbs free energies for the oxidation of silicon and aluminium are lower compared to the energy for the oxidation of chromium, meaning that the oxidation of chromium from the melt is reduced in the presence of dissolved Si and Al. Figure 10 shows only the dependence of temperature on the Gibbs free energy of reactions, so the results only indicate which elements have a greater affinity for oxygen. For more accurate results, it is mandatory to take into account the activities of the dissolved elements in the solution.
Based on the presented calculations, we can drag the guidelines for more efficient production of melting steels with an elevated chromium concentration. In the initial phase, at low temperatures and low activities of chromium oxide in the slag, there is a high probability of chromium oxidation. Oxidation can be reduced by protecting the scrap with the addition of carbon (anthracite), silicon, and aluminium, and it is necessary to add an appropriate amount of CaO and MgO to obtain slag with suitable properties, namely slag basicity, viscosity, and reactivity with refractory materials [2,3,10,30]. Secondly, it is necessary to limit the access of oxygen, so it is recommended that melting does not take place with the help of natural gas burners. Large losses of chromium in the initial phase of melting can also be avoided by carefully stocking the baskets, if possible, by stocking the initial baskets of the scrap with the lowest possible concentration of chromium. As can be seen from Figure 5, as the temperature of the melt increases, the solubility of chromium increases, so it makes sense that the decarburization of the steel melt takes place at temperatures as high as possible (normally higher than 1650 °C), and the carbon concentration at the end of decarburization should not be too low, because the oxidation of chromium also takes place in parallel. Decarburization is more effective at a lower partial pressure of CO, which can only be ensured in VOD and AOD aggregates. The kinetics of the decarburization of the steel melt can be dynamically controlled by off-gas analysis. Echterhof et al. [30] presented a method in which they estimated the kinetics of melt decarbonization based on the proportion of CO2 in off-gases. According to the authors, in the first stage, the proportion of CO2 in the off-gases increases with the amount of injected oxygen, which can be connected to the oxidation of silicon from the melt and the increasing trend of carbon oxidation. In the second stage, intensive decarbonization takes place, and the amount of CO2 in off-gases reaches a plateau. The authors associate the drop of CO2 fraction in the off-gases with the reduced kinetics of decarburization and increased activity of chromium in stainless steel melt, and therefore, the beginning of more intense chromium oxidation, the oxygen injection should be stopped at this point. Straightforward and practical methods were implemented to reduce the chromium losses in steel plants. Additionally, using decarburization control during EAF melting, the oxygen consumption and production time were reduced.
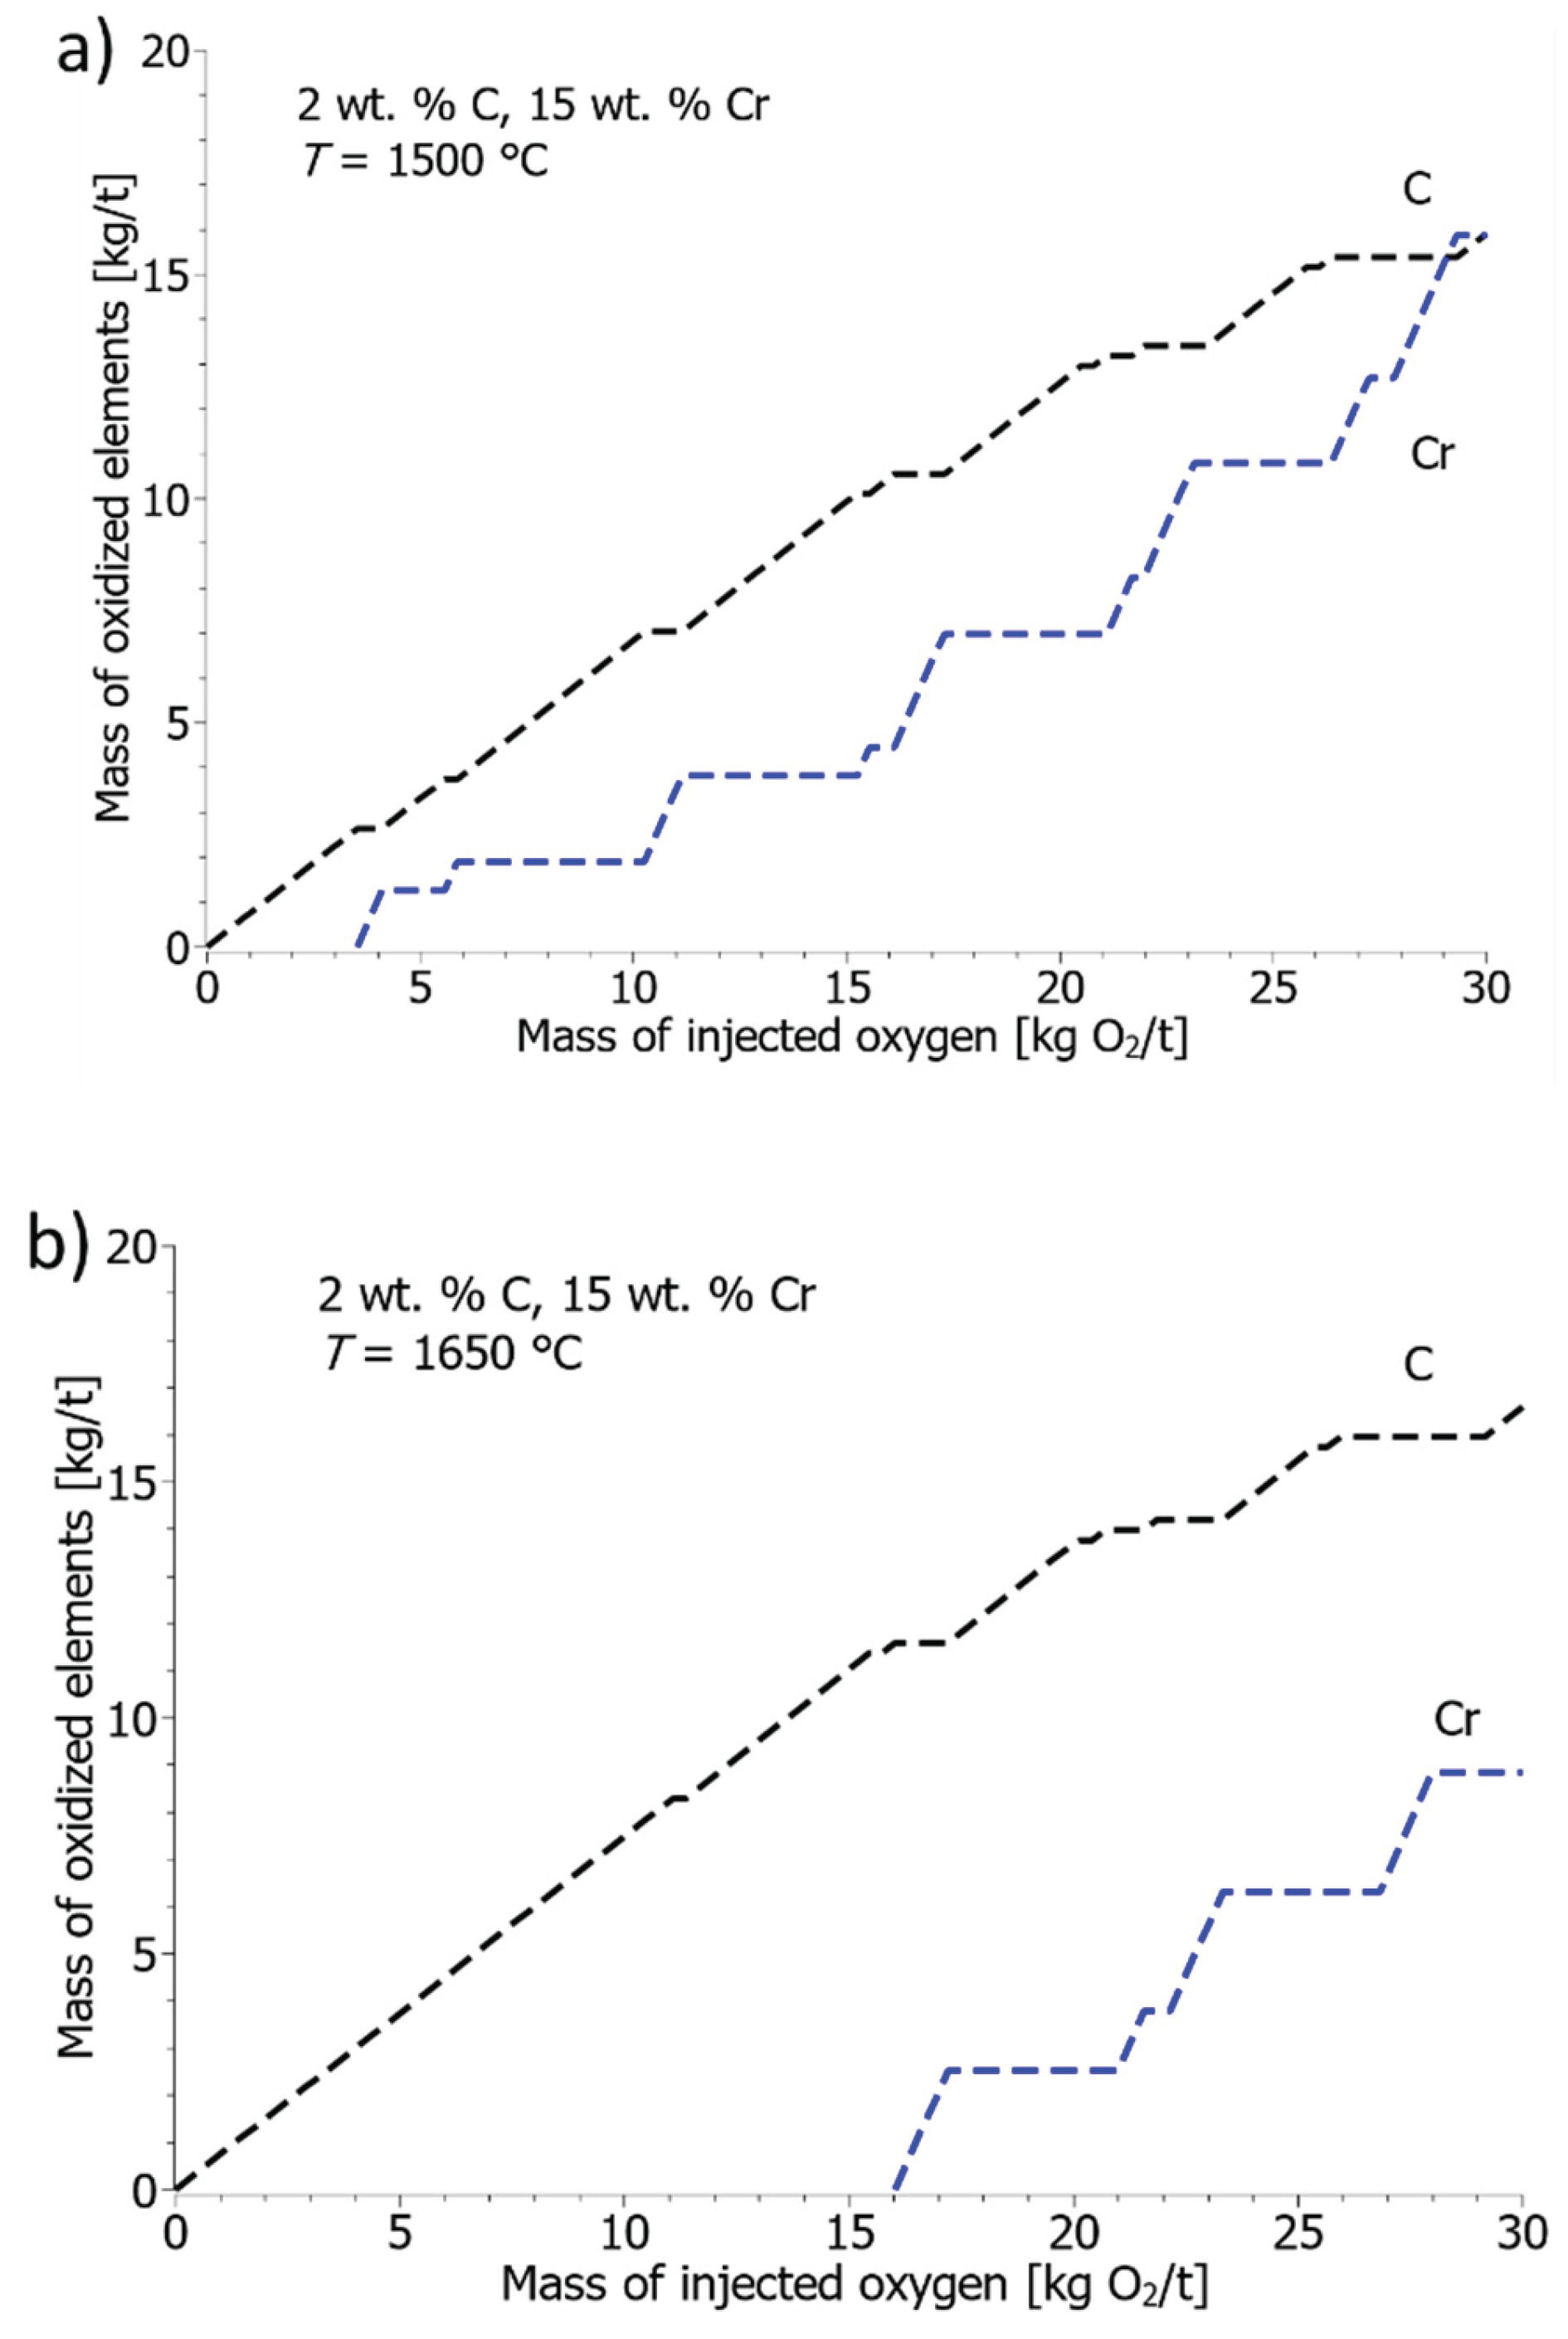
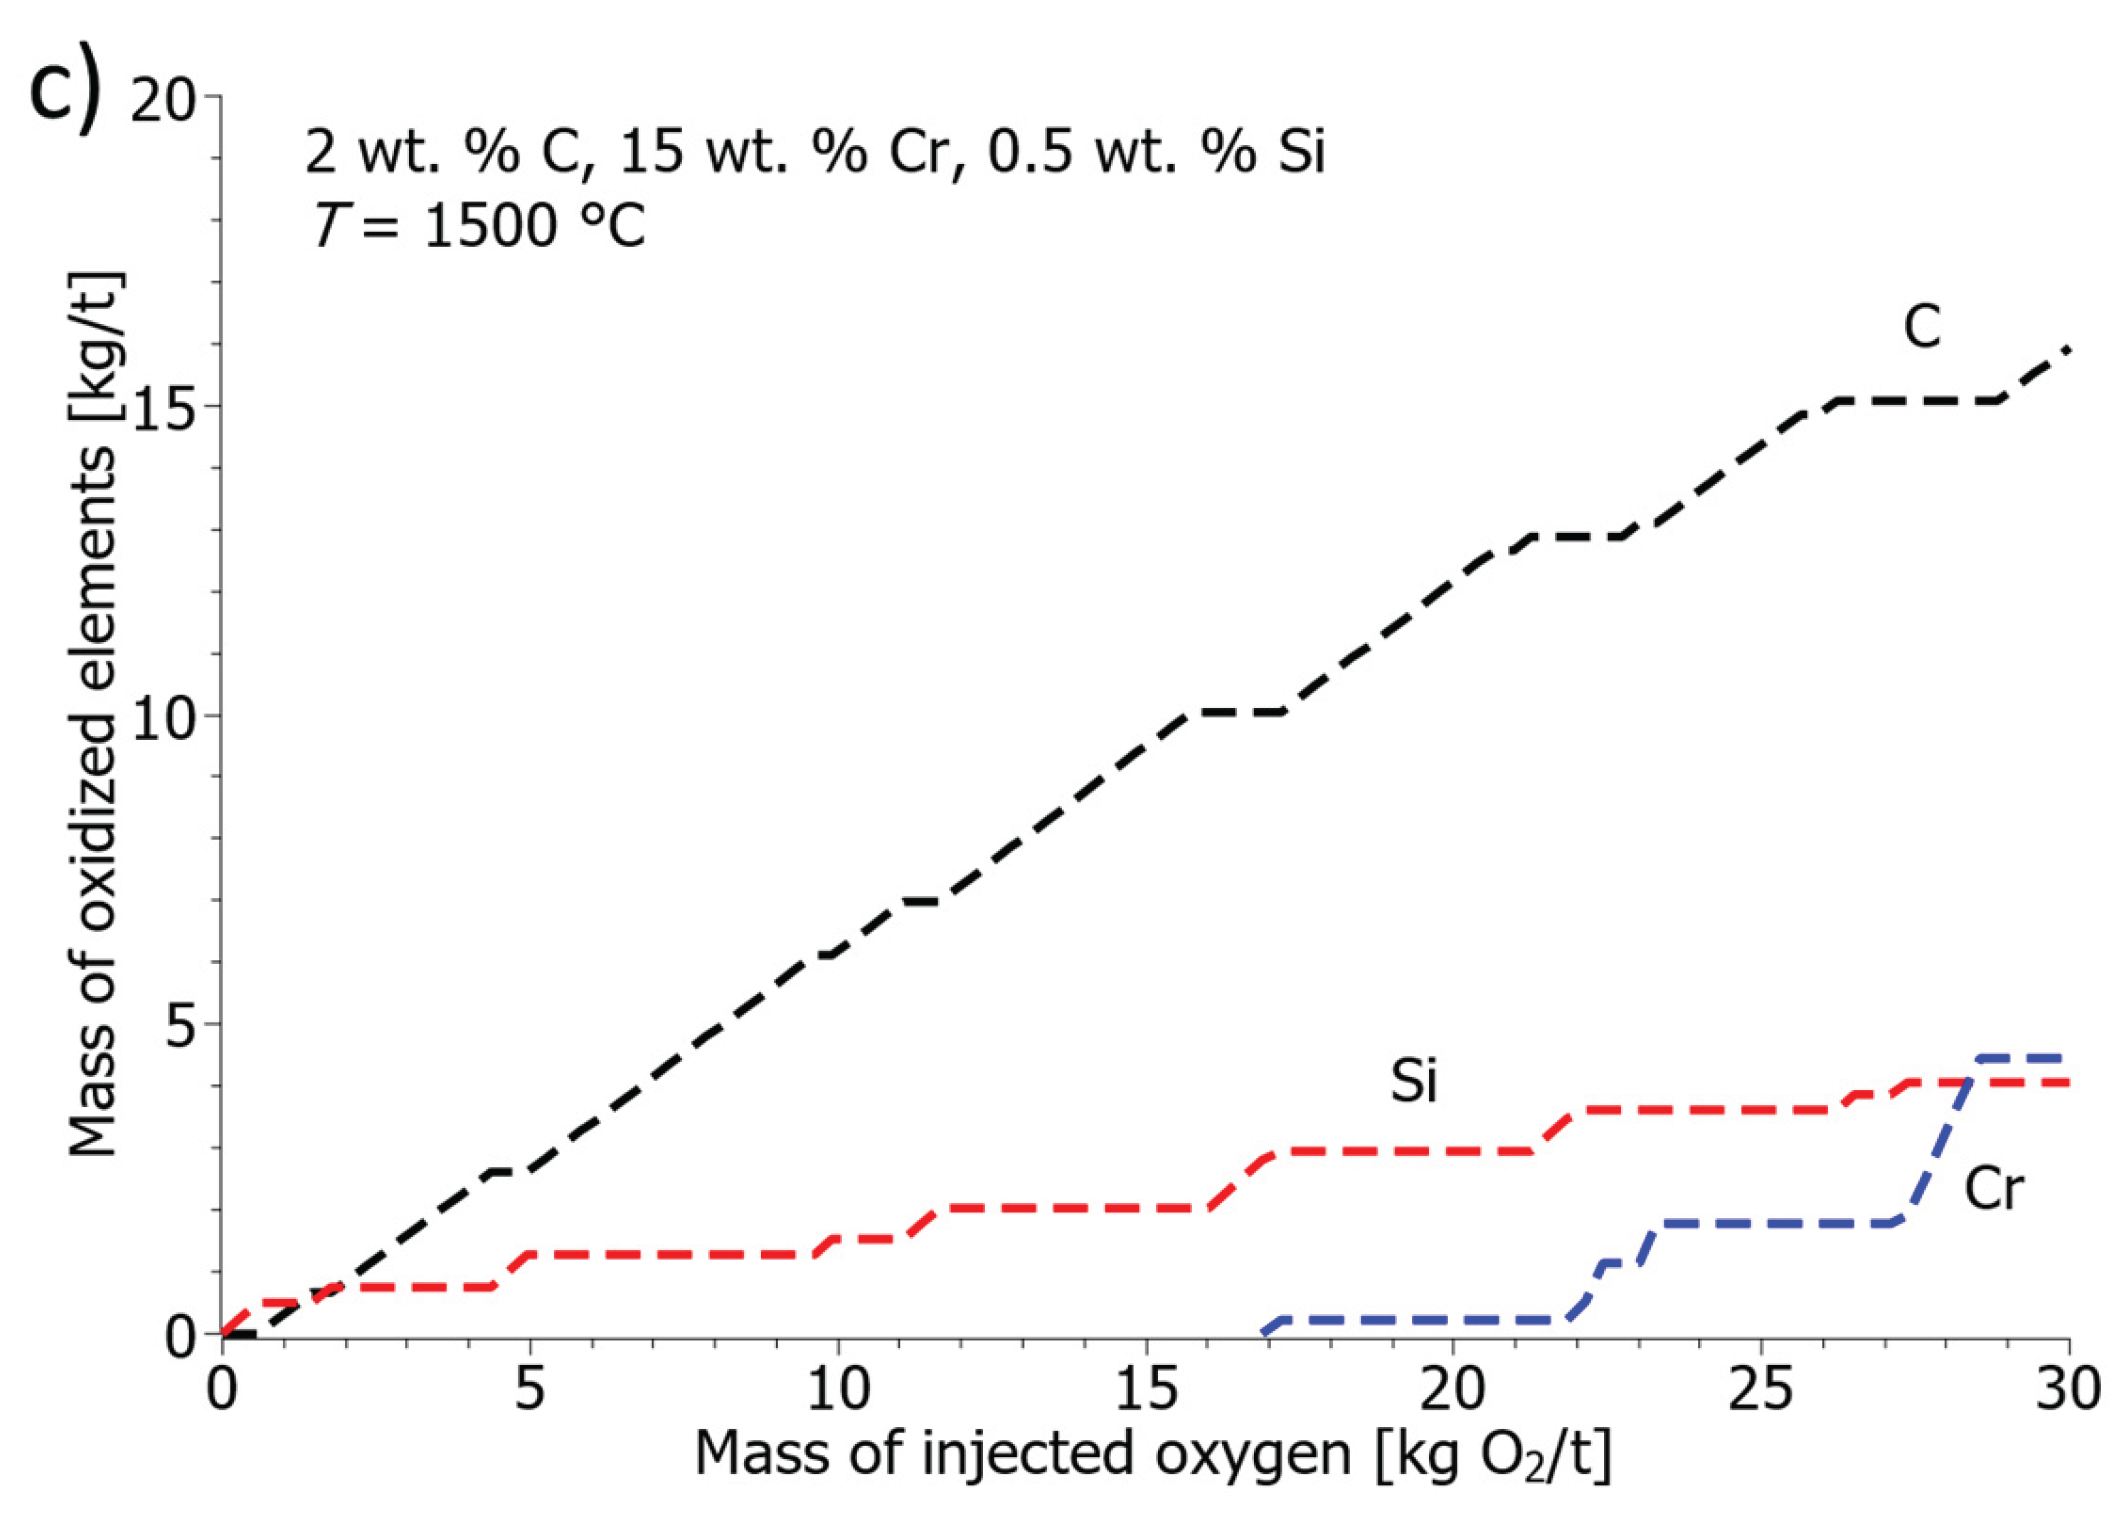
Based on the thermodynamic data from the HSC 8.0 database and the parameters listed in Sigworth et al. [22], a model was created to calculate the decarburization of the stainless steel melt, also partially presented in our previous work [31]. The model defines the oxidation of elements based on the amount of oxygen injected into the solution and the Gibbs free energies of dissolved elements. Figure 11a–c show the results of the amount of oxidized C, Cr, and Si during the oxidation of the solution with 15 wt. % Cr and 2 wt. % C. Figure 11a shows the amount of oxidized carbon and chromium for the solution at the oxidation start temperature of 1500 °C. In the first stage, oxidation of carbon takes place, and above 3.5 kg of injected oxygen per ton of steel, oxidation of chromium also occurs. At 20 kg of injected oxygen per ton of steel, 7 kg of chromium, and 13 kg of carbon per ton of steel oxidized. Figure 11b shows the amount of chromium and carbon oxidized at the oxidation start temperature of 1650 °C. Due to the higher solubility of chromium, as a consequence of the higher temperature of the system, carbon oxidizes for a longer time, and oxidation of chromium occurs at over 16 kg of injected oxygen per ton of steel. At 20 kg of injected oxygen per ton of steel, it oxidizes 2.5 kg of chromium and 13.5 kg of carbon per ton of steel. In Figure 11c, the steel melt at 1500 °C contained 0.5 wt. % Si. The results show that the addition of silicon protects the melt well from chromium oxidation, despite the low temperature, chromium oxidation occurs above 17 kg of injected oxygen per ton of steel. In this case, silicon oxidation takes place in the first stage, followed by the second, more intense phase of carbon oxidation. Above 17 kg of injected oxygen per ton of steel, chromium also oxidizes. At 20 kg of injected oxygen per ton of steel, it oxidizes 0.3 kg of chromium, 12 kg of carbon, and 3 kg of silicon. The model results approximate the thermodynamic oxidation calculations of Echterhof et al. [30]. The calculated model confirms that a high melt temperature is necessary for effective decarburization with low chromium losses, and secondly, the model shows that it is possible to protect chromium losses at low temperatures by adding silicon.
Slag also plays an important role in reducing chromium losses in the production of stainless steels. In general, slag protects the melt from oxidation, loss of heat and material, and additionally, slag enables better efficiency of electricity and increases the productivity of the process. With the presence of foaming slag, the productivity and energy efficiency of the process increase even more. Due to the formation of chromium oxides, the formation of foaming slag in the production of stainless steels can be difficult. At low concentrations of chromium oxides (up to 8 wt. %), there are no significant differences, above 13 wt. % of chromium oxides, the viscosity of the slag decreases at the expense of an increase in the concentration of solid particles. With an increased concentration, the foaming index decreases and makes the formation of foaming slag more difficult. Another obstacle to the formation of foaming slag is the low concentration of FeO in the slag, as a result of which the kinetics of the formation of gaseous CO is low, and the amount or height of the foaming slag is correspondingly lower [2,18,32,33,34].
The decarburization phase of the melt is usually followed by the reduction of the slag with silicon and aluminium, with the aim of reducing the chromium oxides in the slag. Slag reduction is effective in the case of intensive mixing of melt and slag, which usually occurs during tapping both, steel and slag into the ladle [9,10,11,12,13,16].
3. Conclusions
When reviewing literature sources, there were discrepancies in the reporting of Gibbs free energies, interaction parameters, and other data in the Fe-Cr-C system. Deviations occur due to different interpretations of thermodynamic reactions and states of elements in the mentioned system. The data collected in the work were used to calculate the equilibrium solubilities of chromium and carbon in the system. Based on thermodynamic calculations, guidelines were determined for the management of the stainless steel melting process with the aim of reducing chromium losses. Based on the presented results, the following conclusions can be drawn:
In literature sources, there are discrepancies in the citation of Gibbs free energy and interaction parameters, which is the result of different interpretations of thermodynamic reactions and states of elements. The parameters from the database of the HSC 8.0 program and the parameters written in the work of Sigwortgh et al. [22] were used in the calculations.
In the production of stainless steel, the largest losses of chromium occur in the EAF. Losses at low temperatures (during the melting process), where the activity of chromium oxides in the slag is low, can be reduced by protecting the scrap with the addition of C, Si, and Al. In addition, chromium oxidation can be prevented by limiting oxygen intake, most of the time the problem is due to additional heating with natural gas and an excess of oxygen content. The losses can also be influenced by the correct distribution of the chromium in the scrap, choosing the option where the first basket with a minimum amount of chromium is placed in the EAF.
Chromium losses at high temperatures are the result of decarburization of the melt and can be limited by a suitably high oxidation start temperature of the melt and by limiting the degree of decarburization according to the chromium content in the melt. With the dynamic control of off-gases, it is possible to accurately assess the degree of carbon oxidation and predict the required amount of oxygen injected with minimal chromium losses.
In addition, the reduction of chromium losses can be influenced by the reduction of slag with Si and Al after decarburization
Author Contributions
Conceptualization, A.B. and J.B.; methodology, A.B.; software, A.B. and J.B.; validation, J.B.; investigation, A.B. and J.B.; resources, J.B.; data curation, A.B. and J.B.; writing—original draft preparation, A.B.; writing—review and editing, J.B.; visualization, A.B. and J.B.; supervision, J.B.; All authors have read and agreed to the published version of the manuscript.
Funding
This research was funded by ARIS research program P2-0050.
Data Availability Statement
Not applicable.
Conflicts of Interest
The authors declare no conflicts of interest.
References
- Wang, H. Investigations on the Oxidation of Iron-Chromium and Iron-Vanadium Molten Alloys. Doctoral Thesis, Royal Institute of Technology - KTH, 2010.
- Heikkinen, E.-P.; Fabritius, T. Modelling of the Refining Processes in the Production of Ferrochrome and Stainless Steel. In Recent Researches in Metallurgical Engineering - From Extraction to Forming; 2012; pp. 65–88.
- Kirschen, M.; Jung, I.H.; Hackl, G. Phase Equilibrium Diagram for Electric Arc Furnace Slag Optimization in High Alloyed Chromium Stainless Steelmaking. Metals (Basel) 2020, 10, 826. [Google Scholar] [CrossRef]
- Kho, T.S.; Swinbourne, D.R.; Blanpain, B.; Arnout, S.; Langberg, D. Understanding Stainless Steelmaking through Computational Thermodynamics Part 1: Electric Arc Furnace Melting. Transactions of the Institutions of Mining and Metallurgy, Section C: Mineral Processing and Extractive Metallurgy 2010, 119, 1–8. [Google Scholar] [CrossRef]
- Ahindra Ghosh; Chatterjee, A. Ironmaking and Steelmaking: Theory and Practice; PHI Learning Private Limited: New Delhi, 2008; ISBN 9788120332898. [Google Scholar]
- Arh, B.; Tehovnik, F. The Oxidation and Reduction of Chromium of Stainless Steels in an Eletric Arc Furnace. Materiali in Tehnologije 2007, 41, 203–211. [Google Scholar]
- Swinbourne, D.R.; Kho, T.S.; Langberg, D.; Blanpain, B.; Arnout, S. Understanding Stainless Steelmaking through Computational Thermodynamics Part 2 - VOD Converting. Transactions of the Institutions of Mining and Metallurgy, Section C: Mineral Processing and Extractive Metallurgy 2010, 119, 107–115. [Google Scholar] [CrossRef]
- Swinbourne, D.R.; Kho, T.S.; Blanpain, B.; Arnout, S.; Langberg, D.E. Understanding Stainless Steelmaking through Computational Thermodynamics: Part 3 - AOD Converting. Transactions of the Institutions of Mining and Metallurgy, Section C: Mineral Processing and Extractive Metallurgy 2012, 121, 23–31. [Google Scholar] [CrossRef]
- Sano, N. Reduction of Chromium Oxide in Stainless Steel Slags. In Proceedings of the 10th International Ferroalloys Congress; 2004; pp. 670–677. [Google Scholar]
- Guo, M.; Durinck, D.; Jones, P.T.; Heylen, G.; Hendrickx, R.; Baeten, R.; Blanpain, B.; Wollants, P. EAF Stainless Steel Refining - Part I: Observational Study on Chromium Recovery in an Eccentric Bottom Tapping Furnace and a Spout Tapping Furnace. Steel Res Int 2007, 78, 117–124. [Google Scholar] [CrossRef]
- Burja, J.; Tehovnik, F.; Vode, F.; Arh, B. Microstructural Characterisation of Chromium Slags. Metalurgija 2015, 54, 379–382. [Google Scholar]
- Björkvall, J.; Ångström, S.; Kallin, L. Reduction of Chromium Oxide Containing Slags Using CaC2. In Proceedings of the VII International Conference on Molten Slags Fluxes and Salts; 2004; pp. 663–670. [Google Scholar]
- Shibata, E.; Egawa, S.; Nakamura, T. Reduction Behavior of Chromium Oxide in Molten Slag Using Aluminum, Ferrosilicon and Graphite. ISIJ International 2002, 42, 609–613. [Google Scholar] [CrossRef]
- Heikkinen, E.-P.; Ikäheimonen, T.; Mattila, O.; Fabritius, T. A Thermodynamic Study on the Oxidation of Silicon, Carbon and Chromium in the Ferrochrome Converter. In Proceedings of the Proceedings of the 12th International Ferroalloys Congress: Sustainable Future; 2010; pp. 229–237. [Google Scholar]
- Wang, H.; Nzott, M.M.; Teng, L.; Seetharaman, S. Decarburization of Ferrochrome and High Alloy Steels with Optimized Gas and Slag Phases towards Improved Cr Retention. Journal of Mining and Metallurgy, Section B: Metallurgy 2013, 49, 175–181. [Google Scholar] [CrossRef]
- Carboni, M.C.; Espinosa, D.C.R.; Tenório, J.A.S. Reduction of Chromium from Al2O3-CaO-SiO 2-CrOx Slags by Carbon Dissolved in Liquid Iron. ISIJ International 2011, 51, 523–529. [Google Scholar] [CrossRef]
- Ma, Z.; Janke, D. Thermodynamic Assessment to Chromium Oxidation in the Production of Stainless Steel. Steel Research 2003, 74, 99–103. [Google Scholar] [CrossRef]
- Pretorius, E.B.; Nunnington, R.C. Stainless Steel Slag Fundamentals – From Furnace to Tundish. Ironmaking and Steelmaking 2002, 29, 133–139. [Google Scholar] [CrossRef]
- Seetharaman, S. Treatise on Process Metallurgy, Volume 1: Process Fundamentals, 1 st.; Seetharaman, S., McLean, A., Guthrie, R., Sridhar, S., Eds.; Elsevier: Oxford, 2013; ISBN 9780080969862. [Google Scholar]
- Barin, I. Therrnochernical Data of Pure Substances; Third edit.; Weinheim, 1995; ISBN 3527287450.
- Mihara, R.; Gao, X.; Kaneko, S.; Kim, S.; Ueda, S.; Shibata, H.; Seok, M.O.; Kitamura, S. ya Observation of Oxide Formation for Molten Fe-Cr-C Alloy at a High Carbon Region by Oxygen Top Blowing. Metallurgical and Materials Transactions B: Process Metallurgy and Materials Processing Science 2016, 47, 1035–1051. [Google Scholar] [CrossRef]
- Sigworth; Elliott, J.F. Sigworth; Elliott, J.F. The Thermodynamics of Liquid Dilute Iron Alloys.
- Wagner, C. Thermodynamics of Alloys; Addison-Wesley Press: Massachusetts, 1962. [Google Scholar]
- Lupis, C.H.P. Generalized Interaction Coefficients. Doctoral Thesis, Massachusetts Institute of Technology, 1965.
- The Japan Society for the Promotion of Science. The 19th Committee on Steelmaking Steelmaking Data Sourcebook. Gordon and Breach Science Publisher: New York, 1988. [Google Scholar]
- Materia, T. Production of Stainless Steel: Part One Available online: https://www.totalmateria.com/page.aspx?ID=CheckArticle&site=kts&NM=215.
- Lupis, C.H.P.; Elliott, J.F. Generalized Interaction Coefficients. Part I: Definitions. Acta Metallurgica 1966, 14, 529–538. [Google Scholar] [CrossRef]
- Bale, C.W.; Pelton, A.D. The Unified Interaction Parameter Formalism” Thermodynamic Consistency and Applications. Metallurgical Transactions A 1990, 21, 1997–2002. [Google Scholar] [CrossRef]
- Pelton, A.D.; Bale, C.W. A Modified Interaction Parameter Formalism for Non-Dilute Solutions. Metallurgical Transactions A 1986, 17, 1211–1215. [Google Scholar] [CrossRef]
- Echterhof, T.; Risonarta, V.Y.; Beiler, C.; Lenz, S.; Jung, H.P.; Pfeifer, H. Decarburization Control during Stainless Steel Making in an EAF. In Proceedings of the SteelSim 2011, 4th International Conference on Modelling and Simulation of Metallurgical Processes in Steelmaking; 2011; pp. 1–8. [Google Scholar]
- Bajželj, A.; Burja, J. Optimization of partial stainless steel melt oxidation in the EAF. In Proceedings of the METAL 2024, 33rd International Conference on Metallurgy and Materials, Brno, Czech Republic, 22–24 May 2024; pp. 19–24. [Google Scholar] [CrossRef]
- Ito, K.; Fruehan, R.J. Slag Foaming in Electric Furnace Steelmaking. Transactions ISS, Iron Steelmaker 1989, 16, 55–60. [Google Scholar]
- Corbari, R.; Matsuura, H.; Halder, S.; Walker, M.; Fruehan, R.J. Foaming and the Rate of the Carbon-Iron Oxide Reaction in Slag. Metallurgical and Materials Transactions B: Process Metallurgy and Materials Processing Science 2009, 40, 940–948. [Google Scholar] [CrossRef]
- Vidacak, B.; Arvanitidis, I.; Jönsson, P.G.; Sjöberg, P. Observation on Foaming of EAF Slags in the Production of Stainless Steel. Scandinavian Journal of Metallurgy 2002, 31, 321–327. [Google Scholar] [CrossRef]
Figure 1.
Equilibrium solubility of Cr and C in liquid iron considering different Gibbs free energies.
Figure 1.
Equilibrium solubility of Cr and C in liquid iron considering different Gibbs free energies.
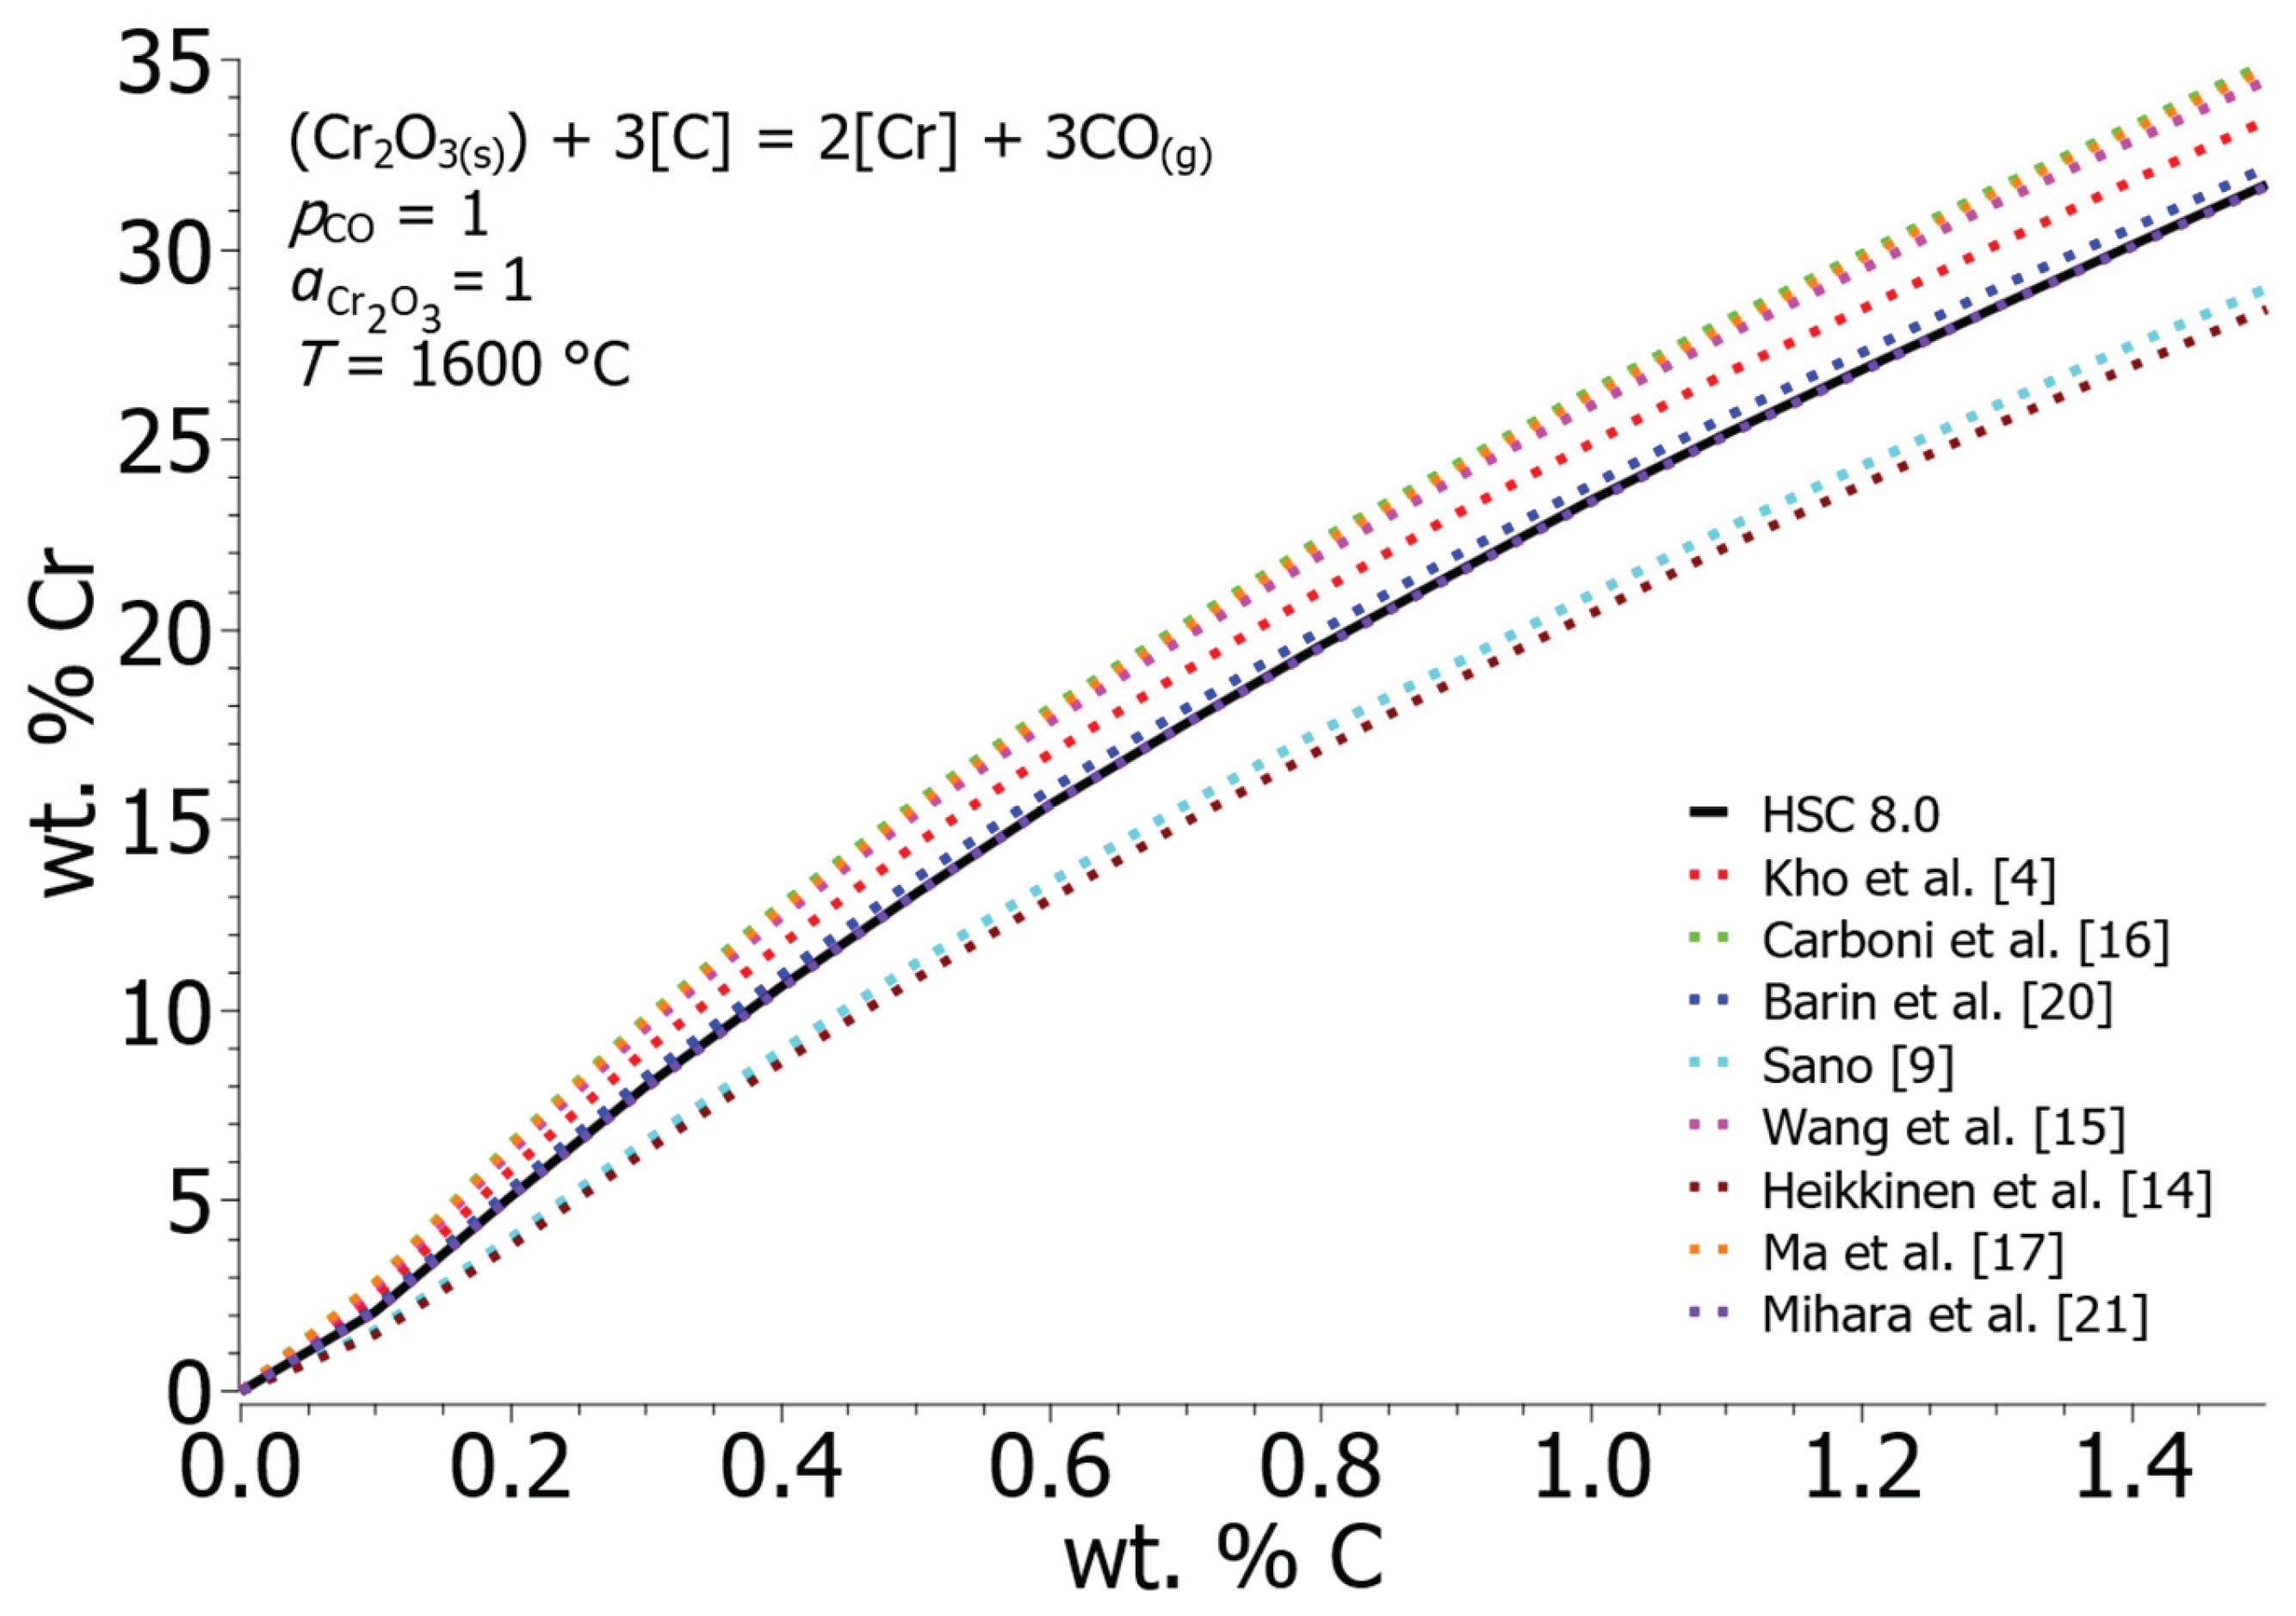
Figure 2.
Equilibrium solubility of Cr and C in liquid iron considering different interaction parameters.
Figure 2.
Equilibrium solubility of Cr and C in liquid iron considering different interaction parameters.
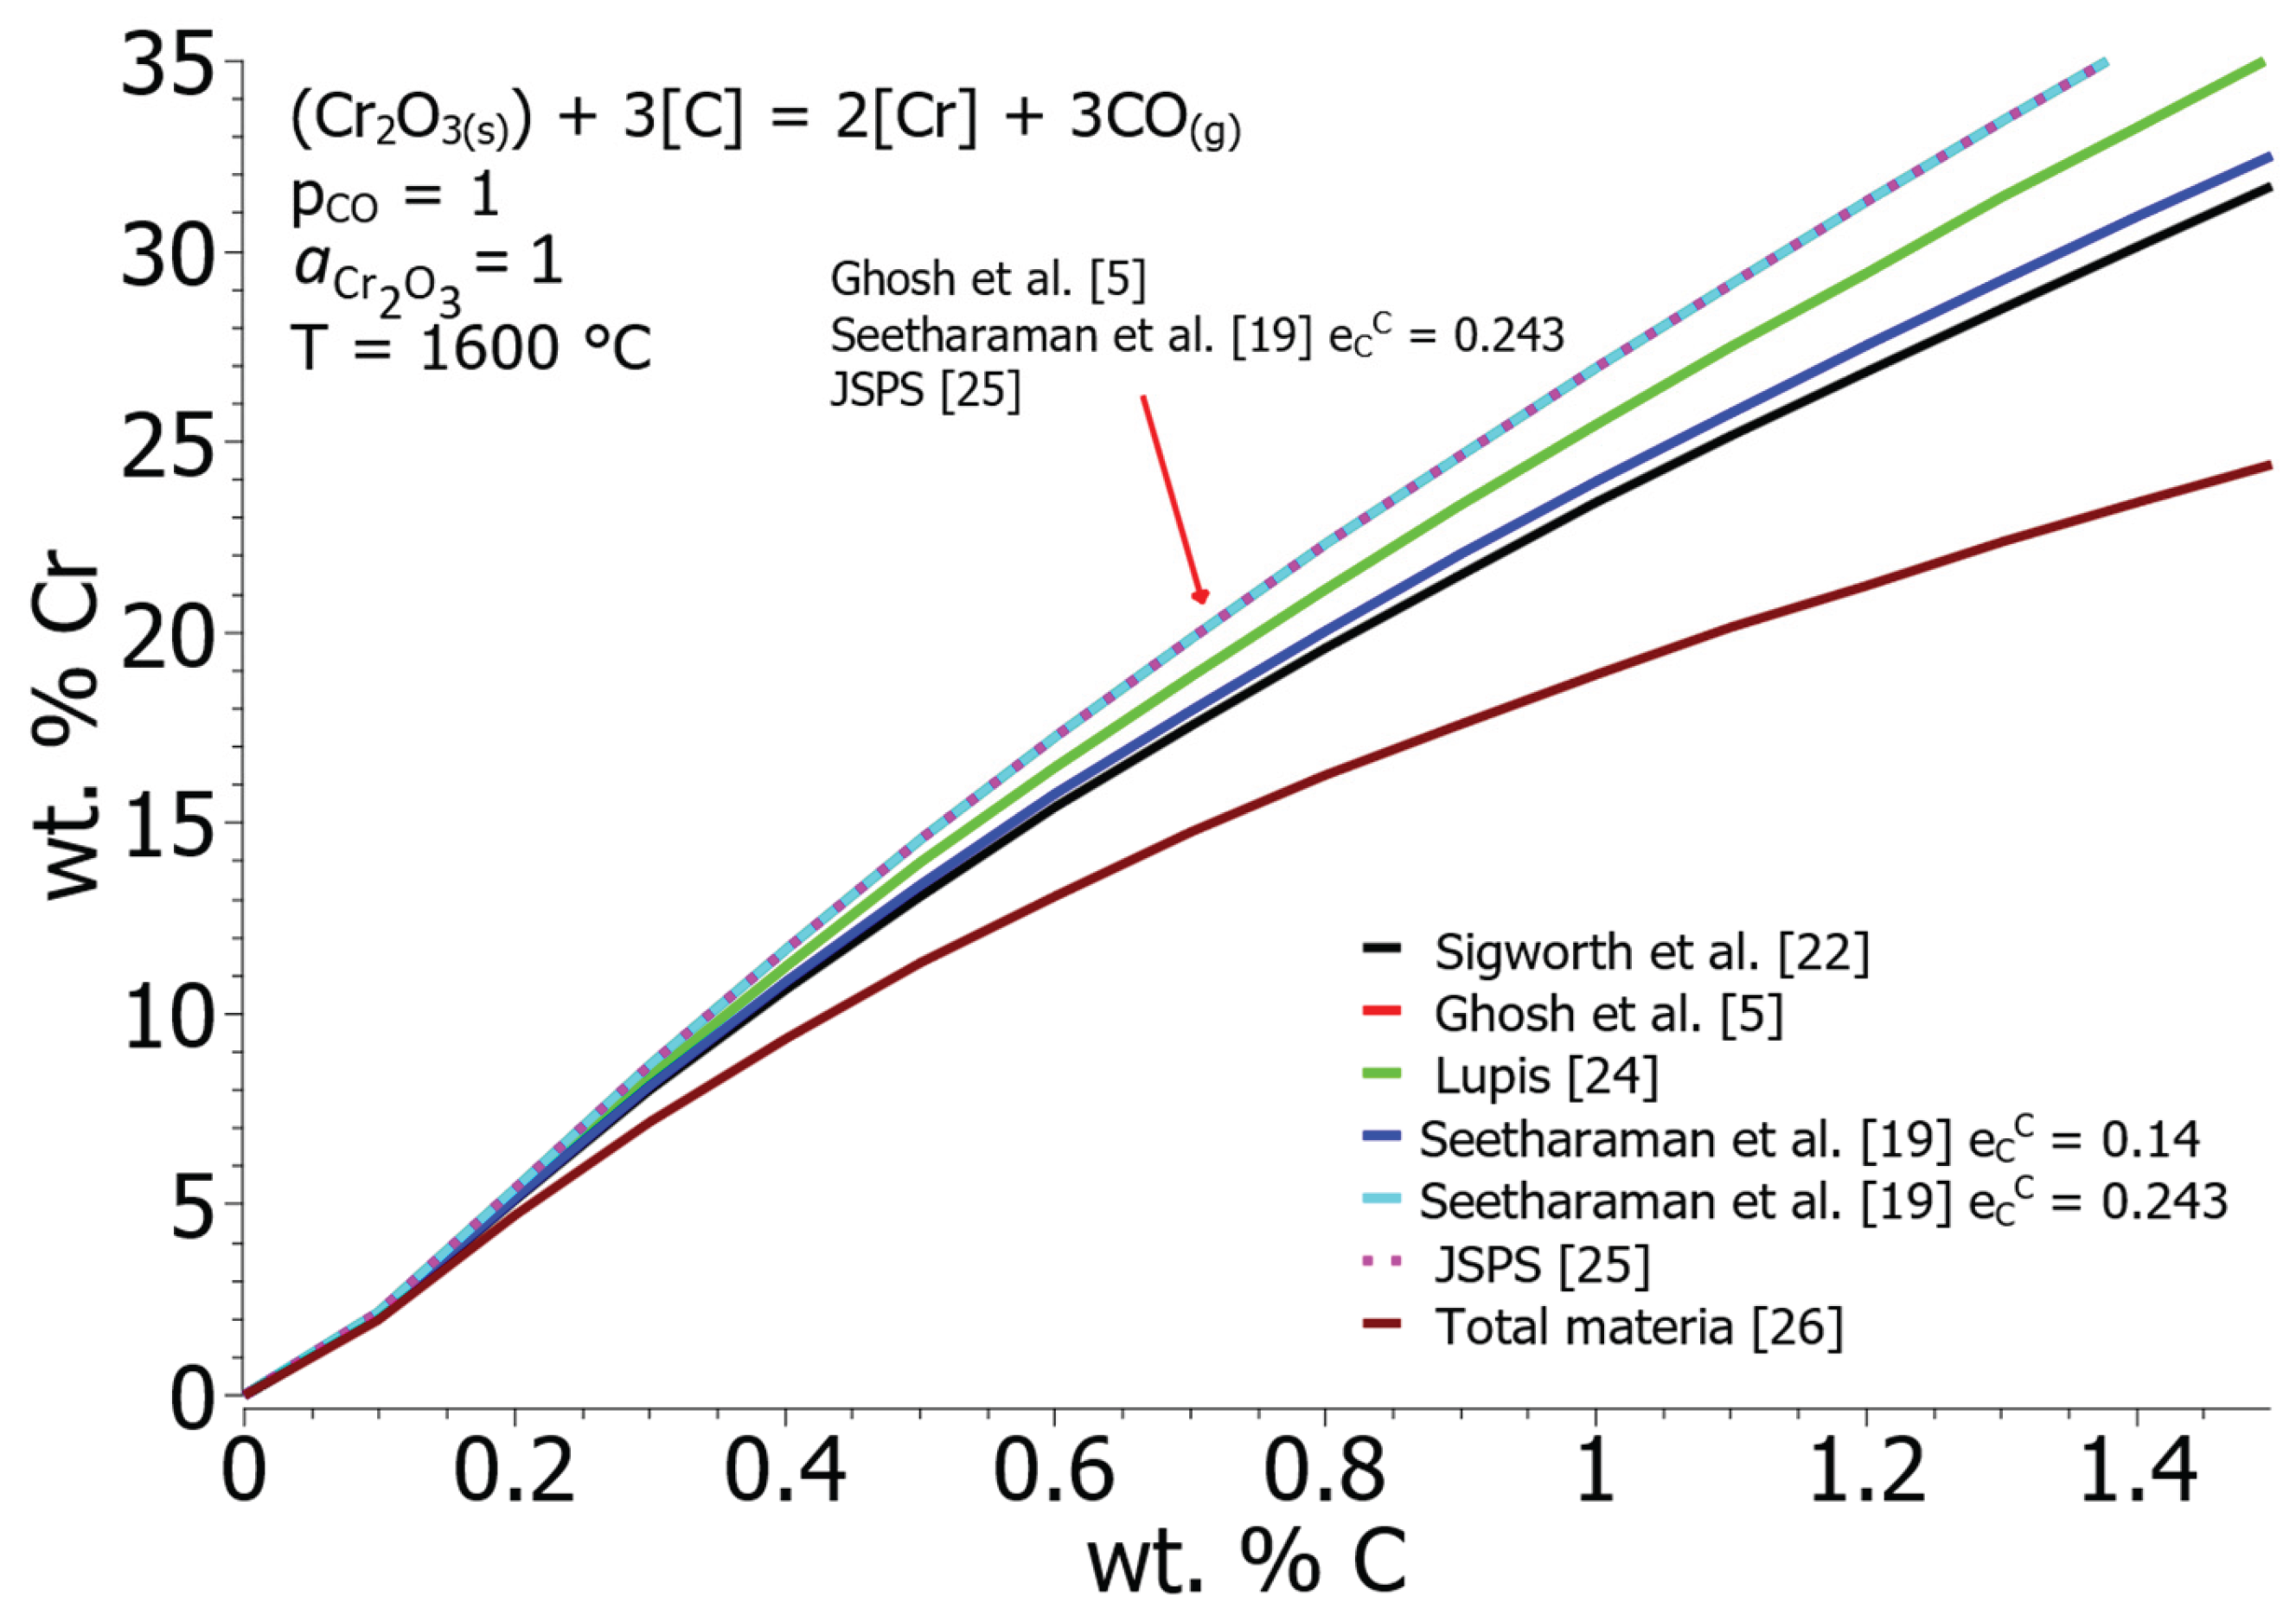
Figure 3.
Equilibrium solubility of Cr and C in liquid iron calculated according to different standard states.
Figure 3.
Equilibrium solubility of Cr and C in liquid iron calculated according to different standard states.
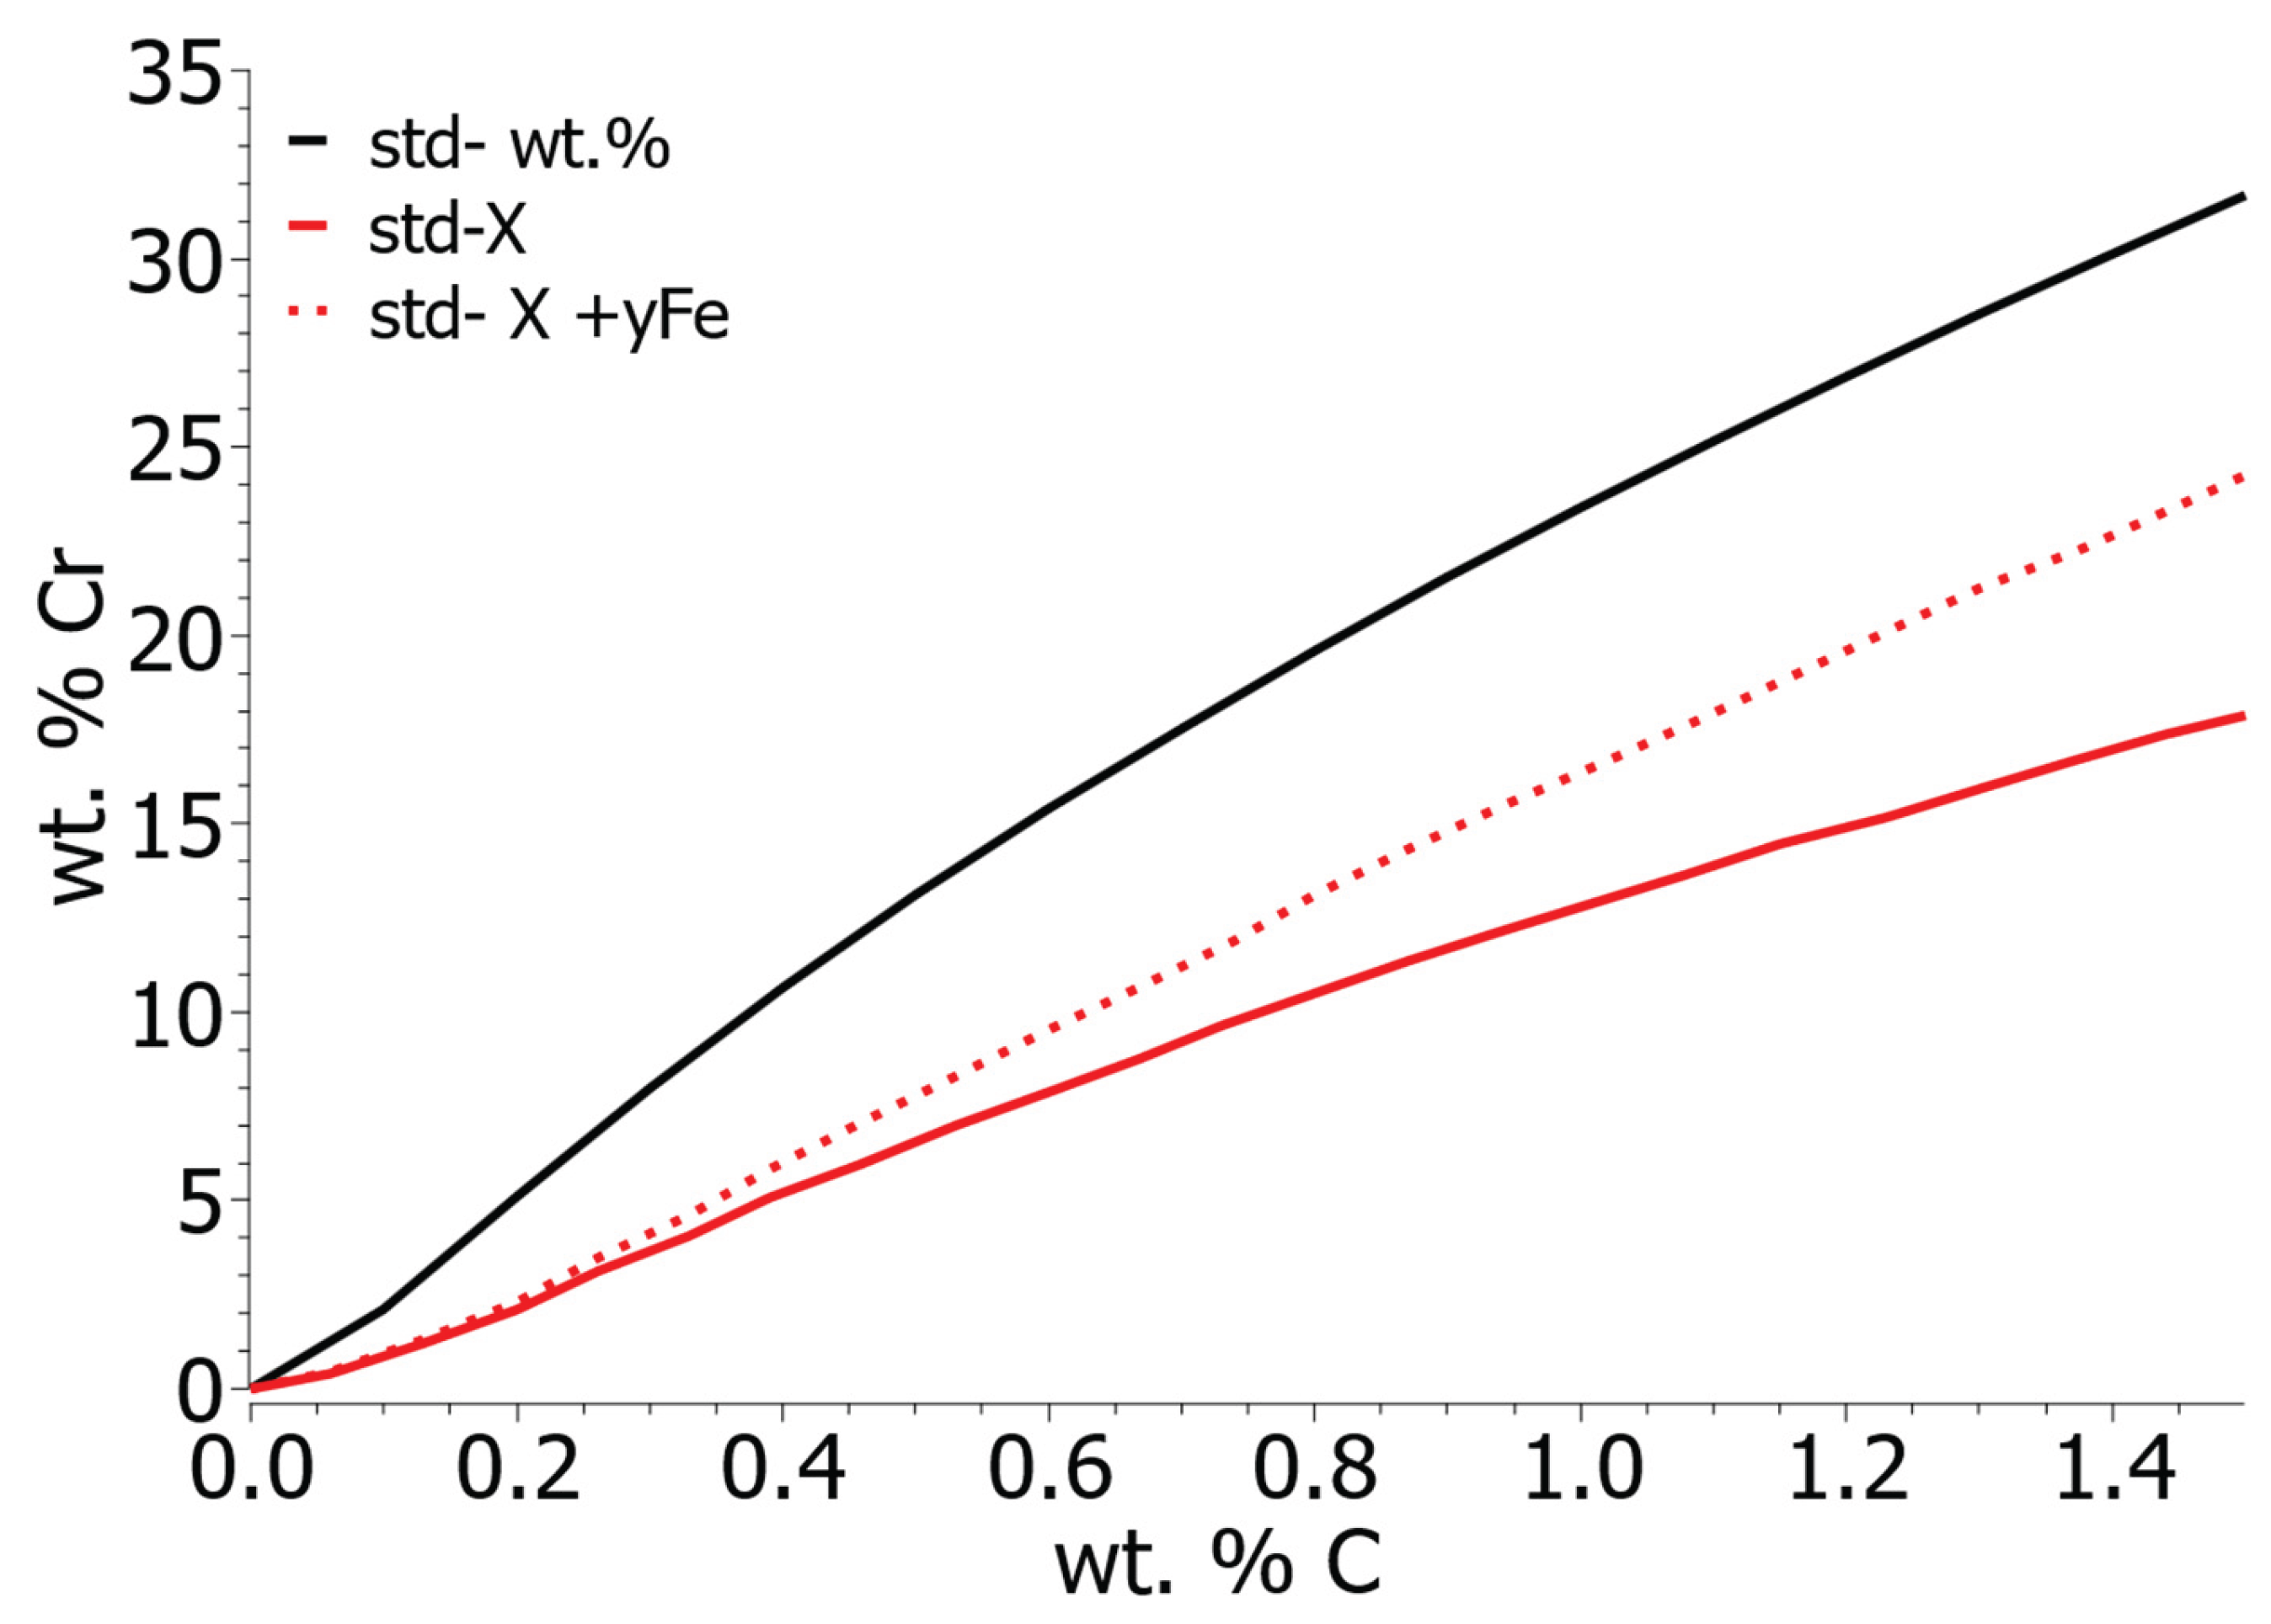
Figure 4.
a) Activity of carbon in iron solution with 15 wt. % Cr, b) activity of chromium in iron solution with 1 wt. % C.
Figure 4.
a) Activity of carbon in iron solution with 15 wt. % Cr, b) activity of chromium in iron solution with 1 wt. % C.
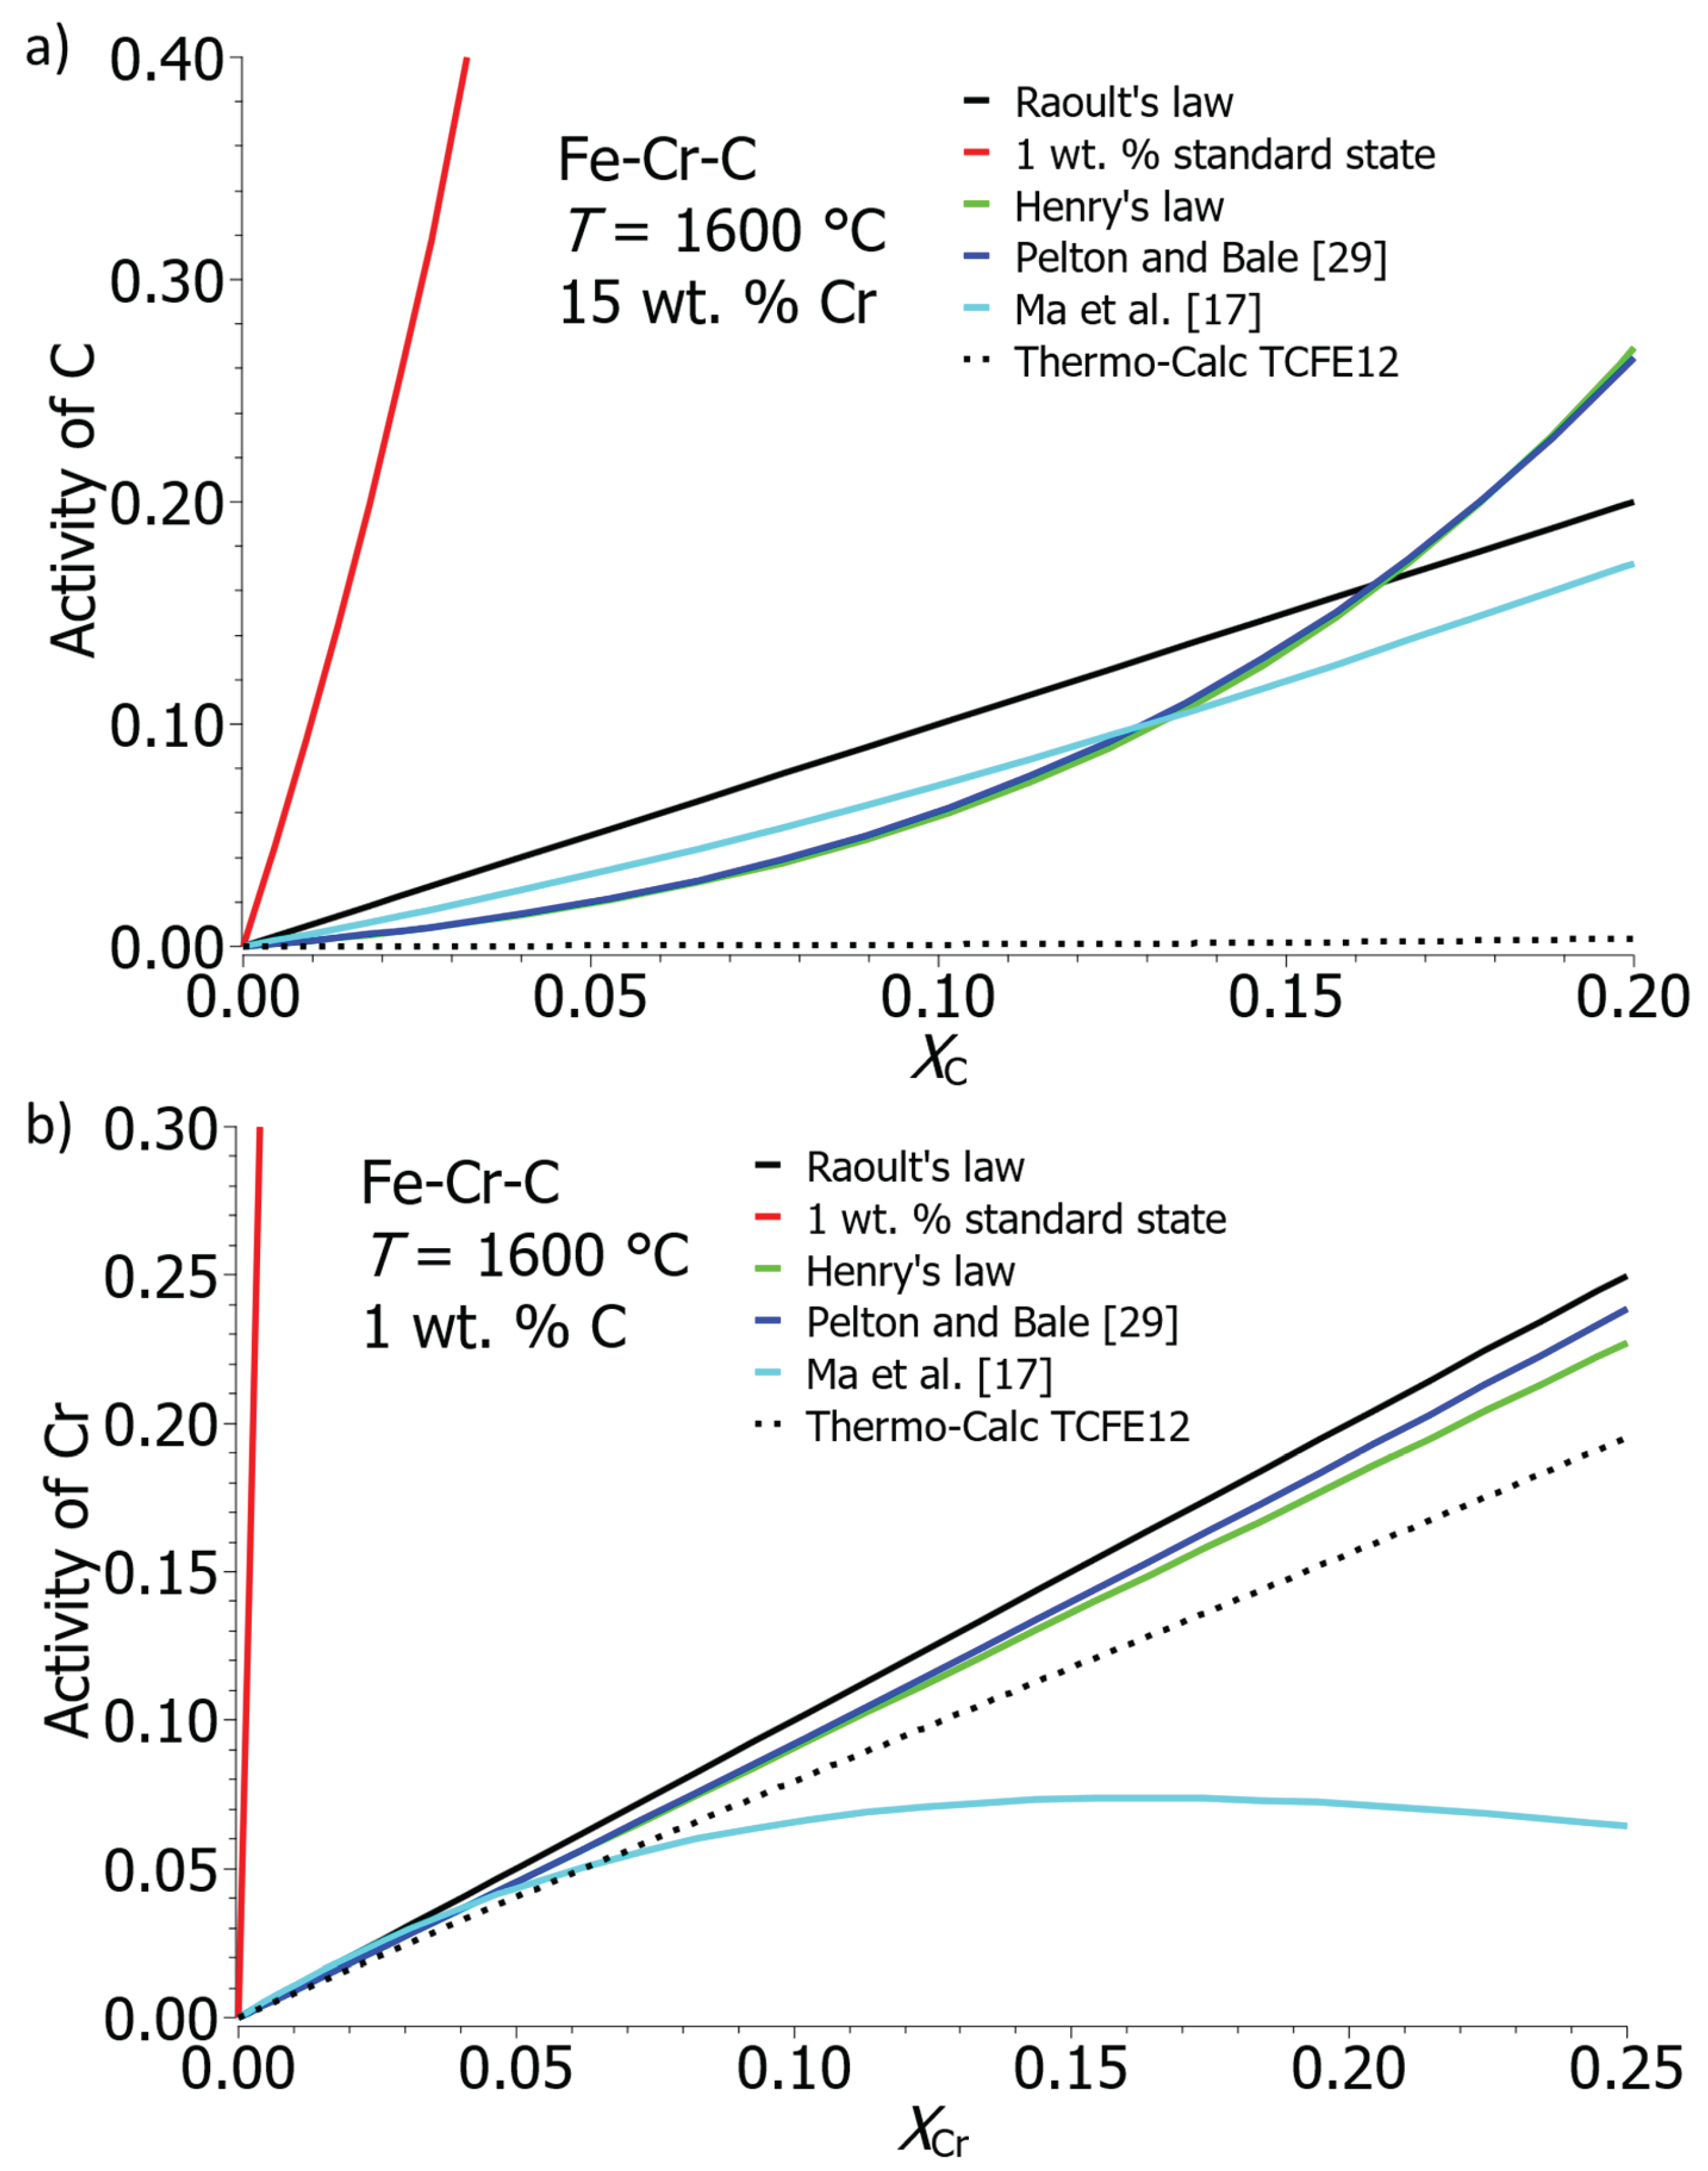
Figure 5.
Equilibrium solubility of Cr and C in liquid iron between 1550 and 1800 °C.
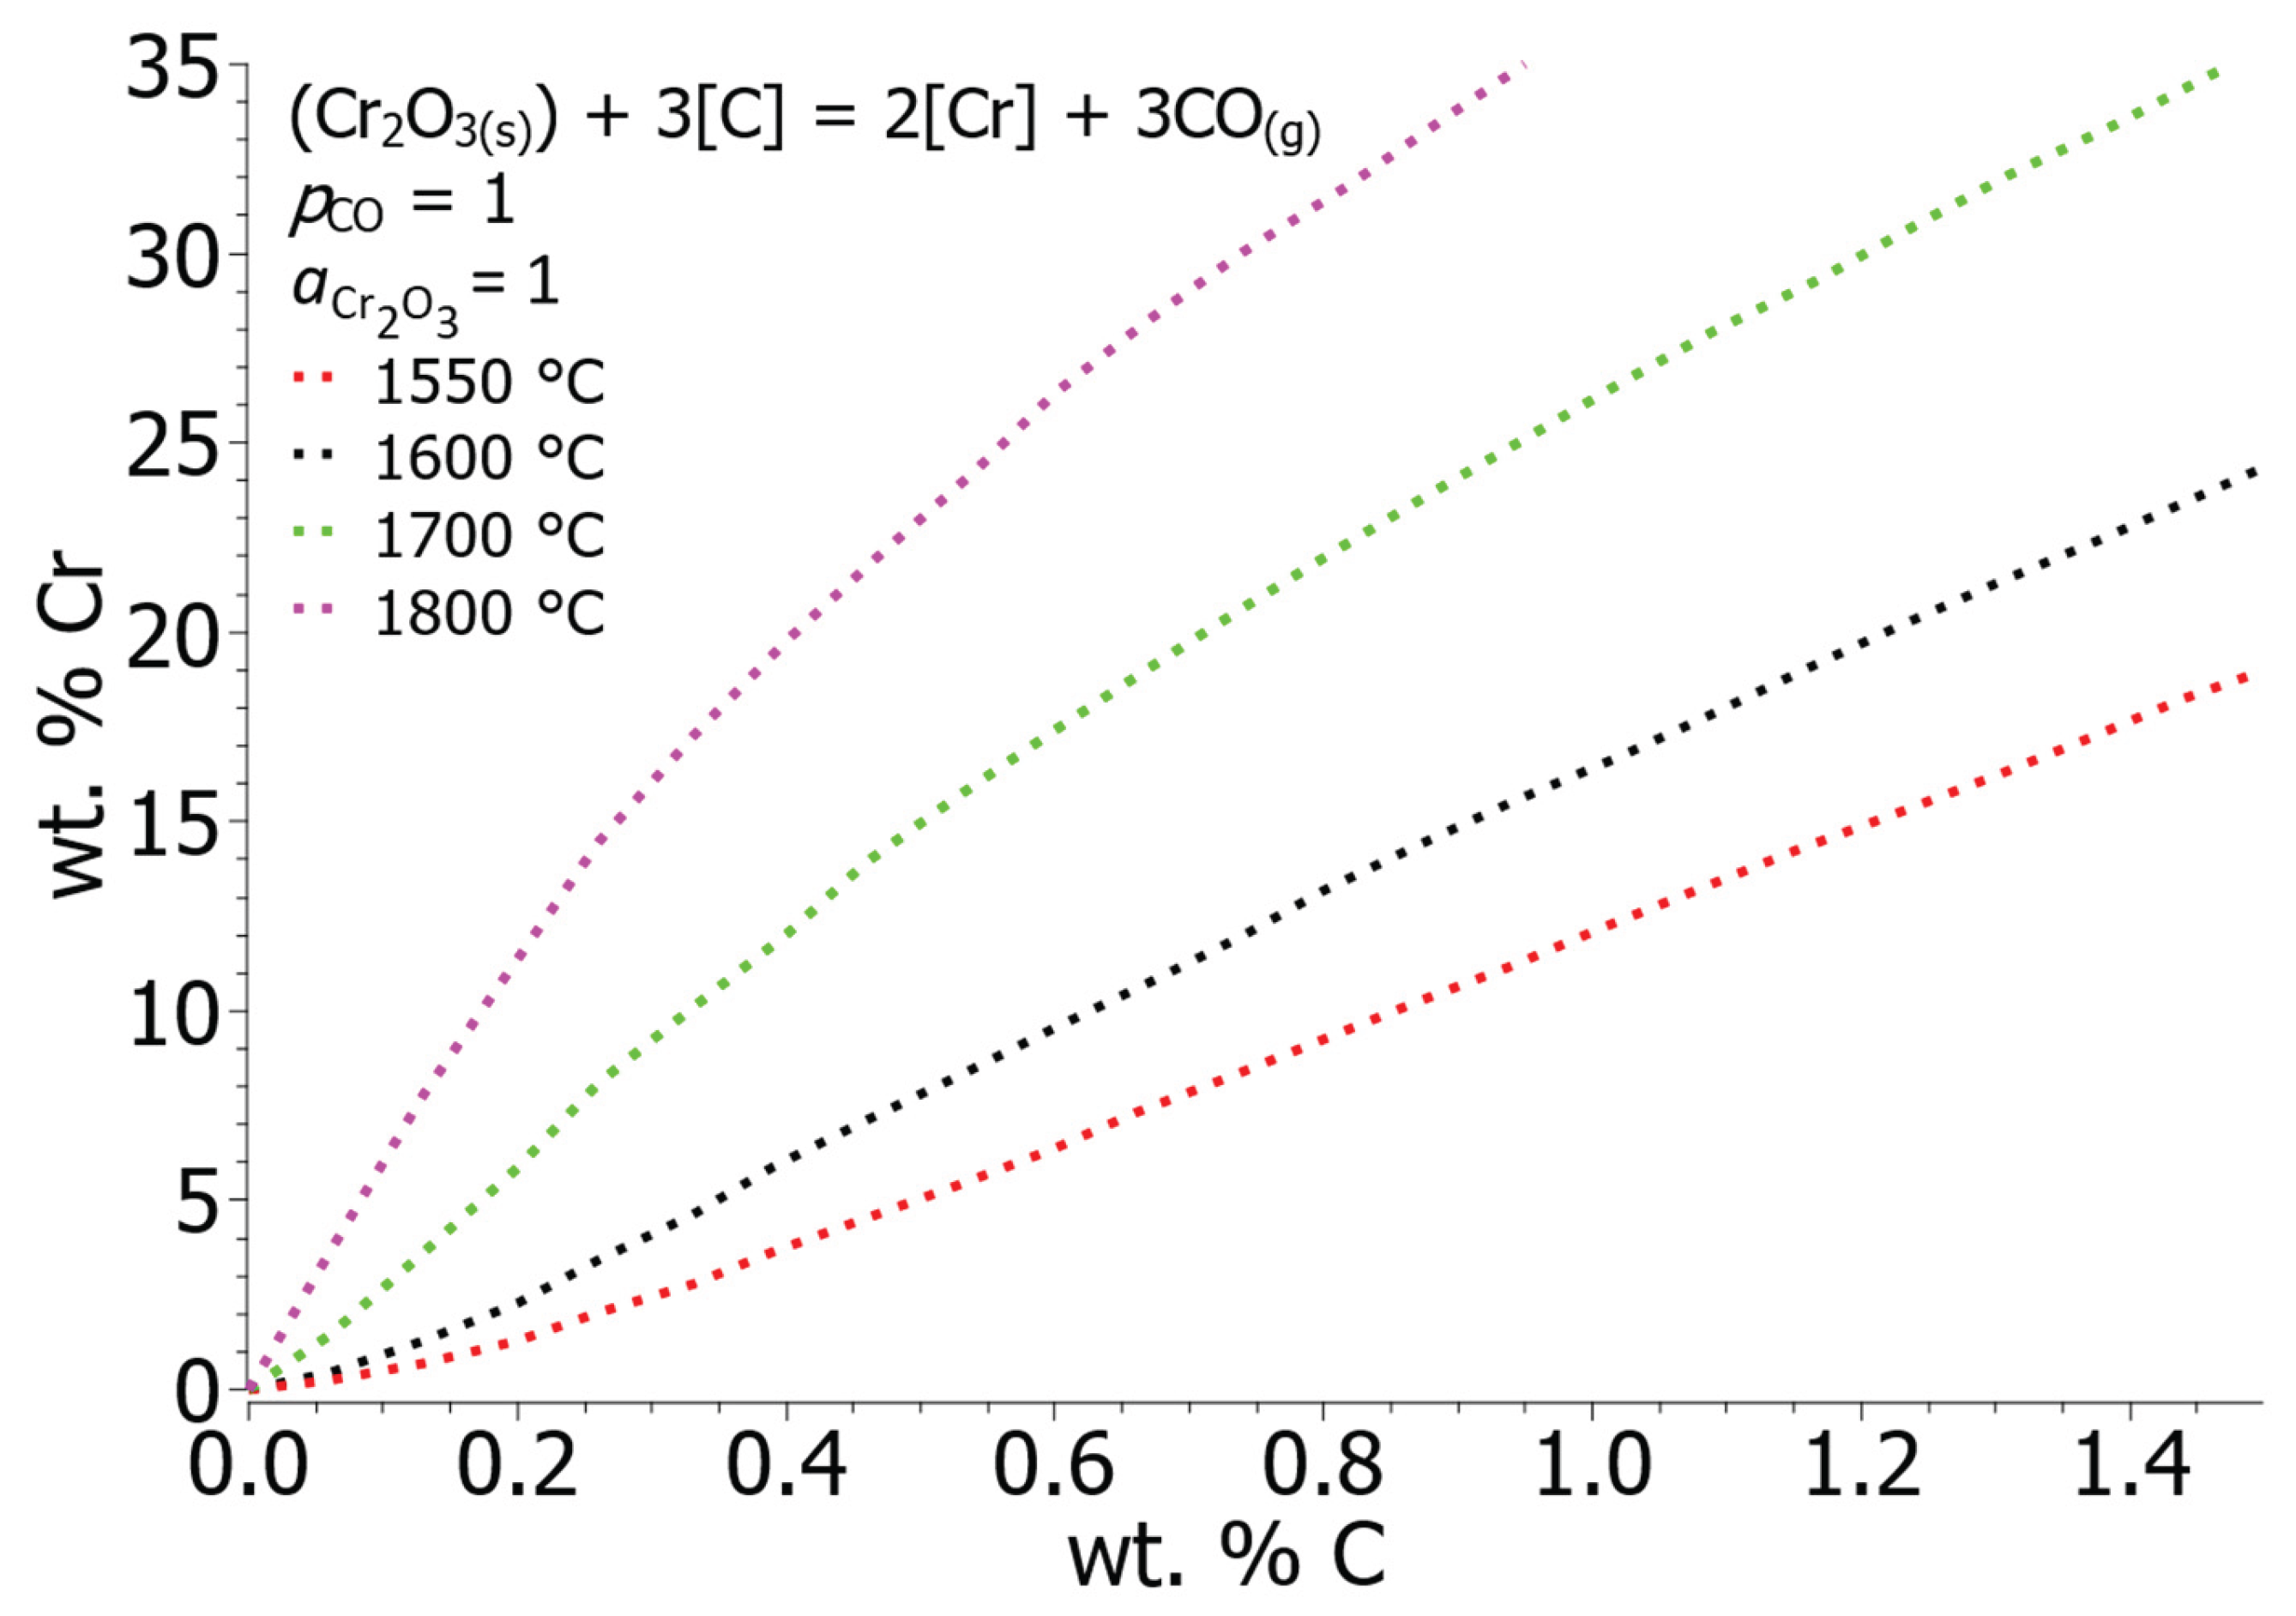
Figure 6.
Equilibrium solubility of Cr and C in liquid iron at different activity of chromium oxide.
Figure 6.
Equilibrium solubility of Cr and C in liquid iron at different activity of chromium oxide.
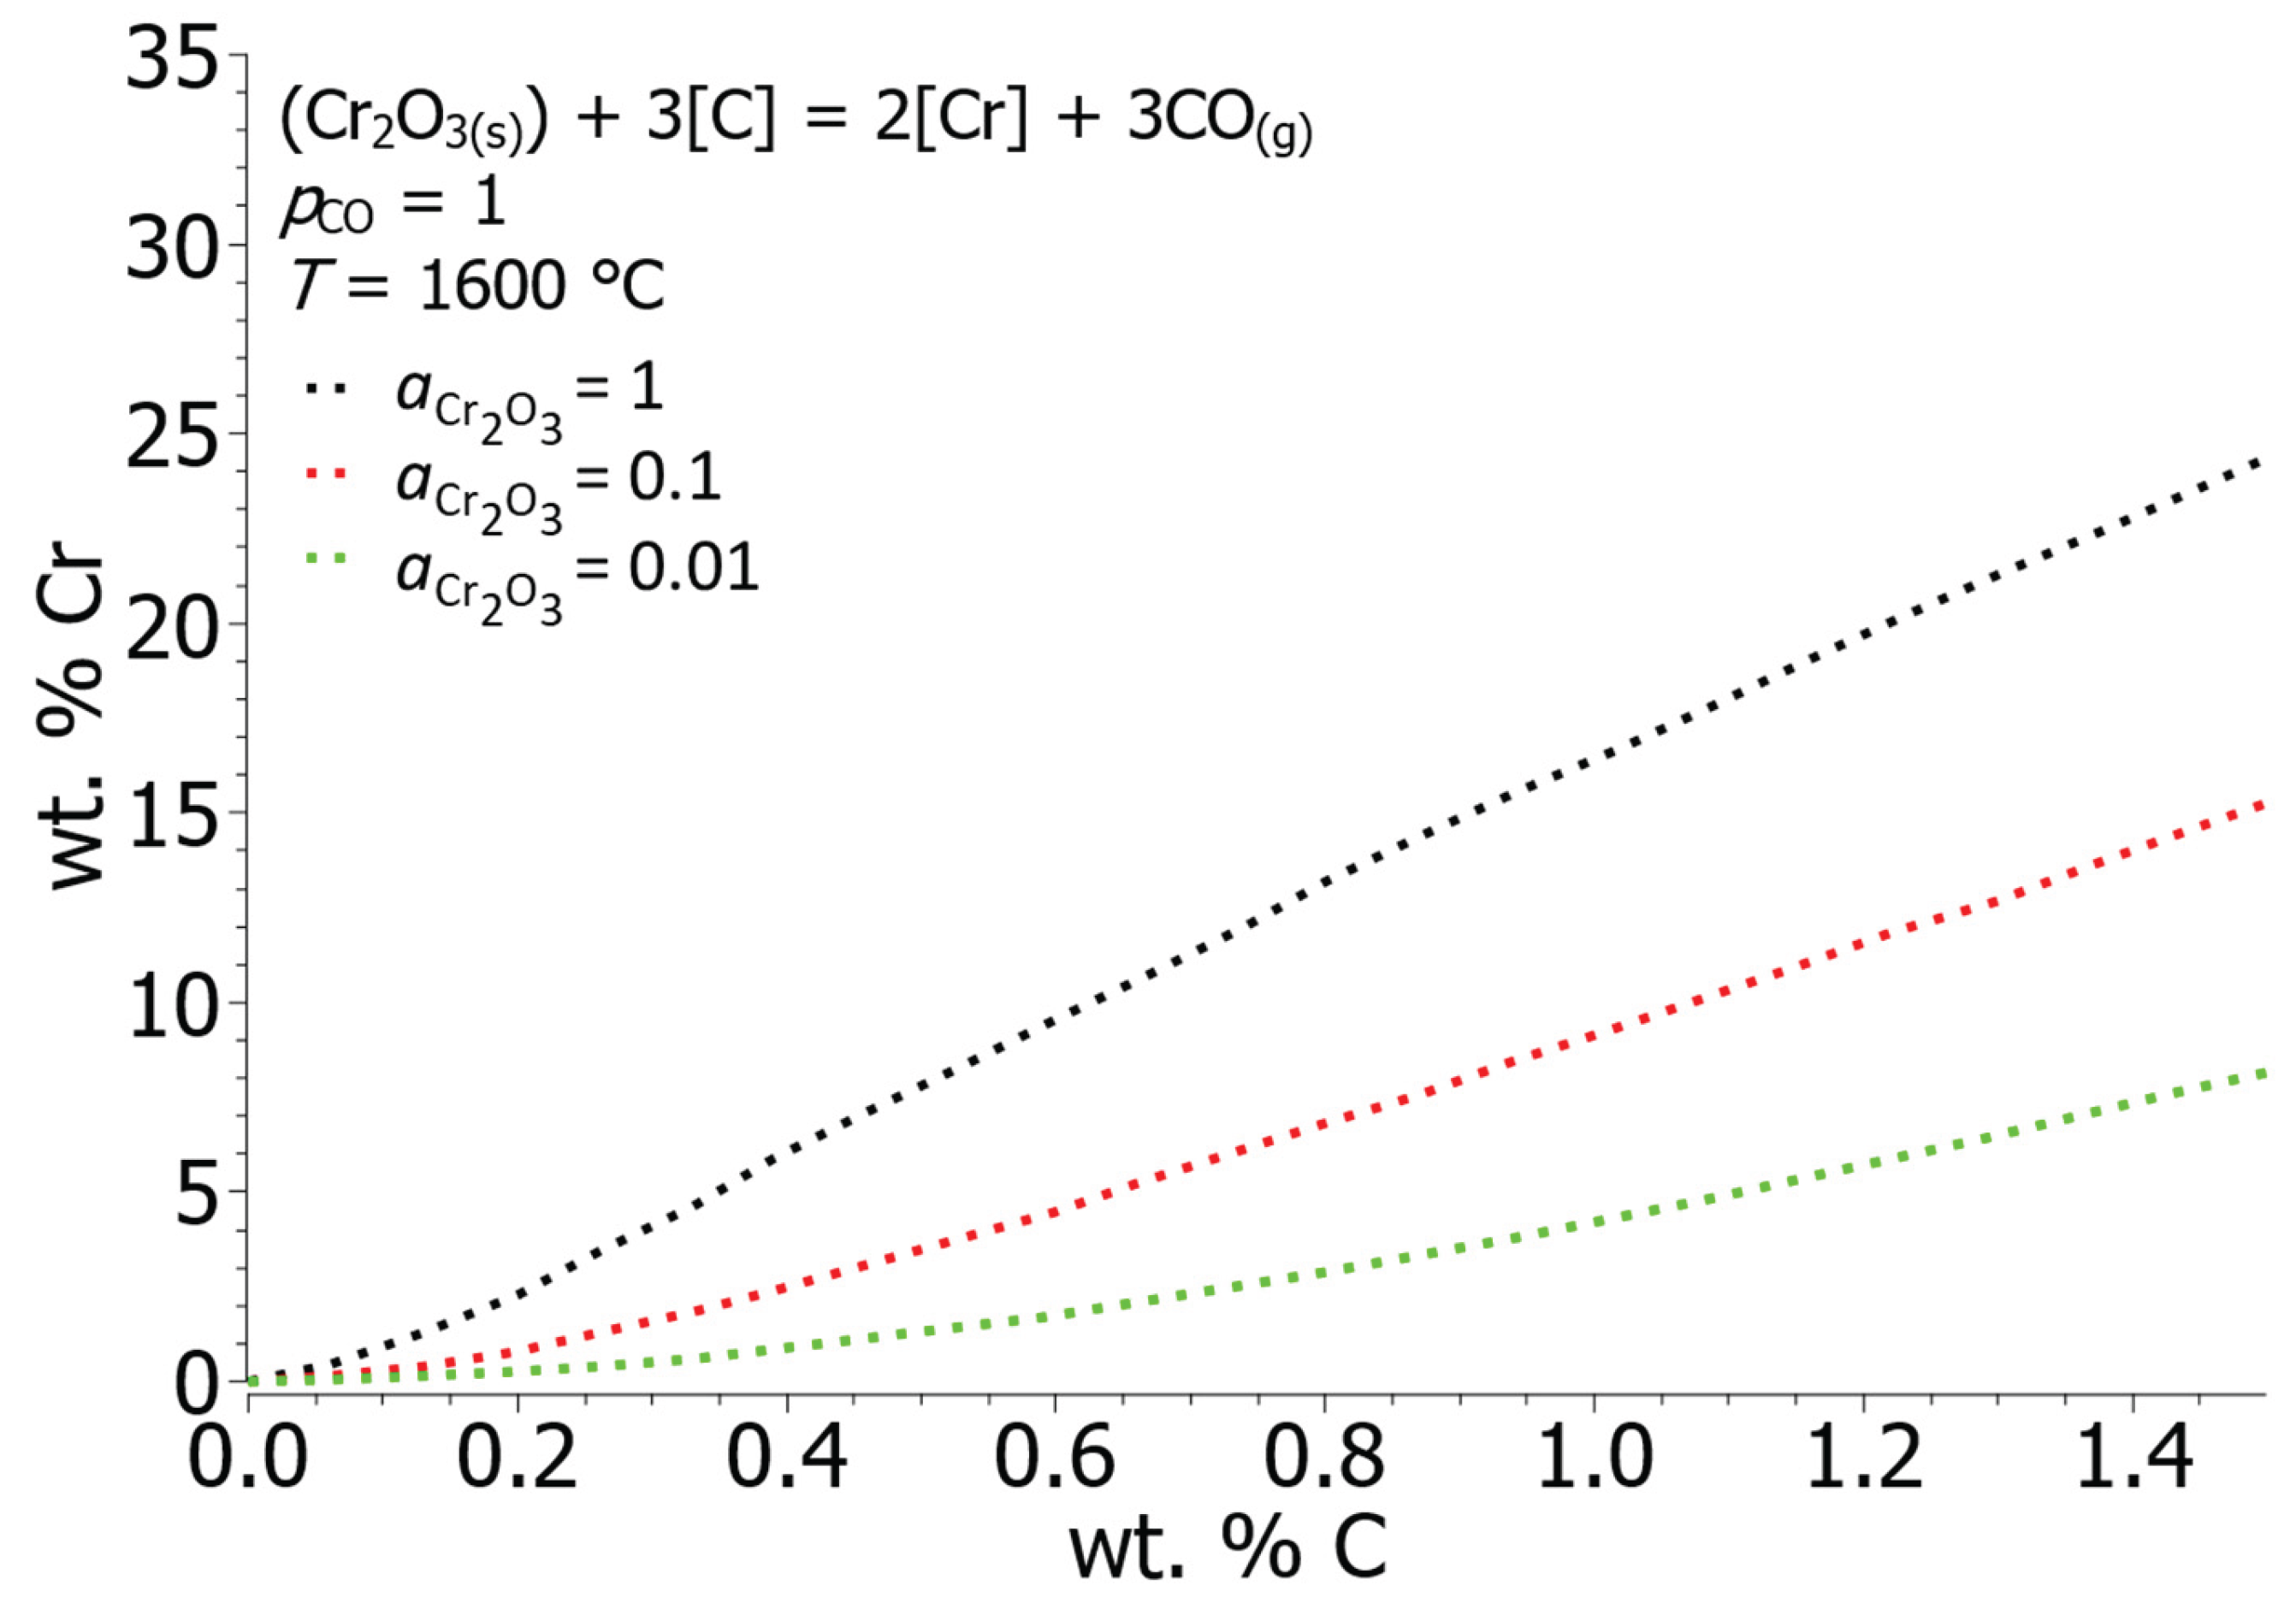
Figure 7.
Equilibrium solubility of Cr and C in liquid iron at different partial pressures of carbon monoxide.
Figure 7.
Equilibrium solubility of Cr and C in liquid iron at different partial pressures of carbon monoxide.
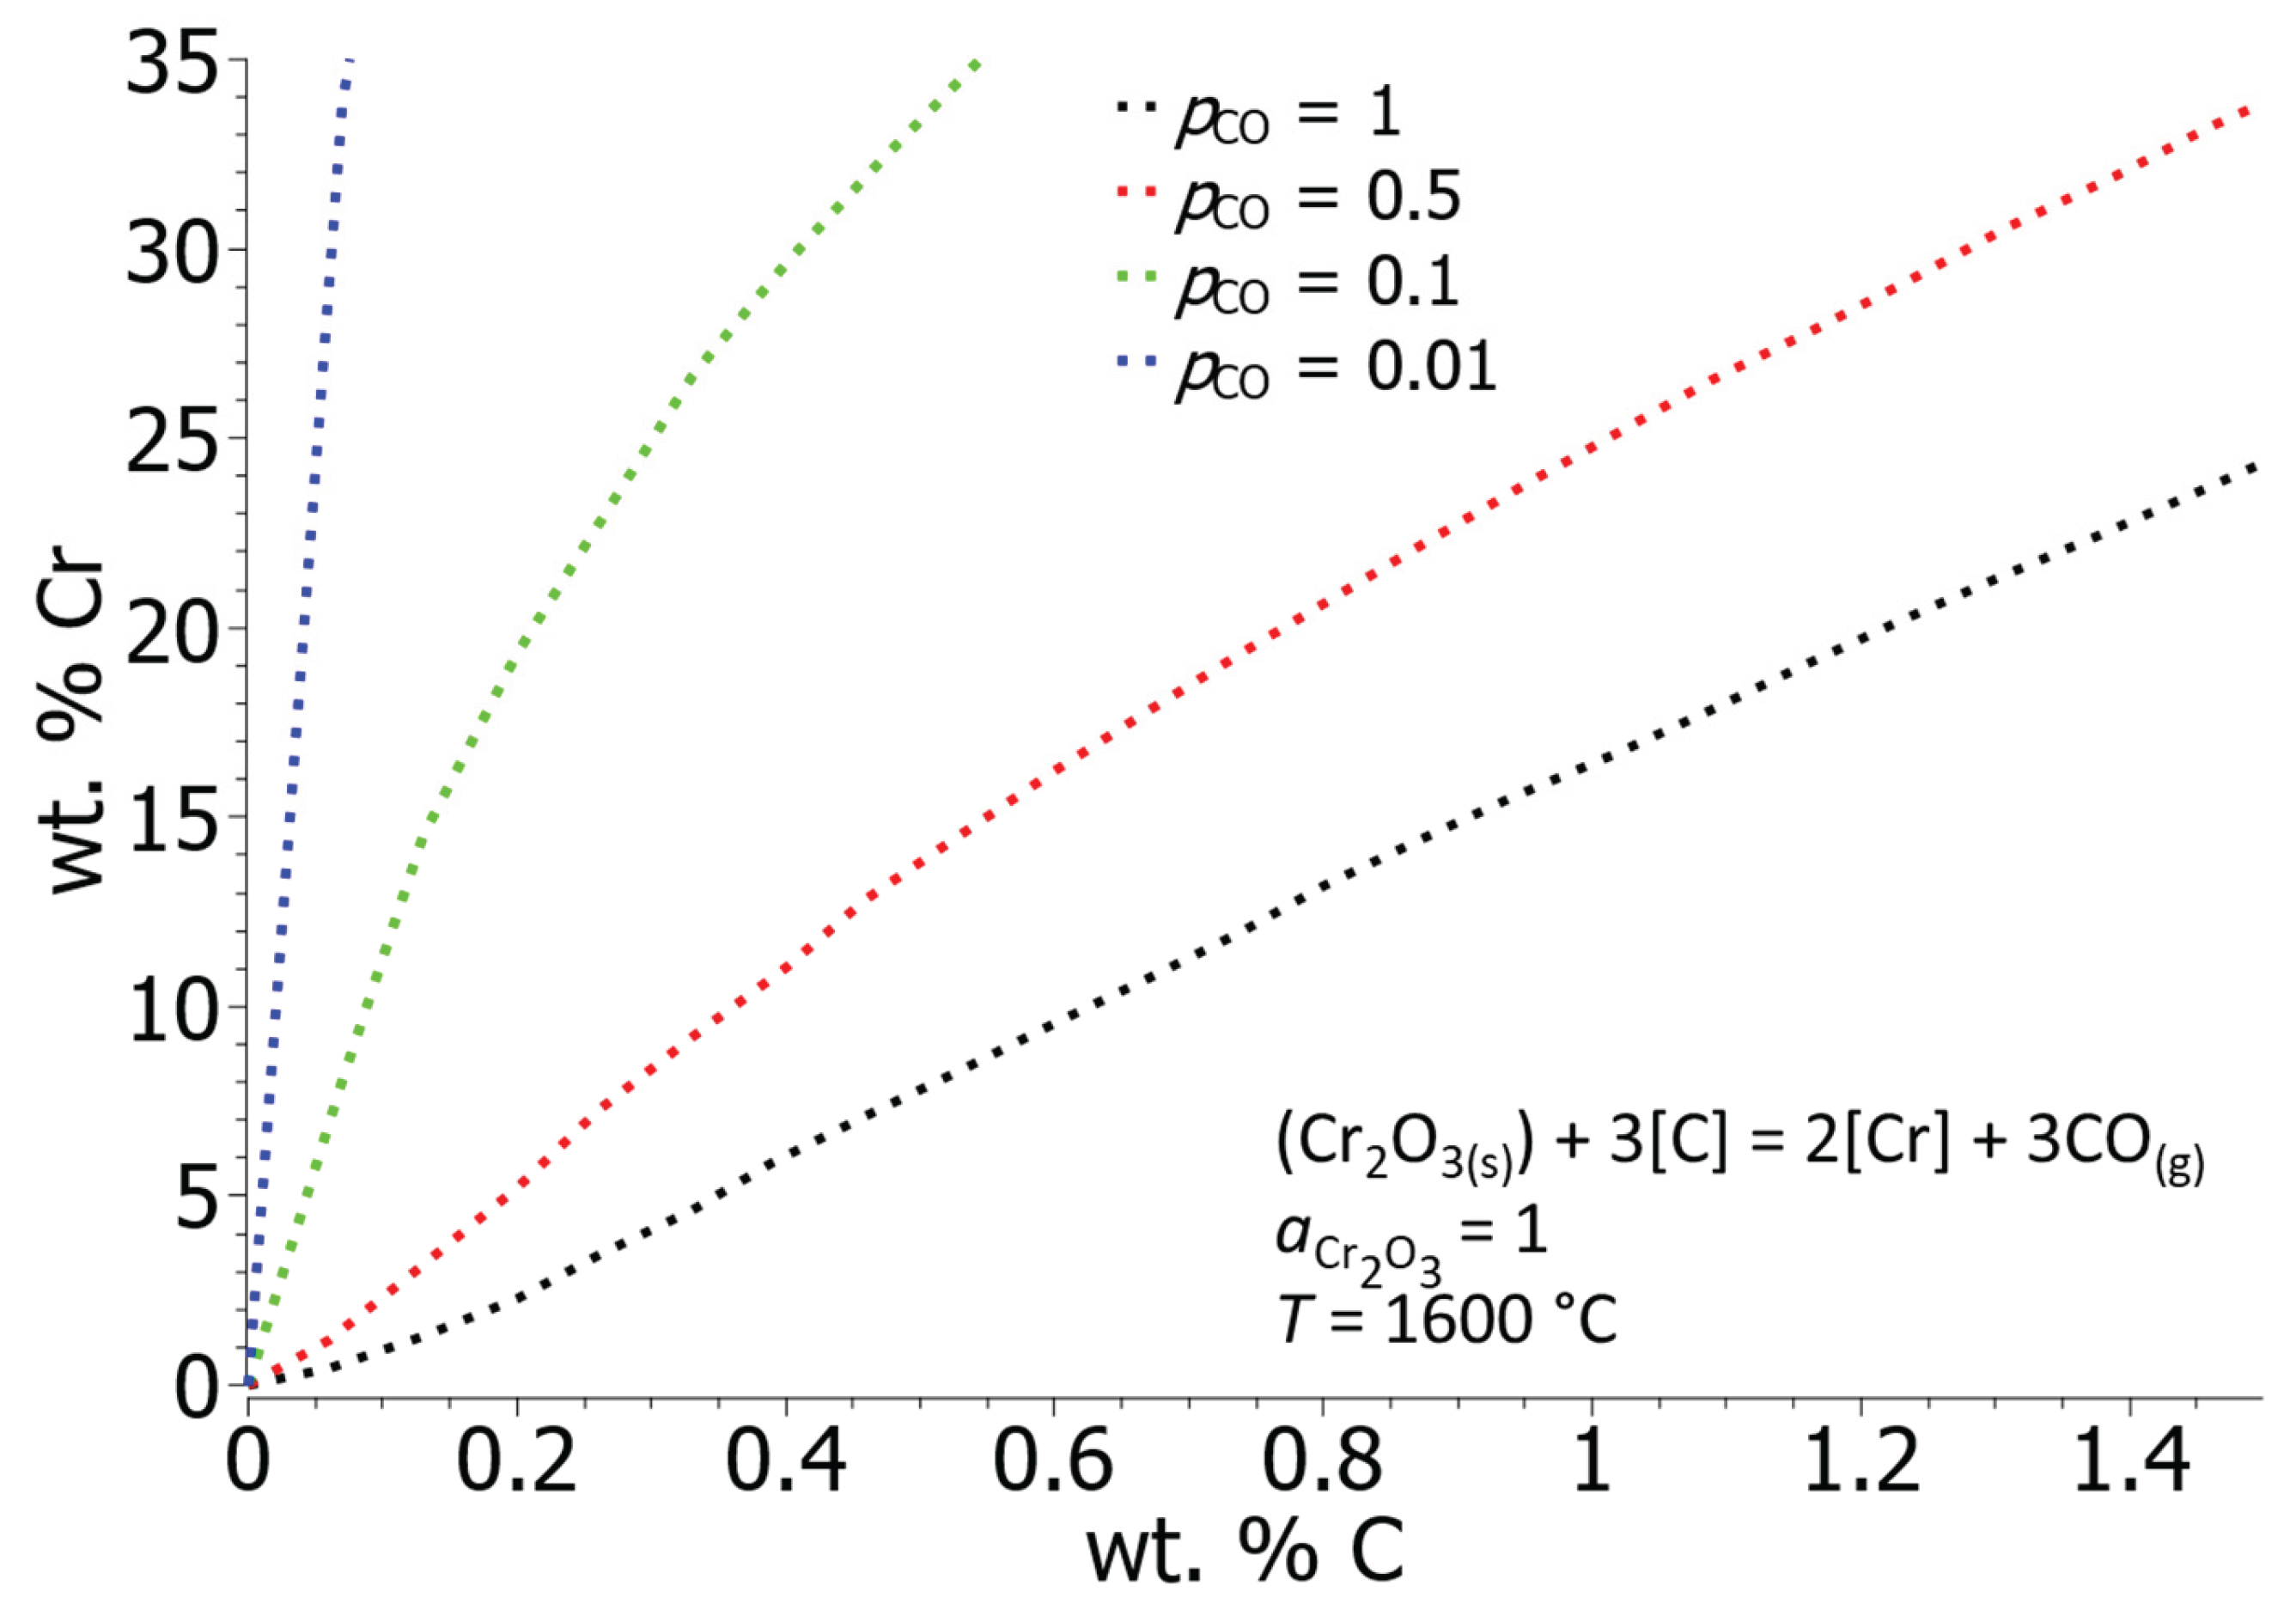
Figure 8.
Equilibrium concentrations of Cr and C at different concentrations of Si in iron liquid solution at a temperature of 1600 °C.
Figure 8.
Equilibrium concentrations of Cr and C at different concentrations of Si in iron liquid solution at a temperature of 1600 °C.
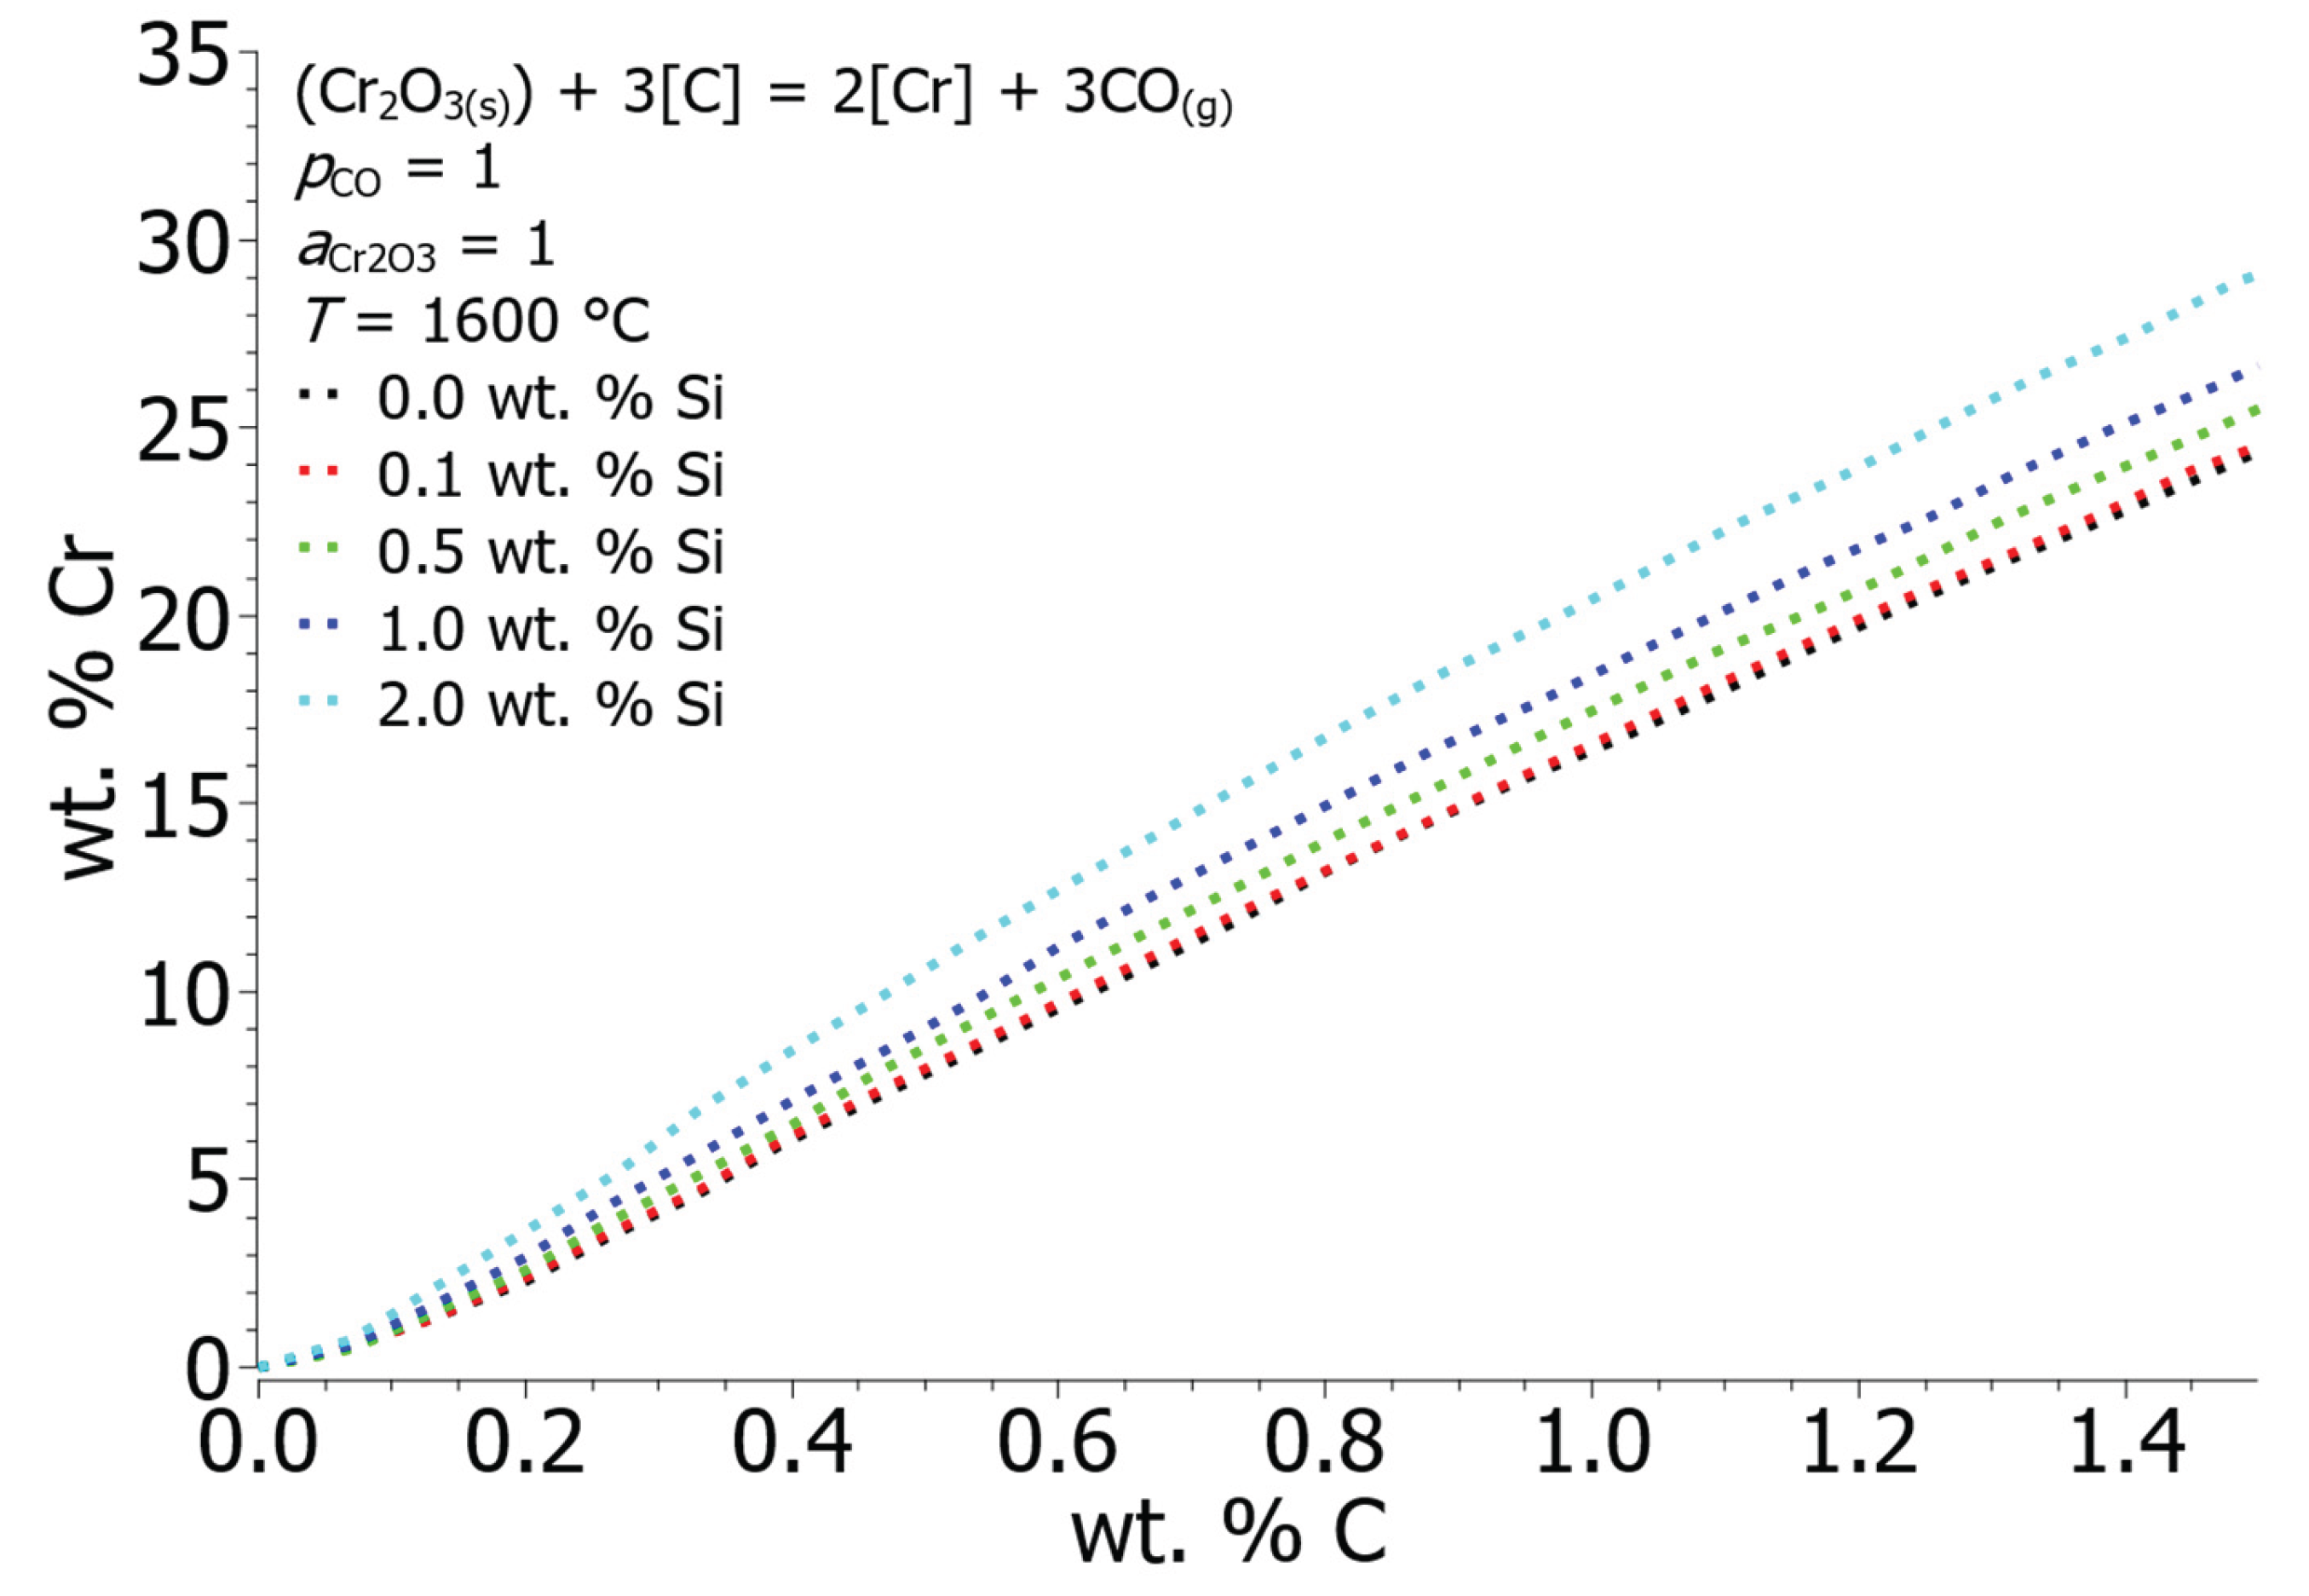
Figure 9.
Equilibrium concentrations of Cr and C at different concentrations of O in iron liquid solution at a temperature of 1600 °C.
Figure 9.
Equilibrium concentrations of Cr and C at different concentrations of O in iron liquid solution at a temperature of 1600 °C.
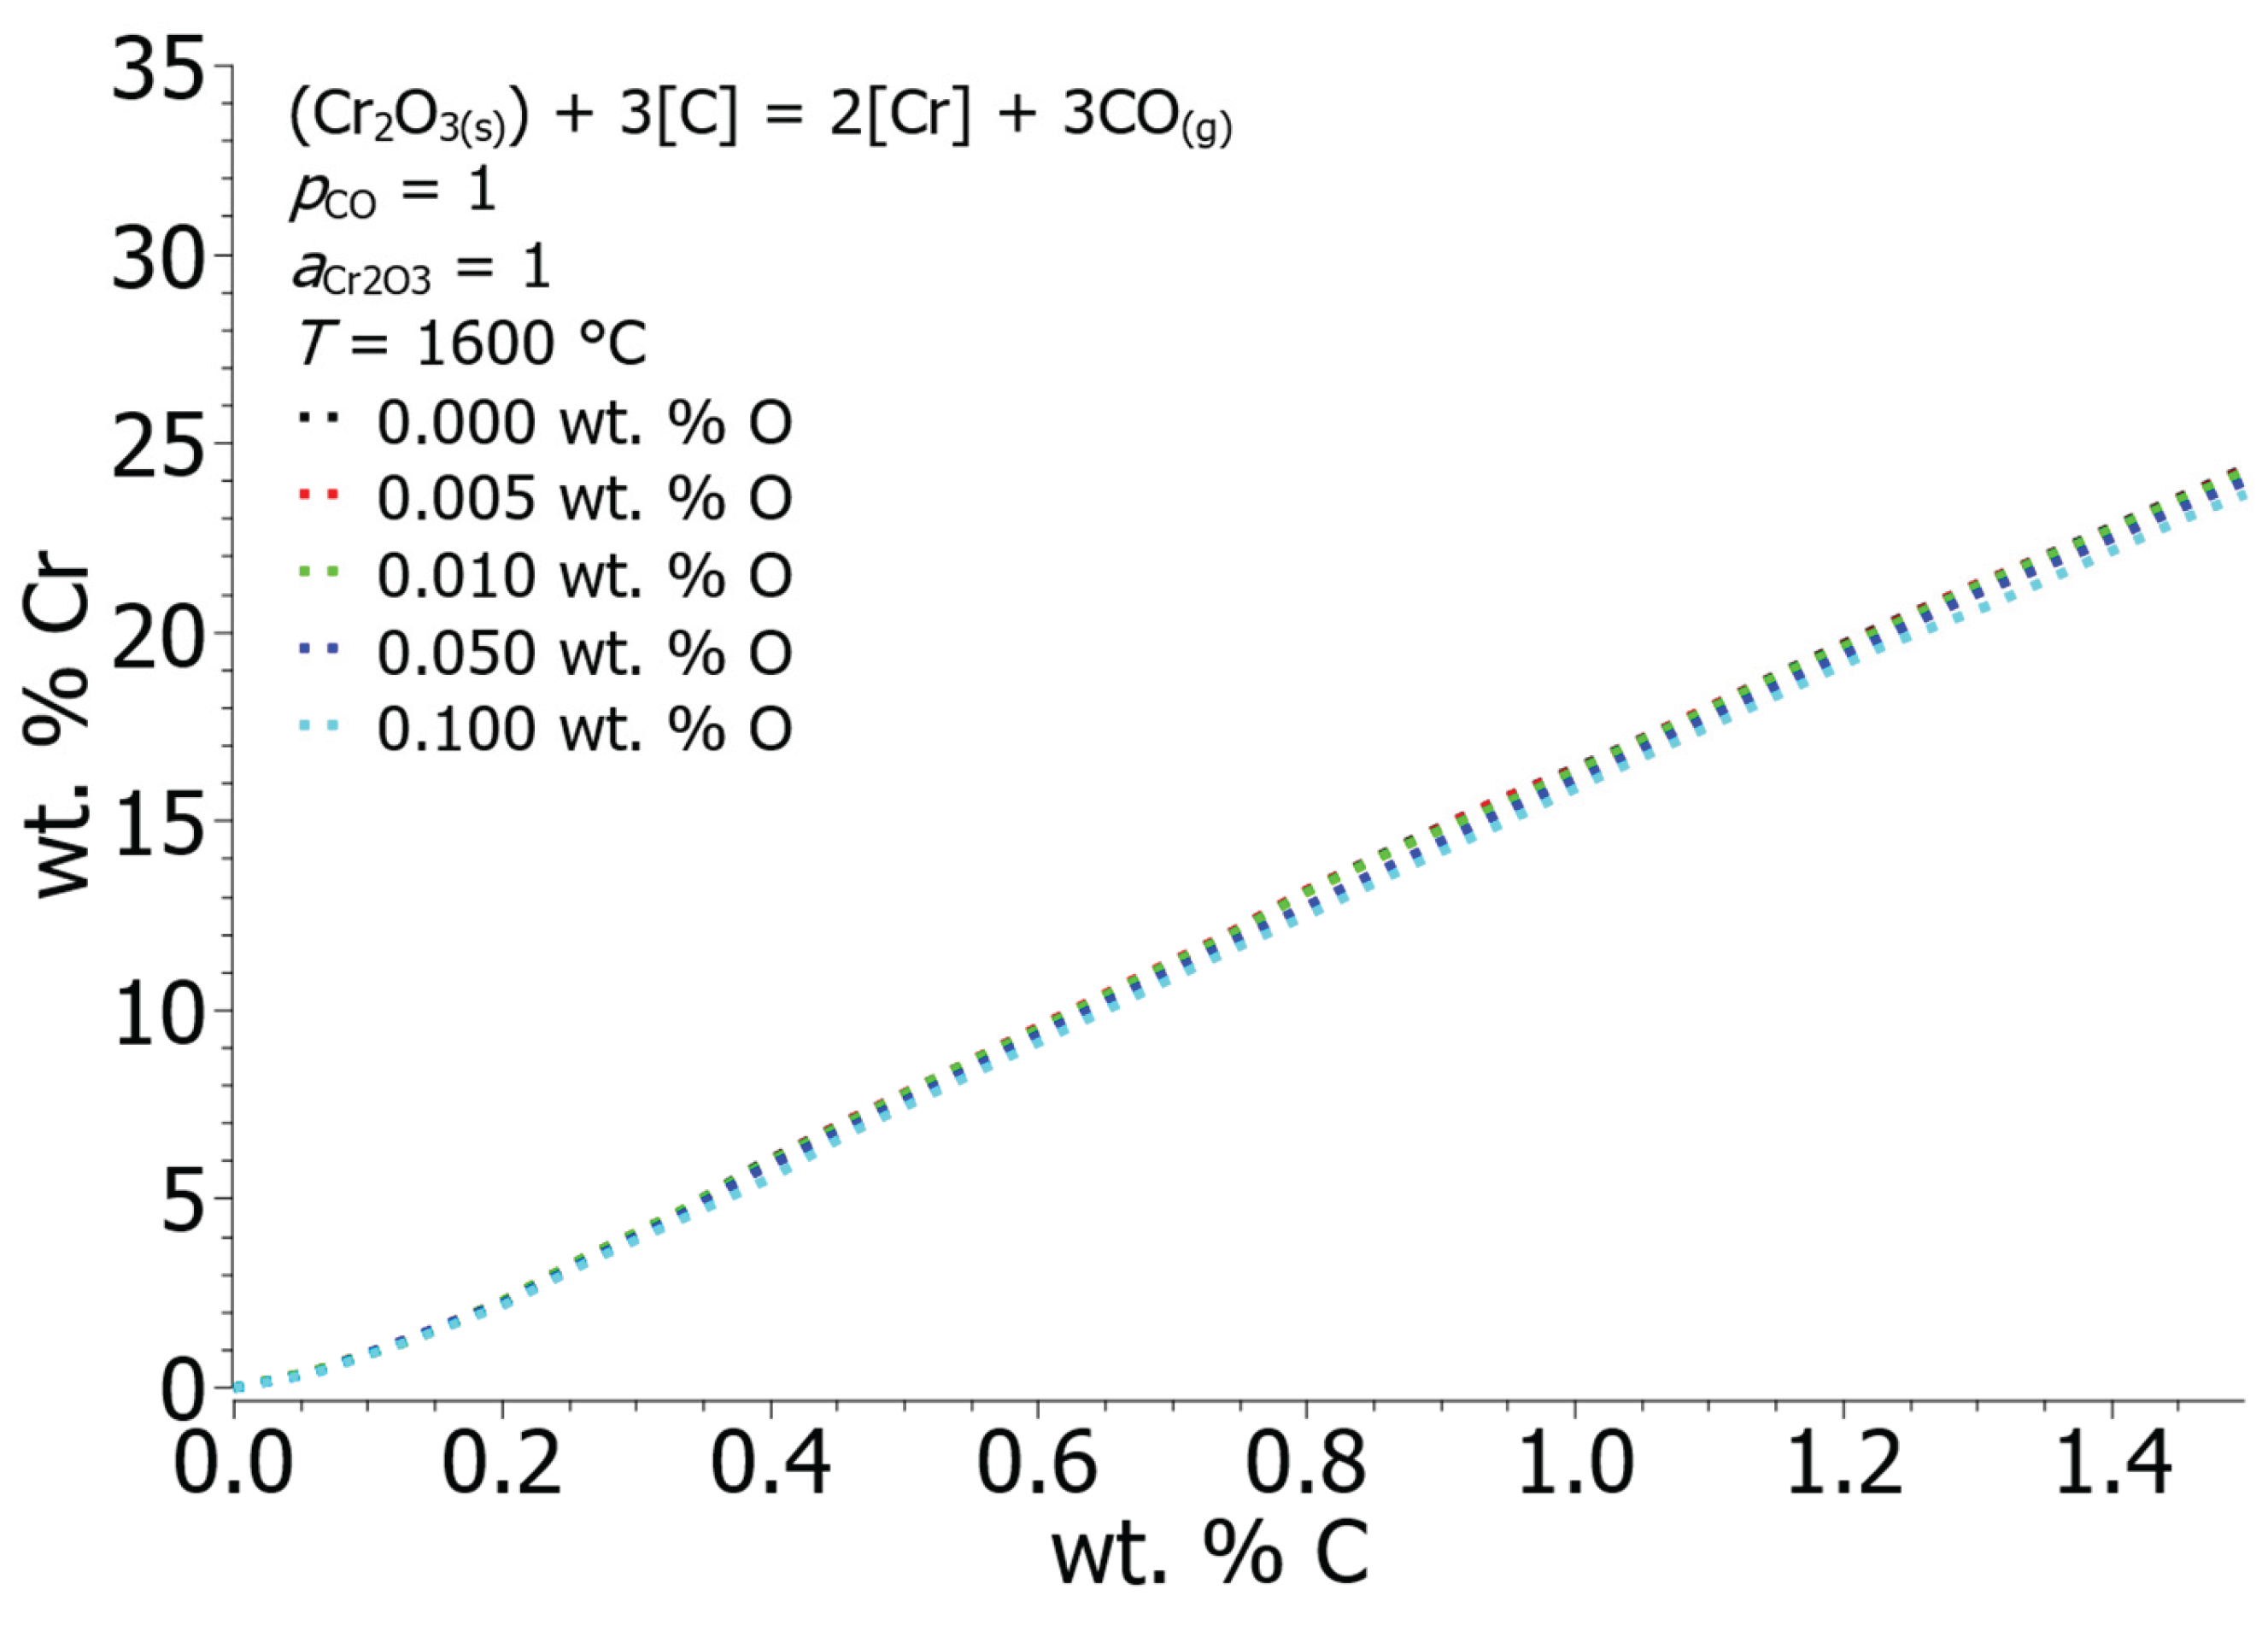
Figure 10.
Gibbs free energies as a function of temperature for the oxidation of alloying elements in iron solution.
Figure 10.
Gibbs free energies as a function of temperature for the oxidation of alloying elements in iron solution.
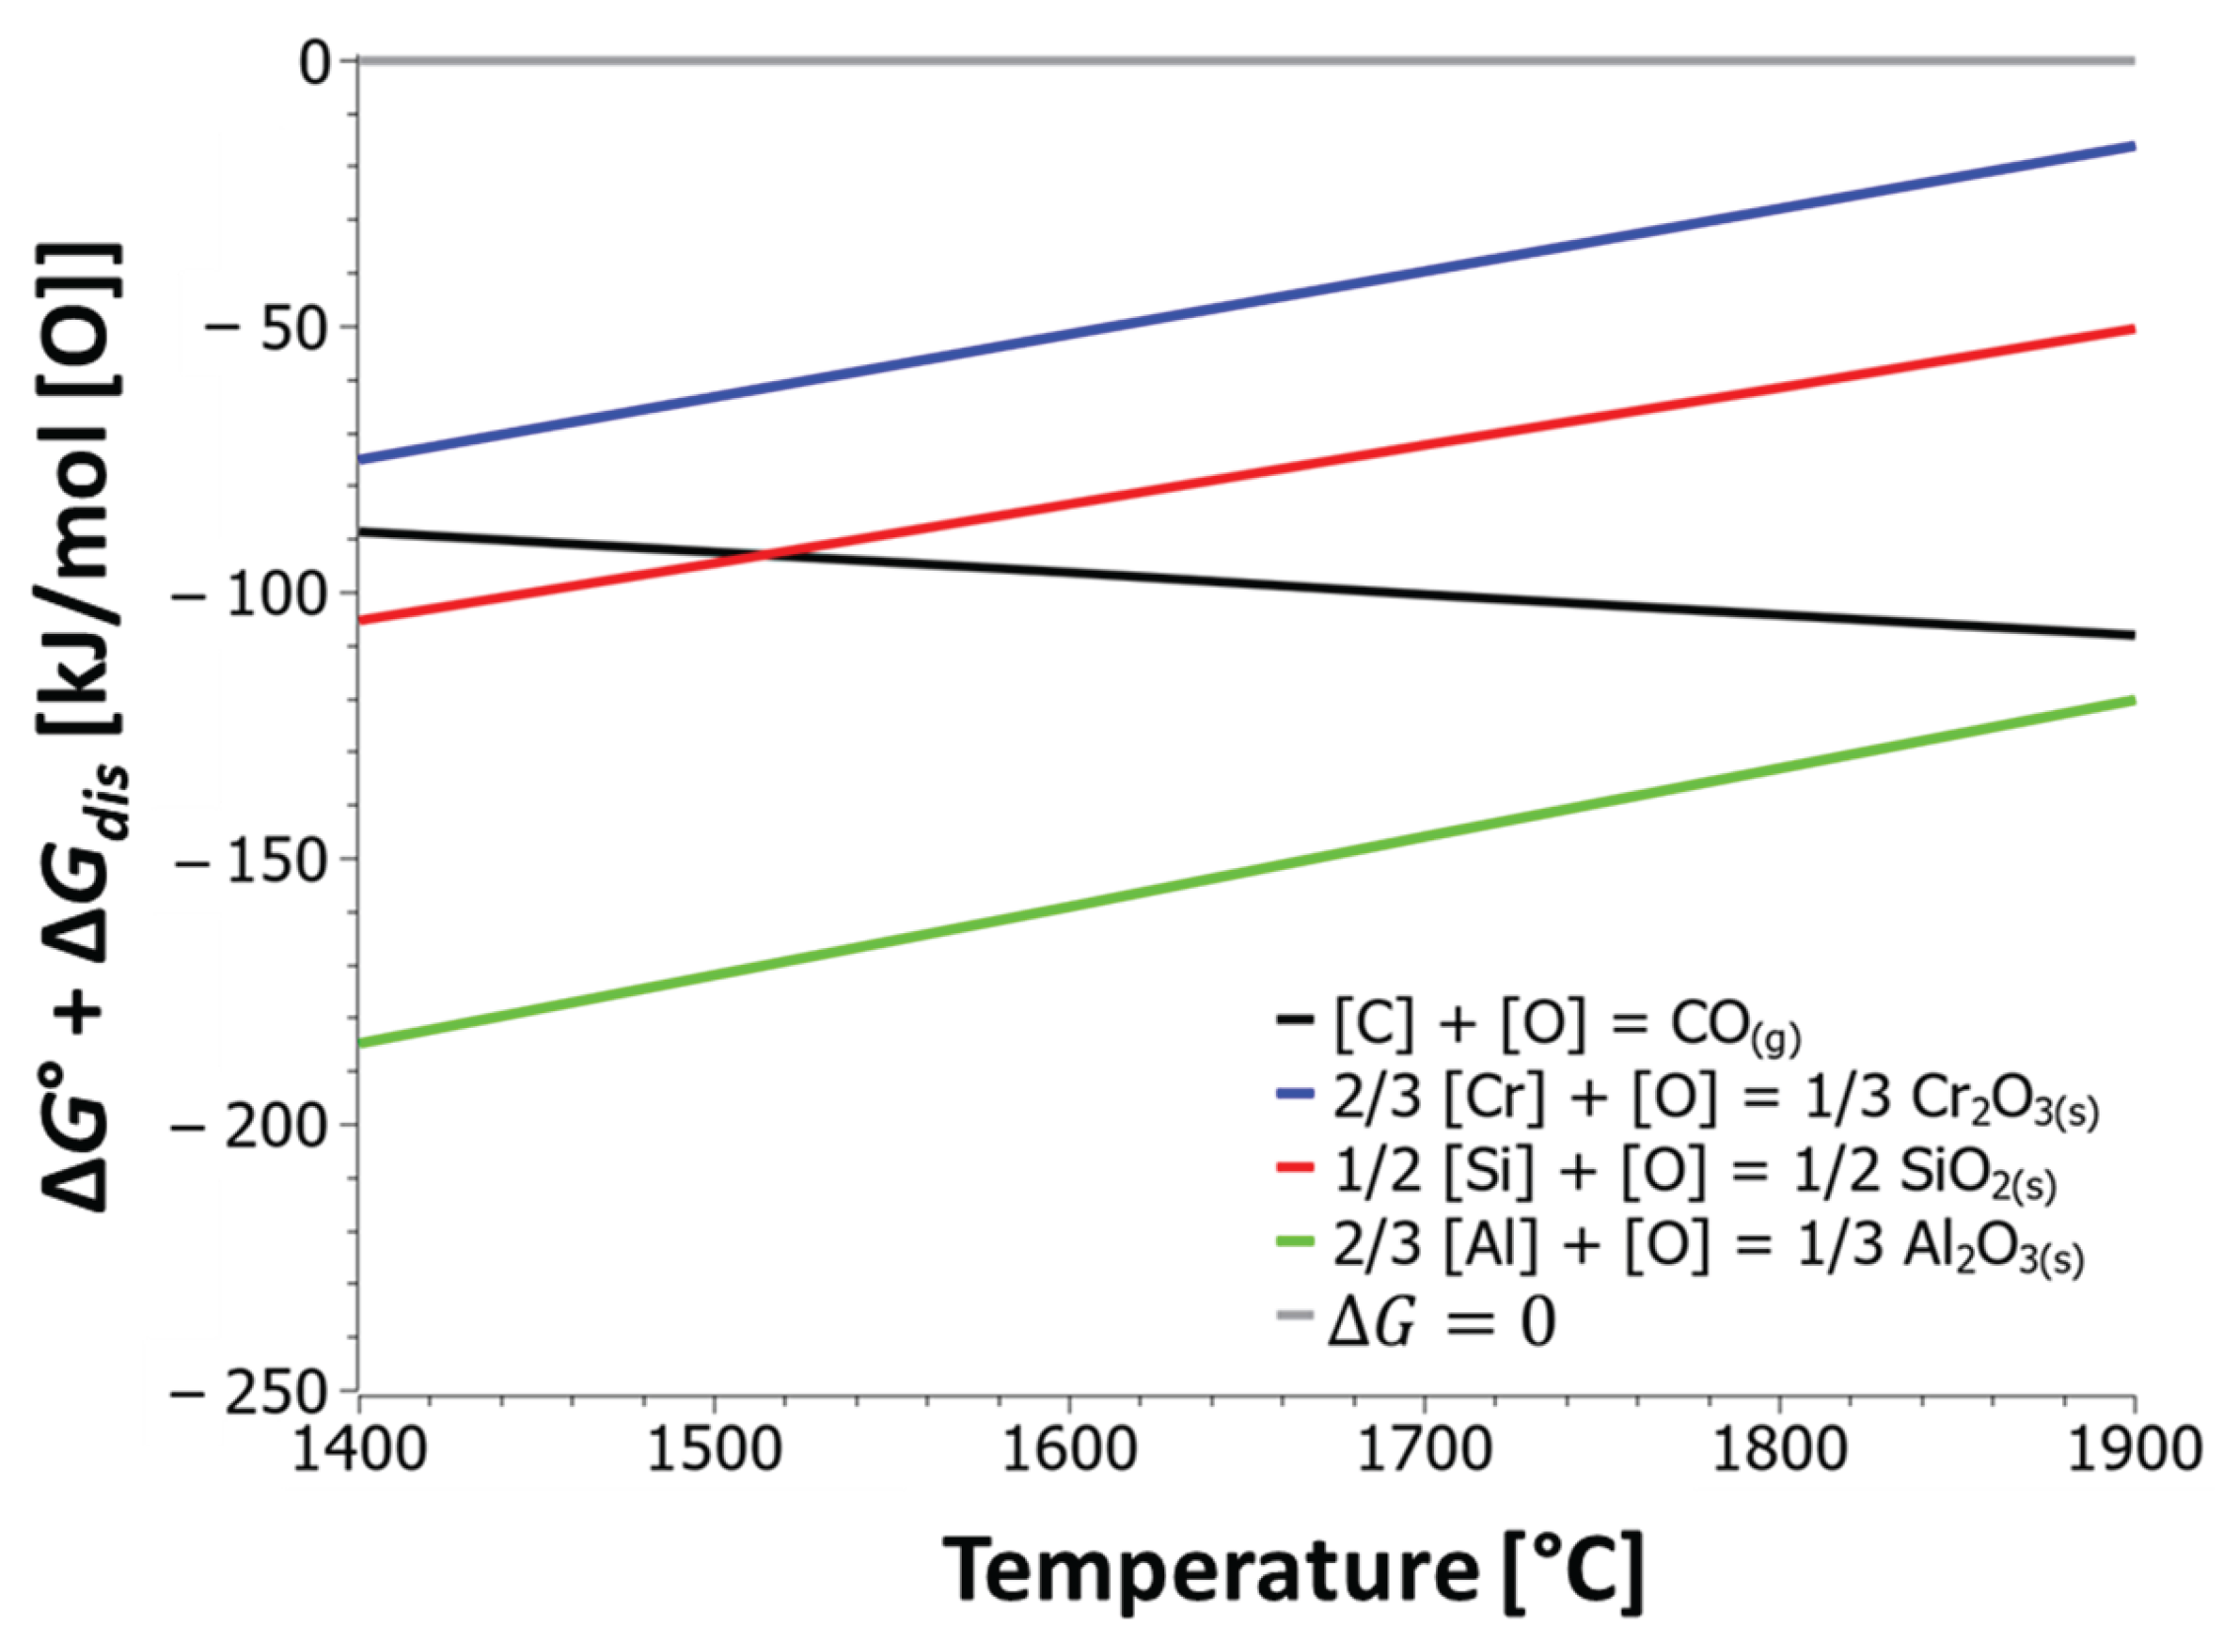
Figure 11.
Oxidation of C, Cr, and Si in steel melt with 15 wt. % Cr and 2 wt. % C. a) Oxidation start temperature 1500 °C, b) oxidation start temperature 1650 °C and c) oxidation start temperature 1500 °C with 0.5 wt. % Si.
Figure 11.
Oxidation of C, Cr, and Si in steel melt with 15 wt. % Cr and 2 wt. % C. a) Oxidation start temperature 1500 °C, b) oxidation start temperature 1650 °C and c) oxidation start temperature 1500 °C with 0.5 wt. % Si.

| Reference | ΔH° [J] | ΔS° [J/K] | ΔG° [J] |
|---|---|---|---|
| Kho et al. [4] | 77000 | 133.481 | –173000 |
| Carboni et al. [16] | 766969 | 504.63 | –1782031 |
| Barin et al. [20] | 776234 | 504.53 | –1687511 |
| HSC 8.0 | 773918 | 502.40 | –1670771 |
| Sano [9] | 402600 | 299.00 | –1574271 |
| Wang et al. [15] | 7487402 | 476.682 | –1440811,2 |
| Ma et al. [17] | 7347822 | 469.952 | –1454341,2 |
| Mihara et al. [21] | 7764681,2 | 486,251,2 | –1342781,2 |
| Heikkinen et al. [14] | 2489481,3 | 201.881,3 | –1291731,3 |
| ThermoCalc SSUB3 | 776631 | 505.10 | –169417 |
1 Calculated values. (2 and 3) Dissolution of C and Cr were taken into account in calculated values. 2 1 wt. % standard state were used, 3 Henrian standard state were used.
Table 2.
Infinite dilution in liquid iron [22].
Table 2.
Infinite dilution in liquid iron [22].
| Reaction | ΔHdis [J] | ΔSdis [J/K] | ΔGdis [J] |
|---|---|---|---|
| 22594 | 42.26 | –565591 | |
| 19246 | 46.86 | –685231 | |
| 0 | 37.70 | –706121 | |
| 22594 | 16.74 | –87601 | |
| 19246 | 9.16 | 20891 | |
| 0 | 0 | 01 |
1 Calculated values.
Table 3.
First-order interaction parameters , , and in dilute liquid iron at 1873 K. Data from [5,19,22,24,25,26].
| Sigworth et al. [22] | Ghosh et al. [5] | Lupis [24] | Seetharaman et al. [19] | JSPS [25] | Total Materia [26] | |
|---|---|---|---|---|---|---|
| 0.14 | 0.243 | 0.22 | 0.243/0.14 | 0.243 | 0.14 | |
| –0.024 | –0.023 | –0.024 | –0.023 | –0.023 | –0.024 | |
| –0.0003 | –0.0003 | / | –0.0003 | –0.0003 | 0.0003 | |
| –0.12 | –0.114 | –0.118 | –0.114 | –0.114 | 0.12 |
Disclaimer/Publisher’s Note: The statements, opinions and data contained in all publications are solely those of the individual author(s) and contributor(s) and not of MDPI and/or the editor(s). MDPI and/or the editor(s) disclaim responsibility for any injury to people or property resulting from any ideas, methods, instructions or products referred to in the content. |
© 2025 by the authors. Licensee MDPI, Basel, Switzerland. This article is an open access article distributed under the terms and conditions of the Creative Commons Attribution (CC BY) license (http://creativecommons.org/licenses/by/4.0/).
Copyright: This open access article is published under a Creative Commons CC BY 4.0 license, which permit the free download, distribution, and reuse, provided that the author and preprint are cited in any reuse.


