Submitted:
15 September 2025
Posted:
16 September 2025
You are already at the latest version
Abstract
Distributed optical fiber sensing technologies, particularly Φ-OTDR, have been extensively applied in vibration monitoring of critical infrastructure, including highways and pipelines. This is attributed to their capabilities of long-distance monitoring, high spatiotemporal coverage, and ease of deployment. Nevertheless, the monitoring data encompasses a mixture of information such as cable structural coupling, initial vibration states, and multi-modal environmental excitations. Consequently, effective separation and extraction of these signals are crucial for practical implementations. Notably, multi-modal weak signal analysis has emerged as a significant technical challenge in this field. Building upon the Φ-OTDR DVS fiber-environment coupled vibration observation model, this research introduces an innovative scenario-oriented analytical framework that integrates a combined multi-head attention mechanism. This advancement enables precise extraction of multi-modal weak signals within complex environments. Empirical validation utilizing measured data from a 30 km optical cable installed along an urban ring road has confirmed the framework’s exceptional performance across various scenarios. These include road surface roughness detection, construction machinery detection and localization, and vehicle trajectory recognition. The study reveals that the attention mechanism effectively concentrates on scenario-relevant signals, thereby substantially enhancing the analytical real-time performance. Overall, the proposed framework offers a versatile and real-time solution for DVS signal processing in intricate scenarios.
Keywords:
combined multi-head attention
; Φ-OTDR
; coupled vibration DVS observation model
; multimodal weak signal analysis
1. Introduction
Distributed Optical Fiber Vibration/Acoustic Sensing (DVS/DAS) has garnered significant attention due to its remarkable resistance to electromagnetic interference, high sensitivity, multiple signal channels, extensive monitoring range, user-friendly installation and deployment, and cost-effectiveness. As a result, it has found widespread applications in monitoring a diverse range of infrastructure, such as overhead transmission lines, buried power/optical cables, submarine power/optical cables, oil and gas pipelines, highways, railways, bridges, and tunnels, among others [1]. DVS/DAS enables distributed monitoring of axial dynamic strain along the optical fiber, functioning analogous to an anisotropic cumulative response linear array that is uniformly distributed along the accessed optical cable [2]. Its response signal is a scalar covering a relatively wide frequency band, differing significantly from the three-dimensional spatial vector vibration signals provided by traditional point vibration sensors (e.g., 3-axis accelerometers). Taking buried optical cable DVS monitoring signals as an example, they simultaneously contain the structural response characteristics of the cable, the coupling characteristics between the cable and the environment, nearby geological structure characteristics, as well as information from natural seismic event excitation, environmental excitation like rainfall, and vehicle and human activity events [2]. This information is ultimately coupled into scalar response signals of an anisotropic linear array distributed equidistantly along the fiber. Therefore, analyzing and processing DVS monitoring signals requires customized signal processing methods tailored to specific application scenarios to enhance useful characteristic signals while suppressing other signals as background noise [3].
Existing DVS monitoring signal analysis and processing mostly focus on enhancing relevant feature signals and suppressing background signals only for single-purpose application scenarios [4,5,6,7]. On one hand, this wastes much useful information within the DVS monitoring signals; on the other hand, it requires more training samples from different background signal combination scenarios to enable the system to reach usable accuracy requirements [3]. Furthermore, due to the neglect of the inherent variation patterns of background signals, pre-defined scenarios struggle to cover all variations encountered in practical applications, significantly limiting the scope and effectiveness of DVS monitoring applications [8,9].
In light of this, this paper draws on the achievements in the application of visual attention mechanisms and introduces an attention mechanism into DVS monitoring signal processing [10,11,12,13]. By combining top-down application scenario guidance with bottom-up feature signal salience, it achieves fusion through methods such as feature channel attention, spatiotemporal/time-frequency region attention, and channel-space cross-attention, adaptively constructing an efficient complex logic decision tree for relevant event detection. This approach organically integrates existing time-frequency analysis, spatiotemporal array analysis, and frequency-space array analysis with relatively low computational complexity, enabling application scenario-guided adaptive multimodal analysis of DVS signals.
The framework facilitates convenient multi-channel information fusion, achieving multi-modal weak signal extraction and analysis with a higher signal-to-noise ratio. The effectiveness of the proposed method is verified using real DVS signals from a buried communication cable on the outer ring of a city.
2. Model Algorithm
2.1. DVS Based on Heterodyne Coherent Detection Φ-OTDR
DVS is typically implemented using Phase-sensitive Optical Time-Domain Reflectometry (Φ-OTDR). It injects optical pulses into the optical fiber and demodulates the phase information of the backscattered Rayleigh scattering time-series signals to achieve distributed measurement of vibrations along the fiber [1,14,15]. In this study, a DVS system based on heterodyne coherent detection Φ-OTDR was constructed, as depicted in Figure 1.
Assuming an equal-intensity probe laser pulse with pulse width (unit ns) is injected into the sensing fiber of total length at frequency , and the data acquisition card’s sampling frequency is . According to the fundamental principles of heterodyne coherent detection Φ-OTDR [9], the observation data matrix can be derived:
Here represents the time dimension, denotes the spatial dimension; is the speed of light in the fiber, , is the speed of light in vacuum, is the fiber refractive index; is the detector responsivity; is the probe laser pulse intensity; is the fiber attenuation coefficient; is the optical frequency shift introduced by the acousto-optic modulator; is the phase deviation caused by the reference light; , are the mean amplitude and phase modulation, respectively, of the fiber scattering points within the length interval over the time interval .
Typically, to avoid aliasing of backscattered Rayleigh signals from multiple pulses, ; to ensure vibrations at any point within the monitoring range can be captured by at least one sampling point, avoiding spatial monitoring blind spots,, i.e.,:
2.2. Fiber-Environment Coupled Vibration Observation Model
From Eqs. (1) and (2), it can be seen that DVS can monitor vibration signals within the frequency range at points along the sensing fiber over a length with a spatial resolution of (actual resolution ); where is the lowest observable frequency affected by system noise. Since light transmission in the fiber exhibits exponential attenuation with distance, the amplitude of the observed signal also attenuates exponentially with distance. Its phase reflects the scalar dynamic strain generated by vibration at each fiber point along the axial direction, which differs significantly from the three-dimensional spatial vector vibration signals measured by traditional triaxial accelerometers. Furthermore, different installation methods of the sensing fiber (direct burial/overhead/pipeline/subsea, etc.) result in different forms of vibration coupling with the environment, leading to vibration waves from different incident angles affecting the axial dynamic strain of the fiber to varying degrees, forming an anisotropic response [2].
Figure 2 illustrates the relationship between the fiber-environment coupled system vibration model and the DVS observation model. Fibers installed in different ways receive characteristic excitations carrying environmental noise, forming a fiber-environment coupled vibration system. Its previous state and the current noisy excitation together influence the noisy observation signal obtained by DVS. Assuming the fiber-environment coupled vibration system at point $l$ has $n$ degrees of freedom, the above process can be described by Eq. (3) [16,17].
Where represents the discrete time quantity, represents the discrete spatial quantity; is the discrete-time state variable, is the discrete-time state matrix, is the discrete-time external excitation vector, is the discrete-time input matrix, is the system input noise; is the vibration signal observation (here, the optical path change component at position at time in the fiber), is the discrete-time output matrix, is the discrete-time direct feedthrough matrix, is the observation output noise, is the number of related measurement points, often in practical DVS systems. is the phase change at position at time in the fiber as shown in Eq. (1), is as shown in Eq. (1); and:
Where are the mass matrix, damping matrix, and stiffness matrix, respectively.
By assigning values with different distribution characteristics to ,,, and Eq. (3) can conveniently describe the observation models for most practical DVS application scenarios. The aforementioned characteristics of DVS signals determine that in practical applications, we need to adopt methods distinct from traditional vibration signal processing, consider the vibration coupling characteristics of the sensing fiber and the environment, and fully exploit the spatio-temporal correlation of the linear array response sensing signals from DVS to provide appropriate solutions for real-world scenarios.
2.3. Application Scenario-Driven Combined Multi-Head Attention Mechanism DVS Signal Analysis
Attention is the process by which the brain filters information and focuses on targets in complex environments. Its essence can be attributed to the selective dynamic allocation of information, optimizing the use of limited cognitive resources to prioritize the processing of key information. The attention mechanism permeates the core processes of brain prediction, decision-making, and learning, achieving closed-loop adaptive optimization of perception-action and the environment through selective information deepening under limited resources [18]. Recent research has transitioned from traditional behavioral experiments to a new paradigm characterized by “computational modeling, neural mechanisms, and real-world context integration.” By leveraging technological innovation and interdisciplinary collaboration, researchers are better equipped to explore the inherent complexity of cognition.
In this field, attention models simulate the information filtering and resource allocation strategies observed in biological cognitive systems, emerging as a key technological innovation in artificial intelligence. As core components of AI models, they significantly enhance the model’s ability to filter and integrate key information. Their advantages in handling long-range dependencies, multimodal alignment, and interpretable decision-making have driven breakthroughs in fields such as natural language processing, computer vision, and multimodal learning. Existing attention mechanism models mainly include channel attention, spatial attention, temporal attention, branch attention, as well as combined attentions like channel-spatial attention and spatial-temporal attention [19].
From Section 2.2., it can be seen that the obtained DVS monitoring signal contains information such as environmental excitation , the vibration state of the cable and its coupled structure, and the fiber-environment coupled vibration . Guided by the requirements of specific application scenarios, introducing reasonable assumptions to simplify the problem, and comprehensively utilizing related prior knowledge, we can mimic the human attention mechanism to integrate multi-clue information for complex background suppression, multi-feature fusion detection and extraction. This allows limited computational resources to be rapidly focused on appropriate information for processing, providing real-time solutions for specific application scenario problems. Several typical monitoring problem descriptions are given below:
1. Event Detection and Classification. Detect whether the external excitation contains the target excitation distribution corresponding to a specific event. Non-target excitation is treated as background excitation and suppressed within . Differences in the cable and its coupled structure state also need to be eliminated. Further feature extraction and classification are performed on the detected .
2. Vibration State Identification of Cable and its Coupled Structure. Estimate and identify the characteristics and categories of , requiring robustness against interference from different environmental excitations .
3. Detection of Physical Property Changes in Cable and its Coupled Structure. Detect changes in the mass matrix , damping matrix and stiffness matrix of the cable and its coupled structure. This is achieved by identifying physical parameters of the fiber-environment coupled vibration model , requiring adaptation to the influences of different vibration states and different environmental excitations .
Clearly, the target excitation , the vibration state to be detected , and the features of the physical parameter identification fiber-environment coupled vibration model only affect the monitoring signal within certain frequency bands. They exhibit certain characteristics in the time domain, frequency domain, and space domain, and their spatio-temporal distribution usually satisfies certain prior rule constraints.
To address the above three types of problems, we comprehensively utilize frequency-domain attention, time-domain feature-spatial attention, time-frequency feature-spatial attention, and long-branch spatio-temporal prior information association attention to construct a corresponding combined multi-head attention mechanism DVS signal analysis framework. This achieves background suppression and target signal detection, segmentation, and extraction, as shown in Figure 3.
Using a sliding window mechanism similar to Short-Time Fourier Transform (STFT), the monitoring signal is segmented in the time dimension. With frame length and frame shift , and the number of spatial points and the number of spatial points , then is an matrix.
Firstly, it is necessary to determine the frequency domain distribution range of the monitoring signal that is influenced by the target signal features. Signals other than the target signal are treated as background signals. The difference between the frequency domain distribution of the monitoring signal affected by the target signal features and the frequency domain distribution of the background signals serves as the metric for frequency-domain attention. Perform 1D frequency-domain filtering/enhancement on at each spatial point. The result will be the input for subsequent processing.
Next, extract the multi-dimensional features of the target signal in both the time domain and time-frequency domain. Introduce multi-head time-domain feature-spatial attention and perform multi-channel fusion to obtain the time-domain feature-spatial attention fusion result . Introduce multi-head time-frequency domain feature-spatial attention and perform multi-channel fusion to obtain the time-frequency domain feature-spatial attention fusion result .
Finally, combine the predictive prior information from the previous frame. and each consider inter-frame spatio-temporal prior information branch attention. Their processed results are fused to obtain the final target signal analysis and detection result .Simultaneously, update the predictive prior attention information used for processing the next frame.
3. Experiment
Heterodyne coherent detection Φ-OTDR equipment was deployed in a communication equipment room, and one core of redundant optical fiber from a 30km communication optical cable around a city’s ring expressway was connected to this equipment. This setup enabled distributed vibration signal monitoring with a spatial resolution of 12.5 m/point and a sampling frequency of 380 Hz. Using the model algorithm described in Section 2., the actual monitoring signals were analyzed, achieving applications including but not limited to road surface roughness identification (correlated with fiber structural coupling), vehicle movement tracking (associated with variable motion states of vehicle bodies), fiber projection positioning and parameter extraction, among others. Compared with traditional signal analysis frameworks, this approach achieved a higher signal-to-noise ratio in the detection and analysis of multi-modal weak signals.
3.1. Frequency-Domain Attention
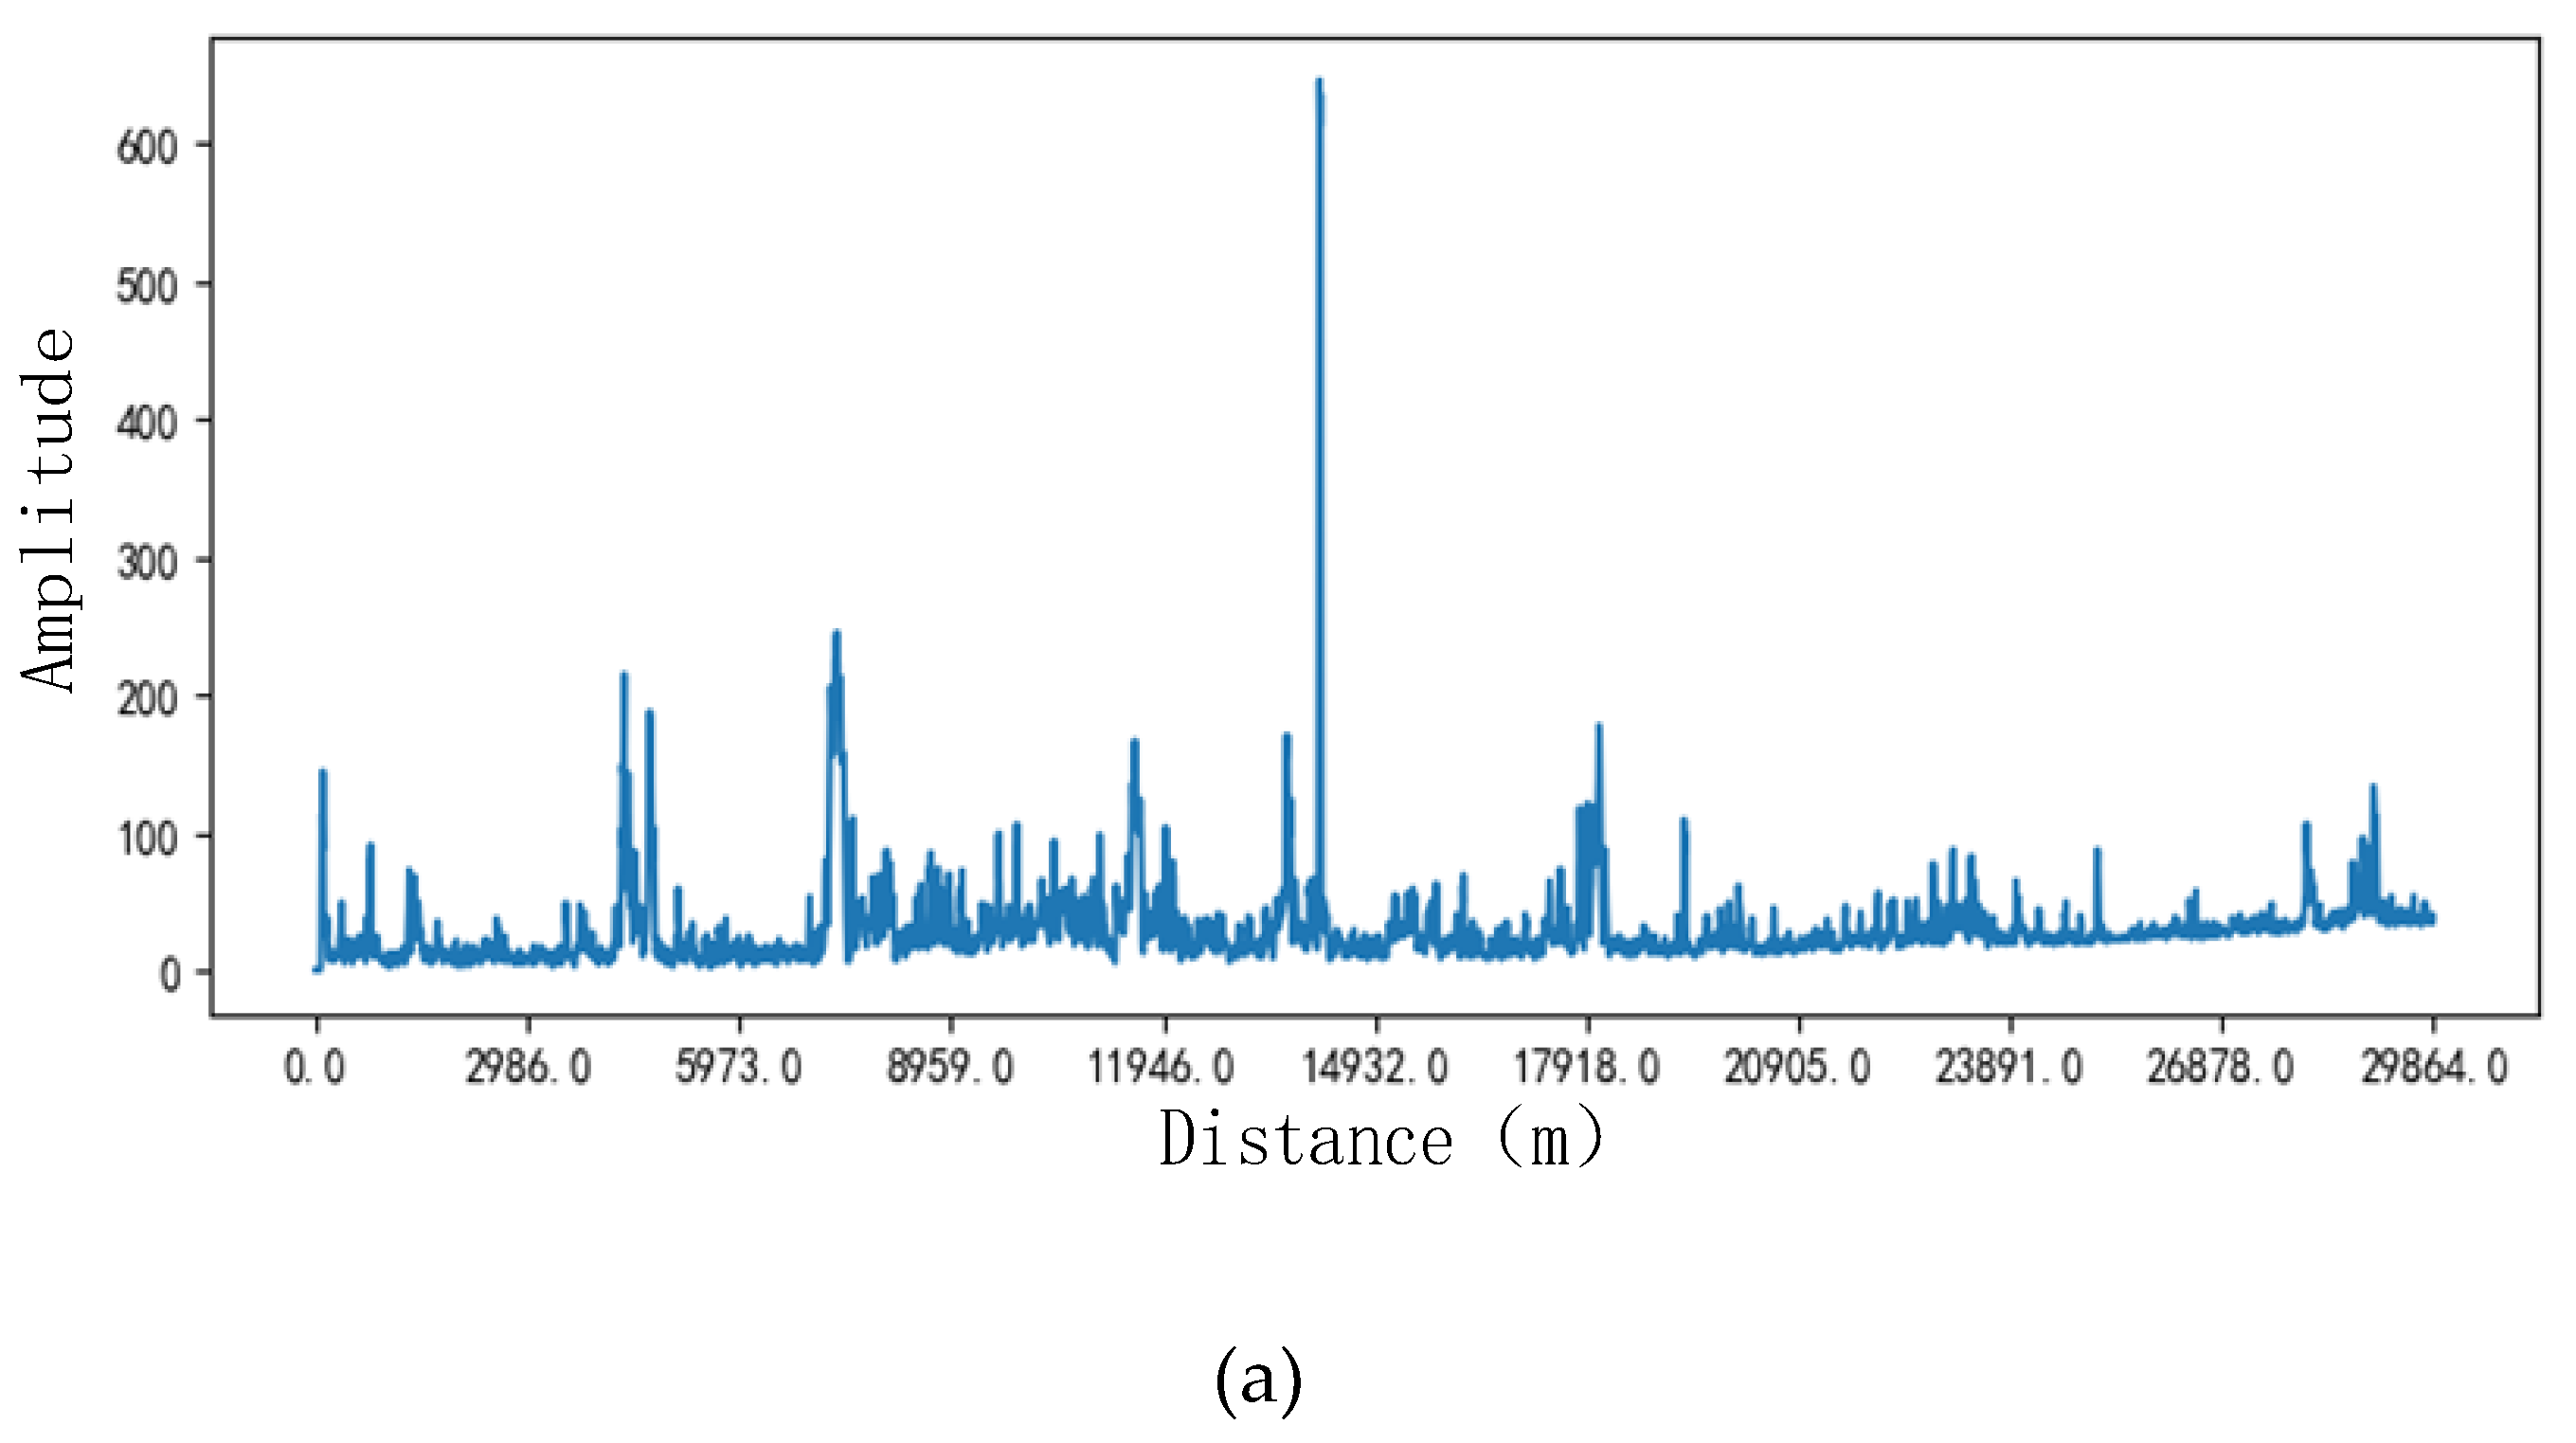
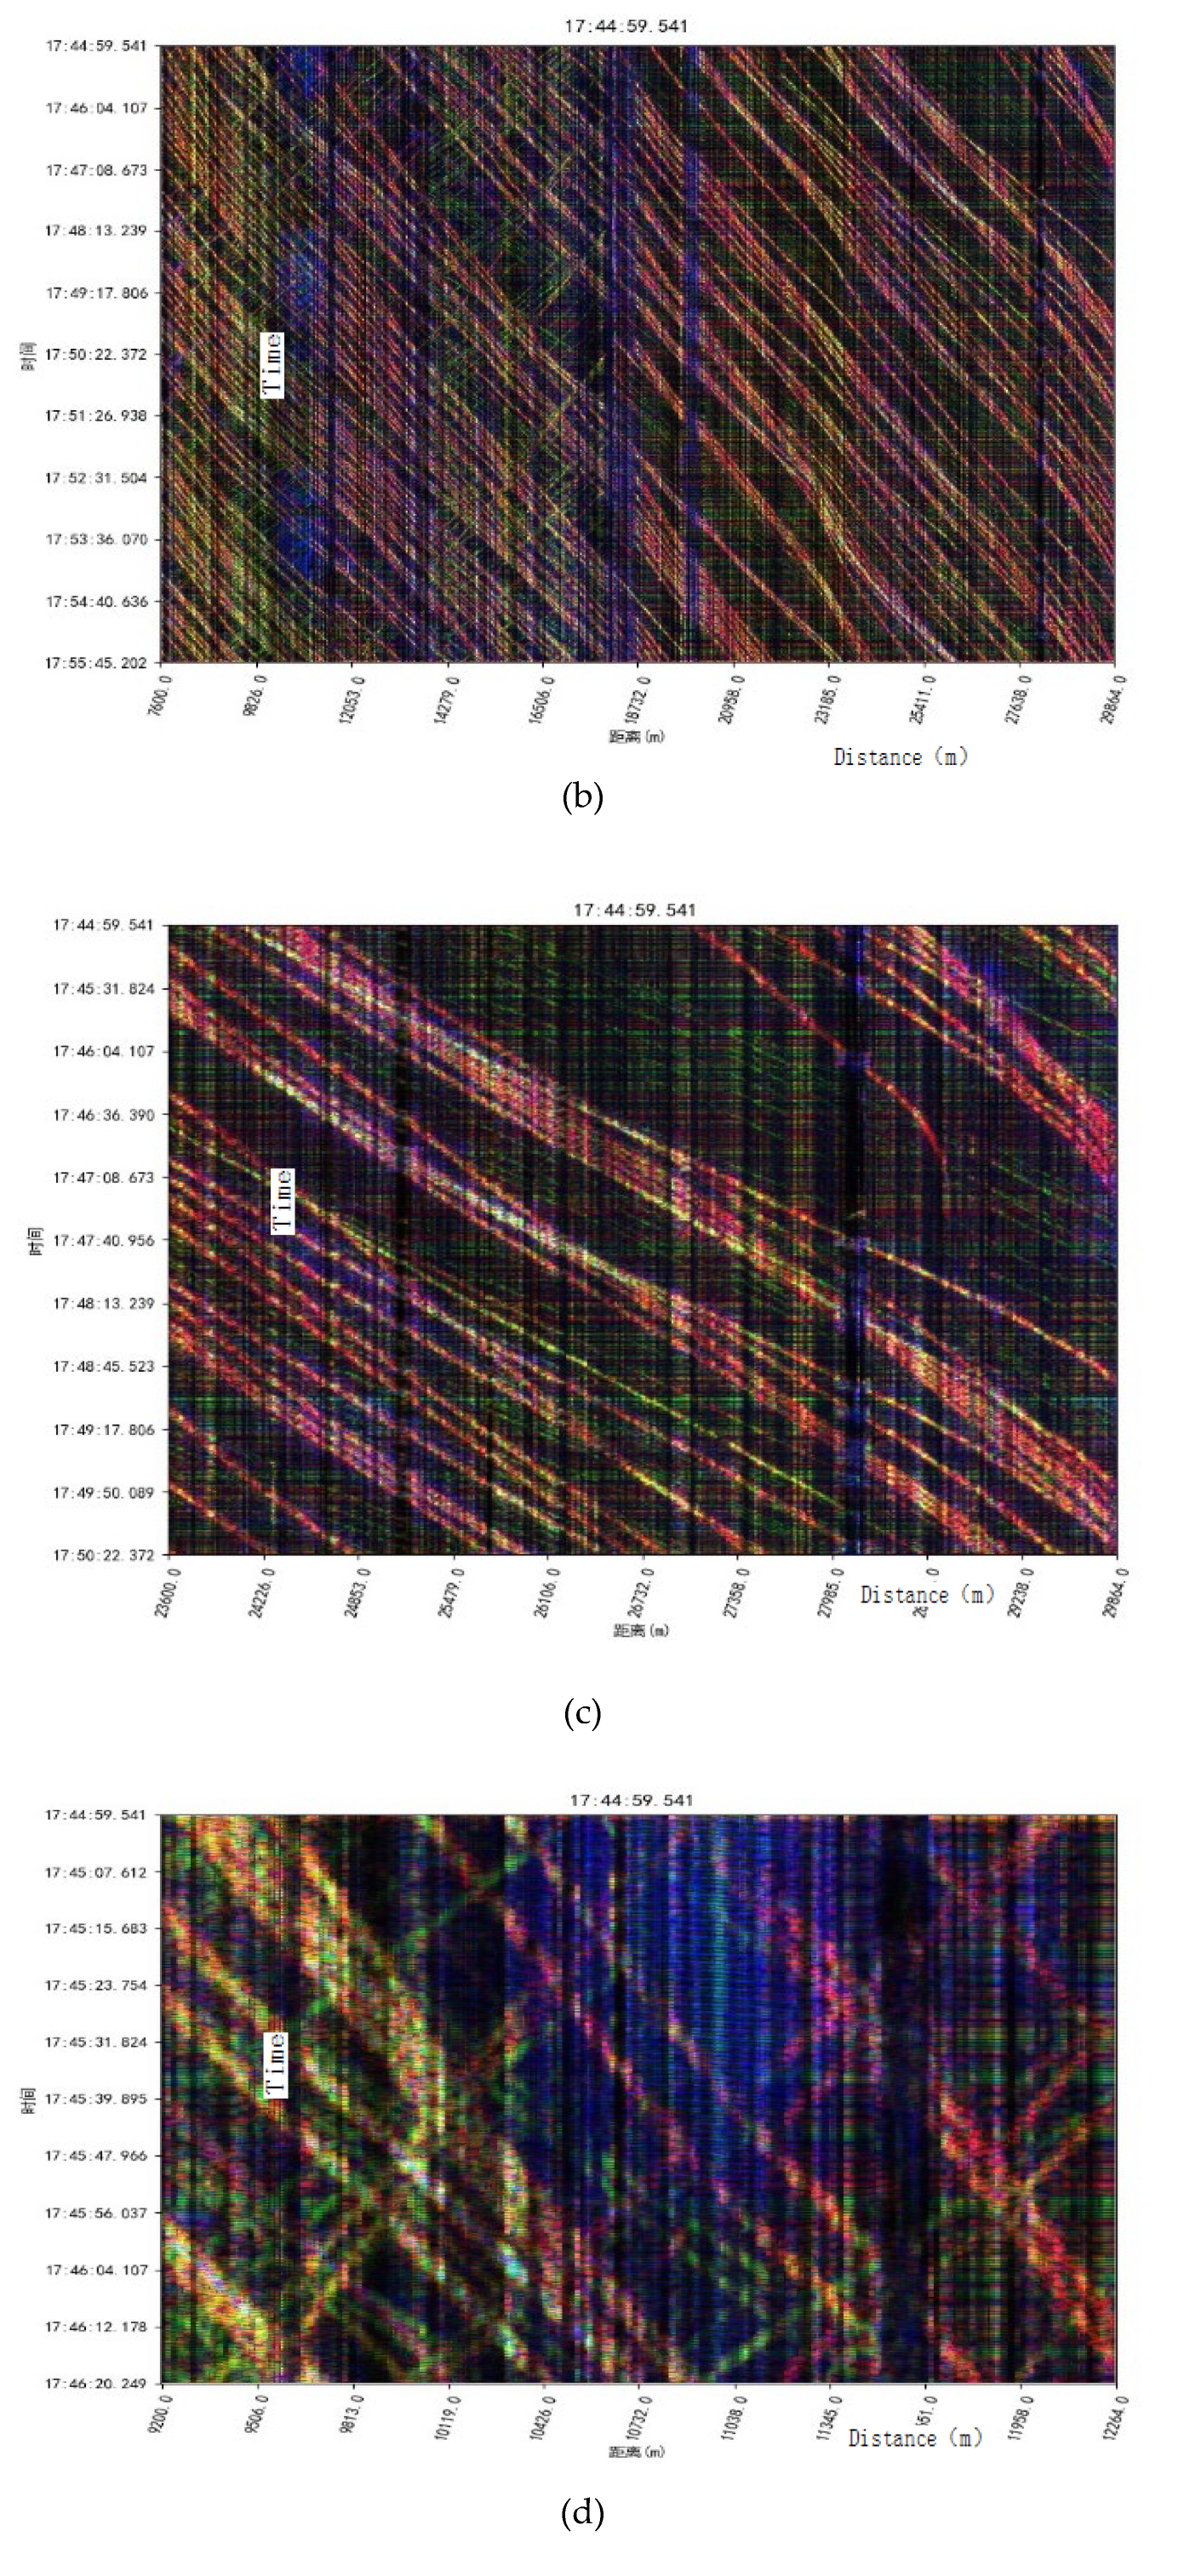
The original pulses collected by the heterodyne coherent detection Φ-OTDR follow the pattern of Eq. (1), exhibiting exponential attenuation in space, as shown in Figure 4(a). Initially, the fiber attenuation coefficient was identified, and spatial attenuation coefficient compensation was performed to obtain pulse signals with a unified range after attenuation correction, as depicted in Figure 4(b). A preliminary analysis of the compensated signal in both the time and frequency domains indicated that signals above 60 Hz contained minimal useful information. Consequently, a 60 Hz low-pass filter was applied to the original signal, followed by downsampling at a sampling frequency of 126.8 Hz. This resulted in a signal with a maximum frequency of 63.4Hz, which was used as the input for subsequent signal analysis, as shown in Figure 4(f).
Long-term statistical analysis of measured data can obtain frequency domain distribution curves of observed signals under different scenarios. Figure 5 respectively illustrates the frequency distribution trends for background noise, road surface roughness influence, vehicle passing, and mechanical construction scenarios, respectively. Based on the obtained scenario frequency distribution trend curves, frequency bands that show significant advantages relative to other excitations/excitation additions are selected as the frequency-domain attention saliency band for that scenario. According to this criterion, the frequency-domain attention saliency bands for vehicles passing by are set as 0.1–12 Hz and 23–42 Hz; for mechanical construction, it is 57–100 Hz; and for road surface roughness, it is 25–63.4 Hz. Respectively, the above results are illustrated in Figure 5.
3.2. Road Surface Roughness Identification
Based on the analysis results from Section 3.1. and considering the noise distribution characteristics of Φ-OTDR, this study employs a combined multi-head attention mechanism (as shown in Figure 3) across three frequency bandpass channels (5–10 Hz, 25–40 Hz, and 60–100 Hz) to extract and analyze road surface roughness, vehicle trajectories, and mechanical construction signals on highways. Compared with traditional transform-filter-reconstruction methods, the proposed approach achieves a higher signal-to-noise ratio in weak signal extraction and analysis without significantly increasing computational complexity. The results are presented using a multi-channel color image fusion visualization method.
Figure 6 displays the results obtained from the traditional wavelet transform-based multi-modal signal analysis method. In this approach, a 7-level decomposition with the db6 wavelet basis is employed. By suppressing abnormal coefficients, noise reduction is achieved while reconstructing road surface roughness information. However, this method fails to effectively separate mechanical construction signals from vehicle trajectory signals.
Figure 7 illustrates the results obtained using the proposed combined multi-head attention mechanism for multi-modal signal analysis. The analysis results from three frequency bands (5-10 Hz, 25-40 Hz, and 60-100 Hz) are respectively assigned to red, green, and blue channels to form a composite visualization image. Compared with the results in Figure 6, this approach not only successfully separates mechanical construction signals (blue) from vehicle trajectory signals, but also effectively extracts weak signals from distant vehicles (displayed as thin green lines). These weak signals were entirely masked by stronger signal interference and rendered undetectable in Figure 6.
4. Conclusion
This study establishes an extrapolated coherent detection Φ-OTDR DVS fiber-environment coupled vibration observation model and innovatively proposes an application-scenario-driven combined multi-head attention mechanism framework for DVS signal analysis. This framework successfully enables scenario-guided multi-modal analysis of DVS signals. To validate the effectiveness of the proposed method, experiments were conducted using signals collected from a 30 km optical cable along an urban ring expressway across multiple typical application scenarios. These scenarios specifically included road surface roughness identification, detection and localization of construction machinery operations, as well as identification of vehicle trajectory projections along the fiber and related parameter extraction. The experimental results comprehensively demonstrate the feasibility and effectiveness of the proposed method, which achieves superior performance in multi-modal weak signal extraction and analysis in terms of signal-to-noise ratio.
Notably, the introduced attention mechanism exhibits significant advantages. It enables computational resources to precisely focus on application-relevant signals during initial processing stages, substantially enhancing the real-time performance of multi-modal signal analysis.
In conclusion, the proposed application-scenario-driven combined multi-head attention framework for DVS signal analysis shows promise as a universal and efficient real-time processing solution for multi-modal DVS signal analysis in complex environments, offering novel approaches and methodologies for related research fields and practical applications.
References
- Zhang, X.P.; Zhang, Y.X.; Wang, L. Current Status and Future of Research and Applications for Distributed Fiber Optic Sensing Technology. Acta Optica Sinica 2024, 44, 0106001. [Google Scholar]
- LINDSEY, N.J. Fiber-optic Seismology in Theory and Practice. PhD dissertation, University of California, Berkeley, Berkeley, California, USA, 2019.
- LI, J.; WANG, Y.; WANG, P. Pattern Recognition for Distributed Optical Fiber Vibration Sensing, A Review. IEEE Sensors Journal, 2021, 21, 11983–11998. [Google Scholar] [CrossRef]
- Wang, W.J.; Guo, J.F.; Yin, H. Identification of Rainwater Signal for External Damage Monitoring of Fiber Optic Cable. Laer & Infrared 2022, 52, 1042–1047. [Google Scholar]
- Wang, W.J.; Guo, J.F.; Yin, H. Application of Optical Sensing Technology in Monitoring System for Preventing External Breaking of Optical Cable in Power Pipeline. Optics & Optoelectronic Technology 2021, 19, 34–37. [Google Scholar]
- Yang, Y.; Yan, Z.C.; Guo, Z. Research on the Identification Algorithm of Optical Fiber Anti-Breakthrough Considering Vertical Distance Classification. Optics & Optoelectronic Technology 2021, 19, 41–47. [Google Scholar]
- Zhang, J.W.; Lan, B.; Huang, J.G. Monitoring and Early Warning System for Anti-breakage of Optical Cable based on Distributed Optical Fiber Vibration Sensing. Study on Optical Communications 2022, 233, 53–57. [Google Scholar]
- Wu, J. Key Technologies Research on Signal Detection and Recognition in Φ-OTDR Distributed Optical Fiber Vibration Sensing System. PhD dissertation, Anhui University, Hefei, Anhui, China, 2019.
- Shan, Y.Y. Research of Distributed Optical Fiber Vibration Sensing System Based on Φ-OTDR. PhD dissertation, Nanjing University, Nanjing, Jiangsu, China, 2019.
- Li, H.X.; Li, J.H; Li, W.L. A Visual Model Based on Attention Mechanism and Convolutional Neural Network. Acta Metrologica Sinica 2021, 42, 840–845. [Google Scholar]
- Li, Z.X.; Wei, H.Y.; Huang, F.C. Combine Visual Features and Scene Semantics for Image Captioning. Chinese Journal of Computers 2020, 43, 1624–1640. [Google Scholar]
- Zhang, Y.Q.; Li, G.H; Lei, J. FF-CAM: Crowd Counting Based on Frontend-Backend Fusing Through Channel-Attention Mechanism. Chinese Journal of Computers 2021, 44, 304–317. [Google Scholar]
- Yao, R.; Xia, S.X.; Zhou, Y. Spatial-temporal video object segmentation with graph convolutional network and attention mechanism. Journal of Image and Graphics 2021, 26, 2376–2387. [Google Scholar] [CrossRef]
- LU, P.; LALAM, N.; BADAR, M. Distributed optical fiber sensing: Review and perspective. Applied Physics Reviews 2019, 041302. [Google Scholar] [CrossRef]
- Zhang, X.P.; Ding, Z.W; Hong, R. Phase Sensitive Optial Time-Domain Reflective Distributed Optical Fiber Sensing Technology. Acta Optica Sinica 2021, 41, 0106004. [Google Scholar] [CrossRef]
- Li, D.B.; Lu, Q.H. Experimental modal analysis and applications; Science Press: Beijing, China, 2001. [Google Scholar]
- Zhang, G.W. Modal Parameter Automatic Identification for Structures Under Ambient Excitation and Algorithm Optimization. PhD dissertation, Chongqing University, Chongqing, China, 2012.
- FRISTON, K. The free-energy principle: a unified brain theory. Nature reviews neuroscience 2010, 11, 127–138. [Google Scholar] [CrossRef] [PubMed]
- GUO, M.H; XU, T.X; LIU, J.J. Attention mechanisms in computer vision: A survey. Computational Visual Media 2022, 8, 331–368. [Google Scholar] [CrossRef]
Figure 1.
Coherent detection Φ-OTDR system.
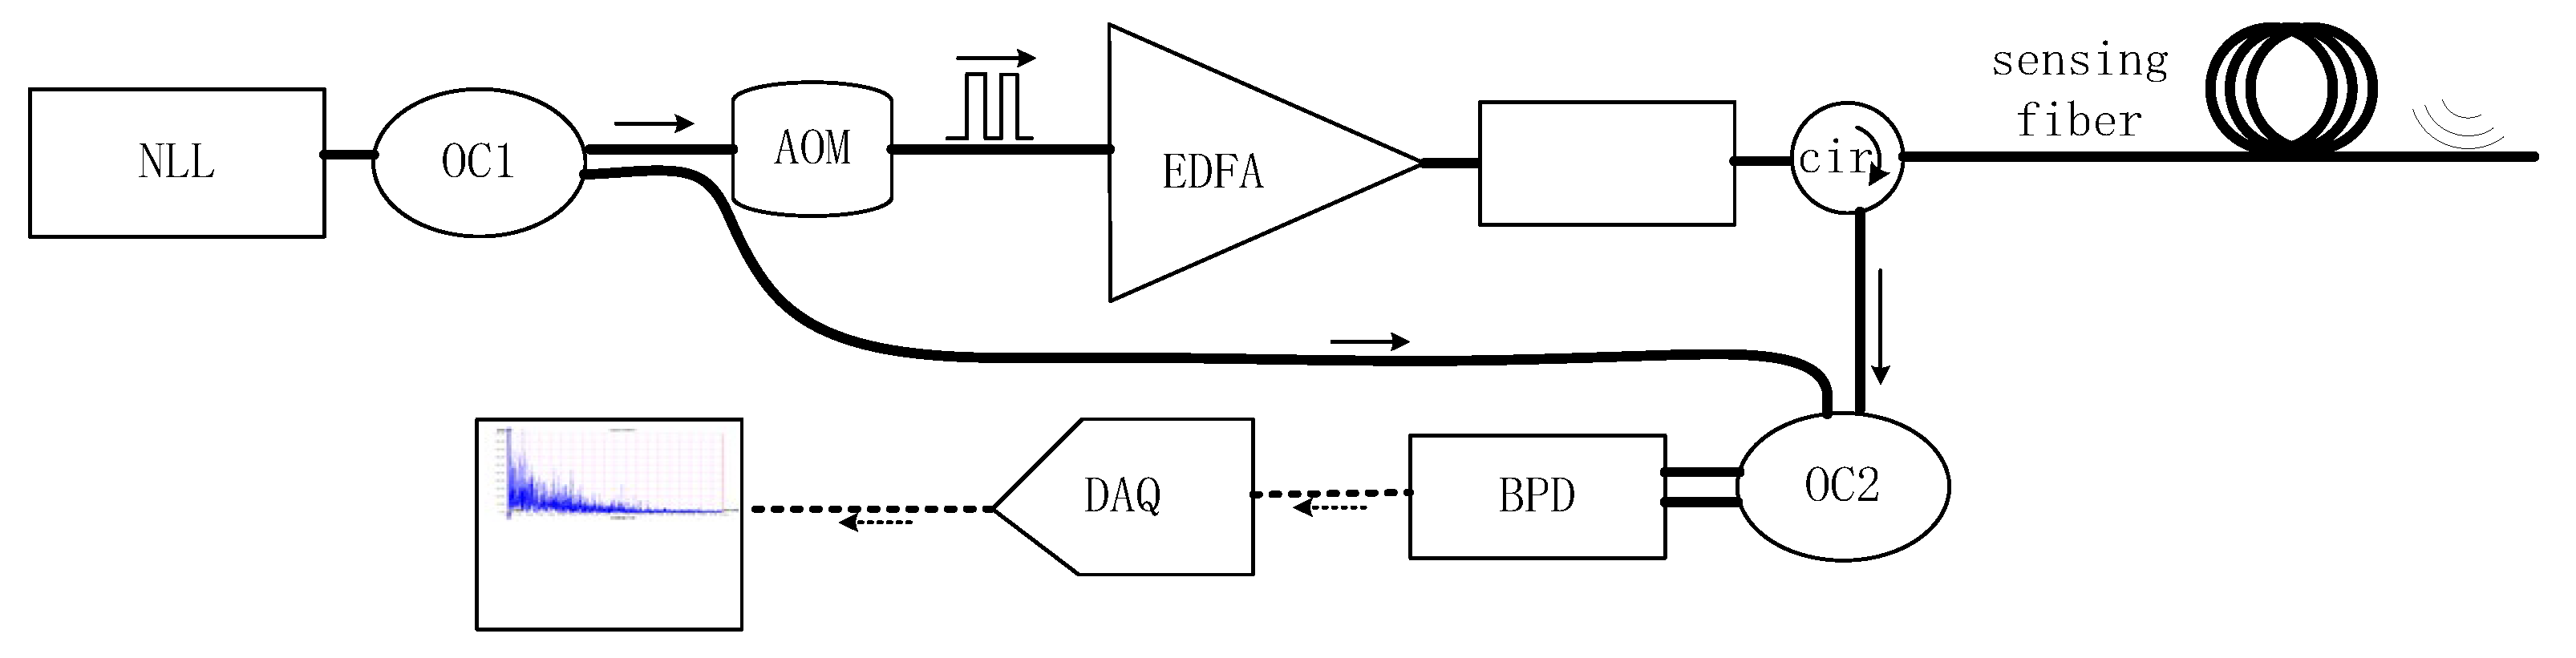
Figure 2.
Fiber-Optic Environmental Coupling Vibration DVS Observation Model.
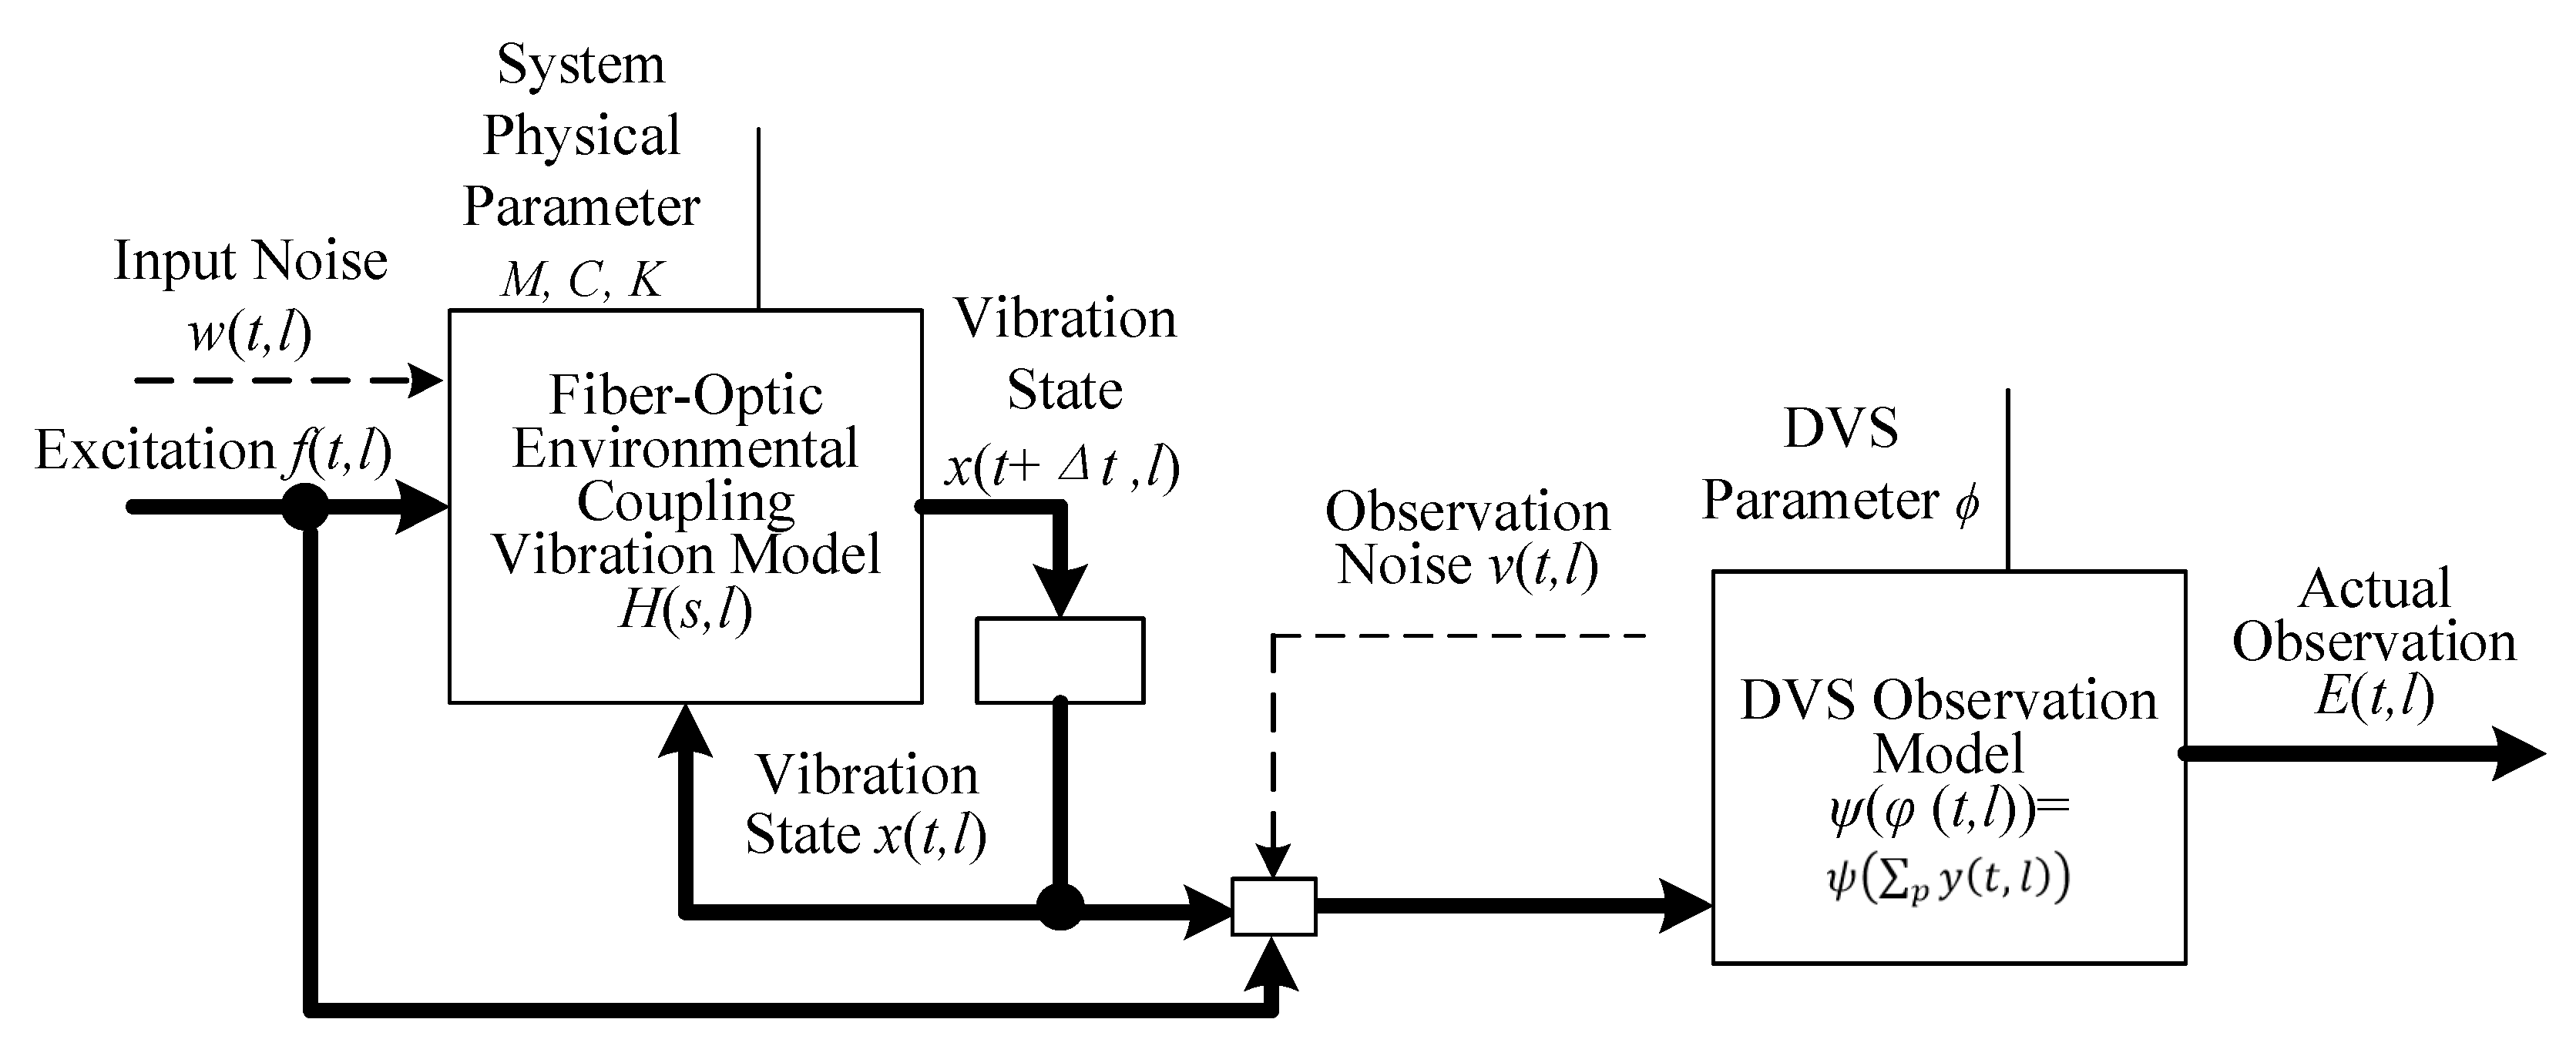
Figure 3.
Integrated Multi-Head Attention Mechanism Framework for DVS Signal Analysis.
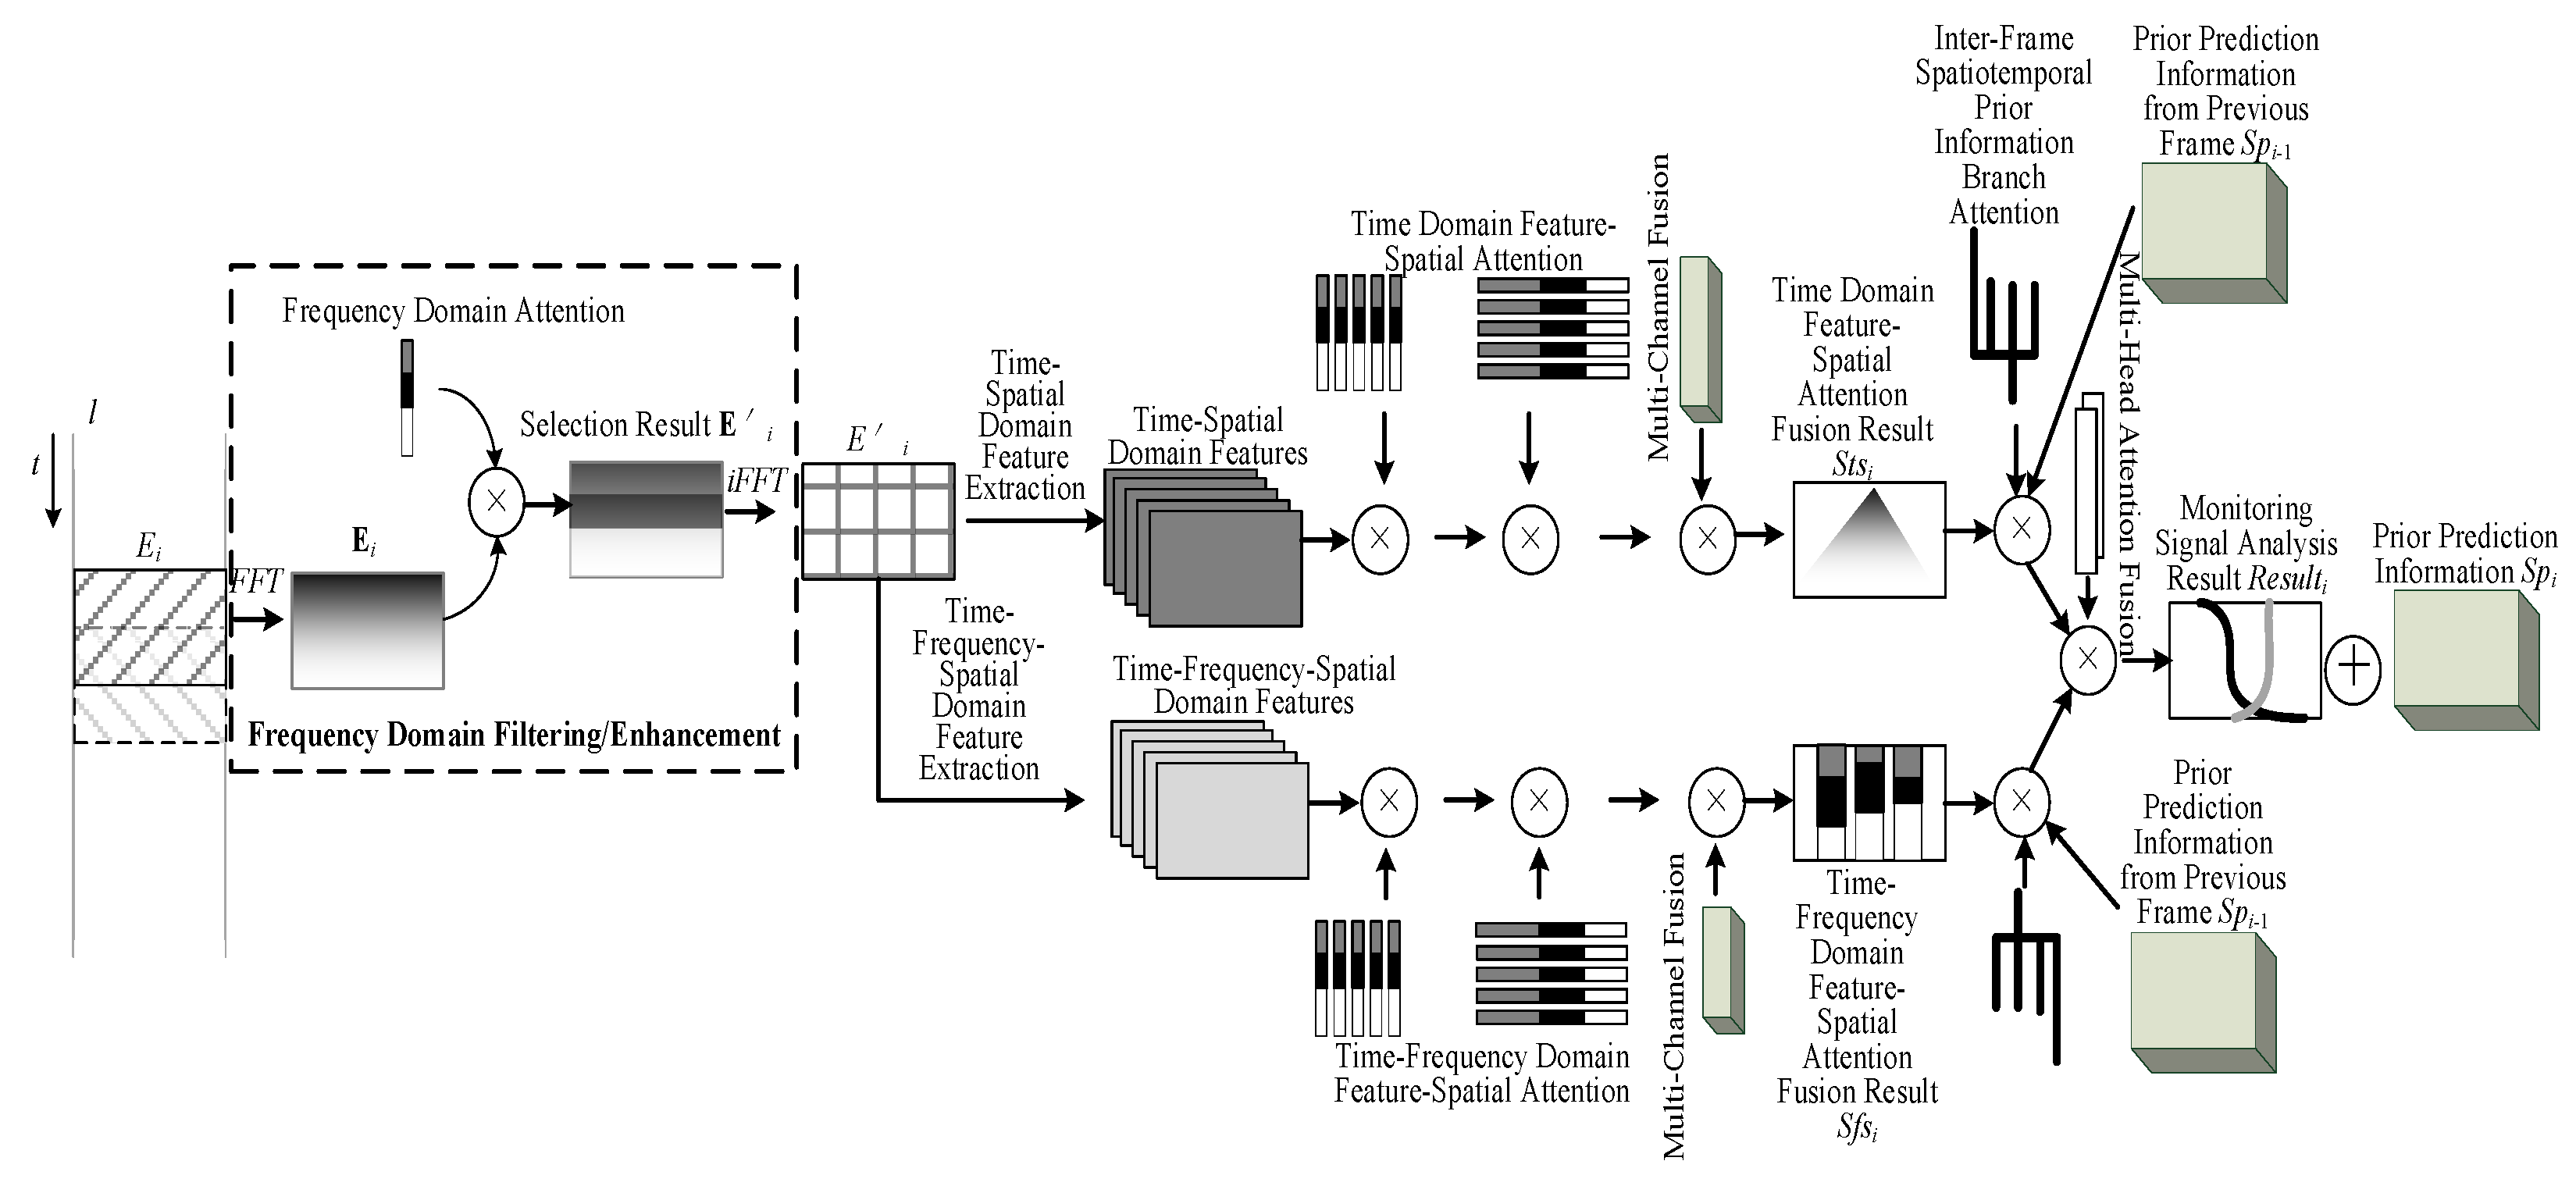
Figure 4.
DVS Monitoring Signals of a 30-km Urban Ring Expressway in a City: 15:31:35.336 to 15:32:18.380. (a)Original Pulse Signal; (b)Attenuation-Compensated Pulse Signal; (c)Frequency-Domain Energy-Spatial Distribution; (d)Time-Domain Energy-Spatial Distribution; (e)Time-Domain Energy-Spatial Distribution (Above 60 Hz); (f) Frequency-Domain Energy-Spatial Distribution of Downsampled Signal at 63.4 Hz.
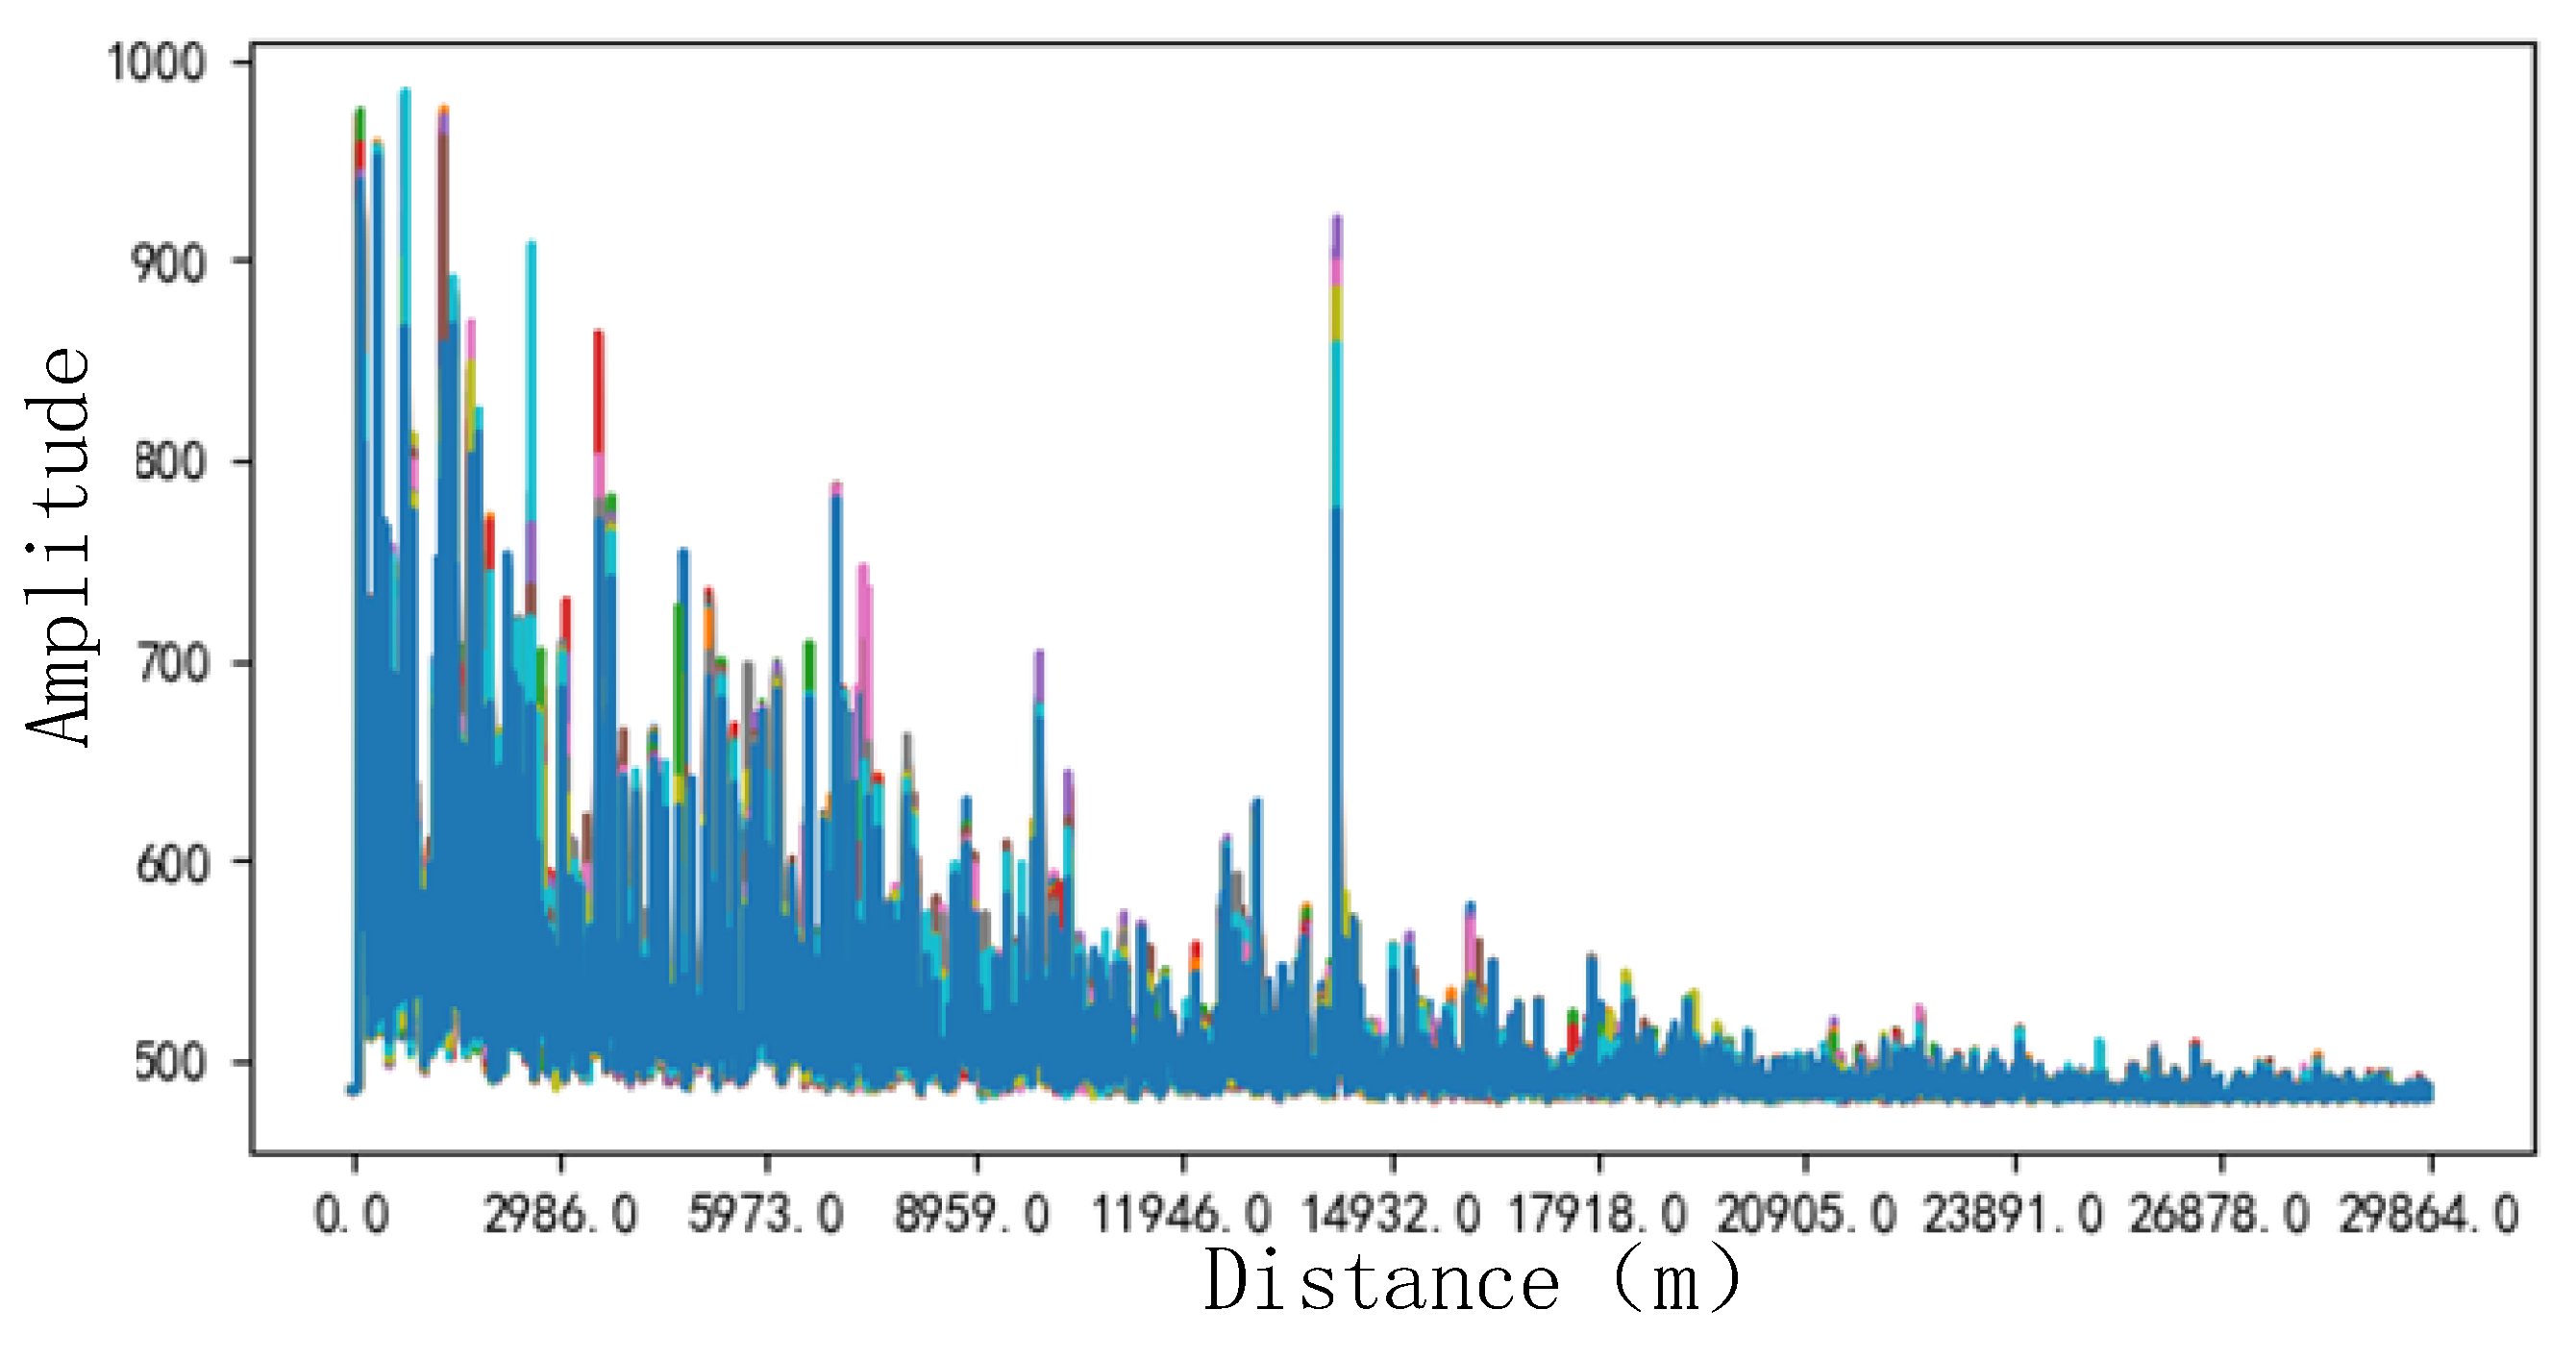
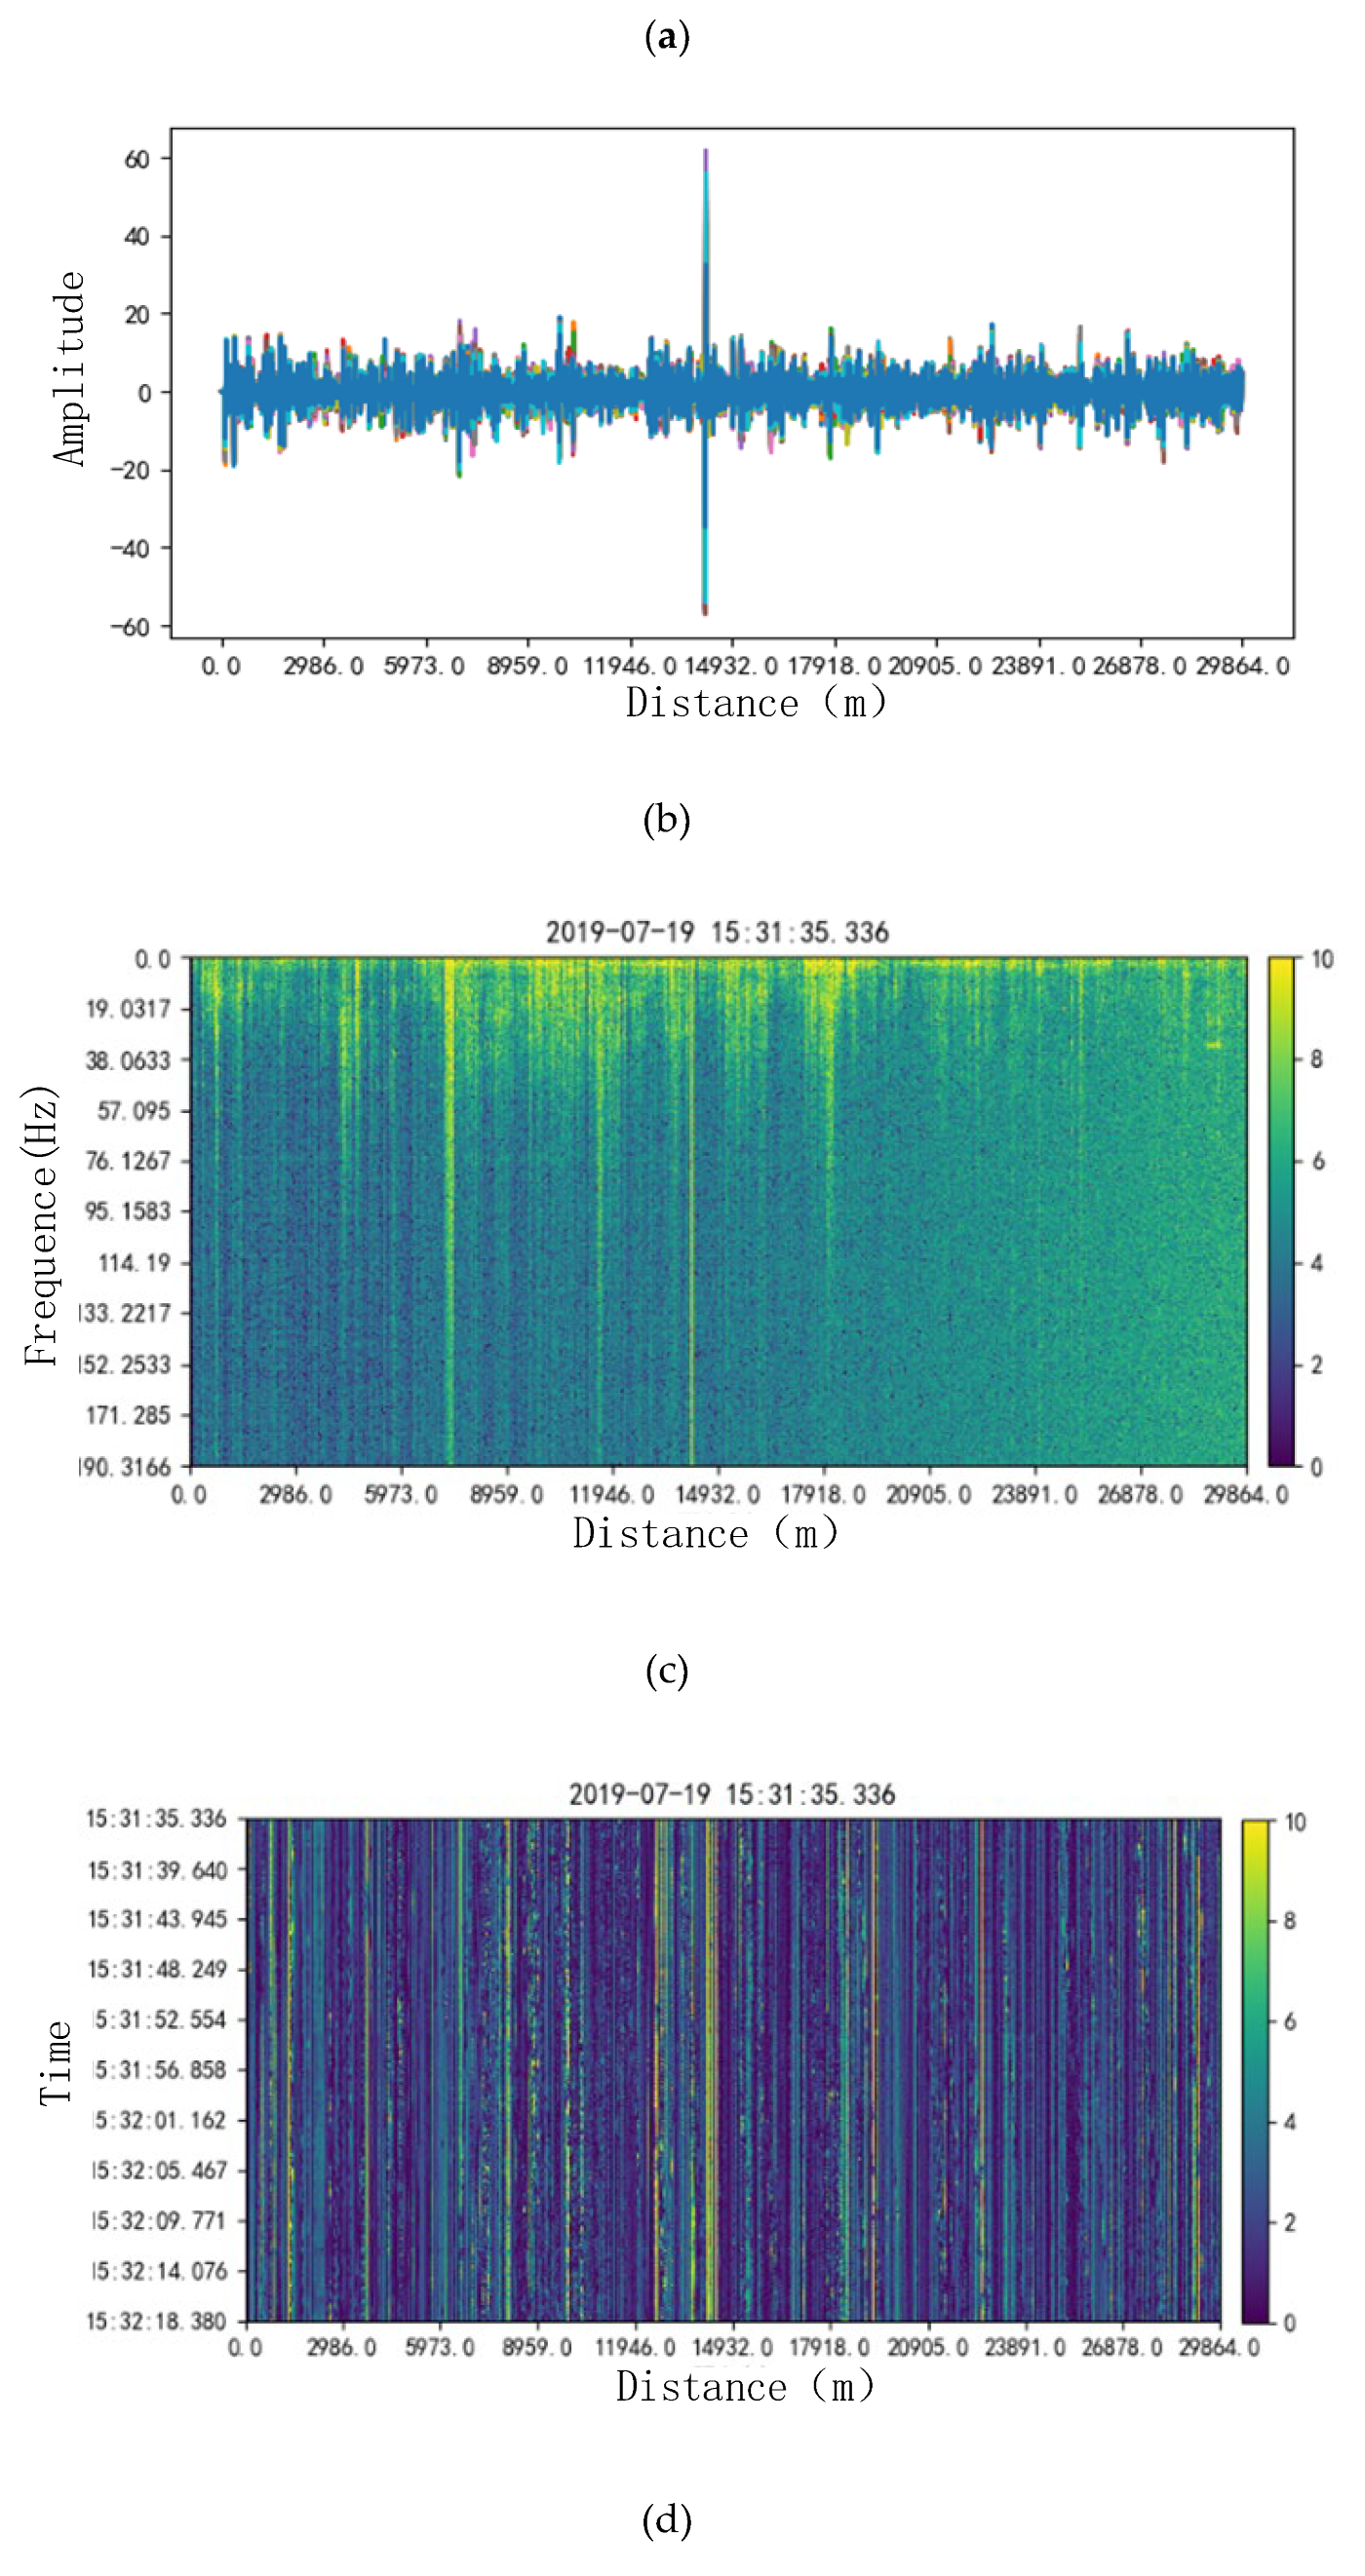
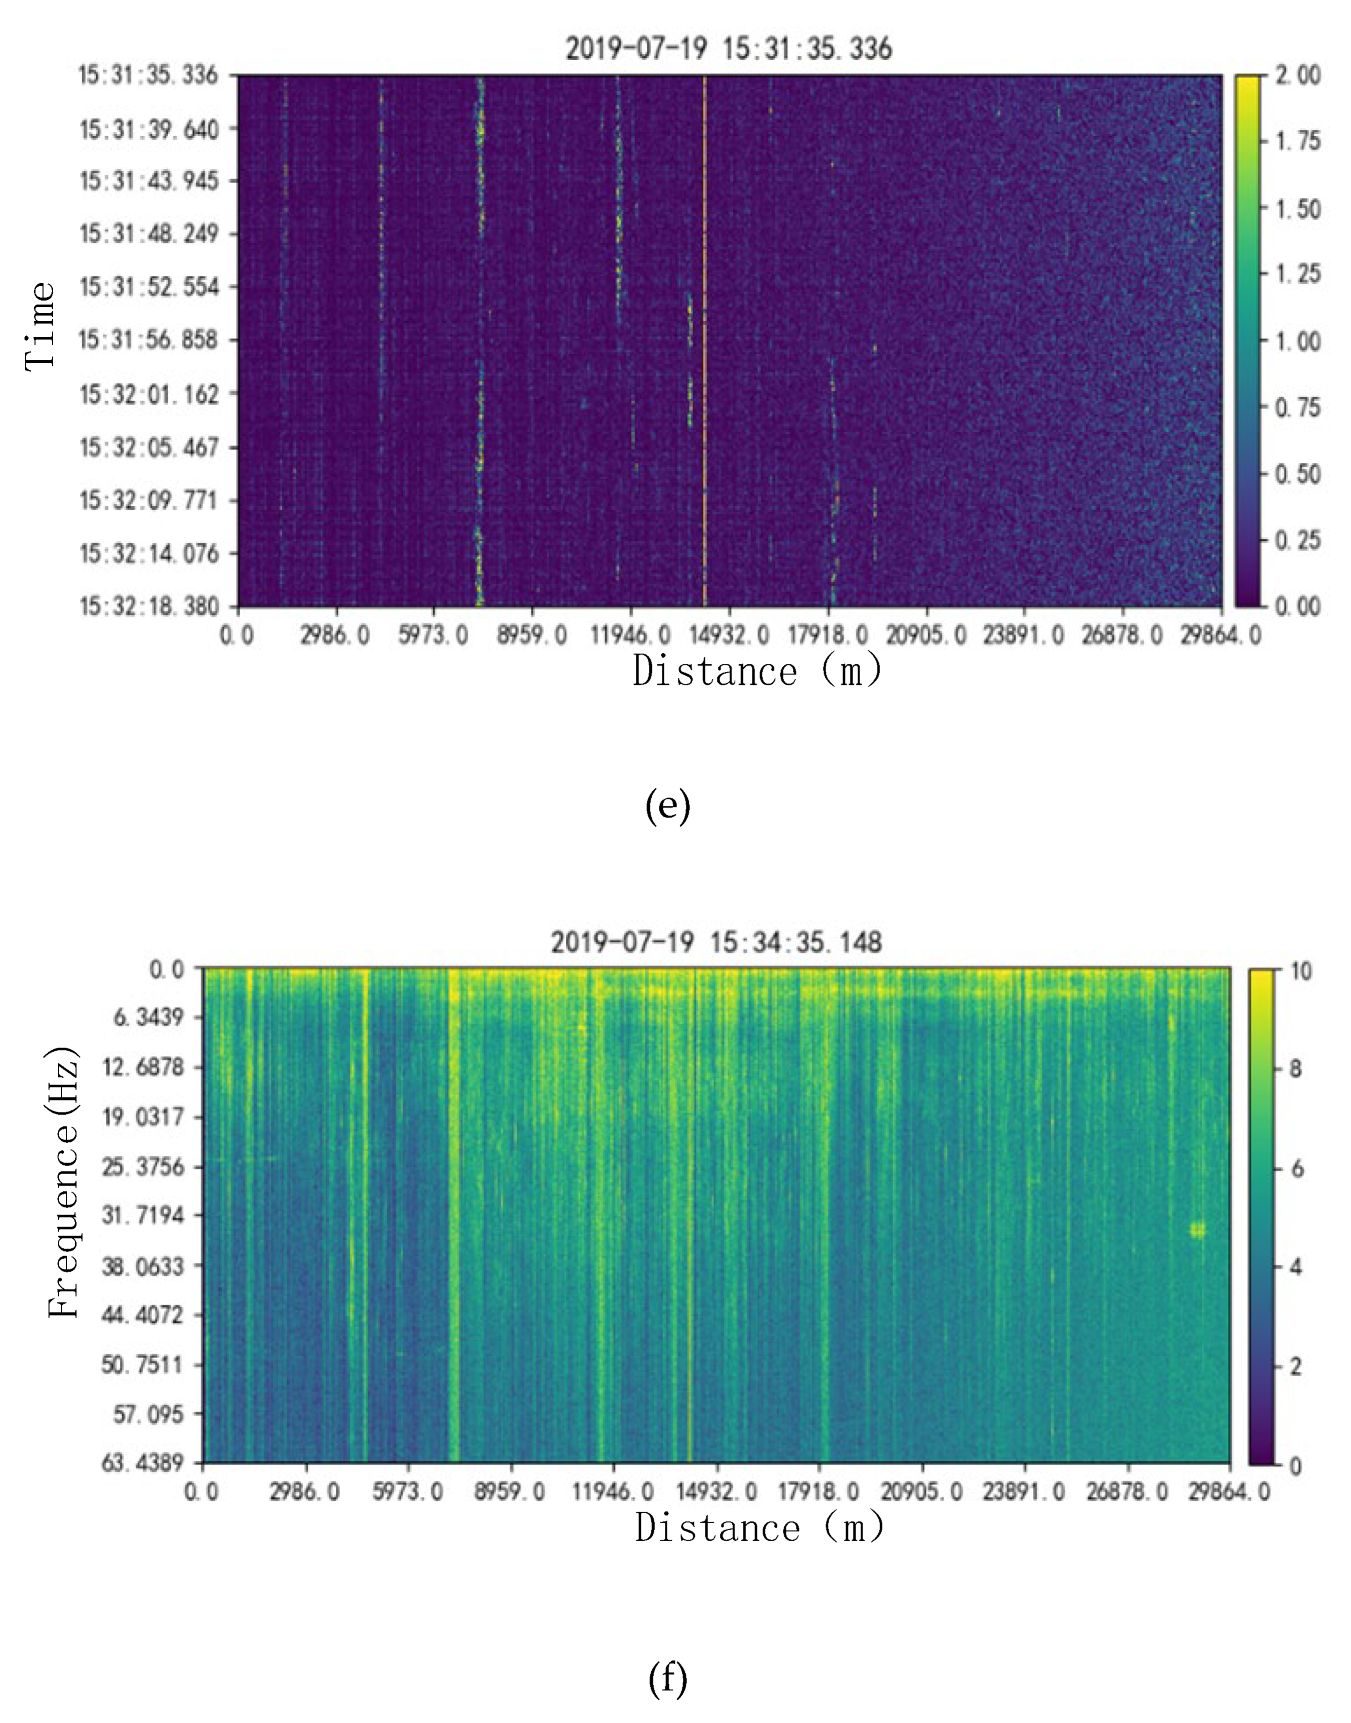
Figure 5.
Scenario-Specific Frequency Domain Distribution Trends and Frequency Domain Attention.
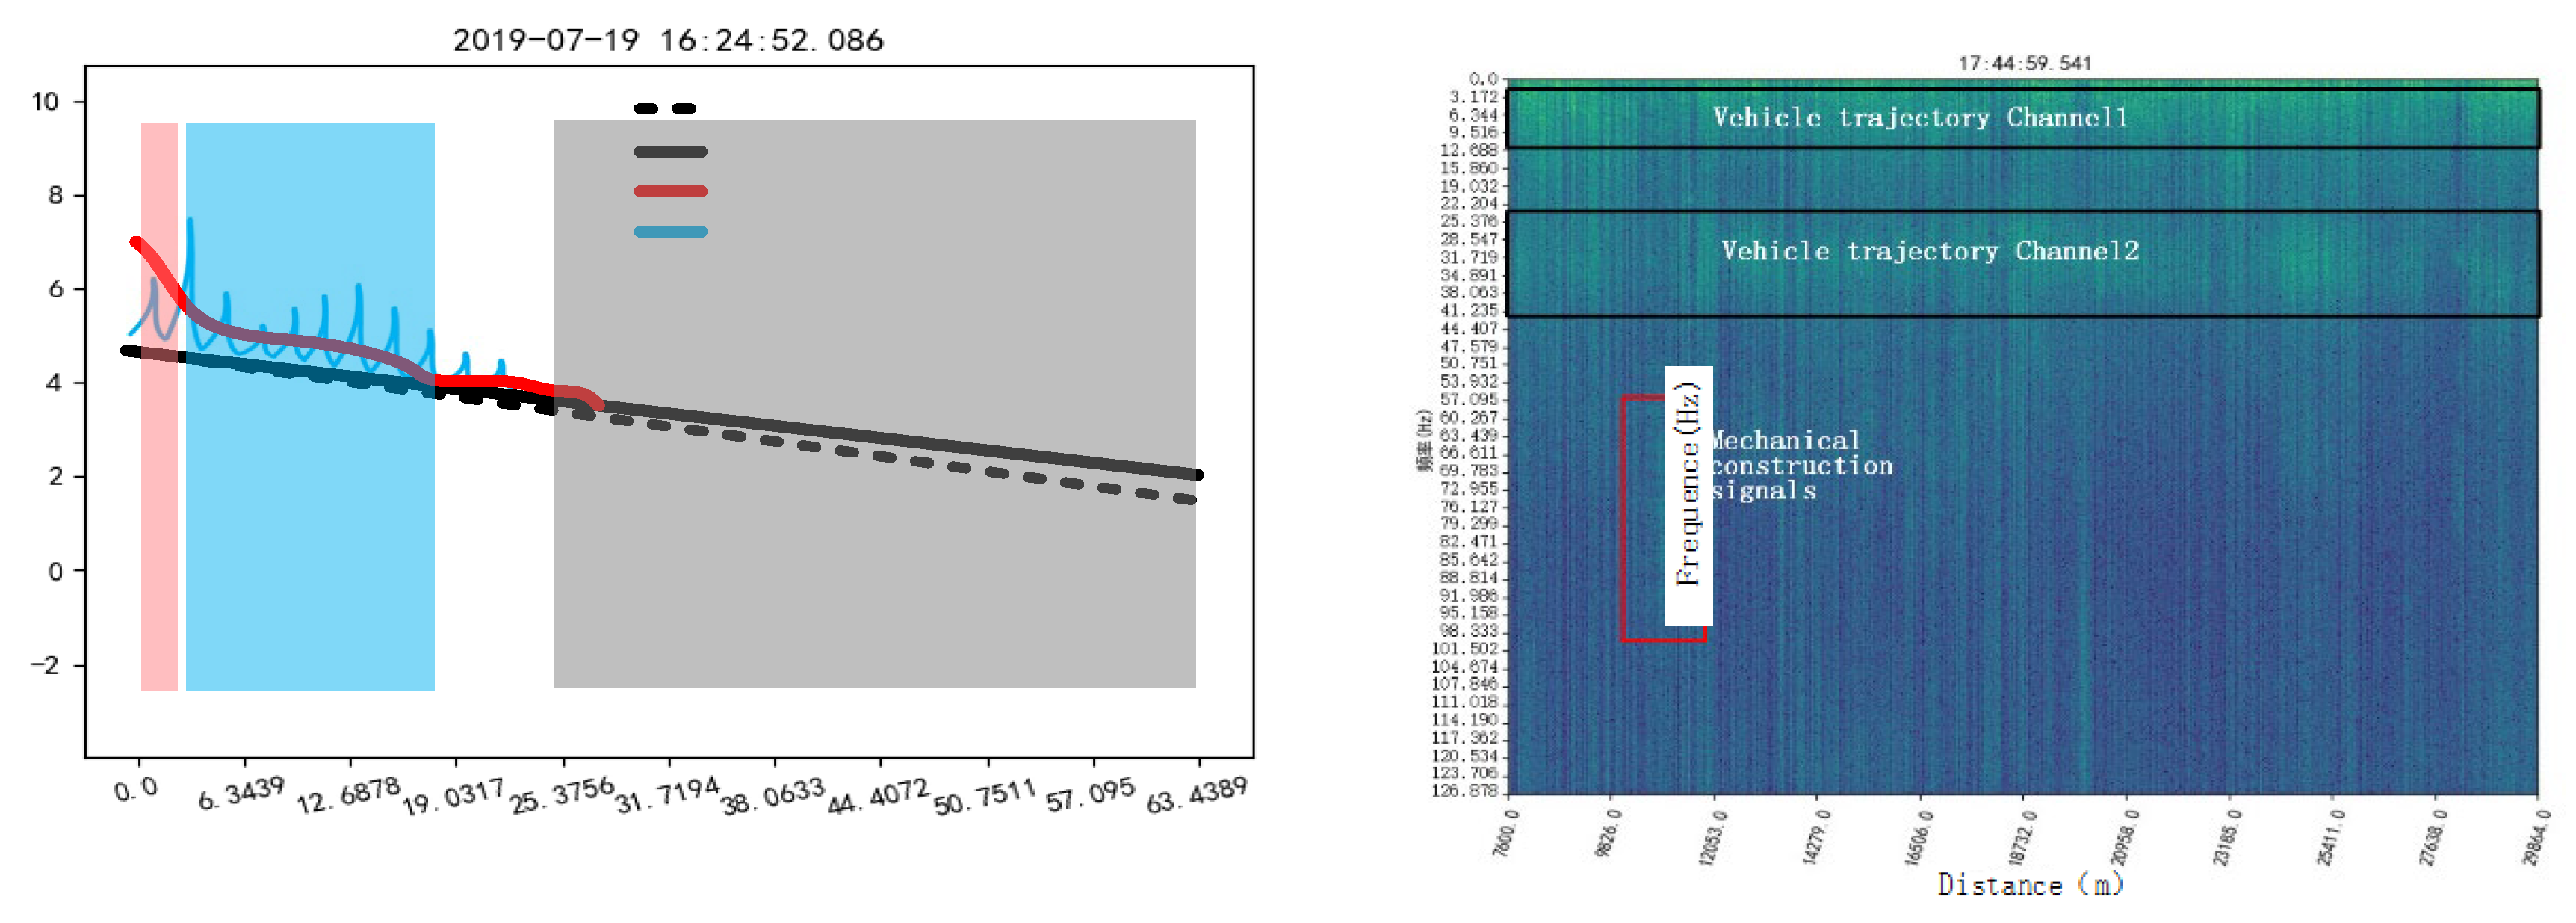
Figure 6.
Conventional wavelet-transform-based multi-modal signal analysis. (a) Denoising and Reconstruction Results Using db6 Wavelet Decomposition; (b) Extraction Results of Road Surface Roughness Information;(c) Results After Road Roughness Effect Removal;(d) Mechanical Construction Signal Details;(e) Vehicle Movement Signature Details.
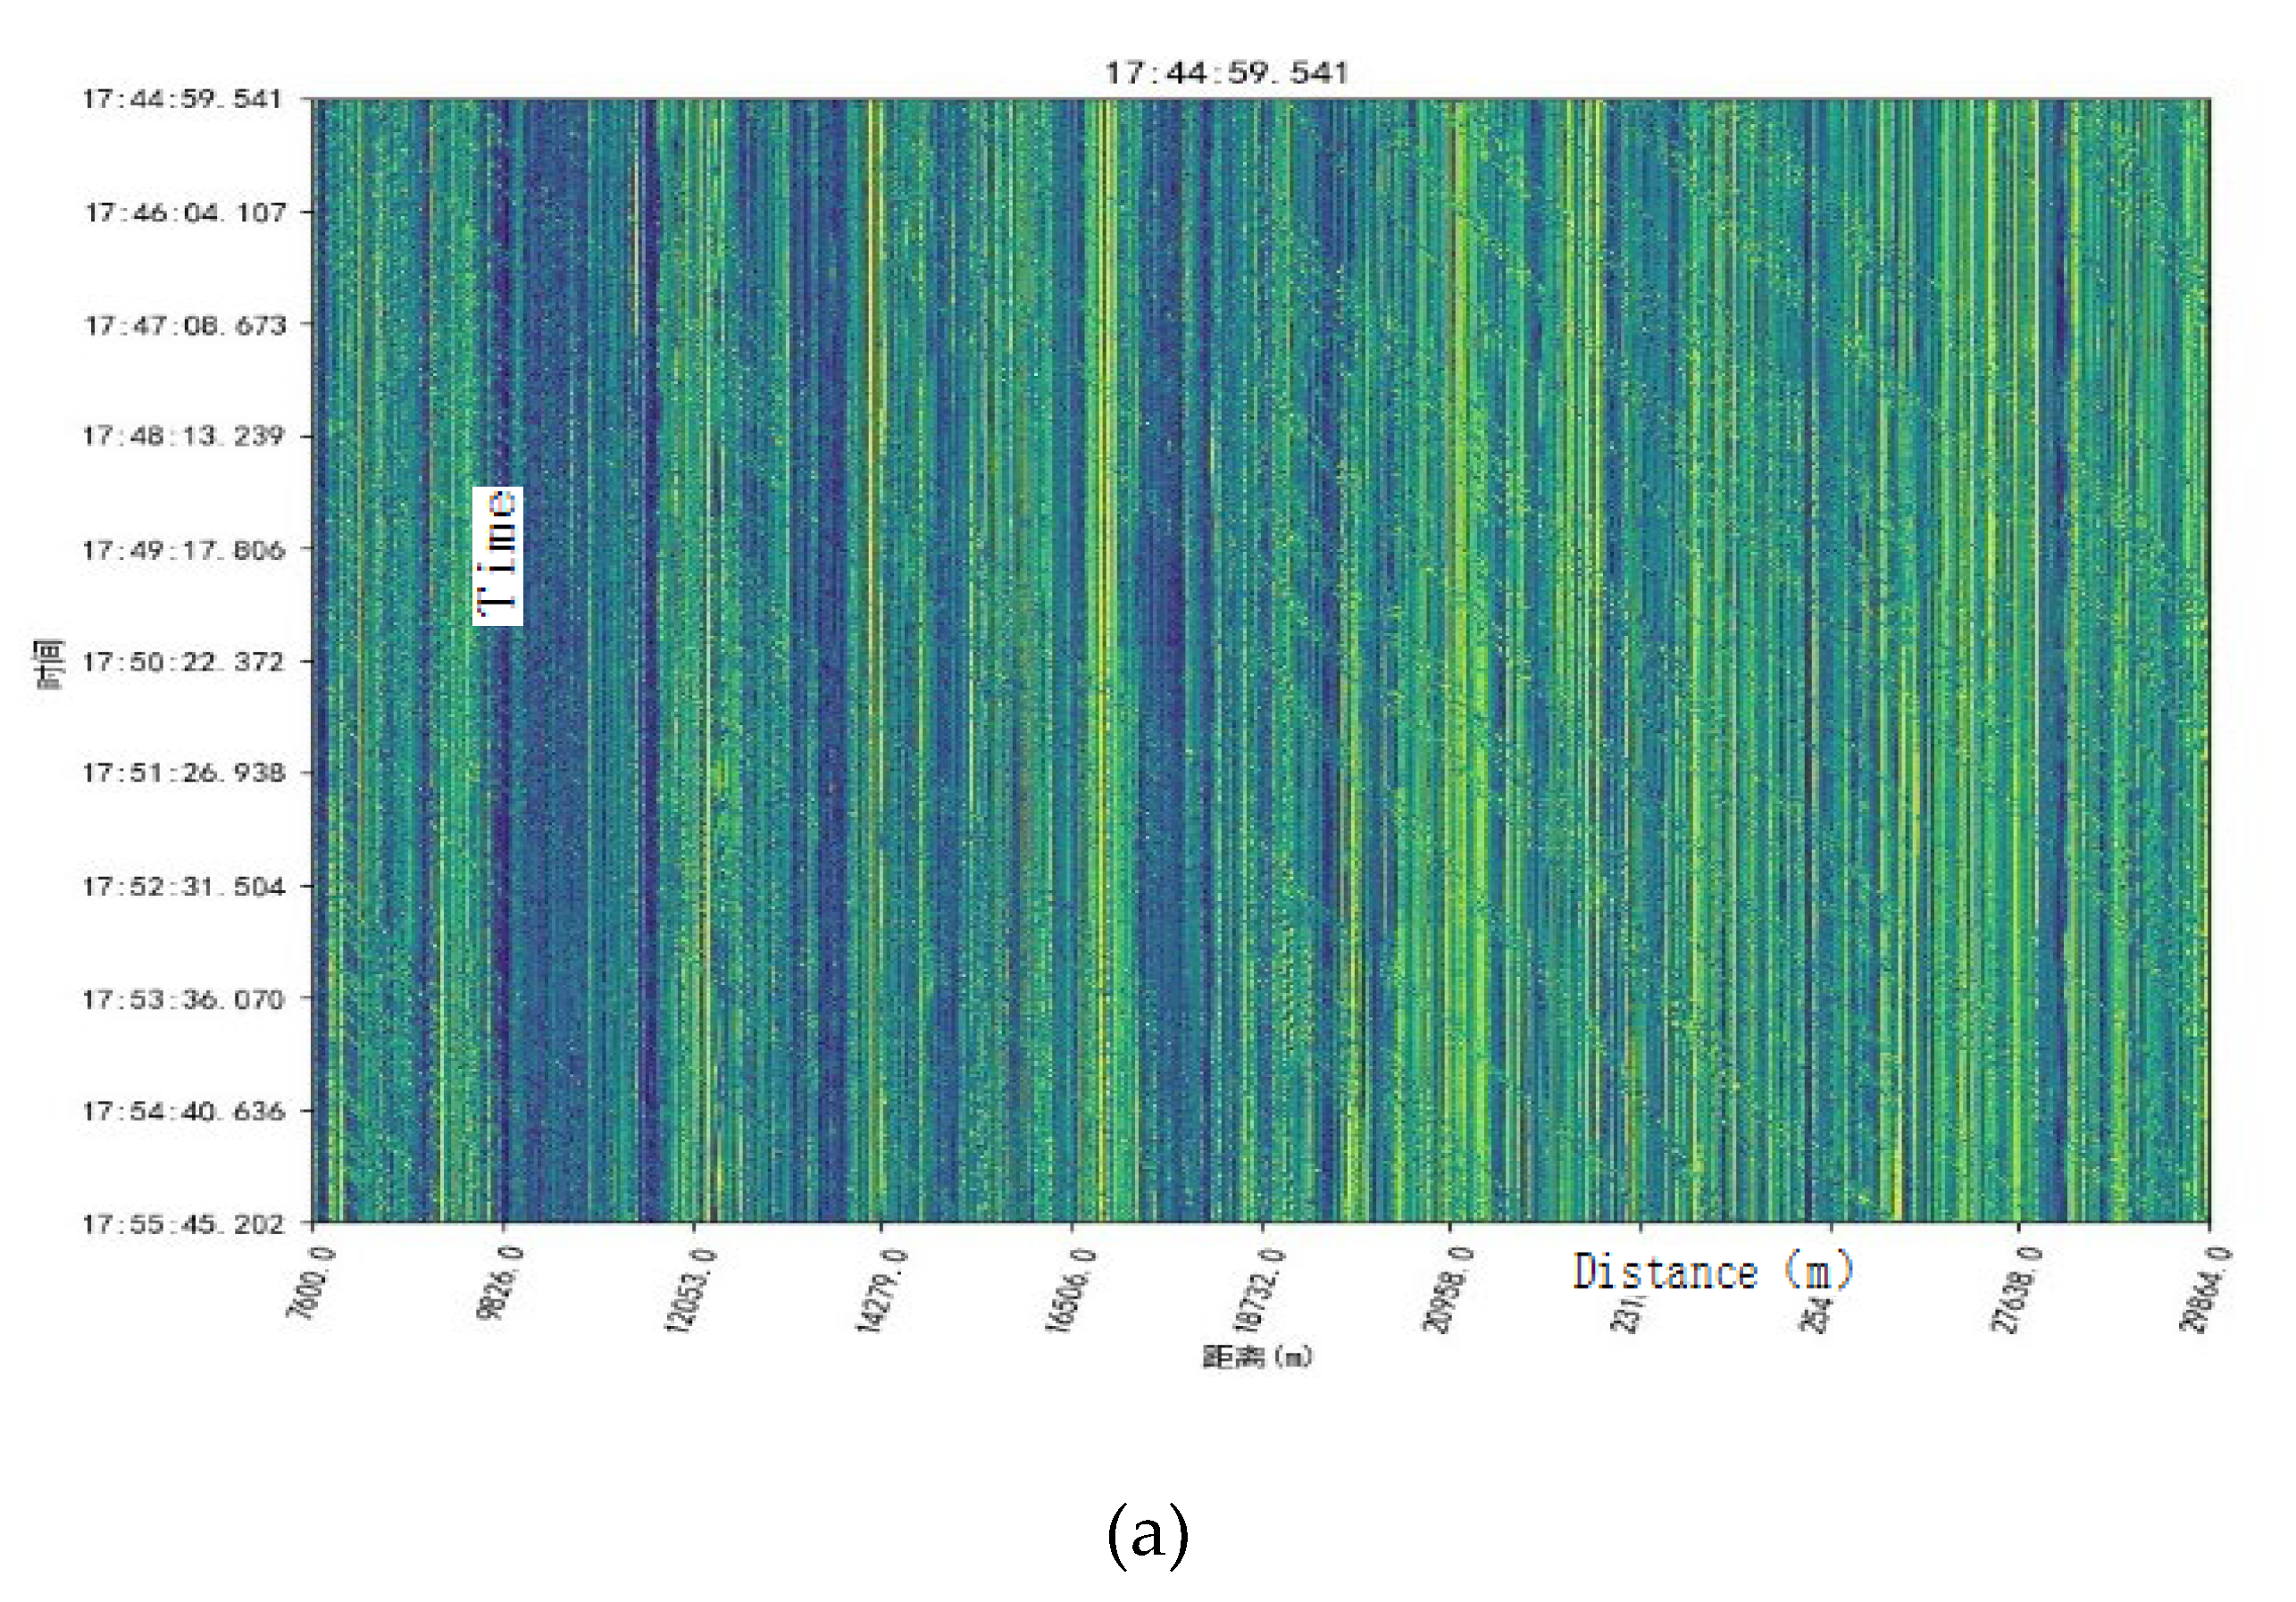
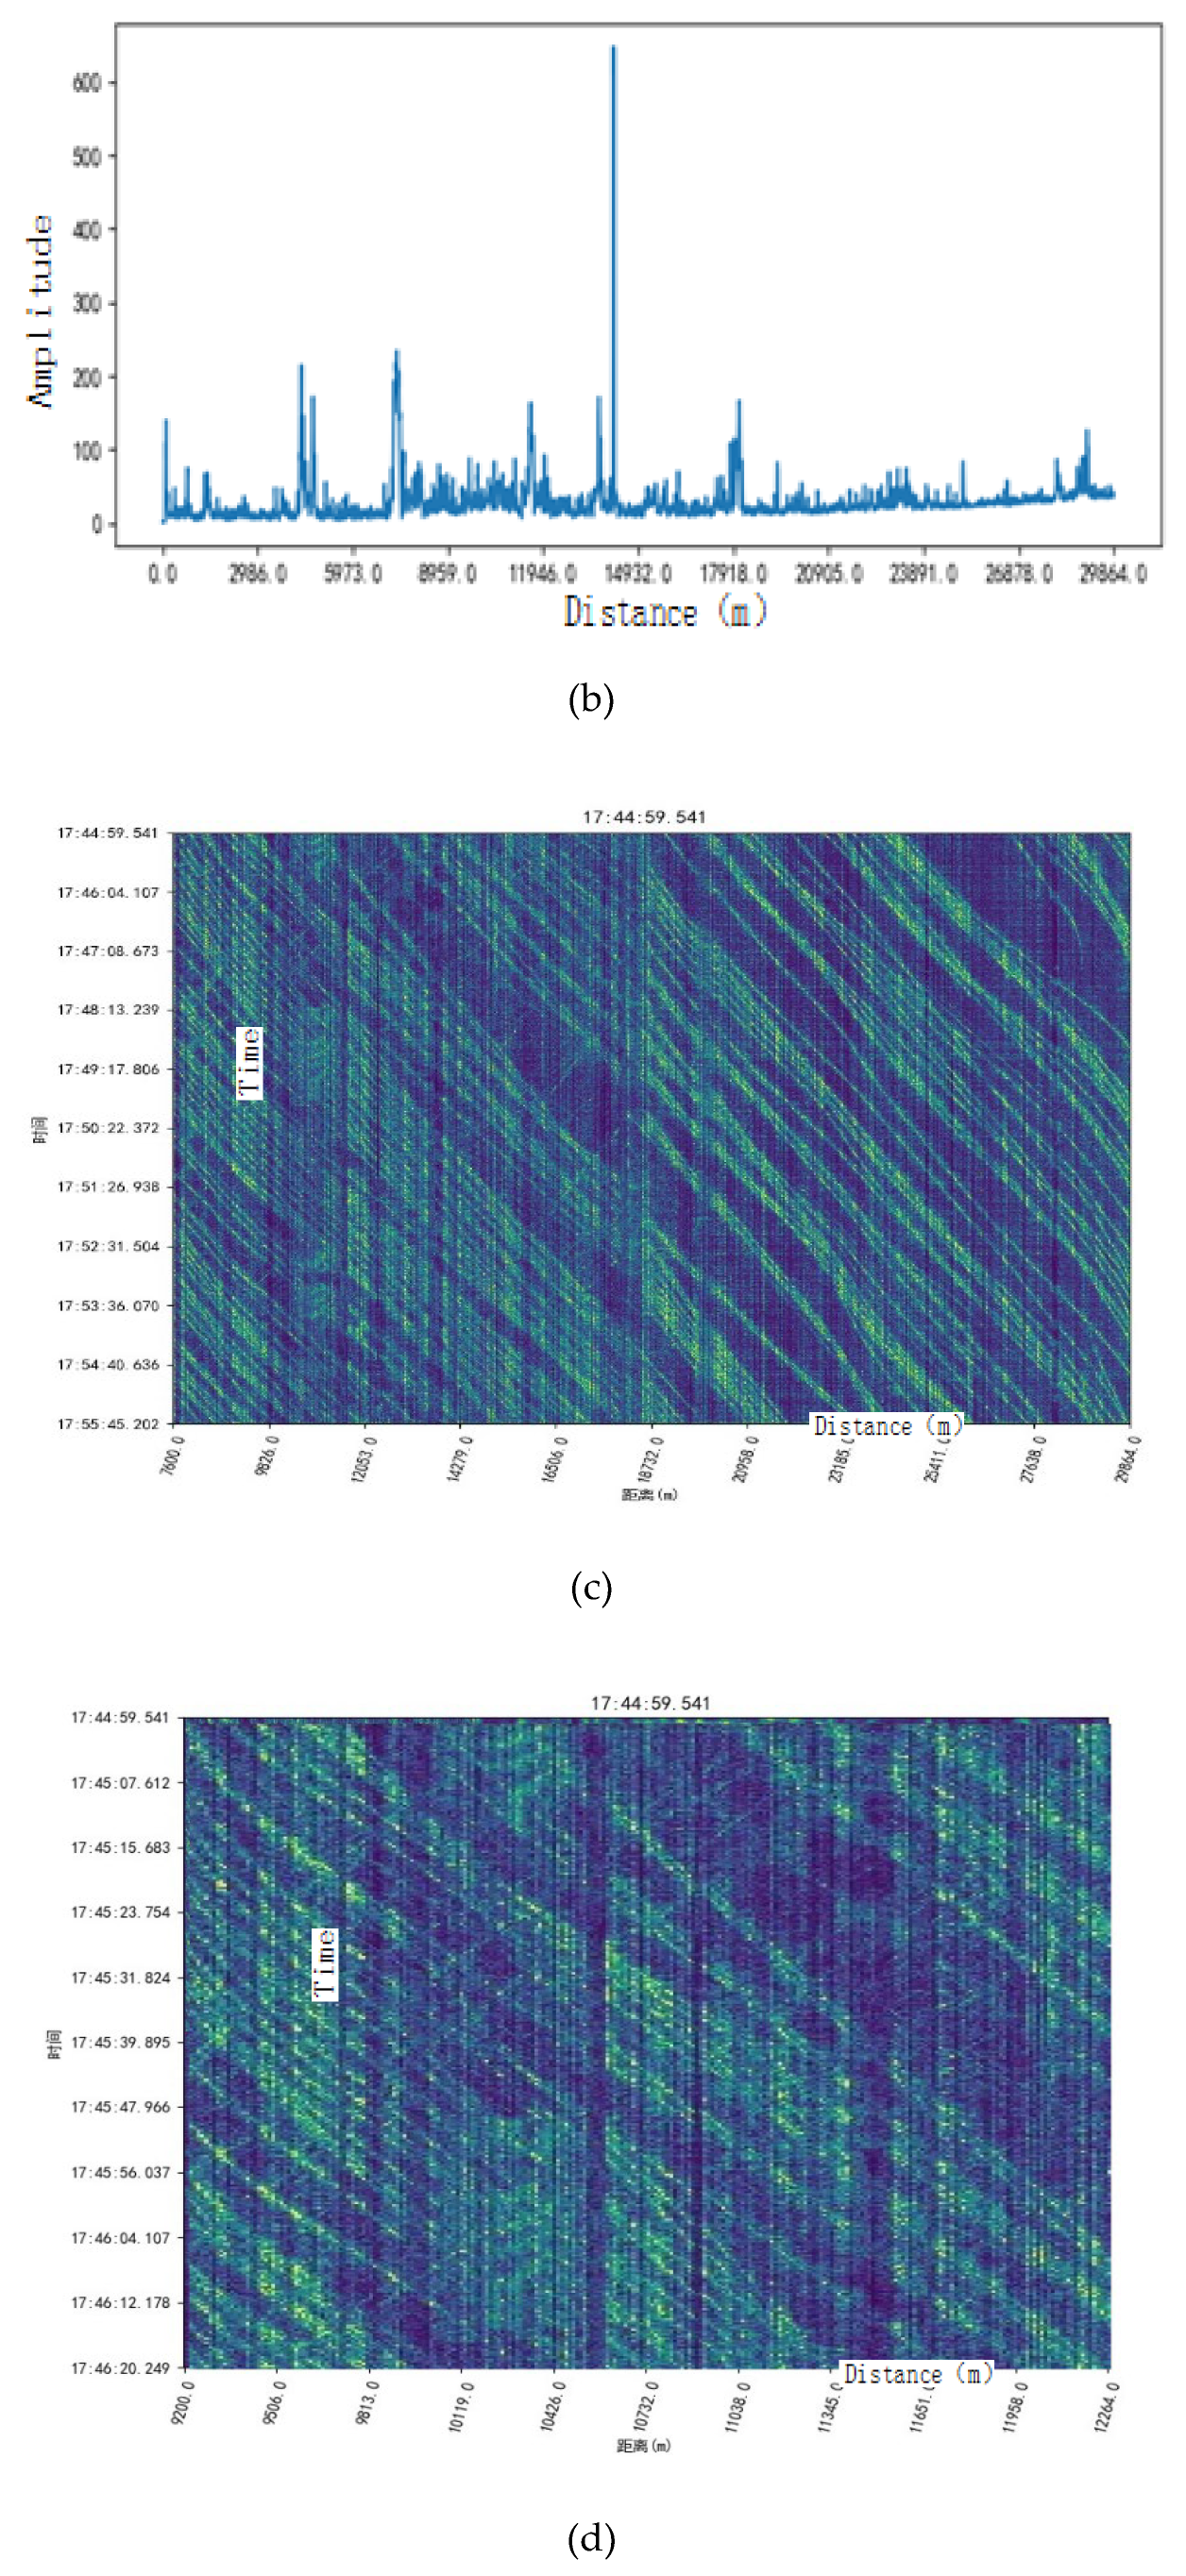
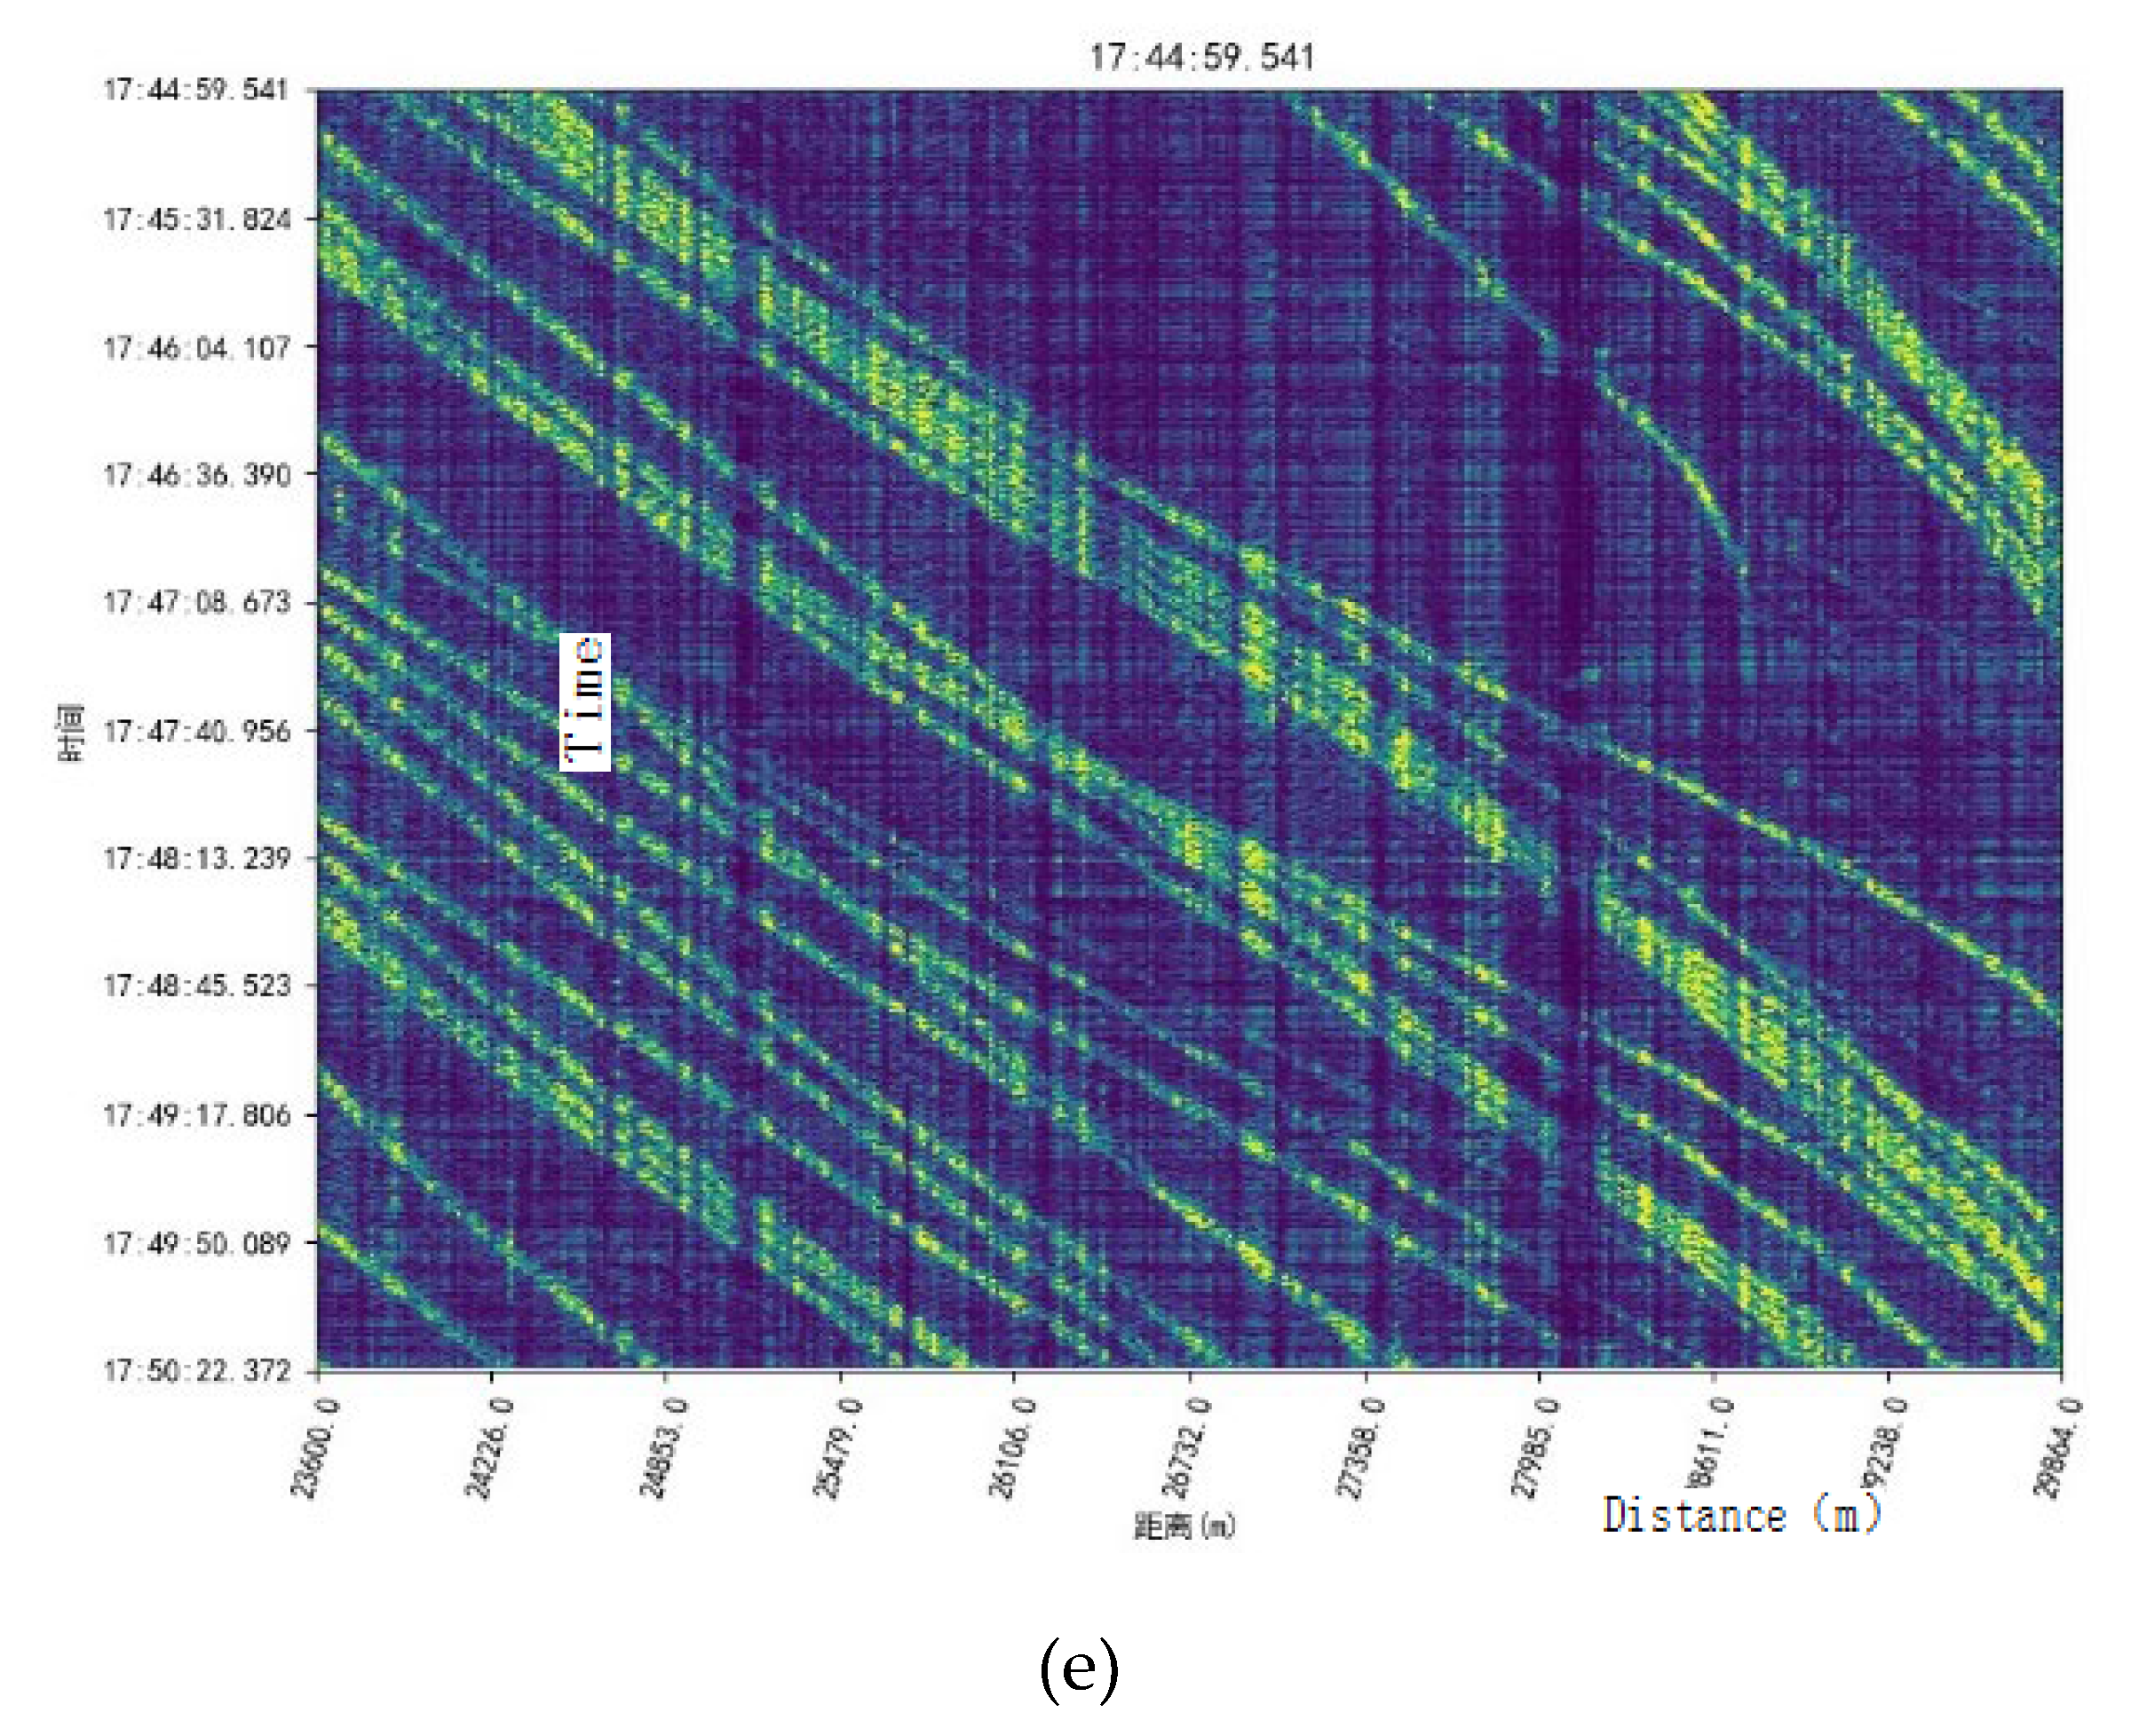
Figure 7.
Multi-modal Signal Extraction and Analysis for Highway Monitoring Using Combined Multi-head Attention Mechanism. (a) Road Surface Roughness Extraction Results; (b) Multi-channel Signal Extraction of Vehicle Trajectories and Construction Activities; (c) Multi-channel Vehicle Trajectory Signal Characteristics; (d) Multi-channel Construction Machinery Signal Characteristics.
Disclaimer/Publisher’s Note: The statements, opinions and data contained in all publications are solely those of the individual author(s) and contributor(s) and not of MDPI and/or the editor(s). MDPI and/or the editor(s) disclaim responsibility for any injury to people or property resulting from any ideas, methods, instructions or products referred to in the content. |
© 2025 by the authors. Licensee MDPI, Basel, Switzerland. This article is an open access article distributed under the terms and conditions of the Creative Commons Attribution (CC BY) license (http://creativecommons.org/licenses/by/4.0/).
Copyright: This open access article is published under a Creative Commons CC BY 4.0 license, which permit the free download, distribution, and reuse, provided that the author and preprint are cited in any reuse.


