

Submitted:
12 September 2025
Posted:
16 September 2025
You are already at the latest version
Abstract
The correlation between heat exposure in outdoor working environments and adverse effects to the health of workers has been widely investigated. Recent epidemiological studies, combined with direct observations, highlight an increase in work-related risks and hazards, which in turn leads to an increase in accidents at work. In this research, we investigated the tendencies and variability of such hazards in the Italian cities of Cagliari, Genoa, Lamezia Terme, Lecce, and Venice, as well as other cities overlooking the Mediterranean Basin, namely Beirut, Cairo, Gibraltar, Istanbul, Larnaca, Tunis, and Valencia.Specifically, we evaluated the Heat Index (HI), which is not considered the most accurate and reliable heat stress indicator, but can be applied on a wide scale as it depends entirely on temperature (Ta) and relative humidity (RH) data.Data products released by NOAA and based on local measurements across the Mediterranean Basin, performed between 2000 and 2024, were collected and analyzed with Jamovi 2.6.19, R v. 4.4.2 and MATLAB v. 2023. The HI provides two threshold values, Danger and Extreme Danger, which correspond to specific combinations of relative humidity and temperature considered hazardous for human health. We calculated the number of hours that, every year between May and October, exceed these thresholds. All trends lines show an increase over time, compatible with anthropogenic climate change. From this, we infer a percentage increase in the order of 60% with respect to productivity hour loss over the time span of two decades. The analysis also showed an extension of the boreal summer to September. Data confirm a constant increase in the number of HI-Danger which, in Tunis for example, increased from 49 days in 2000 to 156 days in 2024.Furthermore, the threshold of 35 °C as a limit for work activities often used in absence of national regulations does not appear to be conservative in more than one third of the studied locations. Despite the limitations of this methodology, this work is intended to set up new mitigation policies, at various scales, in the absence of more detailed methods accounting for additional parameters such as clothing and specific body acclimatation.
Keywords:
Heat Index
; Mediterranean Basin
; health hazard
; high temperatures
; heat exposure
; outdoor workers
1. Introduction
Meteorological conditions, heat exposure, and a number of adverse effects on human health – especially that of workers – constitute an issue of growing concern in scientific studies, as well as in the broader society and economy [1]. During the calendar year 2003, record temperatures were reached, and the general population became more concerned about the topic of heat exposure [2,3]. Epidemiological research and direct observations both indicate an increase in risks and hazards alike associated with working under extreme heat conditions [4,5] In addition to potentially lethal effects such as heat strokes and thermal shocks occurring during heat waves, accidents attributable to exhaustion, reduced cognitive functions, reduced decision-making capabilities, and other factors may occur [6].
In two works, it was shown that in Italy there is a 30% increase in accidents in construction and 60% in agriculture [7,8].
According to recent estimates, approximately 30% of the world’s population is currently exposed to heat conditions deemed critical for human health at least 20 days per year, with an increasing trend caused by the increase in anthropogenic greenhouse gases (GHGs) in the atmosphere and the effects caused by their GWP (global warming potential) [9]. Workers, especially those spending most of their time in outdoor environments (e.g., agriculture, construction) are particularly exposed to heat and other related environmental risks, such as direct exposure to solar radiation. These occurrences have led numerous countries to introduce specific hazard mitigation policies and measures which rely on different exposure indexes. In fact, these regulations are heterogeneous, even among the countries sharing similar environmental characteristics.
Commonly used indexes are the WBGT (WetBulb Globe Temperature) and PHS (Predicted Heat Strain), which are affected by limitations such as the requirement to use expensive sensors, thus reducing their applicability on a wide scale, as well as assessments of each worker’s tasks and specific thermal protection parameters attributed to clothing [10,11,12]. Furthermore, the index is not always precautionary, and although it represents the risk condition for the individual worker in greater detail, these indices can be used by experts with specific measuring equipment available.
The index that we have considered in this work is the Heat Index (HI) introduced in 1979 by the United States Meteorological Service and its strong point lies in its simplicity of use [13] through the use of two easily measurable parameters, temperature (Ta) and relative humidity (RH) with which one enters a double entry table providing, on a chromatic scale, the value of the index [14].
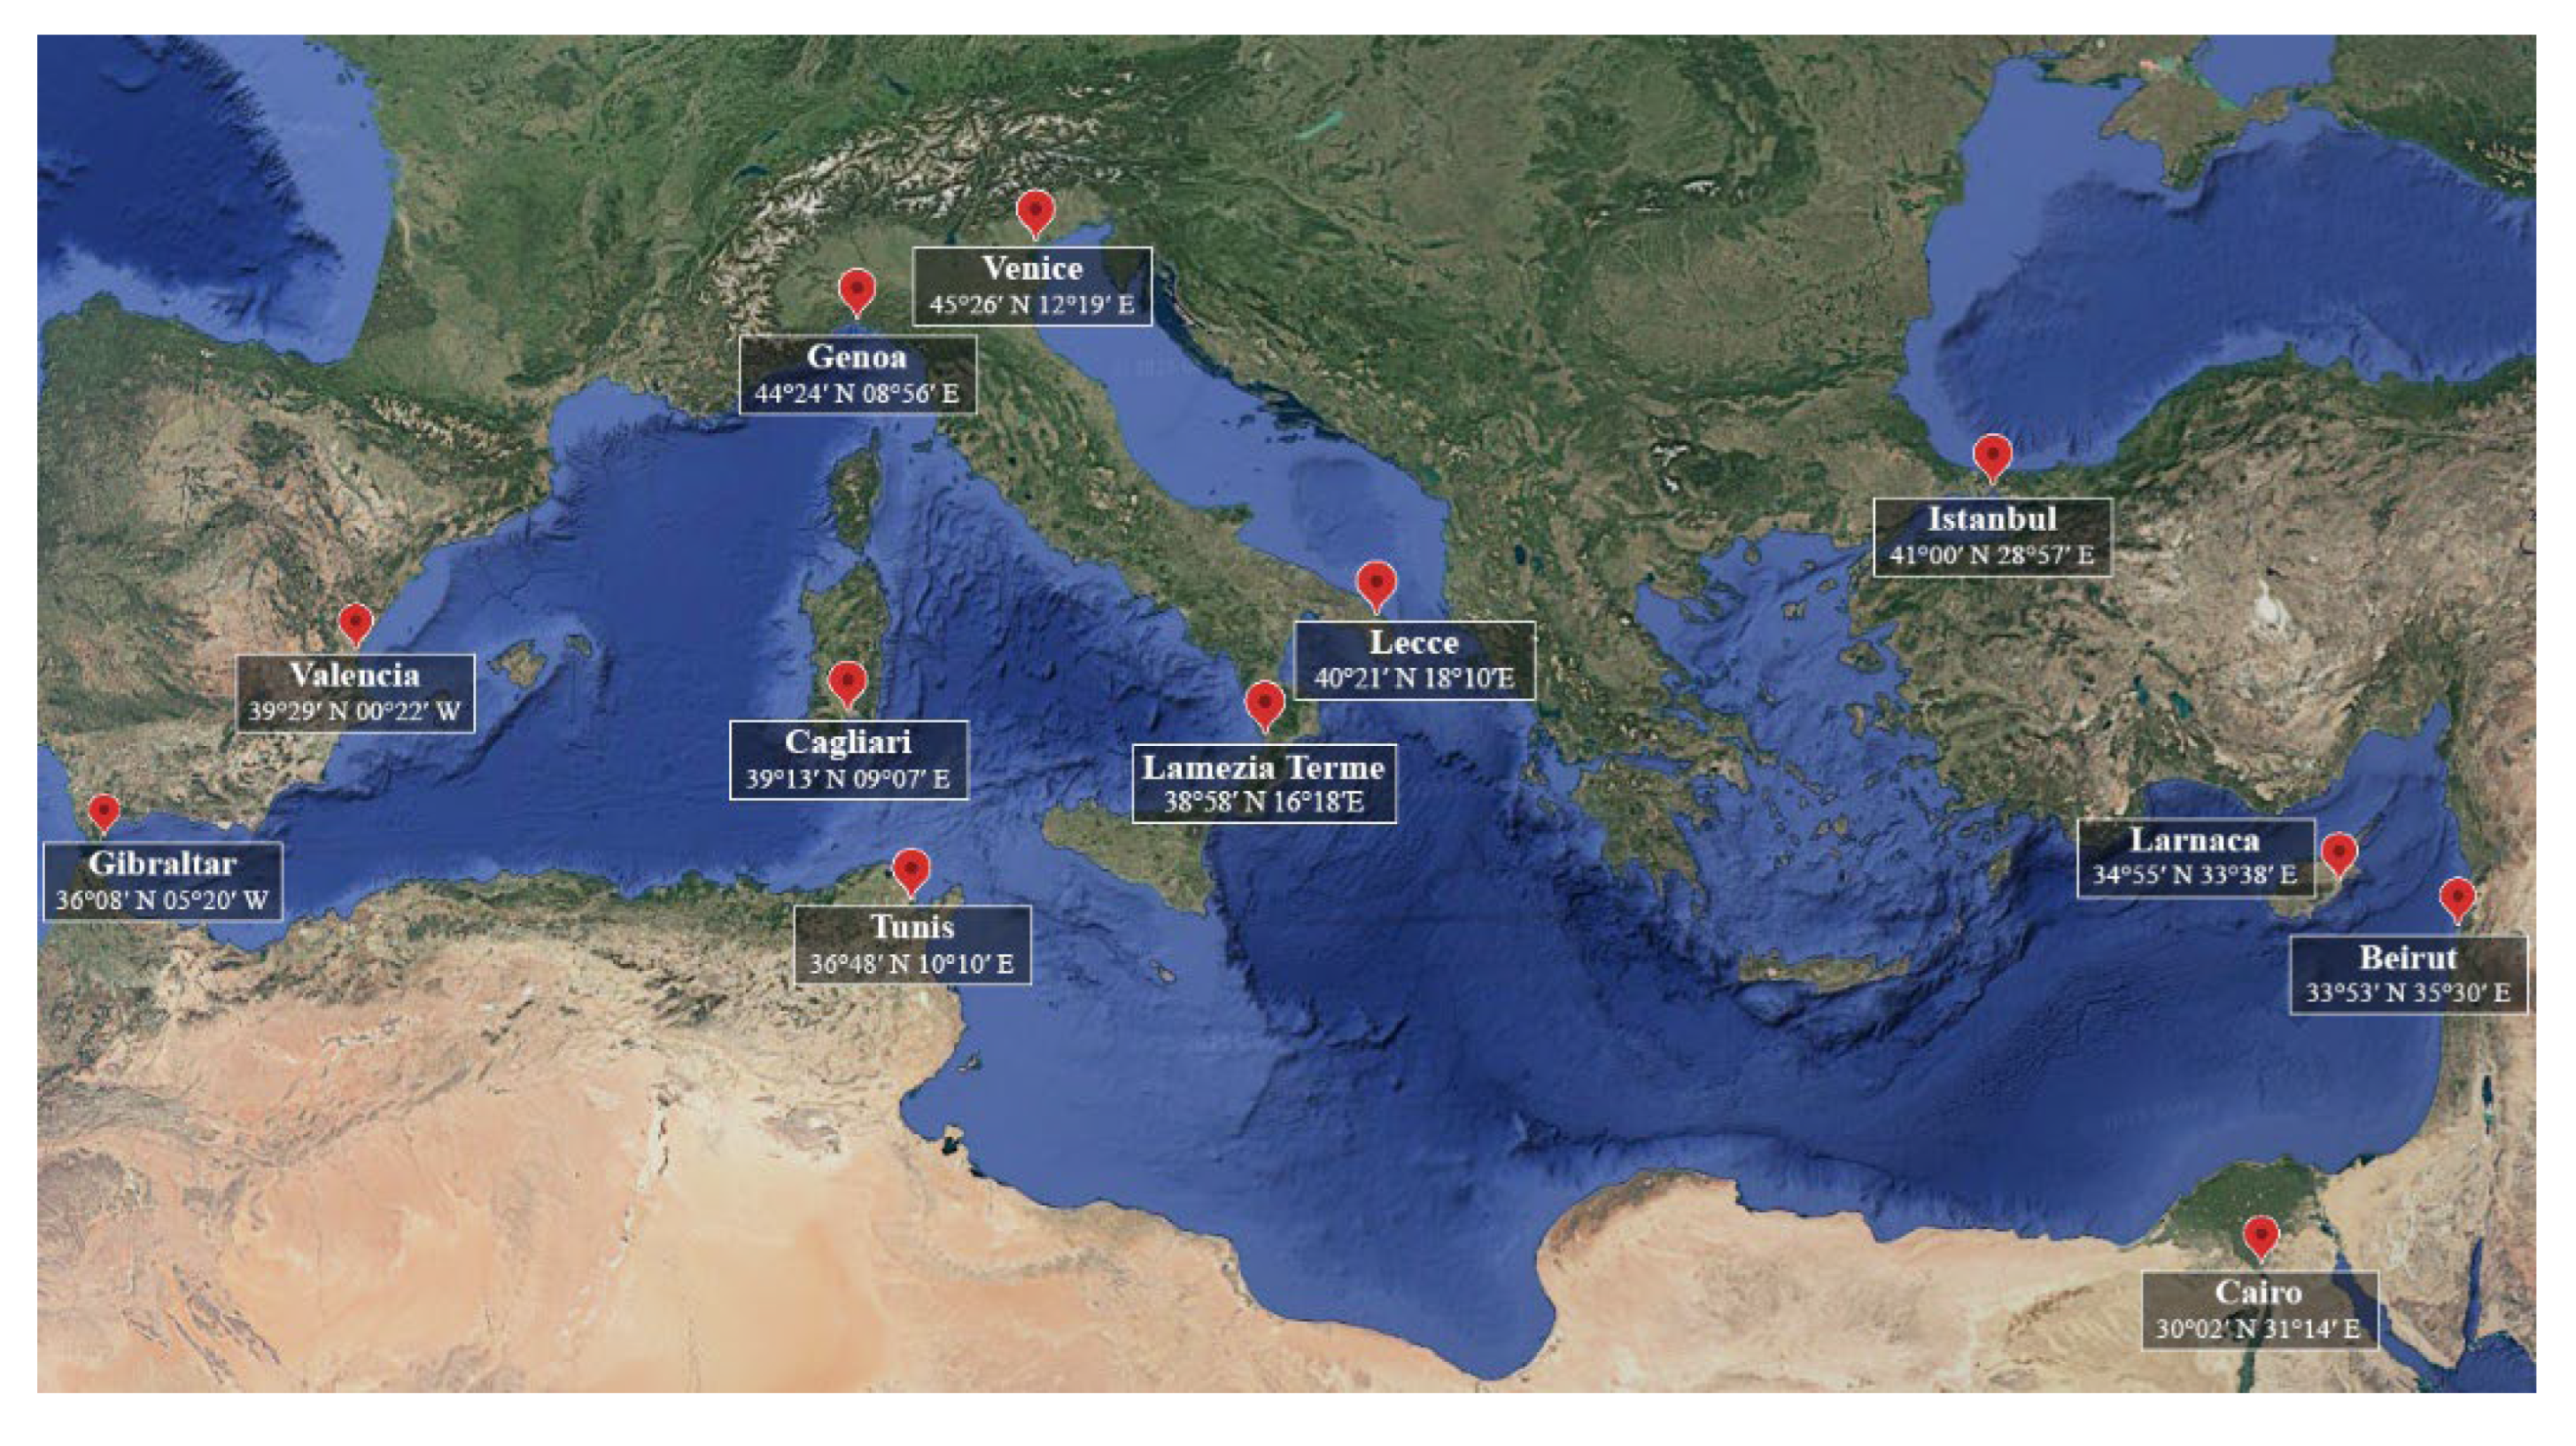
This study evaluates climate data issued by NOAA (National Oceanic and Atmospheric Administration) concerning the 2000-2024 period in twelve locations overlooking the Mediterranean Sea (Lamezia Terme, Lecce, Cagliari, Venice, Genoa, Valencia, Gibraltar, Tunis, Cairo, Larnaca, Beirut, and Istanbul) (Figure 1). These data, gathered by local institutions and research centers, have been processed by NOAA to generate a single, consistent dataset [15].
Figure 1.
Map of the Mediterranean Basin highlighting the location and coordinates of the twelve locations subject to this study’s analysis.
Figure 1.
Map of the Mediterranean Basin highlighting the location and coordinates of the twelve locations subject to this study’s analysis.
2. Methods and Results
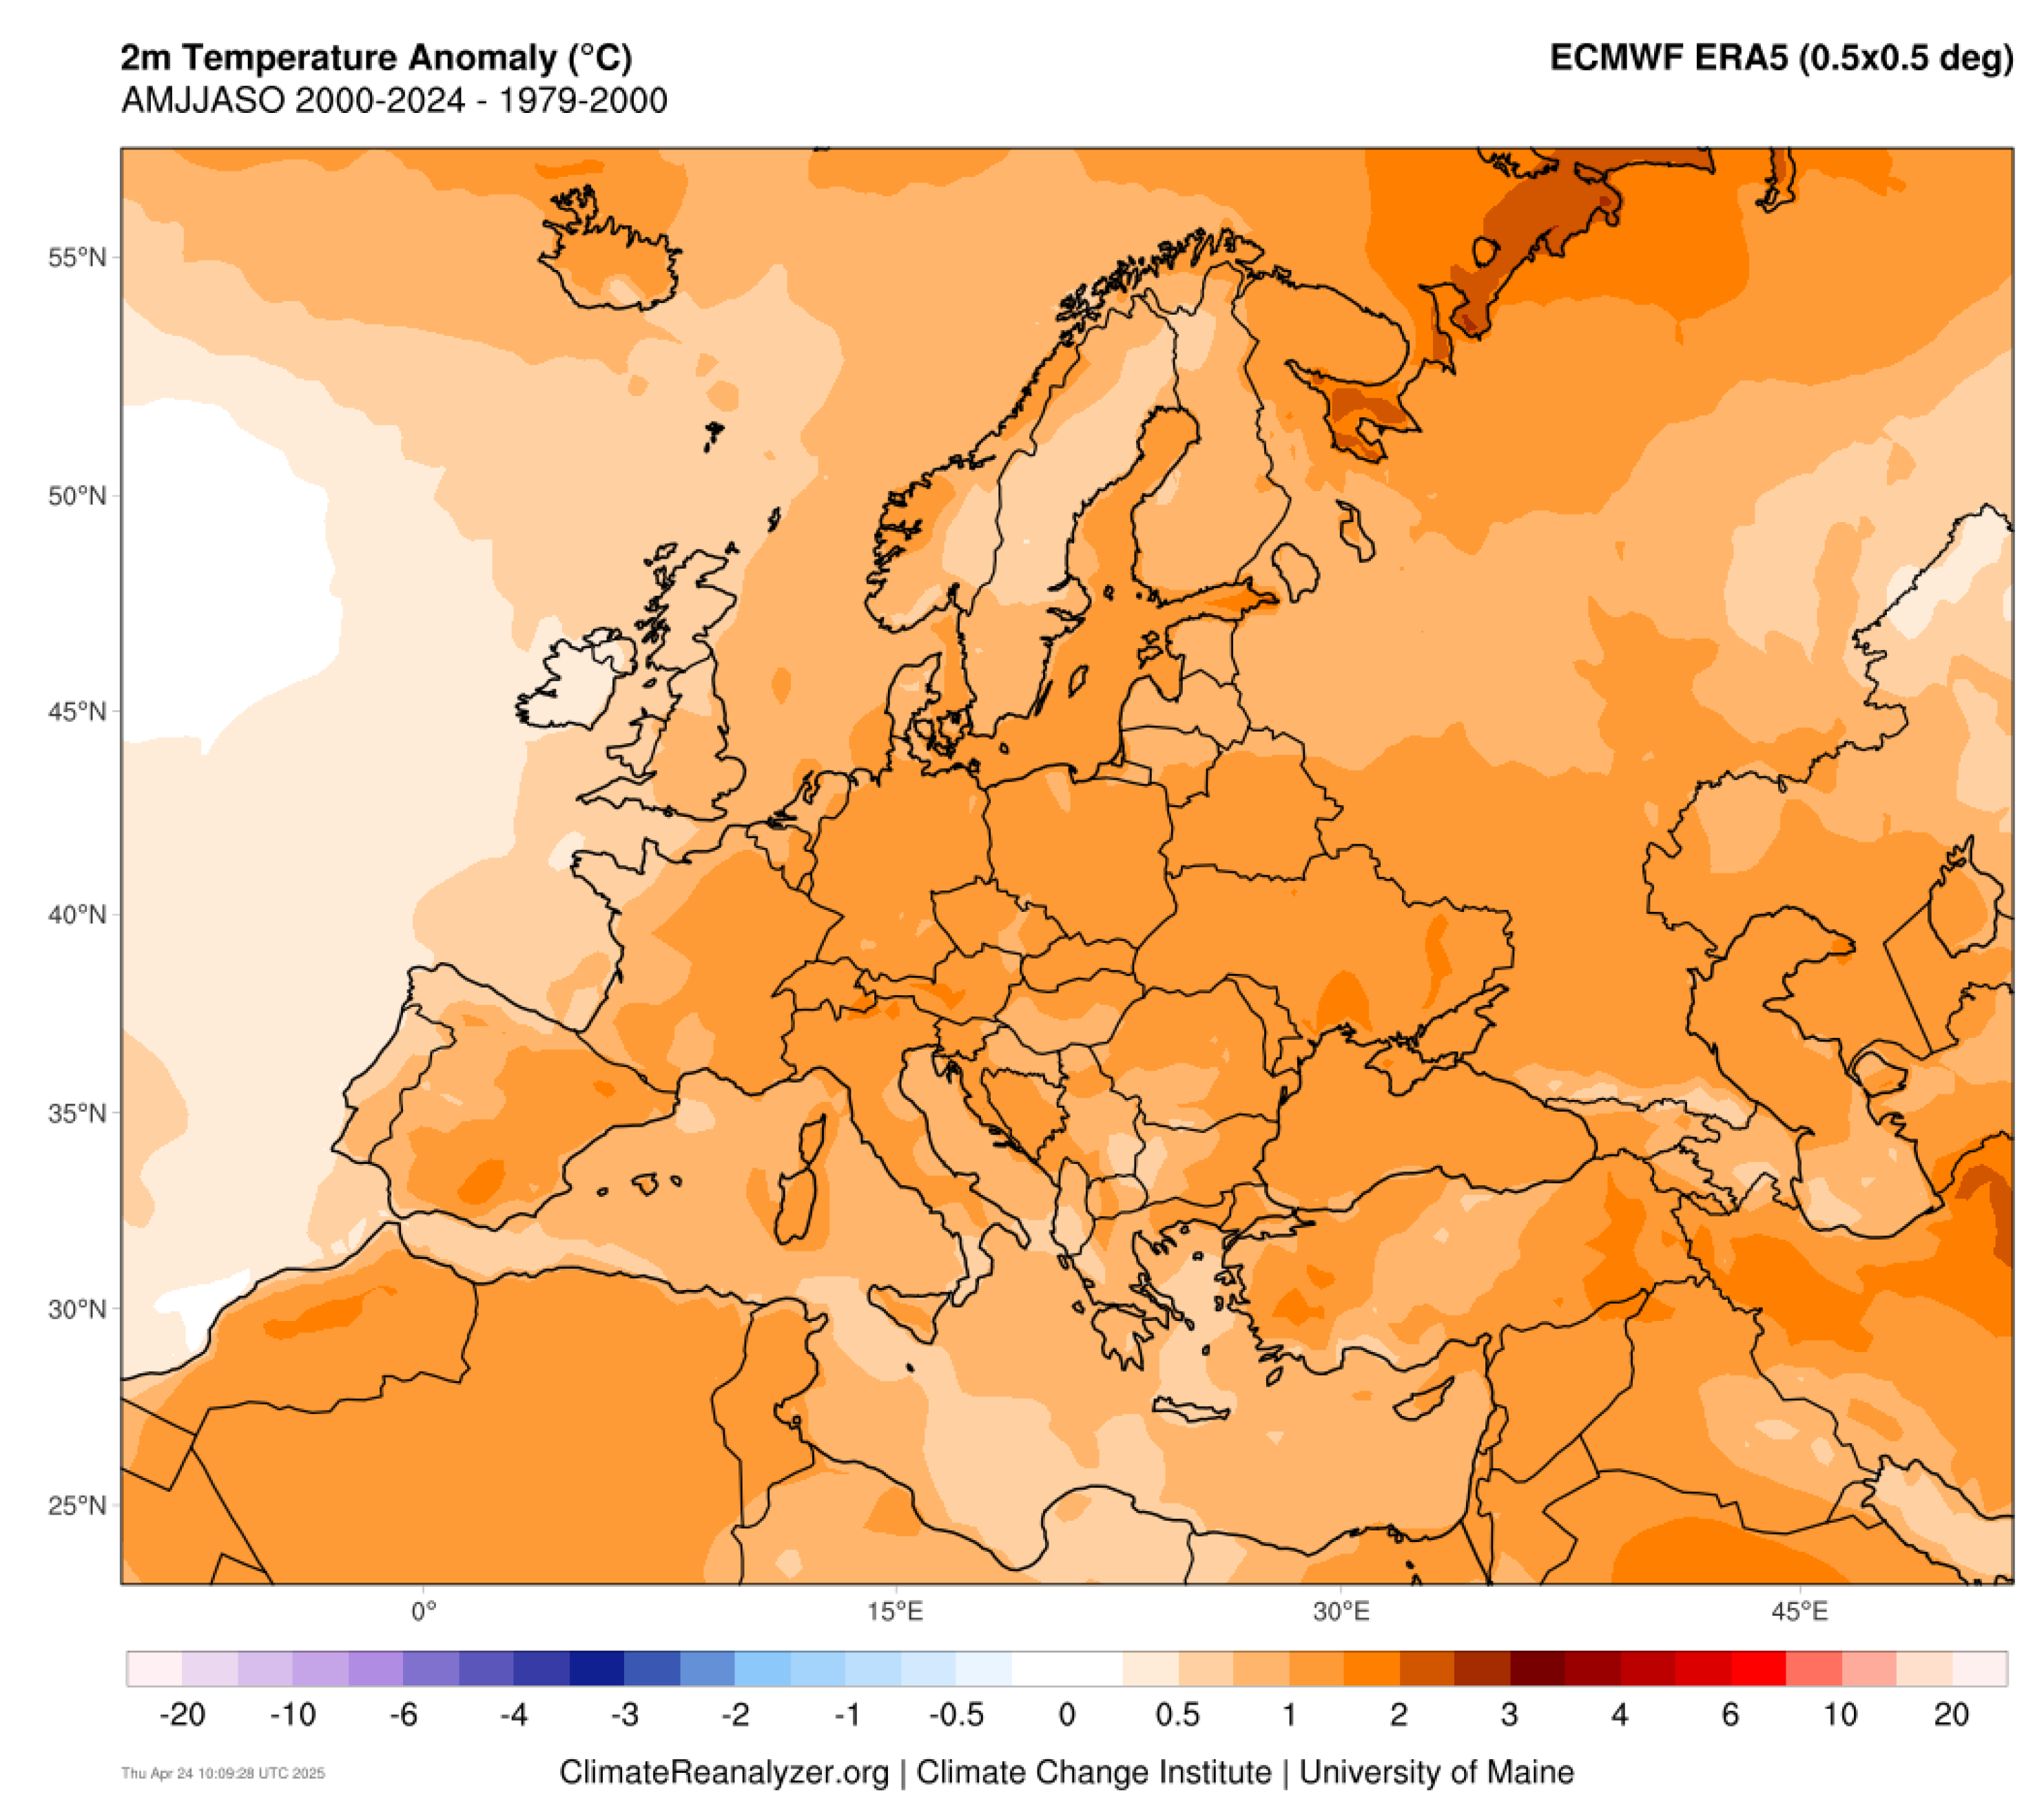
The Mediterranean is known to be a hotspot for climate change mechanisms. For each of the 25 evaluated years, the HI was calculated on an hourly basis for May-October. The selection of towns and cities across the basin was made by considering multiple combinations of driving factors for HI variability. Figure 2 shows an ECMWF ERA5 product by Copernicus comparing 1979-2000 averaged temperatures with those computed for 2000-2024. Although the anomalies are heterogeneous in entity, a consistent increase of at least 0.5 °C affects most of the Mediterranean Basin [16].
Figure 2.
Copernicus ECMWF ERA5 - t2m map showing temperature anomalies reported for the 2000-2024 period with respect to 1979-2000.
Figure 2.
Copernicus ECMWF ERA5 - t2m map showing temperature anomalies reported for the 2000-2024 period with respect to 1979-2000.
The HI was introduced to prevent risks to the general population and is therefore more cautious than indices aimed specifically at workers. It should be emphasized that the exposure to severe climatic conditions is particularly risky for workers with certain medical conditions, especially those affecting the cardiovascular system. The HI is calculated starting from a mathematical algorithm whose results are reported in a simplified table, which correspond to specific combinations of relative humidity and temperature considered dangerous for human health and allows the identification of two threshold values: Danger and Highly danger [14,17]. By entering the double-entry table with the current temperature and humidity values, employers and workers themselves obtain, through the index, objective information allowing to implement mitigation measures on particularly hot days. In Italy, despite the implementation of the Worklimate platform, its hazard-assessment maps based on WBGT, and specific government guidelines, it is clearly specified that the tool “can be affected by potentially relevant errors, and therefore needs to be treated as supporting material in decision making, meant to be integrated by the active monitoring of environmental parameters in a workplace” [18,19].
We counted the number of daily hours with HI values exceeding select thresholds and studied their evolution over time. In addition to that, considering that many regulations across European and not European countries require working activities to be interrupted past the 35 °C threshold, the hours exceeding that limit were compared to HI results Furthermore, due to the key role of RH in human thermoregulation, all days with averaged RH values in the 65-99% range were also considered, and consequently compared with HI results
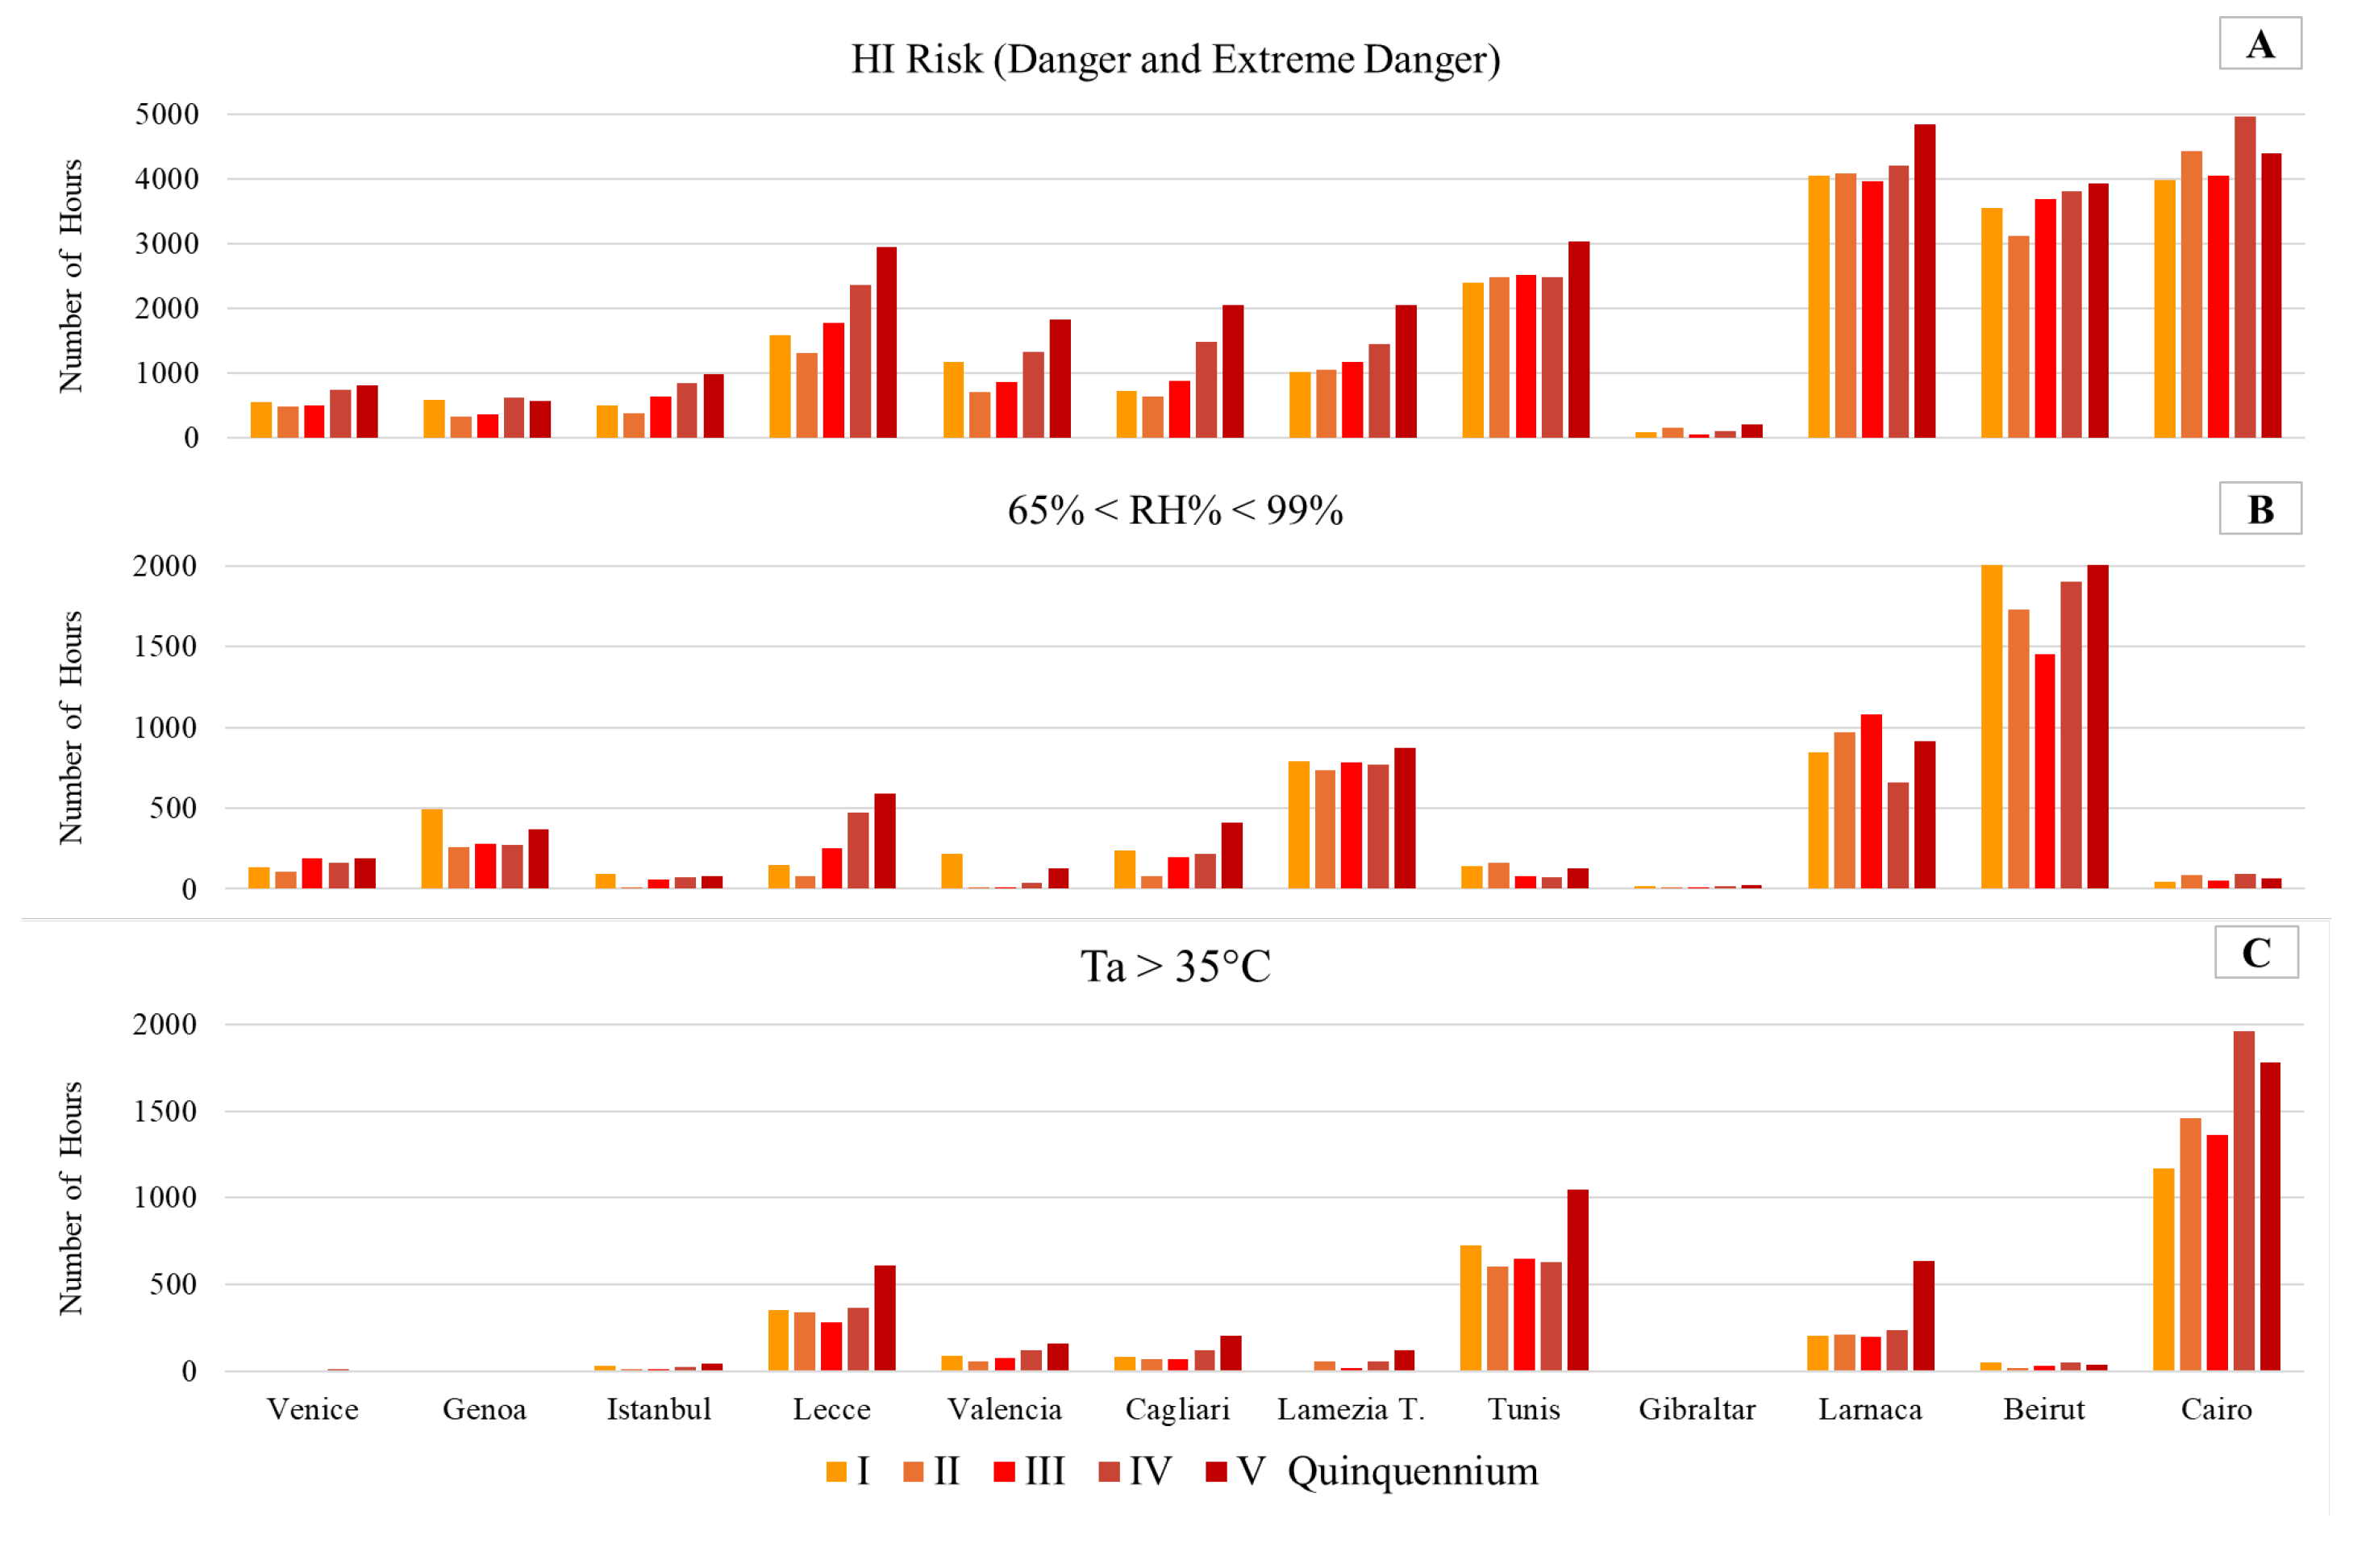
The years considered in this study have been divided in five quinquennia (e.g., I: 2000-2004; V: 2020-2024), and for each quinquennium, several parameters have been calculated (Figure 3). From the results, is it possible to infer that local climate patterns have a relevant impact on health hazards at each site. Considering that many regulations across countries require working activities to be interrupted past the 35 °C threshold, the hours exceeding that limit were compared to HI results. Furthermore, due to the key role of RH in human thermoregulation, all days with averaged RH values in the 65-95% range were also considered and consequently compared with HI results.
Figure 3.
Number of hours, in each quinquennium, with A) a HI of Danger or above; RH between 65% and 99%, and C) temperatures above the 35 °C threshold.
Figure 3.
Number of hours, in each quinquennium, with A) a HI of Danger or above; RH between 65% and 99%, and C) temperatures above the 35 °C threshold.
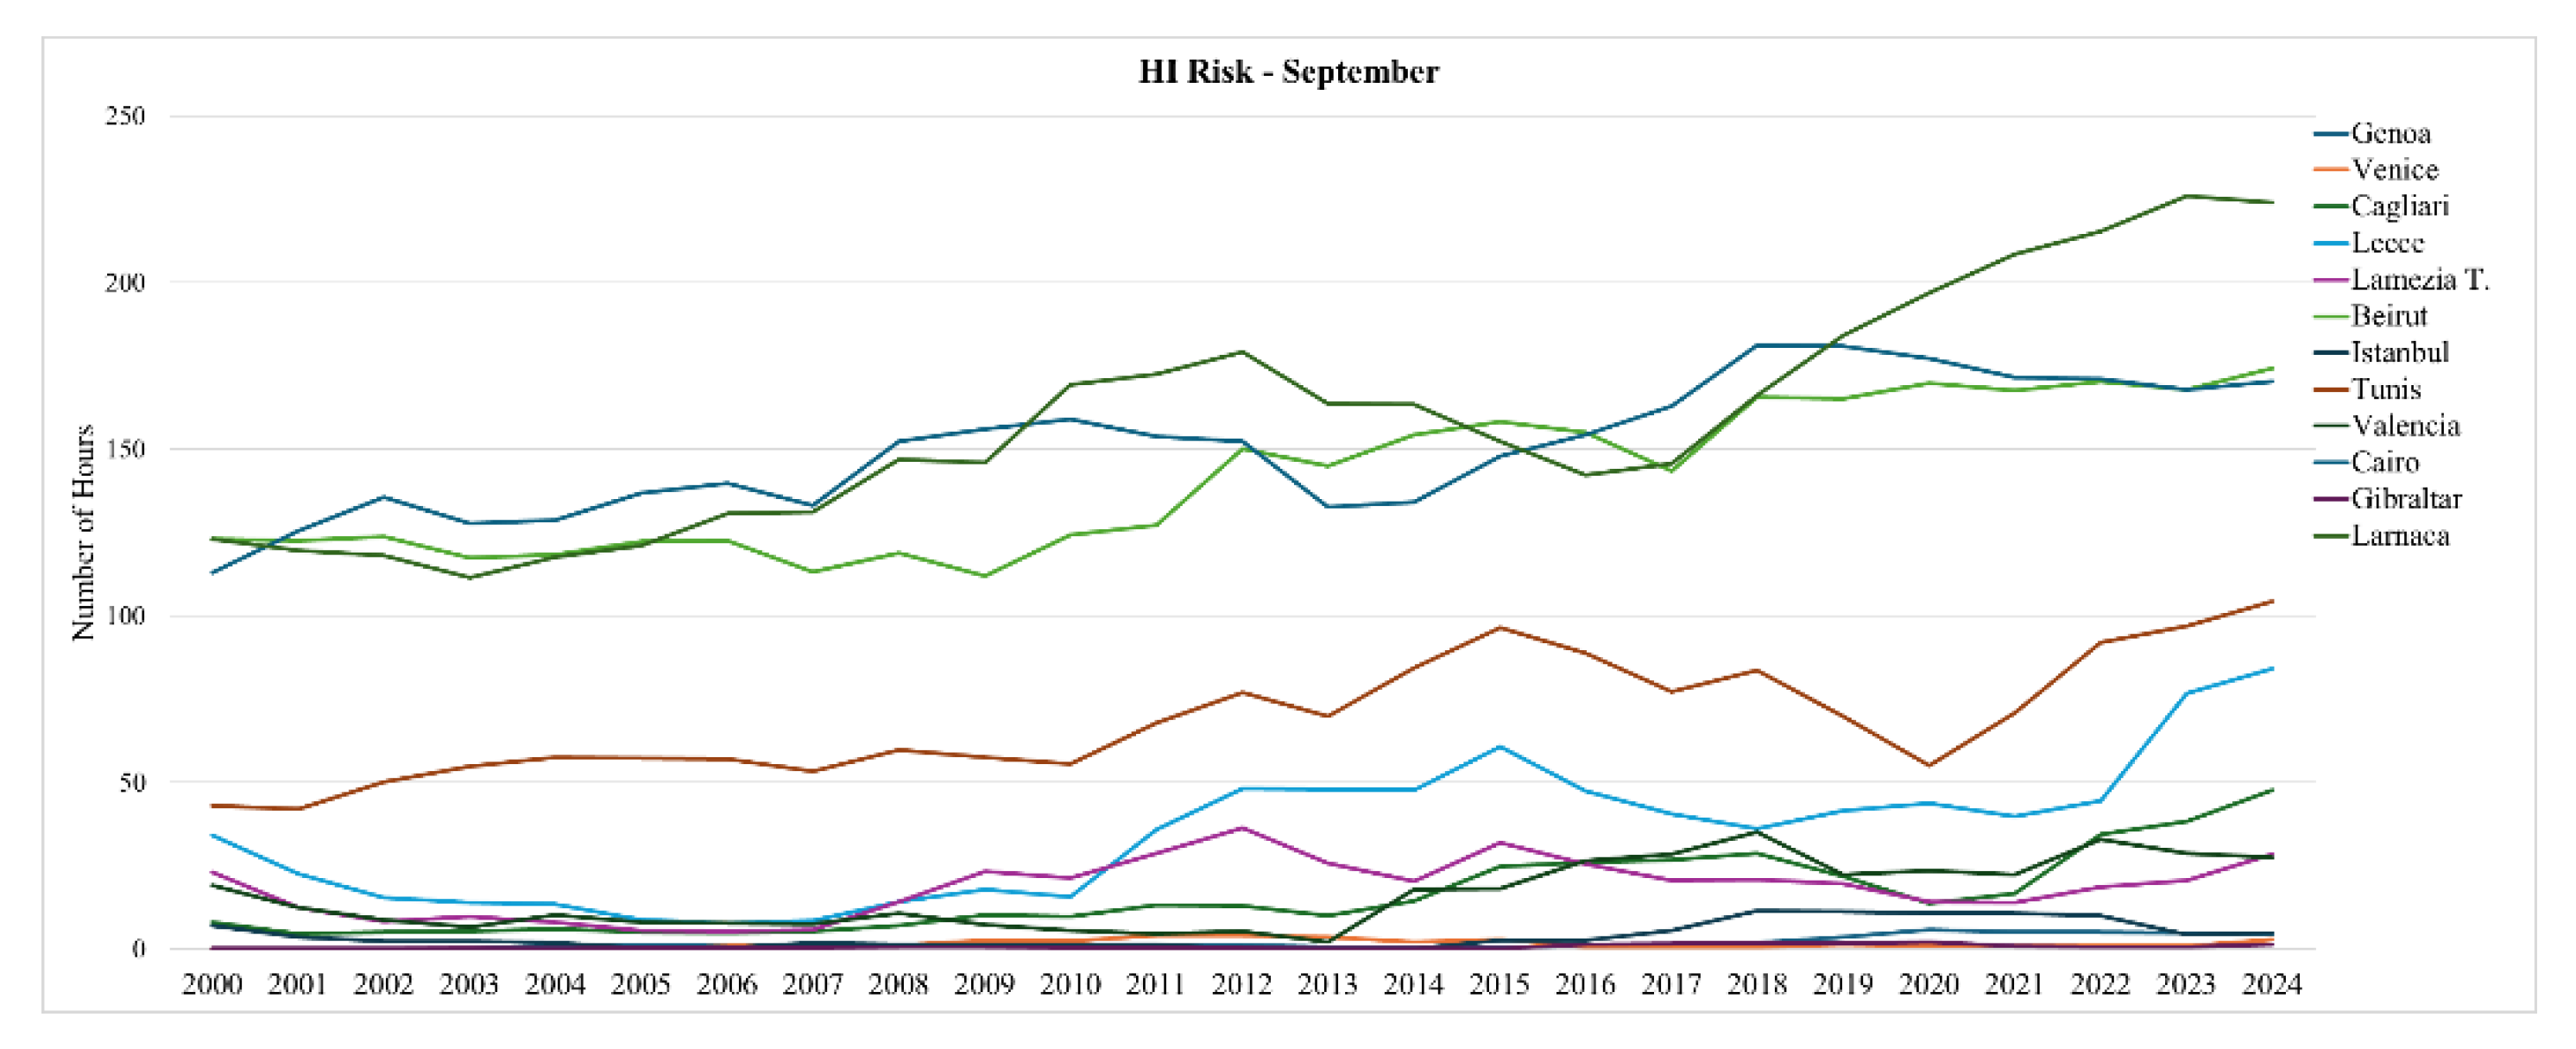
In climate studies, the summer season is defined by the June, July, and August trimester (JJA); however, studies have highlighted that average temperatures are not symmetrical during the course of a calendar year, as the month of September is characterized by summer-like values [20]. With temperatures on the increase, we evaluated September’s tendencies as proof of an “extended” summertime period (Figure 4). The results indicate that, under most circumstances, September is leaning towards the characteristics of a summertime month, with all related risks in terms of health hazards.
Figure 4.
Number of hours across the study period (2000-2024), referred specifically to the month of September, with HI of Danger and above.
Figure 4.
Number of hours across the study period (2000-2024), referred specifically to the month of September, with HI of Danger and above.
The tendencies are heterogeneous in entity and growth rate. In Figure 5, trend lines representing the increase of hours satisfying the condition of “Danger” or above in terms of HI are shown, and clearly indicate an overall upward trend.
Figure 5.
Trend lines of the patterns seen in Figure 4, showing a general increase of the number of hours meeting high HI requirements.
Figure 5.
Trend lines of the patterns seen in Figure 4, showing a general increase of the number of hours meeting high HI requirements.
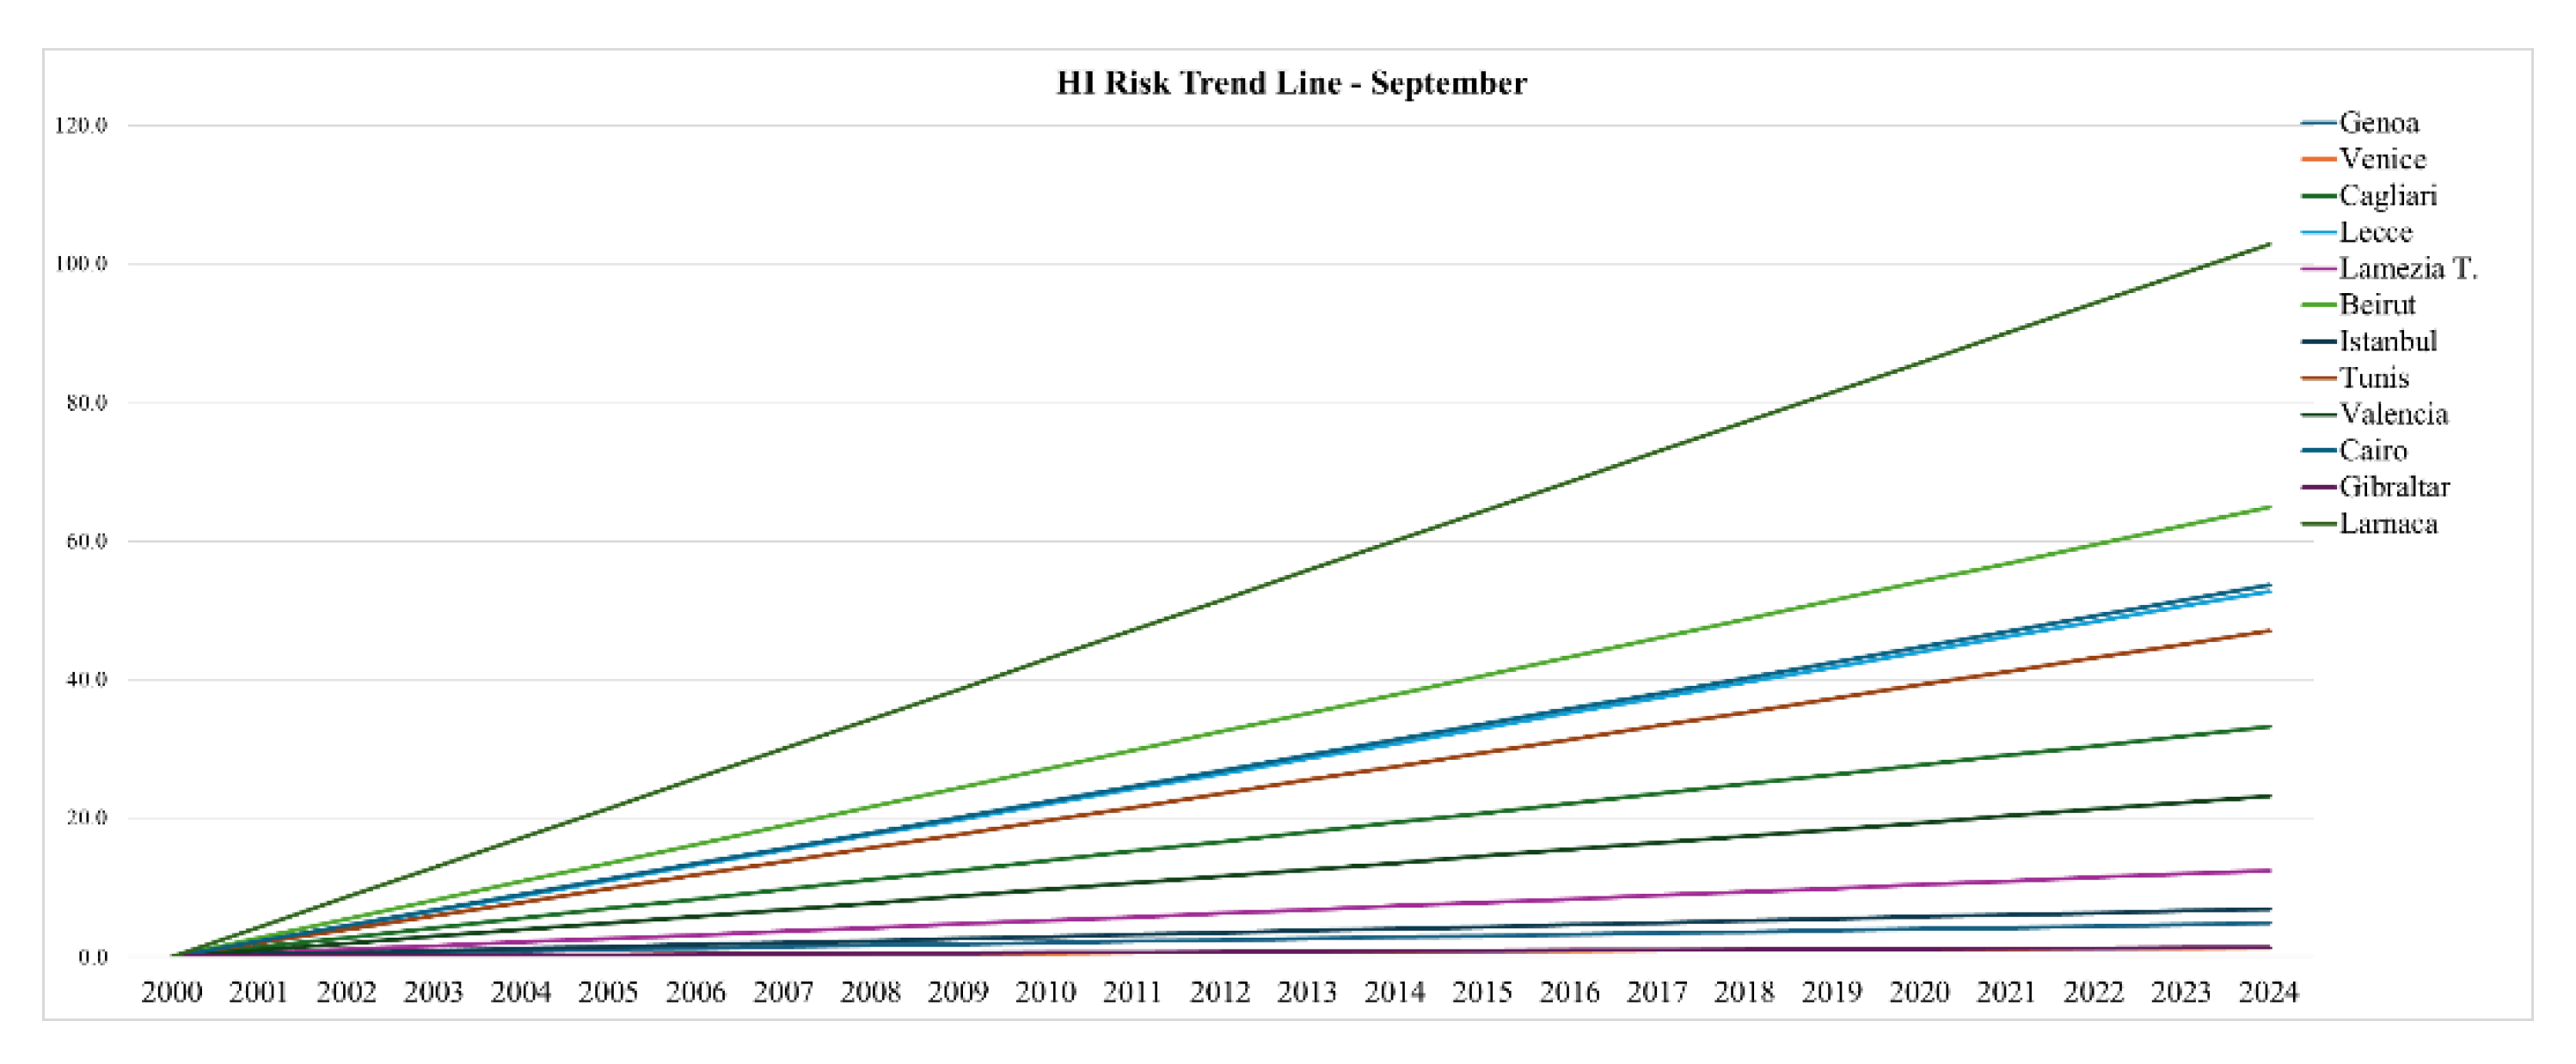
The statistical analysis was performed using MATLAB v. 2023, R v. 4.4.2, and Jamovi v. 2.6.19; trend lines were plotted considering the slope coefficient only, thus normalizing the intercept for all sites evaluated in the study.
3. Discussion
The Heat Index (HI) methodology highlights two thresholds deemed hazardous for human health: Danger, and Extreme danger. This work is aimed specifically at outdoor workers, and the evaluation of HI has considered a buffer zone of 15 °F to consider direct exposure to solar radiation. Based on the method, in this work we calculated the number of hours exceeding select thresholds between 2000 and 2024. The results are heterogeneous, with Gibraltar – for instance – yielding 1000 hours and Cairo yielding 32000 hours. All data, shown in Table 1, Table 2 and Table 3, are categorized on a per-quinquennium basis.

Table 1.
Number of hours with a Heat Index (HI) greater than select thresholds for “Danger” level or above. All data are divided by quinquennia.
Table 1.
Number of hours with a Heat Index (HI) greater than select thresholds for “Danger” level or above. All data are divided by quinquennia.
| Location | HI Risk (Danger or Ex. Danger) | ||||
| I | II | III | IV | V | |
| Venice | 863 | 820 | 790 | 1154 | 1186 |
| Genoa | 822 | 479 | 513 | 814 | 867 |
| Istanbul | 586 | 413 | 795 | 965 | 1104 |
| Lecce | 1941 | 1577 | 2095 | 2944 | 4188 |
| Valencia | 1700 | 865 | 1089 | 1689 | 2778 |
| Cagliari | 1012 | 806 | 1106 | 1917 | 2775 |
| Lamezia T. | 1320 | 1340 | 1430 | 1797 | 2695 |
| Tunis | 3316 | 3412 | 3319 | 3234 | 4349 |
| Gibraltar | 137 | 224 | 90 | 144 | 308 |
| Larnaca | 5273 | 5429 | 5460 | 5866 | 7197 |
| Beirut | 4782 | 4088 | 5109 | 5631 | 6374 |
| Cairo | 5508 | 6352 | 5563 | 7604 | 7023 |
Table 2.
Number of hours with relative humidity (RH) in the 65-99% range. All data are divided by quinquennia.
Table 2.
Number of hours with relative humidity (RH) in the 65-99% range. All data are divided by quinquennia.
| Location | 65% < RH < 99% | ||||
| I | II | III | IV | V | |
| Venice | 298 | 281 | 367 | 343 | 355 |
| Genoa | 698 | 400 | 407 | 404 | 683 |
| Istanbul | 132 | 12 | 136 | 97 | 113 |
| Lecce | 184 | 113 | 316 | 687 | 1220 |
| Valencia | 456 | 4 | 34 | 126 | 461 |
| Cagliari | 389 | 132 | 289 | 399 | 756 |
| Lamezia T. | 1076 | 984 | 1010 | 1058 | 1355 |
| Tunis | 421 | 448 | 272 | 217 | 525 |
| Gibraltar | 21 | 16 | 3 | 21 | 83 |
| Larnaca | 1681 | 1963 | 2256 | 1819 | 2584 |
| Beirut | 3866 | 2569 | 2586 | 3477 | 4232 |
| Cairo | 45 | 83 | 51 | 94 | 67 |
Table 3.
Number of hours with temperatures greater than the select threshold of 35 °C. All data are divided by quinquennia.
Table 3.
Number of hours with temperatures greater than the select threshold of 35 °C. All data are divided by quinquennia.
| Location | Ta > 35 °C | ||||
| I | II | III | IV | V | |
| Venice | 3 | 6 | 2 | 12 | 2 |
| Genoa | 0 | 0 | 0 | 8 | 7 |
| Istanbul | 32 | 16 | 11 | 31 | 46 |
| Lecce | 407 | 393 | 321 | 415 | 699 |
| Valencia | 131 | 88 | 113 | 144 | 189 |
| Cagliari | 93 | 88 | 80 | 146 | 250 |
| Lamezia T. | 10 | 60 | 19 | 57 | 132 |
| Tunis | 833 | 699 | 734 | 711 | 1201 |
| Gibraltar | 5 | 7 | 8 | 2 | 13 |
| Larnaca | 232 | 233 | 206 | 257 | 690 |
| Beirut | 56 | 19 | 43 | 60 | 41 |
| Cairo | 1292 | 1648 | 1541 | 2269 | 2138 |
Considering that outdoor work activities most take place in the morning, hourly data have been evaluated considering working hours in the 07:00-16:00 (7am to 4pm) interval. Table 4, Table 5 and Table 6 show data limited to these hours.
Table 4.
Number of working hours (7am to 4 pm) with a Heat Index (HI) greater than select thresholds for “Danger” level or above. All data are divided by quinquennia.
Table 4.
Number of working hours (7am to 4 pm) with a Heat Index (HI) greater than select thresholds for “Danger” level or above. All data are divided by quinquennia.
| Location | HI Risk (Danger or Ex. Danger) | ||||
| I | II | III | IV | V | |
| Venice | 542 | 482 | 493 | 744 | 807 |
| Genoa | 581 | 319 | 364 | 610 | 565 |
| Istanbul | 488 | 380 | 632 | 845 | 974 |
| Lecce | 1584 | 1305 | 1771 | 2356 | 2948 |
| Valencia | 1176 | 710 | 856 | 1317 | 1823 |
| Cagliari | 725 | 640 | 873 | 1482 | 2054 |
| Lamezia T. | 1007 | 1048 | 1161 | 1439 | 2049 |
| Tunis | 2400 | 2486 | 2521 | 2473 | 3040 |
| Gibraltar | 88 | 142 | 53 | 94 | 209 |
| Larnaca | 4055 | 4083 | 3959 | 4214 | 4843 |
| Beirut | 3552 | 3132 | 3688 | 3816 | 3928 |
| Cairo | 3985 | 4429 | 4045 | 4971 | 4400 |
Table 5.
Number of working hours (7am to 4 pm) with relative humidity (RH) in the 65-99% range. All data are divided by quinquennia.
Table 5.
Number of working hours (7am to 4 pm) with relative humidity (RH) in the 65-99% range. All data are divided by quinquennia.
| Location | 65% < RH < 99% | ||||
| I | II | III | IV | V | |
| Venice | 135 | 109 | 190 | 163 | 189 |
| Genoa | 490 | 255 | 281 | 274 | 372 |
| Istanbul | 95 | 10 | 58 | 70 | 77 |
| Lecce | 147 | 81 | 254 | 474 | 588 |
| Valencia | 214 | 2 | 10 | 37 | 125 |
| Cagliari | 235 | 81 | 193 | 215 | 407 |
| Lamezia T. | 791 | 738 | 784 | 769 | 870 |
| Tunis | 142 | 161 | 79 | 75 | 125 |
| Gibraltar | 14 | 10 | 1 | 14 | 26 |
| Larnaca | 845 | 972 | 1078 | 660 | 915 |
| Beirut | 2710 | 1727 | 1454 | 1901 | 2106 |
| Cairo | 45 | 83 | 51 | 94 | 67 |
Table 6.
Number of working hours (7am to 4 pm) with temperatures greater than the select threshold of 35 °C. All data are divided by quinquennia.
Table 6.
Number of working hours (7am to 4 pm) with temperatures greater than the select threshold of 35 °C. All data are divided by quinquennia.
| Location | Ta > 35 °C | ||||
| I | II | III | IV | V | |
| Venice | 3 | 3 | 2 | 11 | 2 |
| Genoa | 0 | 0 | 0 | 7 | 7 |
| Istanbul | 29 | 12 | 11 | 26 | 42 |
| Lecce | 354 | 343 | 281 | 367 | 610 |
| Valencia | 93 | 61 | 80 | 119 | 160 |
| Cagliari | 86 | 72 | 70 | 124 | 205 |
| Lamezia T. | 9 | 56 | 19 | 55 | 121 |
| Tunis | 725 | 607 | 648 | 627 | 1045 |
| Gibraltar | 2 | 6 | 4 | 2 | 9 |
| Larnaca | 208 | 212 | 199 | 235 | 636 |
| Beirut | 51 | 19 | 33 | 50 | 36 |
| Cairo | 1169 | 1461 | 1363 | 1962 | 1780 |
Heterogeneities are reported in this case as well. Considering the spatial distribution of all sites evaluated in this study, latitude alone is not a key regulating factor of exposure to dangerous HI levels. In Table 7, all sites are listed based on their latitude, i.e. from Venice, Italy to Cairo, Egypt, alongside the statistical data of evaluated regressions.
Table 7.
Statistical linear regression parameters of exposure to dangerous HI levels during working hours.
Table 7.
Statistical linear regression parameters of exposure to dangerous HI levels during working hours.
| Location | Slope (m) | Intercept (q) | R2 |
| Venice | 79.2 | 376 | 0.686 |
| Genoa | 25.9 | 410 | 0.091 |
| Istanbul | 143.7 | 232.7 | 0.855 |
| Lecce | 377.9 | 859.1 | 0.824 |
| Valencia | 190.3 | 605.7 | 0.477 |
| Cagliari | 350 | 104.8 | 0.848 |
| Lamezia T. | 247.5 | 598.3 | 0.827 |
| Tunis | 126.7 | 2203.9 | 0.6 |
| Gibraltar | 19.4 | 59 | 0.259 |
| Larnaca | 170.7 | 3718.7 | 0.581 |
| Beirut | 144.5 | 3187.9 | 0.536 |
| Cairo | 137.2 | 3954.4 | 0.304 |
For a number of cities such as Genoa, Gibraltar and Beirut, the linear growth rate is not relevant and the R2 value is considerably lower than 1, while other sites have yielded a statistically significant increase in the number of hazardous hours based on their HI. Istanbul does not yield a high number of hazardous hours based on the HI; however, it yields a significant number of working hours lost due to hazardous conditions based on the HI. This pattern is reported for other sites, such as Tunis and Lamezia Terme.
According to regulations applied by various countries, under normal operations, outdoor working activities would require to be stopped once air temperature crosses the 35 °C threshold. Figure 3 shows that this occurrence may be more common than expected in sites overlooking the Mediterranean Basin.
During working hours, as shown in Table 4, Table 5 and Table 6, the number of hours associated solely with the risk of T > 35°C or with the risk of 65% < RH < 99% is significantly lower than the number of hours in which the HI exceeds the “Danger” risk threshold. Moreover, the hourly daily analysis confirms that whenever the Ta > 35°C threshold is exceeded, that condition matches a threshold of “Danger” or above in terms of HI. Therefore, it can be stated that this index is conservative and protective in safeguarding workers health compared to risk assessments based solely on temperature.
Another key finding of the study is the extension of summertime conditions to the month of September, which normally falls under the Autumn category in climate studies. As evidenced in Figure 4, there is a clear upward trend in the number of hours with hazardous HI conditions during this month, although heterogenous tendencies are reported between select sites. This can be inferred from Figure 5, where an increasing trend in hours with hazardous HI levels is reported for all select locations.
The results of our statistical analyses are shown in Table 8. With the exception of Venice, all locations show a statistically significant increase in hazardous HI conditions over time.
Table 8.
Statistical parameters of the regression lines for hazardous HI conditions during the month of September, 2000-2024, by location.
Table 8.
Statistical parameters of the regression lines for hazardous HI conditions during the month of September, 2000-2024, by location.
| Locations | Slope (m) | Intercept (q) | R2 | p-value |
| Genoa | 0.20 | -0.89 | 0.63 | < 0.001 |
| Venice | 0.05 | 0.68 | 0.09 | 0.154 |
| Cagliari | 1.38 | -1.99 | 0.72 | < 0.001 |
| Lecce | 2.20 | 6.09 | 0.6 | < 0.001 |
| Lamezia T. | 0.52 | 11.74 | 0.20 | 0.025 |
| Beirut | 2.70 | 106.09 | 0.83 | < 0.001 |
| Istanbul | 0.29 | 0.25 | 0.29 | 0.005 |
| Tunis | 1.96 | 43.40 | 0.66 | < 0.001 |
| Valencia | 0.97 | 3.40 | 0.50 | < 0.001 |
| Cairo | 2.23 | 121.55 | 0.73 | < 0.001 |
| Gibraltar | 0.06 | -0.09 | 0.42 | < 0.001 |
| Larnaca | 4.29 | 103.26 | 0.81 | < 0.001 |
A longer period with climate conditions deemed dangerous for human health, now extending to the month of September, can result in hazardous conditions also in the presence of cooler periods in between. Due to thermoregulatory acclimatization, the human body adapts to prolonged exposure to lower ambient temperatures. However, a subsequent exposure to higher temperatures causes an additional physiological strain, potentially increasing the risk of heat-related stress responses.
4. Conclusions
This work relies on punctual climate data gathered for 25 continuous years (2000-2024) to assess trends in hazardous Heat Index (HI) conditions in twelve locations overlooking the Mediterranean Basin. The study period was divided in five quinquennia. The results clearly indicate that most locations are subject to an increase in hazardous HI conditions over time, with some of the results being particularly significant. Furthermore, the extension of summertime conditions to the month of September was also demonstrated with an increase in favorable conditions during that month across the study period. The results also indicate that using the temperature threshold of 35 °C alone as a condition past which local regulations cause outdoor working activities to stop as a hazard mitigation measure, is not sufficient. Although the HI methodology does not consider worker- and working environment-specific susceptibility to heat, this works highlights the increase in potential hazards for outdoor working activities in the Mediterranean Basin.
Should the upward trend be confirmed in forthcoming years, safety regulations and measures, as well as sustainable policies, would need to adapt to these changes, and also reduce the economic loss caused by the interruption of working activities caused by these mitigation measures.
References
- Kaźmierczak, A. et al. European Environment Agency: Climate change as a threat to health and well-being in Europe: focus on heat and infectious diseases, EEA Report No 07/2022, 2022. ISBN: 978-92-9480-508-9, ISSN: 1977-8449.
- Errico, E. , Di Nunzio D. Caldo estremo e salute e sicurezza sul lavoro: il ruolo del dialogo sociale. I risultati del progetto Adaptheat per il contesto italiano, Working Paper n. 5, Fondazione Di Vittorio, Roma. 2024. [CrossRef]
- Narocki, C. Report 2021.06 - Heatwaves as an occupational hazard. Brussels 2021, mISBN: 978-2-87452-613-8.
- Fatima, S.H. , Rothmore, P.R., Giles, L. C., Varghese, B. M., Bi, P. Extreme heat and occupational injuries in different climate zones: A systematic review and meta-analysis of epidemiological evidence. Environ. Int. 2021, 148, 106384. [Google Scholar] [CrossRef] [PubMed]
- Ioannou, L.G. , Foster, J. , Morris, N.B., Piil, J.F., Havenith, G., Mekjavic, I.B., Kenny, G.P., Nybo, L., Flouris, A.D. Occupational heat strain in outdoor workers: A comprehensive review and meta-analysis, Temperature 2022, 9, 67–102. [Google Scholar]
- Martinez-Solanas, E. , Lopez-Ruiz, M., Wellenius, G. A., Gasparrini, A., Sunyer, J., Benavides, F. G., Basagna, X. Evaluation of the Impact of Ambient Temperatures on Occupational Injuries in Spain. Environ Health Perspect 2018, 126, 067002. [Google Scholar] [CrossRef] [PubMed]
- Di Blasi, C. , et al. Effects of Temperatures and Heatwaves on Occupational Injuries in the Agricultural Sector in Italy, Int. J. Environ. Res. Public Health 2023, 20, 2781. [Google Scholar] [PubMed]
- Gariazzo, C. , Taiano, L., Bonafede, M., Leva, A., Morabito, M., De’ Donato, F., Marinaccio, A. Association between extreme temperature exposure and occupational injuries among construction workers in Italy: An analysis of risk factors. Environ Int. 2023, 171, 107677. [Google Scholar] [CrossRef] [PubMed]
- WORKCLIMATE 2.0 Clima Lavoro Prevenzione, https://www.worklimate.it/, last accessed 2025/04/16.
- Del Gaudio, M. , Freda, D., Avino, P., Nataletti, P., Sabatino, R. La valutazione del microclima, INAIL, Milano, (2018).
- UNI EN ISO 7243: Ergonomics of the thermal environment — Assessment of heat stress using the WBGT (wet bulb globe temperature) index, (2017).
- UNI EN ISO 7933: Ergonomics of the thermal environment — Analytical determination and interpretation of heat stress using calculation of the predicted heat strain, (2023).
- Al-Bouwarthan, M. , Quinn, M. M., Kriebel, D., David H. Wegman, D.H. Assessment of Heat Stress Exposure among Construction Workers in the Hot Desert Climate of Saudi Arabia, Ann. Work. Expo. Health 2019, 63, 505–520. [Google Scholar]
- NOAA (National Oceanic and Atmospheric Administration), NCEP (National Centers for Environmental Prediction), WPC (National Weather Service) Heat Index Chart, https://www.weather.gov/ffc/hichart, last accessed 2025/01/20.
- NOAA (Nation Oceanic and Atmospheric Administration), NCEI (National Center for Environmental Information), https://www.ncei.noaa.gov/archive ì. Dataset from 2000 to 2024, last accessed 2025/01/20.
- Tool Monthly Reanalysis Maps of Climate Reanalyzer, https://climatereanalyzer.org/research_tools/monthly_maps/, last accessed 2025/04/16.
- NOAA (National Oceanic and Atmospheric Administration), NCEP (National Centers for Environmental Prediction), WPC (National Weather Service), Heat Index Equation, https://www.wpc.ncep.noaa.gov/html/heatindex_equation.shtml, last accessed 2025/01/20.
- Marinaccio, A.; et al. Climate change and occupational health and safety. Risk of injuries, productivity loss and the co-benefits perspective, Environ. Res. 2025, 269, 120844. [Google Scholar] [PubMed]
- Bonafede, M. Decalogo Per La Prevenzione Delle Patologie Da Calore E Da Esposizione A Radiazione Solare Nei Luoghi Di Lavoro - Informativa Per I Datori Di Lavoro, Materiale Informativo | Worklimate: Decalogo-per-la-prevenzione-delle-patologie-da-calore-e-da-esposizione-a-radiazione-solare-nei-luoghi-di-lavoro_27.05.2024.pdf, last accessed 2025/04/18.
- D’Amico, F. , Gullì, D., Lo Feudo, T., Ammoscato, I., Avolio, E., De Pino, M., Cristofanelli, P., Busetto, M., Malacaria, L., Parise, D., Sinopoli, S., De Benedetto, G., Calidonna, C.R. Cyclic and multi-year characterization of surface ozone at the WMO/GAW coastal station of Lamezia Terme (Calabria, Southern Italy): implications for local environment, cultural heritage, and human health. Environments 2024, 11, 227. [Google Scholar]
Disclaimer/Publisher’s Note: The statements, opinions and data contained in all publications are solely those of the individual author(s) and contributor(s) and not of MDPI and/or the editor(s). MDPI and/or the editor(s) disclaim responsibility for any injury to people or property resulting from any ideas, methods, instructions or products referred to in the content. |
© 2025 by the authors. Licensee MDPI, Basel, Switzerland. This article is an open access article distributed under the terms and conditions of the Creative Commons Attribution (CC BY) license (https://creativecommons.org/licenses/by/4.0/).
Copyright: This open access article is published under a Creative Commons CC BY 4.0 license, which permit the free download, distribution, and reuse, provided that the author and preprint are cited in any reuse.