Submitted:
12 September 2025
Posted:
15 September 2025
You are already at the latest version
Abstract
Multi-sensor fire detection technology has been widely adopted in practical applications; however, existing methods still suffer from high false alarm rates and inadequate adaptability in complex environments due to their limited capacity to capture deep time-series dependencies in sensor data. To enhance the robustness and accuracy of fire detection, this paper proposes a fire detection model based on a Bidirectional Long Short-Term Memory network with Layer Normalization and Self-Attention (BiLSTM-LN-SA). The model employs a Bidirectional LSTM (BiLSTM) to autonomously extract intricate time-series features and long-term dependencies from multi-sensor data. Furthermore, Layer Normalization(LN) is introduced to effectively mitigate feature distribution shifts across different environments, thereby improving the model's adaptability to cross-scenario data distributions and generalization capability. Coupled with a self-attention mechanism that dynamically evaluates the importance of features at different time steps, the model adaptively enhances fire-critical information and achieves deeper dynamic process-aware feature fusion. Experimental results on a real-world fire dataset demonstrate that the BiLSTM-LN-SA model effectively identifies fire events, exhibiting superior detection performance.
Keywords:
multi-sensor data fusion
; fire detection
; BiLSTM
; self-attention
; layer normalization
1. Introduction
As one of the primary disasters threatening human life and property, accurate fire detection remains a critical challenge in the field of public safety. The core objective of fire detection technology is to simultaneously achieve a low False Positive Rate (FPR) and a low False Negative Rate (FNR). The FPR refers to the probability of a detector being erroneously triggered in non-fire scenarios, while the FNR denotes the probability of a detector failing to respond during an actual fire event. Enhancing the accuracy and reliability of fire detection methods is of paramount importance for both theoretical research and practical applications[1].
In recent years, with the acceleration of urbanization and the increasing complexity of industrial environments, traditional fire detection methods relying on single-sensor threshold judgments have exposed significant limitations. On one hand, single-dimensional environmental indicators, such as smoke, temperature, or gas concentration, are susceptible to transient noise interference, resulting in high false positive rates (FPR). For instance, water vapor, dust, or even insects can trigger false alarms in smoke detectors[1,2,3]. On the other hand, fire is a dynamically evolving process that often exhibits subtle early-stage characteristics with time-series patterns across multimodal signals. Conventional methods, which typically ignore time-series dependencies, struggle to capture such latent risks, leading to delayed detection or high False Negative Rates (FNR)[4]. Multi-sensor information fusion, which integrates multidimensional environmental indicators such as temperature, smoke, and CO/CO₂ concentrations, effectively mitigates the perceptual limitations of single sensors[5]. As multi-sensor fusion has become mainstream, various fusion algorithms have been developed to better leverage complementary sensor information.
Solórzano et al. [6] analyzed the performance of gas sensor arrays and proposed a calibration model with long-term predictive capabilities, effectively enhancing the detection accuracy and stability of gas sensor arrays. Li et al. [7] developed a fire detection method for early fire identification, utilizing the normalized concentration ratio of carbon monoxide to carbon dioxide as a key alarm parameter. Chen Shin-Juh et al. [8] proposed a threshold-based fire detection method by calculating the growth rates of carbon monoxide, carbon dioxide, and smoke concentrations. Baek et al. [9] investigated the performance of multi-sensor systems during the fire perception phase, introducing a sensor data processing method based on a similarity matching algorithm. Liu et al. [10] improved weighted information fusion and Kalman filter fusion algorithms, enhancing system reliability by dynamically adjusting sensor weights. Liu et al. [11] proposed a multi-sensor fusion localization method based on Batch Inverse Covariance Intersection (BICI) to address localization drift issues in confined spaces. Wang et al. [12] introduced a weighted fusion algorithm based on an improved Analytic Hierarchy Process (AHP), enabling rapid detection of aircraft fires and improving timeliness and accuracy in complex scenarios such as aviation fire detection. Chen Jing et al. [13] leveraged the graphical knowledge representation and uncertainty handling capabilities of Bayesian Networks (BN) for fire alarm system analysis. Ran et al. [14] proposed a probabilistic statistical framework for multi-sensor data fusion, extending the lifespan of wireless sensor networks while improving data accuracy. Jana et al. [15] developed a novel algorithm that integrates logistic regression, SVM, decision trees, and naïve Bayes classifiers through feature engineering preprocessing, enhancing prediction accuracy and robustness. Baek et al. [16] introduced a new fire monitoring framework employing Support Vector Machines with a Dynamic Time Warping Kernel (SVM-DTWK), which accounts for the time series dynamics of various fire sensor signals. These methods typically rely on precise system models or prior knowledge, exhibiting limited capabilities in handling complex nonlinear relationships.
The Dempster-Shafer (D-S) evidence theory is a powerful tool for handling uncertainty, with its primary advantage being the ability to flexibly fuse information from different evidence sources (sensors) without requiring prior probability information. Ding et al. [17] developed a multi-sensor building fire alarm system, utilizing D-S evidence theory to integrate data from light, smoke, and temperature sensors. Li et al. proposed several improvements, such as optimizing the Basic Probability Assignment (BPA) function or modifying fusion rules, to enhance the reliability of fusion results [18,19]. In tunnel fire detection, Wang et al. introduced a two-level fusion framework that optimizes BPA and employs trust coefficients to address evidence conflicts, significantly improving the accuracy and response speed of fire detection. Su et al. [20] designed a gradient data fusion model for detecting fires in aging communities, reducing misjudgments in traditional systems. Zhang et al. [21] proposed a novel fire detection approach combining Backpropagation (BP) neural networks with D-S evidence theory, further introducing an evidence correction method based on exponential entropy.
Artificial intelligence methods represent a current research hotspot and a primary direction for development. Sowah et al. [22] developed a fuzzy logic system using Arduino, integrating data from smoke, temperature, and flame sensors to achieve fire detection. Hong Bao et al.[23] employed a fuzzy inference system to fuse empirical fire signal characteristics and fitted fire data features, deriving the final fire probability. Rachman et al. [24] designed a system capable of expanding the fire detection range, which collects data from multiple sensors and processes it using fuzzy logic methods to enable effective fire detection.
Wang Xihuai et al. [25] developed a multi-sensor fire detection algorithm for shipboard fire detection based on a fuzzy neural network. This algorithm employs multi-sensor integration and multi-parameter fusion to achieve multi-level fire alarming for maritime applications. Qu et al. [26] utilized a Backpropagation Neural Network (BPNN) to fuse data from temperature, smoke concentration, and CO concentration, effectively improving the accuracy of fire warnings. Wu et al. [27] enhanced the BPNN by incorporating non-uniform sampling and trend extraction as inputs, improving the model’s ability to distinguish fire signals from environmental interference. Jiang et al. [28] proposed an intelligent fire detection system based on a fuzzy neural network for multi-sensor information fusion. This system integrates data from temperature, smoke, and carbon monoxide sensors—three parameters with distinct fire-related characteristics—and employs an intelligent fuzzy neural network algorithm to determine the probability of a fire occurrence.
Wen et al. [29] analyzed the seasonal adjustment of time-series data for fire alarm reception, summarizing the fundamental characteristics of seasonal factors. This study provides valuable reference for fire departments to optimize the allocation of firefighting resources, thereby enhancing fire prevention and response capabilities. Ryder et al. [30] proposed a hierarchical temporal memory algorithm and discussed its advantages and limitations for fire state determination in continuous learning environments. Yang Li et al. [31] introduced the TCN-AAP-SVM algorithm, which effectively incorporates the time series dimension of sensor data, demonstrating robust classification performance. Nakip et al. [32] proposed a recursive trend prediction neural network (rTPNN) that integrates trend prediction with hierarchical forecasting of sensor data, achieving significant improvements over traditional Support Vector Machines (SVM) and Bayesian networks. Liu et al. [33] developed the EIF-LSTM model, which fuses environmental indicator variations and contextual information, achieving high performance on the NIST dataset. Deng et al. [34] proposed an indoor fire detection method based on multi-sensor fusion and a lightweight Convolutional Neural Network (CNN), resulting in an efficient lightweight CNN for indoor fire detection. Sun et al. [35] employed an Evidence Reasoning (ER) approach combined with a Particle Swarm Optimization (PSO) algorithm to assess dynamic fire risk levels using heterogeneous multi-source data, including fire images, smoke images, temperature, and carbon monoxide concentrations. Zhang et al.[36]introduced a novel anomaly detection method based on dynamic graph neural networks, which fuses time series features and modality-related features extracted from each sensor node into a vector representation. This is further aggregated with spatial features representing the spatial relationships of nodes to identify anomalous states based on the fused features.
Through an analysis of existing research, it is demonstrated that utilizing trend features derived from sensor measurements can, to some extent, enhance the accuracy of fire detection. However, a common shortcoming of these methods is their failure to fully exploit the correlative features inherent in multi-sensor time-series data. As a result, the complexity of practical environments introduces significant interference, rendering such systems susceptible to elevated rates of false alarms and missed detections.
This paper presents a multi-sensor fire detection algorithm based on a Bidirectional Long Short-Term Memory (BiLSTM) network integrated with Layer Normalization and a self-attention mechanism, termed BiLSTM-LN-SA. The algorithm utilizes the BiLSTM to capture profound time-series dependencies within each environmental indicator. A Layer Normalization module is then incorporated to stabilize the feature distribution and mitigate cross-environmental shifts, thereby enhancing the model’s generalization capability. Subsequently, a self-attention mechanism is employed to dynamically focus on the most discriminative time-series features. As a result, the proposed approach improves both the accuracy and robustness of fire detection.
2. The Proposed Method
This section introduces the overall framework of the proposed algorithm, along with the specific structures and implementation details of its components. The framework comprises the following key modules: Data Preprocessing Module, Time-Series Feature Extraction Module, Feature Enhancement Module, and Classification Module. The overall architecture is shown in Figure 1.
2.1. Data Preprocessing Module
The data preprocessing Module transforms raw sensor data into a unified, structured dataset through data normalization and time-series sequence construction, enabling subsequent model training and evaluation.
- (1)
- Normalization;
Normalization is applied to sensor data to mitigate the effects of inherent variations in numerical ranges across different sensor types, thereby scaling the values to a common interval and ensuring consistent input for subsequent model training and evaluation. The normalization process is as follows:
(1)
Where is the original sensor data value, is the maximum value, is the. minimum value, and is the normalized data value, scaled to the range[0, 1]. During normalization, the minimum and maximum values are determined exclusively from the training dataset.
- (2)
- Time-Series Data Generation;
After normalizing, the preprocessed sensor data is used to construct the input matrix , with dimensions , where represents the time steps and denotes the number of sensor features. In this study, N=4, corresponding to the features: temperature, TVOC, CO2, and NC2.5.
2.2. Time-Series Feature Extraction Module
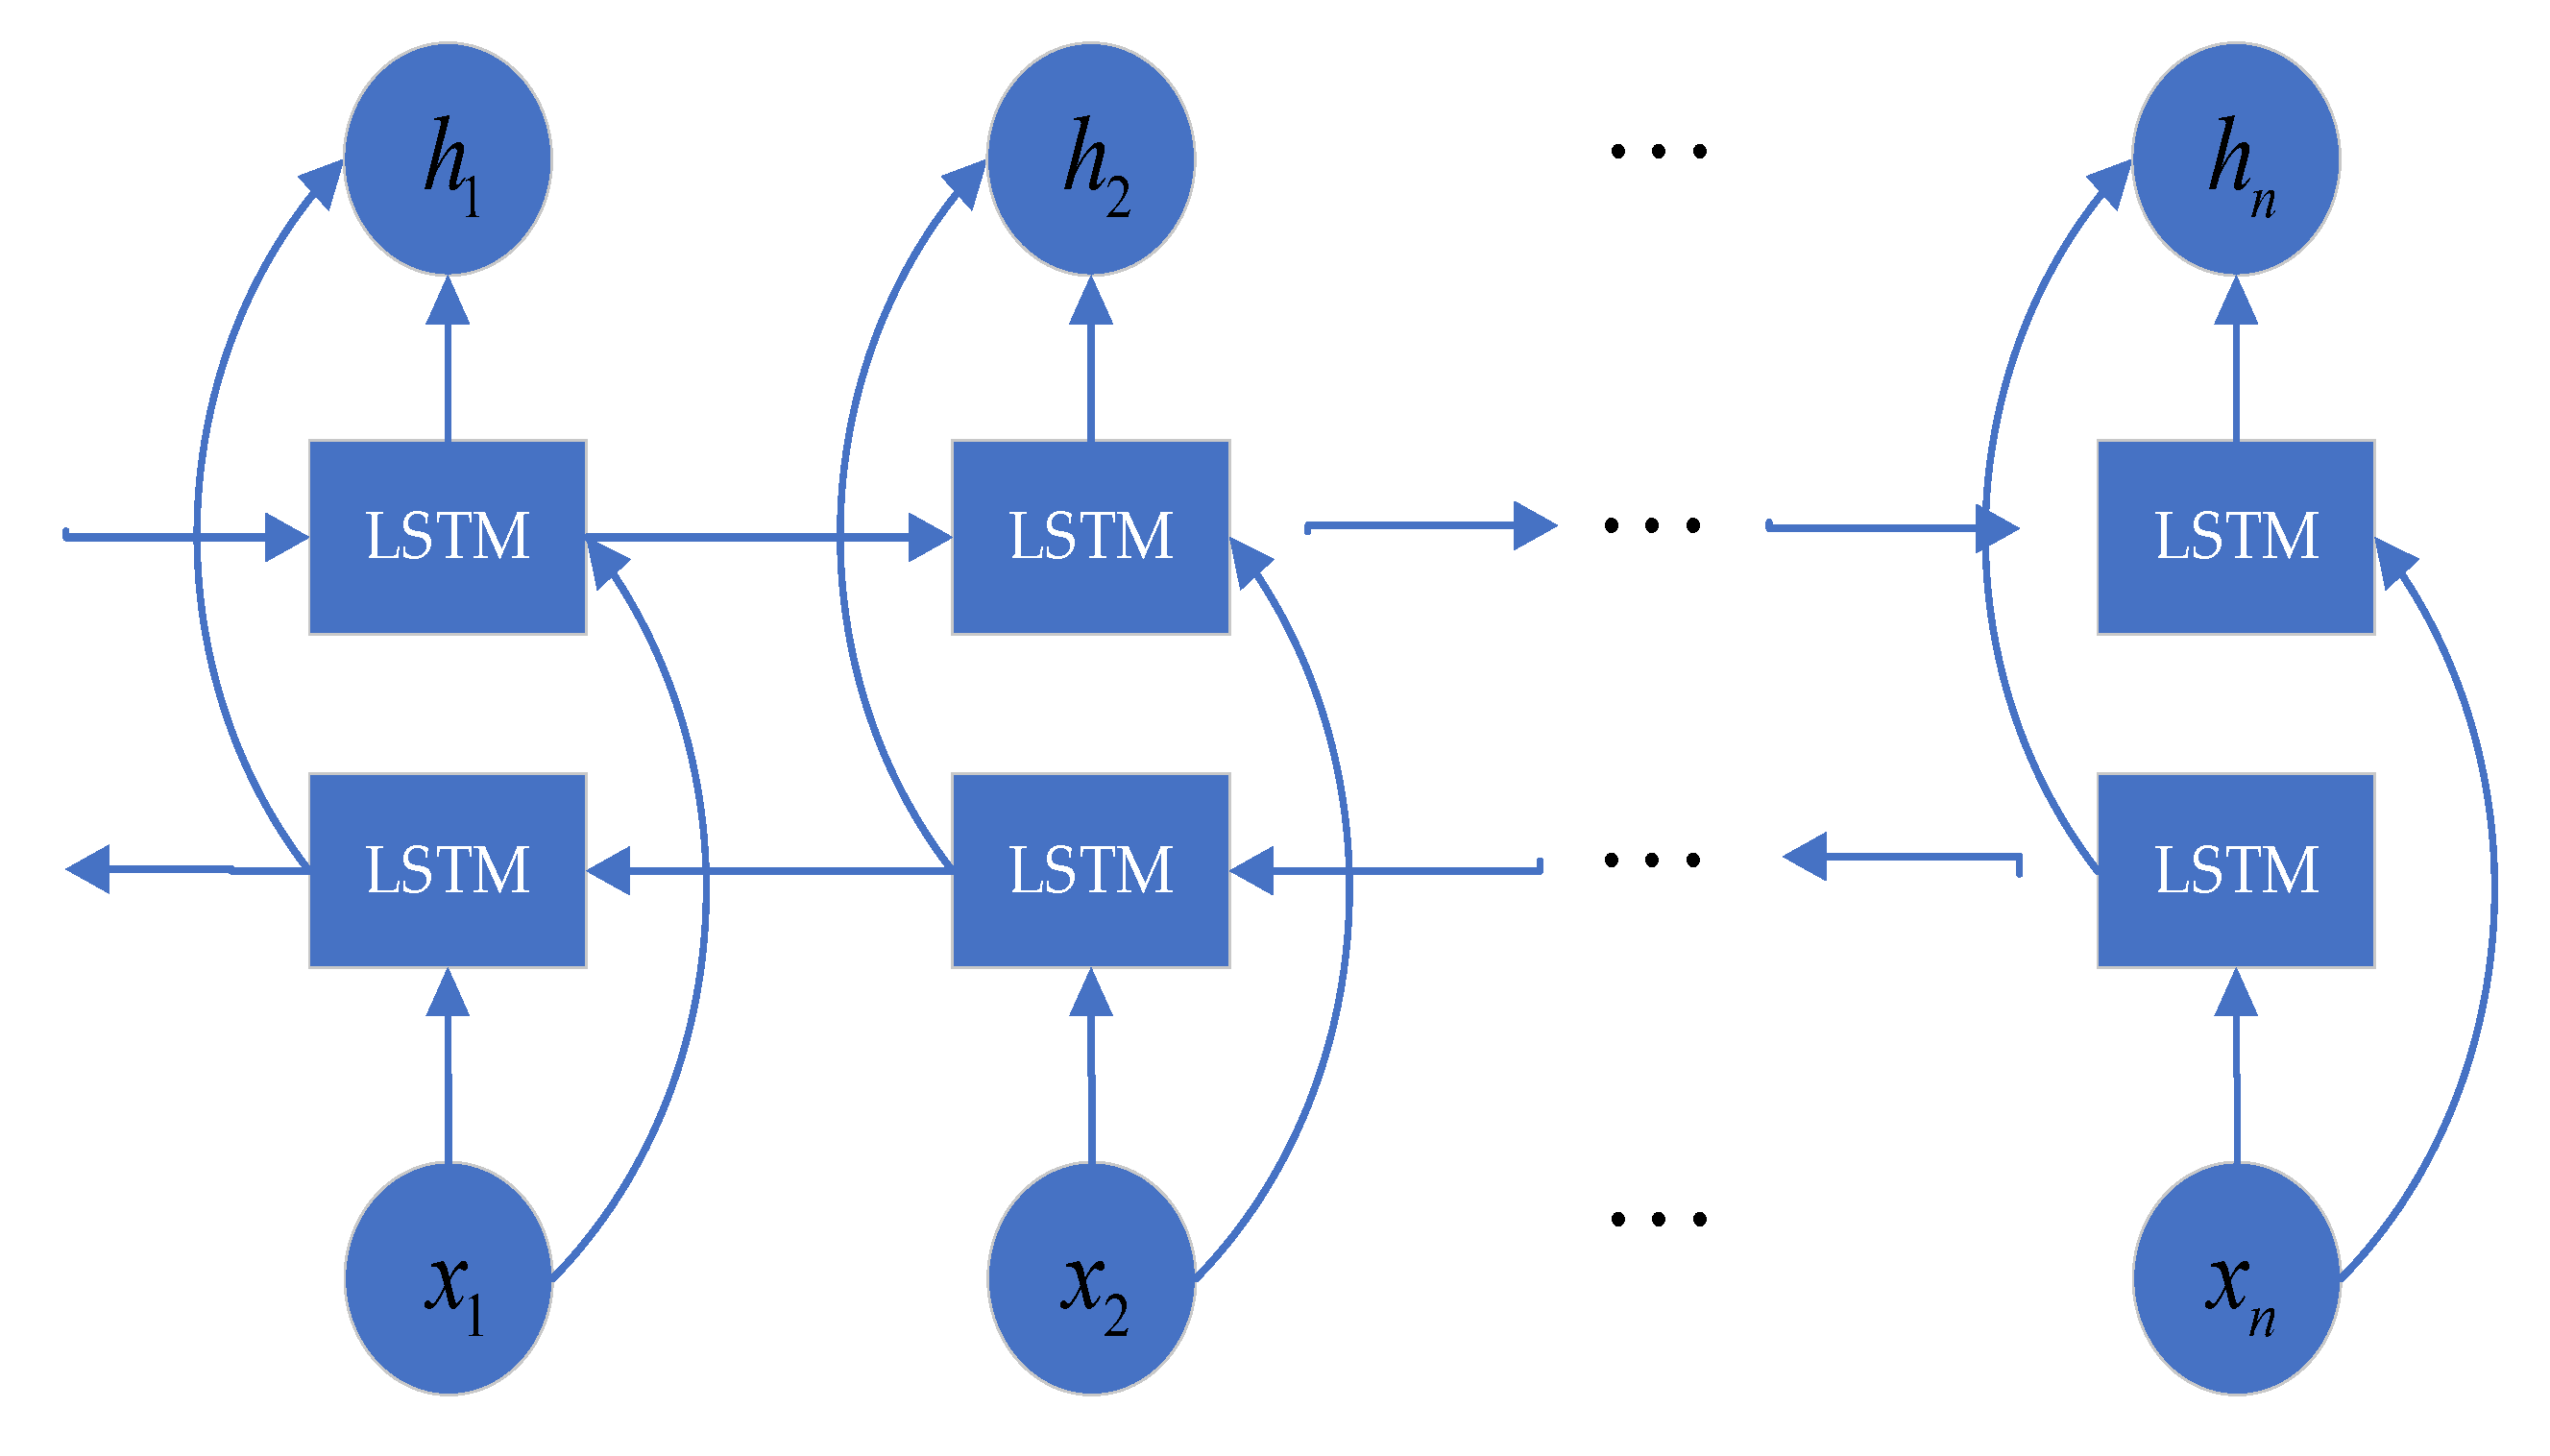
The time-series feature extraction module, constructed based on a Bidirectional LSTM (BiLSTM) architecture, serves as a foundational representation layer for multi-sensor data. It is designed to capture dynamic time-series features from input time-series matrices. Unlike traditional Long Short-Term Memory (LSTM) networks, which generate hidden states based solely on historical information, the BiLSTM processes the sequence in both forward and backward directions using two separate LSTM units and integrates the hidden states from both directions. As a result, the model captures contextual information from both past and future time steps, enabling more comprehensive and robust extraction of dynamic time-series features. This capability is particularly essential in fire detection, where sensor data exhibits strong time-series dependencies, and accurate determination of the fire state at any moment relies on integrating information from both preceding and subsequent readings. The Architecture of this BiLSTM module is illustrated in Figure 2. The computation process is as follows:
(2)
Here, and denote the hidden states of the forward and backward LSTM at time step , respectively, each containing hidden units. The concatenated hidden state at each time step is represented as .The final output is a time series feature matrix , formed by concatenating the hidden states across all time steps, with a dimension of .
This resulting matrix, which represents the output of the BiLSTM-based feature extraction module, integrates bidirectional contextual information and hierarchically fused cross-sensor features derived from the simultaneous input of four sensor readings at each time step. It effectively captures long-range dependencies within the multi-sensor sequence, thereby enhancing the recognition of weak yet persistent fire indicators. The architecture allows the model to gradually integrate multi-source information during processing, drawing on complementary environmental signals from all sensors to support its ability to distinguish between false alarms and genuine fire events.
Figure 2.
Architecture of the BiLSTM model for fire detection.
2.3. Feature Enhancement Module
The feature enhancement module incorporates a self-attention mechanism, which enables the model to automatically assign differentiated weights to individual time steps within the input sequence. This design allows the network to selectively focus on segments of the sensor data that are most relevant for fire recognition, as the significance of readings often varies considerably across time. By emphasizing critical intervals in the time series, the self-attention mechanism refines the BiLSTM-output features and extracts key time-step information, thereby contributing to more informed and context-aware decision-making. The architecture of this self-attention mechanism is depicted in Figure 3. The detailed computational procedure is as follows.
First, the time-series features extracted from the sensors are processed by a Layer Normalization module. This operation stabilizes the feature distribution and mitigates internal covariate shift across different environments, ensuring a more stable and efficient learning process for the subsequent attention mechanism. The operations are defined as follows:
(3)
Here, and are the mean and variance computed dynamically across the feature dimension of each individual sample within ; This operation does not rely on any statistics accumulated during training, ensuring consistent and stable behavior for both training and inference. is a small constant included for numerical stability. The normalization promotes robustness by emphasizing relative anomalies and internal feature relationships rather than absolute feature values, which enhances the model’s adaptability to varying environmental conditions.
These normalized features are then projected into query (Q), key (K) and value(V) spaces through learnable weight matrices and , respectively. This projection facilitates the modeling of interactions and correlations across different sensors and time steps. The operations are defined as follows:
(4)
The attention weight matrix , which captures the relative importance of each time step, is then computed as the softmax of the scaled dot-products between queries() and keys():
(5)
The scaling factor stabilizes the gradients during training. the attention weights are used to compute a weighted sum of the features
2.4. Classification Module
The classification module maps the extracted sensor fused features into a predicted probability of fire occurrence. Its key function is to convert high-level abstract representations into a quantifiable fire risk score. This component consists of a global average pooling layer followed by a classification head network. The overall architecture of this module is illustrated in Figure 4.
- (1)
- Global Average Pooling
This layer aggregates time series features into a unified global representation, preserving the overarching trend of sensor measurements across the entire time window. It summarizes the sequential information by averaging feature values over all time steps, thereby capturing dominant patterns such as sustained temperature increases. The operation is defined as equation (6):
. (6)
where is the number of time steps, is the input feature matrix, and is the resulting pooled feature vector.
- (2)
- Classification Head
The classification head is designed to map fused features into a discriminative representation space suitable for fire event detection, ultimately producing a probabilistic fire prediction through sigmoid activation.
First, the pooled feature vector is processed by a fully connected layer with ReLU activation to capture nonlinear patterns inherent in fire-related sensor dynamics. This is formulated as:
(7)
where, and denote learnable weights and biases, and ReLU activation introduces nonlinearity to model complex feature interactions indicative of fire events
Subsequently, the features are projected onto a fire probability score by the Fire Probability Projection Layer (a sigmoid-activated linear transformation):
(8)
Where are learnable parameters, and denotes the sigmoid function. The output represents the estimated probability of a fire event, enabling flexible binary decision-making through application-dependent thresholding.
3. Experiments
In this section, we evaluate the performance of our proposed method against several contemporary approaches, namely NP, MLP, rTPNN, and EIF-LSTM, on the task of real-fire detection[32,33].
3.1. Datasets and Experiment Preparation
We use a publicly available fire dataset[37]. The data were collected using IoT devices. To ensure the construction of a representative training set, samples were gathered from a wide range of environments and fire sources. The captured scenarios include:
- Normal indoor conditions
- Normal outdoor conditions
- Indoor wood fire within a firefighter training area
- Indoor gas fire within a firefighter training area
- Outdoor wood, coal, and gas grill fires
- High-humidity outdoor environments
All sensors were sampled at a rate of 1 Hz. A UTC timestamp is included with every reading to facilitate data tracking and synchronization. To structure the data for time-series classification, we segmented the continuous data into overlapping windows of 20 consecutive time steps (=20). This resulted in a final dataset of 49888 independent samples, each representing a 20-second window of multi-sensor data and labeled with the fire state at the end of the window.
We employed 10-fold cross-validation on the dataset to comprehensively evaluate the performance of the proposed method. Throughout the training process, the input takes the form of a three-dimensional tensor with dimensions, where:
- B denotes the batch size, set to 32, indicating the number of samples processed in each batch;
- T indicates the number of time steps, which is set to 20, corresponding to the length of consecutive sensor readings per sample;
- N represents the number of sensors (or sensor channels), which is set to 4 in this study.
The output tensor has a shape of , corresponding to the binary fire state prediction for each input sample in the batch.
3.2. Experimental Results Analysis
This section presents the experimental results of various detection methods, with interpretation and analysis based on multiple evaluation metrics, including accuracy, confusion matrix, F1-score, and ROC curve.
3.2.1. Metrics of Accuracy
Accuracy, defined as the proportion of correctly classified samples, is a fundamental performance metric for classification tasks. In fire detection, it directly reflects the detection efficacy and generalization capability of an algorithm. The “Mean” values in the tables represent the average accuracy from 10-fold cross-validation on the training and test sets, quantifying the model’s overall performance. The “Std” (standard deviation) indicates the dispersion of results across the folds, where a lower value denotes higher consistency and robustness.
As shown in Table 1, BiLSTM-LN-SA demonstrates advantages in both mean accuracy and standard deviation. Its mean test accuracy reaches 98.38%, outperforming EIF-LSTM (95.30%) by 3.08 percentage points, rTPNN (93.85%) by 4.53 percentage points, and significantly surpassing MLP (88.27%) and NP (80.12%). This improvement is primarily attributed to the model’s enhanced capability to excavate and integrate features from multi-sensor time-series data. This approach effectively mitigates the limitations of single-sensor representations and significantly strengthens the discriminative power for identifying fire-related patterns.
To further validate the advantage of multi-sensor fusion, we compared the performance against systems using individual sensor data, as presented in Table 2. A noticeable performance gap exists, with the highest test accuracy among single-sensor data being only 85.75% (TVOC). This gap arises because univariate physical signals are insufficient to characterize the multi-stage dynamics of fire events. The limitation in feature diversity inherently restricts their discriminative capability.
The accuracy results confirm the effectiveness of the BiLSTM-LN-SA model. The combination of a high mean and a low standard deviation preliminarily validates the advantage of its architecture in integrating multi-sensor time-series information and enhancing model robustness.
3.2.2. Metrics of Confusion Matrix
The confusion matrix serves as a fundamental tool for evaluating classification performance by comparing predicted outcomes against actual instances. In contrast to accuracy, which only considers the overall probability of correct classification, the confusion matrix addresses accuracy’s limitation by providing a detailed breakdown of different types of classification errors. The confusion matrix in this study includes four key metrics: True Positive Rate (TPR), False Negative Rate (FNR), True Negative Rate (TNR), and False Positive Rate (FPR). TPR reflects the rate of actual fires correctly identified, while FNR indicates the rate at which fires are missed. Conversely, TNR measures the correct identification of non-fire events, and FPR represents the rate of false alarms. These four metrics obey the following relations: TPR+FNR=100% and TNR+FPR=100%.
The confusion matrix metrics of BiLSTM-LN-SA and other multi-sensor methods are compared in Table 3. The proposed model demonstrates superior performance across all four key metrics: it achieves a TPR of 98.15% and an FNR as low as 1.85%. Compared to EIF-LSTM (FNR = 4.80%), this represents a reduction of 2.95 percentage points in the false negative rate. Additionally, BiLSTM-LN-SA attains a TNR of 98.50% and an FPR of only 1.50%, which is 1.6 percentage points lower than that of EIF-LSTM (FPR = 3.10%). These results indicate that BiLSTM-LN-SA improves fire detection accuracy and reduces the false alarm rate.
To further illustrate the effectiveness of the multi-sensor fusion strategy, the BiLSTM-LN-SA model was compared with various single-sensor methods, as listed in Table 4. The results indicate inherent limitations in single-sensor approaches. For example, the temperature-based approach achieves a TPR of only 28.30%, whereas BiLSTM-LN-SA exceeds it by over 69.85 percentage points. Although certain single-sensor methods achieve a relatively low FPR (e.g., the TVOC-based method has an FPR of 0.90%), their TPR remains considerably low (e.g., 85.40%), making it difficult to balance detection rate and false-alarm rate effectively.
In summary, BiLSTM-LN-SA achieves an effective balance between the missed detection rate and the false alarm rate, thereby offering a reliable solution for intelligent fire detection in complex scenarios.
3.2.3. Metrics of F1-Score
The F1-score is a comprehensive metric used for evaluating classification performance, defined as the harmonic mean of precision aned as follows:
In the context of fire detection, precision indicates the proportion of correctly identified fire events among all alarms triggered, while recall (also known as sensitivity) measures the model’s ability to detect actual fires, thereby directly influencing the risk of missed detections.
The F1-score balances both the accuracy and completeness of positive-class predictions, with values ranging between [0, 1]. Values closer to 1 indicate better overall classification performance.
As shown in Figure 5, the multi-sensor fusion method BiLSTM-LN-SA achieved an F1-score of 0.98, which is higher than that of other methods. These results demonstrate that BiLSTM-LN-SA achieves a good balance between precision and recall, reflecting its capability for comprehensive classification performance.
The high F1-score underscores the effectiveness of BiLSTM-LN-SA in leveraging cross-feature fusion and time series modeling, which enhances detection reliability while reducing both missed detections and false alarms.
3.2.4. Metrics of ROC Curve
Receiver operating characteristic (ROC) curves provide a graphical representation of classification model performance under different decision thresholds. In the context of fire detection, the ROC curve illustrates the relationship between the true positive rate (TPR) and the false positive rate (FPR). Additionally, the area under the ROC curve, known as the area under the curve (AUC), quantifies the discriminative ability of the detection algorithm. The AUC value typically falls between 0.5 and 1, with higher values indicating better classification performance.
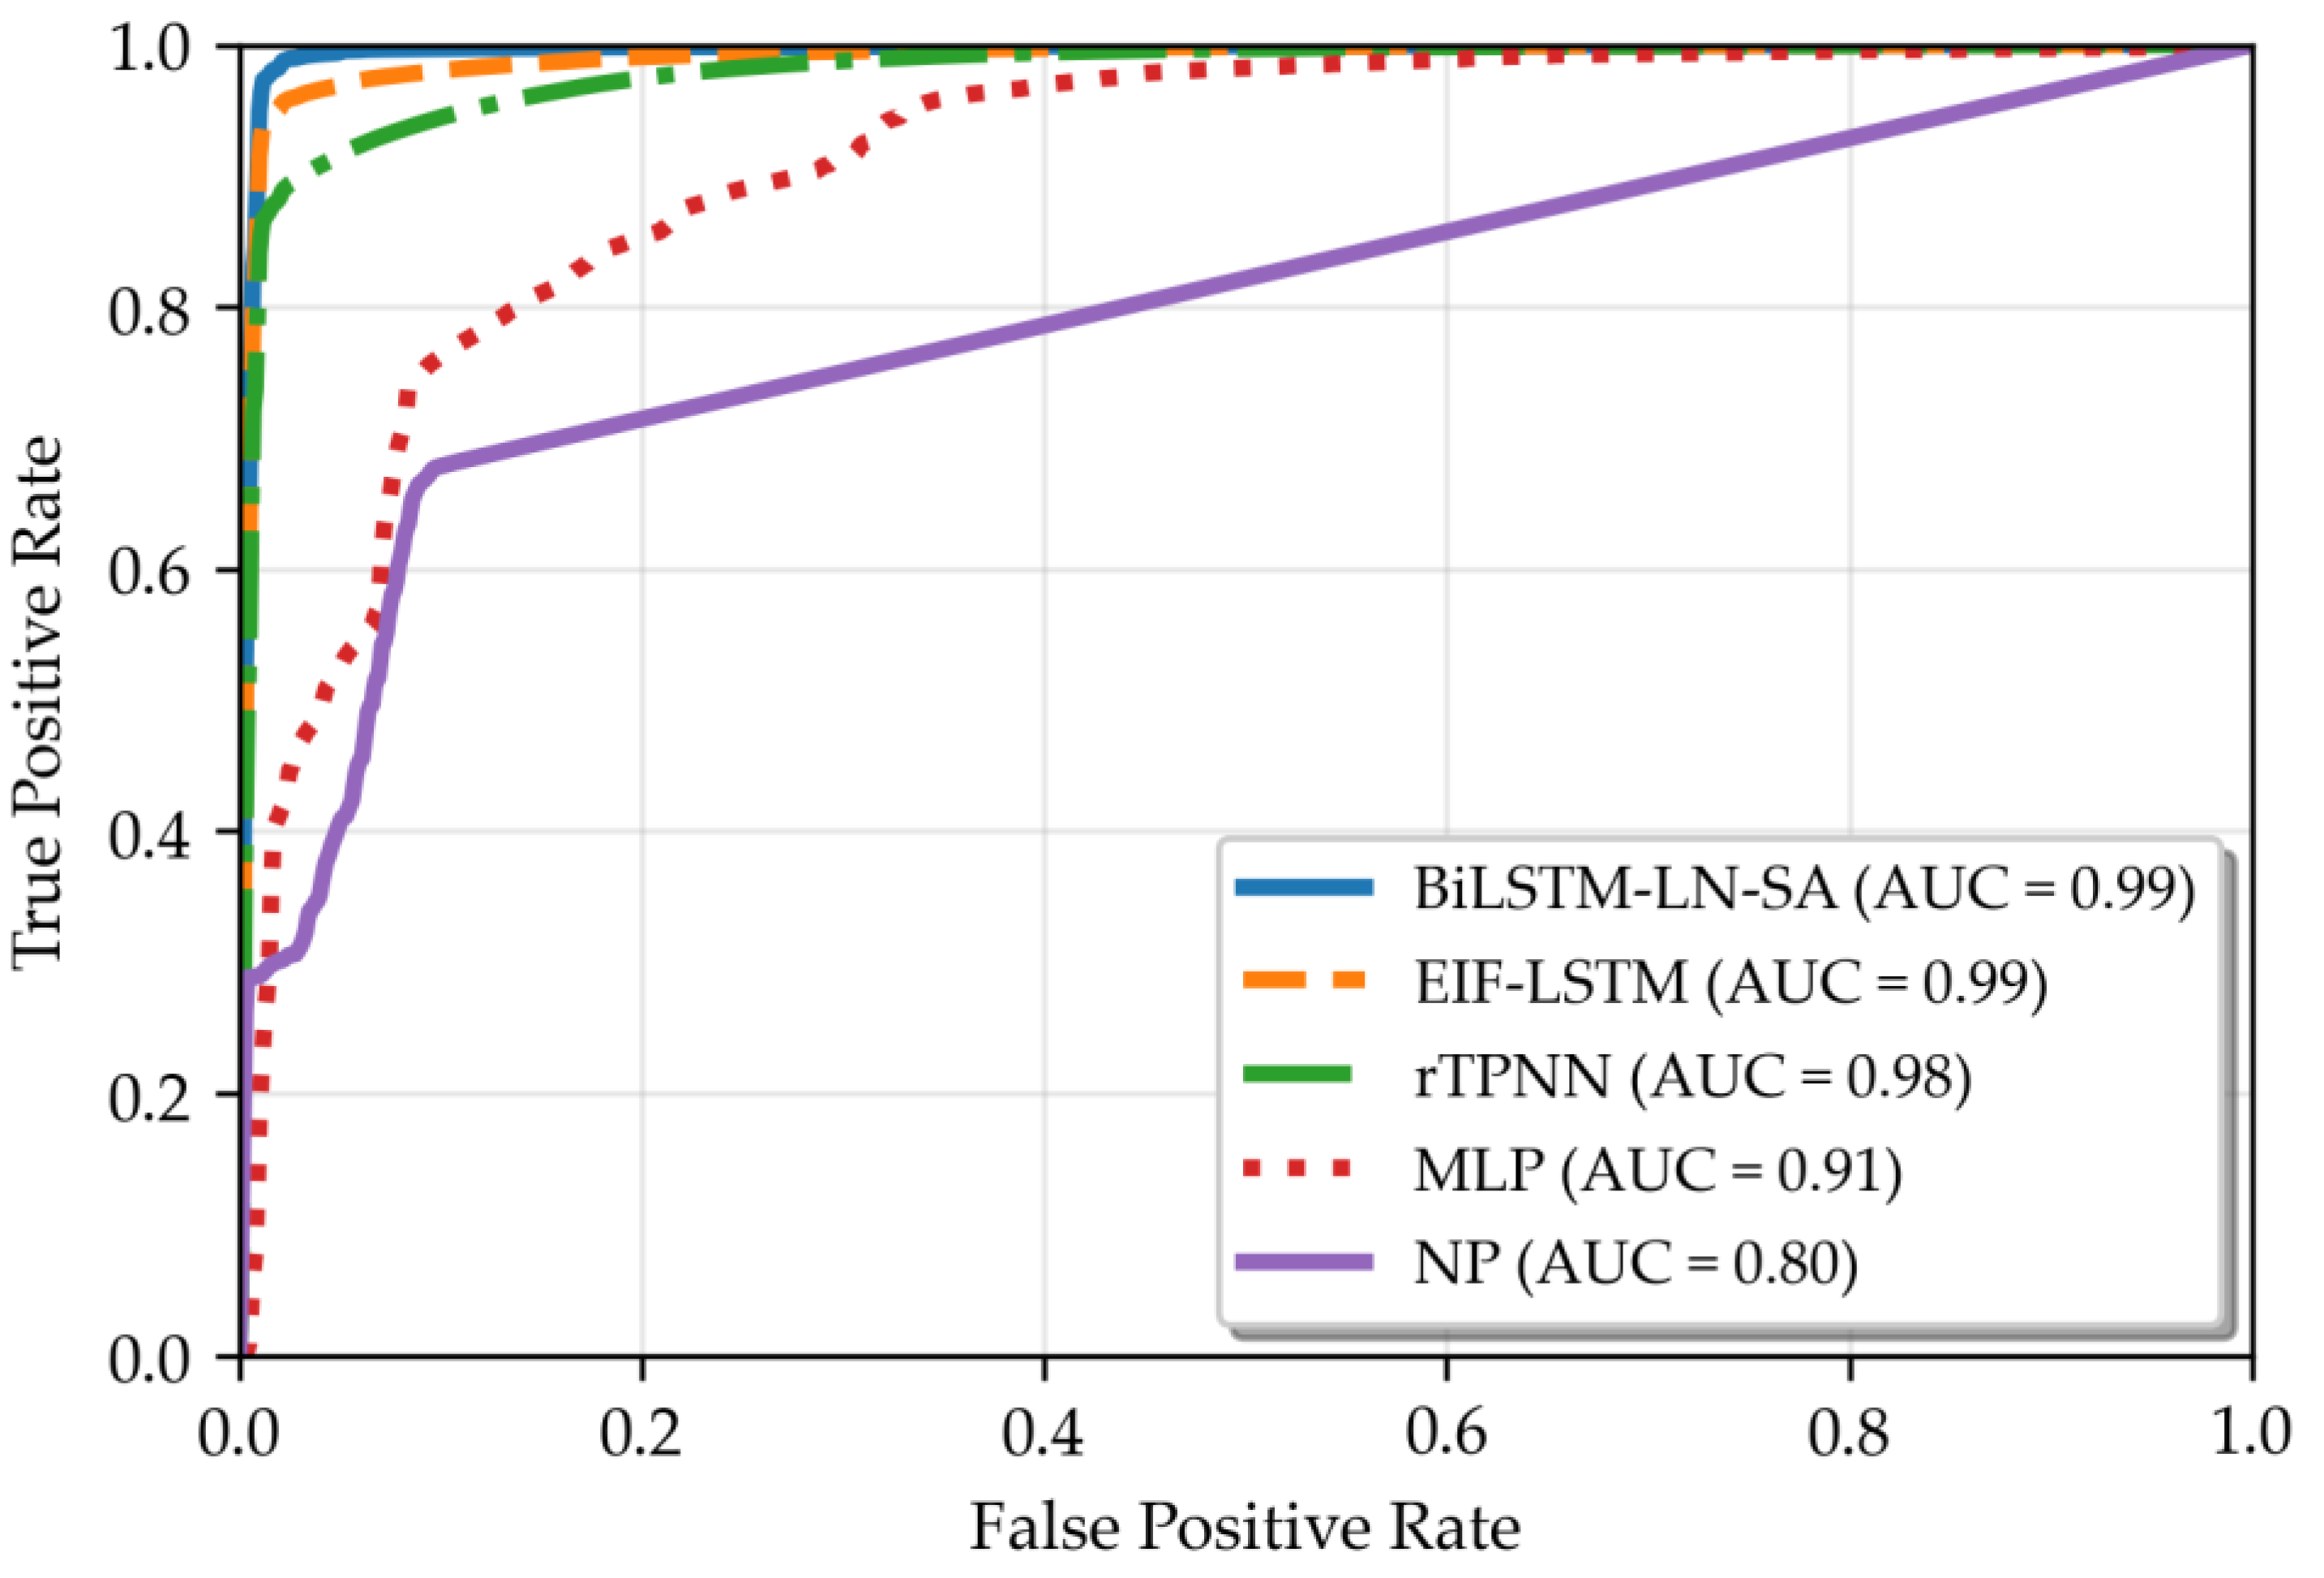
Figure 6, BiLSTM-LN-SA achieved an AUC of 0.99, with its ROC curve approaching the top-left corner, which indicates good discriminative capability in distinguishing between fire and non-fire events. The rTPNN model followed with an AUC of 0.98, still maintaining respectable performance though its ROC curve lies slightly below that of BiLSTM-LN-SA and EIF-LSTM. In contrast, MLP (Multilayer Perceptron) and NP attained AUC values of only 0.91 and 0.80, respectively. These lower values indicate their more limited representational capacity in complex fire scenarios and their consequent poorer overall discrimination.
3.2.5. Analysis of the Relationship Between Step Size and Performance in Fire Detection Systems
This section investigates the influence of time-series resolution on model performance through three key metrics: AUC, F1-score, and Recall. As shown inFigure 7, a systematic evaluation was conducted at 5-step intervals across a range of 5 to 30 time steps to identify the optimal granularity for fire detection.
All three metrics exhibit consistent optimization trends, reaching peak performance at 20 time steps. The AUC exhibits a non-linear improvement, rising from 0.993 at 5 time steps to a maximum of 0.996 at 20 time steps, before slightly declining to 0.994 at 25 time steps. Similarly, the F1-score follows a comparable trajectory, increasing from an initial value of 0.983 at 5 time steps to an optimum of 0.992 at 20 time steps, indicating a balance between precision and recall. Recall also attains its highest value (0.985) at 20 time steps, reflecting a noticeable improvement from the baseline of 0.972 at 5 time steps.
These results empirically establish 20 time steps as the optimal time-series resolution, achieving an effective trade-off between feature preservation and noise reduction. This configuration enables simultaneous optimization of discriminative capability (AUC), classification robustness (F1-score), and detection sensitivity (Recall), representing a noticeable improvement over both finer and coarser time-series resolutions.
3.2.6. Ablation Study: The Impact of Layer Normalization
To empirically evaluate the effectiveness of the Layer Normalization (LN) module in mitigating feature distribution shifts in multi-scenario fire detection, an ablation study was designed. By comparing the performance of the complete model (BiLSTM-LN-SA) against a variant with the LN layer removed (BiLSTM-SA), this study aims to clarify the contribution of LN to the model’s generalization capability and stability. The two models share identical structures except for the LN module and were trained under the same data and experimental conditions to ensure a fair comparison.
The experiment focused on the most critical performance metrics for fire detection: the false positive rate (FPR) and false negative rate (FNR). As shown in Table 5, all performance metrics were improved with the incorporation of layer normalization. The complete model (BiLSTM-LN-SA) achieved an FPR of 1.50%, which is substantially lower than the 4.80% observed in the model without LN. Meanwhile, the FNR decreased from 3.20% to 1.85%. In addition, the true positive rate (TPR) and true negative rate (TNR) increased to 98.15% and 98.50%, respectively, indicating enhanced discriminative ability for both positive and negative samples.
These results demonstrate that layer normalization effectively mitigates covariate shift caused by varying environmental conditions by stabilizing feature distributions in deep networks. This reduces the model’s sensitivity to absolute feature values and enables it to focus more on discriminative relative patterns and internal feature relationships. Consequently, this mechanism improves the model’s generalization capability and robustness.
4. Conclusions
To address the persistent challenges of high false alarm and missed detection rates in multi-sensor fire detection within complex environments, this paper proposes a novel BiLSTM-LN-SA model that integrates a Bidirectional Long Short-Term Memory (BiLSTM) network with Layer Normalization and a self-attention mechanism. The core innovation of this model lies in its effective combination of BiLSTM’s ability to capturing bidirectional long-term time-series dependencies, the feature distribution stabilization and generalization enhancement offered by Layer Normalization, and the self-attention mechanism’s capacity for dynamic feature enhancement. This integration enables comprehensive mining and adaptive fusion of deep time- series features from multi-sensor data, significantly improving the accuracy of fire event recognition.
Experimental results on a real-world fire dataset demonstrate the superior detection performance of the proposed BiLSTM-LN-SA model. It significantly outperforms existing methods including MLP, rTPNN, and EIF-LSTM across key evaluation metrics such as accuracy, F1-score, and AUC. Crucially, ablation studies confirm the substantial contribution of the Layer Normalization module in mitigating feature shift and reducing false alarms. Furthermore, comprehensive comparative analyses—encompassing confusion matrices and ablation studies against single-sensor baselines—consistently validate the effectiveness of the multi-sensor fusion strategy and the model’s exceptional capability in balancing false positive and false negative rates. The hyperparameter study identifies 20 time steps as the optimal sequence length, which achieves the best feature preservation and overall performance.
This research presents a novel and efficient deep learning-based solution for fire detection. Its outstanding real-time perception performance and enhanced resilience to environmental variations demonstrates significant potential for enhancing the reliability of fire monitoring systems in complex scenarios. Future work will focus on developing lightweight versions of the model for deployment on edge computing devices and investigating its potential for extension towards earlier stage fire warning capabilities.
Funding
This research was funded by the Shijiazhuang Municipal Bureau of science and technology (Grant nos. 241130163A).
References
- Nakip, M.; Guzelis, C. Development of a Multi-Sensor Fire Detector Based On Machine Learning Models. 2019 Innovations in Intelligent Systems and Applications Conference (ASYU) 2019, 1-6. [CrossRef]
- Festag, S. False alarm ratio of fire detection and fire alarm systems in Germany – A meta analysis. Fire Safety Journal 2016, 79, 119-126. [CrossRef]
- Hangauer, A.; Chen, J.; Strzoda, R.; Fleischer, M.; Amann, M.C. Performance of a fire detector based on a compact laser spectroscopic carbon monoxide sensor. Optics Express 2014, 22, 13680. [CrossRef]
- Baek, J.; Alhindi, T.J.; Jeong, Y.-S.; Jeong, M.K.; Seo, S.; Kang, J.; Shim, W.; Heo, Y. A Wavelet-Based Real-Time Fire Detection with Multi-Modeling Framework. SSRN Electronic Journal 2023. [CrossRef]
- Fonollosa, J.; Solórzano, A.; Marco, S. Chemical Sensor Systems and Associated Algorithms for Fire Detection: A Review. Sensors 2018, 18, 553. [CrossRef]
- Solórzano, A.; Eichmann, J.; Fernández, L.; Ziems, B.; Jiménez-Soto, J.M.; Marco, S.; Fonollosa, J. Early fire detection based on gas sensor arrays: Multivariate calibration and validation. Sensors and Actuators B: Chemical 2022, 352, 130961. [CrossRef]
- Li, Y.; Lu, Y.; Zheng, C.; Ma, Z.; Yang, S.; Zheng, K.; Song, F.; Ye, W.; Zhang, Y.; Wang, Y.; et al. Development of a Mid-Infrared Sensor System for Early Fire Identification in Cotton Harvesting Operation. SSRN Electronic Journal 2022. [CrossRef]
- Chen, S.-J.; Hovde, D.C.; Peterson, K.A.; Marshall, A.W. Fire detection using smoke and gas sensors. Fire Safety Journal 2007, 42, 507-515. [CrossRef]
- Baek, J.; Alhindi, T.J.; Jeong, Y.-S.; Jeong, M.K.; Seo, S.; Kang, J.; Heo, Y. Intelligent Multi-Sensor Detection System for Monitoring Indoor Building Fires. IEEE Sensors Journal 2021, 21, 27982-27992. [CrossRef]
- Liu, Q. Application Research and Improvement of Weighted Information Fusion Algorithm and Kalman Filtering Fusion Algorithm in Multi-sensor Data Fusion Technology. Sensing and Imaging 2023, 24. [CrossRef]
- Liu, Y.; Deng, Z.; Hu, E. Multi-Sensor Fusion Positioning Method Based on Batch Inverse Covariance Intersection and IMM. Applied Sciences 2021, 11, 4908. [CrossRef]
- Wang, R.; Li, Y.; Sun, H.; Yang, K. Multisensor-Weighted Fusion Algorithm Based on Improved AHP for Aircraft Fire Detection. Complexity 2021, 2021. [CrossRef]
- Jing, C.; Jingqi, F. Fire Alarm System Based on Multi-Sensor Bayes Network. Procedia Engineering 2012, 29, 2551-2555. [CrossRef]
- Ran, M.; Bai, X.; Xin, F.; Xiang, Y. Research on Probability Statistics Method for Multi-sensor Data Fusion. 2018 International Conference on Cyber-Enabled Distributed Computing and Knowledge Discovery (CyberC) 2018, 406-4065. [CrossRef]
- Jana, S.; Shome, S.K. Hybrid Ensemble Based Machine Learning for Smart Building Fire Detection Using Multi Modal Sensor Data. Fire Technology 2022, 59, 473-496. [CrossRef]
- Baek, J.; Alhindi, T.J.; Jeong, Y.-S.; Jeong, M.K.; Seo, S.; Kang, J.; Choi, J.; Chung, H. Real-Time Fire Detection Algorithm Based on Support Vector Machine with Dynamic Time Warping Kernel Function. Fire Technology 2021, 57, 2929-2953. [CrossRef]
- Ding, Q.; Peng, Z.; Liu, T.; Tong, Q. Multi-Sensor Building Fire Alarm System with Information Fusion Technology Based on D-S Evidence Theory. Algorithms 2014, 7, 523-537. [CrossRef]
- Jiang, Y. Fire detection system based on improved multi-sensor information fusion. Fifth International Conference on Computer Information Science and Artificial Intelligence (CISAI 2022) 2023, 71. [CrossRef]
- Ma, L.; Yao, W.; Dai, X.; Jia, R. A New Evidence Weight Combination and Probability Allocation Method in Multi-Sensor Data Fusion. Sensors 2023, 23, 722. [CrossRef]
- Su, Q.; Hu, G.; Liu, Z. Research on fire detection method of complex space based on multi-sensor data fusion. Measurement Science and Technology 2024, 35, 85107. [CrossRef]
- Zhang, T.; Liu, Y.; Fang, W.; Jia, G.; Qiu, Y. Fire Detection Scheme in Tunnels Based on Multi-source Information Fusion. 2022 18th International Conference on Mobility, Sensing and Networking (MSN) 2022, 1025-1030. [CrossRef]
- Sowah, R.A.; Ofoli, A.R.; Krakani, S.N.; Fiawoo, S.Y. Hardware Design and Web-Based Communication Modules of a Real-Time Multisensor Fire Detection and Notification System Using Fuzzy Logic. IEEE Transactions on Industry Applications 2017, 53, 559-566. [CrossRef]
- Hong Bao, u.; Jun Li, u.; Xian-Yun Zeng, u.; Jing Zhang, u. A fire detection system based on intelligent data fusion technology. Proceedings of the 2003 International Conference on Machine Learning and Cybernetics (IEEE Cat. No.03EX693), 1096-1101. [CrossRef]
- Rachman, F.Z.; Hendrantoro, G.; Wirawan. A Fire Detection System Using Multi-Sensor Networks Based on Fuzzy Logic in Indoor Scenarios. In Proceedings of the 2020 8th International Conference on Information and Communication Technology (ICoICT), 2020/06/24/26, 2020; pp. 1-6.
- Wang Xihuai, u.; Xiao Jianmei, u.; Bao Minzhong, u. Multi-sensor fire detection algorithm for ship fire alarm system using neural fuzzy network. WCC 2000 - ICSP 2000. 2000 5th International Conference on Signal Processing Proceedings. 16th World Computer Congress 2000 3, 1602-1605. [CrossRef]
- Qu, W.; Tang, J.; Niu, W. Research on Fire Detection Based on Multi-source Sensor Data Fusion. Advances in Intelligent Systems and Computing 2020, 629-635. [CrossRef]
- Wu, L.; Chen, L.; Hao, X. Multi-Sensor Data Fusion Algorithm for Indoor Fire Early Warning Based on BP Neural Network. Information 2021, 12, 59. [CrossRef]
- Jiang, Y.L. Research of Multi-Sensor Information Fusion Fire Detection System. Advanced Materials Research 2013, 2745-2749. [CrossRef]
- Wen, M. Time Series Analysis of Receipt of Fire Alarms Based on Seasonal Adjustment Method. In Proceedings of the 2016 8th International Conference on Intelligent Human-Machine Systems and Cybernetics (IHMSC), 2016/08/27/28, 2016; pp. 81-84.
- Ryder, N.L.; Geiman, J.A.; Weckman, E.J. Hierarchical Temporal Memory Continuous Learning Algorithms for Fire State Determination. Fire Technology 2021, 57, 2905-2928. [CrossRef]
- Li, Y.; Su, Y.; Zeng, X.; Wang, J. Research on Multi-Sensor Fusion Indoor Fire Perception Algorithm Based on Improved TCN. Sensors 2022, 22, 4550. [CrossRef]
- Nakip, M.; Guzelis, C.; Yildiz, O. Recurrent Trend Predictive Neural Network for Multi-Sensor Fire Detection. IEEE Access 2021, 9, 84204-84216. [CrossRef]
- Liu, P.; Xiang, P.; Lu, D. A new multi-sensor fire detection method based on LSTM networks with environmental information fusion. Neural Comput & Applic 2023, 35, 25275-25289. [CrossRef]
- Deng, X.; Shi, X.; Wang, H.; Wang, Q.; Bao, J.; Chen, Z. An Indoor Fire Detection Method Based on Multi-Sensor Fusion and a Lightweight Convolutional Neural Network. Sensors 2023, 23, 9689. [CrossRef]
- Sun, B.; Guo, T. Evidential reasoning and lightweight multi-source heterogeneous data fusion-driven fire danger level dynamic assessment technique. Process Safety and Environmental Protection 2024, 185, 350-366. [CrossRef]
- Zhang, Q.; Ye, M.; Deng, X. A novel anomaly detection method for multimodal WSN data flow via a dynamic graph neural network. Connection Science 2022, 34, 1609-1637. [CrossRef]
- Stefan, B. ai sensor fusion for fire detection. 2022. :https://github.com/Blatts01.
Figure 1.
Figure 1. Framework of the BiLSTM-LN-SA model for fire detection.
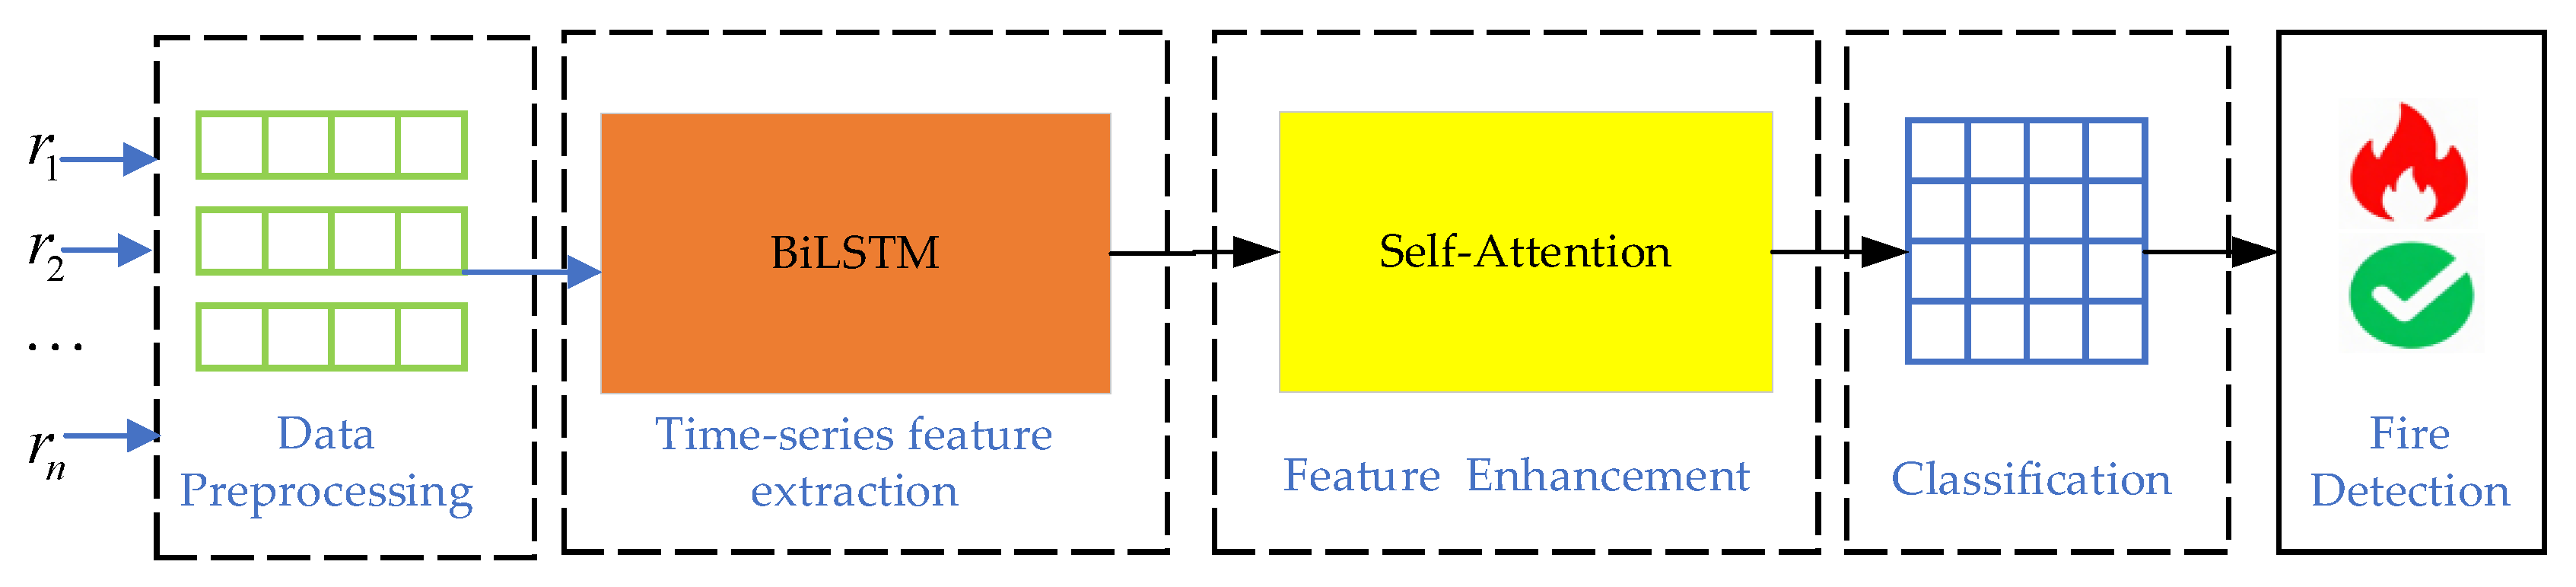
Figure 3.
Schematic of the Feature enhancement module for fire detection.
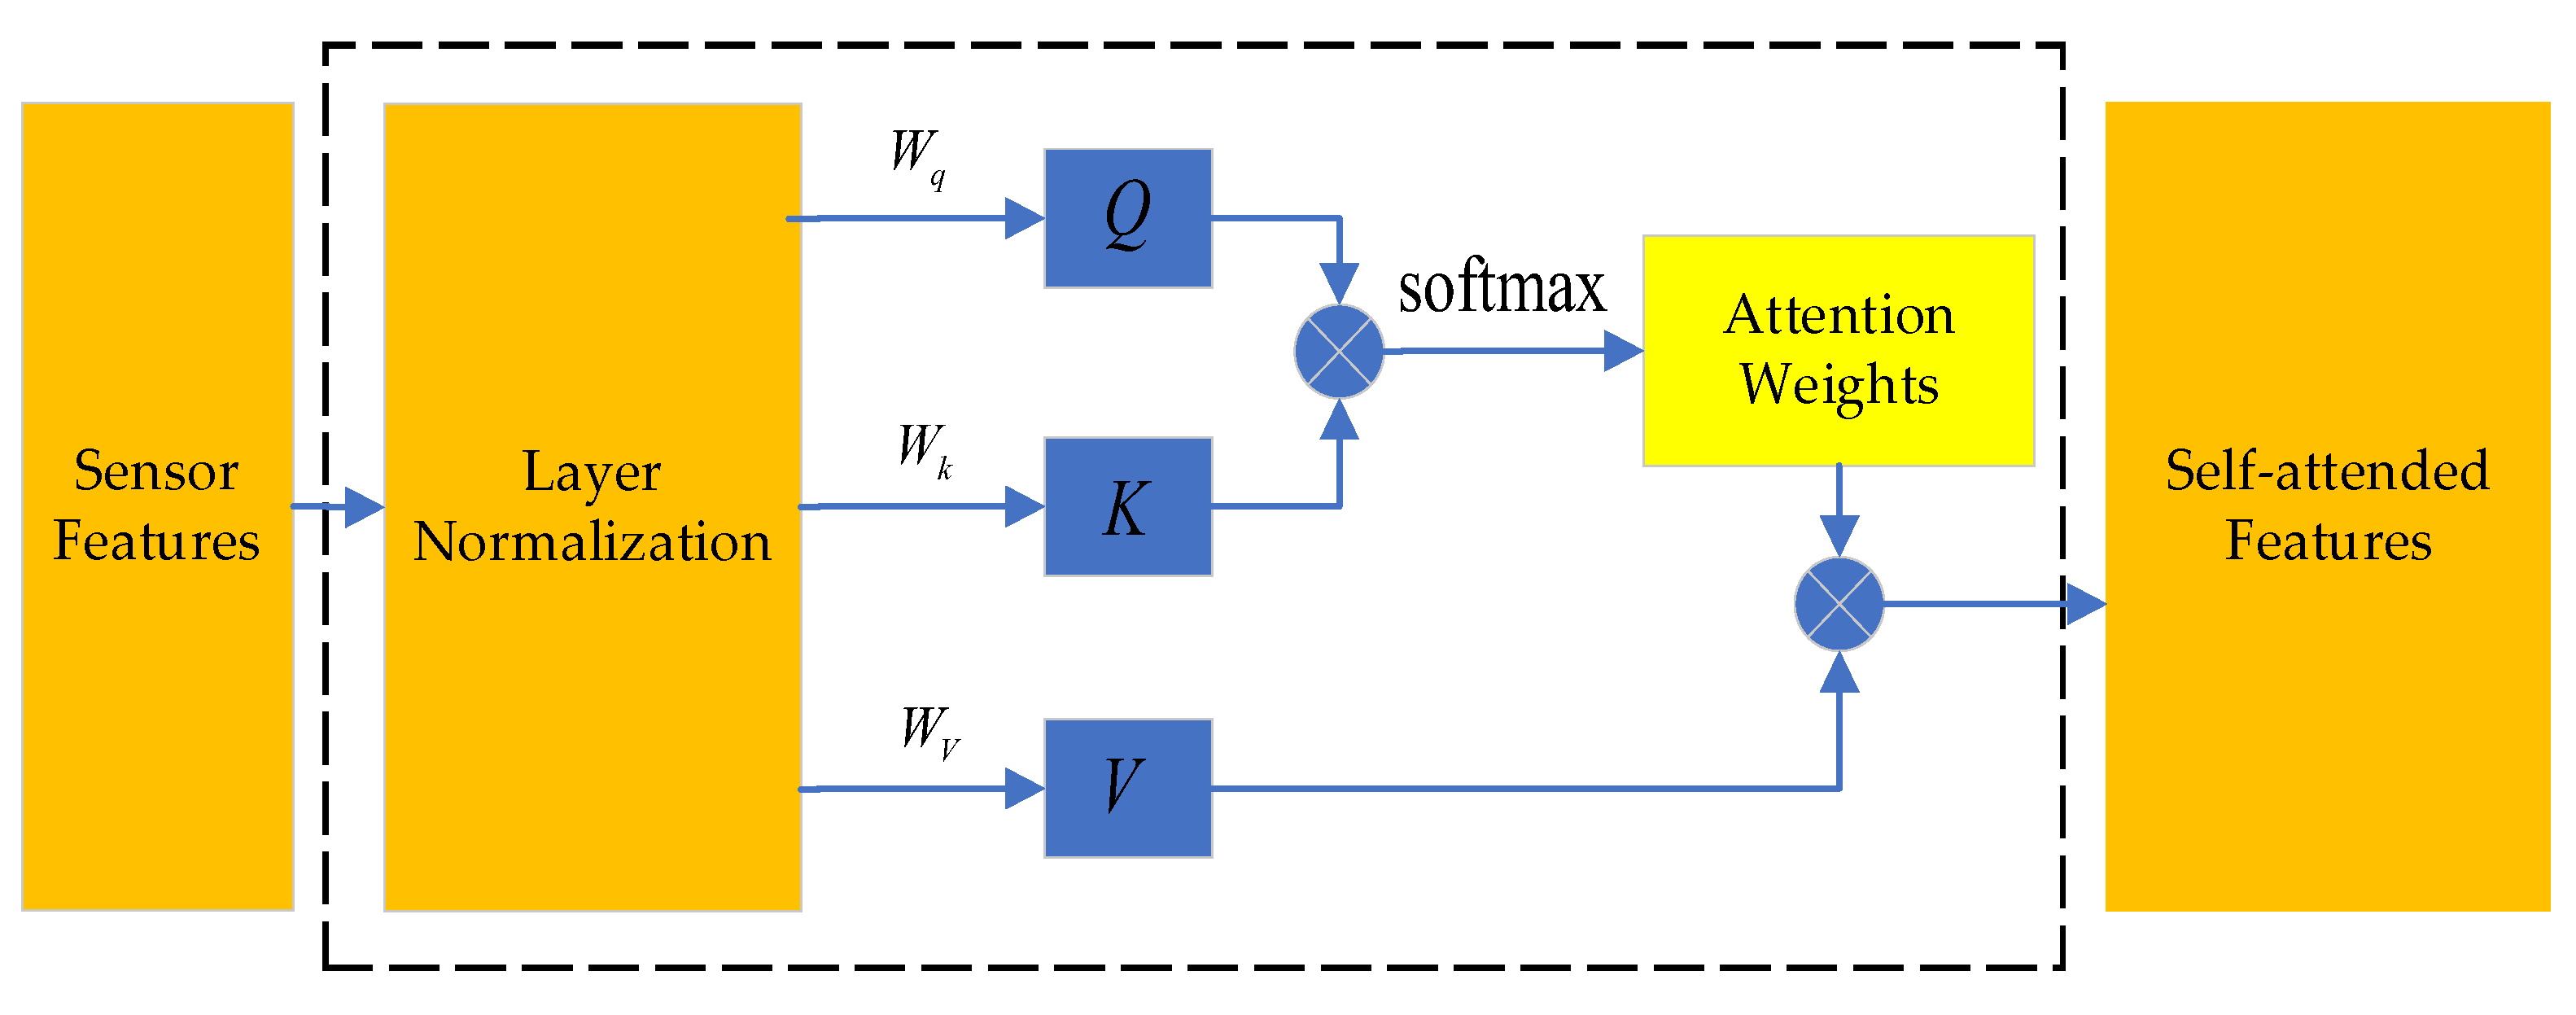
Figure 4.
Architecture of the fire probability classification module.
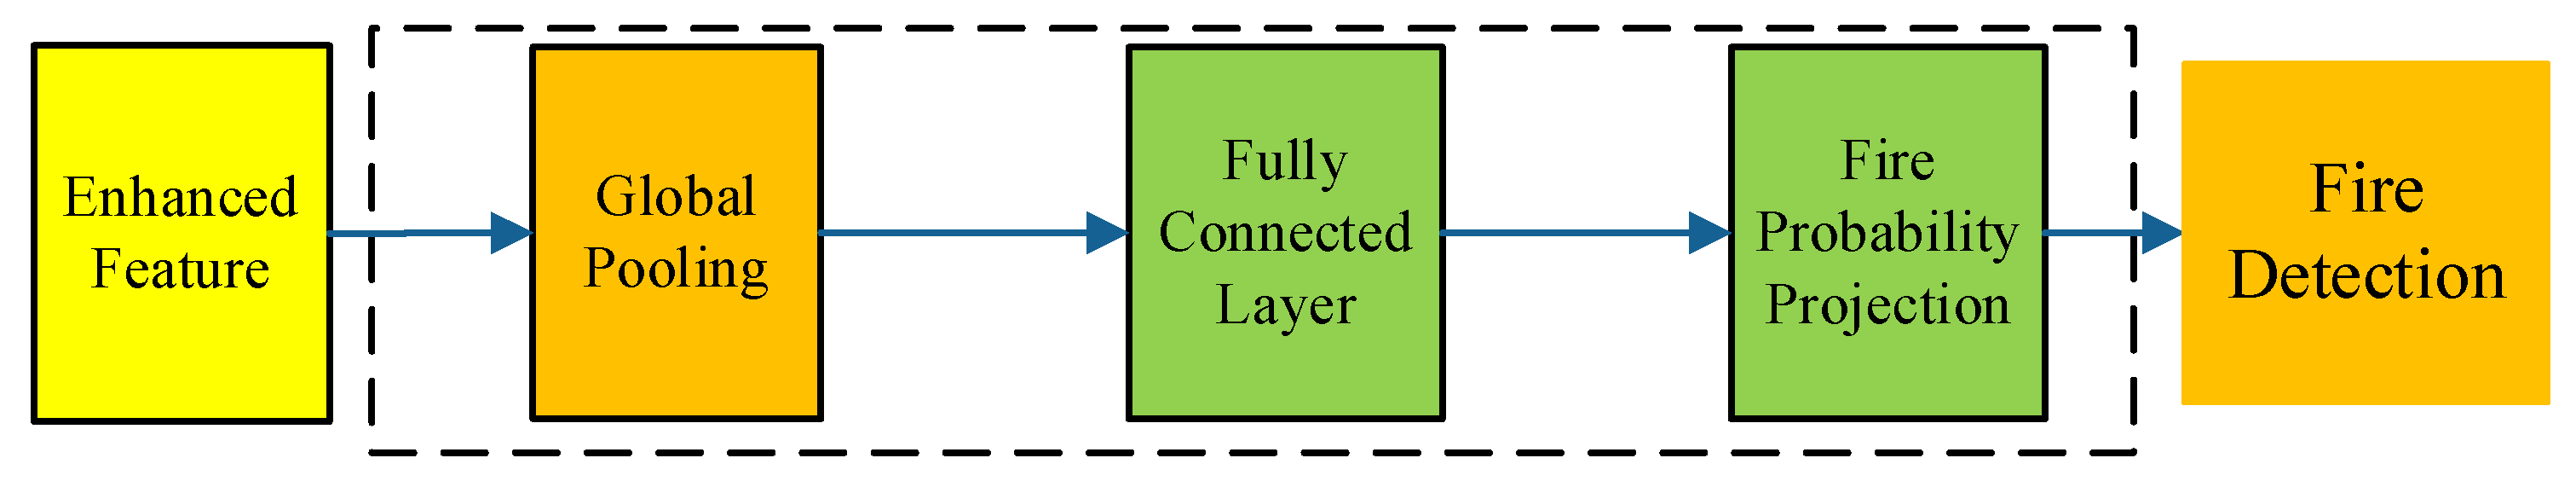
Figure 5.
Comparison of F1-scores across different multi-sensor fire detection methods.
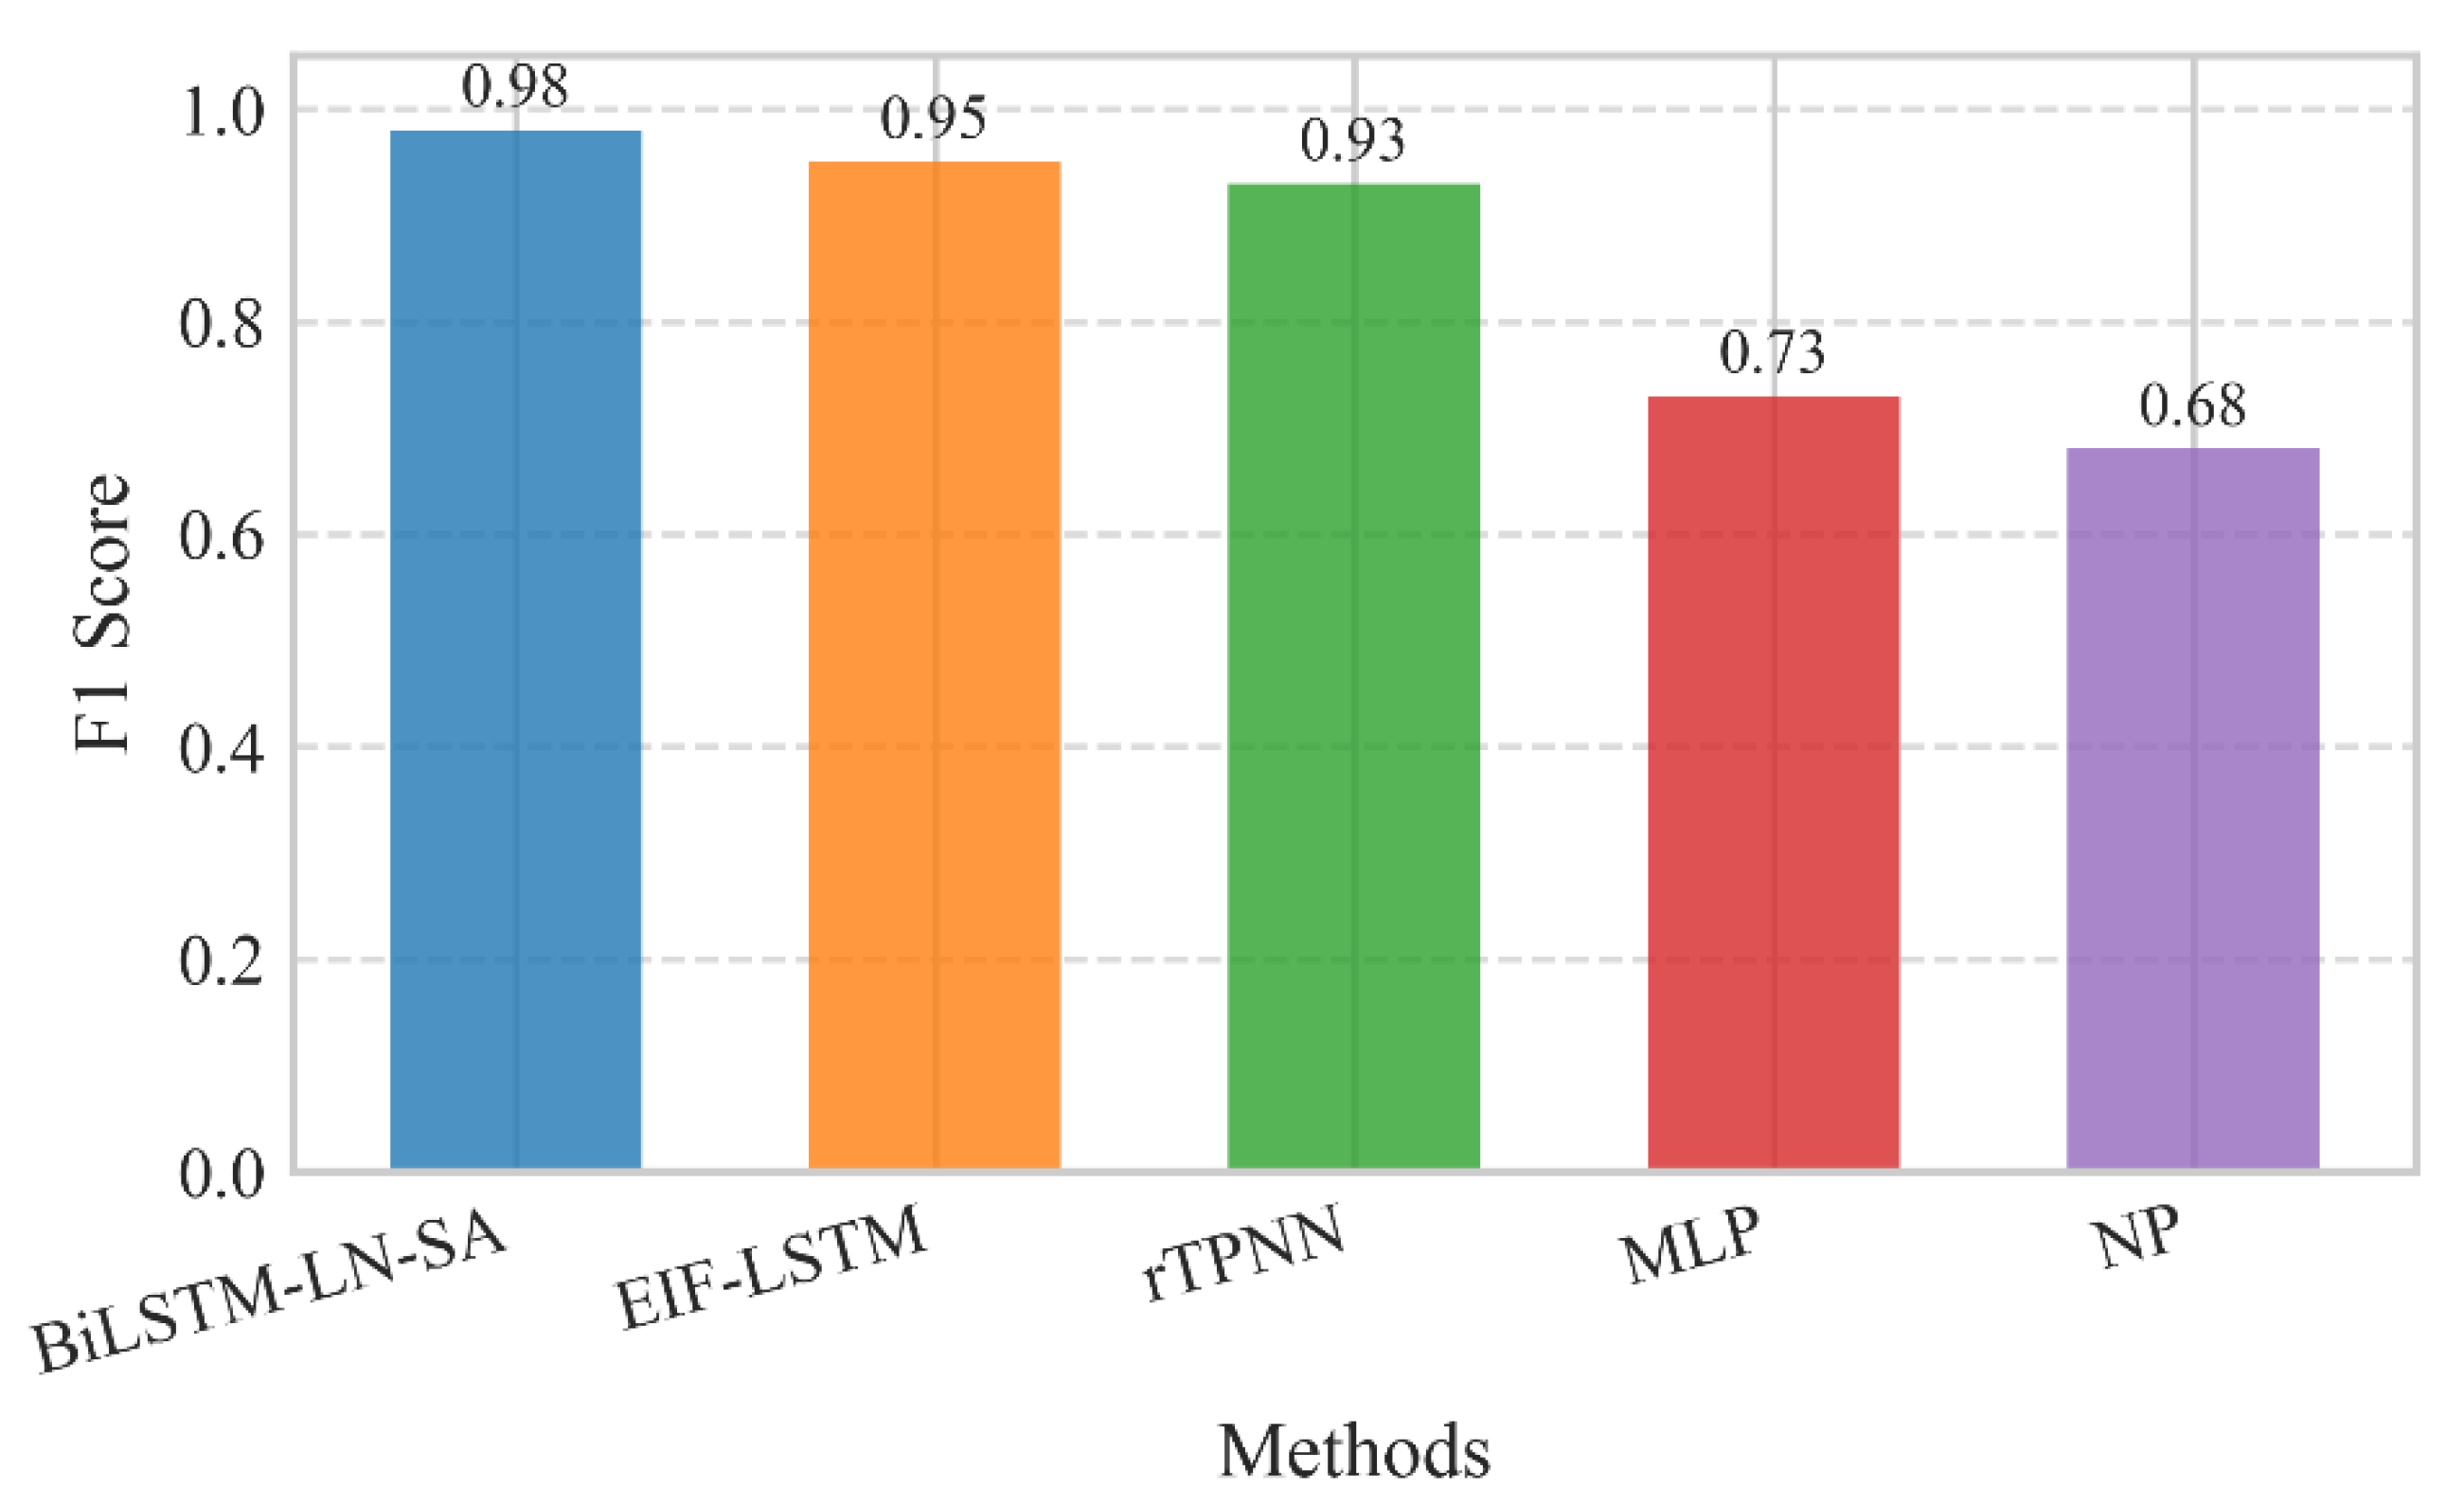
Figure 6.
Comparison of different multi-sensor methods based on AUC values.
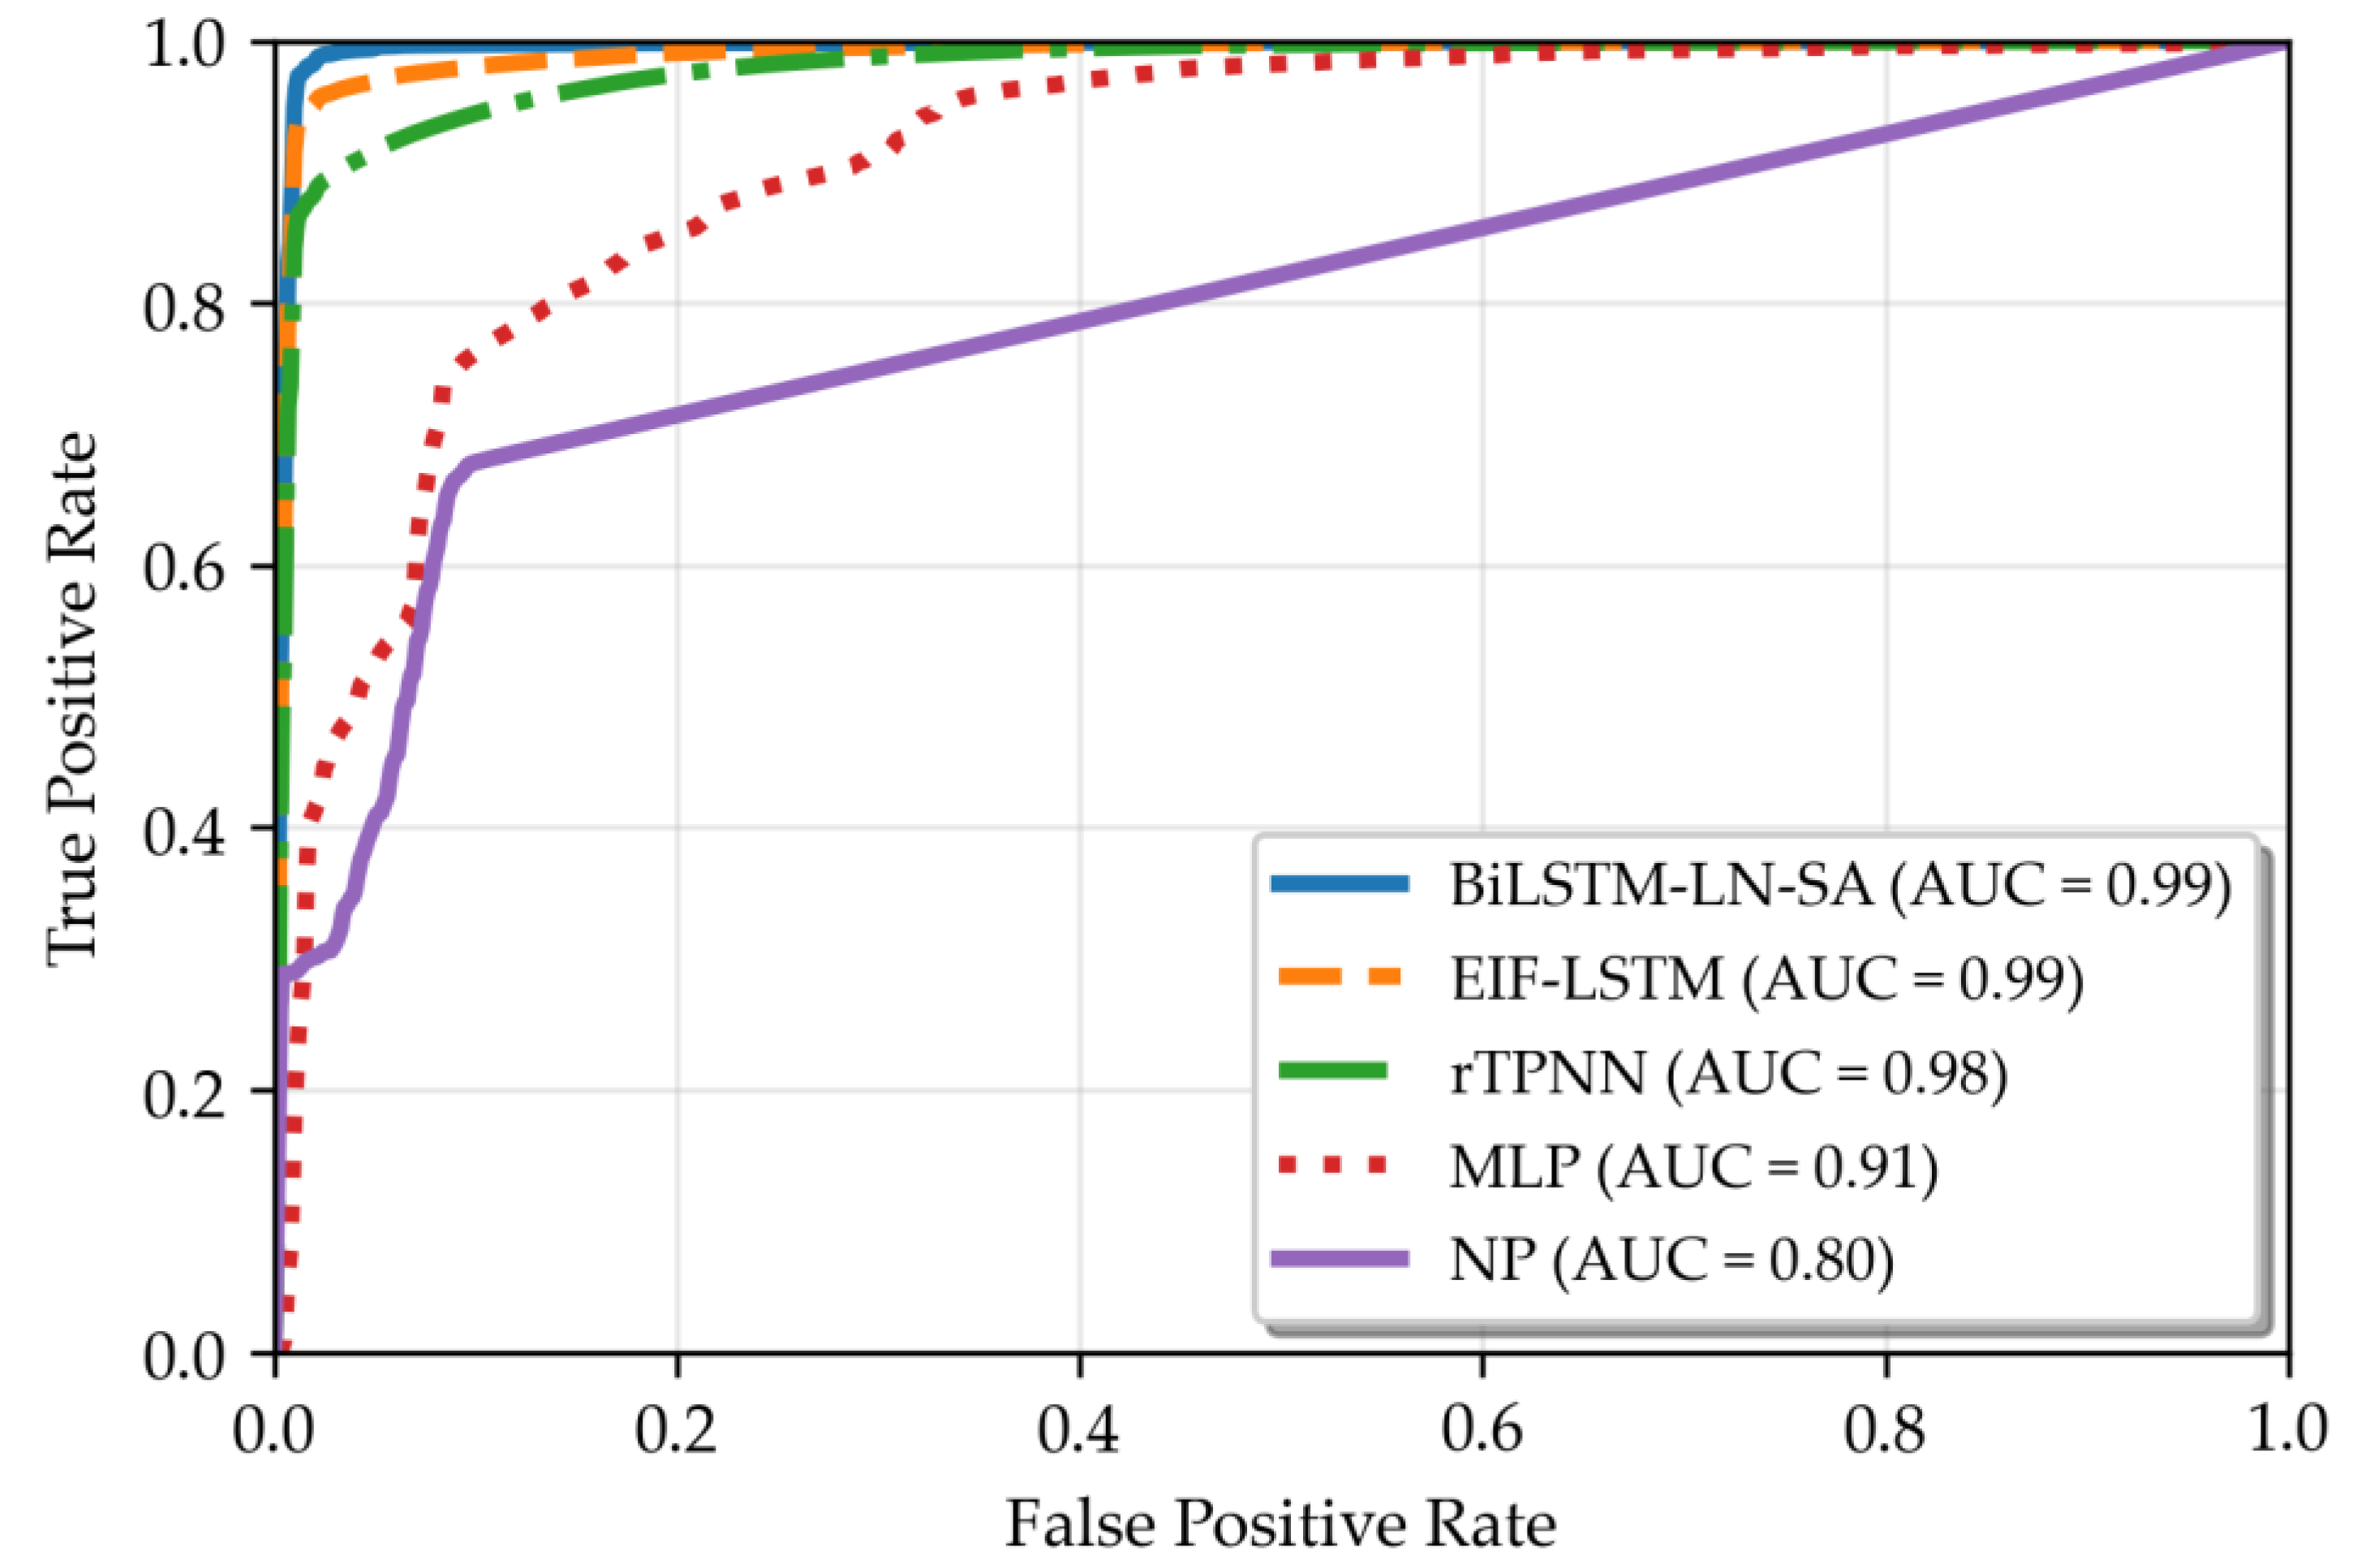
Figure 7.
Impact of time step size (in increments of 5) on fire detection performance metrics, including AUC, F1-score, and Recall.
Figure 7.
Impact of time step size (in increments of 5) on fire detection performance metrics, including AUC, F1-score, and Recall.
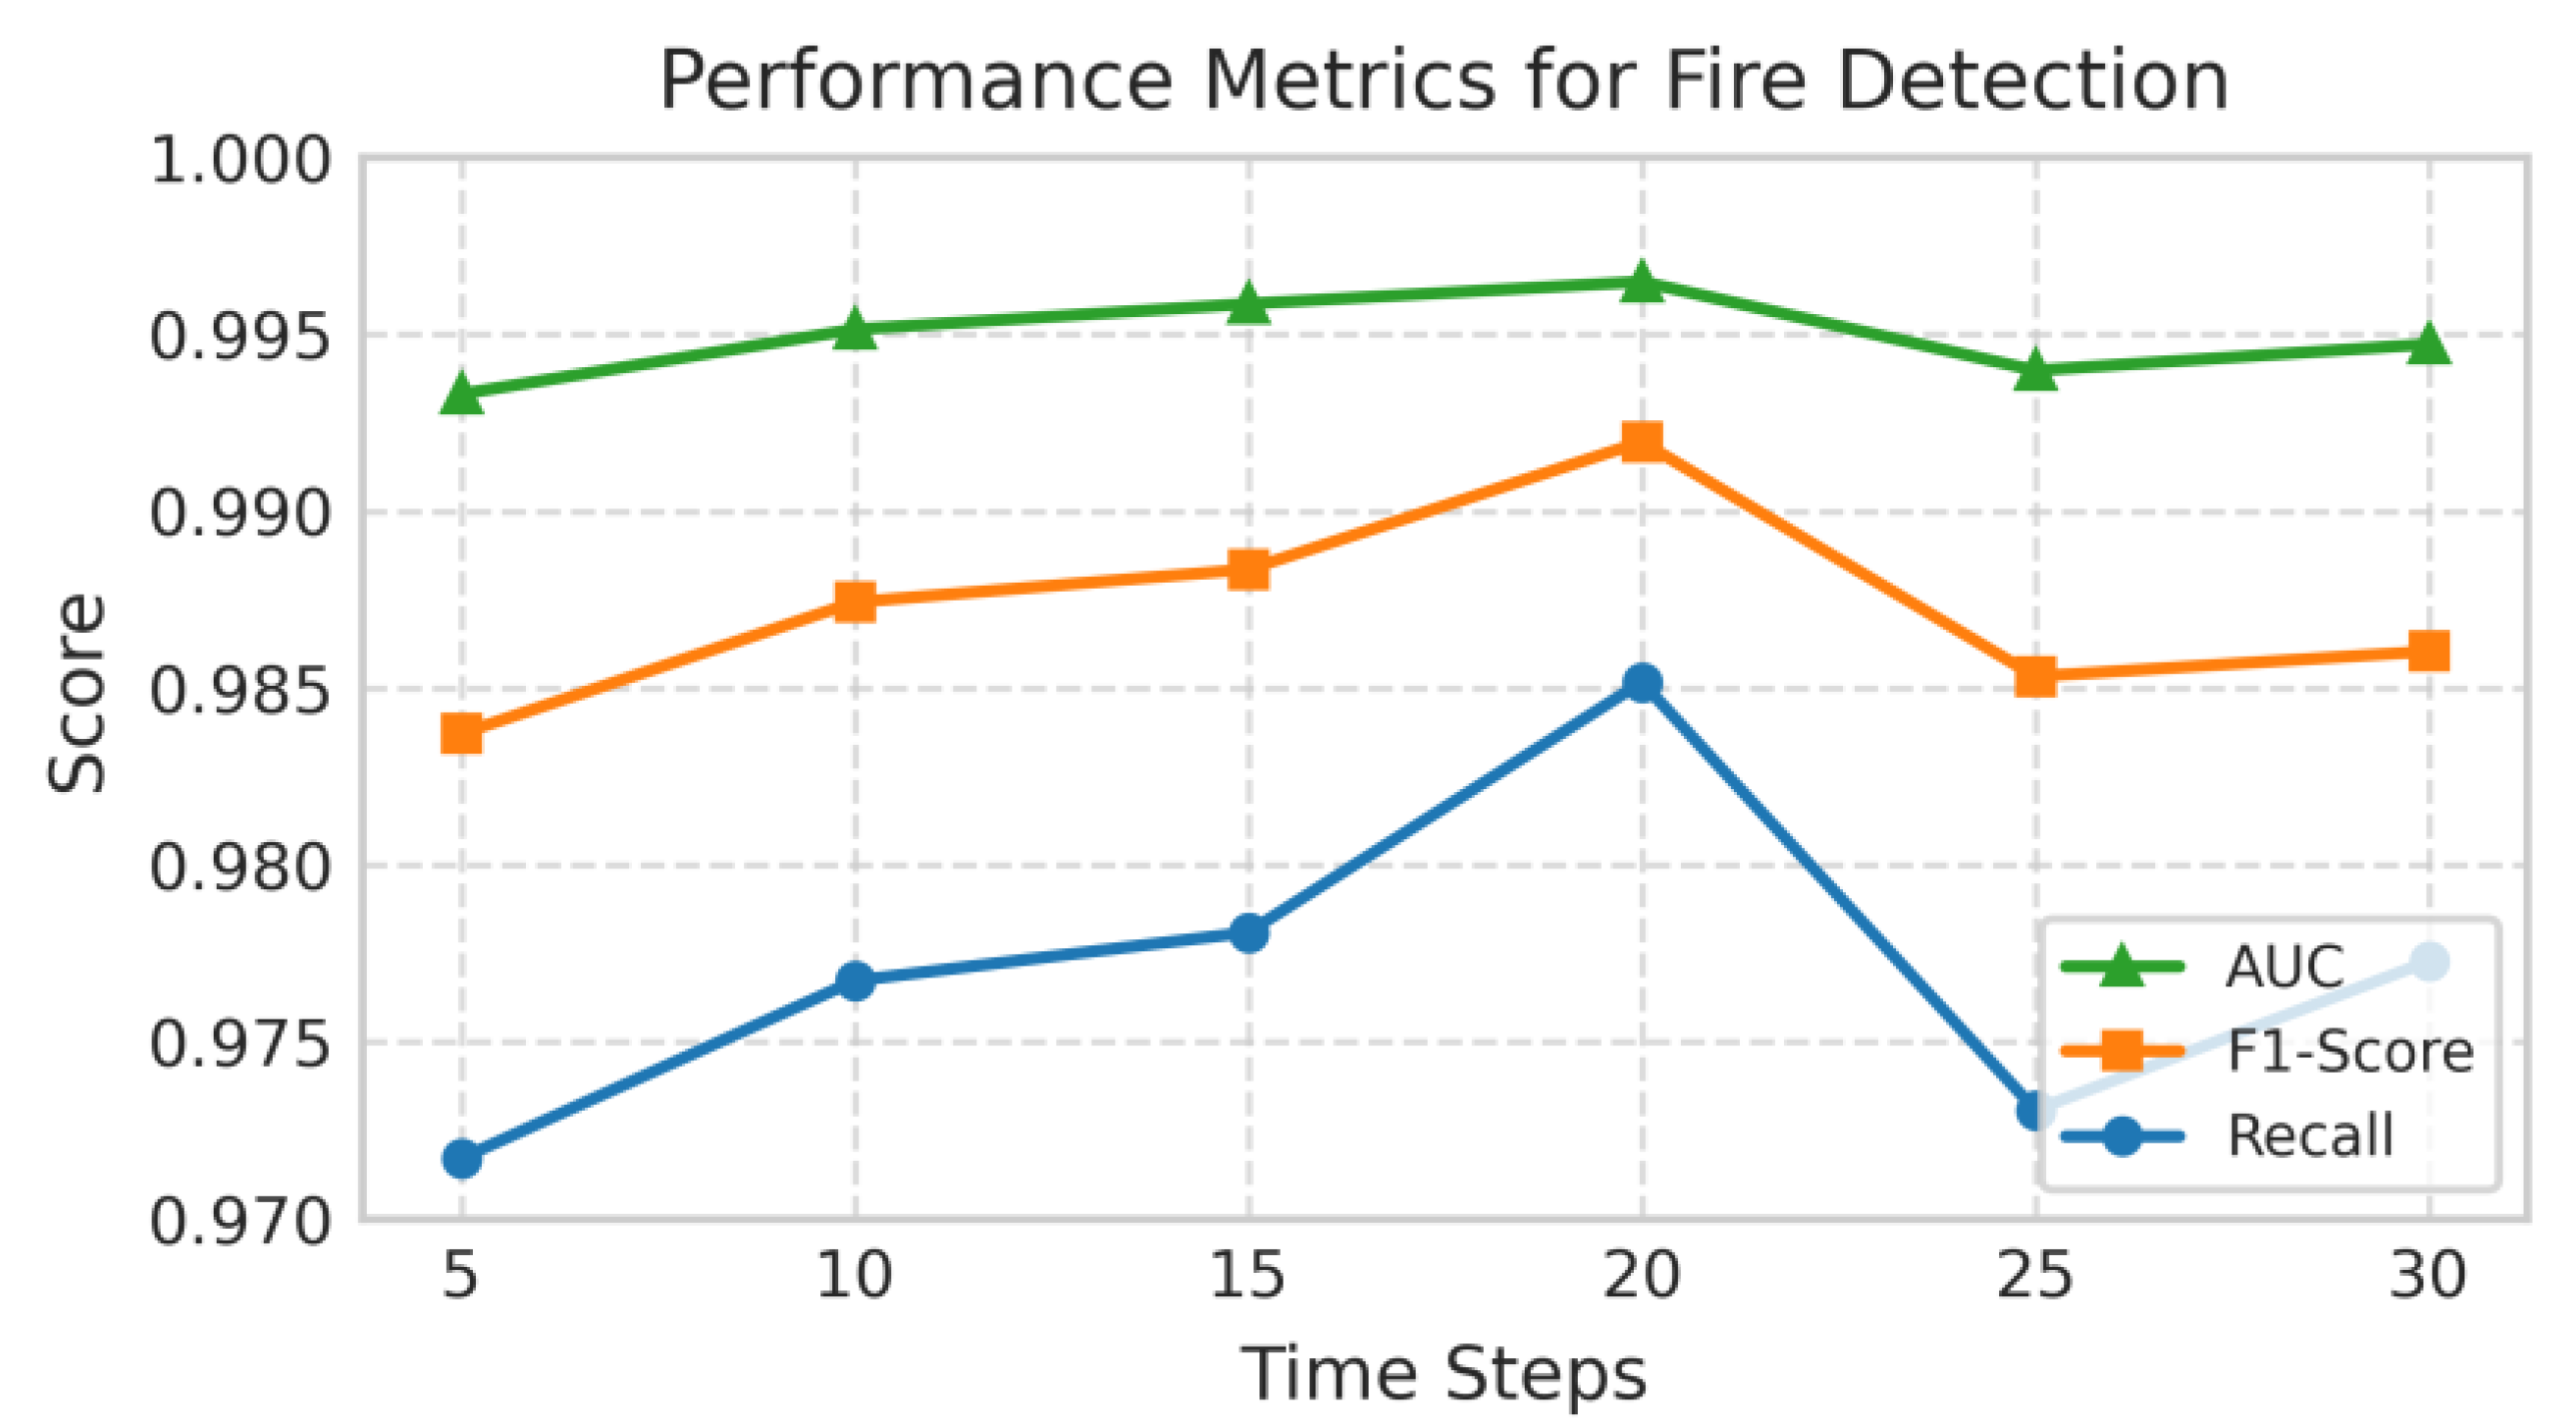

Table 1.
Comparison of Detection Accuracy Using Multi-Sensor Data
| Methods | Training | Test | ||
|---|---|---|---|---|
| Mean | Std | Mean | Std | |
| BiLSTM-LN-SA | 98.50 | 0.31 | 98.38 | 0.38 |
| EIF-LSTM | 96.15 | 0.41 | 95.30 | 0.49 |
| rTPNN | 94.10 | 2.32 | 93.85 | 2.16 |
| MLP | 87.95 | 2.02 | 88.27 | 2.41 |
| NP | 80.05 | 1.21 | 80.12 | 1.26 |
Note: Results are presented as percentages (%).
Table 2.
Comparison of Detection Accuracy Using Individual Sensor Data.
| Sensor Type | Training | Test | ||
| Mean | Std | Mean | Std | |
| Temperature | 50.62 | 2.26 | 50.52 | 2.29 |
| TVOC | 85.89 | 0.91 | 85.75 | 0.80 |
| Carbon dioxide | 79.30 | 2.32 | 79.25 | 2.28 |
| NC2.5 | 84.95 | 1.36 | 84.72 | 1.30 |
Table 3.
Performance Comparison of Multi-Sensor Fusion Methods
| Methods | TPR | FNR | TNR | FPR |
| BiLSTM-LN-SA | 98.15 | 1.85 | 98.50 | 1.50 |
| EIF-LSTM | 95.20 | 4.80 | 96.90 | 3.10 |
| rTPNN | 91.27 | 8.73 | 95.27 | 4.73 |
| MLP | 85.27 | 14.73 | 91.27 | 8.73 |
| NP | 75.05 | 25.95 | 81.25 | 18.75 |
Table 4.
Performance Comparison of Single-Sensor Methods
| Sensor Type | TPR | FNR | TNR | FPR |
| Temperature | 28.30 | 71.70 | 98.55 | 1.45 |
| TVOC | 85.40 | 14.60 | 99.10 | 0.90 |
| Carbon dioxide | 52.30 | 47.70 | 96.80 | 3.20 |
| NC2.5 | 82.90 | 17.10 | 98.71 | 1.29 |
Table 5.
Performance Comparison of Models with and without Layer Normalization
| Methods | TPR | FNR | TNR | FPR |
| BiLSTM-LN-SA | 98.15 | 1.85 | 98.50 | 1.50 |
| BiLSTM-SA | 95.80 | 3.20 | 95.20 | 4.80 |
Disclaimer/Publisher’s Note: The statements, opinions and data contained in all publications are solely those of the individual author(s) and contributor(s) and not of MDPI and/or the editor(s). MDPI and/or the editor(s) disclaim responsibility for any injury to people or property resulting from any ideas, methods, instructions or products referred to in the content. |
© 2025 by the authors. Licensee MDPI, Basel, Switzerland. This article is an open access article distributed under the terms and conditions of the Creative Commons Attribution (CC BY) license (http://creativecommons.org/licenses/by/4.0/).
Copyright: This open access article is published under a Creative Commons CC BY 4.0 license, which permit the free download, distribution, and reuse, provided that the author and preprint are cited in any reuse.


