Submitted:
11 September 2025
Posted:
15 September 2025
You are already at the latest version
Abstract
Currently, recognition and assessment of human posture has become significant topics of interest, particularly through the use of visual sensor systems. These approaches can effectively address the drawbacks associated with traditional manual assessments, which include fatigue, variations in experience, and inconsistent judgment criteria. However, systems based on visual sensors encounter substantial implementation challenges when a large number of such sensors are used. To address these issues, we propose a human posture recognition and assessment system architecture, which comprises four distinct subsystems. Specifically, these subsystems include a Visual Sensor Subsystem (VSS), a Posture Assessment Subsystem (PAS), a Control-Display Subsystem, and a Storage Management Subsystem. Through the cooperation of subsystems, the architecture has achieved support for parallel data processing. Furthermore, the proposed architecture has been implemented by building an experimental testbed, which effectively verifies the rationality and feasibility of this architecture. In the experiments, the proposed architecture was evaluated by using pull-up and push-up exercises. The results demonstrate that the proposed architecture achieves an overall accuracy exceeding 96%, while exhibiting excellent real-time performance and scalability in different assessment scenarios.
Keywords:
visual sensor system
; posture assessment system
; deep learning
; human posture recognition
1. Introduction
Recently, the continuous improvement of residents’ living standards and the enhancement of national health awareness have made exercises and physical fitness training topics of widespread concern across various sectors. For enterprises and institutions, the physical health of employees significantly impacts work efficiency and team collaboration [1]. In education institutions, as reforms in physical education curricula advance in primary and secondary schools, assessments of exercises and physical fitness have increasingly become important criteria for evaluating students’ overall quality [2]. This trend extends to higher education, where the assessment of fitness in colleges has garnered growing attentions from the Ministry of Education. As noted in the Guiding Outline for Teaching Reform of "Physical Education and Health" (Tentative) [3], the assessment of physical fitness for college students has become a crucial aspect of physical education.
To achieve exercises assessment, traditional approaches often rely on human observers, which leads to inconsistencies, a lack of data traceability, and inefficiencies in large-scale deployments [4,5,6,7]. Thus, vision-based embedded sensor systems have become increasingly popular in Human Posture Recognition and Assessment (HPRA), facilitating real-time monitoring of body movements for applications in exercises analytics [8]. By integrating deep learning algorithms with compact camera modules, these systems can accurately detect skeletal keypoints, assess posture deviations and provide corrective feedback, thereby enhancing athletic performance [9,10,11,12]. However, systems with visual sensors face critical challenges regarding the efficiency of posture recognition and assessment, particularly when a large number of visual sensors are involved. For instance, while modern posture recognition algorithms, such as BlazePose, HRNet, and YOLOv8-pose [13,14,15,16] achieve high accuracy, their computational complexity often exceeds the capabilities of many low-spec computing platforms, such as the Phytium 2000+ [17]. This situation will significantly reduce the processing rate of the visual sensor system in the posture recognition and assessment. Furthermore, the absence of a generalized algorithmic modeling framework results in significant performance limitations for visual sensor systems when assessing multiple exercise modalities, including but not limited to pull-ups, push-ups and abdominal crunches. Therefore, addressing these issues can substantially enhance the intelligence and large-scale adaptability of human posture recognition and assessment system, thereby promoting their application in a wider range of scenarios to meet diverse assessment needs.
To address these issues, this paper proposes a comprehensive and efficient approach for human posture recognition and assessment, along with an implementable architecture for a visual sensor system. Our results effectively tackle the challenges of low efficiency, poor accuracy, and limited scalability that are commonly associated with traditional assessment methods. The main contributions of this paper are summarized as follows:
- A four subsystem architecture is developed to enhance the efficiency of data processing. It consists of a visual sensor subsystem (VSS), a posture assessment subsystem (PAS), a control-display subsystem, and a storage management subsystem. The proposed system architecture allows for the parallel processing of data from a large number of visual sensors. This capability enables the management of large-scale data and the provision of assessment results in real-time. Through experiments, we validate the rationale and feasibility of the proposed architecture.
- To further enhance system efficiency, a decoupling mechanism for VSS and PAS is proposed. In practice, the recognition speed of video frames is significantly slower than the rate at which these frames are acquired. To address this issue, our decoupling mechanism ensures that video streams are initially cached in a video frame queue. From this queue, multiple keypoint recognition processes can subsequently retrieve frames to perform their recognition tasks. After implementing the decoupling mechanism, multiple processes were employed for video frame recognition, greatly improving the real-time performance of the entire assessment system.
- Furthermore, a general posture assessment algorithm is proposed for multiple exercise modalities. Based on the state machine model, the proposed algorithm accurately identifies key movement transformations to ensure a fair judgment of postures. This effectively enhances intelligence of the assessment system, reduces manual intervention, and improves the fairness and transparency of the assessment process.
- Most importantly, the aforementioned architecture, mechanism, and algorithm have all been implemented through the construction of an experimental system. Via this system, we have verified that the proposed architecture achieves an overall accuracy exceeding 96%.
2. Experimental System Architecture
This section presents the architecture design of our testbed for the human posture recognition and assessment system. As depicted in Figure 1, the system architecture consists of four main subsystems. Each subsystem is responsible for distinct tasks and collaborates using the TCP/IP network protocol to facilitate data exchange.
2.1. Visual Sensor Subsystem
2.1.1. Function Design
This subsystem includes venue layout planning and video stream acquisition, as illustrated in Figure 2(a). Its primary objective is to ensure the real-time collection of video data through strategic venue arrangement, camera selection, and positioning. This framework is crucial for subsequent posture estimation and assessment. The data collection process entails the integration of software, hardware, and network coordination. Cameras capture video streams utilizing the Real-Time Streaming Protocol (RTSP), while OpenCV’s cv2.VideoCapture class facilitates the real-time reading of video frames from RTSP streams [18,19]. Each captured frame is stored in a video frame queue, enabling subsequent subsystems to access the raw data in a sequential manner. The effective selection of protocols, optimized queue management, and seamless hardware-software integration improve the subsystem’s capabilities regarding real-time performance, stability, and processing capacity. In video stream acquisition, since the assessment site and processing server are physically separated, data transmission between the camera and the server must traverse various networks. This scenario imposes the following core requirements on the camera:
Real-time acquisition: The camera must support low-latency video transmission to ensure that the system can capture and transmit images in real-time for posture recognition and scoring. Network transmission latency should be restricted to the millisecond range to guarantee prompt data delivery.
Image quality: High-resolution and clear video footage serve as the foundation for accurate posture recognition. The camera should support multiple resolution options to accommodate various assessment needs. By appropriately adjusting the resolution, the system can maintain image quality while optimizing network bandwidth, reducing storage requirements, and enhancing operational robustness.
Video compression: The adoption of efficient video compression technologies, such as H.264 and H.265, can significantly reduce the size of video data, enhance algorithm efficiency, and decrease network bandwidth consumption, as well as the amount of storage space used.
2.1.2. Hardware Implementation
Regarding the functional requirements, the Hikvision 6-megapixel infrared bullet network camera is selected as the model for our network camera system [20]. The relevant key parameters are listed in Table 1. The entire data collection process, illustrated in Figure 2(b), involves collaborative coordination among software, hardware, and networking components. The camera uses RTSP to retrieve video streams from the video source. To process the video obtained from the camera, the cv2.VideoCapture class in OpenCV is employed to read video frames from the RTSP stream. This class establishes a direct connection to the RTSP stream to acquire video frames in real time. Each time a video frame is successfully obtained, it is stored in a video frame storage queue, enabling subsequent processing subsystems to read the raw data in sequence.
2.2. Assessment Algorithm Subsystem
2.2.1. Function Design
This subsystem extracts human keypoint information from raw video data and executes the corresponding posture assessment algorithms to generate scores.
The assessment algorithm subsystem includes a posture processing module and an assessment algorithm module. The posture processing module identifies key human posture points within video frames and sends essential data to the assessment algorithm module for scoring. The algorithm module employs multiple suprocesses to parallelize the processing of video frames obtained from the cameras. Each subprocess detects the keypoints using human body keypoint recognition algorithms and stores the results (coordinates of keypoints) in a queue for subsequent posture recognition. This parallel processing significantly enhances efficiency, particularly in high-frame-rate scenarios, by avoiding single-thread bottlenecks.
The posture processing module maintains two queues: one for storing raw video frames and another for processed keypoint coordinates. Both queues are thread-safe to prevent data contention or loss. Additionally, the system establishes appropriate queue sizes and regularly clears processed frames to optimize memory usage. As illustrated in Figure 3(a), the posture processing module is responsible for acquiring video frames from the video frame storage queue, which is downstream of the visual sensor subsystem. It then utilizes relevant human posture detection algorithms to extract human keypoints from the video frames and transmits the core data of the keypoints to the subsequent human keypoint queue for the assessment algorithms to analyze, count and calculate the assessment scores. As depicted in Fig. Figure 3(b), the assessment algorithm module obtains data from the human keypoint queue, which is downstream of the posture processing module. It automatically selects the corresponding assessment algorithm for processing based on the chosen assessment event, ultimately generating the assessment results.
2.2.2. Hardware Implementation
In this system, posture processing and assessment are implemented on a server running the Kylin operating system [21]. The specifications of the server are detailed in Table 2. Furthermore, Kylin is a Linux kernel-based operating system designed specifically for the domestic market. It boasts high security and stability, effectively supporting the operation of enterprise-level applications. Moreover, it is essential to ensure that the system has a Python environment installed, along with the necessary dependency libraries, such as TensorFlow and OpenCV.
2.3. Control and Display Subsystem
2.3.1. Function Design
The control and display subsystem includes a control module and a display module. As the primary interface for user interaction, the control module is responsible for delivering user commands and ensuring timely responses from all subsystems to start the assessment process. The display module presents real-time algorithm execution and results, thereby enhancing transparency of the assessment process.
2.3.2. Software Implementation
In this subsystem, we utilize Vue.js for the development of control module and the user interface (UI) of display module. Vue.js is a progressive frontend framework that simplifies UI development, enhances development flexibility, enables rapid response to user interactions, and thereby improves the overall UI development experience. The interaction between frontend and backend is achieved through Axios, a promise based HTTP client. This enables cross-domain access and resource requests to obtain real-time data and update the page. The user interaction component employs directives provided by Vue.js (such as v-bind and v-for) to bind data and update the page, ensuring a dynamic response to user commands and changes occurring on the page. The UI of display module, which runs on the tablet along with the tablet terminal, is illustrated in Figure 4.
2.4. Storage Management Subsystem
2.4.1. Function Design
This subsystem is responsible for storing and managing all assessment data, including posture videos, scores, and related information. The data storage servers ensure secure storage and efficient retrieval of this data. In the storage management subsystem, video archives and assessment scores are primarily organized and stored in a database, which serves as the foundation for data analysis. After acquiring the assessment video stream, it is time-stamped according to the timestamps of the start and end frames. Subsequently, the video is archived in the folder designated for each test-taker, allowing for future querying and management.
2.4.2. Software Implementation
The system utilizes the widely-used MySQL database for efficient management. Within this database, a primary schema named DATABASE has been established, and several tables have been created within it. These tables include a student table1, an assessment records table and an assessment scores table. The key relationships among these tables are illustrated in Figure 5.
The students table, as a fundamental data structure, is responsible for storing essential information of each student. This information includes the student’s name, height, weight, BMI (Body Mass Index), total number of assessments, total score, and more. This table provides a comprehensive profile for each student, enabling the system to monitor their physical condition and assessment history. This, in turn, facilitates the subsequent analysis and management of their health status and changes in physical fitness.
The assessment records table captures essential information for each assessment, including the assessment date, start and end times, as well as the score for each assessment. By designing this table, the system can accurately record the timing and results of each assessment activity, enabling precise tracking of the specific details of each assessment in subsequent analyses.
The assessment scores table primarily records the specific scores for each evaluation, including scores for various exercise modalities such as pull-ups and push-ups. Each score is associated with an individual student and a corresponding assessment record, thereby ensuring high accuracy and integrity of the assessment data. This table not only captures each student’s performance across different modalities but also serves as foundational data for the system’s comprehensive scoring and progress tracking.
Through the close association of these three tables, the database can effectively and comprehensively manage students’ personal information, assessment records and score data. The scores from each assessment are linked to the students’ basic information and historical records, facilitating detailed analysis and queries by the users.
3. Algorithms of Human Posture Recognition and Assessment
The algorithmic core of our system extends beyond static keypoint detection to include comprehensive posture modeling and assessment. Posture reconstruction employs BlazePose model to generate anatomical landmarks [22,23,24], which are then refined using temporal smoothing. From the reconstructed posture sequences, we extract joint angles and segment distances within a standardized 2D image coordinate system, allowing for precise geometry-based assessment. Posture-specific assessment logic is implemented as a finite state machine (FSM), where each state corresponds to a recognized phase of posture (e.g., high-pull, low-support). Transitions between states are triggered when posture metrics meet predefined thresholds. This approach ensures that only complete and accurate motion cycles contribute to the final score.
3.1. Smoothing and Filtering
Figure 6 demonstrates the continuous frame outputs of human keypoints at a video frame rate of 30 FPS. As shown in Figure 6(a), the keypoint detection in the 67th frame accurately reflects the current human posture. However, in Figure 6(b), although the human body does not undergo significant postural changes in the 68th frame, erroneous keypoint detection occurs. Some points show excessive deviations from their actual joint positions, and "flying points" appear in the image. Similarly, the keypoint detection in the 36th frame shown in Figure 6(c) is accurate; however, in the 37th frame shown in Figure 6(d), the detected position of the hand exhibits minor jitter.
To optimize the "flying points" and coordinate jitter errors in human keypoints detection, this paper proposes a frame-based inter-frame joint correction and smoothing algorithm. This algorithm effectively enhances the keypoints detection results by implementing inter-frame position correction and sliding window smoothing.
The pseudocode of the algorithm presented in Table 3 briefly illustrates the execution process of the algorithm. Special attention should be given to the configuration of the correction threshold and the size of the smoothing window. For the correction threshold, the thresholds for x-axis and y-axis are set to 1/30th of the frame width and height, respectively. This determination is based on experimental test results. The size of the sliding window for the smoothing process is set to 10 frames.
3.2. Body Angle Measurement
In the analysis of assessment algorithms, the angles between joints and the distances between keypoints are crucial for assessing human posture [25,26,27]. Therefore, prior to implementing the algorithm, it is necessary to standardize these angles and distances. It is important to note that the raw data consists of normalized scale factors that range from . To facilitate practical image processing and calculations, these factors are multiplied by the actual width and height of the image frame to obtain pixel coordinates. Based on these coordinates, a 2D image coordinate system (XOY) is established, as shown in Figure 7.
In the coordinate system (XOY), the origin O is located at the top-left corner of the image. The x-axis extends horizontally to the right, while the y-axis extends vertically downward. Given three human keypoints , and C, the angle between skeletal vectors and can be calculated through the following steps [28]
The cosine value of the joint bone radian is defined as follows:
Subsequently, the radian value is obtained using the arc-cosine formula, with the counterclockwise direction from the origin of the coordinate system XOY defined as positive. For improved intuitive understanding, this radian value is then converted into degrees. In the two-dimensional image plane, the distance d between keypoints, such as joint points A and B, can be expressed as:
Note that the distance d is measured in pixels on the 2D image frame.
3.3. Pull-up Assessment Algorithm Design
3.3.1. Horizontal Bar Height Measurement
Since the system employs a purely vision-based solution without prior camera calibration, the height of the horizontal bar must be estimated during the execution of the algorithm. By analyzing the entire pull-up movement, we observe that after the test-taker completes the upward motion to grasp the bar, a distinct feature emerges: the height of the hands remains constant. Based on this observation, we attempt to design an algorithm to identify a stable hand height value. Variance measures data dispersion and reflects the extent of value fluctuations within a dataset. The formula for calculation is as follows:
where represents the dataset, is the mean of the dataset, n is the number of elements in the dataset, and denotes each data point within the dataset.
By calculating the variance, the algorithm can effectively identify regions where the heights remain highly stable and change minimally. During the pull-up process, when the hands are in a stationary or nearly static position, the height variation of the hands is minimal, resulting in a low variance value. Conversely, when the hands move up and down, the height variation increases, leading to a rise in variance. By observing these phenomena, the algorithm can accurately determine the height value when the hands are stable, which is then used as the height of the horizontal bar. This approach helps avoid errors in height estimation that could arise from unstable hand movements. The specific steps for the algorithm to estimate the height of the horizontal bar are as follows:
Calculate the variance within the sliding window: The sliding window method is employed, and the variance is calculated for each window. Given a window size , for the data in each window , calculate its variance:
where denotes the mean value of the data within the window, represents each data point, and signifies the size of the window.
Variance stability detection: Select windows that have relatively small variance values, specifically:
where is a threshold determined by the algorithm’s configuration, representing the acceptable range of variance.
Filter and select the maximum height value: Among all stable intervals, the algorithm selects the one with the highest average height value as the final horizontal bar height:
where represents the average height value of the i-th window, and n denotes the total number of window intervals that meet the variance stability condition.
Output result: Return the value of the height of the horizontal bar .
3.3.2. Exercise Posture Measurement Based On Finite State Machine
A finite state machine (FSM) is a model that describes how a system switches between a finite number of states in accordance with inputs and based on fixed rules. In exercise posture assessment, the state machine can define the postures occurring at each stage of a movement. It evaluates whether the movement meets the standard state transition conditions by utilizing human keypoint data, thereby facilitating automated scoring. Based on the different movement states that may occur during the pull-up process of the human body, the states of the state machine model in this paper are defined as follows:
- State1:
- The state in which the human body is pulled to a high position during a pull-up.
- State2:
- The state in which the human body exits State1 during a pull-up.
- State3:
- The state in which the human body exits State4 during a pull-up.
- State4:
- The state in which the human body is in a low position during a pull-up.
The transition between each state on the state machine is closely related to the output of the state machine judgment function , which is presented in pseudocode in Table 4.
This paper presents a state transition table (Table 5) and a state transition diagram (Figure 8) for the pull-up assessment algorithm. The following sections provide a detailed examination of each state and its transition conditions. This will facilitate a deeper analysis of the behavioral patterns and assessment criteria associated with pull-up movements.
Transitions from State1: In State1, the system remains in this state only when the output of the judgment function is "up" indicating that the human body is in the high-pull position. When the output of function is "null", it indicates that the human body exits the "up" state and transitions to State2. When the output of function is "Down ", the FSM transitions to State4. This indicates that the human body is moving directly from the high position to the low position. This generally suggests that the test taker’s movement speed may be too fast, or that the sampling frequency of posture detection is inadequate.
Transitions from State2: State2 represents the state that slides out from State1. When the output of the judgment function is "null", FSM system remains in State2. If the output of function is "up" the system re-enters State1 (the high position). This repetition is not counted because the human body does not transition through State4 (the low position). When the output of function is "down", the FSM proceeds to State4, where the human body descends to the low position.
Transitions from State3: State3 represents the state that slides out from State4. When the output of the judgment function is "null", the FSM remains in State3. If the output of function is "up", the FSM transitions to State1 (the high-pull position) and records this as a standard pull-up posture that has been completed. When the output of function is "down", the FSM re-enters State4 (the low position).
Transitions from State4: State4 indicates that the human body is in a low position during pull-ups. When the output of the judgment function is "down", the FSM remains in State4. When the output of the function is "up", the FSM transitions to State1 (the high position) and counts this as a completed standard pull-up posture. This may also indicate that the test taker’s movement speed is too fast or that the sampling frequency for posture detection is insufficient. When the output of the function is "null", the FSM exits State4 and transitions to State3.
This state machine model clearly defines key states, such as "pull position", "transition states" and "low position" along with their transition conditions. It can identify standard postures, where only the complete process from State4 to State1 is counted, and effectively handle abnormal situations (such as the direct transition from State1 to State4 due to fast movements). The strict conditional constraints in the state transition table ensure the rigor of the counting logic, thereby avoiding misjudgments and omissions. The intuitive presentation of the state transition diagram makes the behavioral patterns of the entire assessment process clearly distinguishable. This state machine-based design method meets the stringent requirements of exercise posture assessments, and also demonstrates good fault tolerance and real-time performance.
3.4. Push-up Assessment Algorithm Design
To accurately describe the working principle of the state machine, we define the relevant terms involved in the push-up assessment algorithm to enhance understanding of its mechanism. As shown in Table 6, the term "angle" refers to the joint angle calculated in the 2D XOY coordinate system of images. The term "height" is defined as the relative distance between the maximum y-axis value in the image frame and the y-value of the key point positions. Lastly, "threshold" refers to an empirical threshold set according to assessment standards, or it may be a self-determined threshold based on each individual’s performance during exercise.
Based on the different movement states that the human body may experience during push-ups, we have defined the various states of the state machine as follows.
- State1:
- During push ups, the body supports a high position.
- State2:
- The state in which the human body exits from State1 during push ups.
- State3:
- The state in which the human body exits from State4 during push ups.
- State4:
- The body supports a low position during push ups.
- State5:
- The posture of the human body in a misaligned position during push ups.
The transition between various states in the state machine is closely related to the output of the state machine judgment function , the pseudocode of which is presented in Table 7.
To clearly illustrate the working principle of the push-up state machine, this paper provides a state transition diagram and a state transition table as shown in Table 8 and Figure 9. The principle of state machine transition for push-up is essentially the same as that for pull-up. To save space, it will not be repeated here. Moreover, it is evident that the state machine-based posture assessment method proposed in this paper exhibits strong generalizability and extensibility. The core idea lies in defining key motion states and transition rules to establish a standardized assessment framework. This framework does not rely on the specific features of movements, but rather focuses on the universal patterns of human motion. Whether it is upper limb-dominant movements such as push-ups and pull-ups, or full-body coordinated movements like squats and sit-ups, this framework can be used for exercise assessment. Consequently, this state machine-based approach not only fulfills the assessment requirements for specific exercises in the current study, but also provides a scalable technical pathway for future applications in diverse exercises (e.g., track and field, gymnastics). Its strong adaptability underscores its practical value for broader implementation.
4. Experiments and Tests
In this section, we present the experimental studies conducted by using the aforementioned testbed.
4.1. Experimental Configuration
To debug and optimize the algorithm, the following outlines the workflow of human posture recognition and assessment task. The Human Pose Detection (Pose Landmarker [24]) task utilizes the create_from_options function to initialize the task, while the create_from_options function accepts the configuration option values that need to be processed. Table 9 presents the parameter configurations along with their descriptions.
The Pose Landmarker task exhibits distinct operational logic across its various execution modes. In IMAGE or VIDEO mode, the task blocks the current thread until it has fully processed the input image or frame. Conversely, in LIVE STREAM mode, the task invokes a result callback with the detection outcomes immediately after processing each frame. If the detection function is called while the task is occupied with other frames, it simply ignores the new input frame. In this system, although the live stream from the webcam inherently aligns with the LIVE STREAM mode, the VIDEO mode is deliberately chosen to ensure detection accuracy and fairness in assessment calculations. This decision benefits from the multi-process design of the assessment algorithm subsystems. Even when the posture processing speed lags behind the data collection speed, this design guarantees that all image frames are processed. Additionally, the parallel operation of multiple sub-modules within the assessment algorithm subsystem plays a crucial role in maintaining real-time performance.
Each time the Pose Landmarker task executes a detection, it returns a PoseLandmarkerResult object. This object contains the coordinates of each human body keypoint, providing essential data for subsequent analysis and assessment. Figure 10 illustrates an example of the output data structure for the Pose Landmarker task. The output includes normalized coordinates (Landmarks), world coordinates (World Landmarks), and a segmentation mask for each detected human body.
4.2. Pull-up Case
In Figure 11(a), the blue line represents the changes of hand height across video frames during pull-ups. It can be observed that the hand height changes slightly and remains stable during the initial and final stages. This stability occurs because the tester’s hands do not vary significantly when standing either before starting or after finishing the pull-up assessment. However, during the pull-up process, there are slight jitters and variations about hand coordinates, primarily influenced by minor hand movements and errors of body keypoints recognition. Particularly during the initial stage of pull-ups, the hand height experiences significant changes. The blue line in Fig. Figure 11(B) illustrates the variance of hand height values within each sliding window. It is evident that the variance remains small in frame intervals where the hands do not move significantly. The red line denotes the acceptable variance threshold (30 pixels, an empirical value selected based on the resolution of the subject’s video stream). Within the sliding window intervals that meet this variance threshold, we select the average hand height value from Fig.Figure 11(a) and take its maximum value (as indicated by the red line) as the height of horizontal bar.
Similarly, the algorithm employs the same deductive logic to determine the eye height threshold, which will be used by the state machine judgment function in Table 4. Throughout the entire pull-up process, the elbow joint point displays similar data characteristics with the hand height in Figure 11. The algorithm extracts the stable height value after the tester mounts the bar during the assessment. This value acts as the threshold that the eyes should remain below when descending to the low position of pull-up, which is referred to as the eye height threshold. The algorithm test results are presented in Figure 12, and the deduction process will not be reiterated here.
Figure 13 presents the results of applying the frame-sequence-based joint correction and smoothing algorithm. To clearly demonstrate the execution process of the algorithm, the data results after the first-step correction are shown in Figure 13(a), while the final results after further smoothing following the correction are presented in Figure 13(b). It can be observed from Figure 13(a) that the errors caused by outliers are effectively suppressed after the correction. In Figure 13(b), after the step of smoothing, the jitter errors of the coordinates are also successfully eliminated. This demonstrates that the algorithm effectively optimizes the errors in the recognition process and restores the true motion trajectory, thus providing a solid foundation for the design of the subsequent assessment algorithm.
In the preceding sections, the assessment criteria for pull-ups have been analyzed in detail, and a corresponding algorithm has been developed based on these criteria. To verify the actual effectiveness of the designed algorithm, we conduct the following experimental validations.
The data results graph from the standard pull-up experiment is shown in Figure 14. The figure is divided into four sub-graphs from top to bottom, illustrating the variation of each key data point. The analysis of the experimental data is as follows.
The 1st Sub-graph: The blue line illustrates the height of the human mouth as the sequence of frames progresses, while the red line indicates the height of the horizontal bar as estimated by the horizontal bar height measurement algorithm. It is intuitively apparent that during a standard pull-up exercise, the curve representing the mouth’s height consistently intersects with the straight line denoting the height of the horizontal bar.
The 2nd Sub-graph: The blue line represents the variation of eye height throughout the frame sequence, while the red line indicates the estimated eye height threshold by Figure 12. Similarly, the curve depicting eye height consistently intersects with the straight line representing the eye height threshold.
The 3rd Sub-graph: The blue line illustrates the variation of the angle of human elbow as the frame sequence progresses, while the red line represents the elbow angle threshold, which has been set at 150 degrees (an empirical value). This setting encourages the test-taker to keep their elbows fully extended when lowering to the low position.
The 4th Sub-graph: The blue line illustrates how the state machine varies as the frame sequence changes, allowing for observation of the overall state of human exercise and the logical counting process. Based on the sequence of the state machine in the 4th sub-graph, this experiment concludes that the test-taker performed 6 standard pull-up movements. Consequently, there were 6 transitions from State4 to State3 to State1 in the sequence.
Figure 15 shows the results of a pull-up assessment process that encounters multiple errors. The data indicates that only a few movements meets the standard assessment criteria. The main issues identified include: the mouth height not exceeding the horizontal bar during the upward pull and the eyes not being below the designated threshold height. Consequently, the final assessment score is determined to be 4, which corresponds to 4 sequences of "State4-State3-State1" in the state machine.
Then, we organized various test-takers to test the pull-up assessment algorithm, and the results are shown in Table 10. Overall, the assessment algorithm demonstrates a relatively high accuracy rate among test-takers with high physical fitness levels. However, the recognition accuracy rate decreases slightly among ordinary college students and teachers. The overall accuracy rate of the algorithm is 96.6%, which indicates that the algorithm can effectively assess pull-ups in most cases.
4.3. Push-up Case
Figure 16 presents the results of a standard push-up experiment. It includes five subgraphs arranged from top to bottom, illustrating the changes of multiple key data points. The specific analysis is as follows.
The 1st Sub-graph: The blue line illustrates the variations of elbow angle of human body as the frame sequence progresses. The red line represents the elbow angle threshold which is set as 140 degrees. This empirically chosen value aims to prevent excessive bending of the elbow during the upward phase. This threshold can be adjusted at different actual conditions. When the blue line is above the red line, it indicates that the elbow angle meets the criteria for the high support position; otherwise, it does not fulfill the established standard.

Table 11.
Push-up Assessment Algorithm Accuracy Statistics.
| Tester | Actual Repetitions/Rep | Detected Repetitions/Rep | Algorithm Counting Accuracy Rate /% |
|---|---|---|---|
| Ordinary Student | 23 | 21 | 91.0 |
| Teacher | 34 | 33 | 97.0 |
| PE Student 1 | 40 | 39 | 97.5 |
| PE Student 2 | 45 | 44 | 97.8 |
| Soldier | 50 | 50 | 100 |
| Summary | 192 | 187 | 97.4 |
The 2nd Sub-graph: The blue line illustrates the variation of mouth height, indicating the position of the tester’s mouth relative to the ground during push-ups. The mouth height fluctuates throughout the movement. The red line represents the minimum shoulder height throughout the entire push-up process, which can be different for different individuals. A necessary condition for entering the low support state during push-ups is that the mouth height must be lower than the minimum shoulder height.
The 3rd Sub-graph: The blue line illustrates the variation of the angle between torso and ground, while the red line indicates a threshold of 15 degrees.
The 4th Sub-graph: The blue line illustrates the variation of waist angle. The red line indicates the threshold which is set at 140 degrees. The purpose of this threshold is to ensure that the tester maintains a straight body.
The 5th Sub-graph: The blue line illustrates the changes of the state machine sequence. When the blue line of the state machine experiences a transition from State4 to State3 to State1, it signifies that the tester has successfully completed a standard push-up movement. During the movement, any non-compliant action will trigger State5. Finally, it can be observed from the figure that the result of this push-up assessment is 9.
Figure 17 shows the assessment results of non-standard push-up. In this experiment, the mouth height consistently failed to reach to the required threshold for the low-position state, and the torso angle also did not meet the standard. Therefore, in the state machine sequence, only 4 transitions from State4 to State3 to State1 happen. Thus, the final score of this tester is 4.
5. Conclusions
In this paper, we focus on the design and implementation of a human posture recognition and assessment system, aiming to address the inefficiencies, inaccuracies and scalability limitations of traditional manual assessment methods. By focusing on holistic posture modeling rather than isolated keypoint detection, our approach facilitates fair, accurate, and scalable assessments across multiple venues and exercises. The integration of BlazePose-based posture reconstruction, correction and smoothing algorithm, and FSM-based assessment logic ensures robustness against non-standard exercises and noise in detection. Experimental results validate the system’s high accuracy and operational efficiency, demonstrating its potential for deployment in educational, enterprise, and military contexts.
References
- Medical Physical Examination Physical Fitness Monitoring Adding “Double Insurance" for Employees’ Health General Administration of Sport of China.
- of Sport, G.A.; the Ministry of Education. Notice of the General Administration of Sport and the Ministry of Education on Printing and Distributing the Opinions on Deepening the Integration of Sports and Education to Promote the Healthy Development of Adolescents.
- Notice of the General Office of the Ministry of Education on Printing and Distributing the Guiding Outline for the Teaching Reform of Physical Education and Health.
- D, B.; CA, C.; JL, L.; R., M. Editorial: Observational Methodology in Sport: Performance Key Elements. Front Psychol. 2020, 12. [CrossRef]
- Calvo, M.G.; Fernández-Martín, A.; Recio, G.; Lundqvist, D. Human Observers and Automated Assessment of Dynamic Emotional Facial Expressions: KDEF-dyn Database Validation. Frontiers in Psychology 2018, 9. [Google Scholar] [CrossRef] [PubMed]
- Castellano, J.; Perea, A.; Alday, L.e.a. The Measuring and Observation Tool in Sports. Behavior Research Methods 2008, 40, 898–905. [Google Scholar] [CrossRef]
- Mattocks, A.R.; ATC, C.; Mahoney, S.E.; FACSM; Vogelpohl, R.E.; ATC; Hawkins, K.; APRN, F.C. Observers Have Similar Impr e Similar Improvements in Student Learning ements in Student LearningOutcomes as P Outcomes as Participants in A ticipants in Athletic T thletic Training Simulation aining SimulationEducation: A Pilot Study. Journal of SportsMedicine and Allied Health Sciences: Official Journal of the Ohio Athletic Trainers Association 2024, 10. [Google Scholar] [CrossRef]
- Li Guisen.; Zheng Zhong.; Jiao Chenxi. Extra-curricular Physical Exercise Management System Based on AI Sports - Development of the Extra-curricular Physical Exercise System of Peking University. pp. 36–41.
- Tee, W.Z.; Dave, R.; Seliya, N.; Vanamala, M. Human Activity Recognition Models Using Limited Consumer Device Sensors and Machine Learning. In Proceedings of the Proc. CACML; 2022; pp. 456–461. [Google Scholar] [CrossRef]
- Ferdous, M.; Debnath, J.; Chakraborty, N.R. Machine Learning Algorithms in Healthcare: A Literature Survey. In Proceedings of the Proc. ICCCNT; 2020; pp. 1–6. [Google Scholar] [CrossRef]
- Narkhede, N.; Mathur, S.; Bhaskar, A.A.; Hiran, K.K.; Dadhich, M.; Kalla, M. A New Methodical Perspective for Classification and Recognition of Music Genre Using Machine Learning Classifiers. In Proceedings of the Proc. ETNCC; 2023; pp. 94–99. [Google Scholar] [CrossRef]
- He, G.; Liu, Y.; Wu, X. A new algorithm for physical topology discovery based on STP and AFT. In Proceedings of the Proc. IHMSC. IEEE, Vol. 1; 2013; pp. 486–490. [Google Scholar]
- Bazarevsky, V.; Grishchenko, I.; Raveendran, K.; Zhu, T.; Zhang, F.; Grundmann, M. BlazePose: On-device Real-time Body Pose tracking. arXiv 2020, arXiv:cs.CV/2006.10204. [Google Scholar]
- Luo, W.; Xue, J. Human Pose Estimation Based on Improved HRNet Model. In Proceedings of the 2023 IEEE 3rd International Conference on Computer Communication and Artificial Intelligence (CCAI); 2023; pp. 153–157. [Google Scholar] [CrossRef]
- Zhang, H.; Dun, Y.; Pei, Y.; Lai, S.; Liu, C.; Zhang, K.; Qian, X. HF-HRNet: A Simple Hardware Friendly High-Resolution Network. IEEE Transactions on Circuits and Systems for Video Technology 2024, 34, 7699–7711. [Google Scholar] [CrossRef]
- Tian, Y.; Liao, W.; Xu, Z.; Wang, W. A Binocular Vision Fish Body Length Measurement Method Based on Improved YOLOv8-pose. In Proceedings of the 2024 5th International Symposium on Computer Engineering and Intelligent Communications (ISCEIC); 2024; pp. 622–625. [Google Scholar] [CrossRef]
- Fang, J.B.; Liao, X.K.; Huang, C.; Dong, D.Z. Performance Evaluation of Memory-Centric ARMv8 Many-Core Architectures: A Case Study with Phytium 2000+. Journal of Computer Science and Technology: English Edition 2021, 36, 11. [Google Scholar] [CrossRef]
- Tushar.; Kumar, K.; Kumar, S. Object Detection using OpenCV and Deep Learning. In Proceedings of the Proc. ICAC3N, 2022, pp. 899–902. [CrossRef]
- Tao, Y.; An, L.; Hao, J. Application of Static Gesture Recognition Based on OpenCV. In Proceedings of the Proc. ACAIT; 2023; pp. 215–220. [Google Scholar] [CrossRef]
- HIKVISION. DS-2CD3T56FWDV2-I3.
- Tenglong, Z. TL520F-A. https://www.pterosauria.cn/product/ftjs/efd/259262d433a95c96b82e508a151e3b74.html, 2023. Accessed: 2023-12-01.
- Maitray, T.; Singh, U.; Kukreja, V.; Patel, A.; Sharma, V. Exercise posture rectifier and tracker using MediaPipe and OpenCV. In Proceedings of the Proc. ICAC3N; 2023; pp. 141–147. [Google Scholar] [CrossRef]
- Alsawadi, M.S.; Rio, M. Human Action Recognition using BlazePose Skeleton on Spatial Temporal Graph Convolutional Neural Networks. In Proceedings of the Proc. ICITACEE; 2022; pp. 206–211. [Google Scholar] [CrossRef]
- Arya, V.; Maji, S. Enhancing Human Pose Estimation: A Data-Driven Approach with MediaPipe BlazePose and Feature Engineering Analysing. In Proceedings of the Proc. IC2SDT; 2024; pp. 1–6. [Google Scholar] [CrossRef]
- Ijjina, E.P.; Mohan, C.K. Human action recognition based on motion capture information using fuzzy convolution neural networks. In Proceedings of the Proc. ICAPR; 2015; pp. 1–6. [Google Scholar] [CrossRef]
- Ruan, R.; Liu, X.; Wu, X. Action Recognition Method for Multi-joint Industrial Robots Based on End-arm Vibration and BP Neural Network. In Proceedings of the Proc. ICCRE; 2021; pp. 13–17. [Google Scholar] [CrossRef]
- Wang, Z.; Zhang, C.; Luo, W.; Lin, W. Key Joints Selection and Spatiotemporal Mining for Skeleton-Based Action Recognition. In Proceedings of the Proc. ICIP; 2018; pp. 3458–3462. [Google Scholar] [CrossRef]
- Szeliski, R. Computer vision: algorithms and applications; Springer Nature, 2022. [Google Scholar]
| 1 | In the table, "students" refers to the test-takers undergoing posture assessment. |
Figure 1.
Framework diagram of human posture recognition and assessment system.
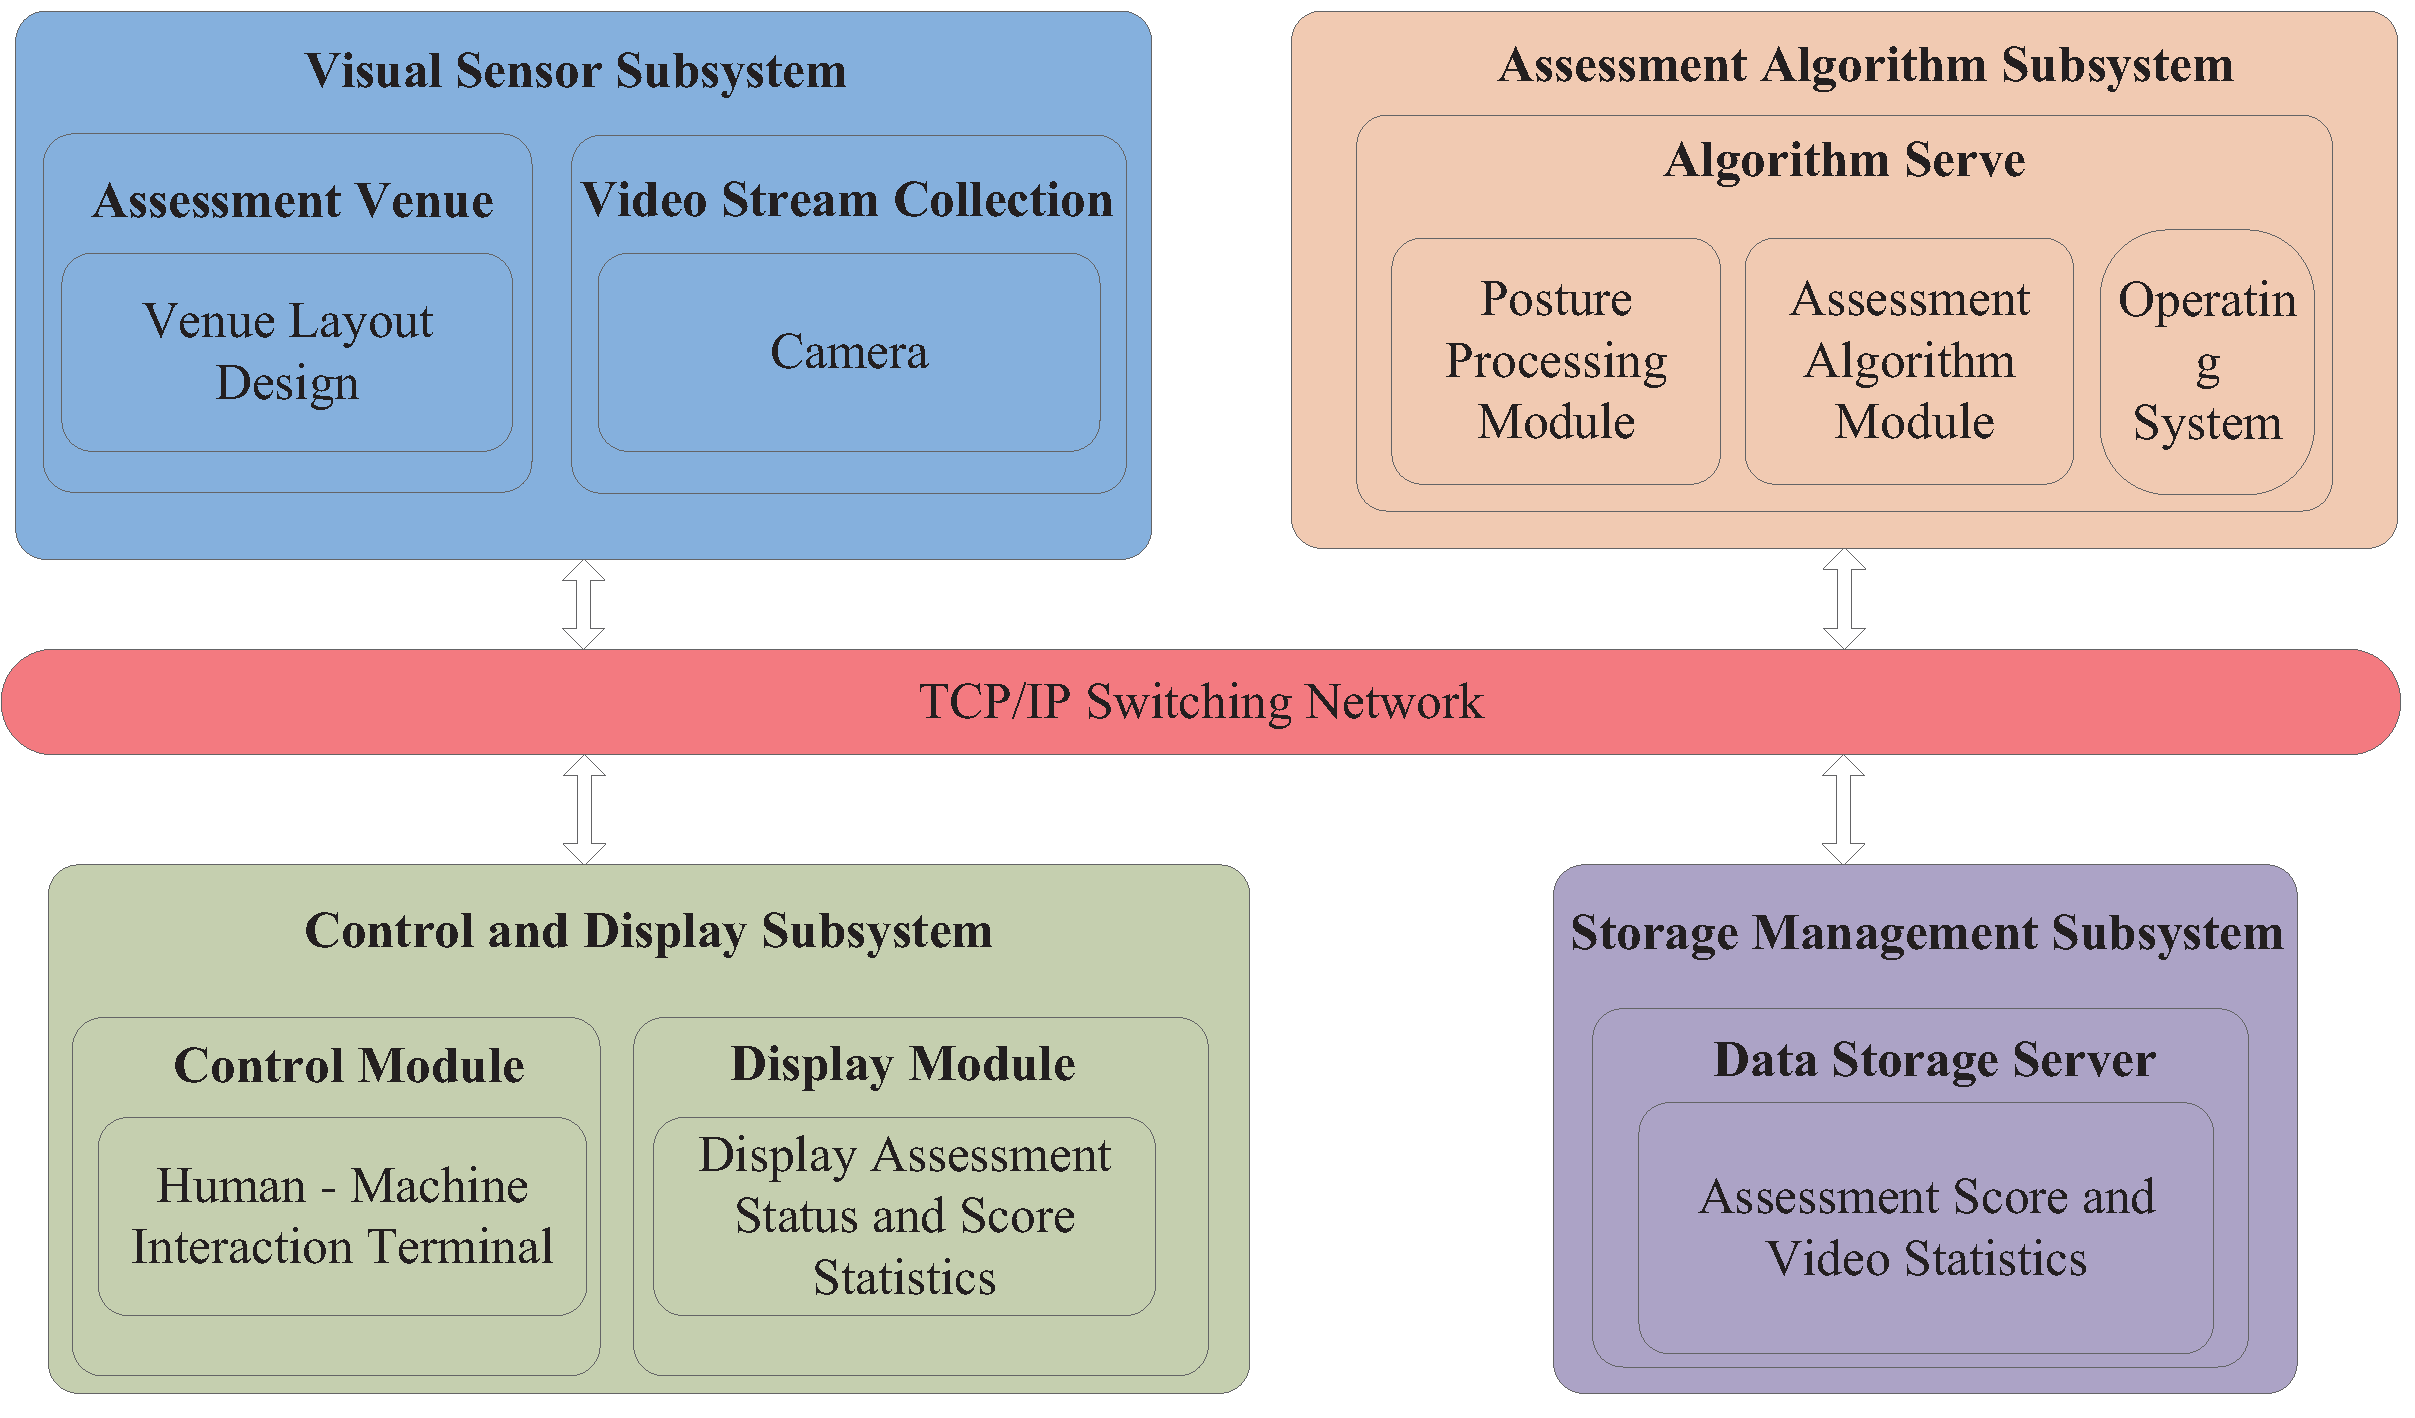
Figure 2.
Venue layout and data acquisition process (Taking pull-ups as an example).
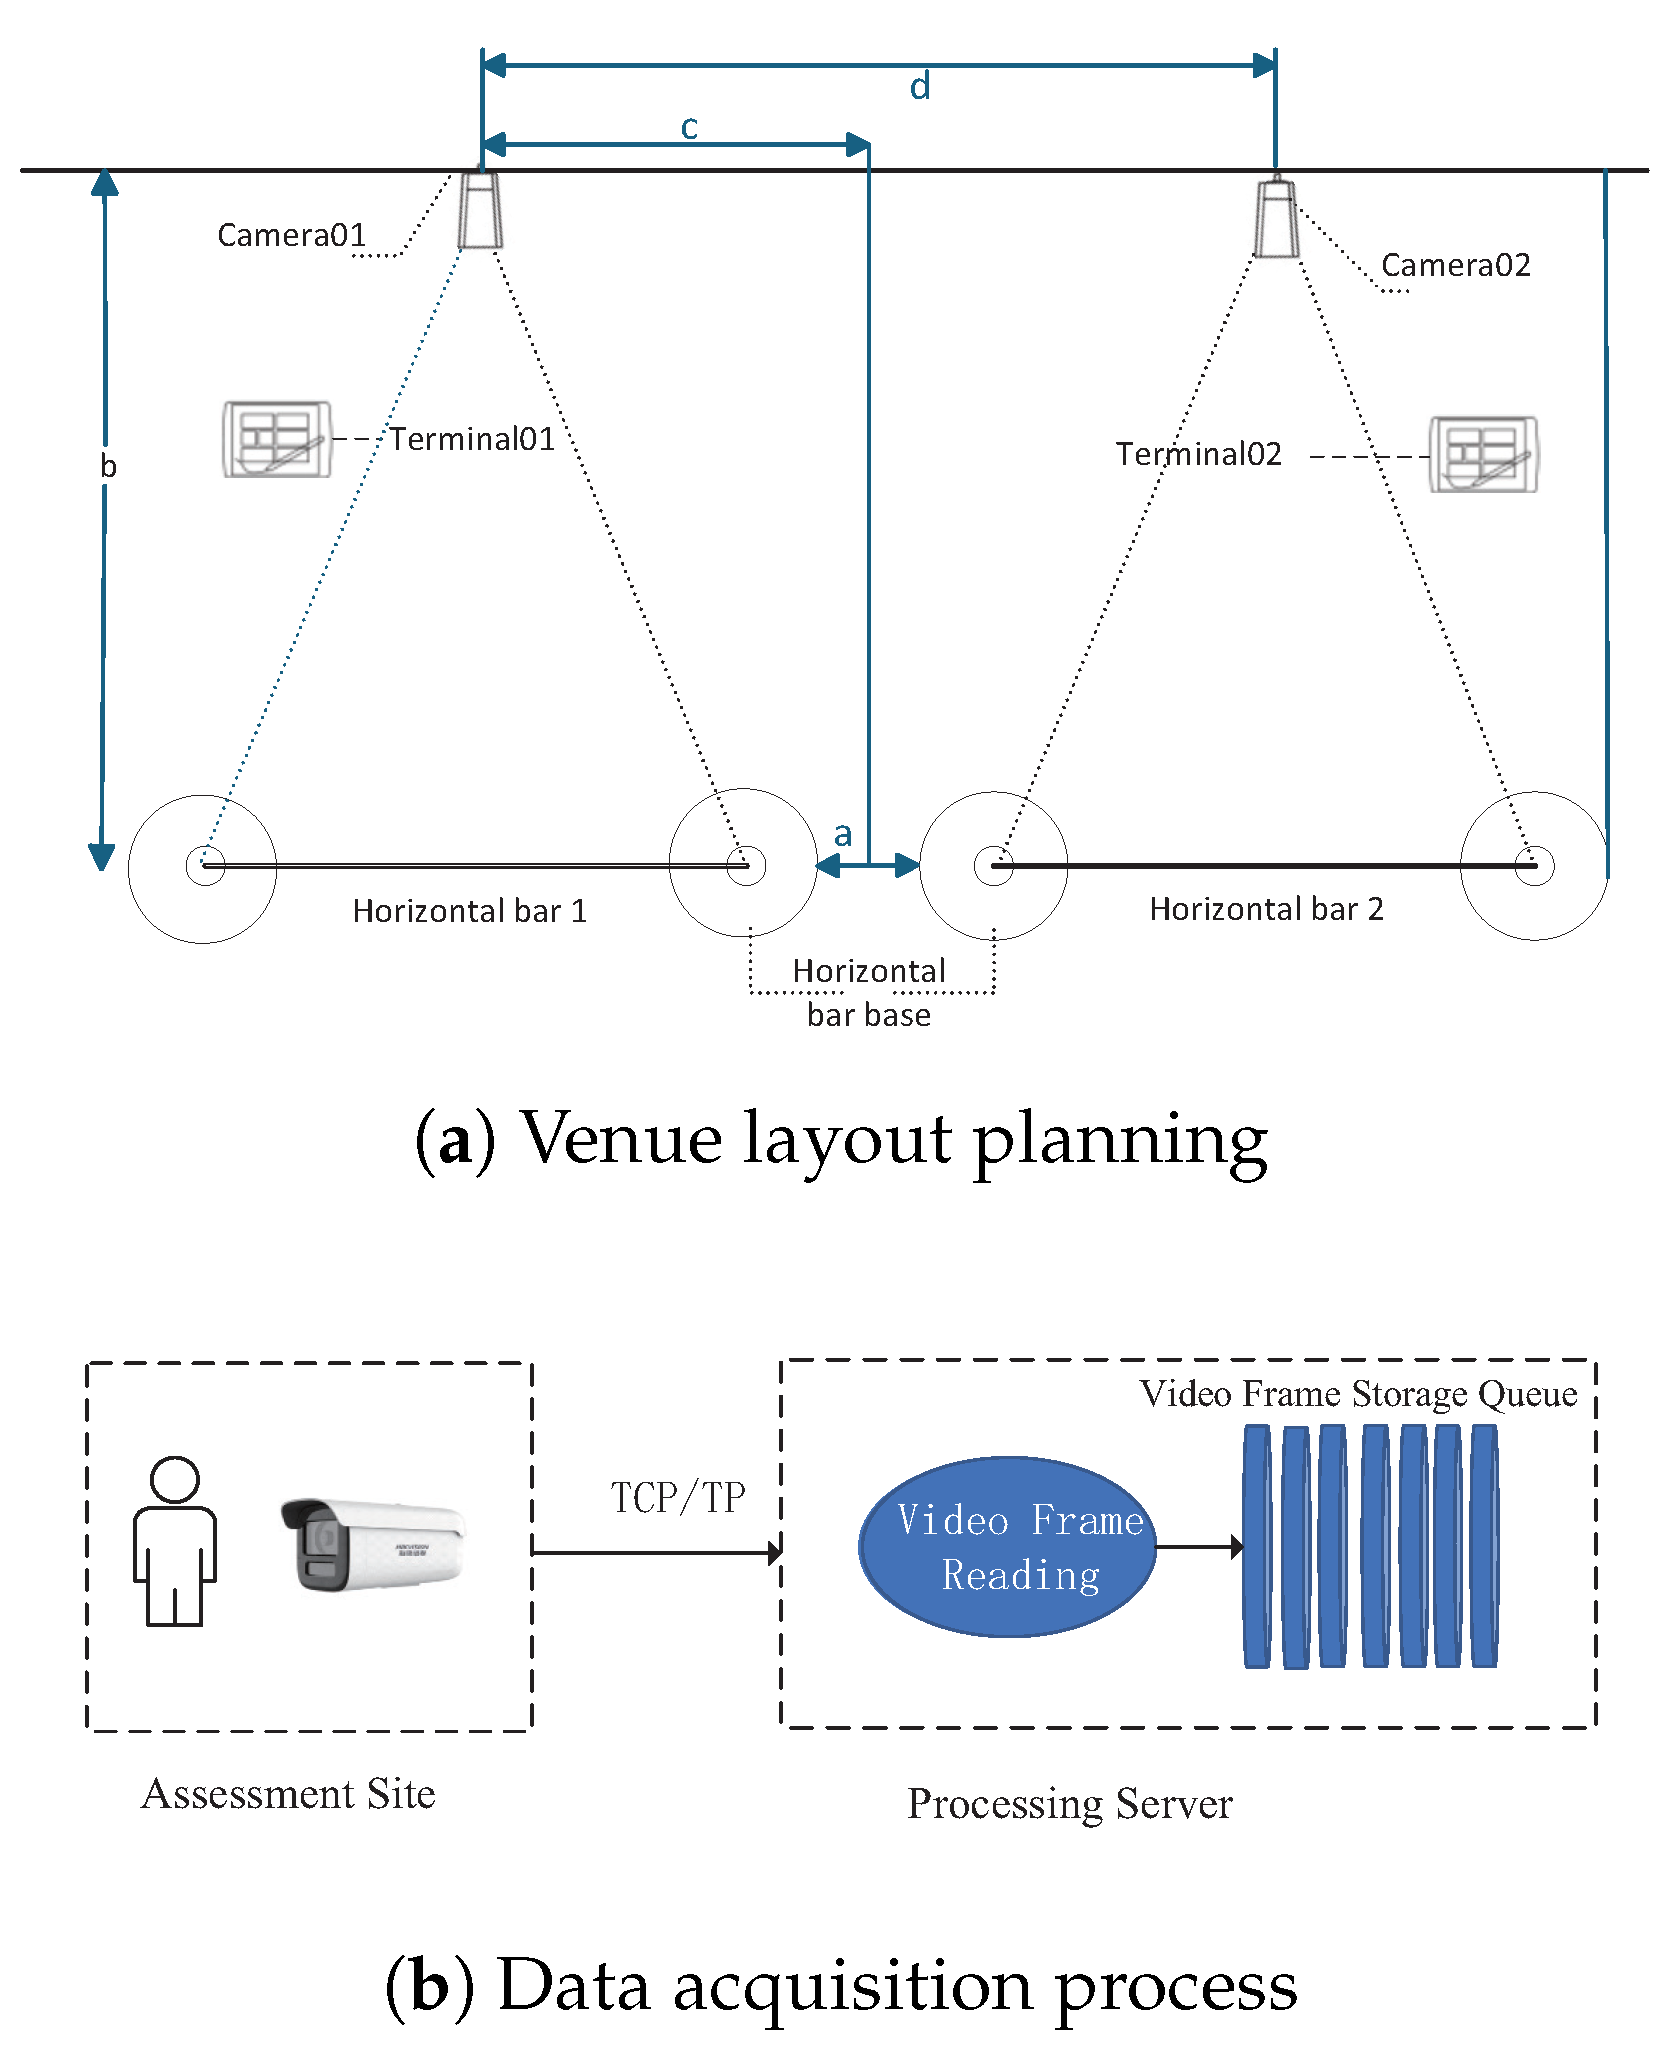
Figure 3.
System processing subsystem. (a) Posture processing module. (b) Assessment algorithm module.
Figure 3.
System processing subsystem. (a) Posture processing module. (b) Assessment algorithm module.
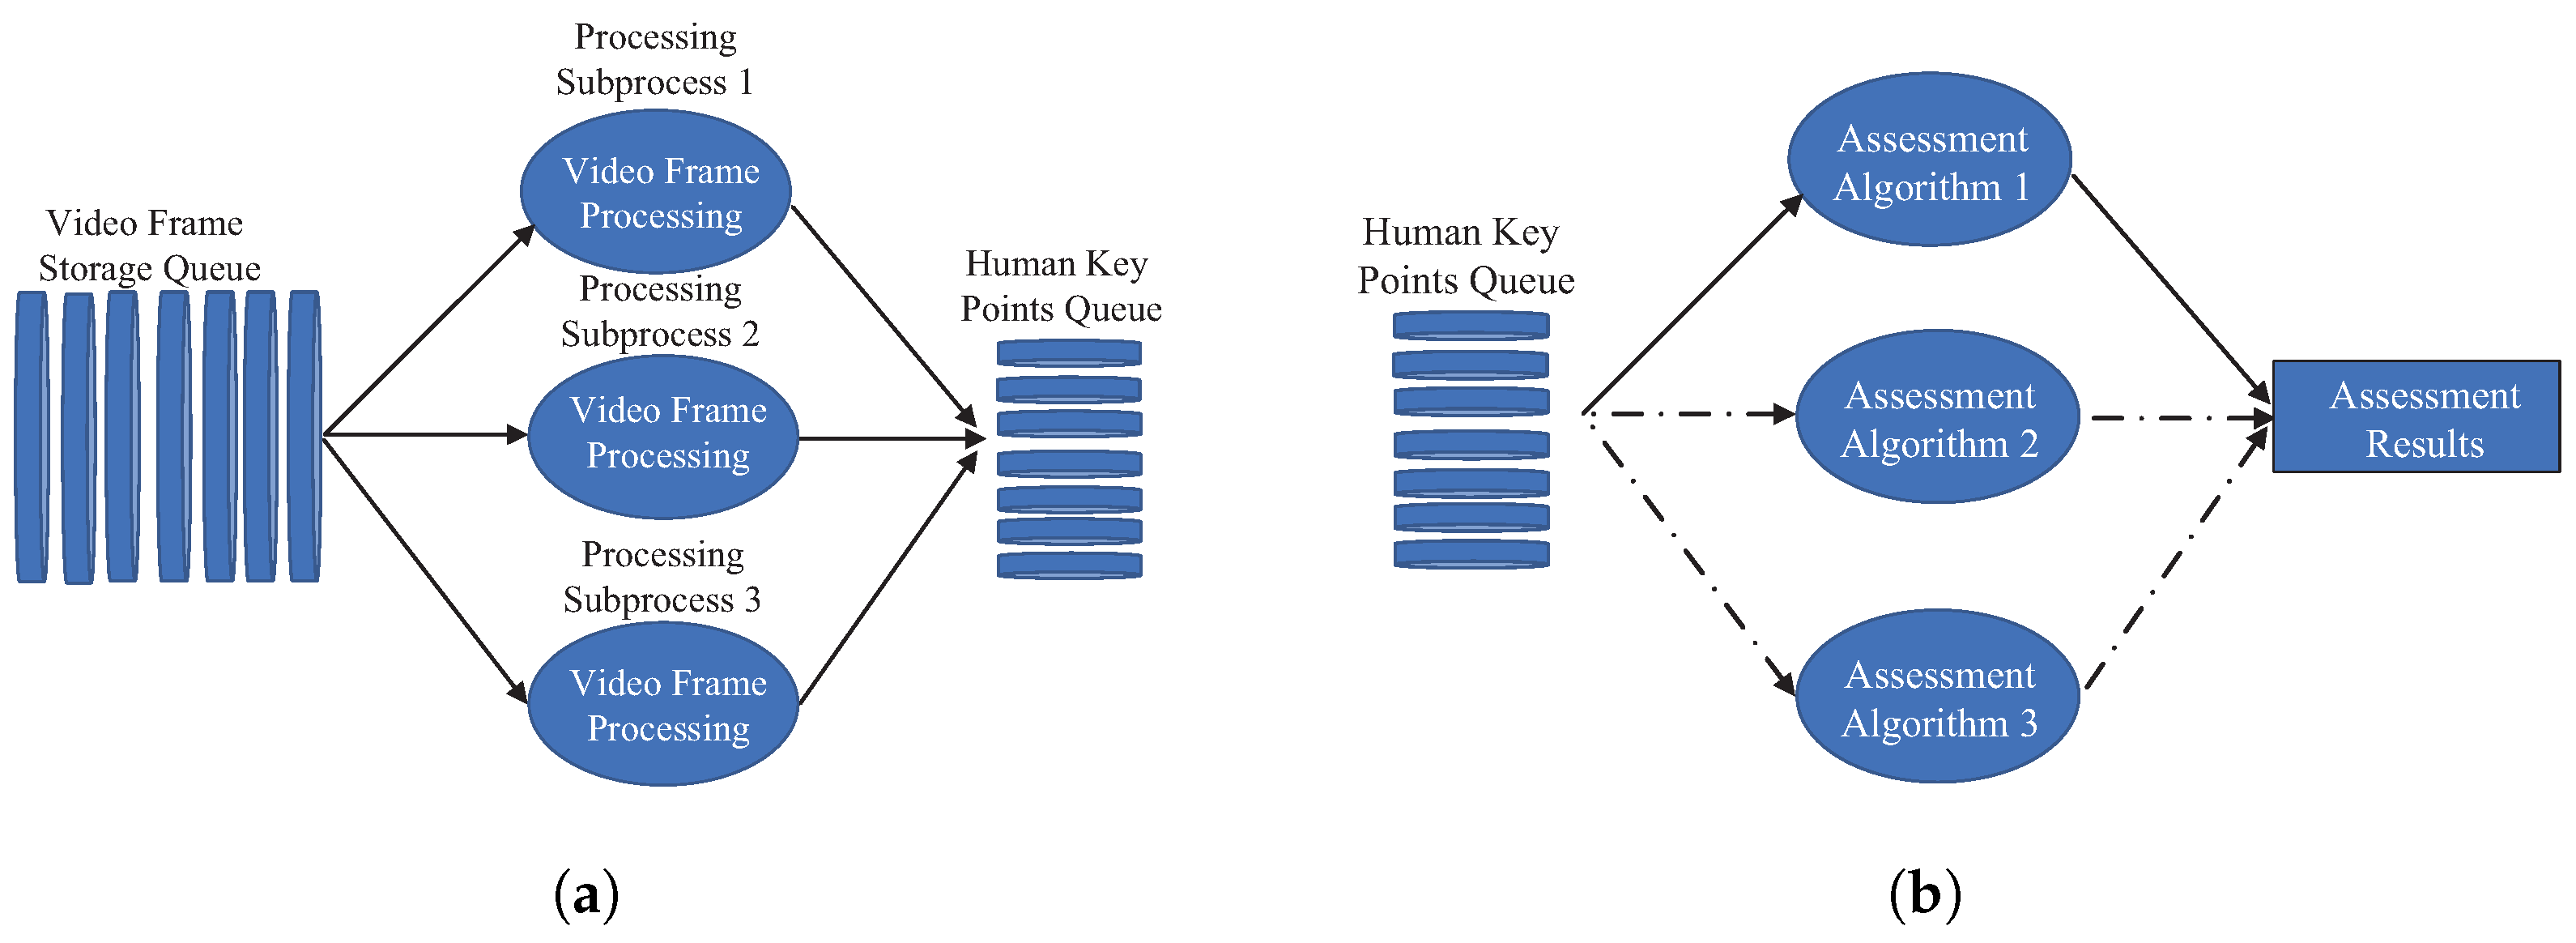
Figure 4.
The UI of display module.
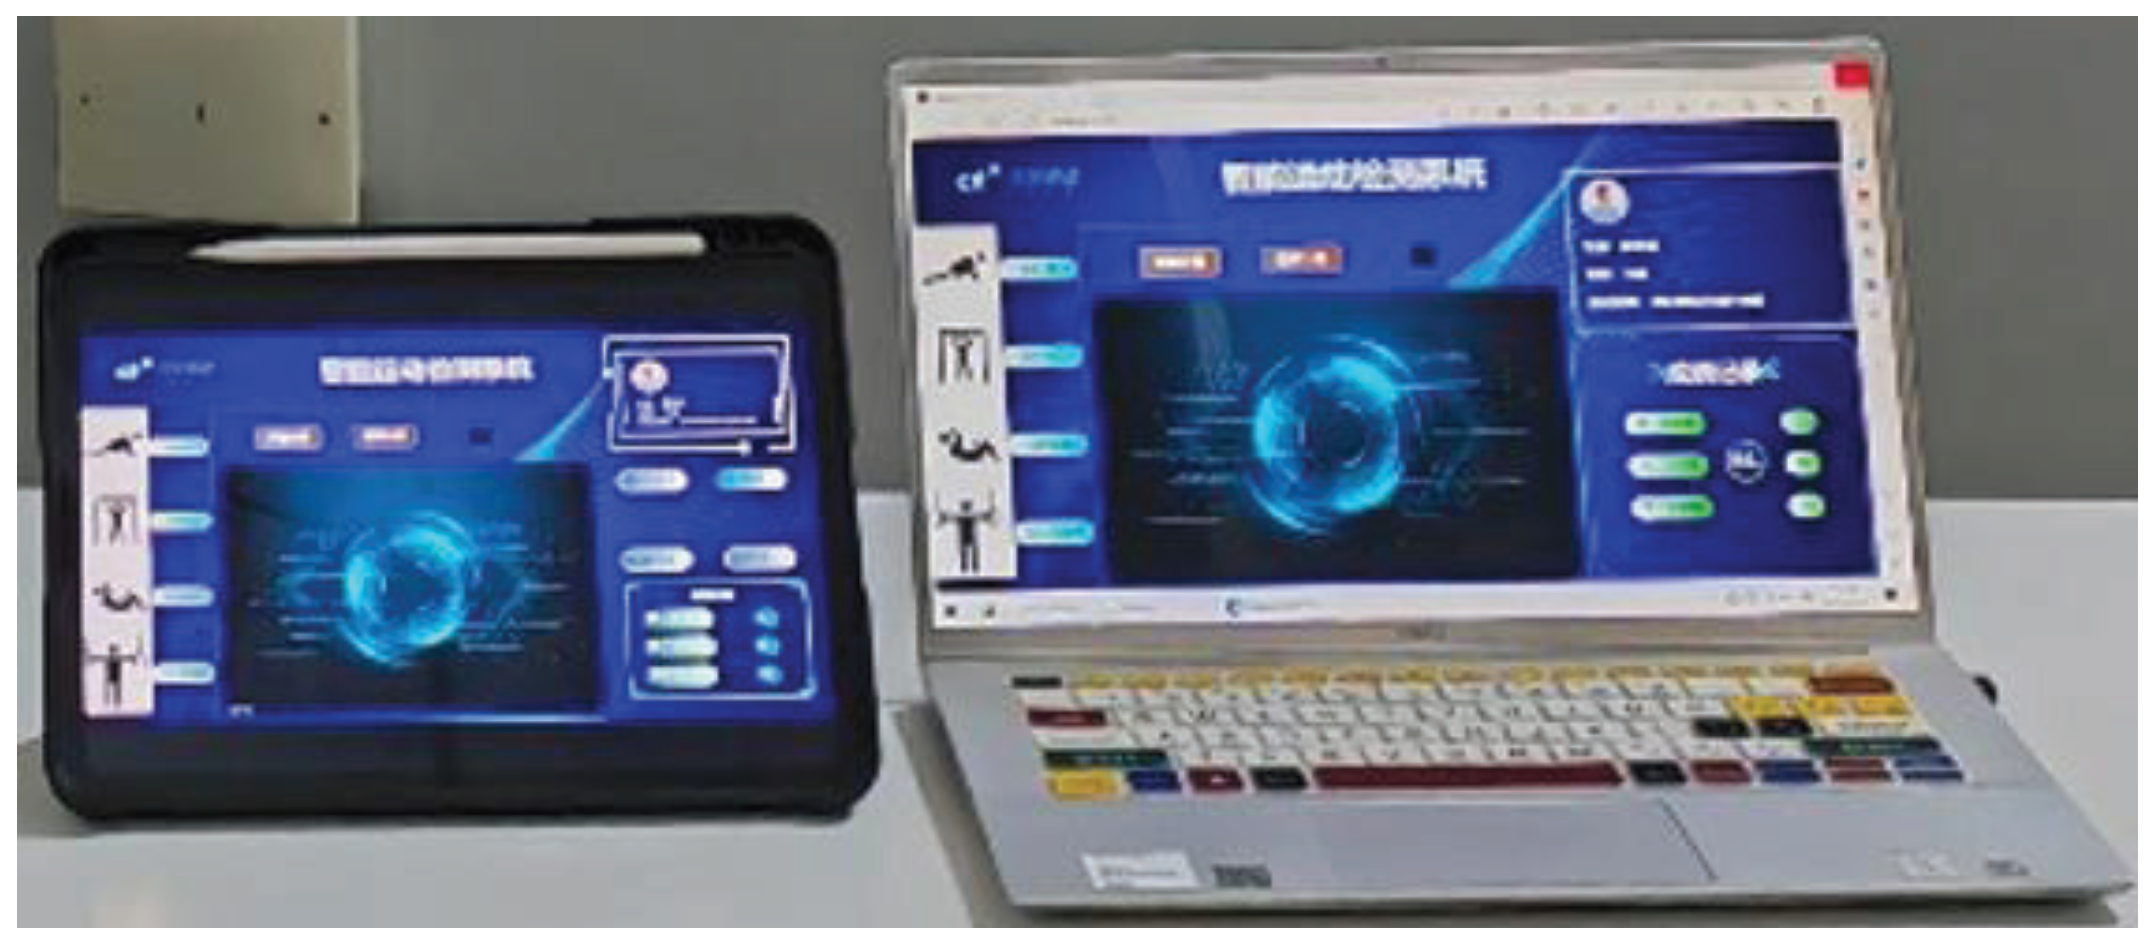
Figure 5.
Table structures and their relationships in databases.
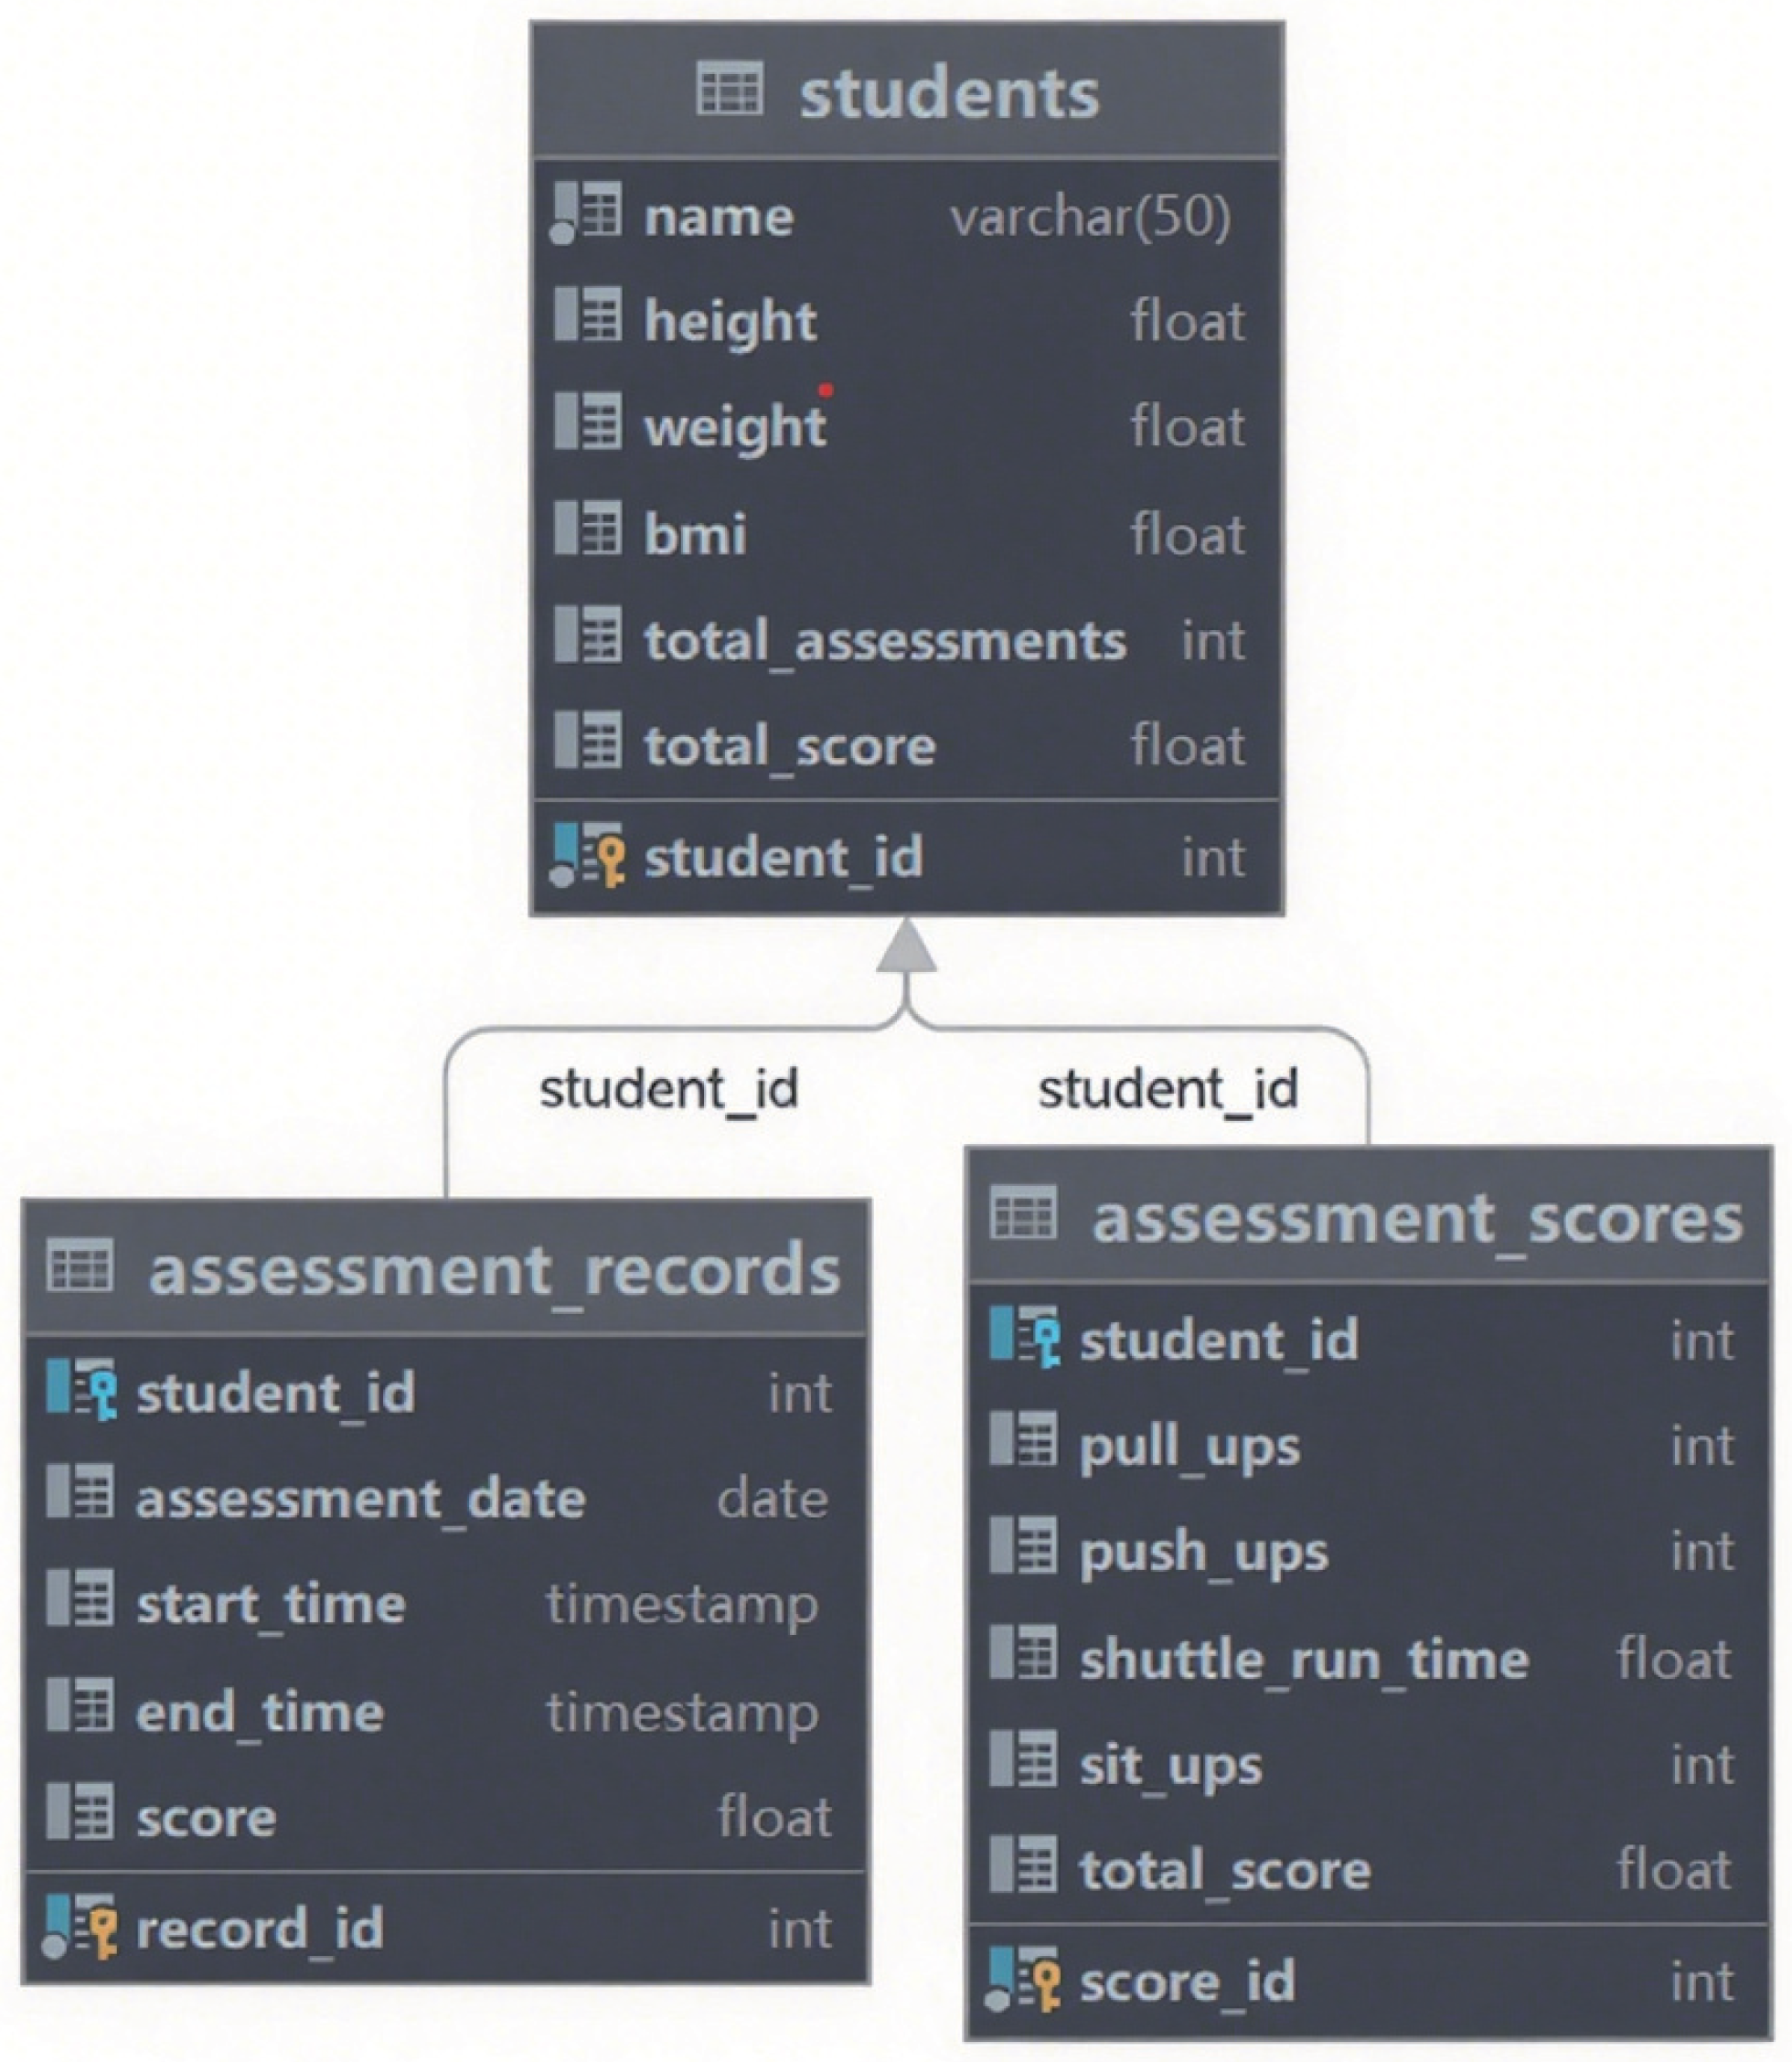
Figure 6.
Coordinate errors in recognition. (a) Frame-67 posture is correctly recognized. (b) Frame-68: Pose Recognition Flying Point. (c) Frame-36 posture is correctly recognized. (d) Frame-37 posture recognition jitter.
Figure 6.
Coordinate errors in recognition. (a) Frame-67 posture is correctly recognized. (b) Frame-68: Pose Recognition Flying Point. (c) Frame-36 posture is correctly recognized. (d) Frame-37 posture recognition jitter.
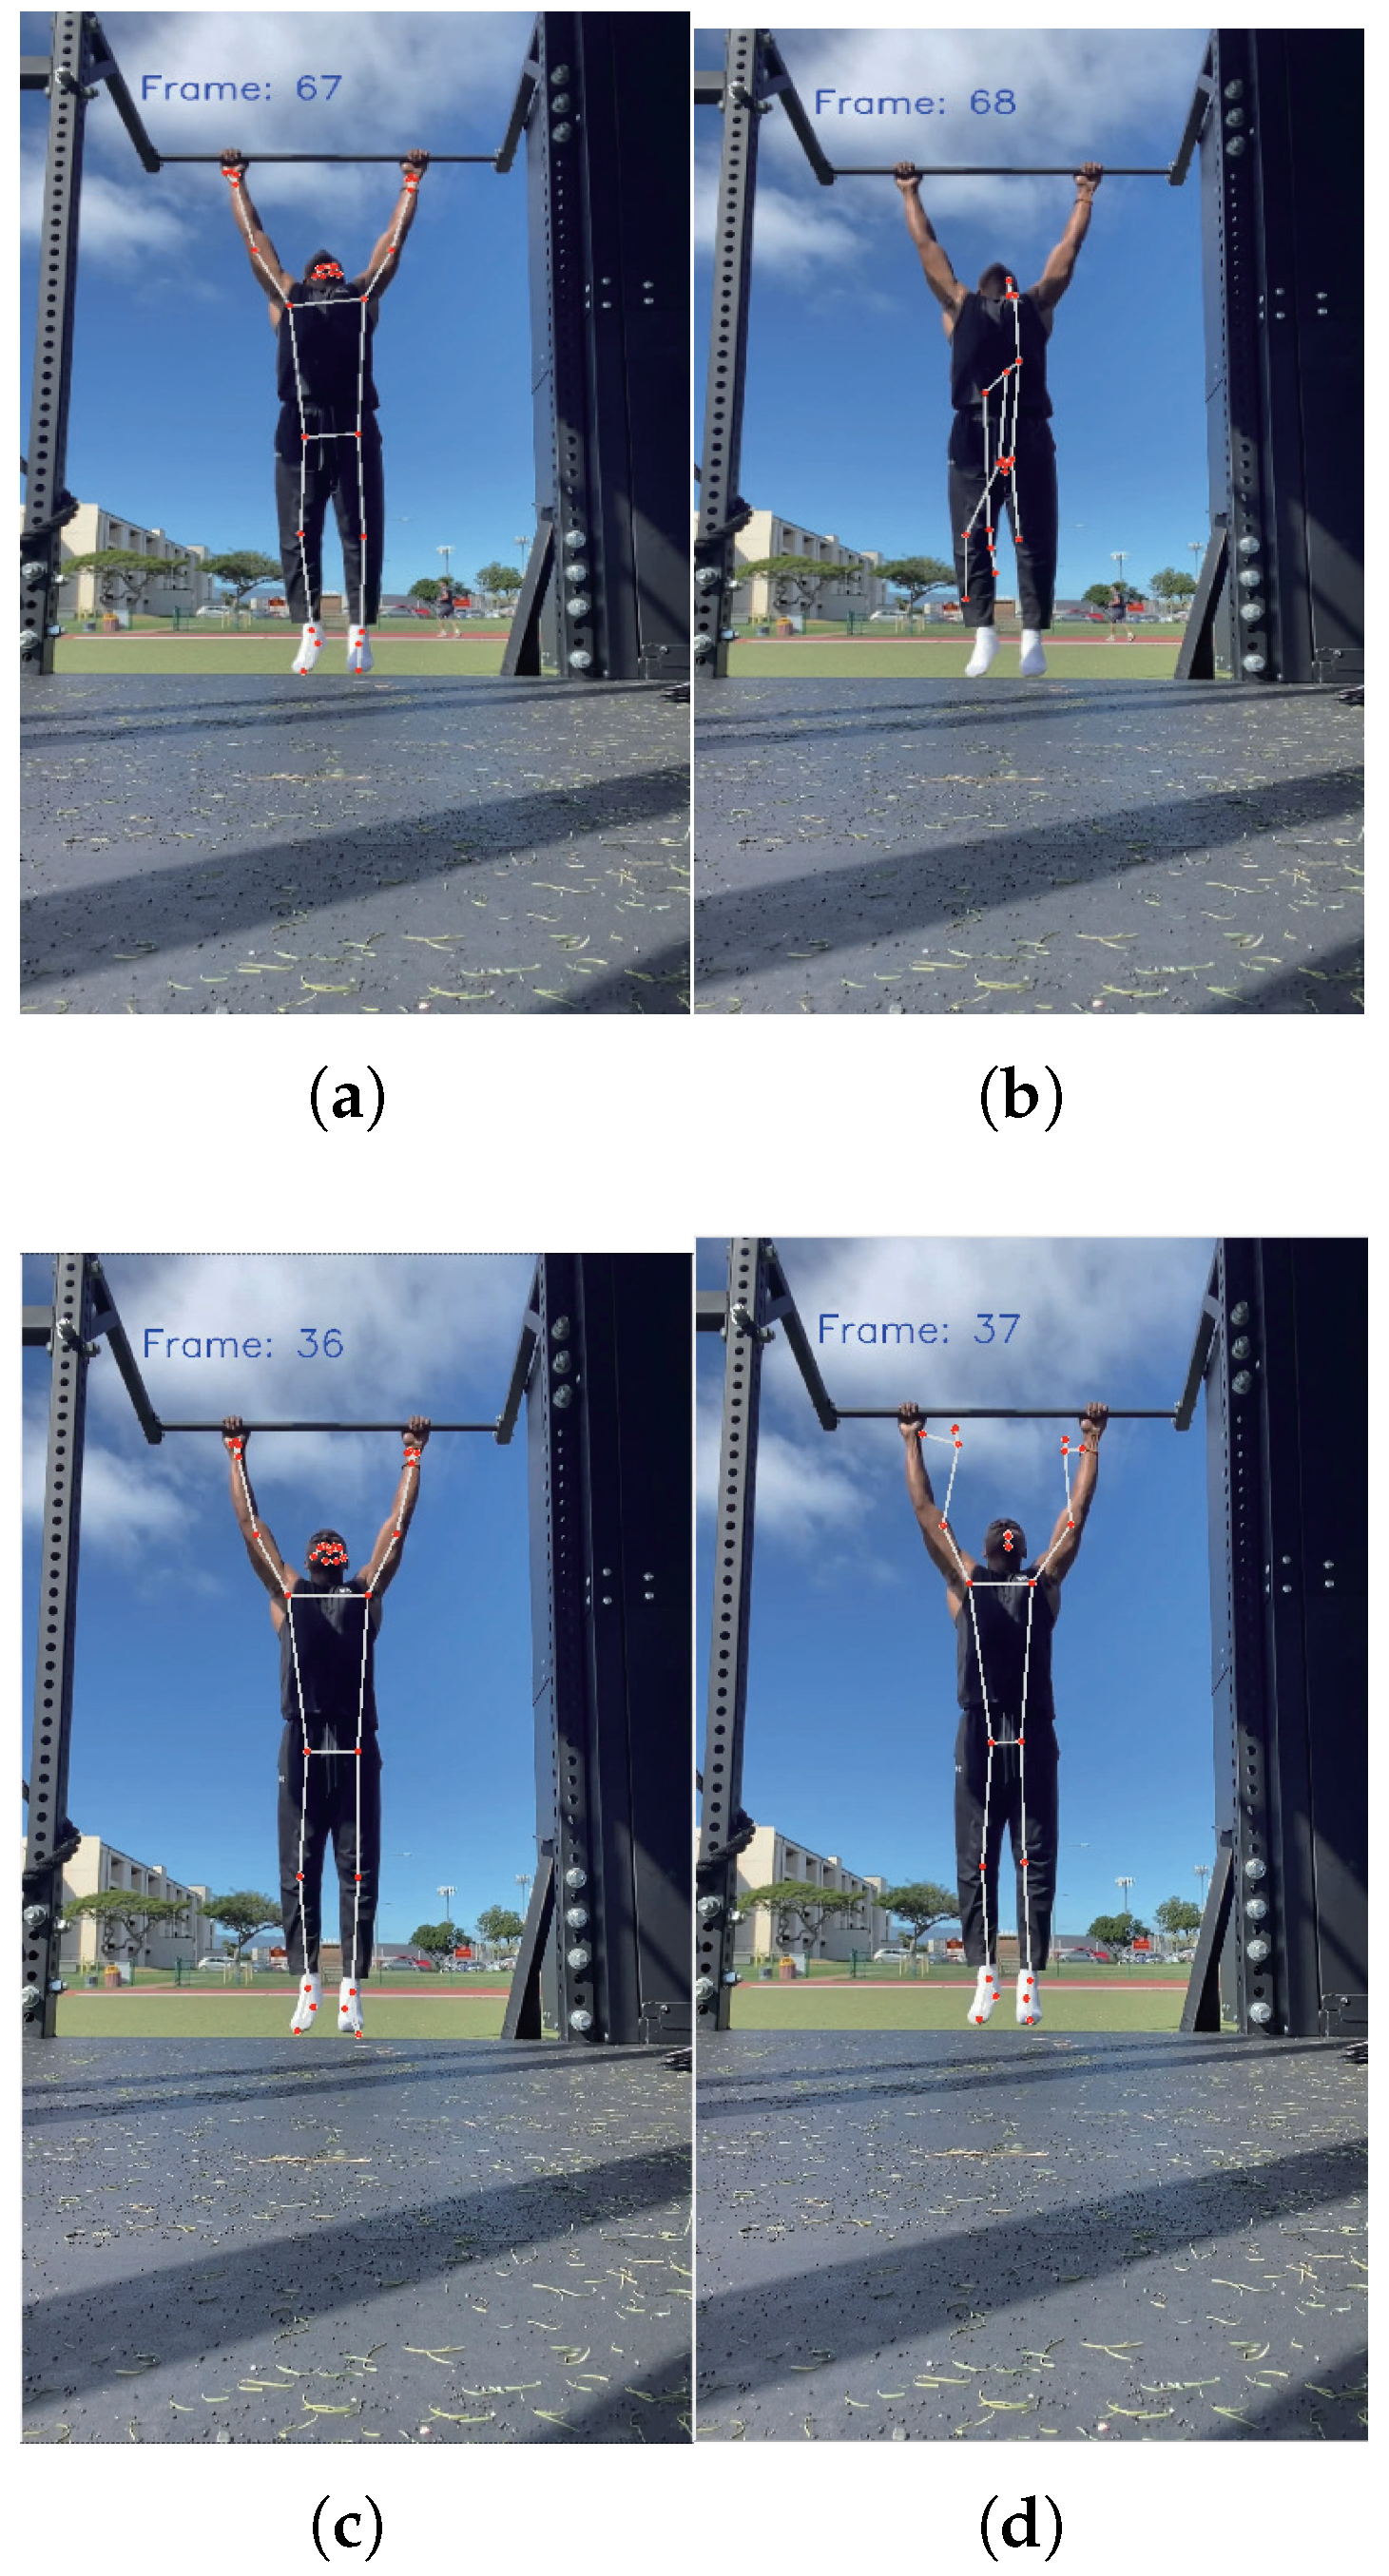
Figure 7.
2D screen image coordinate system XOY.
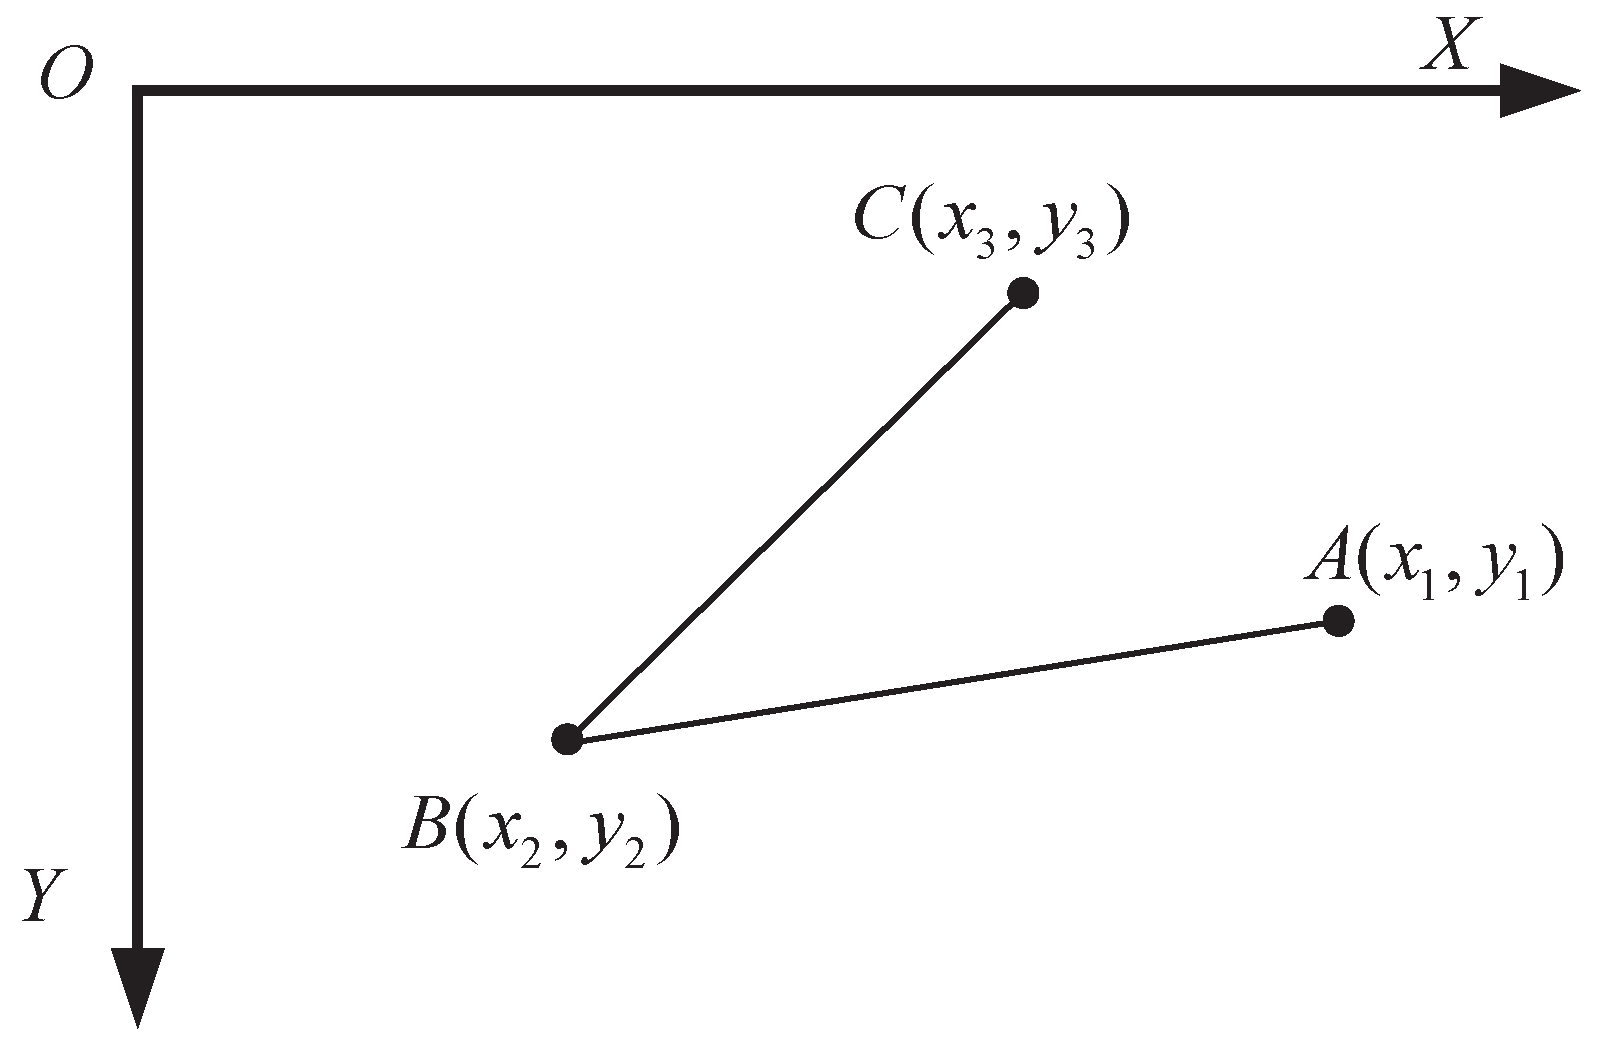
Figure 8.
Pull-up assessment algorithm state machine.
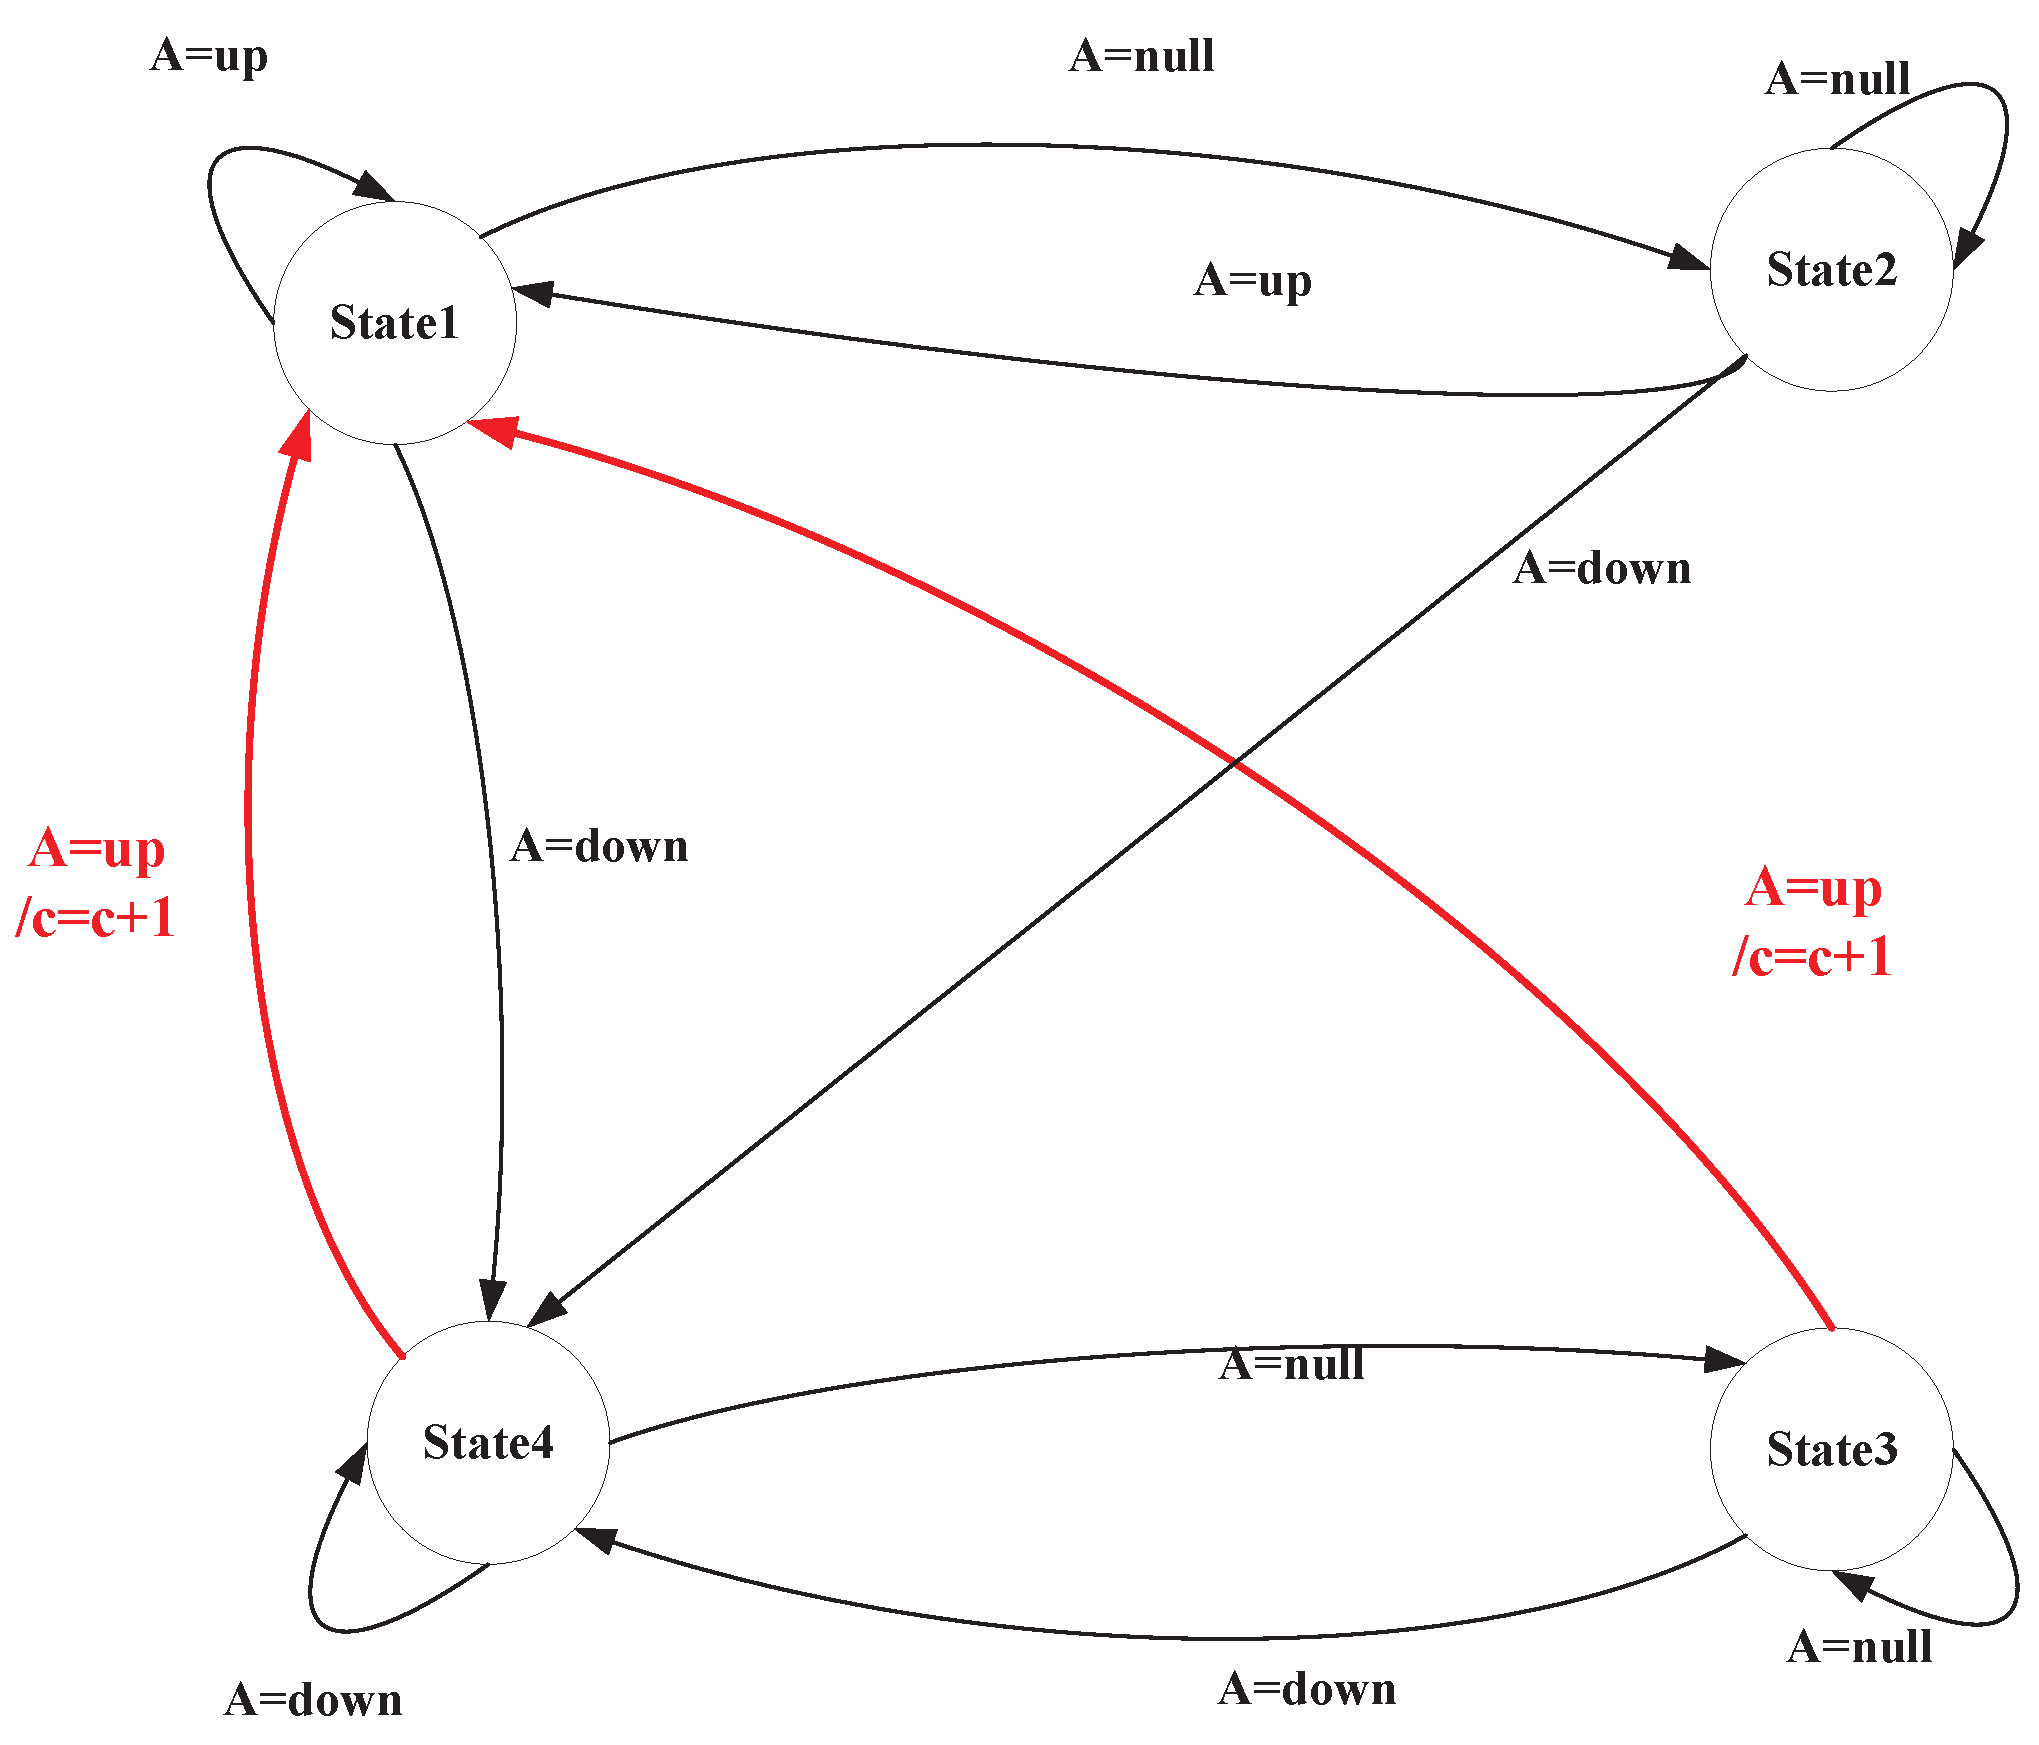
Figure 9.
Push-up assessment algorithm state machine.
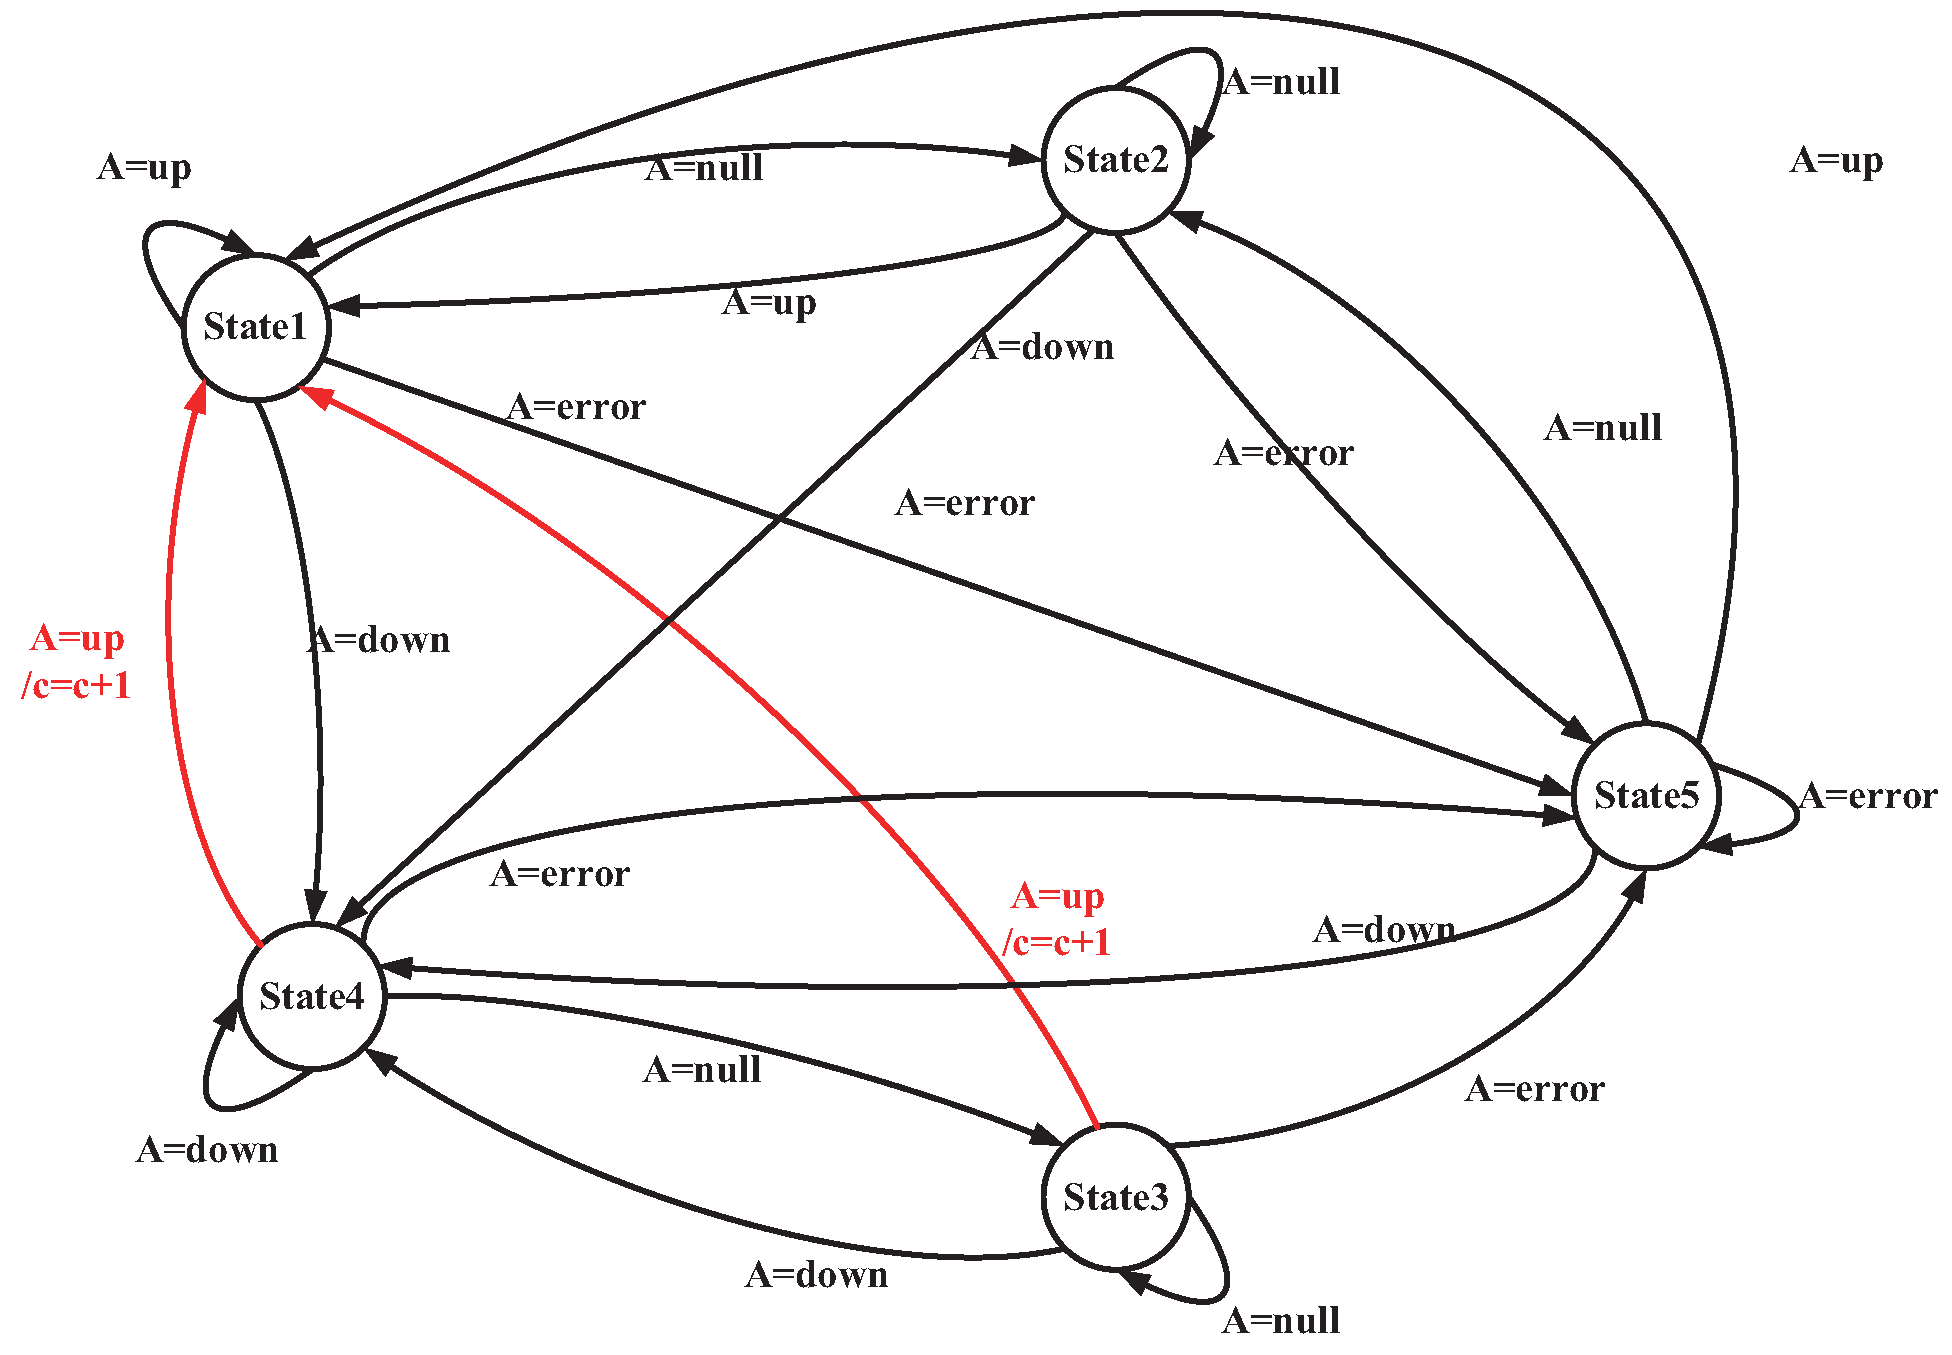
Figure 10.
Pose Landmarker result data structure example.
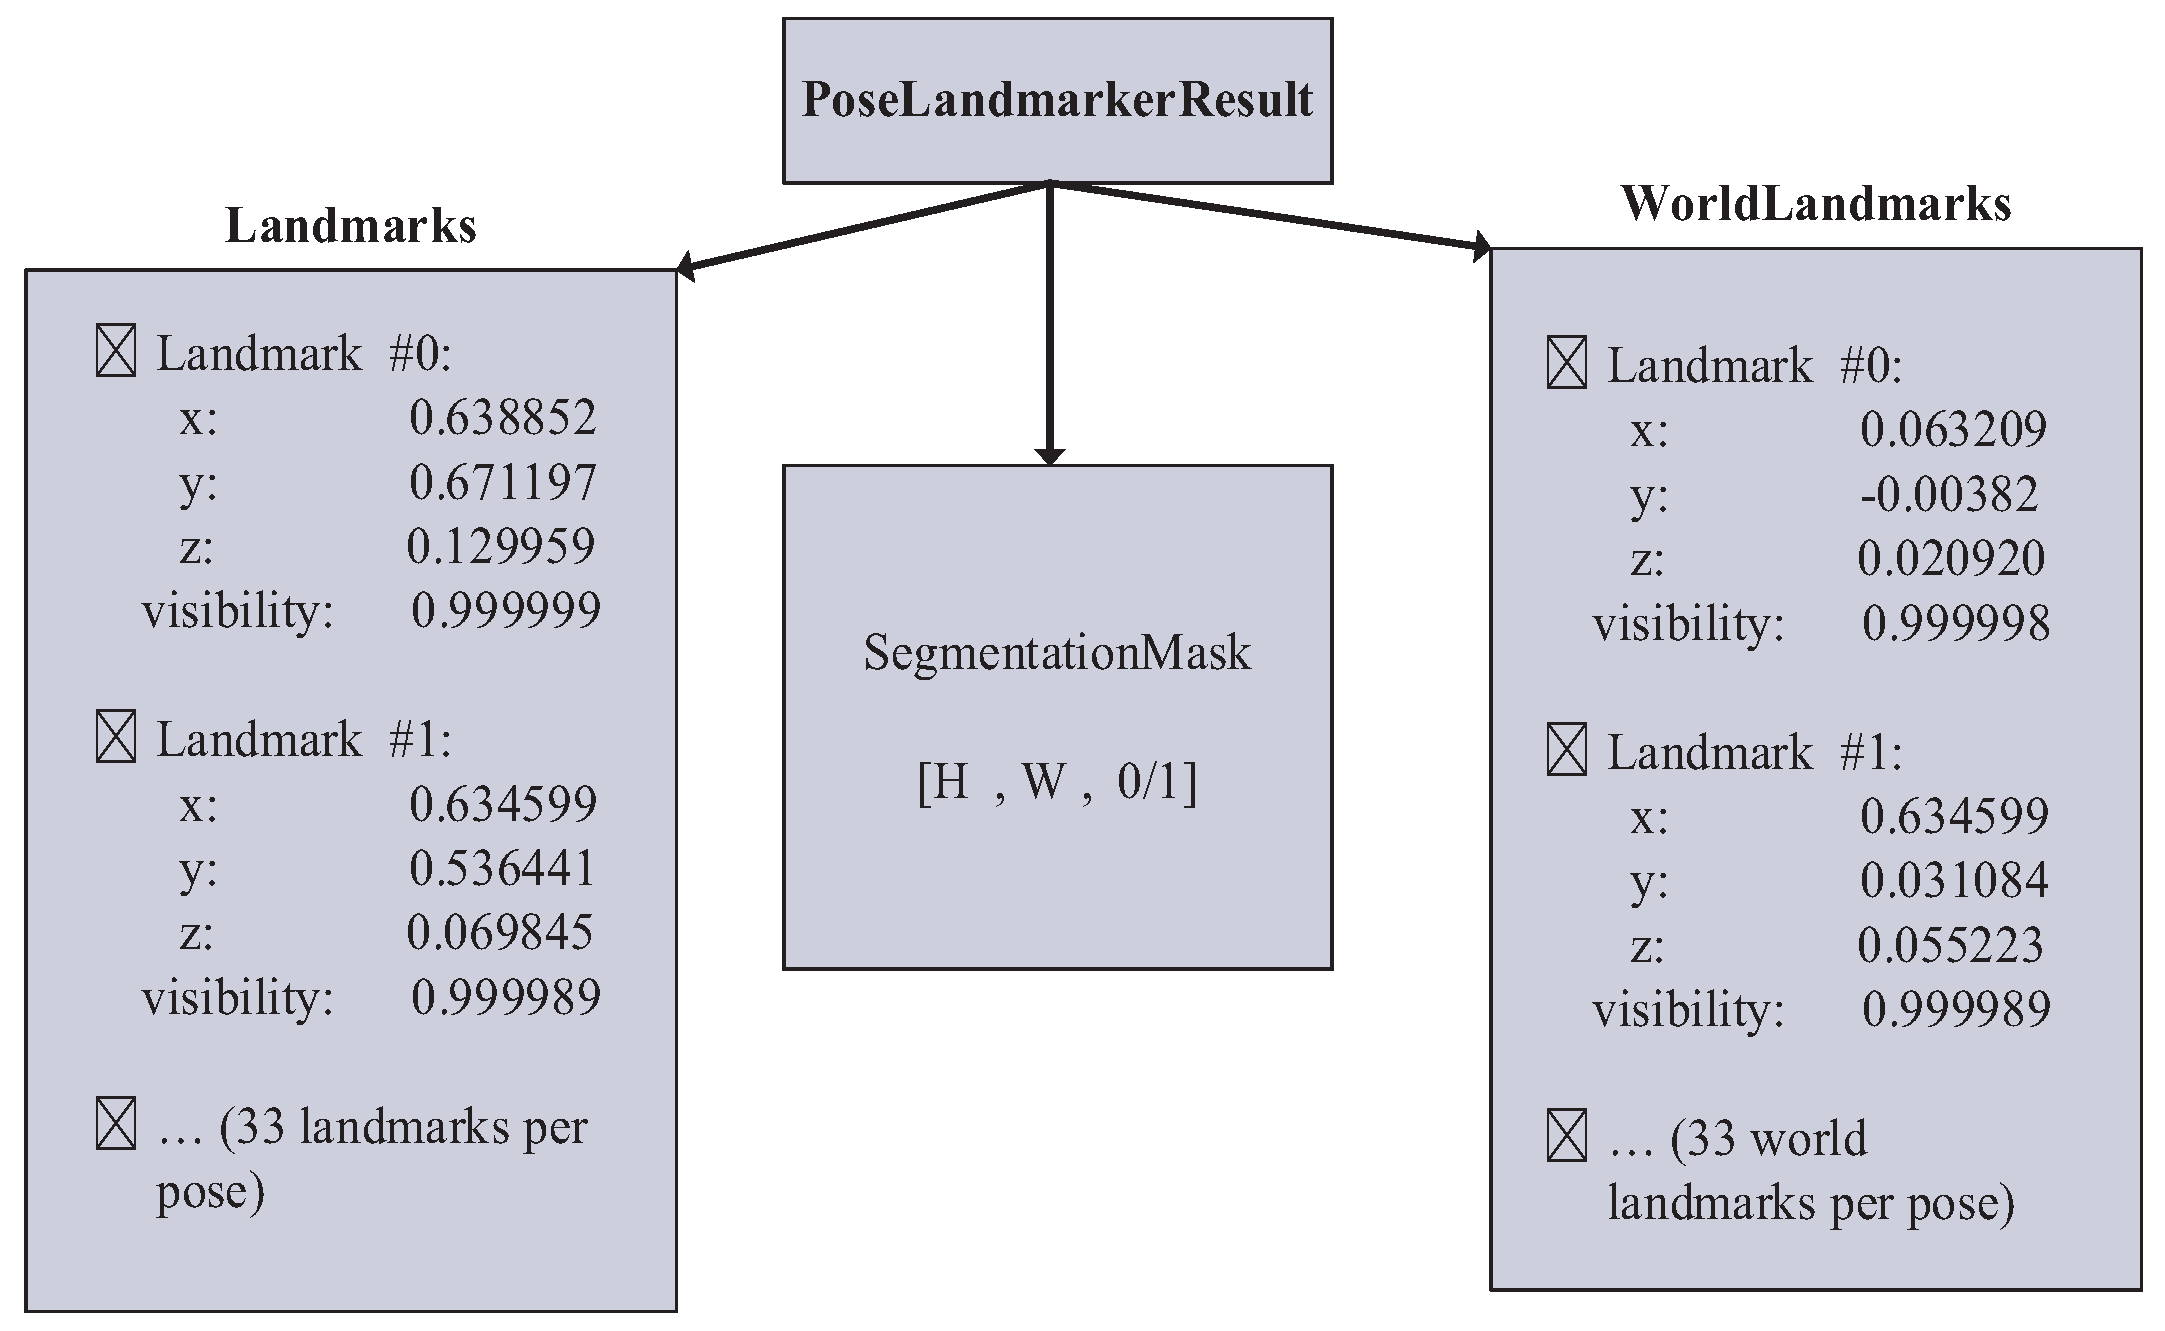
Figure 11.
Horizontal bar height measurement of pull-up. (a) Hand height across video frames during pull-ups. (b) Variance of hand height values within each sliding window.
Figure 11.
Horizontal bar height measurement of pull-up. (a) Hand height across video frames during pull-ups. (b) Variance of hand height values within each sliding window.
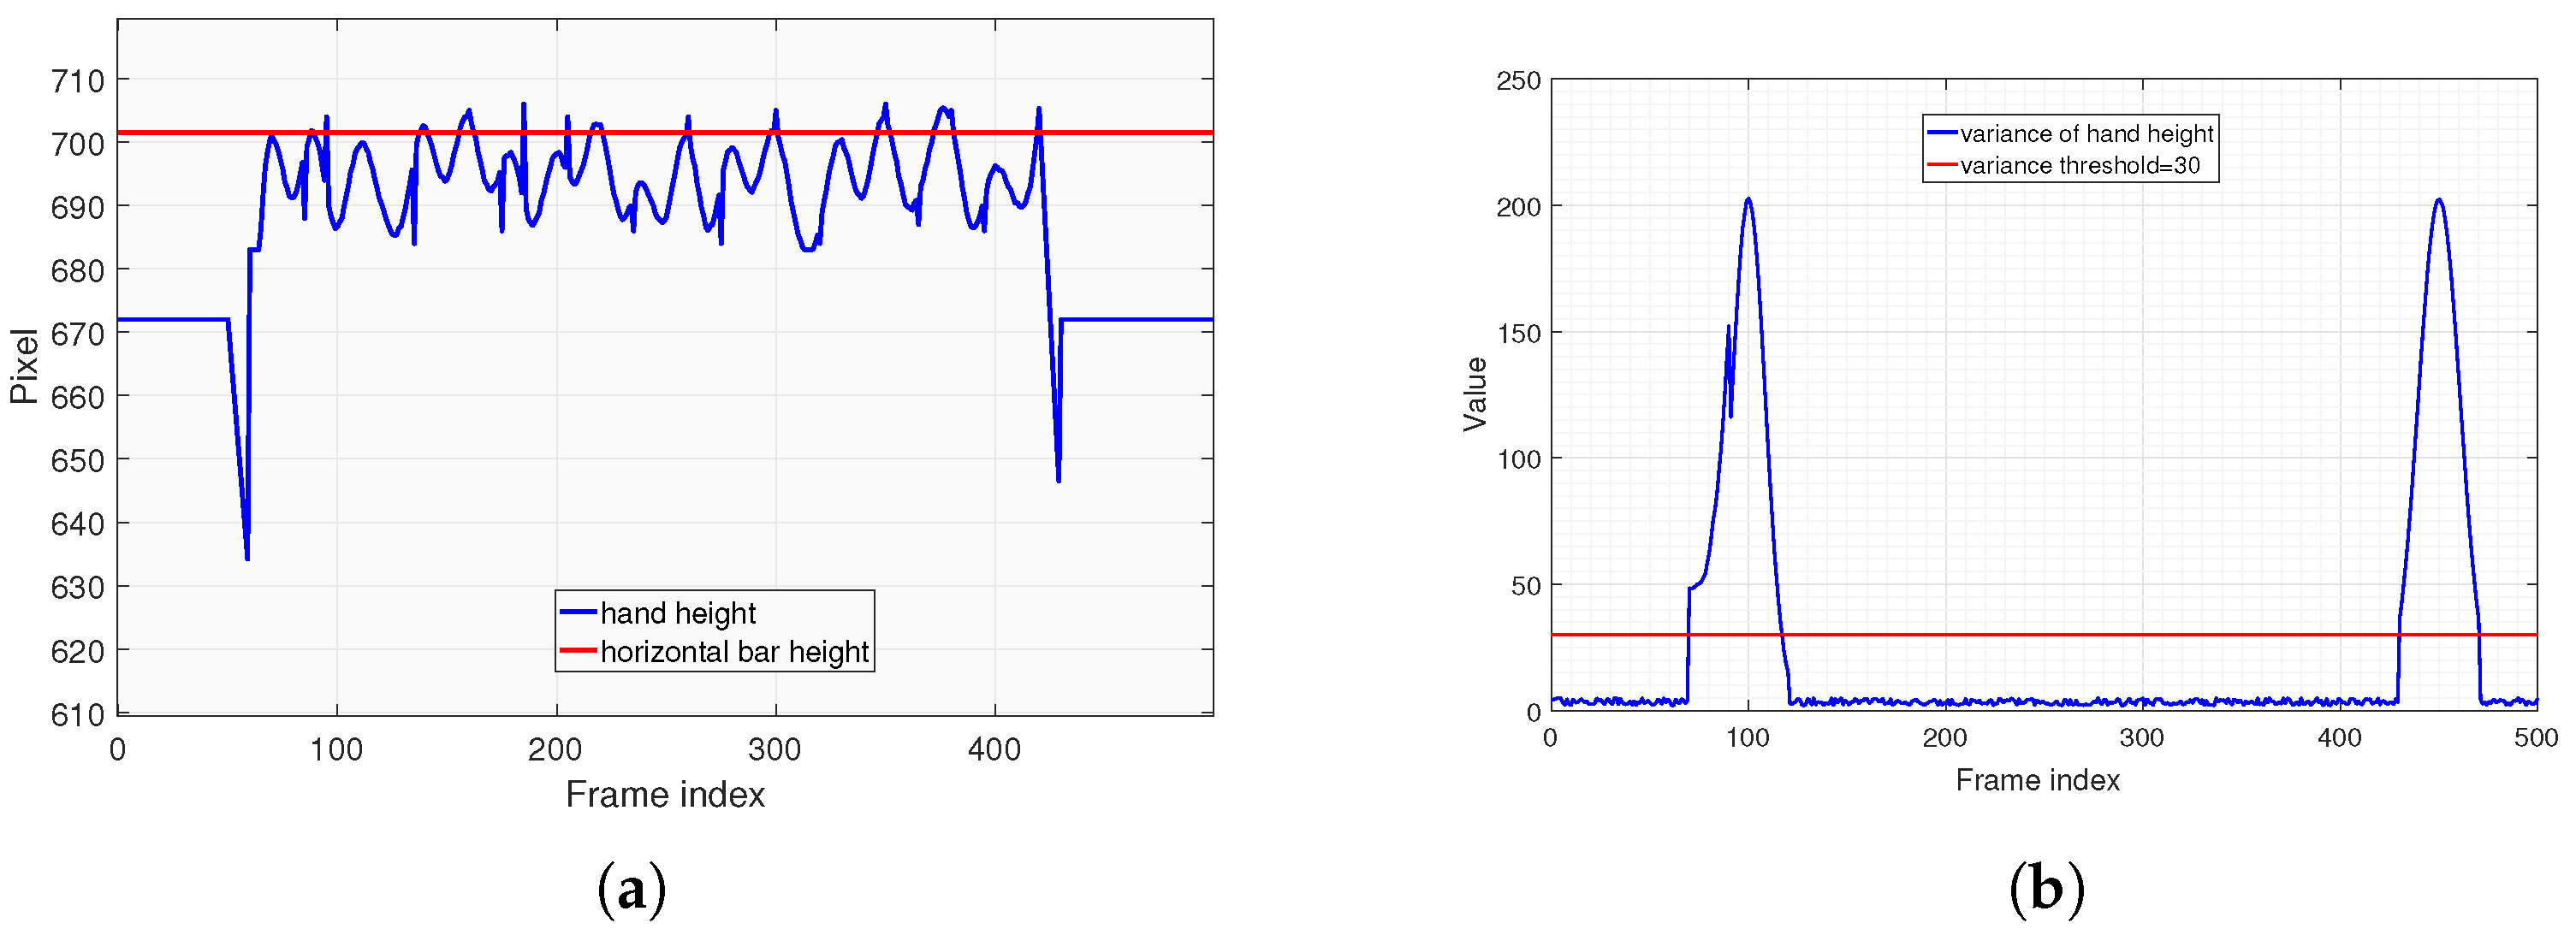
Figure 12.
Eye height threshold measurement of pull-up. (a) Elbow height across video frames during pull-ups. (b) Variance of elbow height values within each sliding window.
Figure 12.
Eye height threshold measurement of pull-up. (a) Elbow height across video frames during pull-ups. (b) Variance of elbow height values within each sliding window.
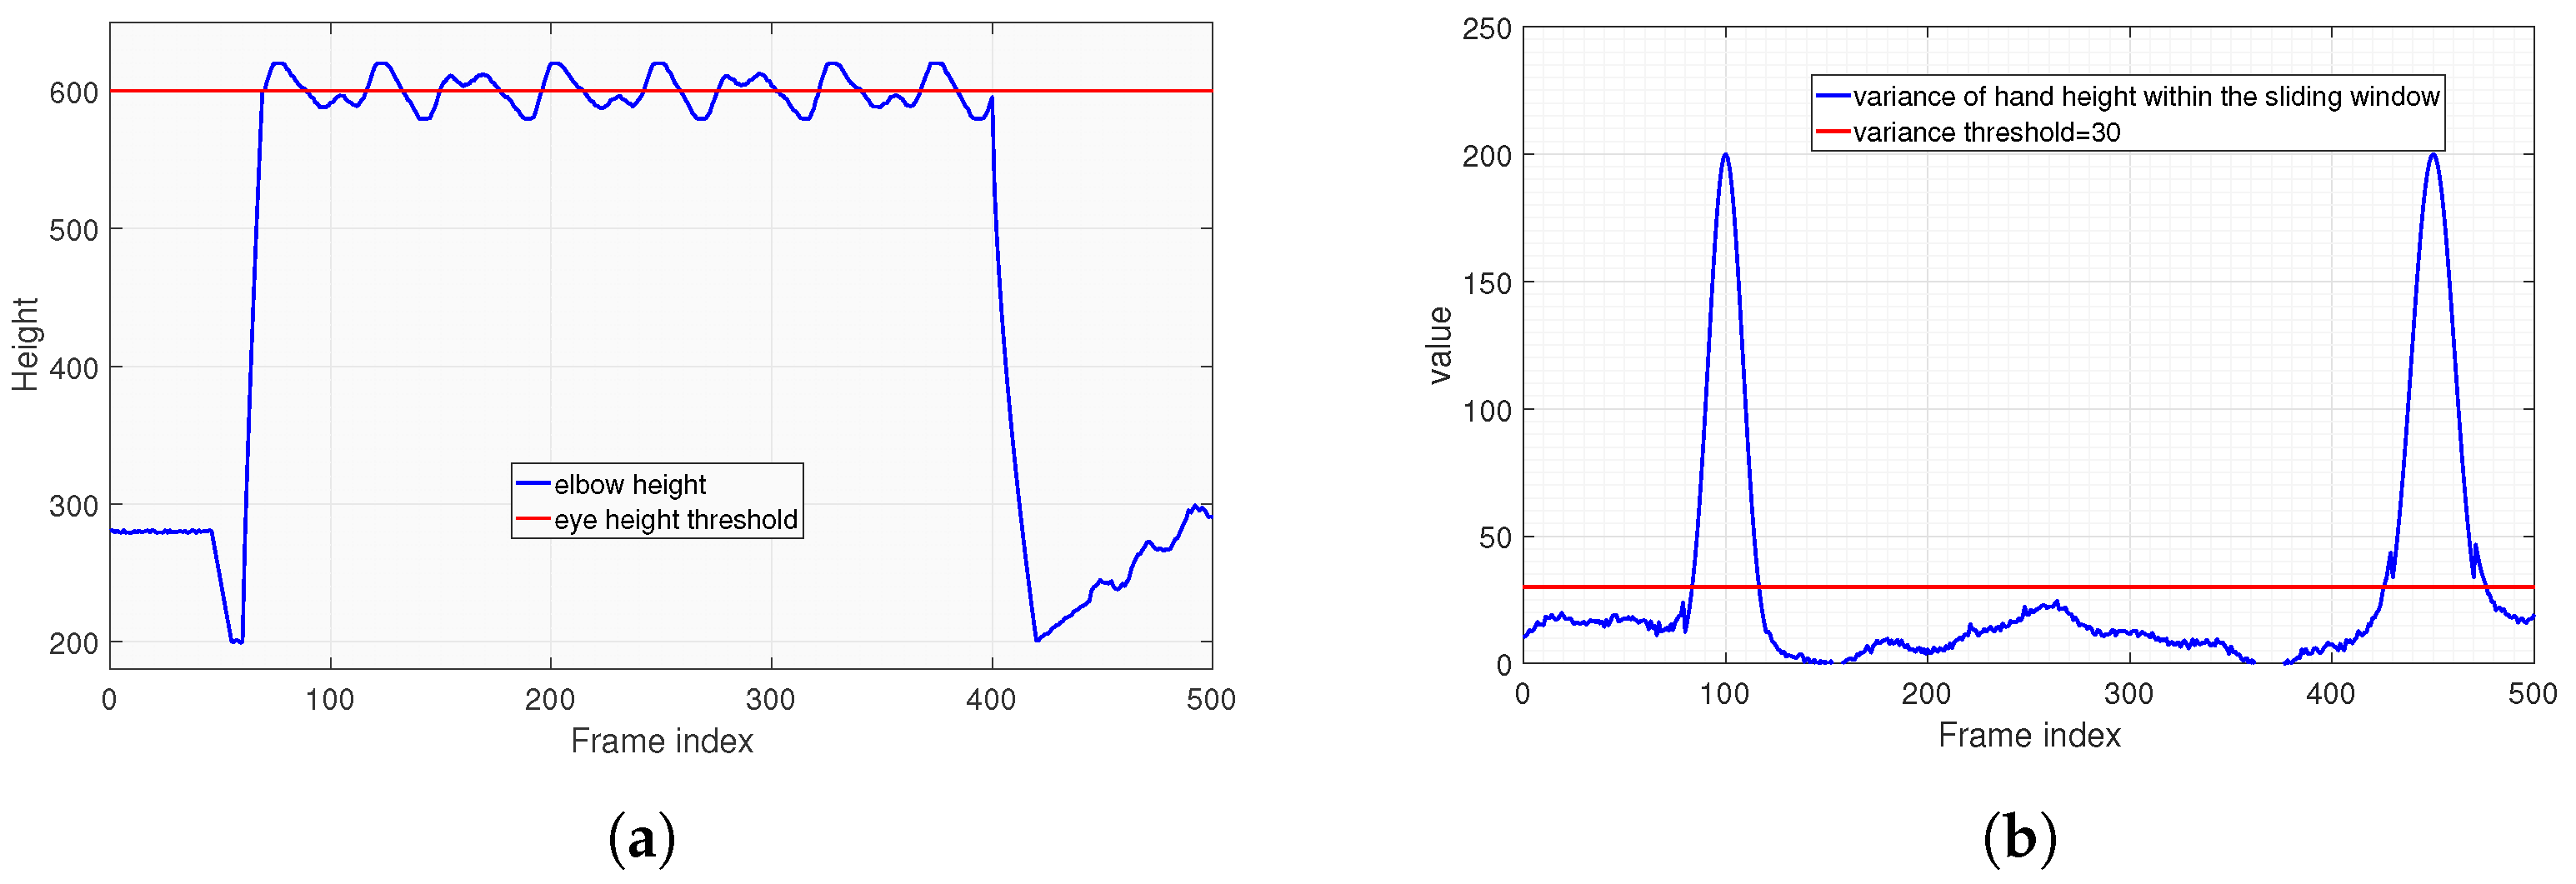
Figure 13.
Data results of applying the frame-sequence-based joint correction and smoothing algorithm. (a) Data results after the first-step correction. (b) Final data results after further smoothing.
Figure 13.
Data results of applying the frame-sequence-based joint correction and smoothing algorithm. (a) Data results after the first-step correction. (b) Final data results after further smoothing.

Figure 14.
Standard pull-up exercise recognition and assessment results.
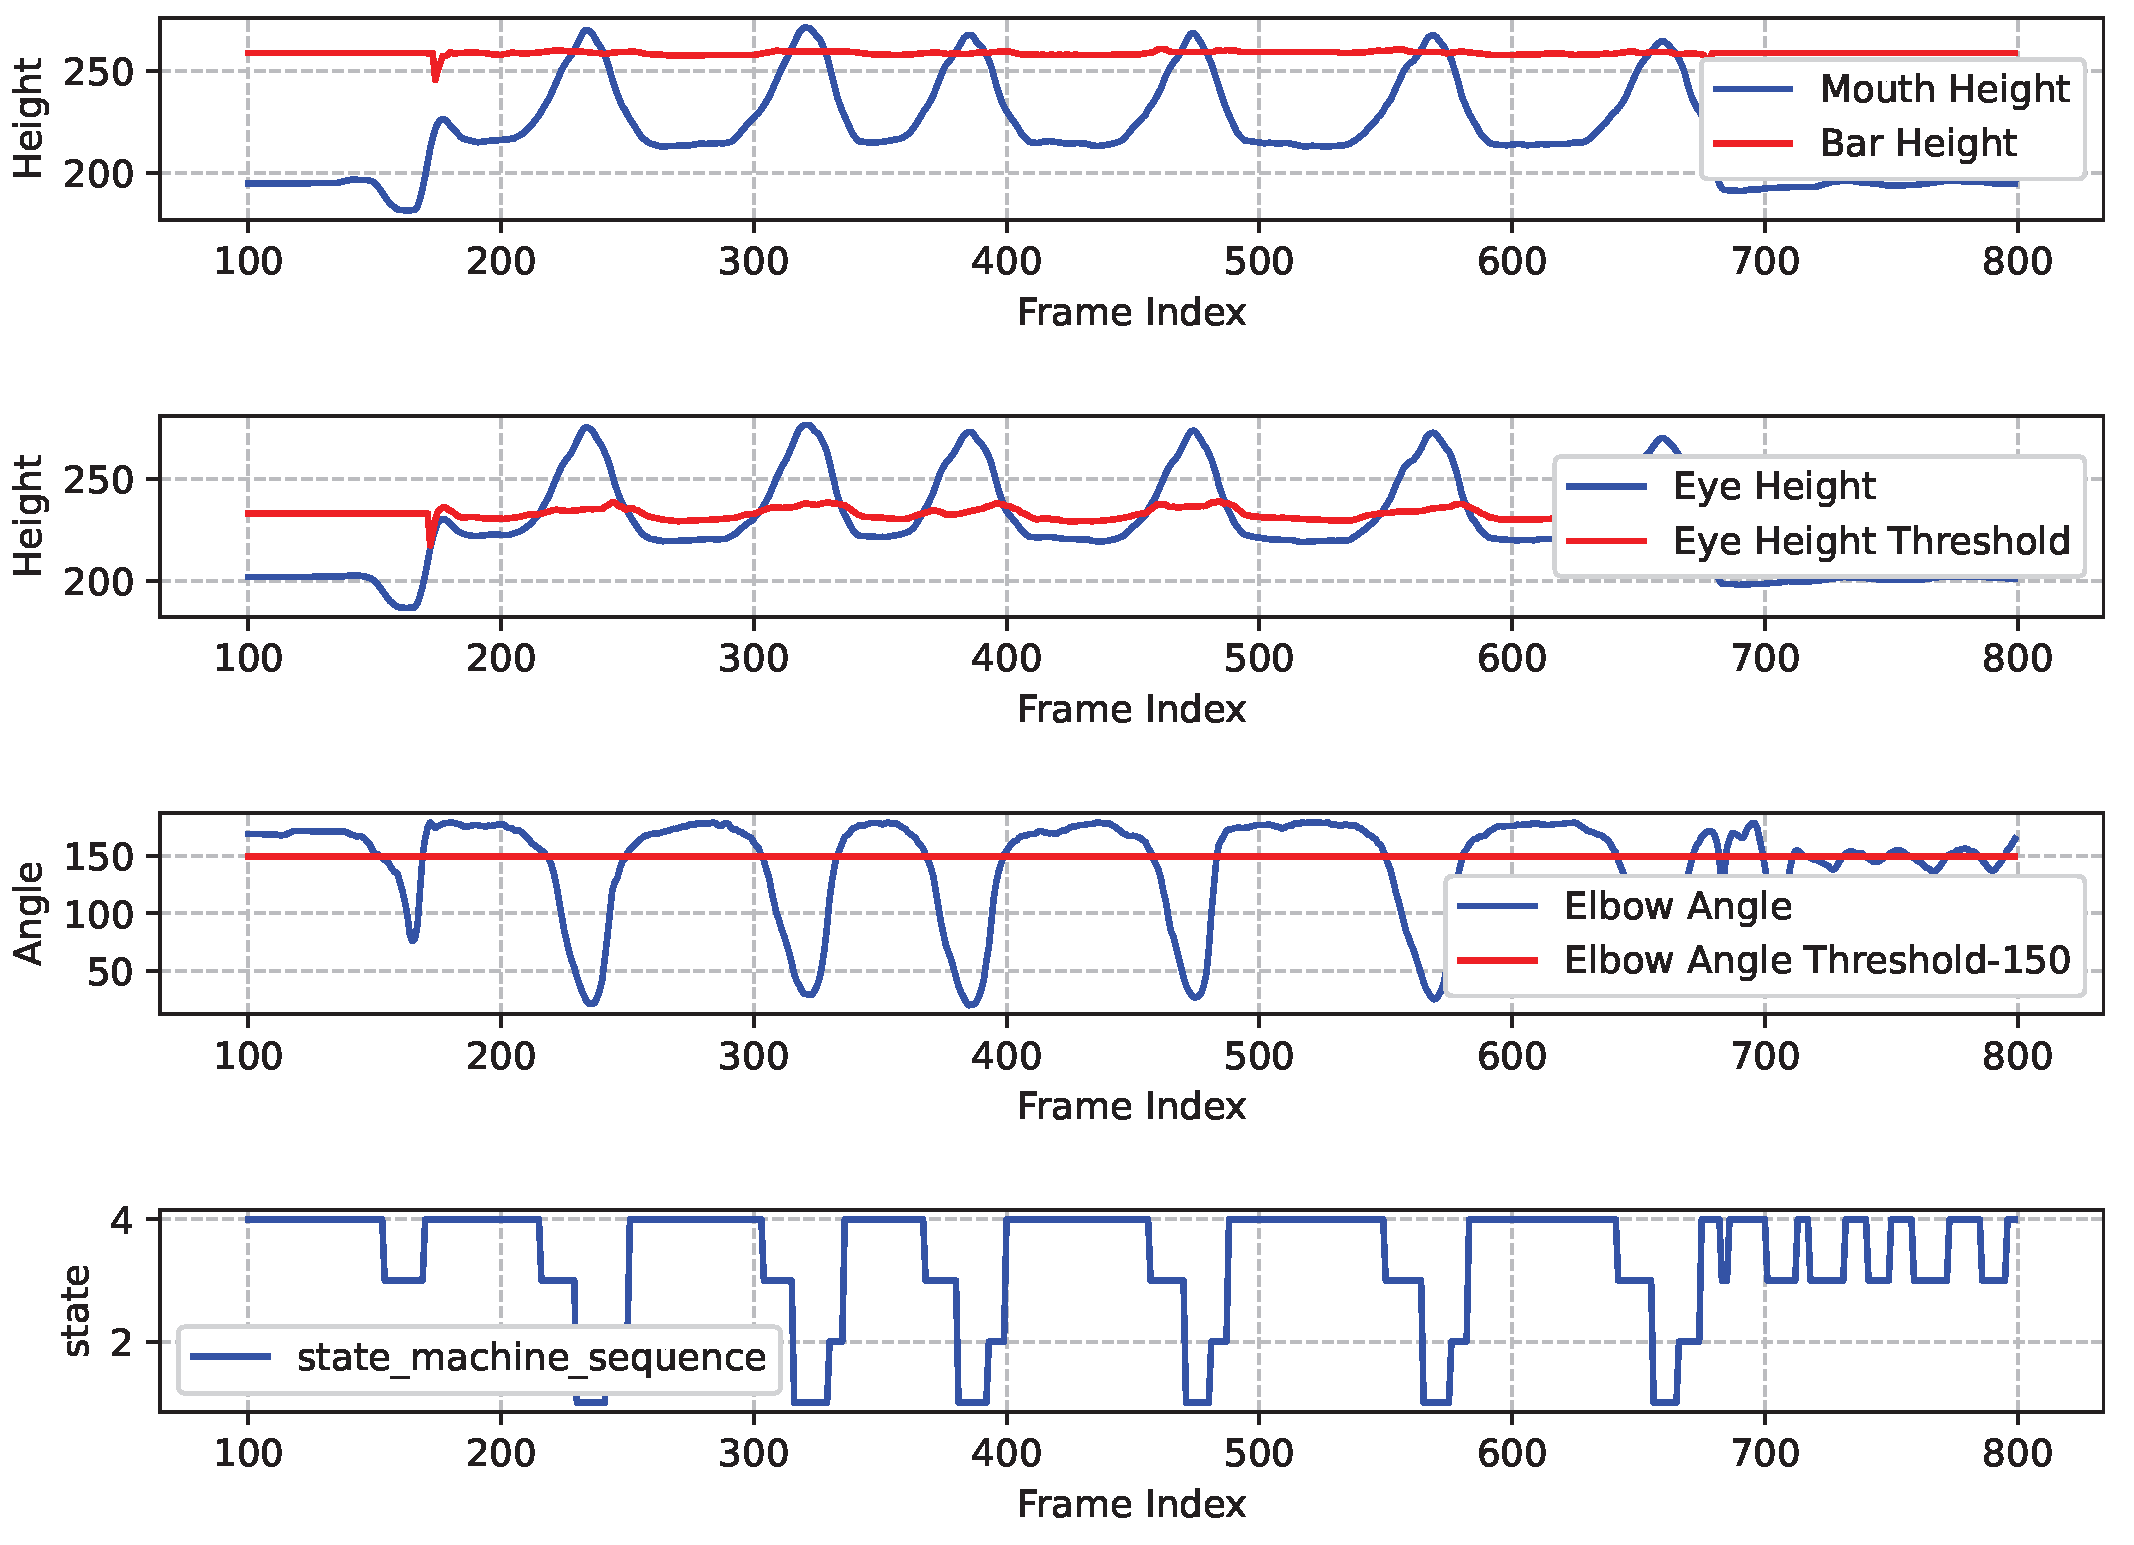
Figure 15.
Nonstandard pull-up exercise recognition and assessment results.
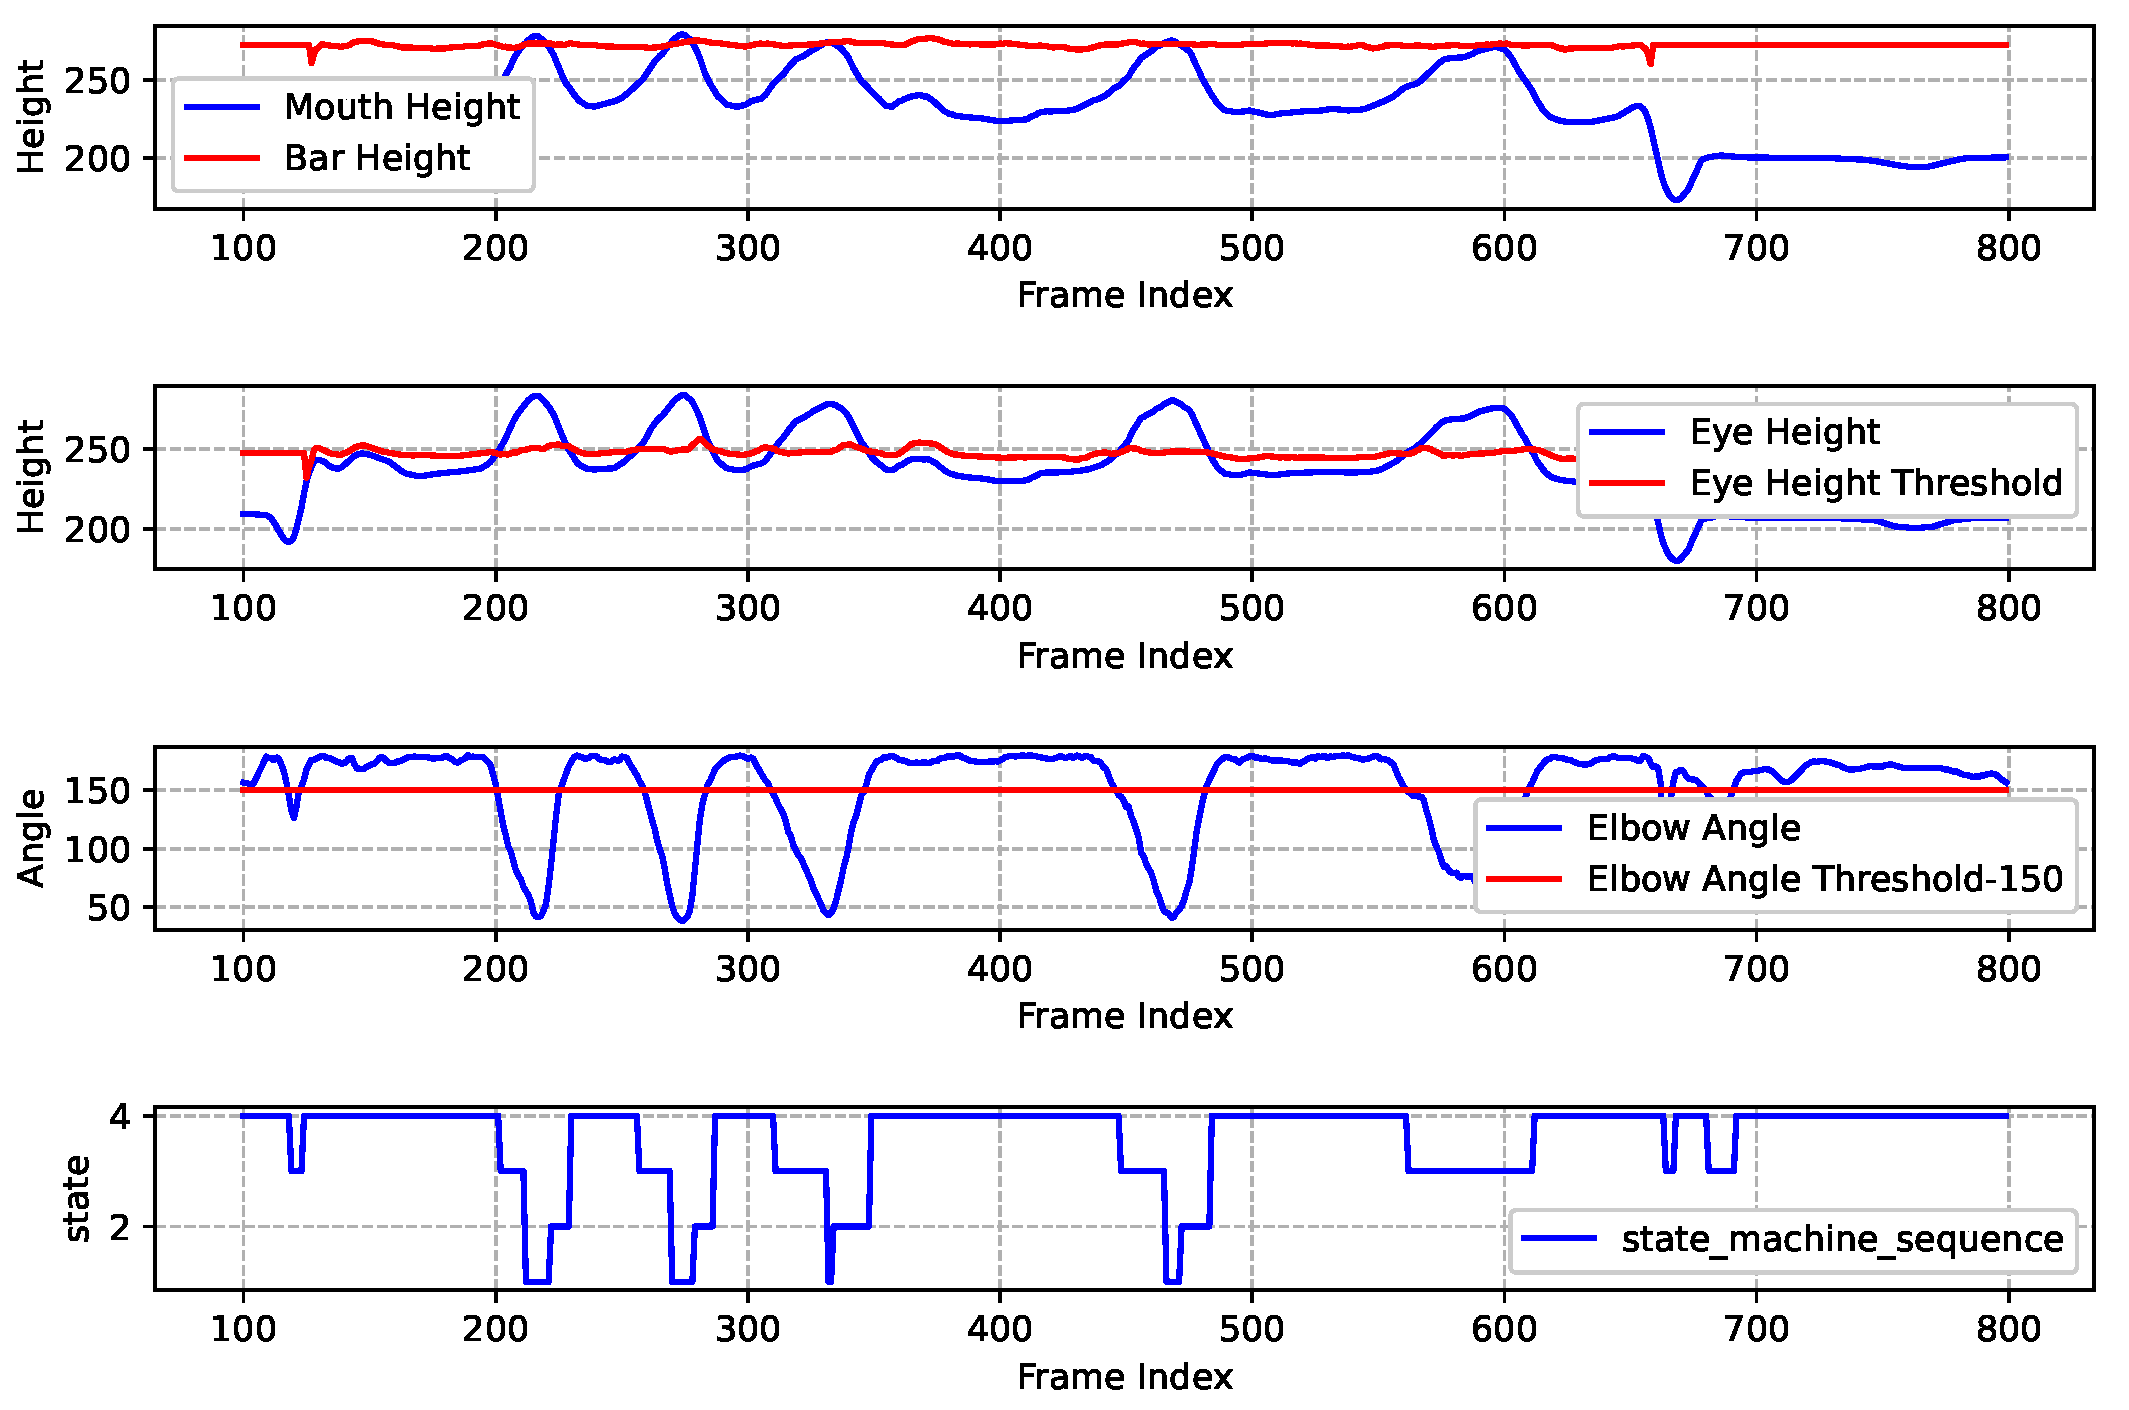
Figure 16.
Standard push-up exercise recognition and assessment results.
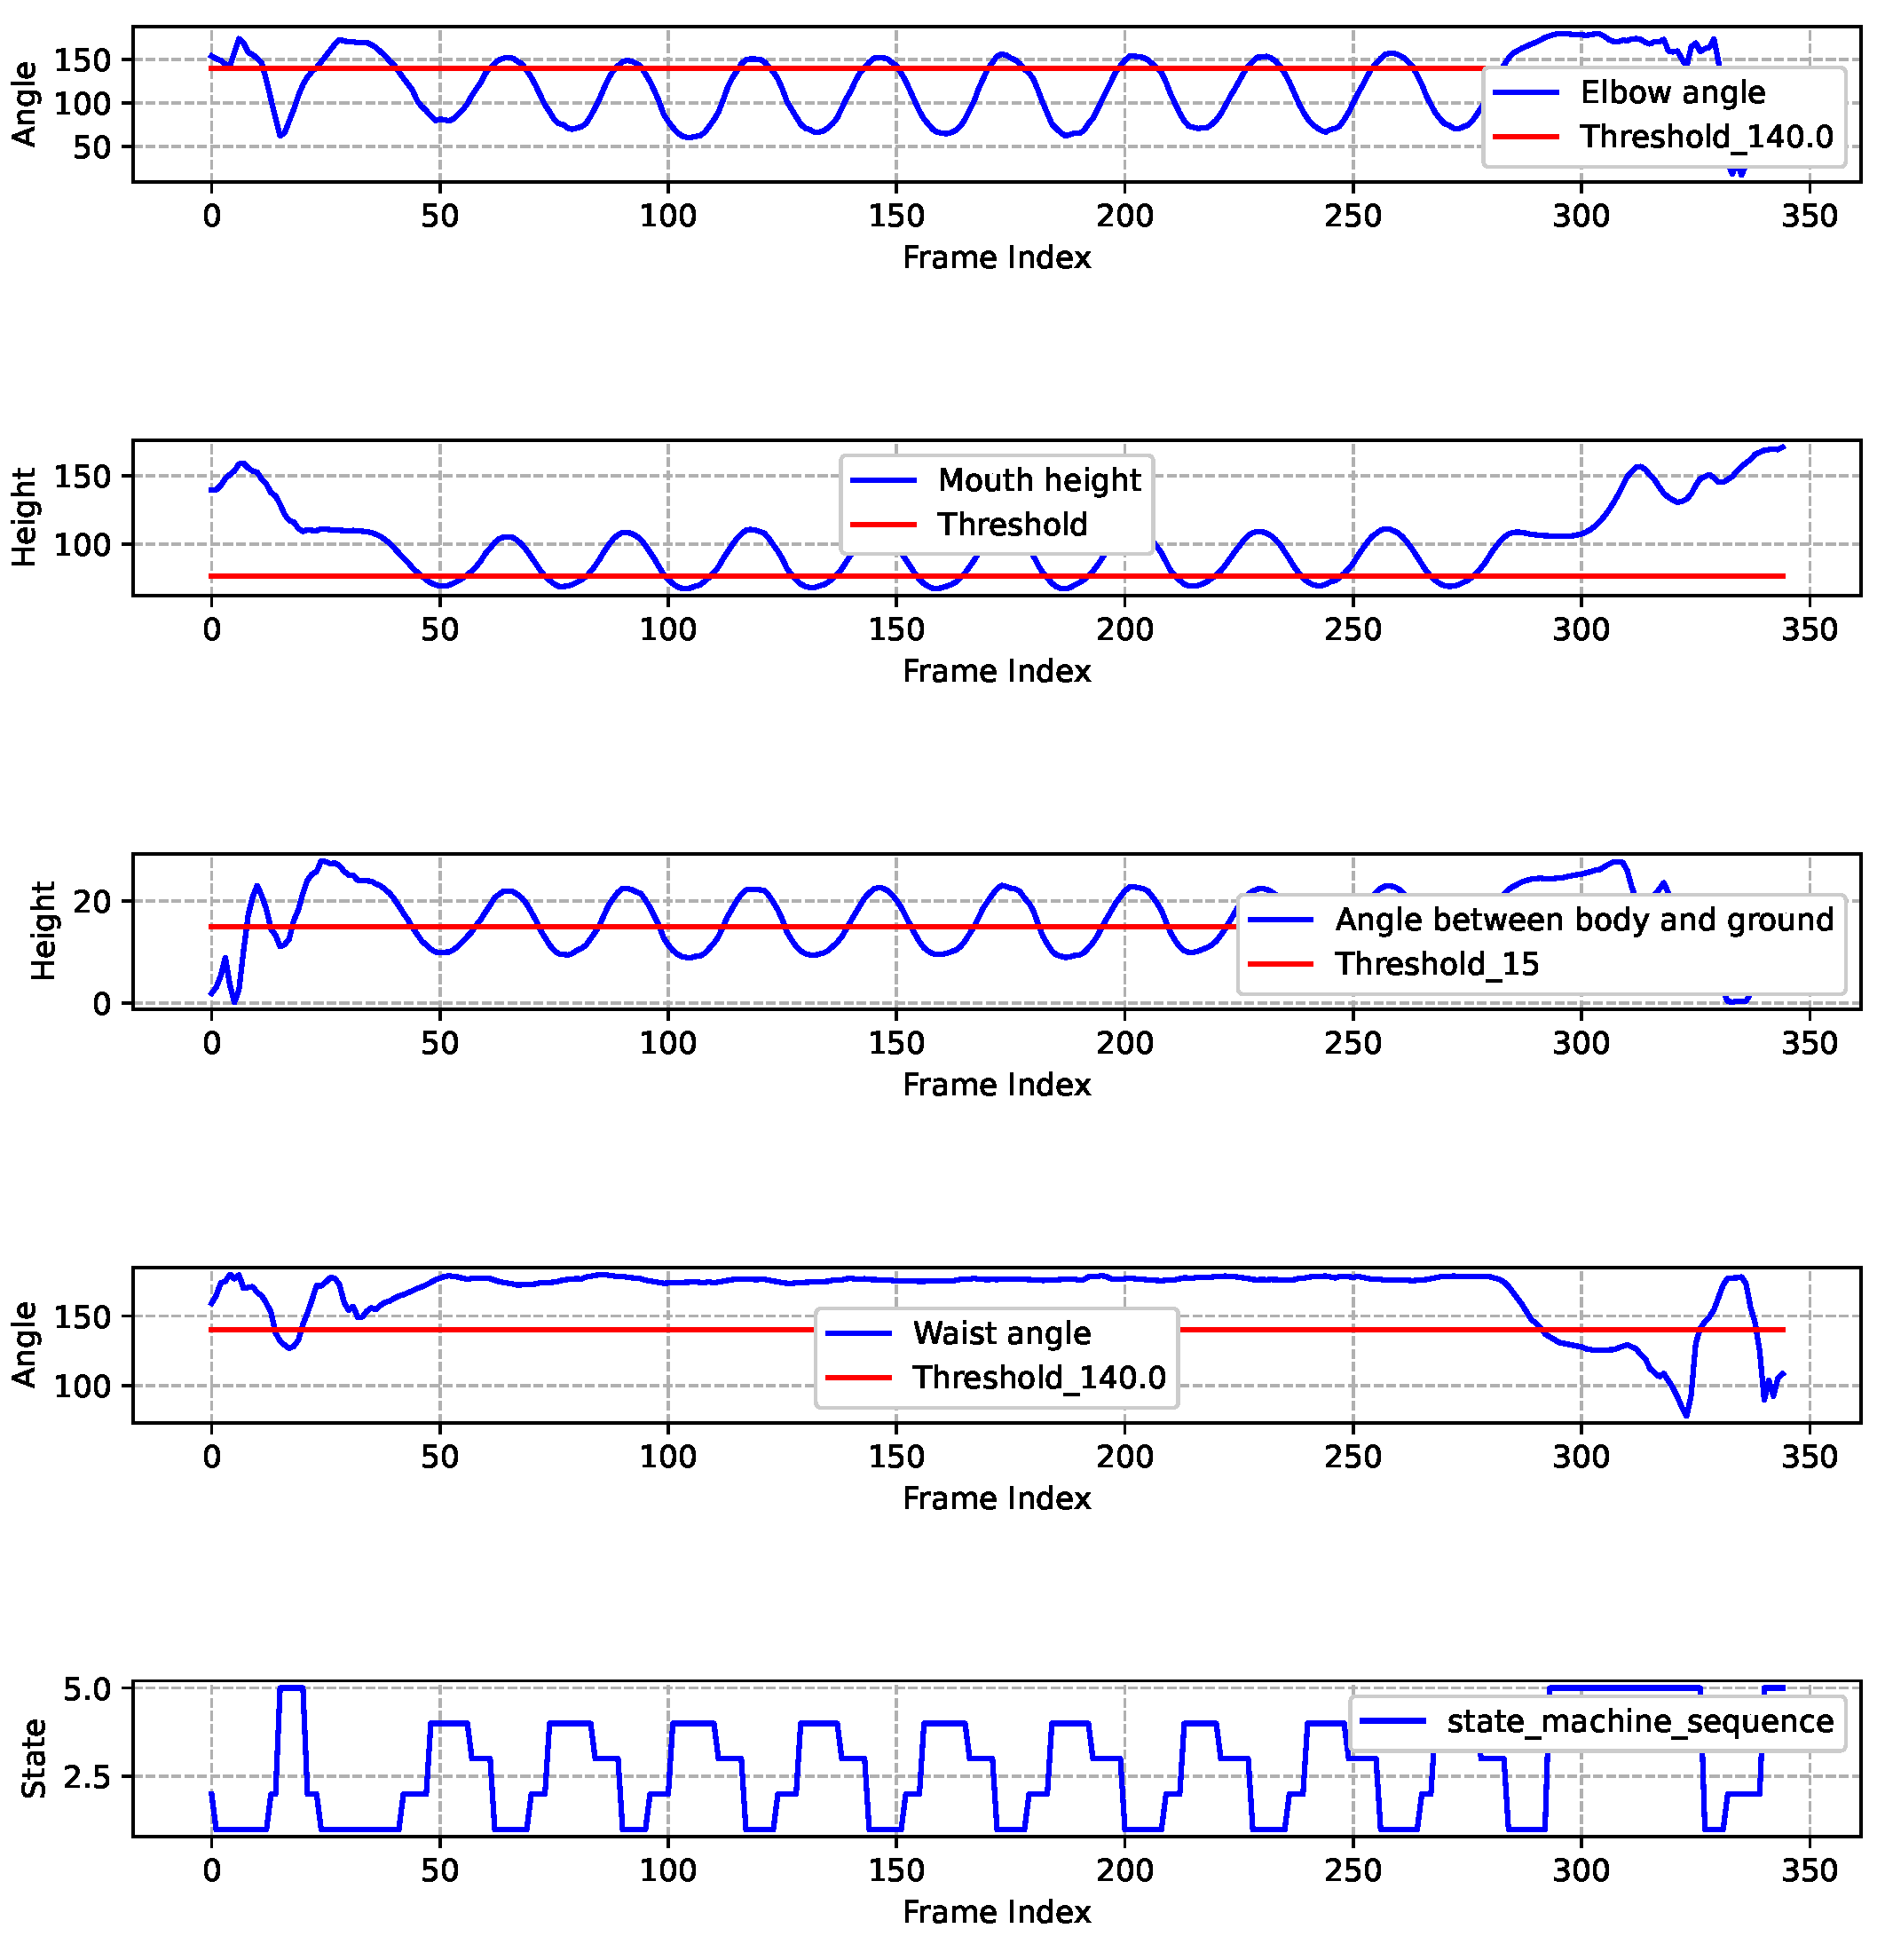
Figure 17.
Nonstandard push-up exercise recognition and assessment results.
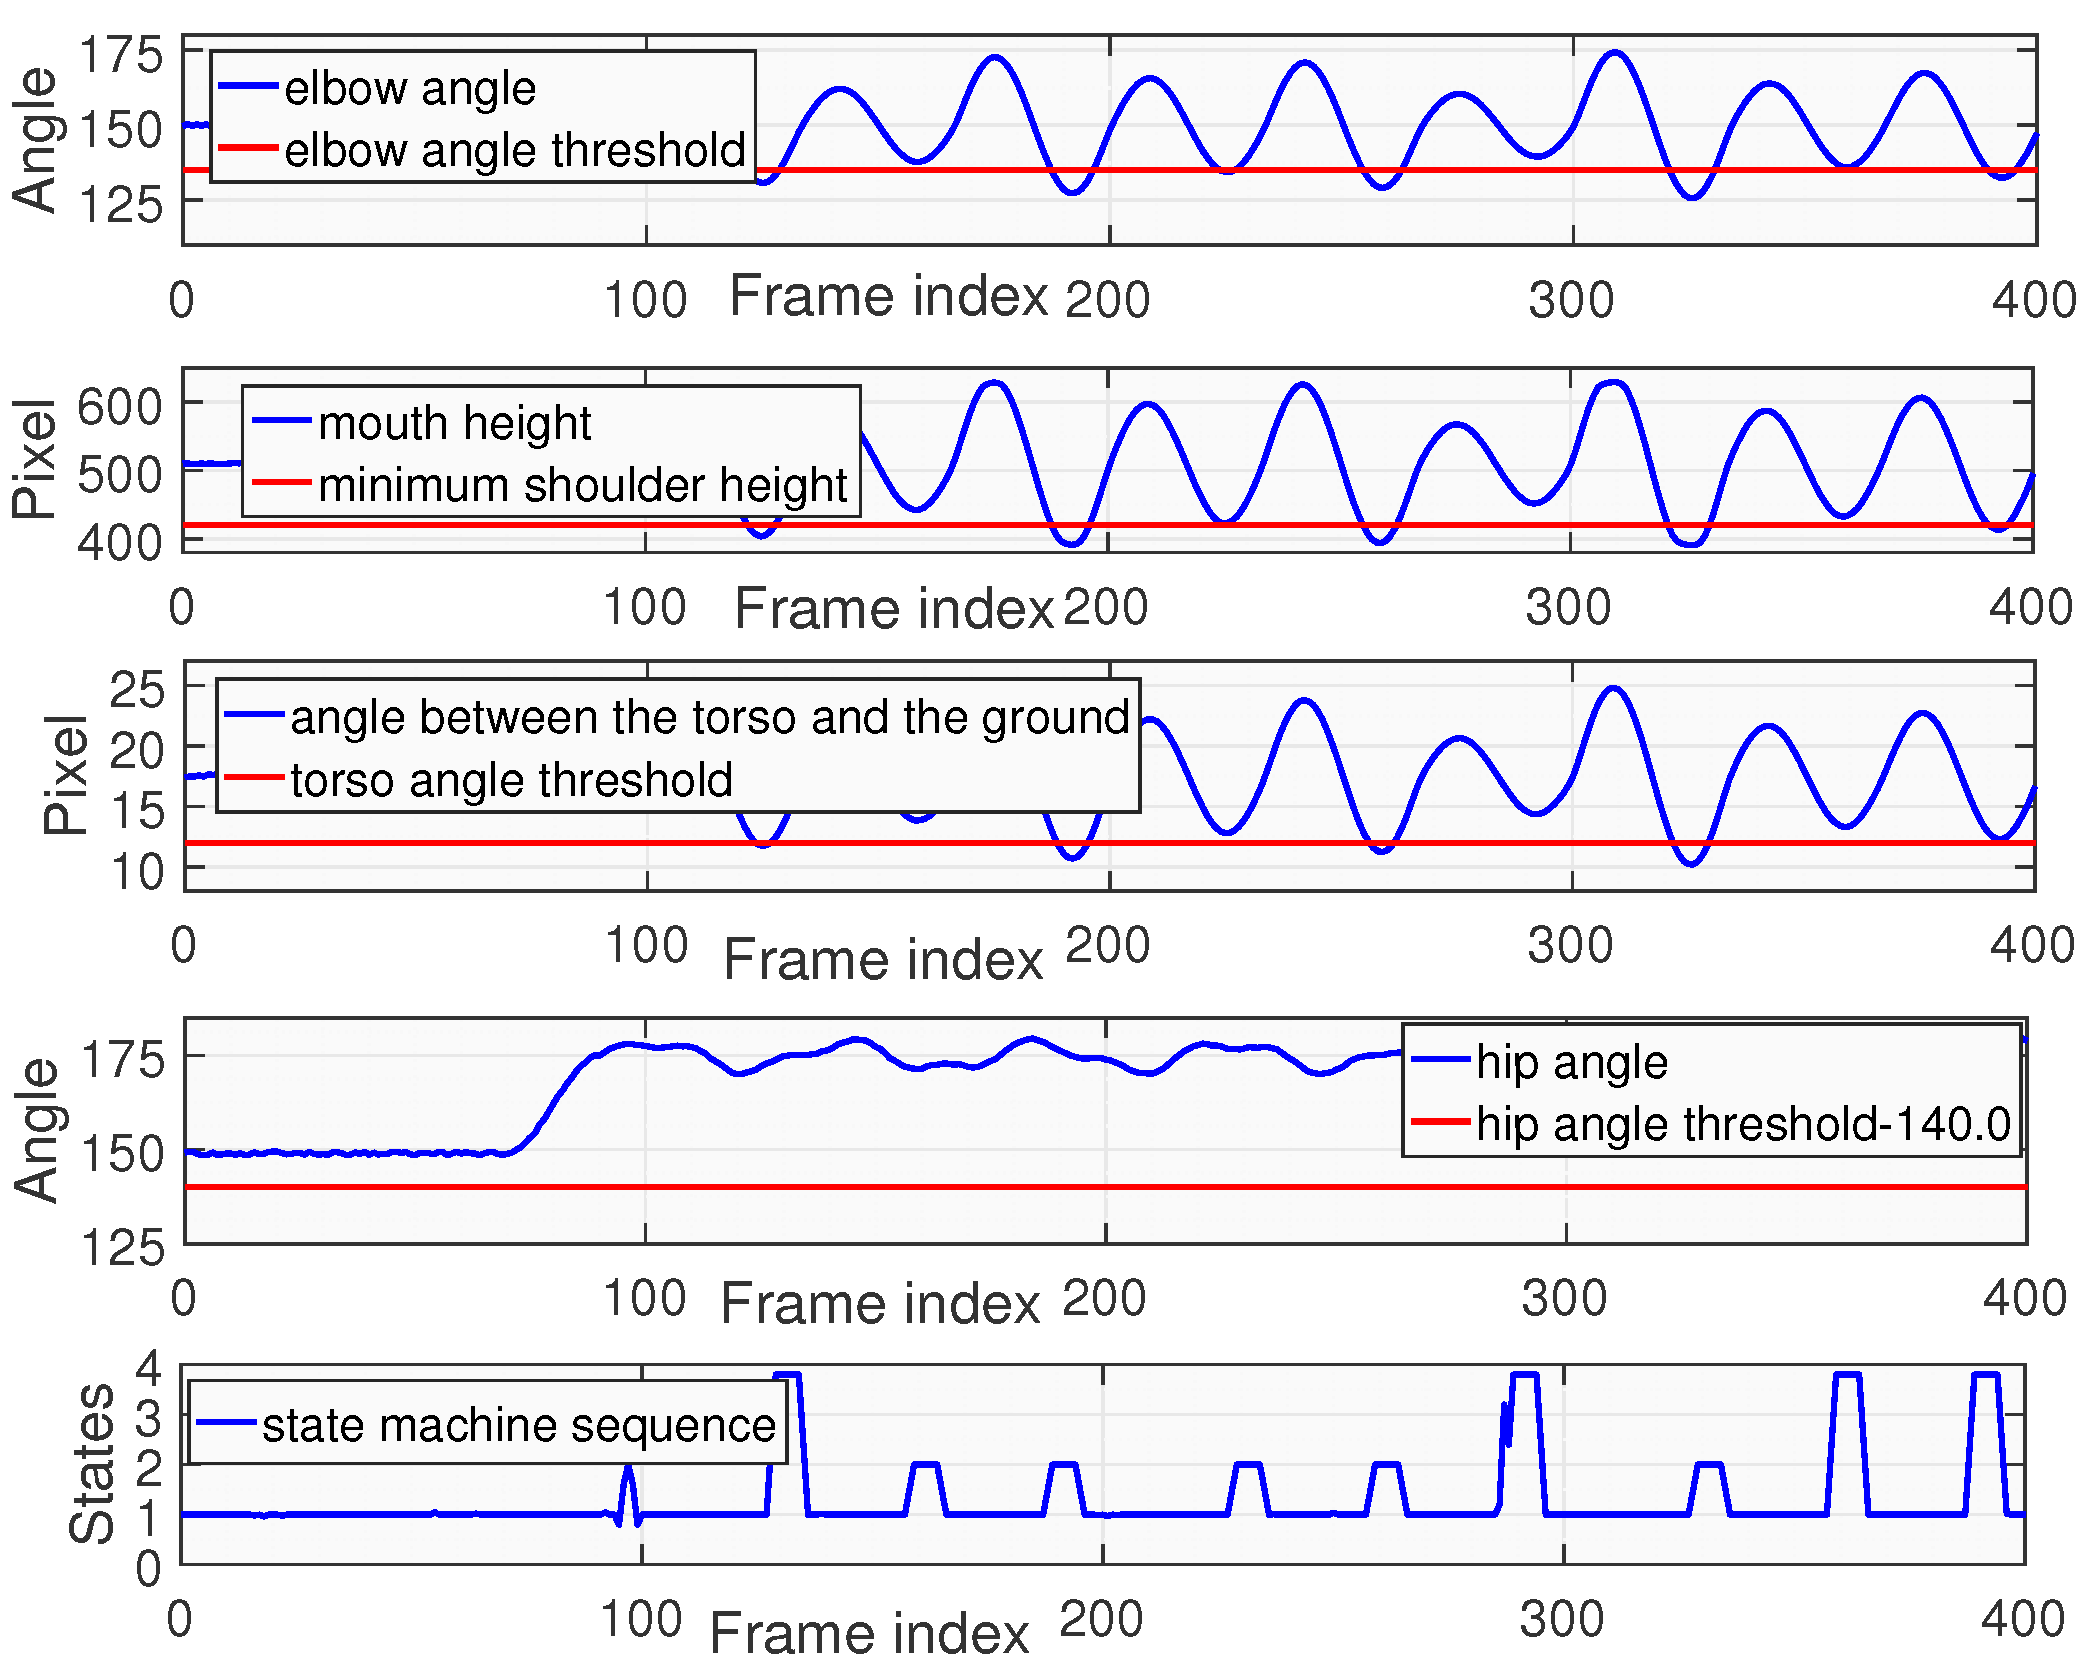
Table 1.
Camera Technical Specifications [20].
Table 1.
Camera Technical Specifications [20].
| Parameter | Description |
|---|---|
| Resolution | Maximum 6 megapixels ( Ultra HD). Main stream supports , ; Sub-stream supports , . |
| Wide Dynamic Range (WDR) | 120dB WDR for clear images in high-contrast lighting environments. |
| Lens Type | Multiple focal lengths available (2.8mm, 4mm, 6mm) for flexible installation. |
| Video Coding | Supports H.264, H.265, H.265+ compression formats to reduce bandwidth and storage requirements. |
| Frame Rate | 25FPS@. Triple-stream technology supports simultaneous output of main, sub, and tertiary streams. |
| Network Protocols | Supports RTSP and other real-time streaming protocols. |
| Interface | Standard RJ45 Gigabit Ethernet port for stable wired connection. |
Table 2.
List of Identification Processing Server Configurations [21].
Table 2.
List of Identification Processing Server Configurations [21].
| No. | Component Configuration |
|---|---|
| 1 | Phytium 2000+ Processor, Main Frequency 2.2GHz, Cores 64 Memory: DDR4 3200 32G×2, Supports 8 Memory Slots |
| 2 | Maximum Supports 38 Hot-Swappable Hard Drives 4TB 3.5×7.2K 6Gb SATA Drive×3 / 480G 2.5 SATA 6Gb R SSD×2 / Rear O2 Disk Drive |
| 3 | Supports 6 PCIe Expansion Slots, Board-Integrated Dual 120-Gigabit Electrical Ports Supports Wake-on-LAN, Network Redundancy, Load Balancing and Other Advanced Network Features |
| 4 | 1GB SAS 12GB 8 RAID Card Supports RAID 1, 5, 6, 10, 50, 60 |
| 5 | 1 R45 Management Interface, 1 VGA Interface, 6 USB Interfaces Integrates BMC Chip, Supports IPMI2.0, SOL, KVM Over IP, Virtual Media and Other Advanced Management Functions |
| 6 | 800W Power Socket×2 Infrared 150cm National Power Supply |
Table 3.
Frame-Sequence-Based Joint Correction and Smoothing Algorithm.
| Algorithm: Frame-Sequence-Based Joint Correction and Smoothing Algorithm |
|---|
| Input: Original keypoint frame sequence K (dimension: (number of frames, keypoint data), where keypoint data includes ), correction threshold T, smoothing window size W |
| Output: Corrected and smoothed keypoint frame sequence |
| Initialization: Set correction threshold T; Set smoothing window size W |
| Steps: |
| 1. For : |
| Compare the dimensions of keypoint data between current frame i and previous frame . If the difference exceeds T, correct i’s keypoint position to align with . |
| 2. For (denoted as ): |
| For of frame i in , compute the average within a window of size W centered at i, and replace the original coordinates. |
Table 4.
Pull-up State Machine Judgment Function.
| Algorithm: Pull-up State Machine Judgment Function |
|---|
| Input: Mouth height, Horizontal bar height , Elbow height, Eye height, Angle of the human elbow, Elbow angle threshold |
| Output: Posture |
| Steps: |
| 1. if Mouth height> : |
| Posture="up" |
| 2. elseif Eye height<Elbow height & Angle of the human elbow>Elbow angle threshold: |
| Posture="down" |
| 3. elseif |
| Posture="null" |
Table 5.
Pull-up Assessment Algorithm State Transition Table.
| up | down | null | |
| State1 | State1/0 | State2/0 | State2/0 |
| State2 | State1/0 | State4/0 | State2/0 |
| State3 | State1/1 | State4/0 | State3/0 |
| State4 | State1/1 | State4/0 | State3/0 |
Table 6.
Definition of Key Terms for Push-up Assessment.
| Noun | Specific Definition |
|---|---|
| Joint Angles | |
| Torso Ang. | Angle of shoulder → foot → hand joints (2D XOY coordinate system). |
| Hip Ang. | Angle of foot → hip → shoulder joints. |
| Elbow Ang. | Angle of shoulder → elbow → hand joints. |
| Height Params | |
| Mouth Height | Y between max y-axis in frame and mouth’s y-coordinate. |
| Thresholds | |
| Mouth Down Thresh. | Minimum height of shoulders during the project process. |
| Elbow Exten. Thresh. | Min angle required at push-up’s highest position. |
| Body Exten. Thresh. | Min angle to maintain during the push-up motion. |
| Torso Ang. Thresh. | Max torso-ground angle allowed in push-up’s low-position state. |
Table 7.
Push-up State Machine Judgment Function.
| Algorithm: Push-up State Machine Judgment Function |
|---|
| Input: Elbow Ang., Mouth Height, Hip Ang., Torso Ang., Elbow Exten. Thresh., Mouth Down Thresh., Body Exten. Thresh., Torso Ang. Thresh., |
| Output: Posture |
| Steps: |
| 1. if Hip Ang.< Body Exten. Thresh.: |
| Posture="error" |
| return "error" |
| 2. if Elbow Ang. > Elbow Exten. Thresh. : |
| Posture="up" |
| 3. elseif Mouth Height < Mouth Down Thresh. & Torso Ang. < Torso Ang. Thresh.: |
| Posture="down" |
| 4. elseif |
| Posture="null" |
Table 8.
Push-up Assessment Algorithm State Transition Table.
| up | down | error | null | |
| State1 | State1/0 | State4/0 | State5/0 | State2/0 |
| State2 | State1/0 | State4/0 | State5/0 | State2/0 |
| State3 | State1/1 | State4/0 | State5/0 | State3/0 |
| State4 | State1/1 | State4/0 | State5/0 | State3/0 |
| State5 | State1/0 | State4/0 | State5/0 | State2/0 |
Table 9.
Pose Landmarker Parameter Configuration Sheet
| Option Name | Description | Parameter Value Range |
|---|---|---|
| running_mode | IMAGE: For single image input mode. VIDEO: For video parsing mode. LIVE_STREAM: For real-time mode with input video stream (e.g., from a camera). | {IMAGE, VIDEO, LIVE_STREAM} |
| min_pose | ||
| _detection_confidence | The minimum confidence value for successful pose detection. | Float [0.0, 1.0] |
| min_tracking_confidence | The minimum confidence value for successful pose tracking. | Float [0.0, 1.0] |
| output_segmentation_masks | Modify the returned pose segmentation masks. | Boolean |
| result_callback | Pose result callback, for receiving and processing results in real-time when the user selects the real-time stream mode. | ResultListener |
Table 10.
Pull-up Assessment Algorithm Accuracy Statistics.
| Tester | Actual Repetitions/Rep | Detected Repetitions/Rep | Algorithm Counting Accuracy Rate /% |
|---|---|---|---|
| Ordinary Student | 18 | 16 | 88.9 |
| Teacher | 22 | 21 | 95.5 |
| PE Student 1 | 30 | 29 | 96.7 |
| PE Student 2 | 35 | 34 | 97.1 |
| Soldier | 40 | 50 | 100 |
| Summary | 145 | 140 | 96.6 |
Disclaimer/Publisher’s Note: The statements, opinions and data contained in all publications are solely those of the individual author(s) and contributor(s) and not of MDPI and/or the editor(s). MDPI and/or the editor(s) disclaim responsibility for any injury to people or property resulting from any ideas, methods, instructions or products referred to in the content. |
© 2025 by the authors. Licensee MDPI, Basel, Switzerland. This article is an open access article distributed under the terms and conditions of the Creative Commons Attribution (CC BY) license (http://creativecommons.org/licenses/by/4.0/).
Copyright: This open access article is published under a Creative Commons CC BY 4.0 license, which permit the free download, distribution, and reuse, provided that the author and preprint are cited in any reuse.


