Submitted:
10 September 2025
Posted:
12 September 2025
You are already at the latest version
Abstract
Background/Objectives: Music engages multiple brain networks simultaneously, yet most studies examine these networks in isolation. Methods: We investigated functional connectivity among auditory, motor, and reward networks during music listening in different contexts using fMRI data from two samples (N=39 each): focused music listening and background music during cognitive tasks. ROI-to-ROI, seed-based, and graph theory analyses examined connectivity patterns among 46 regions spanning the three networks. Results: Both contexts showed enhanced within-auditory network connectivity compared to rest, suggesting this is fundamental to music processing. However, between-network patterns diverged markedly. Background music during cognitive tasks preserved reward-motor coupling while reducing auditory-motor and auditory-reward connectivity. Focused music listening produced widespread negative correlations between motor regions and both auditory and reward networks, potentially reflecting motor suppression in the scanner environment. Graph theory measures revealed context-specific hub reorganization: reward regions (nucleus accumbens, caudate) showed increased centrality during background music, while amygdala and frontal orbital cortex were selectively enhanced during focused listening. Conclusions: These findings demonstrate that music engagement involves context-dependent network reorganization beyond simple attention effects. The same musical stimulus engages different neural mechanisms depending on concurrent cognitive demands, motor requirements, and listening goals. Enhanced within-auditory connectivity appears consistent across contexts, but between-network interactions are shaped by the broader cognitive-behavioral context. These results highlight the importance of considering ecological context when studying music processing and designing music-based interventions, as network connectivity patterns during music listening reflect complex interactions between task demands, attentional resources, and musical engagement rather than music processing alone.
Keywords:
1. Introduction
2. Materials and Methods
2.1. Participants
2.2. Procedures
Study 1: Foreground Music Group
Study 2: Background Music Group
2.3. fMRI Data Acquisition and Analysis
2.4. ROI-to-ROI Analyses
2.5. Seed-Based Connectivity Analyses
2.6. Graph Theory Analyses
3. Results
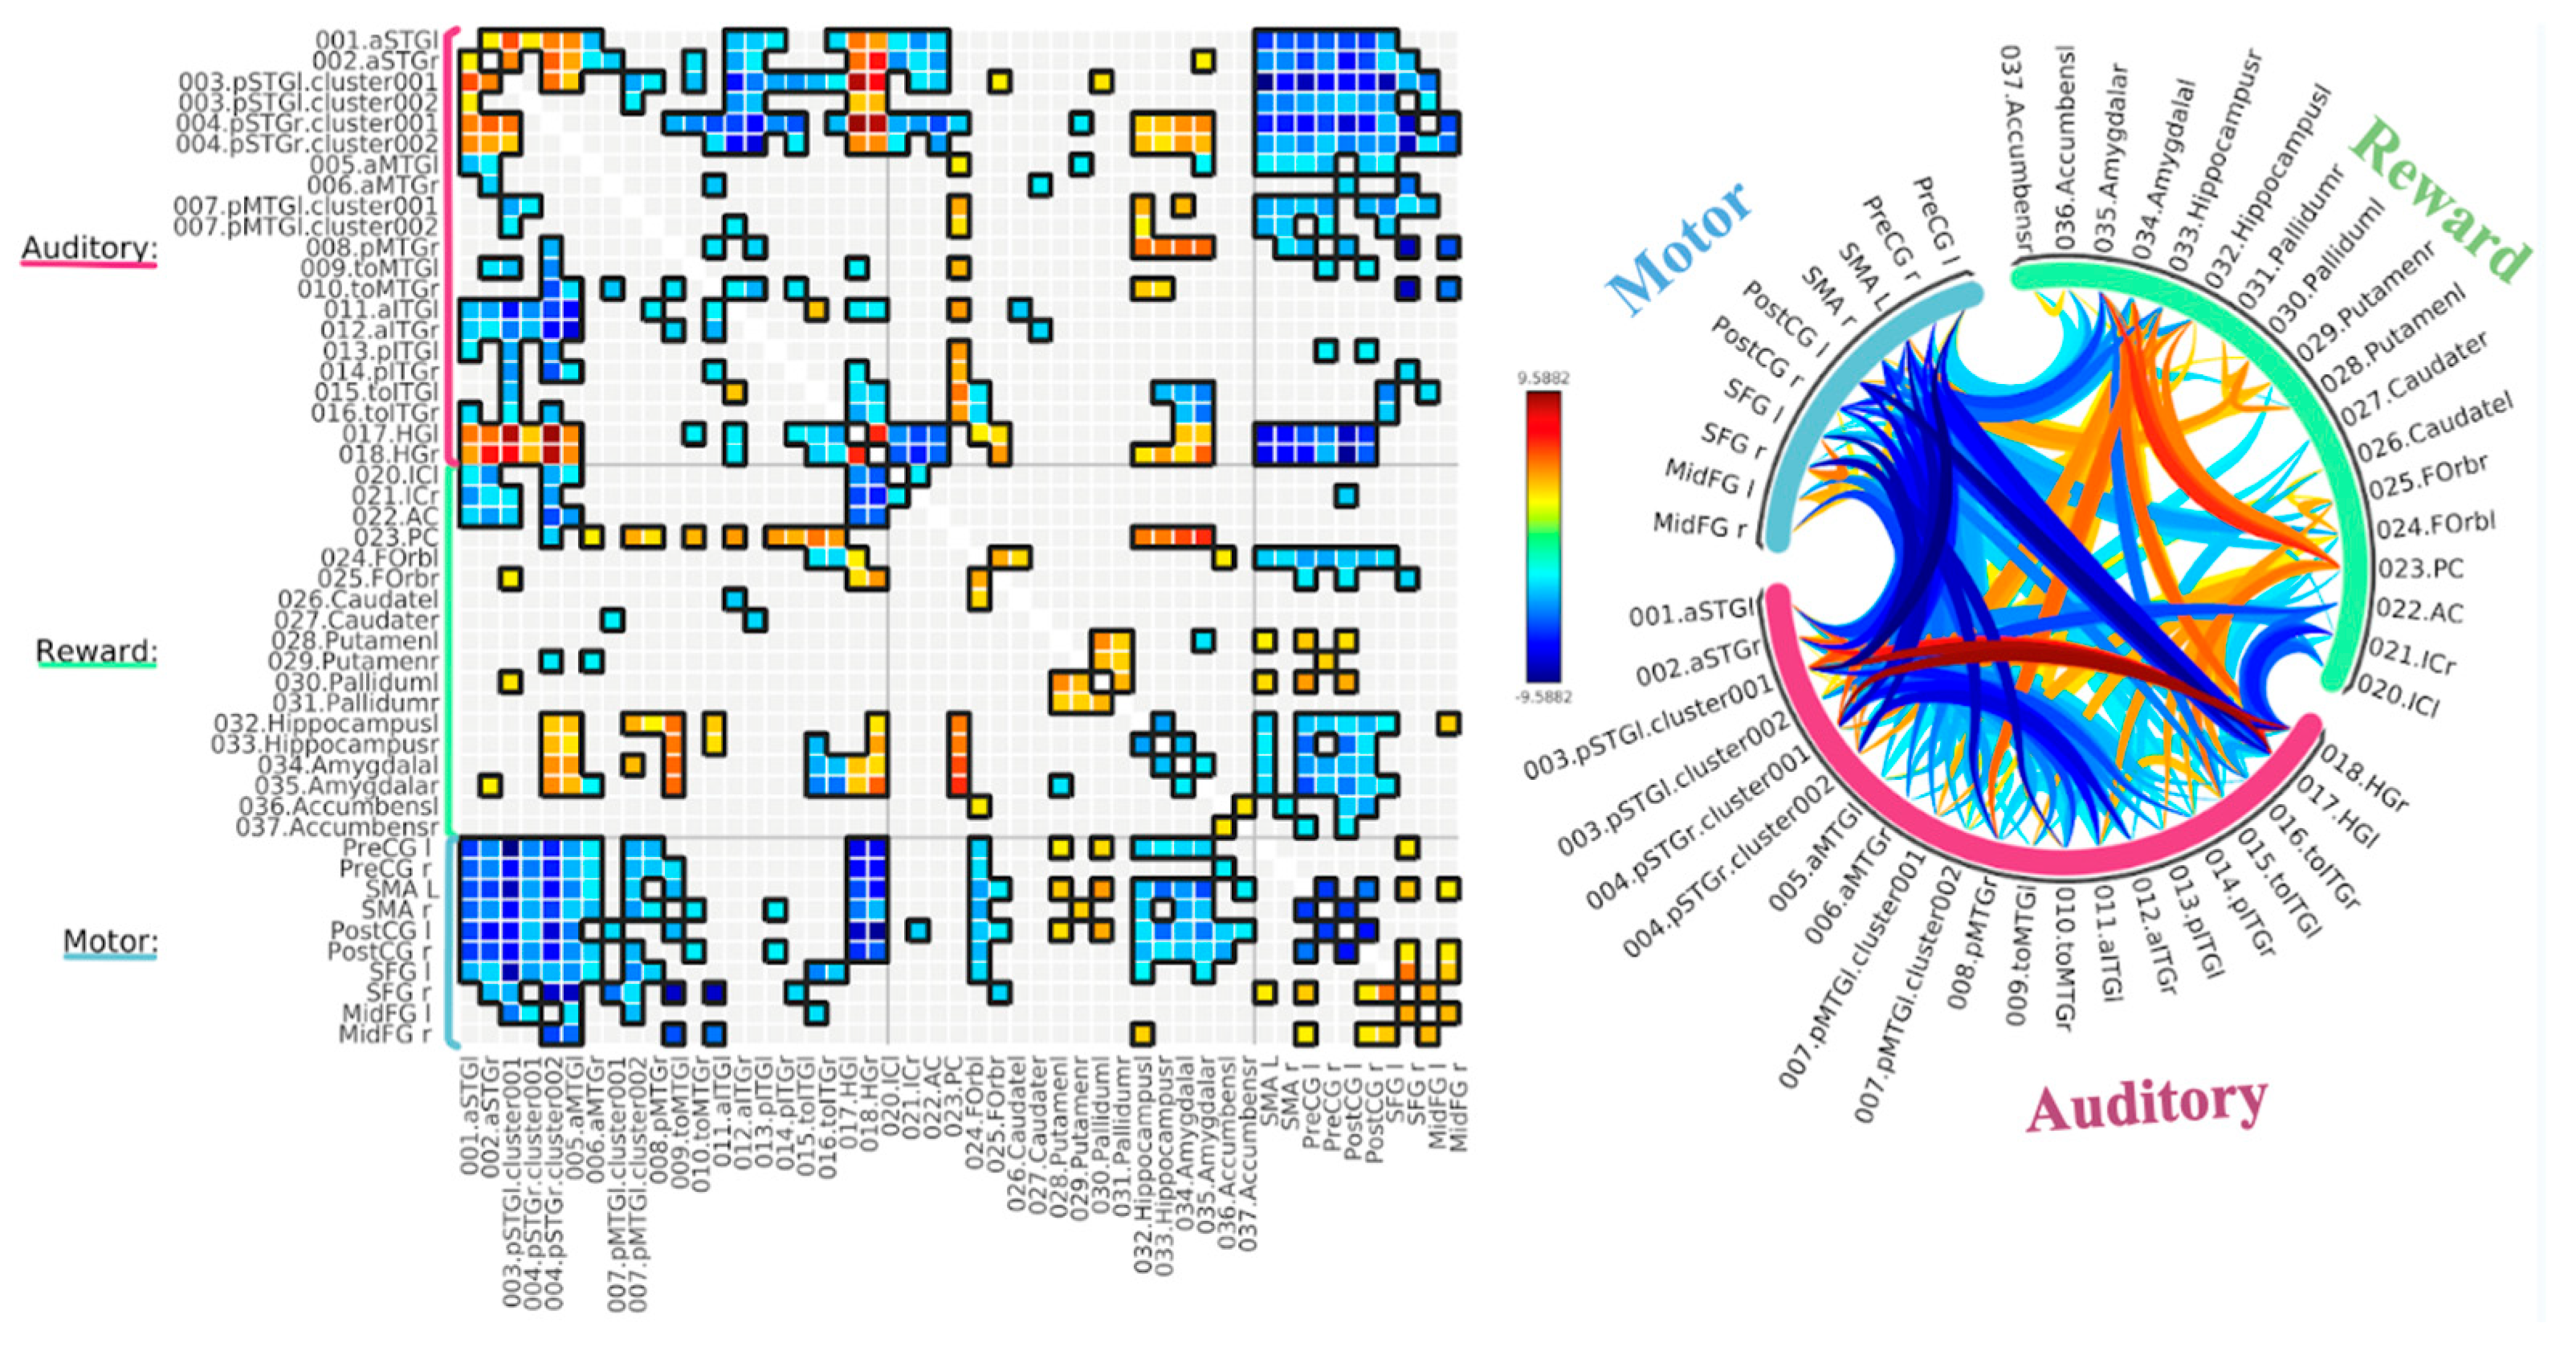
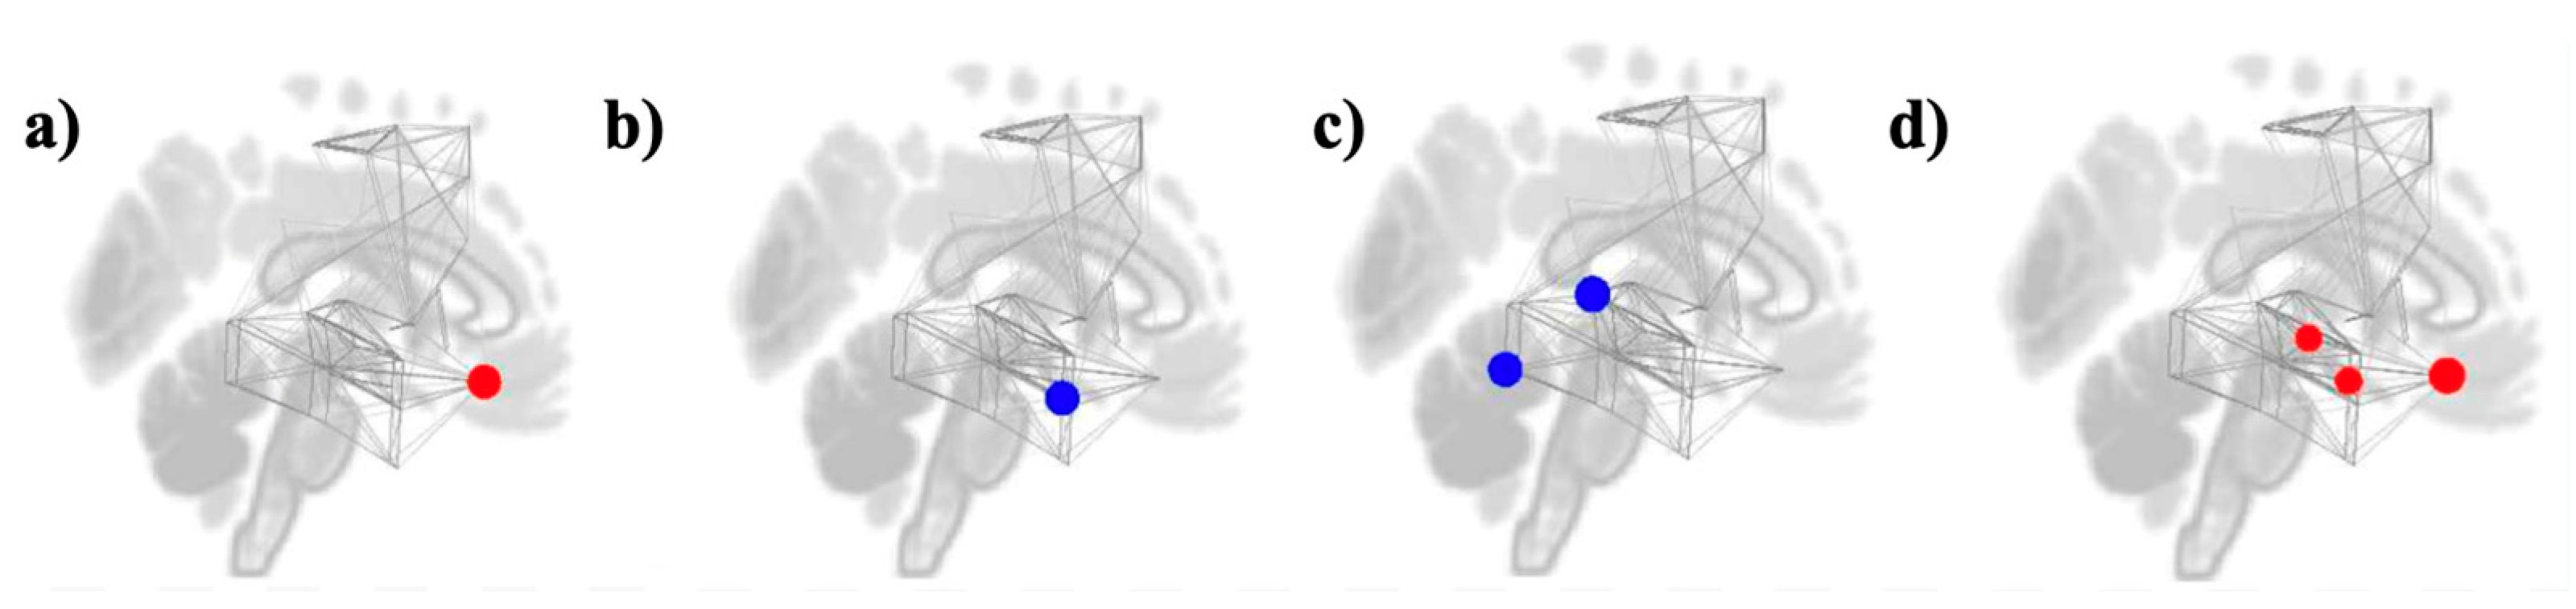
3.1. ROI-to-ROI Analyses
Study 1: Foreground Listening Group
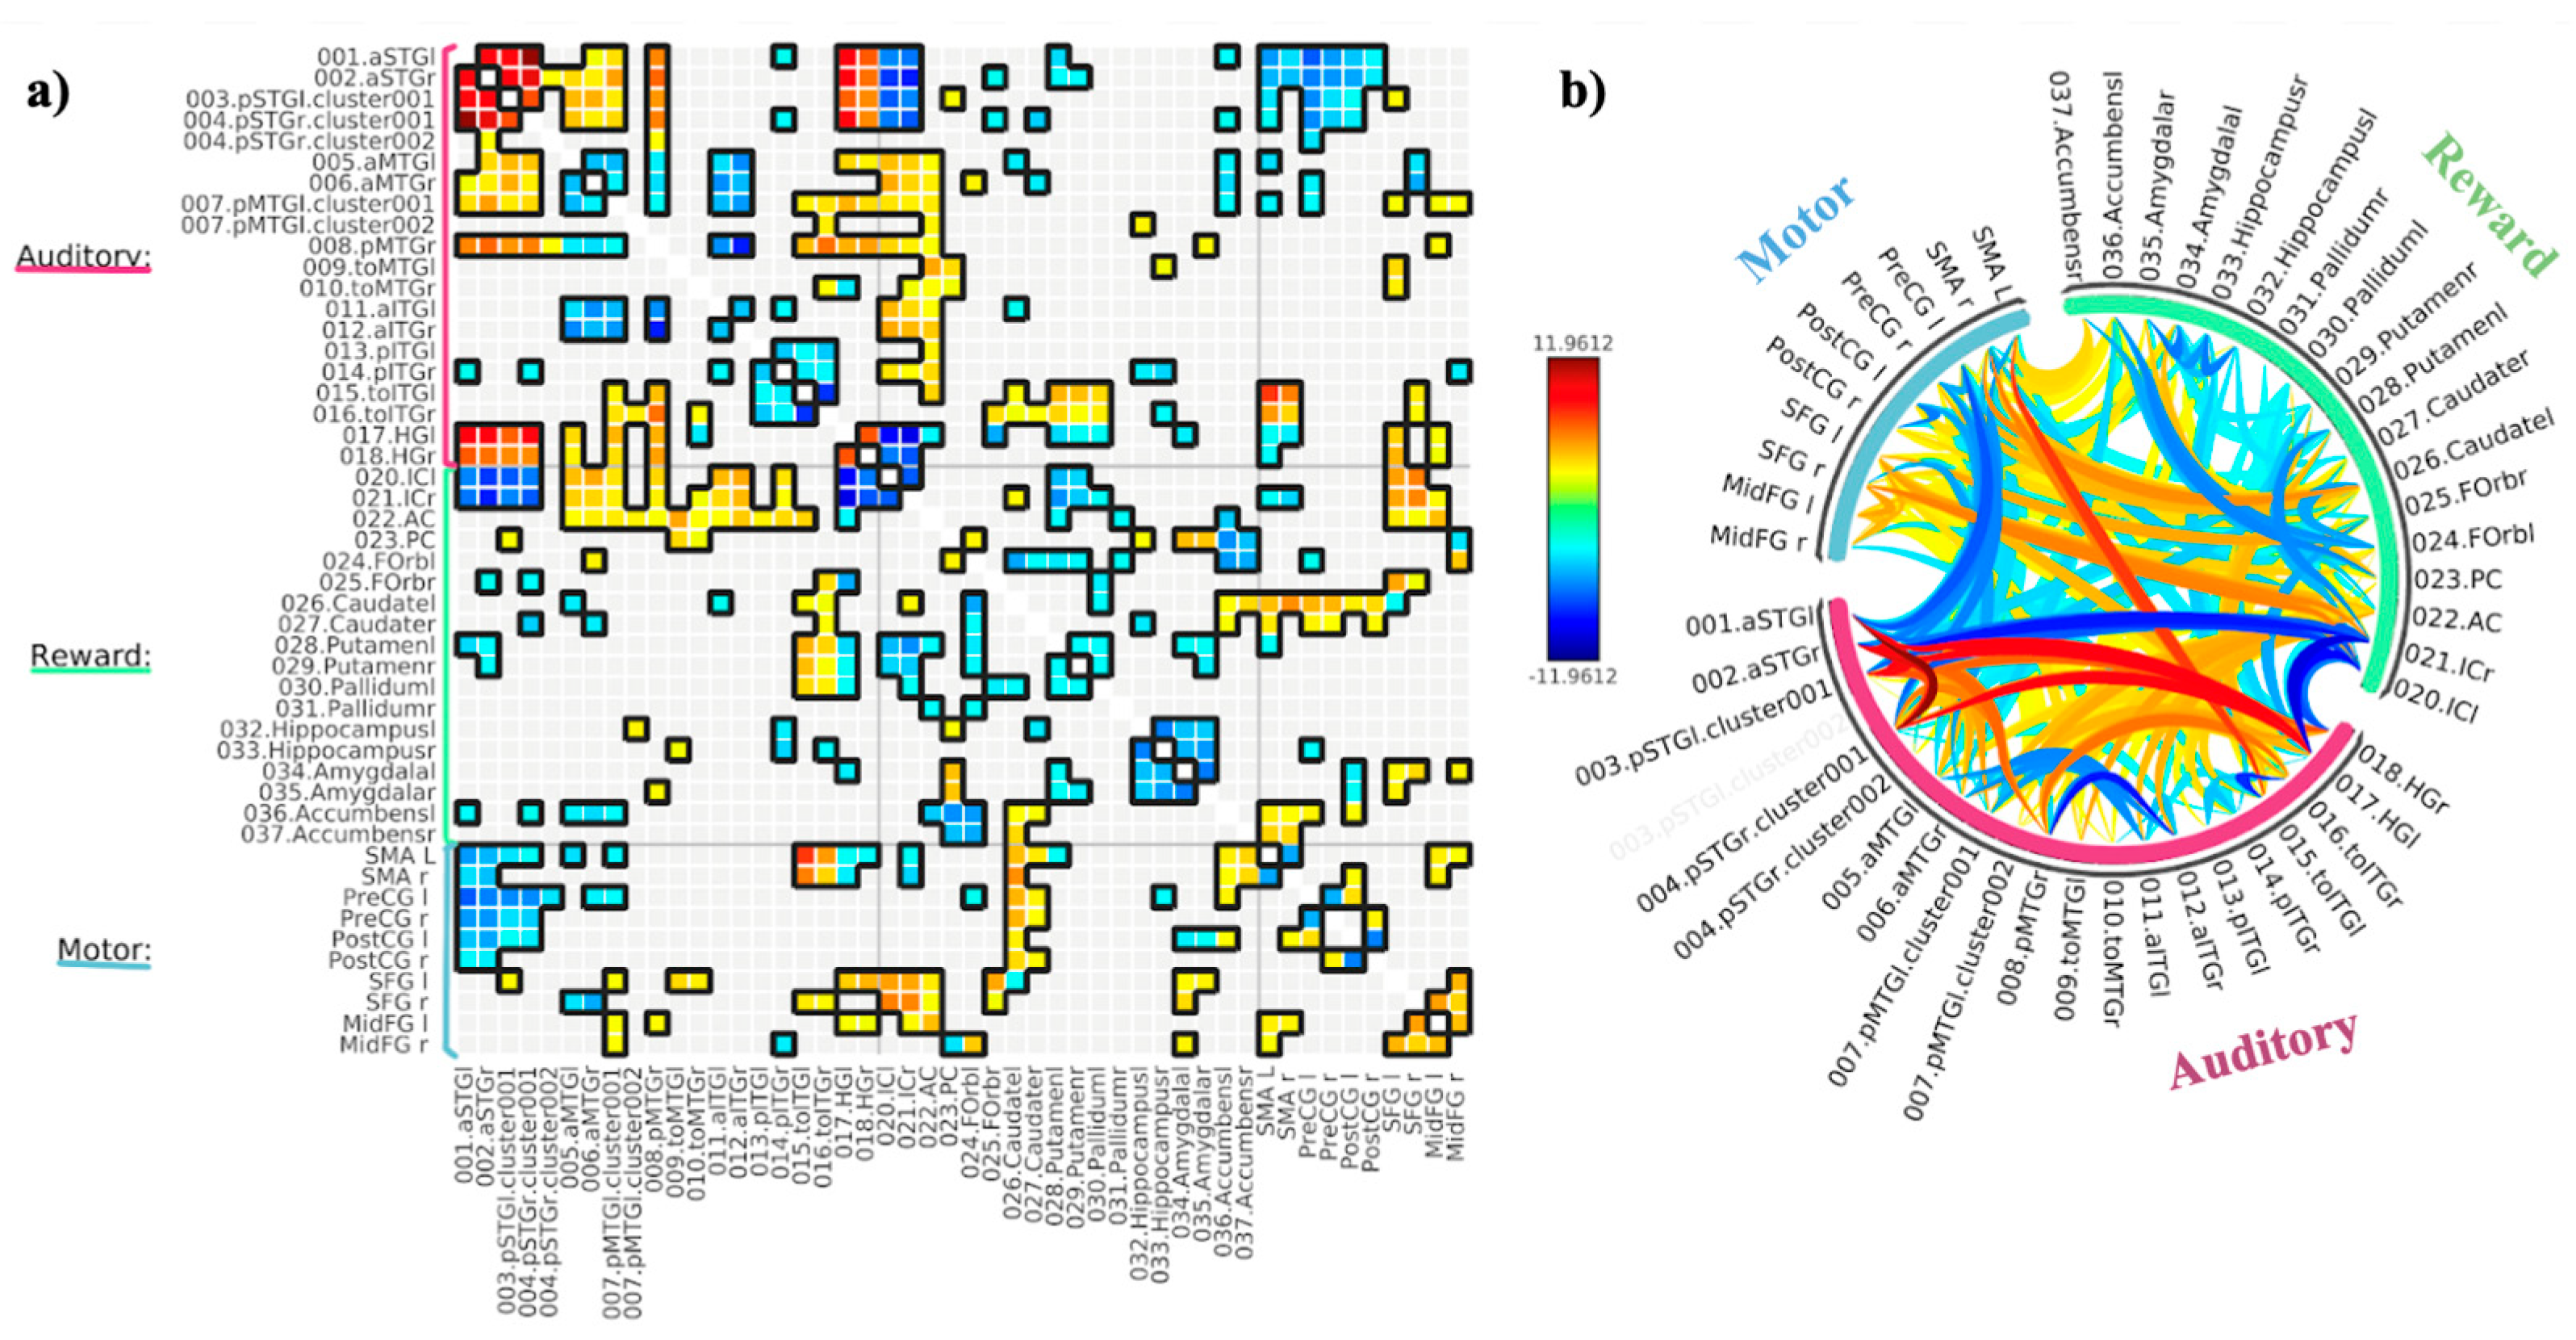
Study 2: Background Listening Group
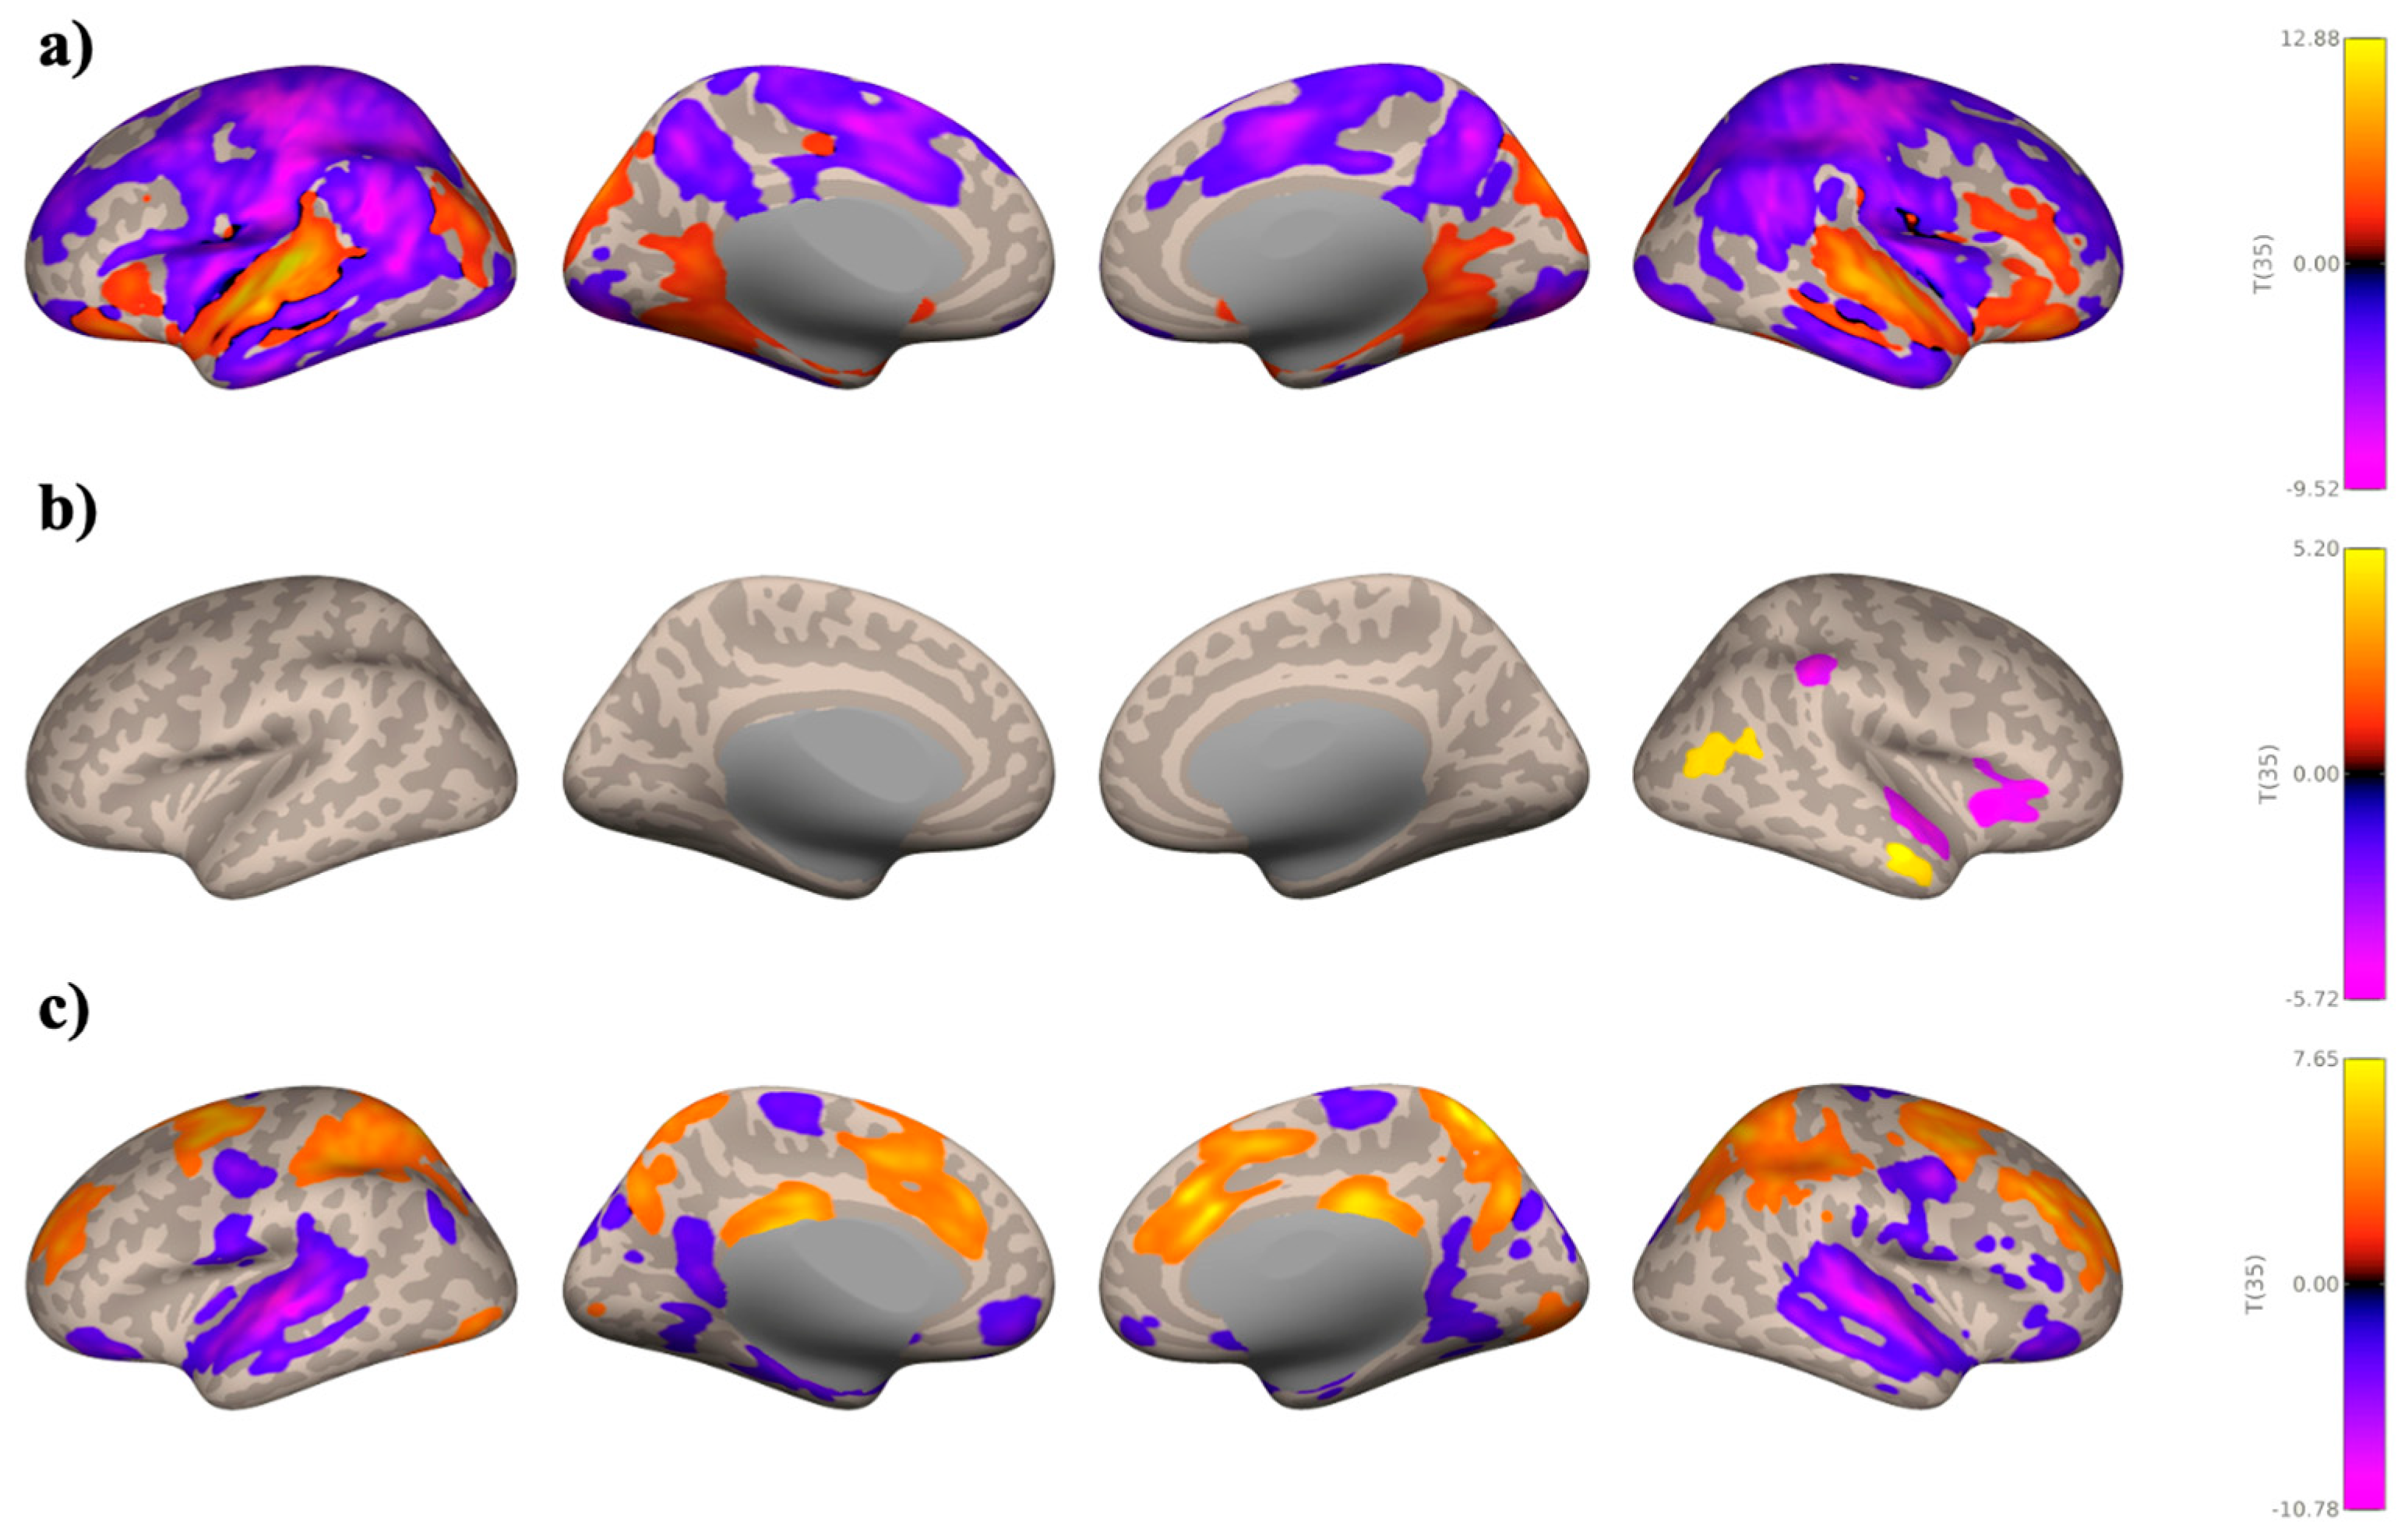
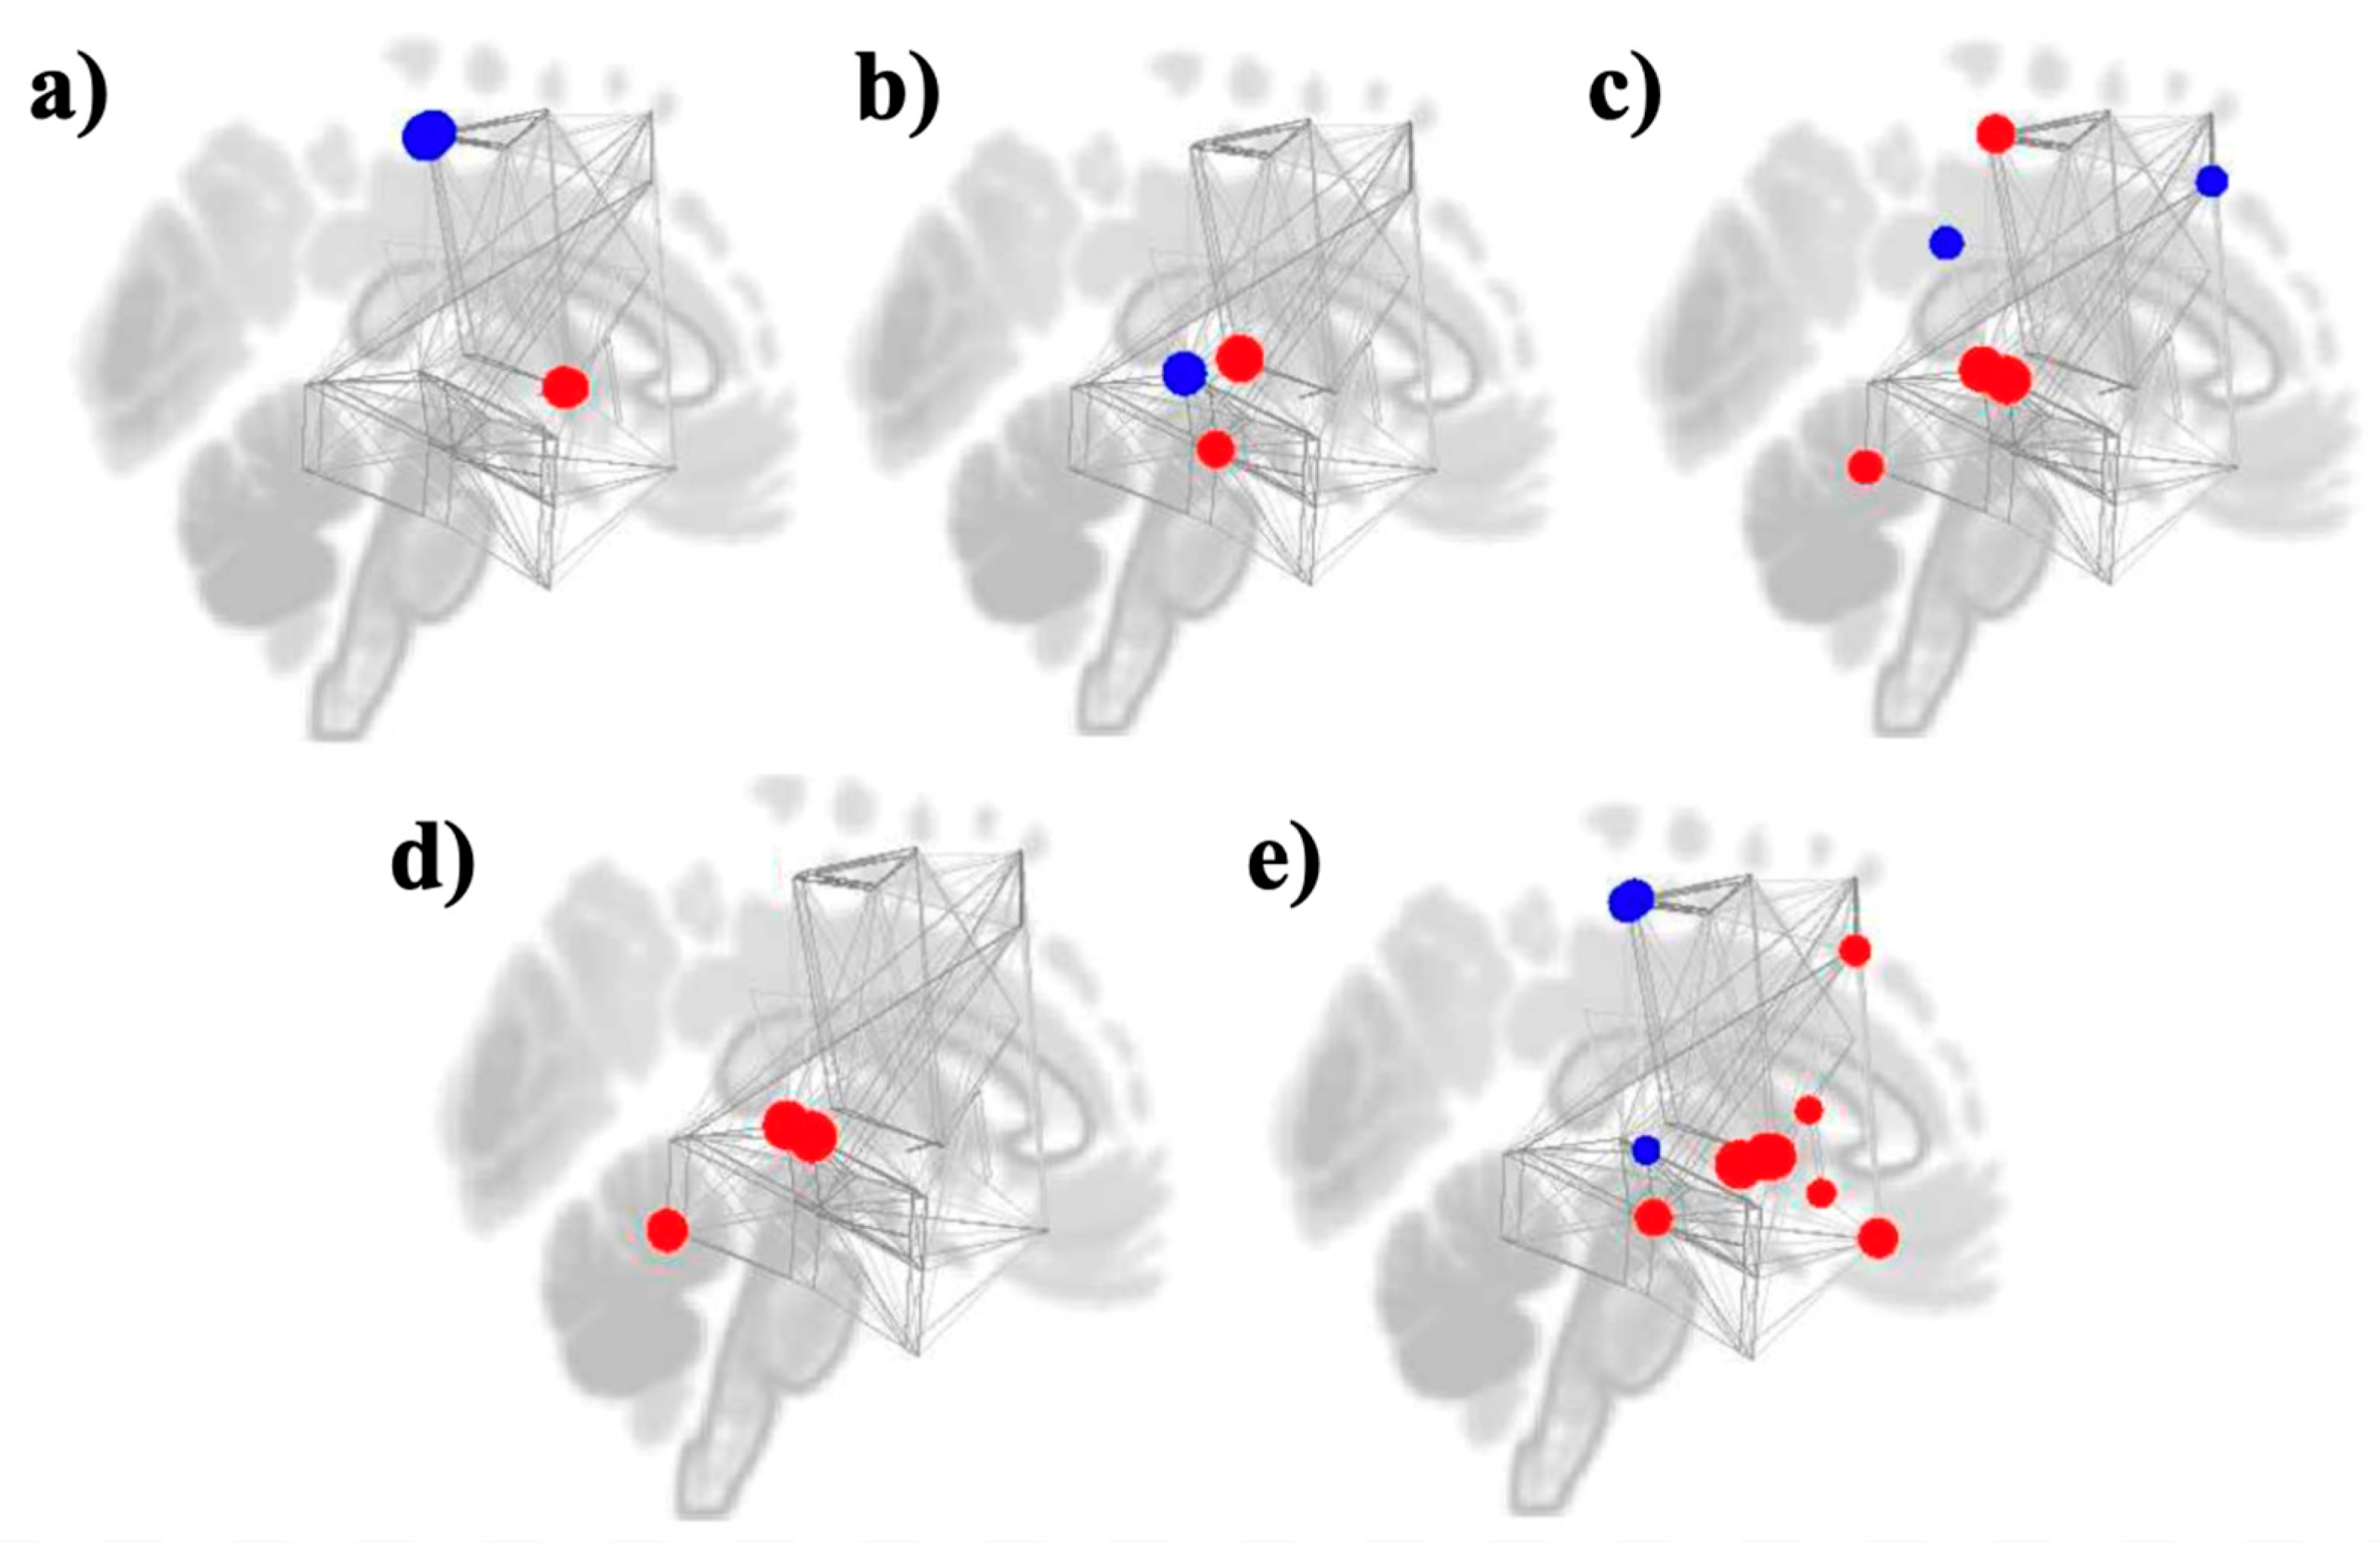
3.2. Seed-Based Connectivity Analyses
Study 1: Foreground Listening Group
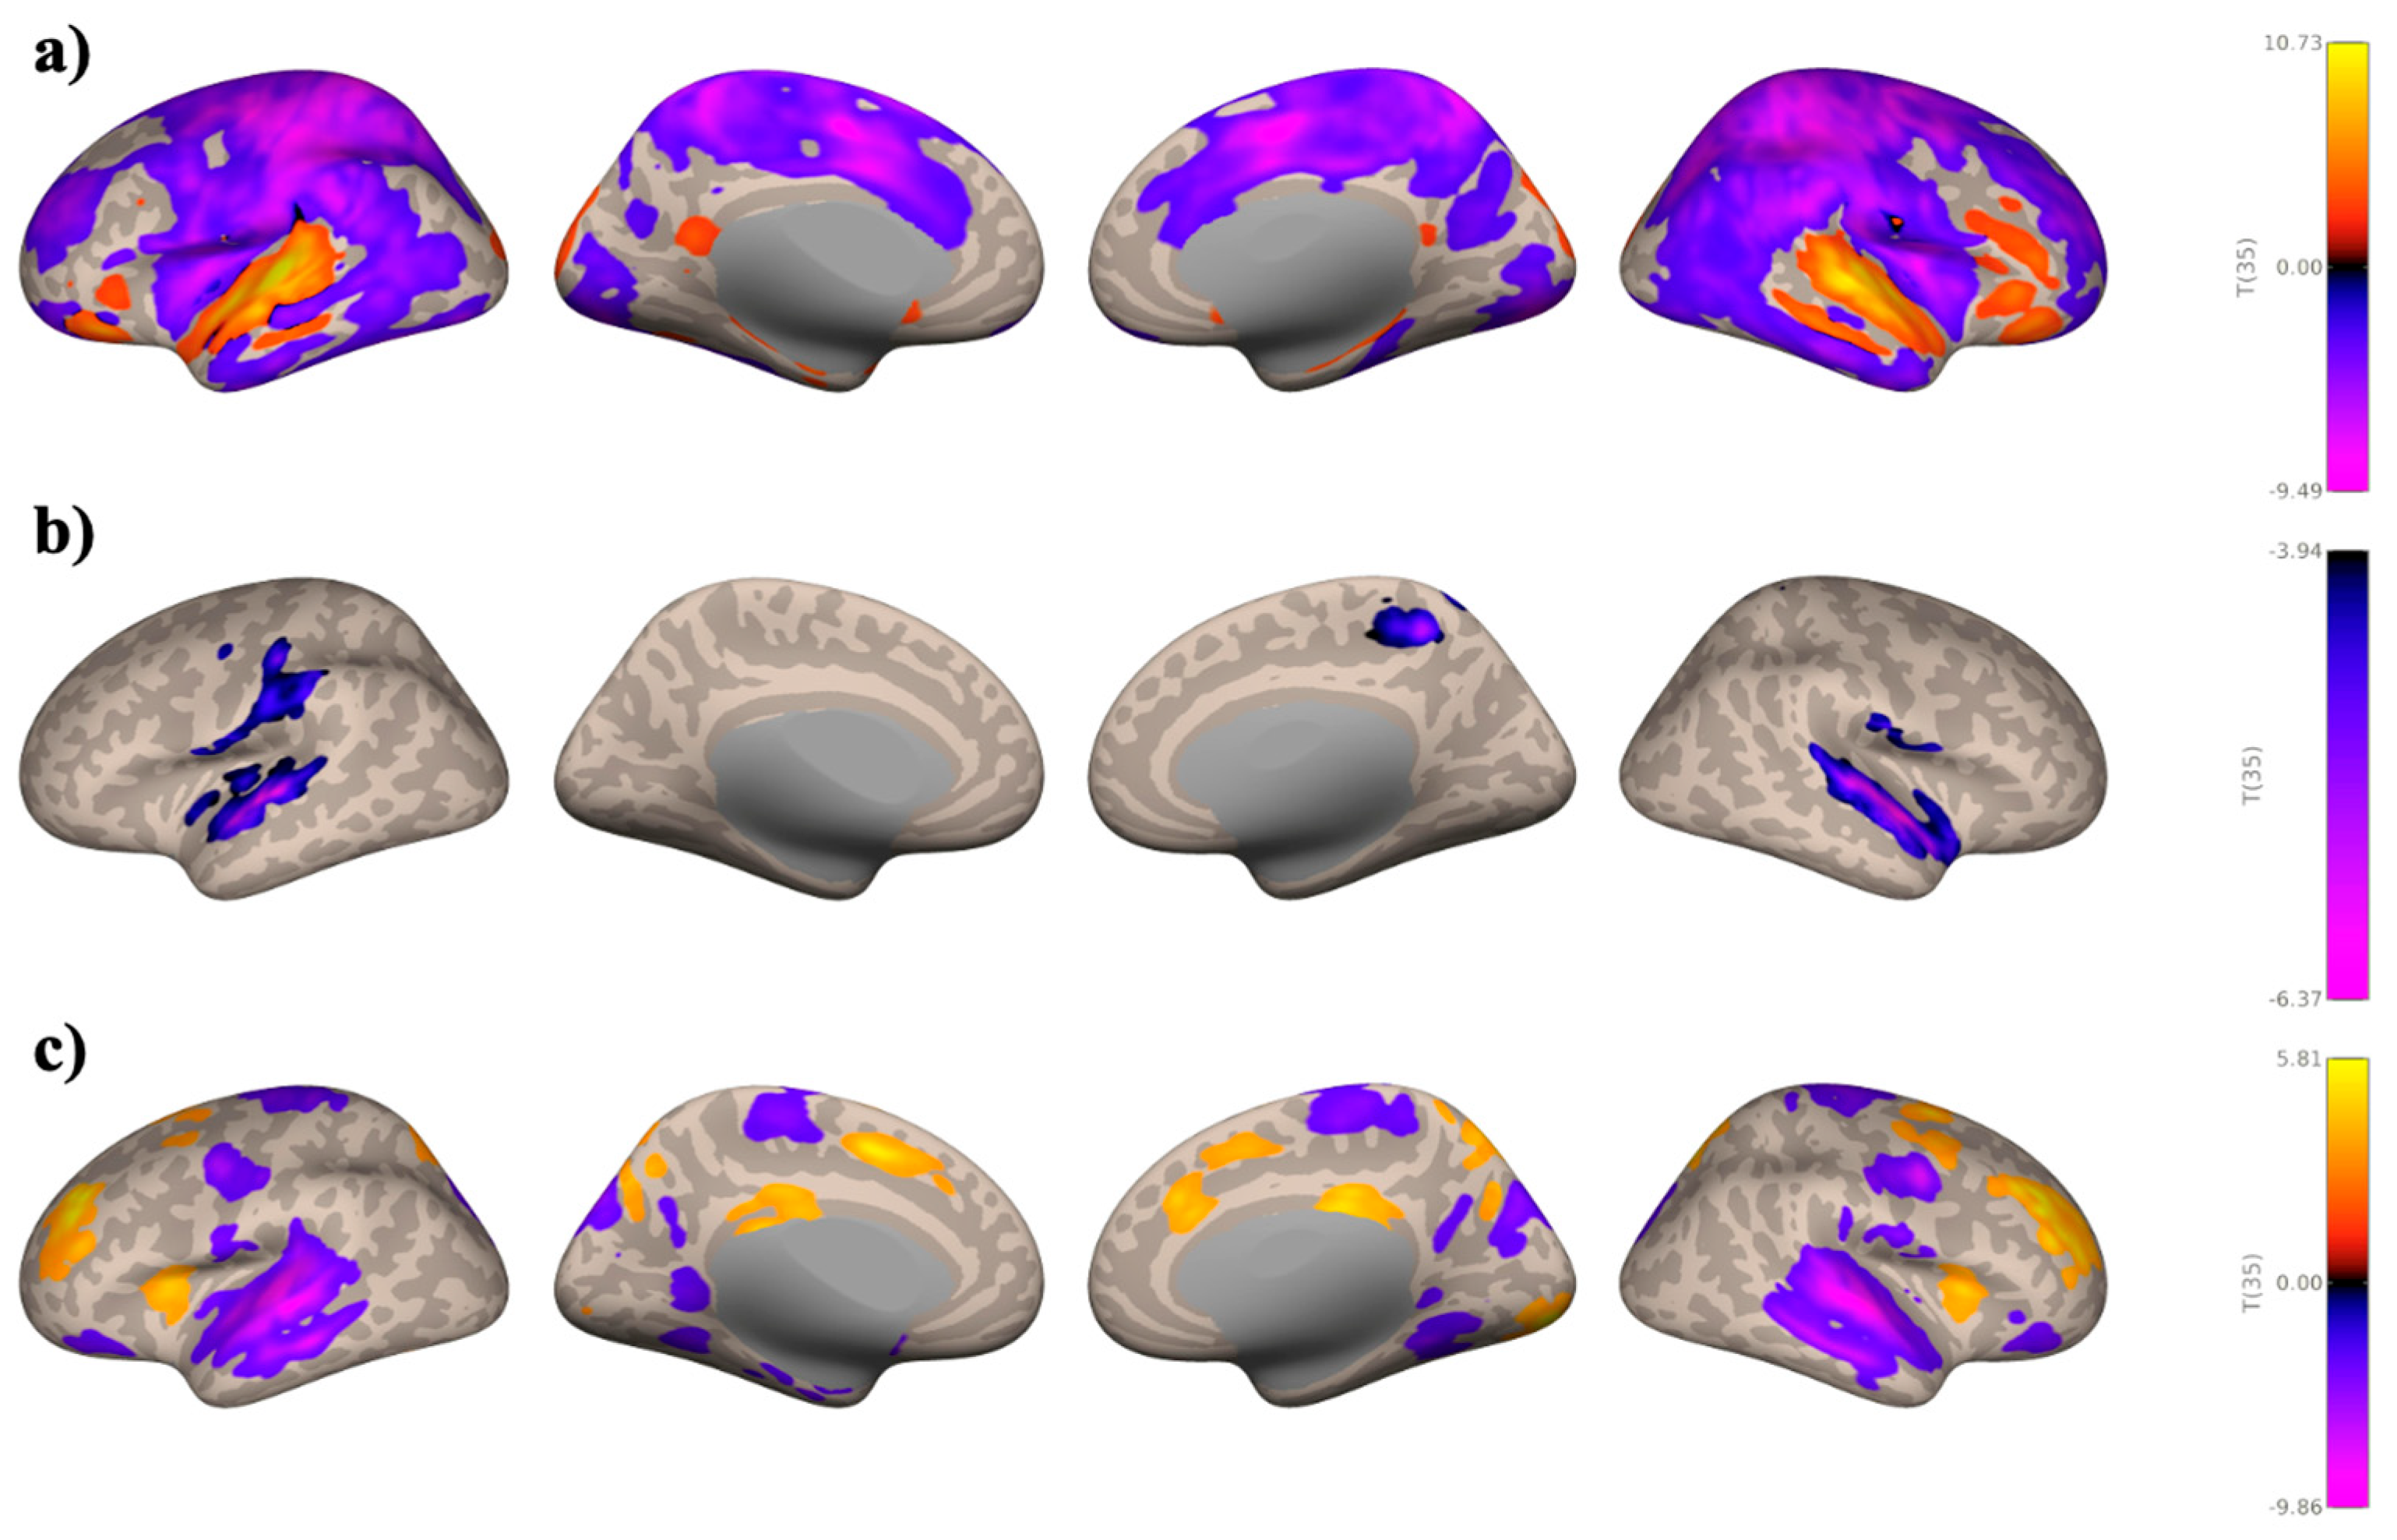
Study 2: Background Listening Group
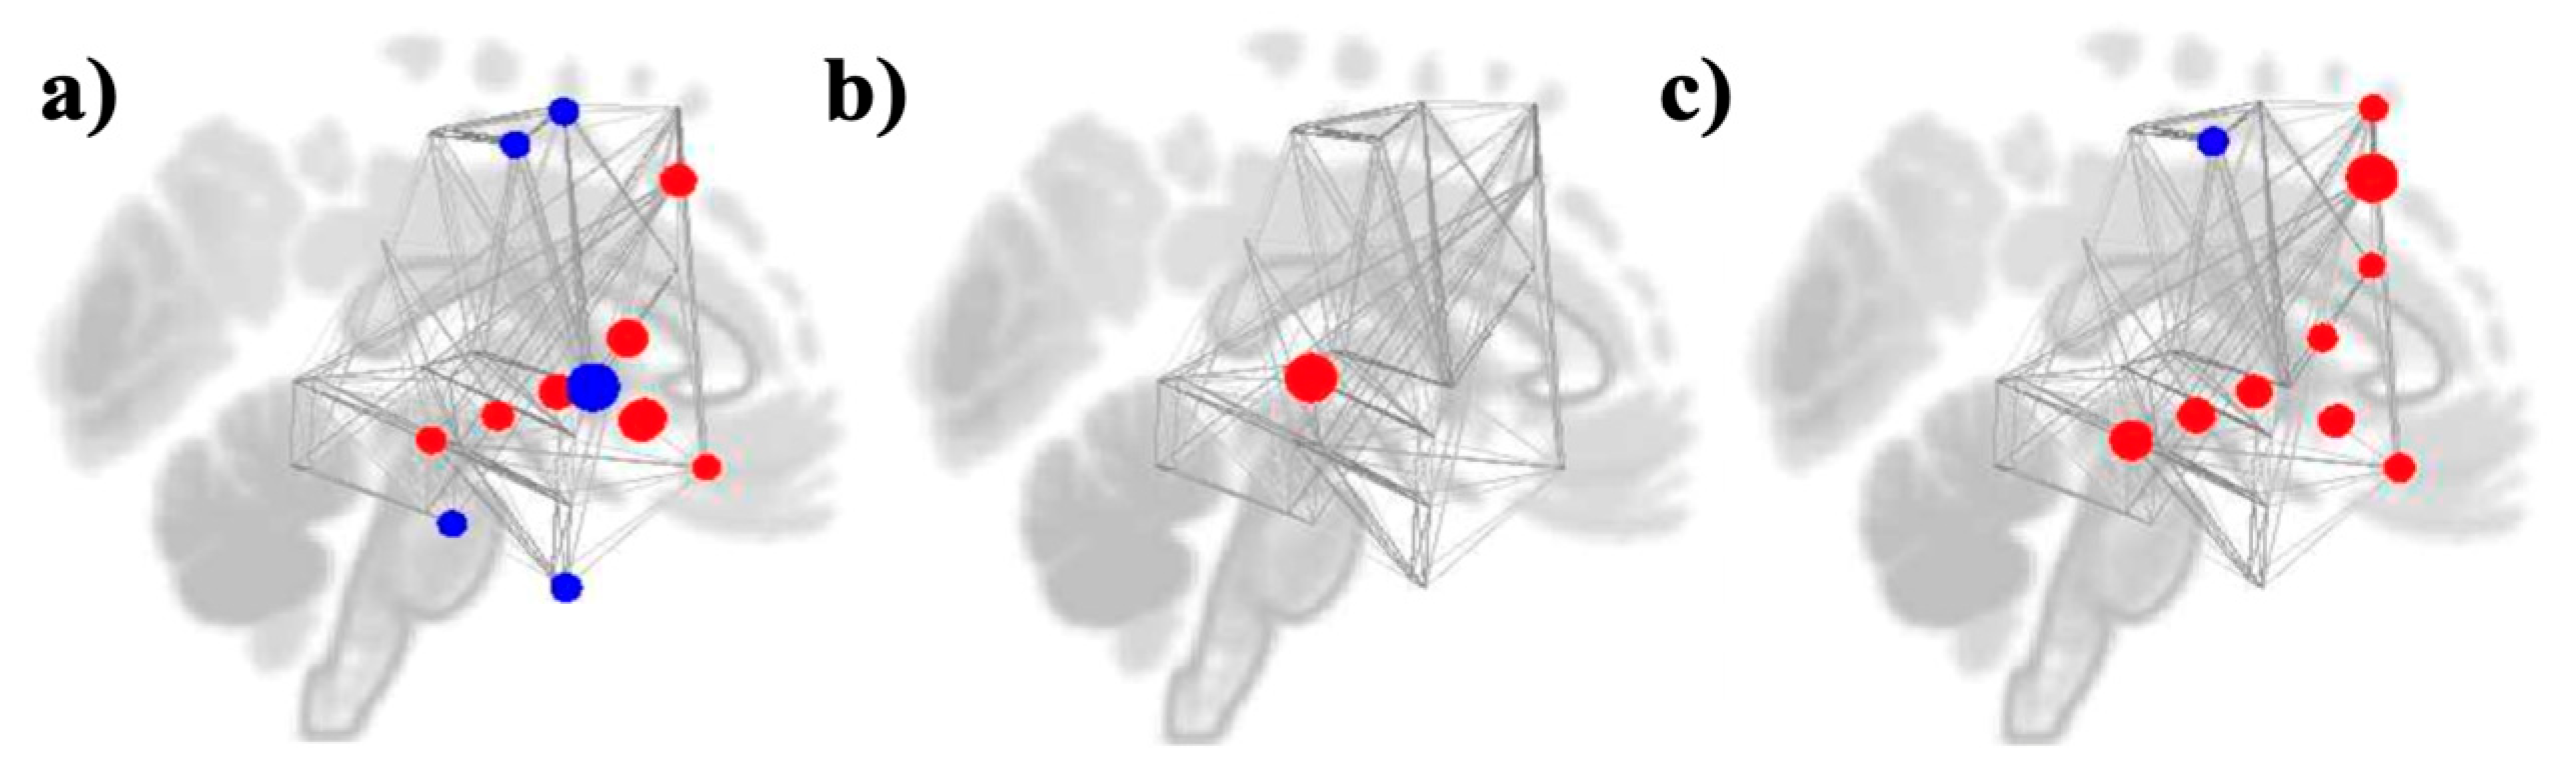
3.3. Graph Theory Analyses
Study 1: Foreground Listening Group
Study 2: Background Listening Group
4. Discussion
4.1. Music Enhances Intrinsic Auditory Network Connectivity
4.2. Context-Specific Motor and Reward Network Patterns During Music Listening
4.3. Network Analyses Support Reward System Integration
4.4. Rethinking the Role of Auditory Connectivity in Neurorehabilitation
4.5. Limitations and Future Directions
5. Conclusions
Supplementary Materials
Author Contributions
Funding
Institutional Review Board Statement
Informed Consent Statement
Data Availability Statement
Acknowledgments
Conflicts of Interest
References
- Dingle, G.A.; Sharman, L.S.; Bauer, Z.; Beckman, E.; Broughton, M.; Bunzli, E.; Davidson, R.; Draper, G.; Fairley, S.; Farrell, C.; et al. How do music activities affect health and well-being? A scoping review of studies examining Psychosocial Mechanisms. Frontiers in Psychology 2021, 12. [Google Scholar] [CrossRef] [PubMed]
- Cook, T.; Roy, A.R.K.; Welker, K.M. Music as an emotion regulation strategy: An examination of genres of music and their roles in emotion regulation. Psychology of Music 2017, 47, 144–154. [Google Scholar] [CrossRef]
- Thoma, M.V.; La Marca, R.; Brönnimann, R.; Finkel, L.; Ehlert, U.; Nater, U.M. The effect of music on the Human Stress Response. PLoS ONE 2013, 8. [Google Scholar] [CrossRef] [PubMed]
- Tarr, B.; Launay, J.; Dunbar, R.I.M. Silent disco: Dancing in synchrony leads to elevated pain thresholds and social closeness. EVOLUTION AND HUMAN BEHAVIOR 2016, 37, 343–349. [Google Scholar] [CrossRef]
- Perkins, R.; Mason-Bertrand, A.; Fancourt, D.; Baxter, L.; Williamon, A. How participatory music engagement supports mental well-being: A meta-ethnography. Qualitative Health Research 2020, 30, 1924–1940. [Google Scholar] [CrossRef]
- Sihvonen, A.J.; Särkämö, T.; Leo, V.; Tervaniemi, M.; Altenmüller, E.; Soinila, S. Music-based interventions in neurological rehabilitation. The Lancet Neurology 2017, 16, 648–660. [Google Scholar] [CrossRef]
- Zatorre, R.J.; Perry, D.W.; Beckett, C.A.; Westbury, C.F.; Evans, A.C. Functional anatomy of musical processing in listeners with absolute pitch and relative pitch. Proceedings of the National Academy of Sciences 1998, 95, 3172–3177. [Google Scholar] [CrossRef]
- Whitehead, J.C.; Armony, J.L. Singing in the brain: Neural representation of music and voice as revealed by fmri. Human Brain Mapping 2018, 39, 4913–4924. [Google Scholar] [CrossRef]
- Zatorre, R.J.; Chen, J.L.; Penhune, V.B. When the brain plays music: Auditory–motor interactions in music perception and production. Nature Reviews Neuroscience 2007, 8, 547–558. [Google Scholar] [CrossRef]
- Toader, C.; Tataru, C.P.; Florian, I.A.; Covache-Busuioc, R.A.; Bratu, B.G.; Glavan, L.A.; Bordeianu, A.; Dumitrascu, D.I.; Ciurea, A.V. Cognitive Crescendo: How Music Shapes the Brain's Structure and Function. Brain sciences 2023, 13, 1390. [Google Scholar] [CrossRef]
- Grahn, J.A.; Brett, M. Rhythm and beat perception in motor areas of the brain. Journal of cognitive neuroscience 2007, 19, 893–906. [Google Scholar] [CrossRef]
- Patel, A.D.; Iversen, J.R. The evolutionary neuroscience of musical beat perception: The Action Simulation for Auditory Prediction (ASAP) hypothesis. Frontiers in systems neuroscience 2014, 8, 57. [Google Scholar] [CrossRef]
- Fujioka, T.; Ross, B.; Trainor, L.J. Beta-Band Oscillations Represent Auditory Beat and Its Metrical Hierarchy in Perception and Imagery. The Journal of neuroscience : The official journal of the Society for Neuroscience 2015, 35, 15187–15198. [Google Scholar] [CrossRef]
- Cheng, T.-H.Z.; Creel, S.C.; Iversen, J.R. How do you feel the rhythm: Dynamic motor-auditory interactions are involved in the imagination of hierarchical timing. The Journal of Neuroscience 2021, 42, 500–512. [Google Scholar] [CrossRef] [PubMed]
- Harding, E.E.; Kim, J.C.; Demos, A.P.; Roman, I.R.; Tichko, P.; Palmer, C.; Large, E.W. Musical neurodynamics. Nature Reviews Neuroscience 2025, 26, 293–307. [Google Scholar] [CrossRef] [PubMed]
- Janata, P.; Tomic, S.T.; Haberman, J.M. Sensorimotor coupling in music and the psychology of the groove. Journal of Experimental Psychology 2012, 141, 54–75. [Google Scholar] [CrossRef] [PubMed]
- Senn, O.; Kilchenmann, L.; Bechtold, T.; Hoesl, F. Groove in drum patterns as a function of both rhythmic properties and listeners’ attitudes. PLoS ONE 2018, 13, e0199604. [Google Scholar] [CrossRef]
- Matthews, T.E.; Witek, M.A.G.; Lund, T.; Vuust, P.; Penhune, V.B. The sensation of groove engages motor and reward networks. NeuroImage 2020, 214, 116768. [Google Scholar] [CrossRef]
- Martín-Fernández, J.; Burunat, I.; Modroño, C.; González-Mora, J.L.; Plata-Bello, J. Music style not only modulates the auditory cortex, but also motor related areas. Neuroscience 2021, 457, 88–102. [Google Scholar] [CrossRef]
- Etani, T.; Miura, A.; Kawase, S.; Fujii, S.; Keller, P.E.; Vuust, P.; Kudo, K. A review of psychological and neuroscientific research on Musical Groove. Neuroscience & Biobehavioral Reviews 2024, 158, 105522. [Google Scholar] [CrossRef]
- Belden, A.; Quinci, M.A.; Geddes, M.; Donovan, N.J.; Hanser, S.B.; Loui, P. Functional organization of auditory and reward systems in aging. Journal of Cognitive Neuroscience 2023, 35, 1570–1592. [Google Scholar] [CrossRef]
- Belfi, A.M.; Loui, P. Musical anhedonia and rewards of music listening: Current advances and a proposed model. Annals of the New York Academy of Sciences 2019, 1464, 99–114. [Google Scholar] [CrossRef] [PubMed]
- Alluri, V.; Brattico, E.; Toiviainen, P.; Burunat, I.; Bogert, B.; Numminen, J.; Kliuchko, M. Musical expertise modulates functional connectivity of limbic regions during continuous music listening. Psychomusicology: Music, Mind, and Brain 2015, 25, 443–454. [Google Scholar] [CrossRef]
- Koelsch, S.; Fritz, T.; v. Cramon, D.Y.; Müller, K.; Friederici, A.D. Investigating emotion with music: An fmri study. Human Brain Mapping 2005, 27, 239–250. [Google Scholar] [CrossRef] [PubMed]
- Brown, S.; Martinez, M.J.; Parsons, L.M. Passive music listening spontaneously engages limbic and paralimbic systems. NeuroReport 2004, 15, 2033–2037. [Google Scholar] [CrossRef]
- Mas-Herrero, E.; Dagher, A.; Farrés-Franch, M.; Zatorre, R.J. Unraveling the Temporal Dynamics of Reward Signals in Music-Induced Pleasure with TMS. The Journal of neuroscience : The official journal of the Society for Neuroscience 2021, 41, 3889–3899. [Google Scholar] [CrossRef]
- Salimpoor, V.N.; van den Bosch, I.; Kovacevic, N.; McIntosh, A.R.; Dagher, A.; Zatorre, R.J. Interactions between the nucleus accumbens and auditory cortices predict music reward value. Science 2013, 340, 216–219. [Google Scholar] [CrossRef]
- Martínez-Molina, N.; Mas-Herrero, E.; Rodríguez-Fornells, A.; Zatorre, R.J.; Marco-Pallarés, J. Neural correlates of specific musical anhedonia. Proceedings of the National Academy of Sciences 2016, 113. [Google Scholar] [CrossRef]
- Sachs, M.E.; Ellis, R.J.; Schlaug, G.; Loui, P. Brain connectivity reflects human aesthetic responses to music. Social Cognitive and Affective Neuroscience 2016, 11, 884–891. [Google Scholar] [CrossRef]
- Wang, D.; Belden, A.; Hanser, S.B.; Geddes, M.R.; Loui, P. Resting-state connectivity of auditory and reward systems in alzheimer’s disease and mild cognitive impairment. Frontiers in Human Neuroscience 2020, 14. [Google Scholar] [CrossRef]
- Mori, K.; Zatorre, R. State-dependent connectivity in auditory-reward networks predicts peak pleasure experiences to music. PLoS biology 2024, 22, e3002732. [Google Scholar] [CrossRef] [PubMed]
- Loui, P.; Grent-’t-Jong, T.; Torpey, D.; Woldorff, M. Effects of attention on the neural processing of harmonic syntax in western music. Cognitive Brain Research 2005, 25, 678–687. [Google Scholar] [CrossRef] [PubMed]
- Jäncke, L.; Leipold, S.; Burkhard, A. The neural underpinnings of music listening under different attention conditions. NeuroReport 2018, 29, 594–604. [Google Scholar] [CrossRef] [PubMed]
- Woods, K.J.; Sampaio, G.; James, T.; Przysinda, E.; Hewett, A.; Spencer, A.E.; Morillon, B.; Loui, P. Rapid modulation in music supports attention in listeners with attentional difficulties. Communications Biology 2024, 7. [Google Scholar] [CrossRef]
- Polcher, A.; Frommann, I.; Koppara, A.; Wolfsgruber, S.; Jessen, F.; Wagner, M. Face-name associative recognition deficits in subjective cognitive decline and mild cognitive impairment. Journal of Alzheimer’s Disease 2017, 56, 1185–1196. [Google Scholar] [CrossRef]
- Esteban, O.; Markiewicz, C.J.; Blair, R.W.; Moodie, C.A.; Isik, A.I.; Erramuzpe, A.; Kent, J.D.; Goncalves, M.; DuPre, E.; Snyder, M.; Oya, H.; Ghosh, S.S.; Wright, J.; Durnez, J.; Poldrack, R.A.; Gorgolewski, K.J. FMRIPrep: A robust preprocessing pipeline for functional MRI. Nature Methods 2018, 16, 111–116. [Google Scholar] [CrossRef]
- Whitfield-Gabrieli, S.; Nieto-Castanon, A. Conn: A functional connectivity toolbox for correlated and anticorrelated brain networks. Brain connectivity 2012, 2, 125–141. [Google Scholar] [CrossRef]
- Nieto-Castanon, A. (2020). Handbook of Functional Connectivity Magnetic Resonance Imaging Methods in CONN. Hilbert Press. [CrossRef]
- Friston, K.J.; Ashburner, J.; Frith, C.D.; Poline, J.B.; Heather, J.D.; Frackowiak, R.S. Spatial registration and normalization of images. Human Brain Mapping 1995, 3, 165–189. [Google Scholar] [CrossRef]
- Nettekoven, C.; Zhi, D.; Shahshahani, L.; Pinho, A.L.; Saadon-Grosman, N.; Buckner, R.L.; Diedrichsen, J. A hierarchical atlas of the human cerebellum for functional precision mapping. Nature communications 2024, 15, 8376. [Google Scholar] [CrossRef]
- Rubinov, M.; Sporns, O. Complex network measures of brain connectivity: Uses and interpretations. NeuroImage 2010, 52, 1059–1069. [Google Scholar] [CrossRef]
- Stupacher, J.; Hove, M.J.; Novembre, G.; Schütz-Bosbach, S.; Keller, P.E. Musical groove modulates motor cortex excitability: A TMS investigation. Brain and cognition 2013, 82, 127–136. [Google Scholar] [CrossRef]
- Brodal, H.P.; Osnes, B.; Specht, K. Listening to Rhythmic Music Reduces Connectivity within the Basal Ganglia and the Reward System. Frontiers in neuroscience 2017, 11, 153. [Google Scholar] [CrossRef]
- Robb, S.L.; Story, K.M.; Harman, E.; Burns, D.S.; Bradt, J.; Edwards, E.; Golden, T.L.; Gold, C.; Iversen, J.R.; Habibi, A.; Johnson, J.K.; Lense, M.; Perkins, S.M.; Springs, S. Reporting guidelines for music-based interventions checklist: Explanation and elaboration guide. Frontiers in Psychology 2025, 16. [Google Scholar] [CrossRef]
- Altenmüller, E.; Marco-Pallares, J.; Münte, T.F.; Schneider, S. Neural reorganization underlies improvement in stroke-induced motor dysfunction by music-supported therapy. Annals of the New York Academy of Sciences 2009, 1169, 395–405. [Google Scholar] [CrossRef]


| Measures | Networks | ROIs | Beta | T (DF = 35) | p-FDR |
| Degree | Reward | FOrb r | 3.04 | 4.64 | 0.002315 |
| Betweenness Centrality | Auditory Auditory |
pSTG l (Cluster 1) toITG l |
-0.02 -0.02 |
-3.51 -3.37 |
0.045299 0.045299 |
| Clustering Coefficient | Auditory | aMTG l | -0.10 | -3.58 | 0.04877 |
| Global Efficiency | Reward Reward Auditory Reward |
FOrb r Amygdala r pSTG r (Cluster 2) Amygdala l |
0.08 0.09 0.03 0.05 |
4.24 3.23 3.17 3.15 |
0.007624 0.041181 0.041181 0.041181 |
| MEASURES | NETWORKS | ROIS | BETA | T (DF = 35) | P-FDR |
| DEGREE | Motor Motor Reward Reward |
PostCG l PostCG r Putamen l Putamen r |
-2.75 -2.62 1.81 1.51 |
-4.29 -4.06 3.76 3.32 |
0.006487 0.006487 0.010042 0.025535 |
| BETWEENNESS CENTRALITY | Auditory Auditory Auditory |
HG r pSTG l (Cluster 1) pMTG r |
0.03 -0.04 0.03 |
4.21 -4.00 3.31 |
0.007574 0.007574 0.035887 |
| Clustering Coefficient | Auditory Auditory Motor Auditory Reward Motor |
pSTG r (Cluster 1) pSTG l (Cluster 1) PostCG r toITG l PCC midFG r |
0.13 0.13 0.12 0.14 -0.28 -0.09 |
4.39 4.28 3.58 3.19 -3.13 -2.99 |
0.003256 0.003256 0.016496 0.037092 0.039538 0.039538 |
| Local Efficiency | Auditory Auditory Auditory | pSTG r (Cluster 1) pSTG l (Cluster 1) toITG l |
0.08 0.08 0.17 |
4.18 4.07 3.48 |
0.005991 0.005991 0.023270 |
| Global Efficiency | Reward Reward Reward Reward Reward Motor Motor Auditory Motor Reward Reward Auditory Reward |
Pallidum l Putamen l Putamen r Pallidum r FOrb r PostCG r PostCG l pMTG r midFG l FOrb l NAcc l pSTG r (Cluster 1) Caudate l |
0.09 0.09 0.08 0.07 0.04 -0.06 -0.05 0.02 0.03 0.04 0.08 -0.03 0.07 |
4.55 4.36 4.22 3.79 3.71 -3.64 -3.59 3.41 2.97 2.93 2.74 -2.72 2.62 |
0.002675 0.002675 0.002714 0.006949 0.006949 0.006979 0.006979 0.010164 0.029074 0.029074 0.041247 0.041247 0.049220 |
| Measures | Networks | ROIs | Beta | T (DF= 35) | P-FDR |
| Degree | Reward Reward Reward Reward Reward Reward Motor Auditory Auditory Motor Motor Auditory Auditory Reward |
IC r NAcc l NAcc r Caudate l Pallidum r IC l MidFG l pSTG r (Cluster 1) aITG r SMA l PreCG l pMTG l (Cluster 1) pITG r FOrb l |
-2.41 0.57 0.46 1.08 0.18 -1.71 1.47 0.95 -1.32 -1.21 -1.20 0.99 -1.29 1.40 |
-4.92 4.14 4.01 3.83 3.55 -3.40 3.36 3.03 -2.97 -2.88 -2.81 2.80 -2.76 2.70 |
0.000993 0.005005 0.005005 0.006186 0.010870 0.013082 0.013082 0.027960 0.029412 0.032720 0.033910 0.033910 0.034359 0.037307 |
| Clustering Coefficient | Auditory | pSTG r (Cluster 1) | 0.13 | 4.88 | 0.000971 |
| Local Efficiency | Auditory | pSTG r (Cluster 1) | 0.10 | 4.22 | 0.007008 |
| Global Efficiency | Motor Auditory Auditory Reward Reward Motor Motor Reward Reward Reward Motor Reward |
midFG l pMTG l (Cluster 1) pSTG r (Cluster 2) Pallidum r NAcc l midFG r PreCG l FOrb l Caudate l NAcc r SFG l ACC |
0.04 0.02 0.09 0.05 0.05 0.02 -0.02 0.03 0.07 0.05 0.02 0.02 |
5.14 4.26 3.71 3.54 3.47 3.33 -3.13 3.08 2.96 2.93 2.86 2.69 |
0.000517 0.003560 0.011548 0.013819 0.013819 0.016608 0.024366 0.024437 0.029337 0.029337 0.031560 0.044730 |
Disclaimer/Publisher’s Note: The statements, opinions and data contained in all publications are solely those of the individual author(s) and contributor(s) and not of MDPI and/or the editor(s). MDPI and/or the editor(s) disclaim responsibility for any injury to people or property resulting from any ideas, methods, instructions or products referred to in the content. |
© 2025 by the authors. Licensee MDPI, Basel, Switzerland. This article is an open access article distributed under the terms and conditions of the Creative Commons Attribution (CC BY) license (http://creativecommons.org/licenses/by/4.0/).


