

Submitted:
09 September 2025
Posted:
11 September 2025
You are already at the latest version
Abstract
Melanoma is the most aggressive and deadliest form of skin cancer, and the current treatments of mel-anoma have many limitations, which necessitates discovering new compounds and targets for melanoma. Two probes, 2155-14 and 2155-18, were identified to induce apoptotic cell death, autophagy, and immune signaling modulation through hnRNPH1/H2-dependent mechanisms. RNA sequencing following the siRNA-mediated knockdown of hnRNPH1/H2 in melanoma cells revealed an enrichment of im-mune-related signaling pathways. The present study investigated the effect of genetic and pharmacologic downregulation of hnRNPH1/H2 on melanoma immunogenicity in vitro. Our results indicate that treating melanoma cell lines with 2155-14, 2155-18, or hnRNPH2 siRNA led to hnRNPH1/H2 downregulation. This resulted in a significant upregulation of pro-inflammatory pathways and simultaneous downregulation of anti-inflammatory pathways. These findings provide the first insight into the role of hnRNPH1/H2 as critical drivers of melanoma immunogenicity and suggest their potential as novel therapeutic targets for enhancing melanoma treatment outcomes. This study underscores the impact of post-transcriptional regulation on the immune environment in melanoma and in cancer in general.
Keywords:
melanoma
; spliceosomal proteins
; hnRNPH1/H2
; drug discovery
; NanoString
; immunotherapy
1. Introduction
Melanoma is a highly aggressive and one of the deadliest forms of skin cancer. In 2022, an estimated 331,722 new cases of melanoma were diagnosed globally, and mortality due to melanoma accounted for 58,667 deaths. North America ranks second in the highest incidence and prevalence of melanoma cases, following Europe [1]. The average annual cost of melanoma treatment in the United States was approximately $2.5 billion between 2016 and 2018 [2]. Current treatments for melanoma face significant limitations, including low response rates (RR), a lack of effective therapies for triple-wide type and NRAS-mutant melanoma [3], and drug resistance [4,5].
We previously discovered two small molecule probes, 2155-14 and 2155-18, which showed potency against melanoma cell lines which was comparable to vemurafenib [6]. Pull-down assays using lysates of melanoma cell lines M14 and WM266-4 with biotinylated analogs of 2155-14 revealed four specific bands. The four bands were identified by LC/MS/MS as ATP-dependent RNA helicase DDX1 (band 1), heterogeneous nuclear ribonucleoprotein H2 (hnRNPH2, band 2), and heterogeneous nuclear ribonucleoprotein A2/B1 (hnRNPA2/B1, bands 3 and 4), all of which were confirmed by immunoblotting [7]. siRNA-mediated knockdown of these targets revealed that only the knockdown of hnRNPH1/H2 potentiates autophagy and apoptosis. Due to the 96% sequence homology of hnRNPH1 and hnRNPH2 sequences, a high degree of functional similarity between the two proteins was suggested [8]. Both hnRNPH1 and hnRNPH2 are RNA-binding proteins (RBPs) that play a key role in regulating essential RNA-related transcription processes. Members of the hnRNP family regulate or contribute to regulation of splicing, transcription, mRNA trafficking, polyadenylation, telomere maintenance, translational regulation, and mRNA degradation [9,10].
Targeting RNA binding proteins to modulate splicing in cancer cells is a relatively new approach in cancer therapy [11,12]. Nevertheless, two compounds—E7107 and H3B-8800—that target the spliceosomal protein, SF3B1, have shown anticancer effects in preclinical and clinical studies. A Phase I clinical study of E7107 in patients with advanced solid tumors was terminated due to adverse events (clinical trial# NCT00499499). H3B-8800 has been evaluated in clinical settings for patients with myelodysplastic syndromes and leukemia (clinical trial #NCT02841540). The results demonstrate dose-dependent target engagement and safety of H3B-8800 even with prolonged dosing [13].
Previous in vivo study demonstrated that the administration of BRAF inhibitors to mice carrying melanoma tumors following anti-PD-1 therapy resulted in increased infiltration of monocytes, T cells, natural killer cells, and dendritic cells, alongside a reduction in Tregs, myeloid-derived suppressor cells (MDSCs), and tumor-associated macrophages [14]. Such results suggest that pharmacological modulation of an “unrelated” target can enhance immune responses against tumor cells. Furthermore, a recent clinical informatics study using data from the Cancer Genome Atlas (TCGA) found a correlation between the increased expression of immune-related signaling pathways (interferon-α/β and interferon-γ) and improved overall survival in melanoma patients [15]. This finding is significant due to the association of interferon-α/β and interferon-γ pathways with higher immune cell infiltration into tumors [16,17], which results in a better response to immunotherapy.
In the present study, we demonstrate the effect of pharmacological and siRNA-mediated i of hnRNPH2 on stimulation of pro-inflammatory signaling in melanoma cells.
Materials and Methods
Procedure for the synthesis of 2155-14 (JC-395) and 2155-18 (JC-408). Pyrrolidine-bis-diketopiperazine JC-395 and JC-408 (Figure S1) were synthesized by modifying the previously published method [6]. The key intermediate (5) was synthesized using automated microwave synthesis conditions on a CEM Liberty PRIME 2.0 system with the one-pot coupling/deprotection methodology. Couplings were performed with Fmoc-protected amino acid (0.5 M in DMF), DIC (1.0 M in DMF), and Oxyma (0.3 M in DMF) for 30 seconds at 25 °C followed by 4 min at 90 °C. Fmoc deprotection was performed for 2 min at 110 °C and initiated by adding pyrrolidine/DMF (15% v/v) directly to the undrained post-coupling solution. The mBHA resin (1.42 g, 2 mmol) was washed with 20% piperidine/DMF (6 mL, 3 times), and it was transferred to the 125 mL reaction vessel for the microwave-assisted amide coupling and Fmoc deprotection reactions. The deprotection-coupling cycle runs were automatically performed with Fmoc-protected amino acids and carboxylic acid. Fmoc-L-Phe, Fmoc-L-Pro, Fmoc-cyclohexylalanine, Fmoc-L-Tyr(OtBu), phenylacetic acid were sequentially used for the intermediate (5) of 2155-14 (JC-395), while Fmoc-L-Phe, Fmoc-L-Pro, Fmoc-L-Phe, Fmoc-Tyr(OtBu), and admantylacetic acid were used for the synthesis of 2155-18 (JC-408).
After coupling reactions, the reaction solution was poured off into a disposable 24 mL polypropylene syringe fitted with a PTFE filter. The solution was drained from the syringe, and the resin was washed with DMF (6× 6 mL), and MeOH (6× 6 mL) and allowed to air-dry. The amide groups on the air-dry resin were reduced using a 40X excess of borane (1 M in tetrahydrofuran (THF)) in the round-bottomed flask under nitrogen at 65 °C for 72 h. The solution mixture was quenched with methanol (MeOH, 20 mL), and the resin was washed with THF (6× 6 mL) and MeOH (6x 6 mL) and allowed to air-dry. Then the resin was treated with piperidine (20 mL), which was stirred at 65 °C for 18 h in a glass vessel. The solution was poured off and drained from the syringe. The resin was washed with DMF (6× 6 mL) followed by MeOH (6× 6 mL) and allowed to air-dry. Completion of reduction was monitored by cleaving 10-15 beads of the resin and analyzing the cleaved product mixture using LC and MS. The resin was added to a solution of 1,1′-oxalyldiimidazole (10 equiv.) in amine-free anhydrous DMF (0.1 M) and shaken at 25 °C for 20 h. The solution was poured off and drained from the syringe, and the resin was rinsed with DMF (6× 6 mL) and MeOH (6× 6 mL). Completion of cyclization was monitored by cleaving 10-15 beads of resin and analyzing the product mixture by LC and MS. The resin was treated with a cleavage solution (12 mL) of trifluoroacetic acid (TFA): Trifluoromethanesulfonic acid (TFMSA) (9:1) for 18 h at 25 °C. After the reaction was completed, the cleavage solution was collected, and TFA was removed under the nitrogen blow. Saturated sodium bicarbonate solution (NaHCO3) was added, and the mixture was extracted with ethyl acetate (2 x 50 mL). The combined organic layers were washed with brine (30 mL), dried over anhydrous magnesium sulfate (MgSO4), and evaporated under the rotary evaporator. Final crude products were purified using preparative HPLC as described below to produce the title compound (JC-395 or JC-408) as a white powdery solid with >97% purity.
(S)-1-((R)-1-((S)-2-(((S)-6-benzyl-2,3-dioxopiperazin-1-yl)methyl)pyrrolidin-1-yl)-3-cyclohexylpropan-2-yl)-5-(4-hydroxybenzyl)-4-phenethylpiperazine-2,3-dione TFA salt.
1H NMR (500 MHz, DMSO-d6) δ ppm 0.93 (q, J = 12.2, 13.1 Hz, 2H), 1.22 (ddt, J = 7.6, 14.9, 40.3 Hz, 5H), 1.32 – 1.43 (m, 1H), 1.54 – 1.72 (m, 4H), 1.77 (dd, J = 7.9, 16.1 Hz, 2H), 1.99 (pent, J = 7.5, 8.0 Hz, 2H), 2.29 (dq, J = 6.6, 13.3 Hz, 1H), 2.73 (tt, J = 8.0, 13.9 Hz, 2H), 2.86 (dtd, J = 5.5, 12.6, 14.9, 25.4 Hz, 4H), 2.99 (td, J = 5.6, 14.0 Hz, 2H), 3.20 (dt, J = 13.2, 21.9 Hz, 3H), 3.37 – 3.80 (m, 10H), 3.85 (q, J = 6.2 Hz, 1H), 4.01 (dd, J = 4.8, 13.9 Hz, 1H), 4.87 (d, J = 10.2 Hz, 1H), 6.72 (d, J = 8.3 Hz, 2H), 7.03 (d, J = 8.1 Hz, 2H), 7.12 – 7.45 (m, 10H), 8.64 (d, J = 5.3 Hz, 1H), 9.18 (s, 1H), 9.38 (s, 1H). 13C NMR (126 MHz, DMSO-d6) δ ppm 20.94, 25.60, 25.93, 28.05, 32.47, 33.33, 33.48, 36.50, 36.69, 37.00, 40.78, 46.14, 46.52, 48.18, 52.73, 53.80, 55.02, 58.12, 66.30, 115.33, 115.86, 118.23, 126.37, 126.77, 126.94, 128.45, 128.59, 129.29, 129.87, 137.01, 138.84, 155.83, 156.16, 156.86, 157.56, 158.10. m/z calculated C44H56N5O5 [M+H]+ 734.4276 and observed 734.4271; m/z calculated C44H55N5O5Na [M+Na]+ 756.4095 and observed 756.4095.
Compound purification and characterization. The final compounds were purified using preparative HPLC with a dual pump Shimadzu LC-20AP system equipped with a SunFire C18 preparative column (19 x 250 mm, 10 micron) at λ = 220 nm, with a mobile phase of (A) H2O (0.1% TFA)/(B) methanol (MeOH)/acetonitrile (ACN) (3:1) (0.1% TFA), at a flow rate of 60 mL/min with 10%(B) for 30 sec, a gradient up to 90%(B) for 9.5 min, and 90%(B) for 3 min. 1H NMR and 13C NMR spectra were recorded in DMSO-d6 on a Bruker Ascend 500 MHz spectrometer at 500.13 and 125.77 MHz, respectively, and mass spectra were recorded using an Advion Mass Express. The purities of the synthesized compounds were confirmed to be greater than 97% by liquid chromatography on a Shimadzu LC-20AD instrument with SPD-20A. The mobile phase of (A) H2O (0.1% formic acid)/(B) I (0.1% formic acid) was used with a gradient of 5-95% over 7 min followed by 3 min rinse and 3 min equilibration.
Cell Lines and Culture. Primary adult melanocytes, murine melanoma B16-F10, and human melanoma cell lines A375, WM2664, and WM1366 were purchased from ATCC (ATCC, Manassas, VA, USA). while the human melanoma cell line WM3918 was generously provided by Dr. Keiran S. Smalley (Moffitt Cancer Center, Tampa, FL, USA). Murine melanoma (B16-F10) and human BRAF-mutated cell lines (A375 and WM266-4) were cultured in DMEM (Dulbecco's Modified Eagle Medium), whereas WM1366 and WM3918 were cultured in RPMI-1640 (Roswell Park Memorial Institute), both obtained from Cytiva (Logan, UT, USA). The media was supplemented with 1% L-glutamine (Quality Biological, Gaithersburg, MD, USA), 1% penicillin-streptomycin solution (Corning, Manassas, VA, USA), and 5-10% fetal bovine serum (FBS) (StemXVivo, Minneapolis, MN, USA). Plasmocin prophylactic (InvivoGen, San Diego, CA, USA) was added when preparing the complete media to prevent mycoplasma contamination. Additionally, the media was filtered using a 0.1 µM filter to ensure sterility. All cells were maintained in a humidified incubator at 37°C with 95% air and 5% CO2. Once confluency reached 70%-80%, cells were passaged using TrypLE (Corning, Manassas, VA, USA) into T-25, T-75, or T-175 flasks, depending on the growth rate and the required number of cells for future experiments. A complete culture medium was used with all cell lines.
RNA sequencing (RNAseq). Primary adult melanocytes and WM266-4 human melanoma cell line were treated with 50nM of hnRNPH2 siRNA for 24 hrs after which RNA was extracted using RNAzol (Molecular Research Center) according to manufacturer instructions. 500 ng of total RNA was submitted to the NSU Genomic Core, and 50 base pair read single-end sequencing was performed using Illumina NextSeq500. All procedures were performed according to the manufacturer’s instructions. Quality control assessment was done using Illumina RNAseq pipeline to estimate genomic coverage, percent alignment and nucleotide quality. Raw reads were mapped to reference human genome (the most recent build GRCh38) using HISAT2 and STAR software. Reads for each gene aligned by HISAT2 were counted using HTSeq software. Alignment by STAR was run with the option “quantMode TranscriptomeSAM” that allowed counting of reads aligned to each gene. Raw counts from HTSeq and STAR were imported into Bioconductor/R package DESeq2, normalized and tested for differential gene expression. This analysis was done separately for the files produced by each aligner. In each analysis, we selected genes that were expressed differentially based on the criteria of False Discovery Rate (FDR) less than 10% and Fold Change more than 1.5 to either direction. Genes that showed differential expression after analysis of the files from both aligners were selected for further analysis. A list of these genes was imported into the STRING database for pathway analysis.
Western blotting for hnRNP H1 and hnRNP H2. A375, WM-266-4, and melanocyte cells were sonicated in RIPA lysis buffer containing protease inhibitors, the protein isolates were subjected to SDS-PAGE followed by transfer to nitrocellulose membrane. hnRNP H2 was detected using a rabbit polyclonal antibody (Abgent #: AP13497b; 1:3,000, in 2% milk overnight), hnRNP H1 was detected using a rabbit monoclonal antibody (abcam EPR25302-12). After washing with TBST, the membranes were treated with chemiluminescent horseradish peroxidase detection reagent (Thermo Scientific, Cat# 32209) and exposed to autoradiography film (Denville Scientific, Inc., Metuchen, NJ, USA, cat# E3018). ImageJ software (NIH, Bethesda, MD) was used to quantify the intensity of protein bands. The protein bands were normalized against loading controls (GAPDH and Actin).
Cell Viability Assay. The CellTiter-Glo (CTG) viability assay (Promega, Madison, WI, USA) was used to determine the half-maximal inhibitory concentration (IC50) values of compounds 2155-14 and 2155-18 against multiple cell lines. When cell confluency reached 50%-80%, cells were harvested and plated in a 384-well assay plate. A total of 8 µl of cell suspension (1000 cells/well) was dispensed into columns 2-12, while 8 µl of media was dispensed in the first column and row and the last column and row. The plate was covered with a metal lid and incubated at 37°C under 5% CO2 and 95% air for 24 hours. On the second day, a dose-response curve of the test compounds was prepared immediately before adding to the cells by adding 30 µl of media into columns 1, 2, and 4-13 of a 384 polypropylene source plate. A 300 µM of compound stock solutions (2155-14 /2155-18) was prepared from an initial 10 mM stock. From this compound stock (14/18), 45 µl was loaded into column 3, and a serial dilution was performed by transferring 15 µl from column 3 well into column 4, mixing thoroughly by pipetting up and down three times. This process was repeated sequentially across columns 4 to 12. Finally, 15 µl was discarded from the last well to maintain consistent volumes. Next, 4 µl of each compound dilution or control media was transferred from the polypropylene source plate to the corresponding wells in the assay plate using a multi-channel pipettor. The assay plate was then incubated for 72 hr. After incubation, 4 µl of CTG 2.0 reagent was added to each well containing medium or cell suspension. Then, cells were incubated for at least 15 min at RT in the dark. Luminescence was measured using a microplate reader (BioTek, Winooski, VT, USA). The following formula was used to calculate the percentage of cell viability:
Cell viability (%) = (100 × (raw luminescence - 0% viable control) / (100% viable control - 0% viable control)
The dose-response curve was created using GraphPad Prism using four-parameter flexible slope non-linear regression analysis.
Cell Treatment with 2155-14 and 2155-18 for nCounter Analysis. Two melanoma cell lines, A375 and WM1366, were treated with 2155-14 and 2155-18 in T-25 flasks for 24hours. The treatment concentration of each compound was determined based on its IC50 value in the viability assay for the respective cell line. For the A375 cell line, 18 µM of 2155-14 and 30 µM of 2155-18. For the WM1366 cell line, 16 µM of 2155-14 and 77 µM of 2155-18. Following treatment, RNA extraction was performed for further downstream assays.
siRNA Transfection for nCounter Assays. For genetic modulation, human cell lines were utilized, including A375 and WM266-4 (BRAF mutated), WM1366 (NRAS mutated), and WM3918 (TWT). Each cell line was seeded in two T-25 flasks using antibiotic-free regular growth media (5 mL) supplemented with FBS. Cells were incubated for 18-24 hours until reaching 60-80% confluency, as Lipofectamine RNAiMax reagent is most effective at this confluency. On the second day, the growth media in both T-25 flasks were discarded and slowly replaced at the edge of the well with 5 ml of Opti-MEM medium (Thermo Fisher Scientific, Waltham, MA, USA). The flasks were then incubated for 1 hour. During the incubation period, transfection reagents were prepared. The lyophilized hnRNPH2 siRNA duplex and control siRNA-H (Scr) (Santa Cruz Biotechnology, Dallas, Texas, USA) were resuspended in 330 µl of RNase-free water to yield a 10 µM concentration, followed by vortexing and spinning down for 10 seconds. Solution A was prepared by diluting 27. 58 µl of hnRNPH2 siRNA/Scr (final concentration: 50nM) into 250 µl of Opti-MEM medium. Solution B was prepared by diluting 17 µl of Lipofectamine RNAiMax reagent (Thermo Fisher Scientific, Waltham, MA, USA) into 250 µl of Opti-MEM medium (briefly spun before use). Solution A was added directly into solution B to dilute the transfection reagent. The solution was mixed gently by pipetting up and down, followed by vortexing and incubation for 30 minutes at RT on an orbital shaker to allow the formation of the siRNA-lipofectamine complexes. Next, the complexes were added to the cells: hnRNPH2 siRNA-lipofectamine complex to one flask and control siRNA-lipofectamine complex to the second flask. Cells were incubated for 24 hours, followed by RNA extraction.
RNA Extraction for nCounter Assays. For total RNA extraction, the miRNAeasy Mini kit was used (Qiagen, Germantown, MD, USA). After 24 hours of cell transfection, the culture medium was discarded, and the cells were washed with cold phosphate buffer saline (PBS) without calcium and magnesium (Corning, Manassas, VA, USA). Then, 700 µl of QIAzol lysis reagent was added to the flask. The adherent cells were then scraped using a cell scraper, and the resulting cell lysates were collected into Eppendorf tubes. The cell lysate was disrupted and homogenized using a 20G needle for 15 seconds, followed by incubation at RT for 5 minutes. Next, 140 µl of chloroform (Thermo Fisher Scientific, Waltham, MA) was added, mixed thoroughly to form a soapy solution, and incubated for 2-3 minutes at RT. Then, the samples were centrifuged at 12,000 x g for 15 minutes at 4°C. While centrifugation was ongoing, DNase I treatment was prepared by mixing 10 µl of DNase I (RNase-free) with 70 µl of RDD buffer (Qiagen, Germantown, MD, USA). Following centrifugation, the upper aqueous phase was transferred to a new collection tube, and 1.5 times the volume of 100% ethanol was added. The mixture was thoroughly mixed by pipetting. Then, 700 µl of the sample was transferred to the RNeasy Mini column in a 2 ml collection tube and centrifuged at 12,000 x g for 30 seconds at RT. The flow-through was discarded, and the remaining sample was processed using the same step. Next, 350 µl of buffer RWT was added to the RNeasy Mini column, followed by centrifugation at 12,000 x g for 30 seconds at RT. The flow-through was discarded. Prepared DNase was then added and incubated at RT for 15 minutes. Following DNase treatment, 350 µl of buffer RWT was added to the RNeasy Mini column, followed by centrifugation under the same conditions, and the flow-through was discarded. Subsequently, 500 µl of buffer RPE was added to the column and centrifuged under the same conditions, and the flow-through was discarded. This step was repeated using an additional 500 µl buffer RPE, but this time, the sample was centrifuged for 2 minutes, and the flow-through was discarded. Finally, the RNeasy Mini column was transferred to a new collection tube, and 33 µl of RNase-free water was added directly to the membrane. The column was centrifuged for 1 minute at 12,000 x g at RT to elute RNA. The RNA concentration was assessed using a Nanodrop (Thermo Fisher Scientific, Waltham, MA). RNA samples were stored frozen at -80°C.
NanoString Gene Expression. RNA samples were sent to the genomic core at either the NSU Center for Collaborative Research (CCR) or the Moffitt Cancer Center, where Qubit, TapeStation, and nCounter assays were performed yielding high-quality RIN scores (~ 10). 100 ng of total RNA from each sample was used to hybridize with the nCounter Elements TagSet at 67°C for 16 hours. The TagSet consists of a reporter tag and a capture tag that hybridize to the user-designed gene-specific probe A and probe B complex. After hybridization, the samples were washed and immobilized to a cartridge using the NanoString nCounter Prep Station. Cartridges were scanned in the nCounter Digital Analyzer at 280 fields of view for the high level of sensitivity. Positive NanoString spike-in controls and 5 highly invariant genes (SAR1B, YWHAB, ETFA, SPEN and SEC24C) served as internal controls for normalization between samples. The host response panel (NanoString cat# XT-HHR-12), covering 785 genes across more than 50 annotated pathways related to host response functions, was used. This panel was used for transcriptomic analysis of hnRNPH2 siRNA-treated cells (A375, WM266-4, WM1366, and WM3918) and compound-treated cells (A375 and WM1366). Data were analyzed using three software platforms: nSolver and Rosalind (NanoString, Seattle, WA) for gene expression interpretation and STRING for network analysis. The cutoff for differentially expressed genes (DEGs) was set to a fold change >1.4 for upregulated genes and < –1.4 for downregulated genes, with a p-value < 0.05. To assess specific pathway upregulation or downregulation, a proprietary Directed Global Significance Score (DGSS) was used.
Statistical Analysis. Results are expressed as mean ± SD for each experimental group, with at least three replicates per condition. Statistical comparisons between two means were conducted using an unpaired Student’s t-test, while comparisons involving more than two groups were performed using ANOVA to assess significant differences among treatment groups. Data were presented as a fold change of treatment groups compared to the control group. Statistical analyses were carried out using GraphPad Prism (San Diego, CA, USA), nSolver Analysis Software (NanoString, Seattle, WA), and Rosalind (San Diego, CA, USA), with statistical significance set at p <0.05. Gene expression data were normalized based on the expression levels of housekeeping genes. The average expression levels from replicate probes of the same gene were used to determine gene-level expression.
2. Results
Synthesis and characterization of 2155-14 and 2155-18. The desired products were synthesized by solid-phase reactions using an automated microwave-assisted peptide synthesizer, followed by multi-step reactions with conventional oil-bath heating (Scheme 1). Briefly, the CEM Liberty PRIME 2.0 system was used to prepare the key intermediate (5) using the one-pot coupling/deprotection methodology. LC analysis of the cleaved samples of the intermediate 5 showed one major single absorption at 215 nm, and its Mass spectrometry analysis showed the matched mass-to-charge ratio (m/z) with the cleaved 5 without the tBu protecting group (m/z calculated C40H50N5O6 [M+H]+ 696.38 and observed 696.65). After the structure confirmation of 5 by Mass and NMR spectrometers, five amide groups were reduced by BH3-THF, and boron coordinated with nitrogen of 6 was removed by the treatment of piperidine and heating at 65 °C for 18 h. Two 2,3-diketopiperazine units (7) were formed by the reaction of 6 with 1,1’-oxalyldiimidazole, and the product was cleaved from the resin. The crude product mixture was purified by HPLC, and the final product was characterized by 1H and 13C NMR (Figure S1A) and high-resolution mass spectrometer (HRMS) (Figure 1B). The other product 2155-18 (JC-408) was synthesized by following the same method with Fmoc-L-Phe-OH and 2-(adamantan-1-yl) acetic acid in step e and g in Scheme 1, respectively.
RNAseq of primary adult melanocytes and WM-266-4 melanoma cell line. To get insight into the role of hnRNPH2 in melanoma and melanocyte cells, we performed RNA sequencing using cells treated with siRNA targeting hnRNPH2. Treatment of primary adult melanocytes with siRNA resulted in 91 DEGs (Table S1), which did not demonstrate any biological process or pathway enrichment (Figure S1). In contrast, WM266-4 treated with hnRNPH2 siRNA had 471 DEGs (Table S1), which we analyzed using the STRING database (Figure 1A). Markov Cluster Algorithm (MCL) functional clustering revealed one main cluster (n=34 genes) (Figure 1B). Overall, there was a significant enrichment of several biological processes and molecular functions. The most enriched biological process was Defense Response to Virus (GO:0051607) (n = 21 genes, signal = 0.54, FDR = 0.0062) (Figure 1C). The most enriched molecular function was double-stranded RNA (dsRNA) binding (GO:0003725) (n = 6 genes, signal = 2.6, FDR = 2.58e-0.5) (Figure 1D).
These data suggested that the downregulation of hnRNPH2 expression leads to interferon cell signaling in melanoma but not melanocytes due to possible RNA binding/RNA helicase and oligoadenylate synthetase (OAS) activity. Previous western blot analysis has reported that hnRNPH1 and hnRNPH2 are not detected in melanocytes but are readily expressed in WM266-4 [7] and A375 melanoma cells (Figure 2A). To further investigate the correlation between hnRNPH1 and hnRNPH2 expression and melanoma, we compared their expression levels in melanoma cell lines and melanocytes from NanoString gene expression analysis. The results revealed that hnRNPH1 and hnRNPH2 gene expression levels were significantly lower in melanocytes compared to melanoma cell lines (Figure 2B). These findings suggest that the lack of effect of hnRNPH2 siRNA on melanocytes is due to the low expression of hnRNPH2 mRNA and protein. Additionally, it is also possible that the hnRNPH2 in melanoma cells interacts with a different repertoire of client pre-mRNAs than in melanocytes.
Melanoma Cell Lines Following hnRNPH2 siRNA-mediated knockdown. To determine whether IFN signaling induction by hnRNPH2 siRNA treatment is also observed in other melanoma cell lines, we also included A375, WM266-4 (BRAF mutant), WM1366 (NRAS mutant), and WM3918 (triple-wild type, TWT) in our experiments. Gene expression profiling was performed using nCounter (NanoString)’s Host Immune Response curated panel covering a range of 785 genes from multiple immune signaling pathways [18]. Rosalind software was utilized to analyze NanoString data and interpret the large number of DEGs. Knockdown of hnRNPH2 using siRNA produced comparable effects in BRAF mutant cell lines, with A375 exhibiting 29 DEGs (18 upregulated, 11 downregulated genes, Table S2) and WM266-4 showing 14 DEGs (6 upregulated, 8 downregulated genes, Table S3). Remarkably, hnRNPH2 knockdown in WM1366 (NRAS mutated) resulted in the highest number of DEGs, totaling 82 (Table S4). In contrast, WM3918 (TWT) demonstrated the lowest DEGs count, with only 12 genes affected (4 upregulated, 8 downregulated genes, Table S5). Heatmap analysis of the four melanoma cell lines demonstrated distinct clustering of gene expression profiles between treated and control samples (Figure 3).
To investigate the biological pathways impacted by hnRNPH2 siRNA treatment, DEGs were annotated using the NanoString nCounter analysis system. Directed global significance scores (DGSS) were calculated to assess differential expression's overall strength and direction within key biological processes. The processes were categorized into the five primary functions of the host immune response, including host susceptibility, interferon response, innate immune cell activation, adaptive immune response, and homeostasis (Figure S2). Pathway enrichment analysis was conducted using Rosalind to identify significantly altered cellular processes. Directed global enrichment analysis revealed a strong activation of inflammation-associated pathways following hnRNPH2 siRNA treatment. Among the melanoma cell lines, WM1366 cells exhibited the highest scores across multiple inflammation-associated pathways, particularly those associated with interferon signaling, cytotoxicity, chemokine signaling, tissue stress response, and TNF signaling. hnRNPH2 siRNA treatment of WM266-4 and WM3918 cell lines had a minimal effect, and the affected pathways were mostly downregulated (Figure 4). A375 (BRAF mutant) and WM1366 displayed upregulation of Interferon Signaling, while WM266-4 (BRAF mutant) and WM3918 (TWT) exhibited limited effects. WM1366 had overall greater upregulation of the Interferon Signaling phase compared to A375, with DNA Sensing, Interferon Response Genes, and Type I Interferon Signaling pathways being the most upregulated, whereas MAPK signaling pathway was the most upregulated in A375 cells (Figure 4). In the Innate Immune Activation phase, A375 response was muted compared to WM1366. A375 displayed the greatest downregulation of chemokine and IL-17 signaling, myeloid inflammation, and NK activity, and upregulation of IL-6, NF-κB, and TNF signaling. WM1366 showed the greatest upregulation of Cytotoxicity, IL-6, mononuclear cell migration, and TNF signaling pathways. Adaptive immune response phase was similarly upregulated in both A375 and WM1366 cells. Upregulation of MHC class I and II antigen presentation, T cell co-stimulation, and mononuclear cell migration was the most noteworthy in this phase. In the Homeostasis phase, A375 displayed strong upregulation of lysosomal, apoptotic, and TNF signaling, while WM1366 exhibited proteotoxic and tissue stress, and TNF signaling.
Host Immune Response Following Treatment with 2155-14 and 2155-18. Next, we treated melanoma and melanocyte cells with 2155-14 and 2155-18 to gain insight into the effect of spliceosomal binding by 2155-14 and 2155-18 on immune signaling and compare it to the effects of siRNA-mediated knockdown of H2. To select optimal concentration of either compound for these assays, we re-assessed their effect on viability of melanoma cell lines. We used CellTiter-Glo viability assay and A375, WM266-4, WM1366, WM3918, and melanocytes. Cells were treated with both compounds at final concentrations of 100, 33.33, 11.11, 3.70, 1.23, 0.41, 0.13, 0.04, 0.01, and 0.005 µM for 72 hours to assess dose-dependent effects on viability and calculate IC50 values.
Compared to the untreated control, both compounds demonstrated dose-dependent cytotoxicity across most melanoma cell lines. Compound 2155-14 significantly reduced the viability of A375 and WM266-4 (BRAF mutants) and WM1366 (NRAS mutant) cells, whereas 2155-18 exhibited greater potency against WM266-4 (Table 1 and Figure S4AB). For WM3918, the viability curve did not reach 50%, thus making the IC50 unassignable (Figure S4C). In the melanocyte viability assay, neither compound reduced viability appreciably (Figure S4D).
Since we did not observe any effect on the viability of WM3918 and melanocytes, we focused on A375 and WM1366 cells for further studies. RNA was extracted from three independently treated and untreated cells after 8 and 24 hours of treatment to capture early and intermediate gene expression responses.
NanoString analysis revealed time-dependent changes in transcription response to either 2155-14 or 2155-18 treatments, with more pronounced gene expression changes observed at 24 hours compared to the one observed at 8 hours. Due to the low gene expression changes after 8 hours of treatment, subsequent analyses focus on the 24-hour data. Treatment of A375 cells with 2155-14 resulted in 84 DEGs (77 upregulated, 7 downregulated genes) (Supplementary Table 6). In contrast, 2155-18 had a more pronounced effect on A375, leading to 263 DEGs (217 upregulated, 46 downregulated genes) (Supplementary Table 7). In WM1366 cells, 2155-14 treatment resulted in 37 DEGs (26 upregulated, 11 downregulated genes) (Supplementary Table 8). Meanwhile, treatment with 2155-18 induced 306 DEGs, with 244 upregulated and 62 downregulated genes (Supplementary Table 9). Heat map analysis demonstrated distinct clustering of gene expression profiles between treated and control samples, highlighting clear transcriptional alterations induced by each compound. The heatmap displayed an upper cluster dominated by upregulated genes in treated samples, whereas genes in the lower cluster were predominantly downregulated. However, the degree of differential expression varied between the cell lines and compounds, with 2155-18 producing greater gene expression perturbation as compared to 2155-14 and siRNA (Figure 5 and Figure 6).
Directed global enrichment analysis in A375 melanoma cells revealed that treatment with 2155-14 and 2155-18 activated more signaling pathways compared to hnRNPH2 siRNA treatment. Among the two compounds, 2155-18 activated more pathways compared to 2155-14. The top enriched pathways included interferon-related pathways, multiple interleukin pathways (IL-1, IL-2, IL-6, IL-17), and inflammasome activation. Additionally, MHC Class I antigen presentation, TNF signaling, proteotoxic stress, tissue stress, and autophagy were significantly upregulated following compound treatment. In contrast, TGFβ signaling was notably downregulated (Figure 7).
Similarly, directed global enrichment analysis in WM1366 cells showed that both compounds modulated immune and stress response pathways, though the magnitude and pattern of activation differed from A375. Notably, 2155-18 treatment induced a stronger upregulation of interferon response, TNF signaling, and antigen presentation pathways. Inflammasome activation and IL signaling (IL-1, IL-2, IL-6, IL-6, IL-17) were also enriched. Unlike A375, WM1366 exhibited a pronounced upregulation of oxidative and proteotoxic stress. TGF-beta signaling was also downregulated (Figure 8).
4. Discussion
The results presented in this study demonstrate the impact of 2155-14 and 2155-18, and hnRNPH2 siRNA in downregulating spliceosomal proteins hnRNPH1 and hnRNPH2 in melanoma cells. We also demonstrate that both genetic and pharmacological downregulation of the two proteins led to significant upregulation of pro-inflammatory signaling pathways, particularly those related to antigen presentation, interferon signaling pathways, interleukin regulation, apoptosis, and autophagy. Conversely, there was notable downregulation of anti-inflammatory pathways, most prominently the TGF-β signaling pathway.
The viability assays in the present study revealed differential effects of compounds 2155-14 and 2155-18 on cell viability across various melanoma cell lines, with no significant impact on cell survival observed in normal primary melanocytes. We reported previously that neither compound affects other non-malignant cell types, including those from the kidney, ovary, and brain [7]. In addition, we demonstrated no impact on several non-melanoma cancer cell lines, such as those derived from lungs, liver, and brain cancers. This selective activity highlights both a potentially safe therapeutic window and melanoma-specific effect, which are critical for future clinical applications.
The NanoString assays revealed significantly lower gene expression levels of hnRNPH1 and hnRNPH2 in untreated melanocytes compared to untreated melanoma cell lines, consistent with our group’s previous Western blot findings [7]. To our knowledge, it has not been demonstrated previously as hnRNPH1 and hnRNPH2 are believed to be expressed ubiquitously. Members of hnRNP protein family have been implicated in various aspects of tumor development and progression, including the promotion of cell proliferation, migration, and inflammatory signaling [19,20,21]. Furthermore, our group demonstrated that treating WM266-4 with 2155-14 led to a reduction in hnRNPH1 and hnRNPH2 protein levels [7]. Notably, our NanoString gene expression data from WM266-4 cells treated with 2155-14 did not show a corresponding decrease in hnRNPH1 and hnRNPH2 mRNA levels. This discrepancy between protein and mRNA levels suggests that the mechanism of action of 2155-14 may occur at the post-transcriptional level, potentially through inhibition of translation or by destabilizing the hnRNPH2 protein [22].
Among the most enriched responses following hnRNPH2 siRNA treatment were those linked to interferon signaling, cytotoxicity, chemokine signaling, tissue stress, and TNF signaling. These pathways are well known to stimulate anti-tumor immunity, inflammation, and immune surveillance, and their upregulation may reflect heightened immune responsiveness in the treated cell lines [23]. Activation of chemokine signaling suggests migrating immune cells, including NK cells, DCs, and CD8⁺ T cells, into the tumor microenvironment [24]. Following treatment of A375 and WM1366 cells with 2155-14 and 2155-18, several immune-related pathways were significantly enriched. This included interferon signaling, multiple interleukin pathways (IL-2, IL-6, IL-17), antigen presentation via MHC I, TNF signaling, PPAR signaling, and inflammasome activation. In addition to these immune pathways, we observed upregulation of stress-response mechanisms such as proteotoxic stress, oxidative stress responses, apoptosis, and autophagy. These findings are consistent with previous results from our group. Specifically, our group’s prior studies demonstrated that 2155-14 treatment led to a significant increase in late-stage apoptosis and the induction of autophagy markers in melanoma cells. Moreover, our group also reported that 2155-14 induces endoplasmic reticulum (ER) stress in melanoma, a critical component of proteotoxic stress responses [7].
Host immune response evaluation revealed notable differences in magnitude of immune activation between hnRNPH2 siRNA treatment and pharmacological compounds 2155-14 and 2155-18. The broader activation of immune-related signaling pathways observed with compound treatments, as opposed to the genetic modulation of hnRNPH2, may be attributed to several factors, such as possible polypharmacology of 2155-14 and 2155-18. We previously reported that the biotinylated version of 2155-14 pulled down several proteins (hnRNPH2 and, possibly, H1, hnRNP A2/B1, and DDX1) with relevance in pre-mRNA splicing [7]. The pharmacological effects of 2155-14 and 2155-18 treatment may be due to the binding to all these proteins (i.e., polypharmacology), which would explain the greater impact on immune signaling as compared to siRNA treatment. This result certainly warrants further exploration. Additionally, hnRNPH2 siRNA specifically targets and depletes a single mRNA, resulting in a more focused and limited downstream effect. In contrast, the small-molecule compounds may interact with multiple cellular targets, including potential unknown or off-target molecules, thereby amplifying their downstream immunomodulatory effects.
It is also worth mentioning that the observed downregulation of several immune-activating pathways likely reflects a regulatory mechanism to prevent overactivation and maintain immune equilibrium. The immune system maintains homeostasis by regulating the interplay between activating signals that promote immune responses and inhibitory mechanisms that prevent excessive or aberrant activation. This balance is crucial for proper immune function and avoiding excessive inflammatory responses [25]. Our future studies will focus on melanoma patient cell cultures carrying different mutational backgrounds.
5. Conclusions
The results of this study offer valuable insights into pharmacologic and siRNA targeting hnRNPH2 protein in melanoma cells with respect to their immunomodulatory effects in melanoma. To our knowledge, this is the first study to investigate the roles of hnRNPH2 and other RNA-binding proteins (RBPs) in melanoma immune signaling. The observed effects from targeting this protein suggest that it represents a novel molecular driver of melanoma immune response and may open avenues for therapeutic development.
Supplementary Materials
The following supporting information can be downloaded at the website of this paper posted on Preprints.org, Figure S1A title: 1H and 13C NMR spectra of JC-395. Figure S1B title: High resolution mass spectrometry analysis of JC-395. Figure S2 title: String database analysis of primary adult melanocytes treated with hnRNPH2 siRNA. Figure S3 title: Pathway annotations across the five functions of the host response. Figure S4 title: Viability assay results of 2155-14 and 2155-18 in melanoma and melanocyte cells. able S1 title: DEGs from RNAseq analysis of mRNAs from WM-266-4 and melanocyte cells treated with hnRNPH2 siRNA. Table S2 title: Results of nCounter analysis of mRNAs from A375 cells treated with hnRNPH2 siRNA using the Host Response Panel. Only DEGs are listed out of 785 genes the RNAs were analyzed against. Table S3 title: Results of nCounter analysis of mRNAs from WM-266-4 cells treated with hnRNPH2 siRNA using the Host Response Panel. Only DEGs are listed out of 785 genes the RNAs were analyzed against. Table S4 title: Results of nCounter analysis of mRNAs from WM1366 cells treated with hnRNPH2 siRNA using the Host Response Panel. Only DEGs are listed out of 785 genes the RNAs were analyzed against. Table S5 title: Results of nCounter analysis of mRNAs from WM3918 cells treated with hnRNPH2 siRNA using the Host Response Panel. Only DEGs are listed out of 785 genes the RNAs were analyzed against. Table S6 title: Results of nCounter analysis of mRNAs from A375 cells treated with 2155-14 using the Host Response Panel. Only DEGs are listed out of 785 genes the RNAs were analyzed against. Table S7 title: Results of nCounter analysis of mRNAs from A375 cells treated with 2155-18 using the Host Response Panel. Only DEGs are listed out of 785 genes the RNAs were analyzed against. Table S8 title: Results of nCounter analysis of mRNAs from WM1366 cells treated with 2155-14 using the Host Response Panel. Only DEGs are listed out of 785 genes the RNAs were analyzed against. Table S9 title: Results of nCounter analysis of mRNAs from WM1366 cells treated with 2155-18 using the Host Response Panel. Only DEGs are listed out of 785 genes the RNAs were analyzed against.
Author Contributions
DM, VB, LN, and KSMS designed the study. DM obtained funding and wrote the manuscript. MS performed the NanoString and viability studies, analyzed data, and wrote the manuscript. JD performed RNA extraction for RNAseq study. SV performed western blotting. YA performed part of the RNA isolation. LN analyzed RNAseq data. JYC co-wrote the manuscript, and SM synthesized and characterized the compounds for the study.
Funding
This work was supported by the Florida Department of Health grant #22B09 (PI – Minond) and by NIGMS/NIH S10GM154296 (PI-Choi).
Institutional Review Board Statement
Not applicable
Data Availability Statement
Not applicable
Conflicts of Interest
The authors declare no conflicts of interest.
References
- Siegel RL, Miller KD, Jemal A. Cancer statistics, 2020. CA Cancer J Clin. 2020;70(1):7-30. Epub 20200108. [CrossRef] [PubMed]
- Kao SZ, Ekwueme DU, Holman DM, Rim SH, Thomas CC, Saraiya M. Economic burden of skin cancer treatment in the USA: an analysis of the Medical Expenditure Panel Survey Data, 2012-2018. Cancer Causes Control. 2023;34(3):205-12. Epub 20221130. [CrossRef] [PubMed] [PubMed Central]
- Williams EA, Montesion M, Shah N, Sharaf R, Pavlick DC, Sokol ES, Alexander B, Venstrom J, Elvin JA, Ross JS, Williams KJ, Tse JY, Mochel MC. Melanoma with in-frame deletion of MAP2K1: a distinct molecular subtype of cutaneous melanoma mutually exclusive from BRAF, NRAS, and NF1 mutations. Mod Pathol. 2020;33(12):2397-406. Epub 20200601. [CrossRef] [PubMed] [PubMed Central]
- Long GV, Fung C, Menzies AM, Pupo GM, Carlino MS, Hyman J, Shahheydari H, Tembe V, Thompson JF, Saw RP, Howle J, Hayward NK, Johansson P, Scolyer RA, Kefford RF, Rizos H. Increased MAPK reactivation in early resistance to dabrafenib/trametinib combination therapy of BRAF-mutant metastatic melanoma. Nat Commun. 2014;5:5694. [CrossRef] [PubMed]
- Tentori L, Lacal PM, Graziani G. Challenging resistance mechanisms to therapies for metastatic melanoma. Trends Pharmacol Sci. 2013;34(12):656-66. Epub 2013/11/12. [pii]. [CrossRef] [PubMed]
- Onwuha-Ekpete L, Tack L, Knapinska A, Smith L, Kaushik G, Lavoi T, Giulianotti M, Houghten RA, Fields GB, Minond D. Novel pyrrolidine diketopiperazines selectively inhibit melanoma cells via induction of late-onset apoptosis. J Med Chem. 2014;57(4):1599-608. Epub 2014/01/30. [CrossRef] [PubMed] [PubMed Central]
- Palrasu M, Knapinska AM, Diez J, Smith L, LaVoi T, Giulianotti M, Houghten RA, Fields GB, Minond D. A Novel Probe for Spliceosomal Proteins that Induces Autophagy and Death of Melanoma Cells Reveals New Targets for Melanoma Drug Discovery. Cell Physiol Biochem. 2019;53(4):656-86. Epub 2019/10/02. [CrossRef] [PubMed]
- Alkan SA, Martincic K, Milcarek C. The hnRNPs F and H2 bind to similar sequences to influence gene expression. Biochem J. 2006;393(Pt 1):361-71. Epub 2005/09/21. [CrossRef] [PubMed] [PubMed Central]
- Huelga SC, Vu AQ, Arnold JD, Liang TY, Liu PP, Yan BY, Donohue JP, Shiue L, Hoon S, Brenner S, Ares M, Jr., Yeo GW. Integrative genome-wide analysis reveals cooperative regulation of alternative splicing by hnRNP proteins. Cell Rep. 2012;1(2):167-78. [CrossRef] [PubMed] [PubMed Central]
- Han SP, Tang YH, Smith R. Functional diversity of the hnRNPs: past, present and perspectives. Biochem J. 2010;430(3):379-92. [CrossRef] [PubMed]
- Kudinov AE, Karanicolas J, Golemis EA, Boumber Y. Musashi RNA-Binding Proteins as Cancer Drivers and Novel Therapeutic Targets. Clin Cancer Res. 2017;23(9):2143-53. Epub 20170131. [CrossRef] [PubMed] [PubMed Central]
- Satoh R. [The Molecular Basis of Drug Discovery Targeting the Regulatory Mechanism of MAPK Signaling via the Spatial Regulation of RNA-binding Proteins]. Yakugaku Zasshi. 2019;139(1):7-12. [CrossRef] [PubMed]
- Foran JM, Sanz GF, Watts JM, Brunner AM, Fossard G, Della Porta MG, Tsai XC, Garcia-Manero G, Dimicoli-Salazar S, Fletcher L, Kim YJ, Font P, Alfonso-Pierola A, Alonso-Dominguez JM, Benton C, Hong J, Malcovati L, Mazure D, Lee JH, Yeh SP, Goursaud L, Barcellini W, Wu E, Corzo D, Kuida K, Stone RM. Phase 1 first-in-human dose-expansion study of the oral SF3B1 modulator H3B-8800 in lower-risk myelodysplastic syndrome. Leuk Res. 2025;156:107735. Epub 20250609. [CrossRef] [PubMed]
- Phadke MS, Chen Z, Li J, Mohamed E, Davies MA, Smalley I, Duckett DR, Palve V, Czerniecki BJ, Forsyth PA, Noyes D, Adeegbe DO, Eroglu Z, Nguyen KT, Tsai KY, Rix U, Burd CE, Chen YA, Rodriguez PC, Smalley KSM. Targeted Therapy Given after Anti-PD-1 Leads to Prolonged Responses in Mouse Melanoma Models through Sustained Antitumor Immunity. Cancer Immunol Res. 2021;9(5):554-67. Epub 20210302. [CrossRef] [PubMed] [PubMed Central]
- Kim YJ, Kim K, Lee KH, Kim J, Jung W. Immune expression signatures as candidate prognostic biomarkers of age and gender survival differences in cutaneous melanoma. Sci Rep. 2020;10(1):12322. Epub 20200723. [CrossRef] [PubMed] [PubMed Central]
- Kitano A, Ono M, Yoshida M, Noguchi E, Shimomura A, Shimoi T, Kodaira M, Yunokawa M, Yonemori K, Shimizu C, Kinoshita T, Fujiwara Y, Tsuda H, Tamura K. Tumour-infiltrating lymphocytes are correlated with higher expression levels of PD-1 and PD-L1 in early breast cancer. ESMO Open. 2017;2(2):e000150. Epub 20170502. [CrossRef] [PubMed] [PubMed Central]
- Nirschl CJ, Suarez-Farinas M, Izar B, Prakadan S, Dannenfelser R, Tirosh I, Liu Y, Zhu Q, Devi KSP, Carroll SL, Chau D, Rezaee M, Kim TG, Huang R, Fuentes-Duculan J, Song-Zhao GX, Gulati N, Lowes MA, King SL, Quintana FJ, Lee YS, Krueger JG, Sarin KY, Yoon CH, Garraway L, Regev A, Shalek AK, Troyanskaya O, Anandasabapathy N. IFNgamma-Dependent Tissue-Immune Homeostasis Is Co-opted in the Tumor Microenvironment. Cell. 2017;170(1):127-41 e15. [CrossRef] [PubMed] [PubMed Central]
- Rezapour M, Walker SJ, Ornelles DA, Niazi MKK, McNutt PM, Atala A, Gurcan MN. Exploring the host response in infected lung organoids using NanoString technology: A statistical analysis of gene expression data. PLoS One. 2024;19(11):e0308849. Epub 20241126. [CrossRef] [PubMed] [PubMed Central]
- Han N, Li W, Zhang M. The function of the RNA-binding protein hnRNP in cancer metastasis. J Cancer Res Ther. 2013;9 Suppl:S129-34. [CrossRef] [PubMed]
- Li H, Liu J, Shen S, Dai D, Cheng S, Dong X, Sun L, Guo X. Pan-cancer analysis of alternative splicing regulator heterogeneous nuclear ribonucleoproteins (hnRNPs) family and their prognostic potential. J Cell Mol Med. 2020;24(19):11111-9. Epub 20200911. [CrossRef] [PubMed] [PubMed Central]
- Tian XY, Li J, Liu TH, Li DN, Wang JJ, Zhang H, Deng ZL, Chen FJ, Cai JP. The overexpression of AUF1 in colorectal cancer predicts a poor prognosis and promotes cancer progression by activating ERK and AKT pathways. Cancer Med. 2020;9(22):8612-23. Epub 20201005. [CrossRef] [PubMed] [PubMed Central]
- Greenbaum D, Colangelo C, Williams K, Gerstein M. Comparing protein abundance and mRNA expression levels on a genomic scale. Genome Biol. 2003;4(9):117. Epub 20030829. [CrossRef] [PubMed] [PubMed Central]
- Schreiber RD, Old LJ, Smyth MJ. Cancer immunoediting: integrating immunity's roles in cancer suppression and promotion. Science. 2011;331(6024):1565-70. [CrossRef] [PubMed]
- Kohli K, Pillarisetty VG, Kim TS. Key chemokines direct migration of immune cells in solid tumors. Cancer Gene Ther. 2022;29(1):10-21. Epub 20210218. [CrossRef] [PubMed] [PubMed Central]
- Xu R, He X, Xu J, Yu G, Wu Y. Immunometabolism: signaling pathways, homeostasis, and therapeutic targets. MedComm (2020). 2024;5(11):e789. Epub 20241103. [CrossRef] [PubMed] [PubMed Central]
Scheme 1.
Schemes for the synthesis of 2155-14 (JC-395). Reagents and Conditions: a) 20% Piperidine/DMF, 25 °C, 3 x 30 min; b) piperidine/DMF, 90 °C, 4 min, then Fmoc-L-Phe-OH/DIC/Oxyma, 90 °C, 4 min; c) piperidine/DMF, 90 °C, 4 min; d) Fmoc-L-Pro-OH/DIC/Oxyma, 90 °C, 4 min, then piperidine/DMF, 90 °C, 4 min; e) Fmoc-cyclohexylalanine-OH/DIC/Oxyma, 90 °C, 4 min, then piperidine/DMF, 90 °C, 4 min; f) Fmoc-L-Tyr(OtBu)-OH/DIC/Oxyma, 90 °C, 4 min, then piperidine/DMF, 90 °C, 4 min; g) Phenylacetic acid /DIC/Oxyma, 90 °C, 4 min; h) Borane-THF, 65 °C, 72 h; i) Piperidine, 65 °C, 18 h; j) 1,1’-Oxalyldiimidazole (10 equiv.), free amine anhydrous DMF, 25 °C, 20 h; k) TFA/TFMSA (9:1), 25 °C, 18 h; Synthetic schemes for JC-395 is present as a representative. For the synthesis of JC-408, the following amino acids and carboxylic acids were used: e) Fmoc-L-Phe-OH/DIC/Oxyma; g) 2-(adamantan-1-yl) acetic acid/DIC/Oxyma.
Scheme 1.
Schemes for the synthesis of 2155-14 (JC-395). Reagents and Conditions: a) 20% Piperidine/DMF, 25 °C, 3 x 30 min; b) piperidine/DMF, 90 °C, 4 min, then Fmoc-L-Phe-OH/DIC/Oxyma, 90 °C, 4 min; c) piperidine/DMF, 90 °C, 4 min; d) Fmoc-L-Pro-OH/DIC/Oxyma, 90 °C, 4 min, then piperidine/DMF, 90 °C, 4 min; e) Fmoc-cyclohexylalanine-OH/DIC/Oxyma, 90 °C, 4 min, then piperidine/DMF, 90 °C, 4 min; f) Fmoc-L-Tyr(OtBu)-OH/DIC/Oxyma, 90 °C, 4 min, then piperidine/DMF, 90 °C, 4 min; g) Phenylacetic acid /DIC/Oxyma, 90 °C, 4 min; h) Borane-THF, 65 °C, 72 h; i) Piperidine, 65 °C, 18 h; j) 1,1’-Oxalyldiimidazole (10 equiv.), free amine anhydrous DMF, 25 °C, 20 h; k) TFA/TFMSA (9:1), 25 °C, 18 h; Synthetic schemes for JC-395 is present as a representative. For the synthesis of JC-408, the following amino acids and carboxylic acids were used: e) Fmoc-L-Phe-OH/DIC/Oxyma; g) 2-(adamantan-1-yl) acetic acid/DIC/Oxyma.
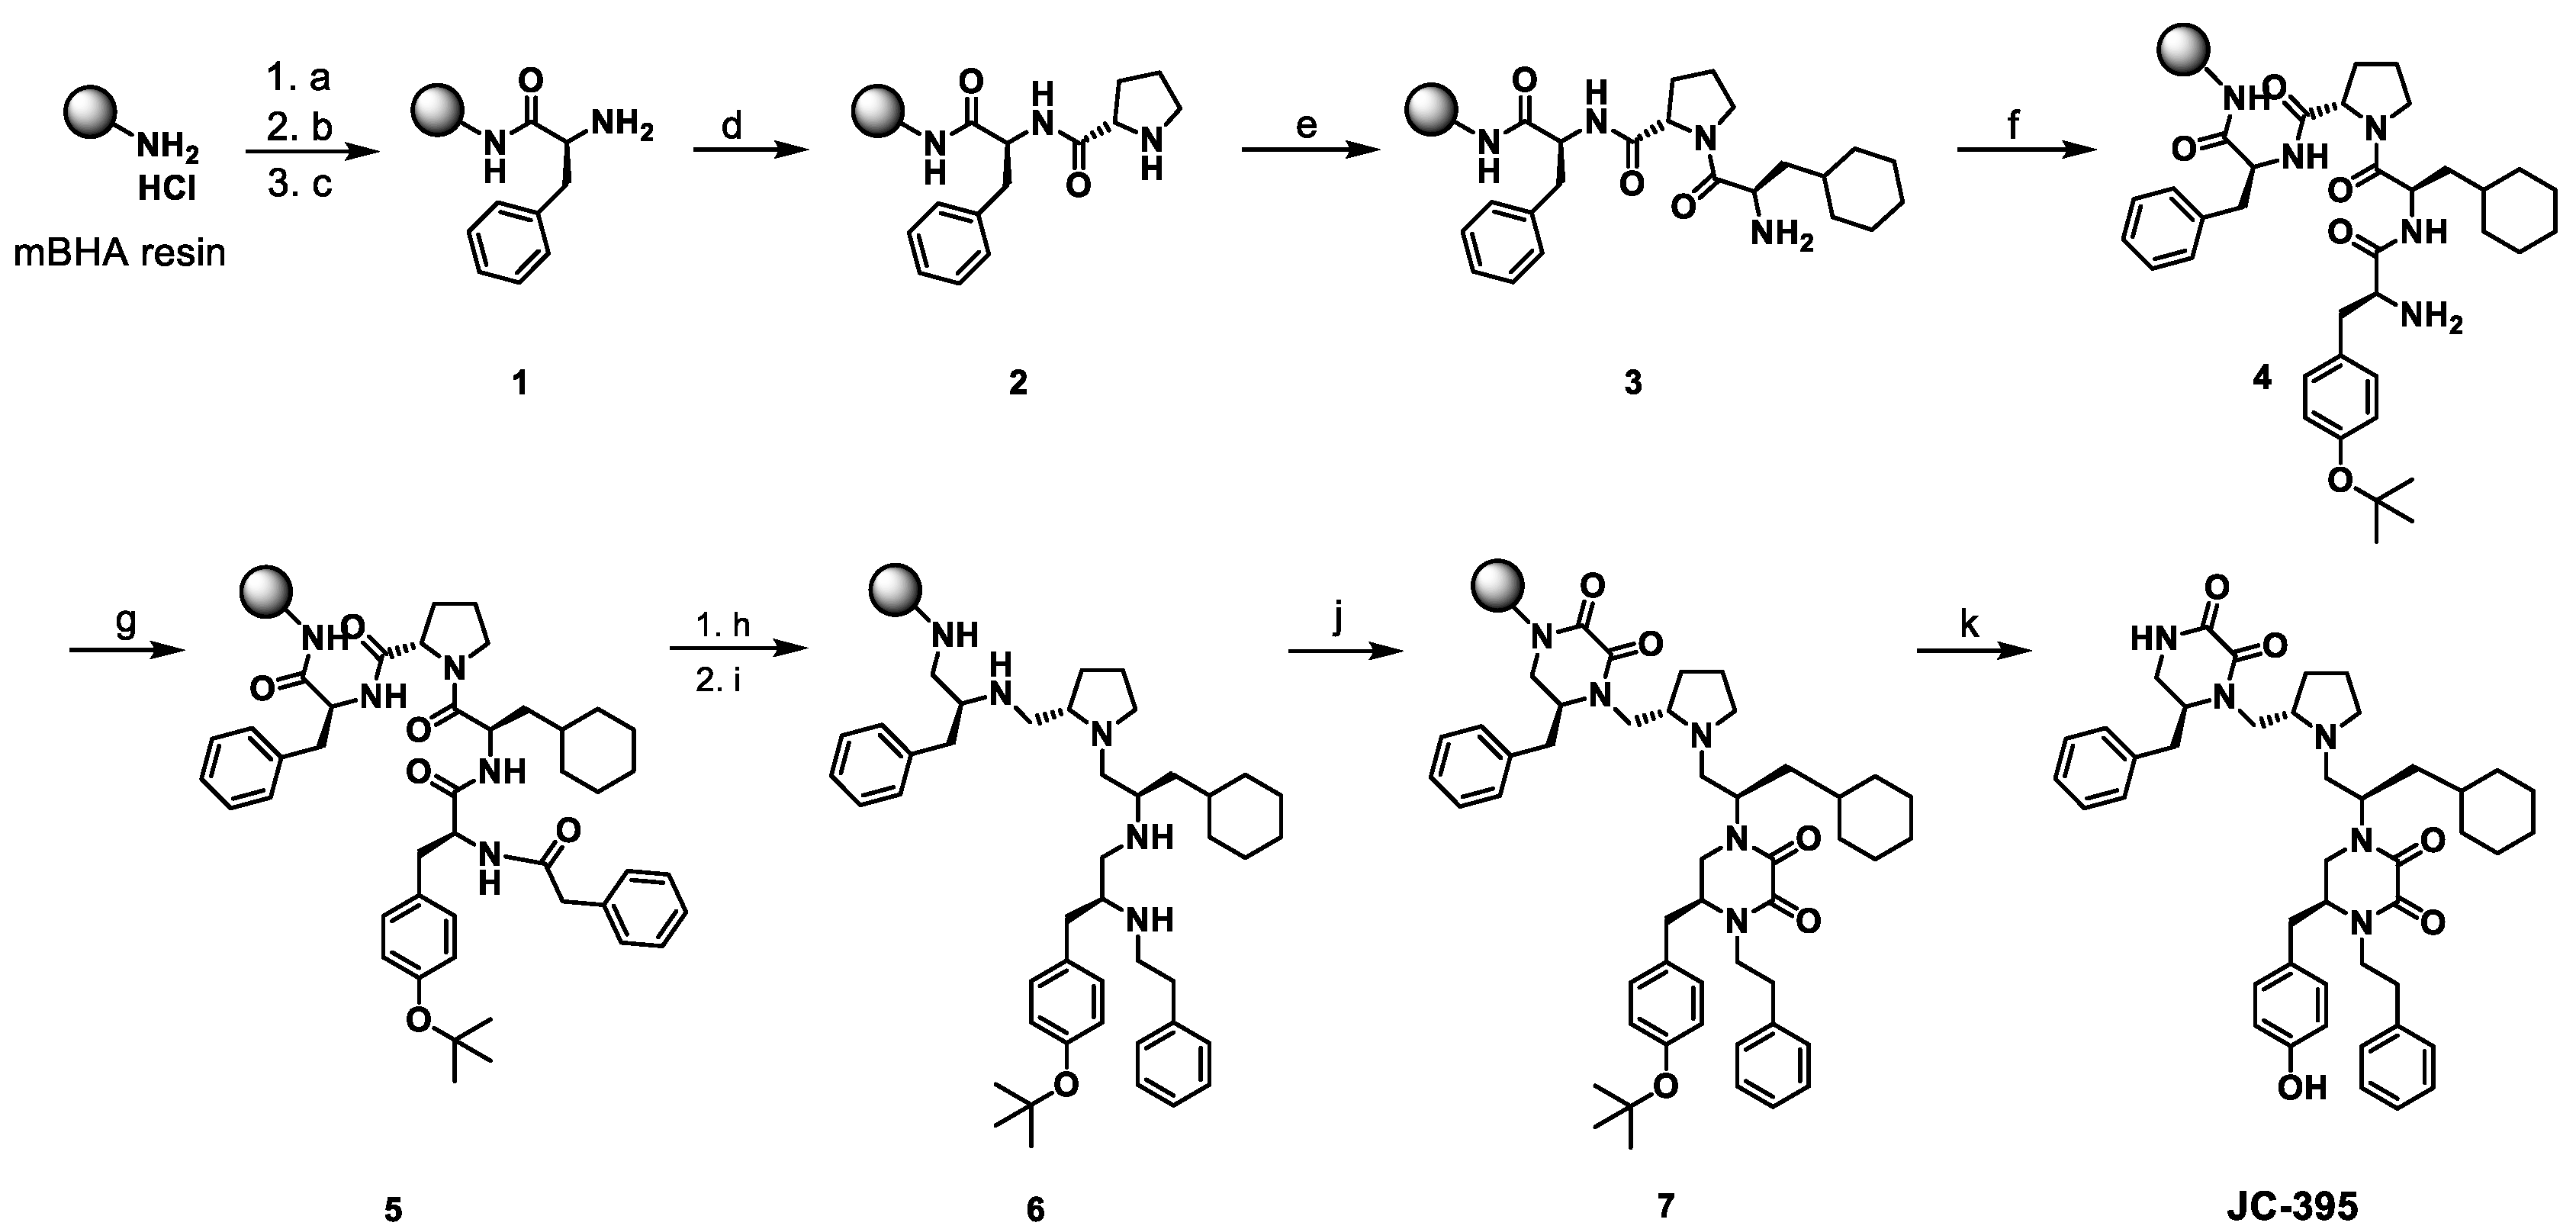
Figure 1.
Results of STRING database analysis of DEGs from WM-266-4 melanoma cells treated with hnRNPH2 siRNA. (A) DEGs show good protein-protein interactions (PPI enrichment p-value: < 1.0e-16) and good clustering using the MCL approach (avg. local clustering coefficient: 0.399). (B) The largest cluster containing 34 DEGs is enlarged for better visibility. (C) Significantly enriched biological processes. (D) Significantly enriched molecular functions.
Figure 1.
Results of STRING database analysis of DEGs from WM-266-4 melanoma cells treated with hnRNPH2 siRNA. (A) DEGs show good protein-protein interactions (PPI enrichment p-value: < 1.0e-16) and good clustering using the MCL approach (avg. local clustering coefficient: 0.399). (B) The largest cluster containing 34 DEGs is enlarged for better visibility. (C) Significantly enriched biological processes. (D) Significantly enriched molecular functions.
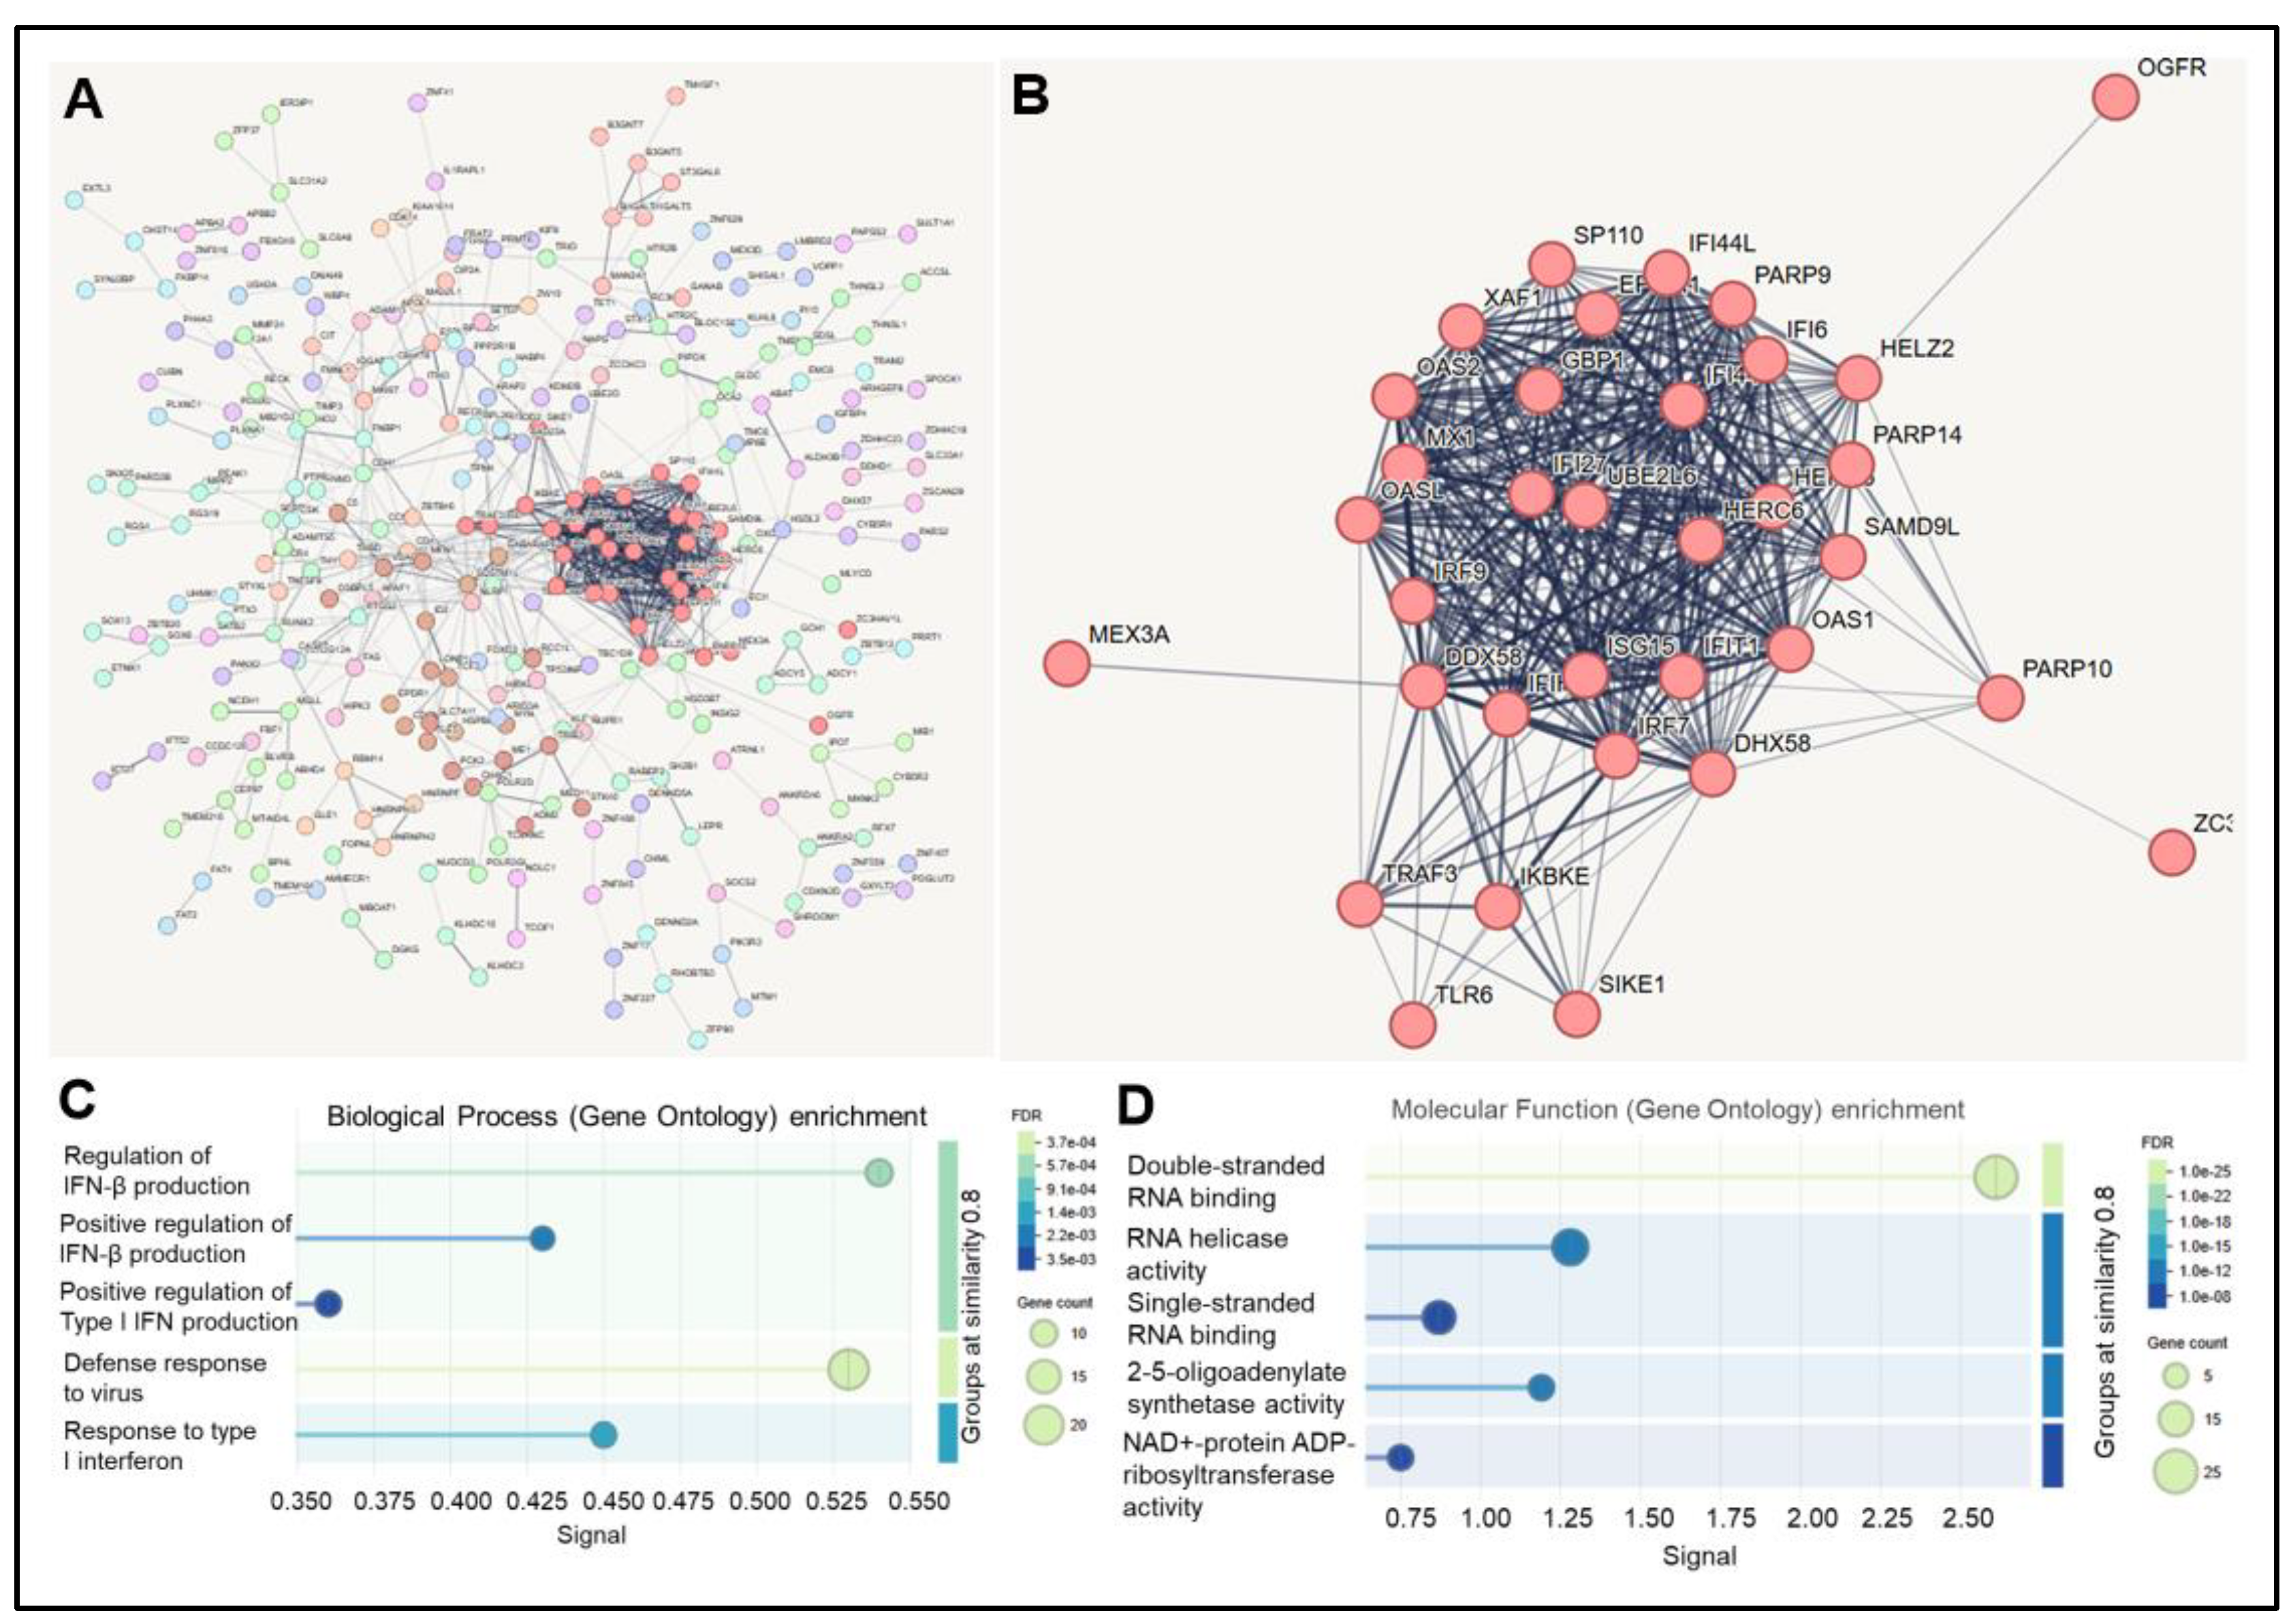
Figure 2.
Expression of hnRNPH1 and H2 in A375, melanocytes, WM1366, and WM266-4 cells. (A) Protein expression by Western blot of H1 and H2 in WM266-4, A375, and melanocytes. (B) Gene expression of hnRNPH1 and H2 in A375, melanocytes, WM1366, and WM266-4 by nCounter (NanoString Inc). One-way analysis of variance (ANOVA) was used, followed by the Dunnett post hoc test. The data shown are the mean ± SD, n=3.*** - p-value < 0.005, **** - p-value < 0.001. Adapted from: [8].
Figure 2.
Expression of hnRNPH1 and H2 in A375, melanocytes, WM1366, and WM266-4 cells. (A) Protein expression by Western blot of H1 and H2 in WM266-4, A375, and melanocytes. (B) Gene expression of hnRNPH1 and H2 in A375, melanocytes, WM1366, and WM266-4 by nCounter (NanoString Inc). One-way analysis of variance (ANOVA) was used, followed by the Dunnett post hoc test. The data shown are the mean ± SD, n=3.*** - p-value < 0.005, **** - p-value < 0.001. Adapted from: [8].
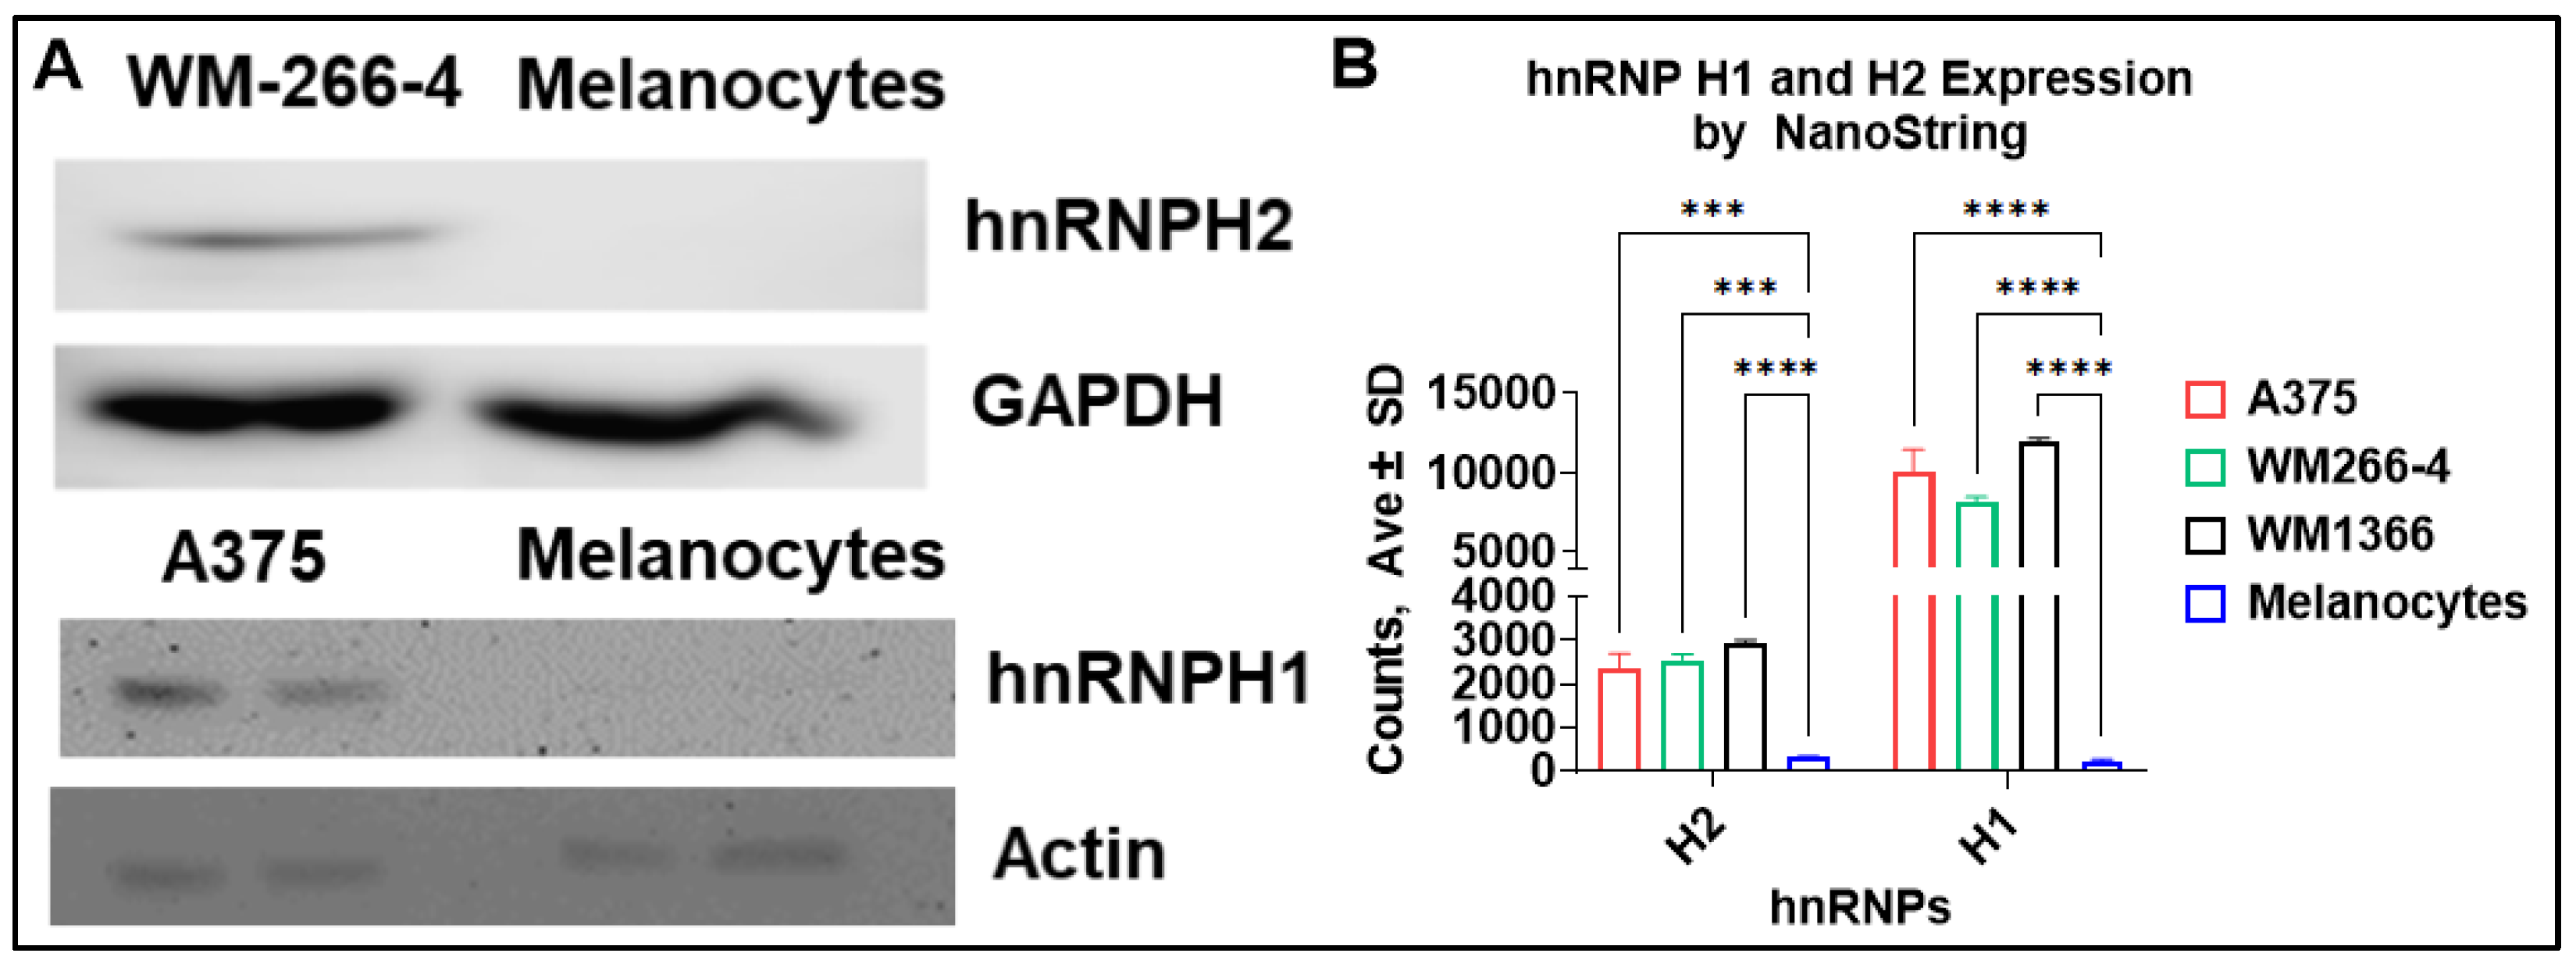
Figure 3.
Heatmap clustering of hnRNPH2 siRNA-treated cell lines compared to scrambled control (siRNA vs. Scr). Differentially expressed genes (DEGs) are shown, with upregulated genes in red and downregulated genes in blue, based on the Host Response Panel. The lists of DEGs are available in the Supplementary Material files.
Figure 3.
Heatmap clustering of hnRNPH2 siRNA-treated cell lines compared to scrambled control (siRNA vs. Scr). Differentially expressed genes (DEGs) are shown, with upregulated genes in red and downregulated genes in blue, based on the Host Response Panel. The lists of DEGs are available in the Supplementary Material files.
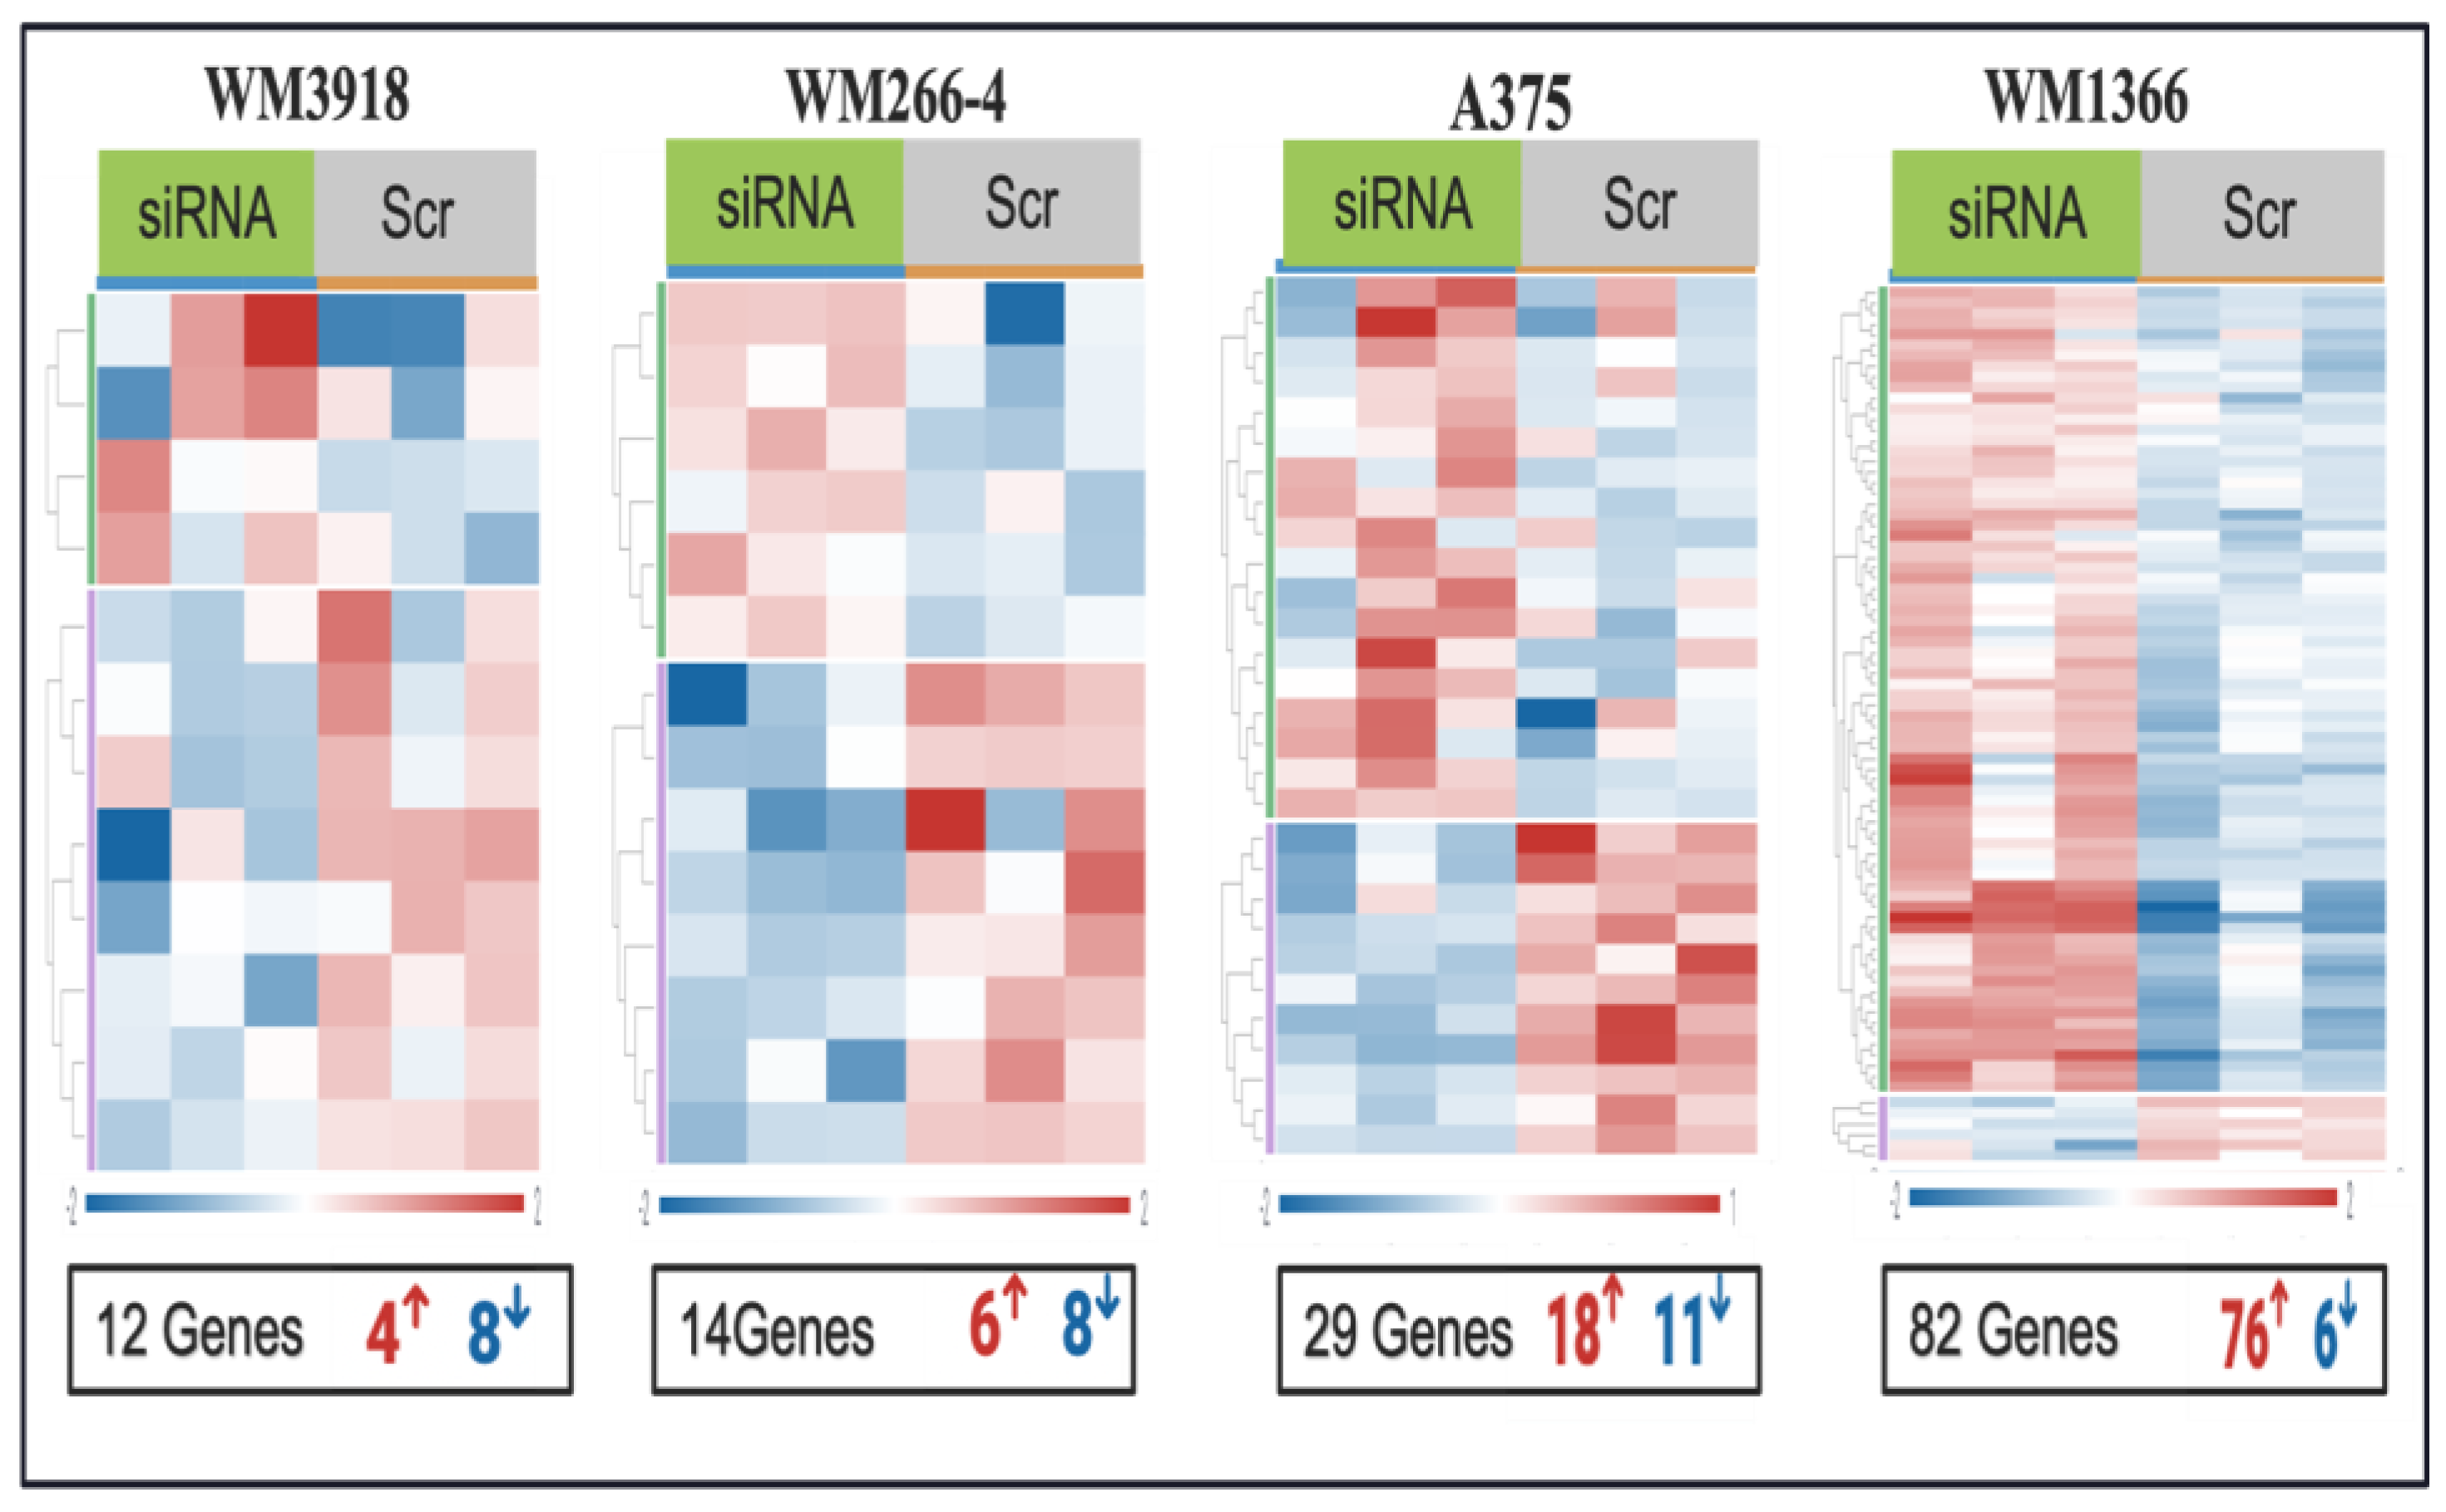
Figure 4.
NanoString-based annotation of immune signaling pathways in response to hnRNPH2 siRNA treatment across melanoma cell lines. All values represent DGSS scores. Positive values indicate pathway upregulation and negative values indicate downregulation.
Figure 4.
NanoString-based annotation of immune signaling pathways in response to hnRNPH2 siRNA treatment across melanoma cell lines. All values represent DGSS scores. Positive values indicate pathway upregulation and negative values indicate downregulation.
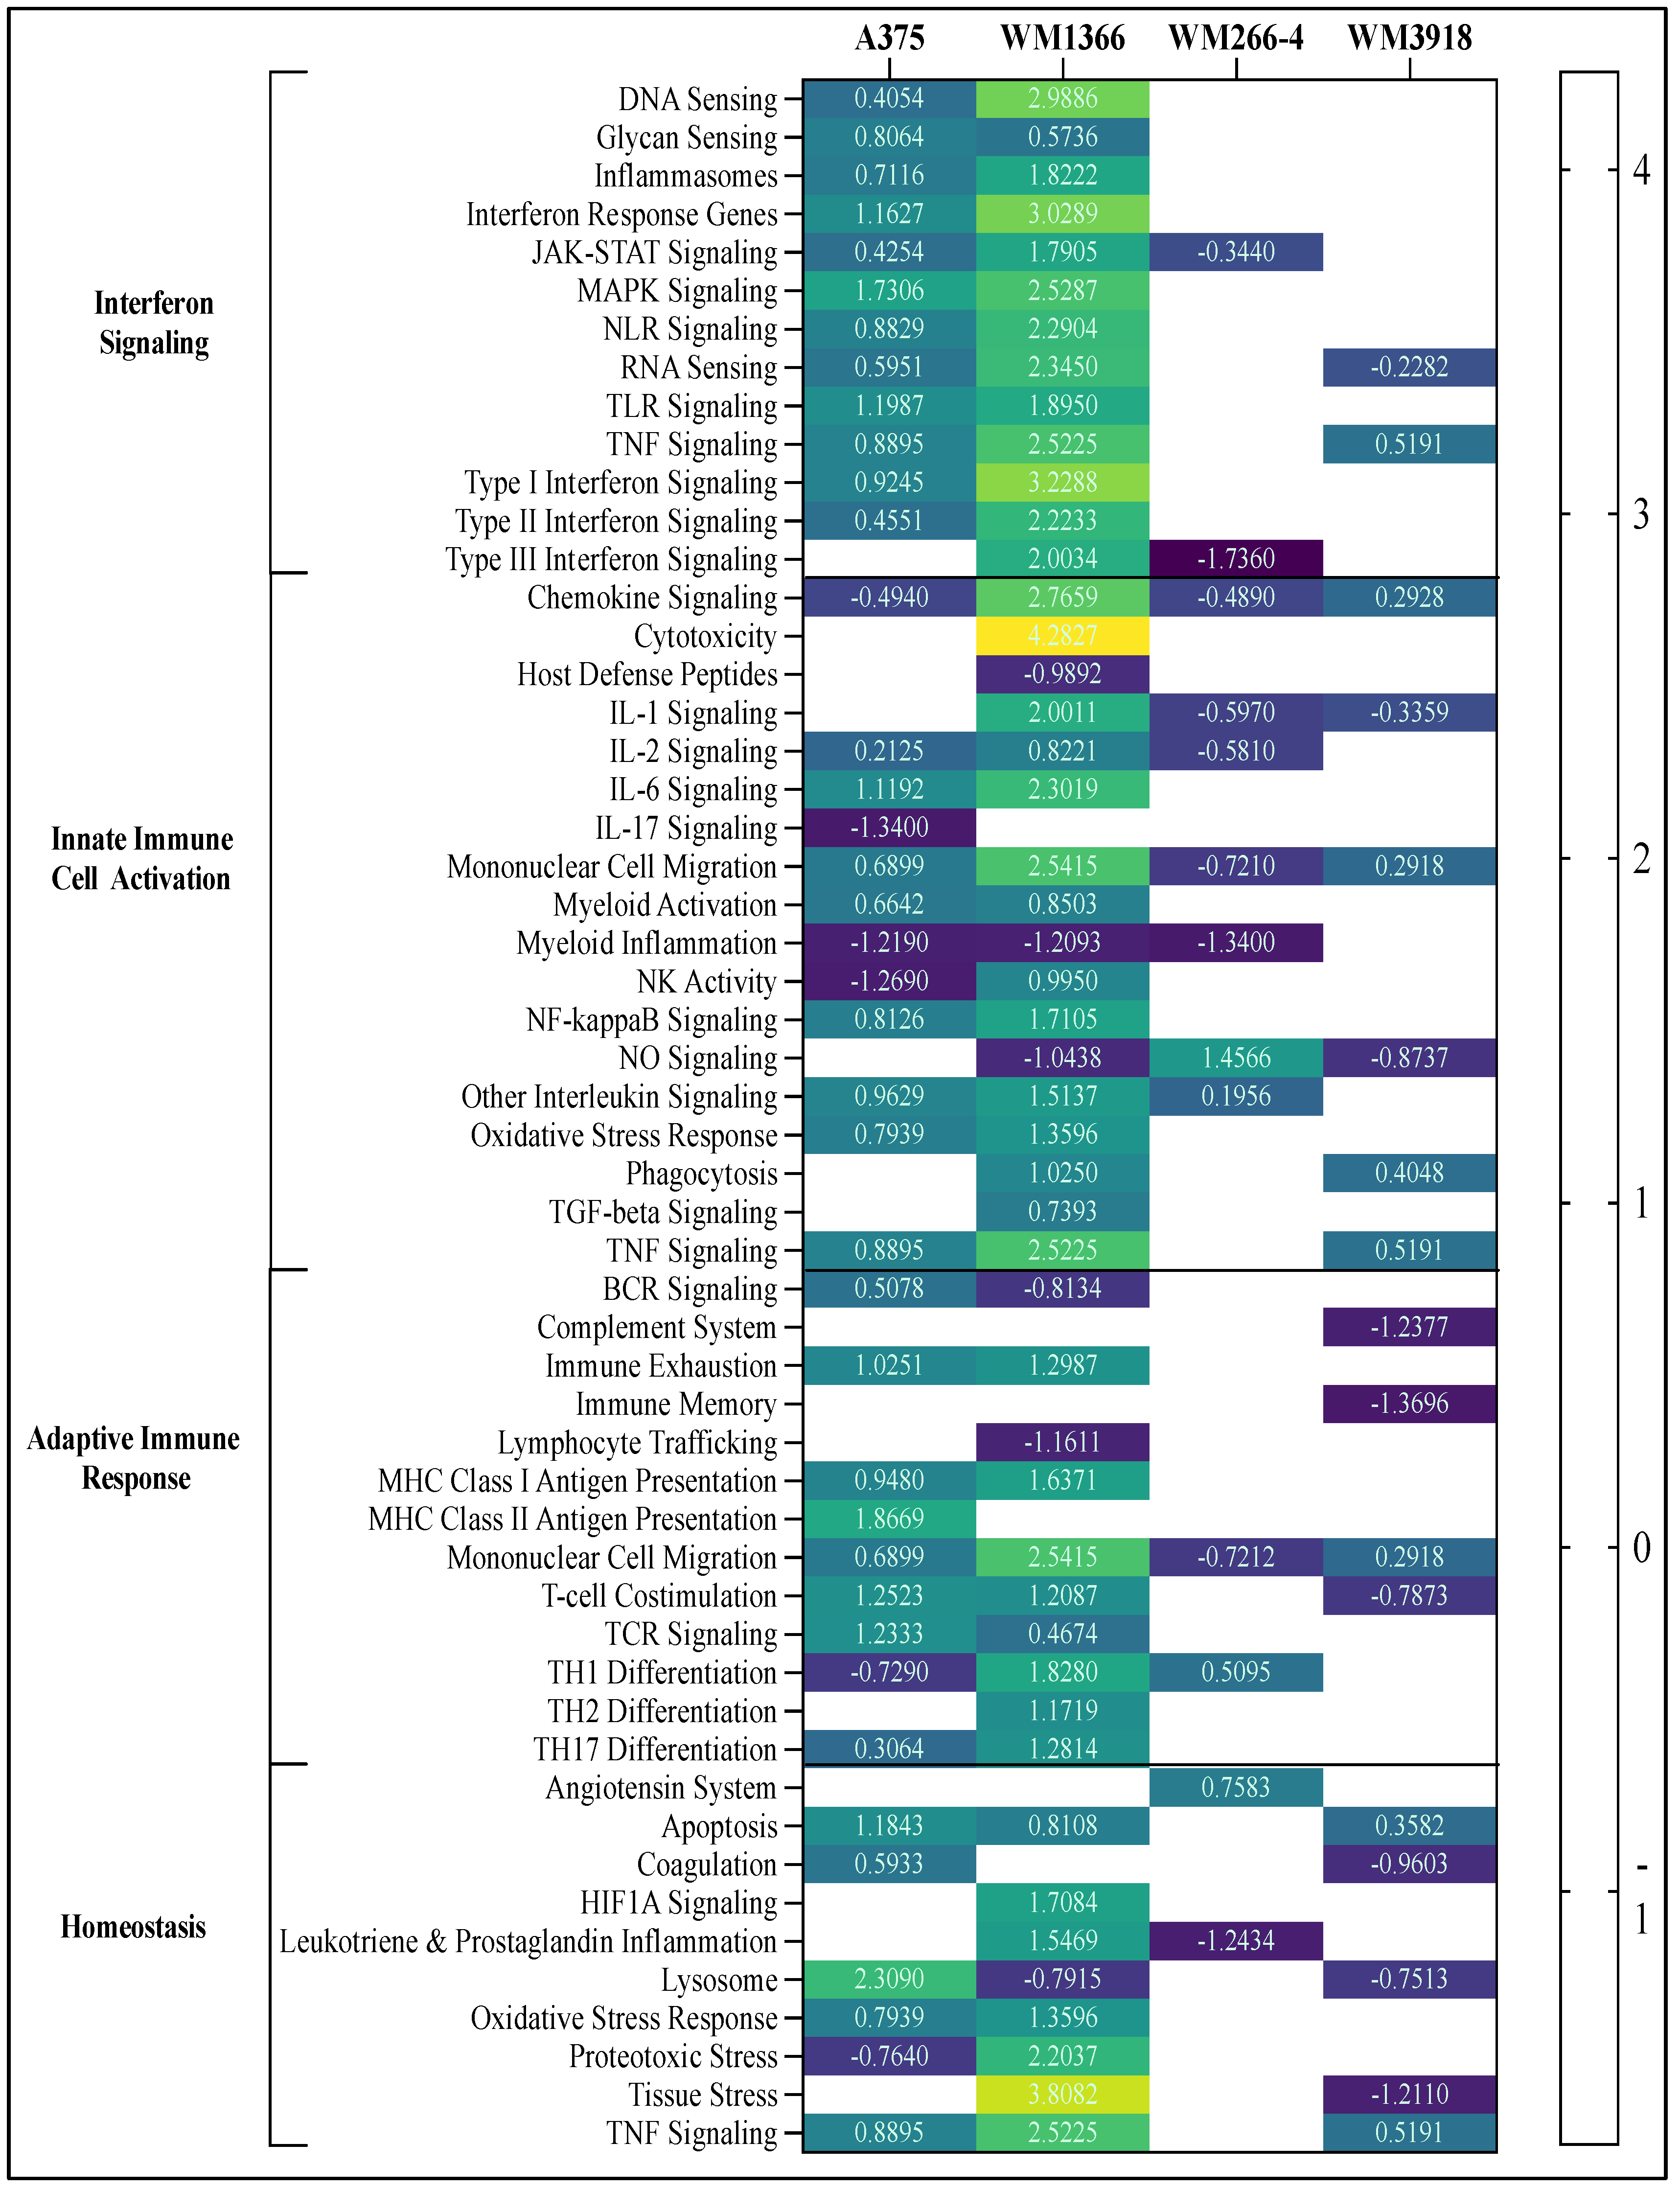
Figure 5.
Heatmap clustering of hnRNPH2 siRNA-treated A375 vs. compound-treated A375 cells. Differentially expressed genes (DEGs) are shown, with upregulated genes in red and downregulated genes in blue, based on the Host Response Panel.
Figure 5.
Heatmap clustering of hnRNPH2 siRNA-treated A375 vs. compound-treated A375 cells. Differentially expressed genes (DEGs) are shown, with upregulated genes in red and downregulated genes in blue, based on the Host Response Panel.
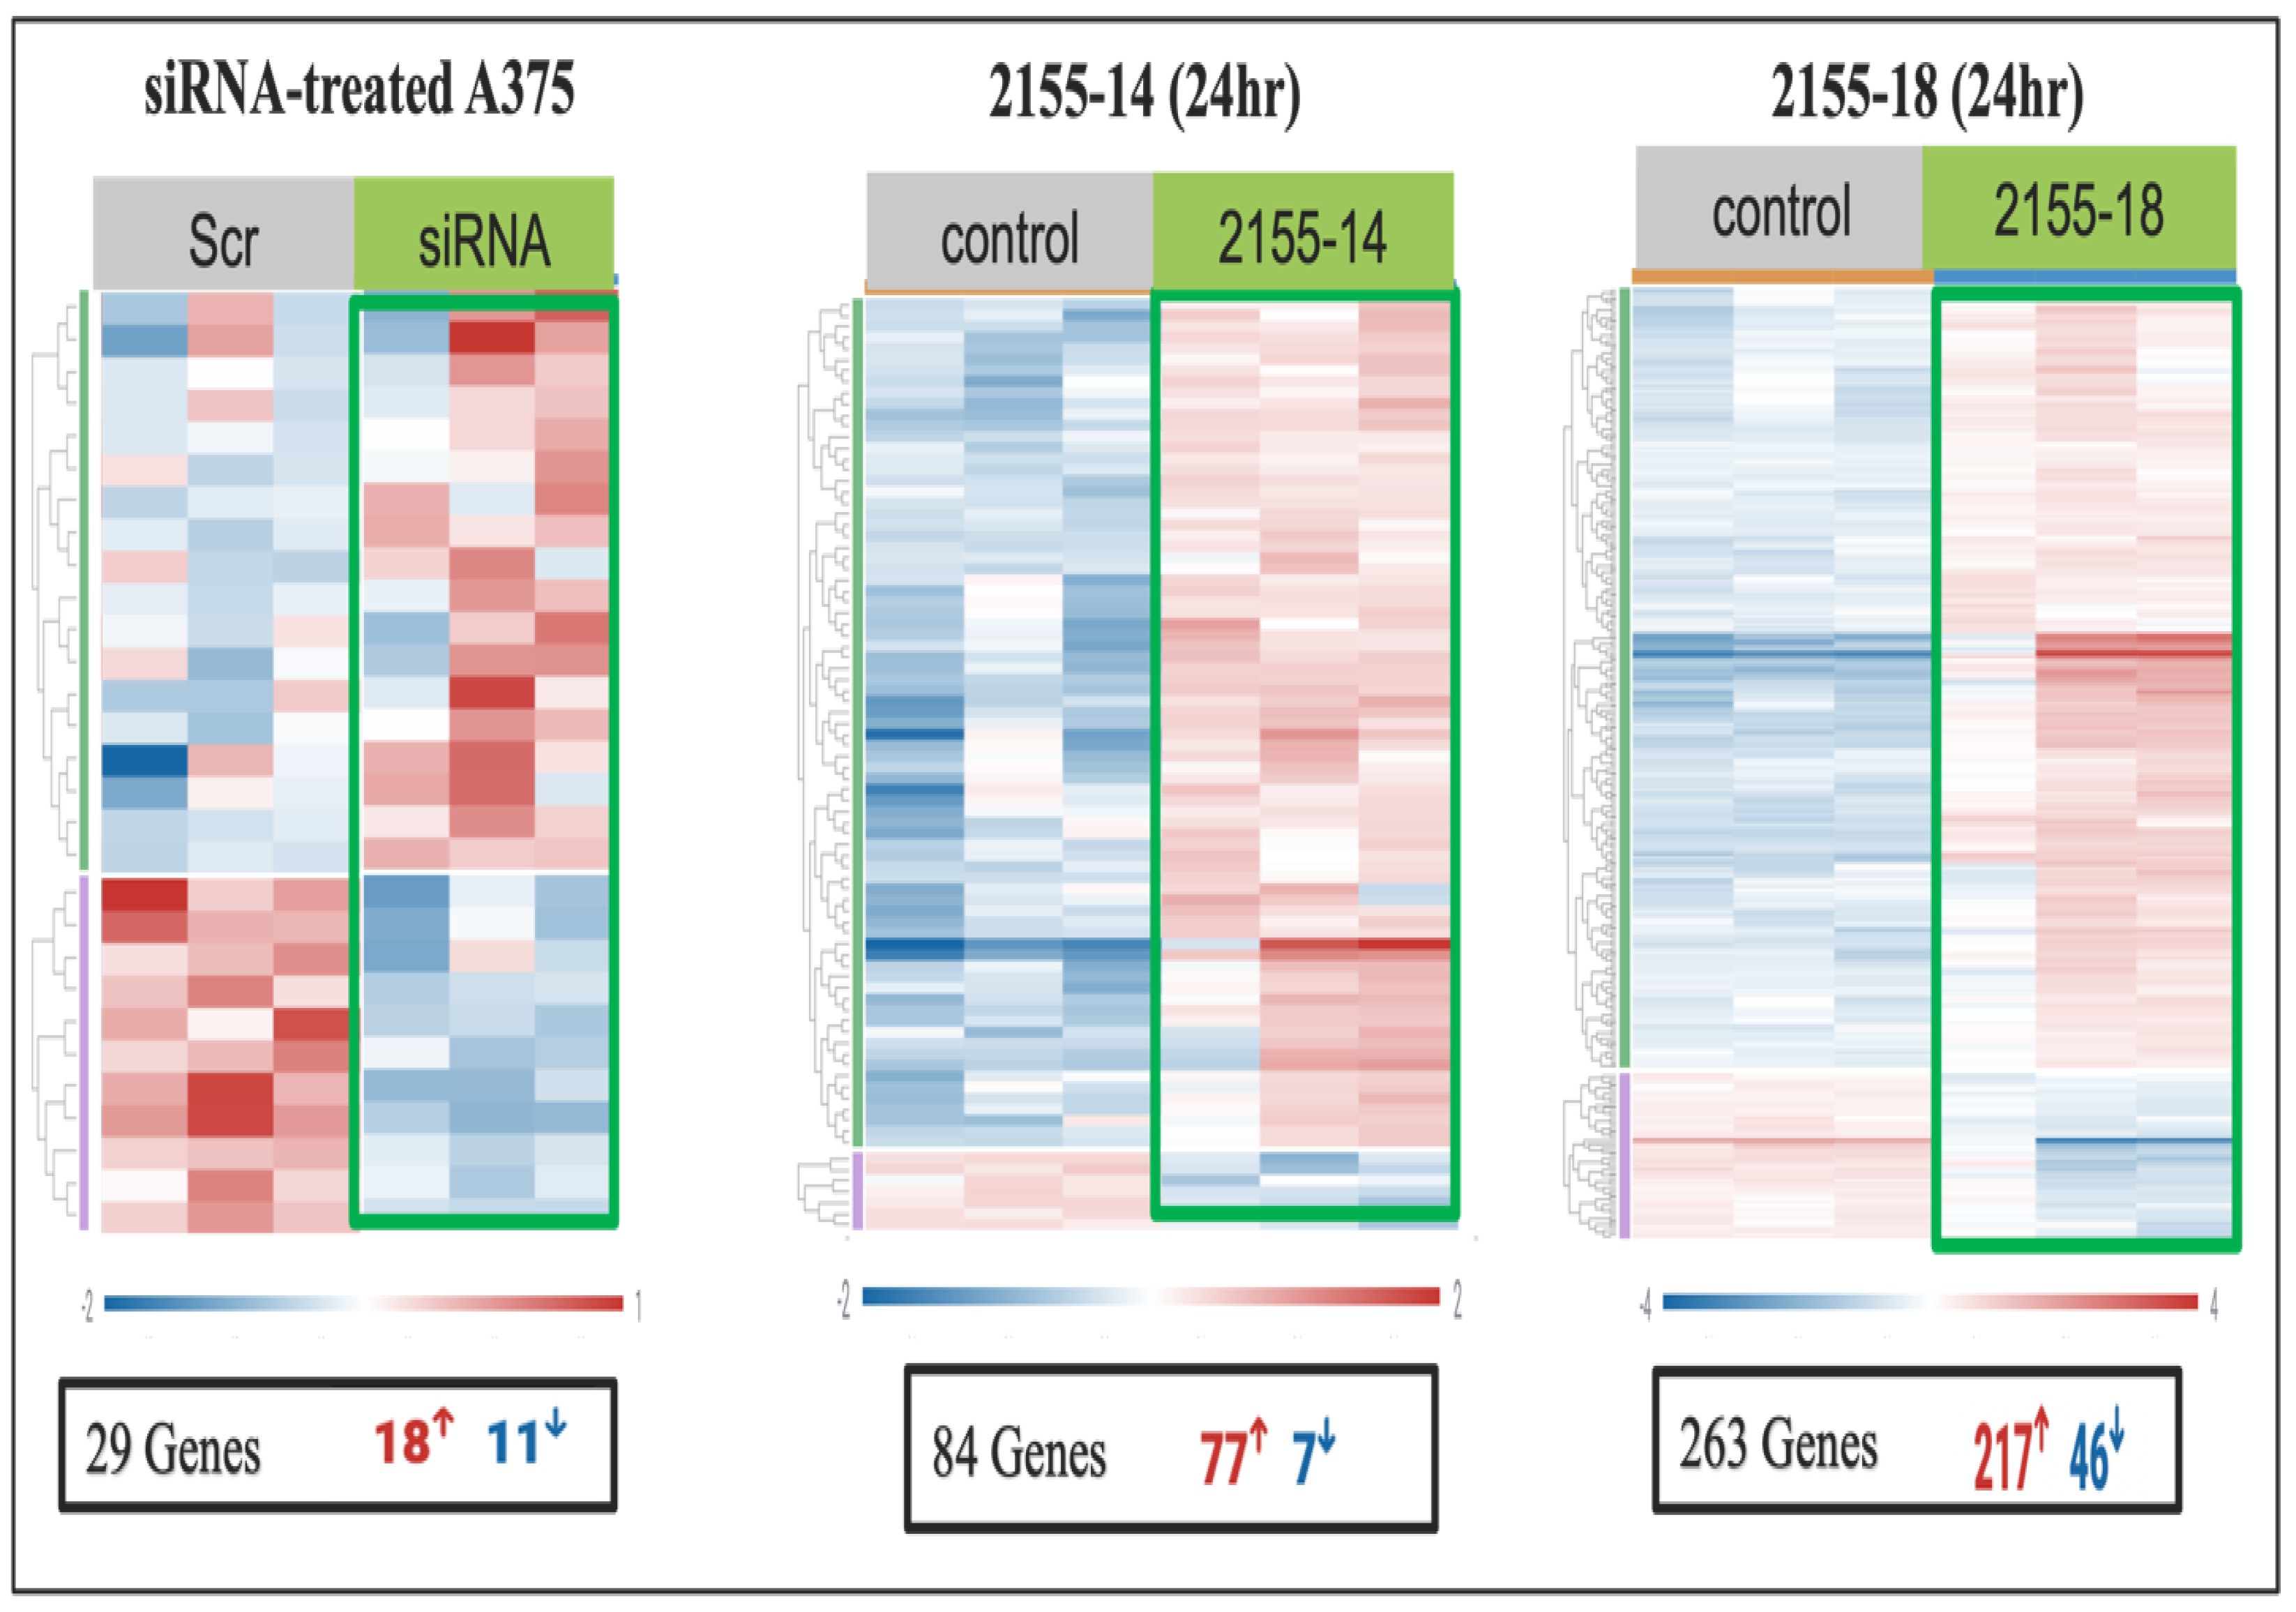
Figure 6.
Heatmap clustering of hnRNPH2 siRNA-treated vs. compound-treated WM1366 cells. Differentially expressed genes are shown, with upregulated genes in red and downregulated genes in blue, based on the Host Response Panel.
Figure 6.
Heatmap clustering of hnRNPH2 siRNA-treated vs. compound-treated WM1366 cells. Differentially expressed genes are shown, with upregulated genes in red and downregulated genes in blue, based on the Host Response Panel.
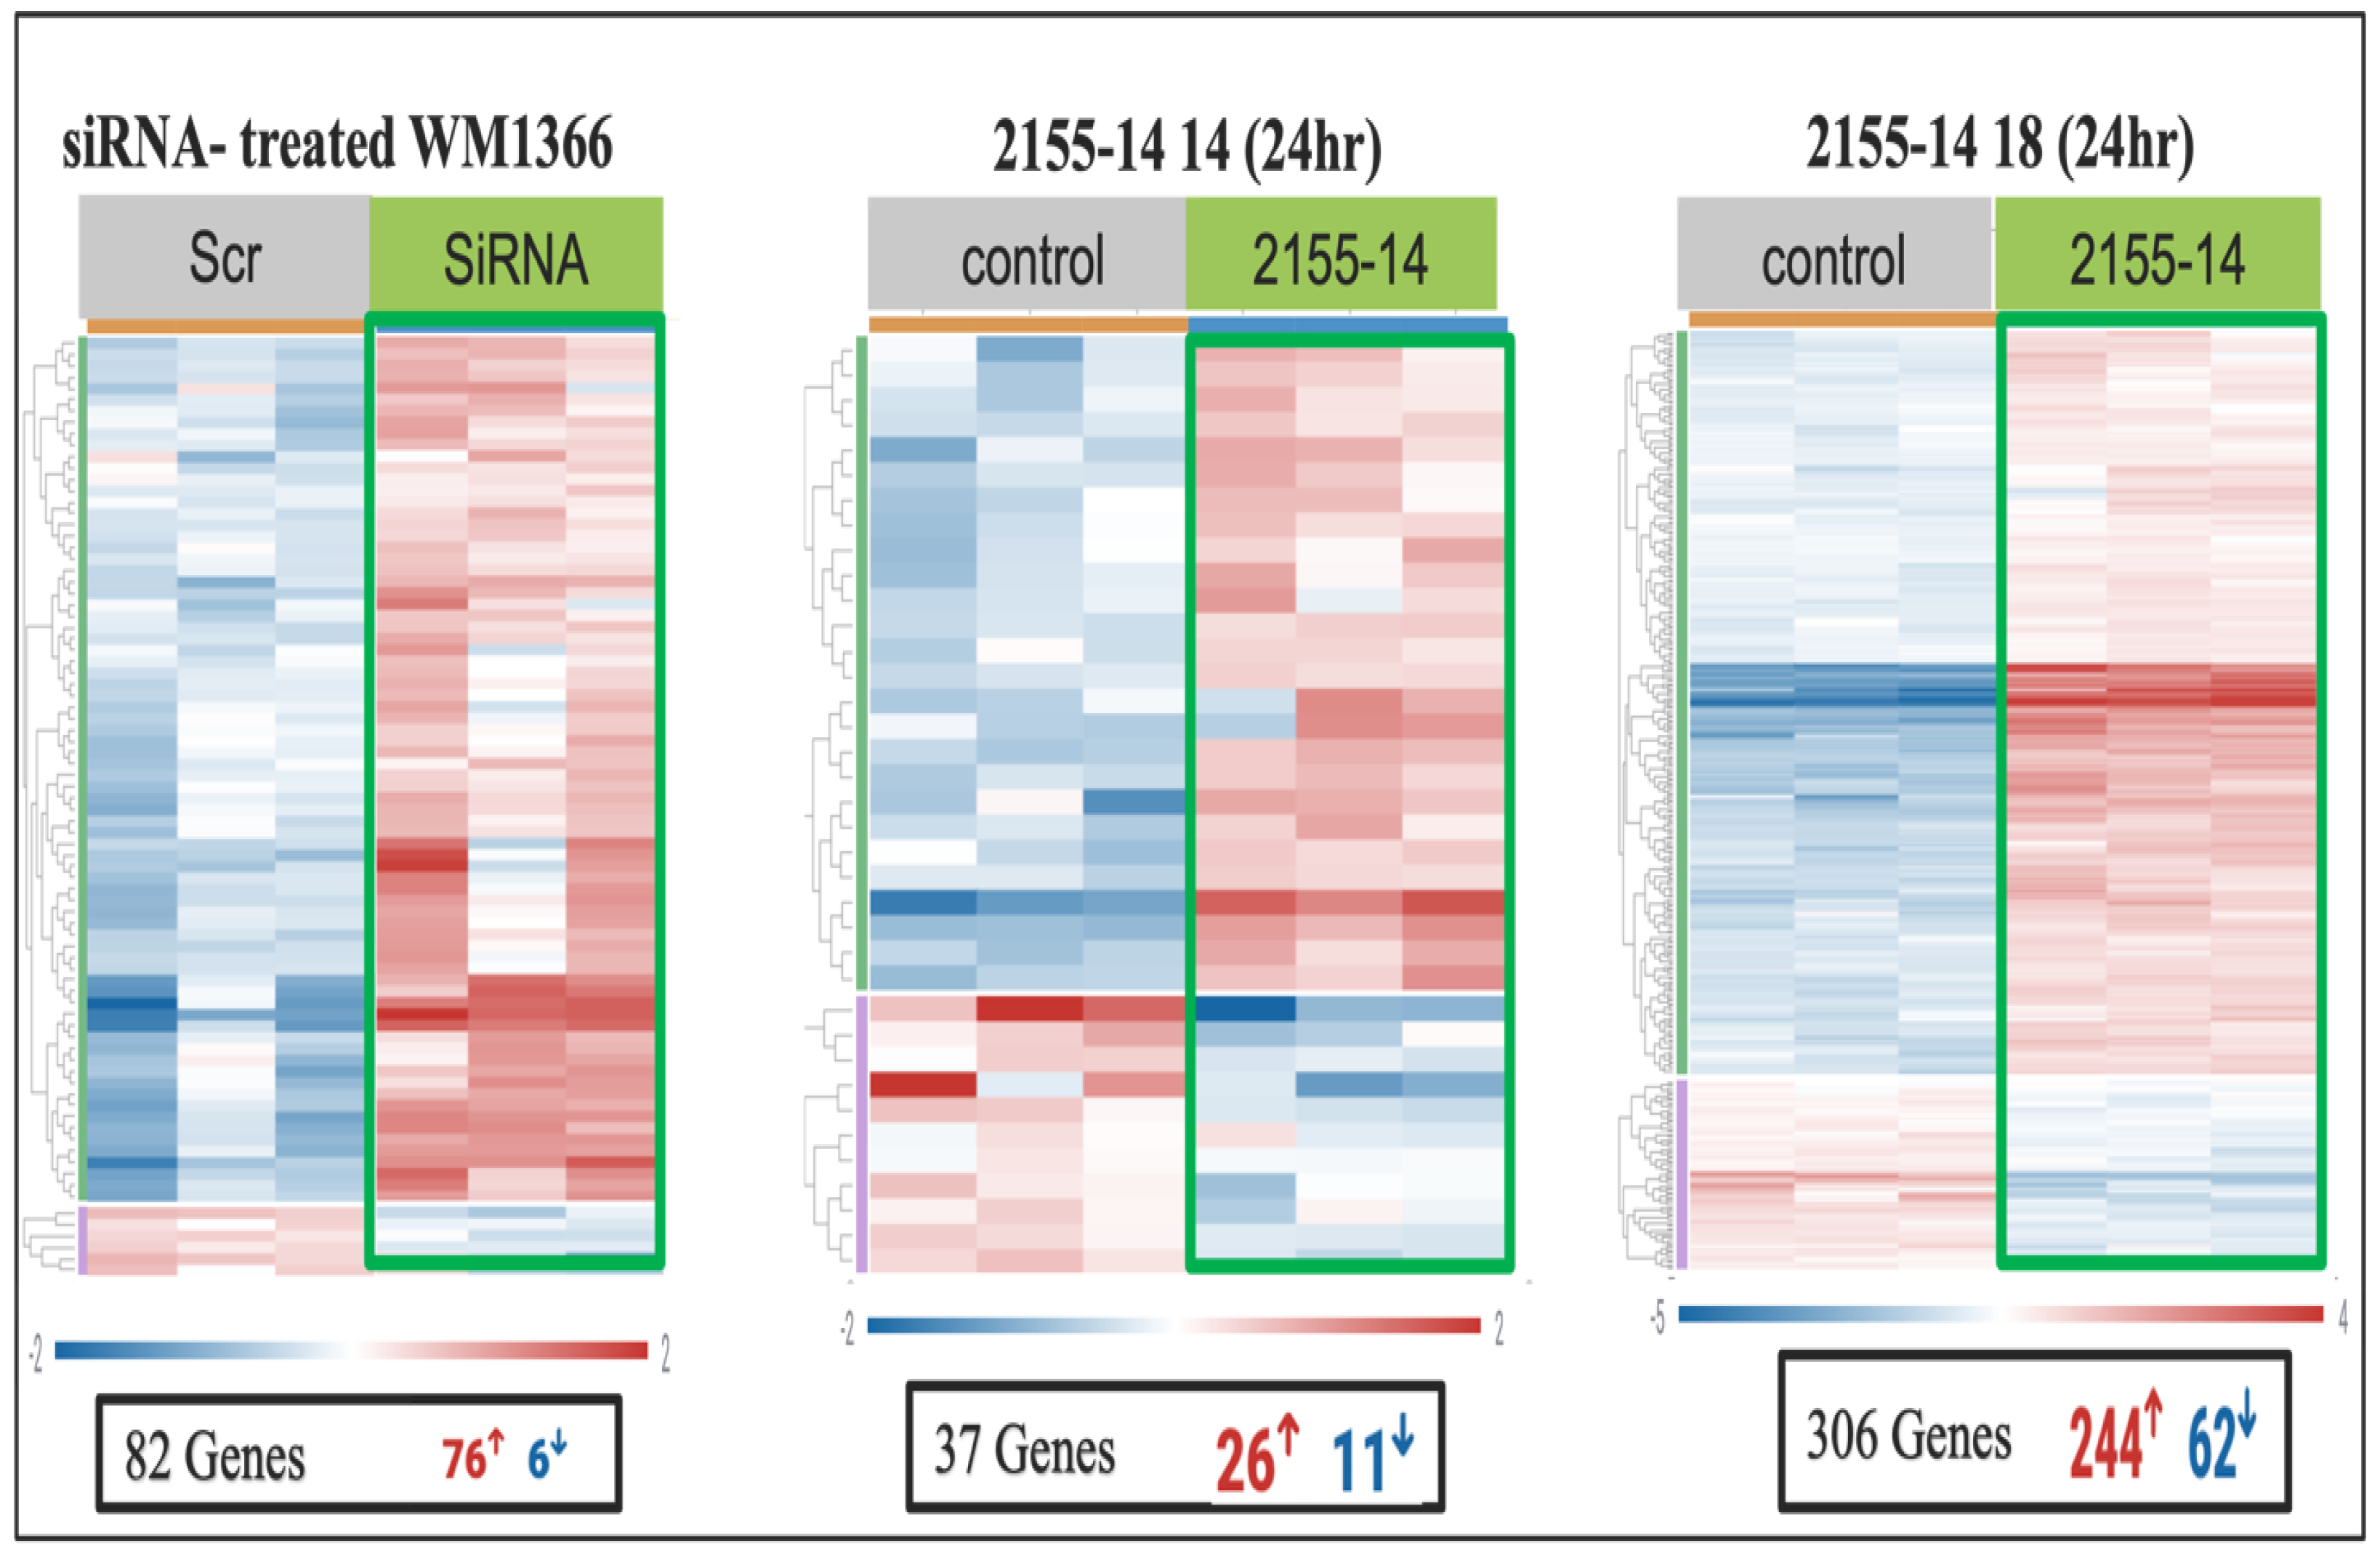
Figure 7.
NanoString-based annotation of immune signaling pathways in response to hnRNPH2 siRNA, 2155-14 and 2155-18 treatment of A375. All values represent DGSS scores.
Figure 7.
NanoString-based annotation of immune signaling pathways in response to hnRNPH2 siRNA, 2155-14 and 2155-18 treatment of A375. All values represent DGSS scores.
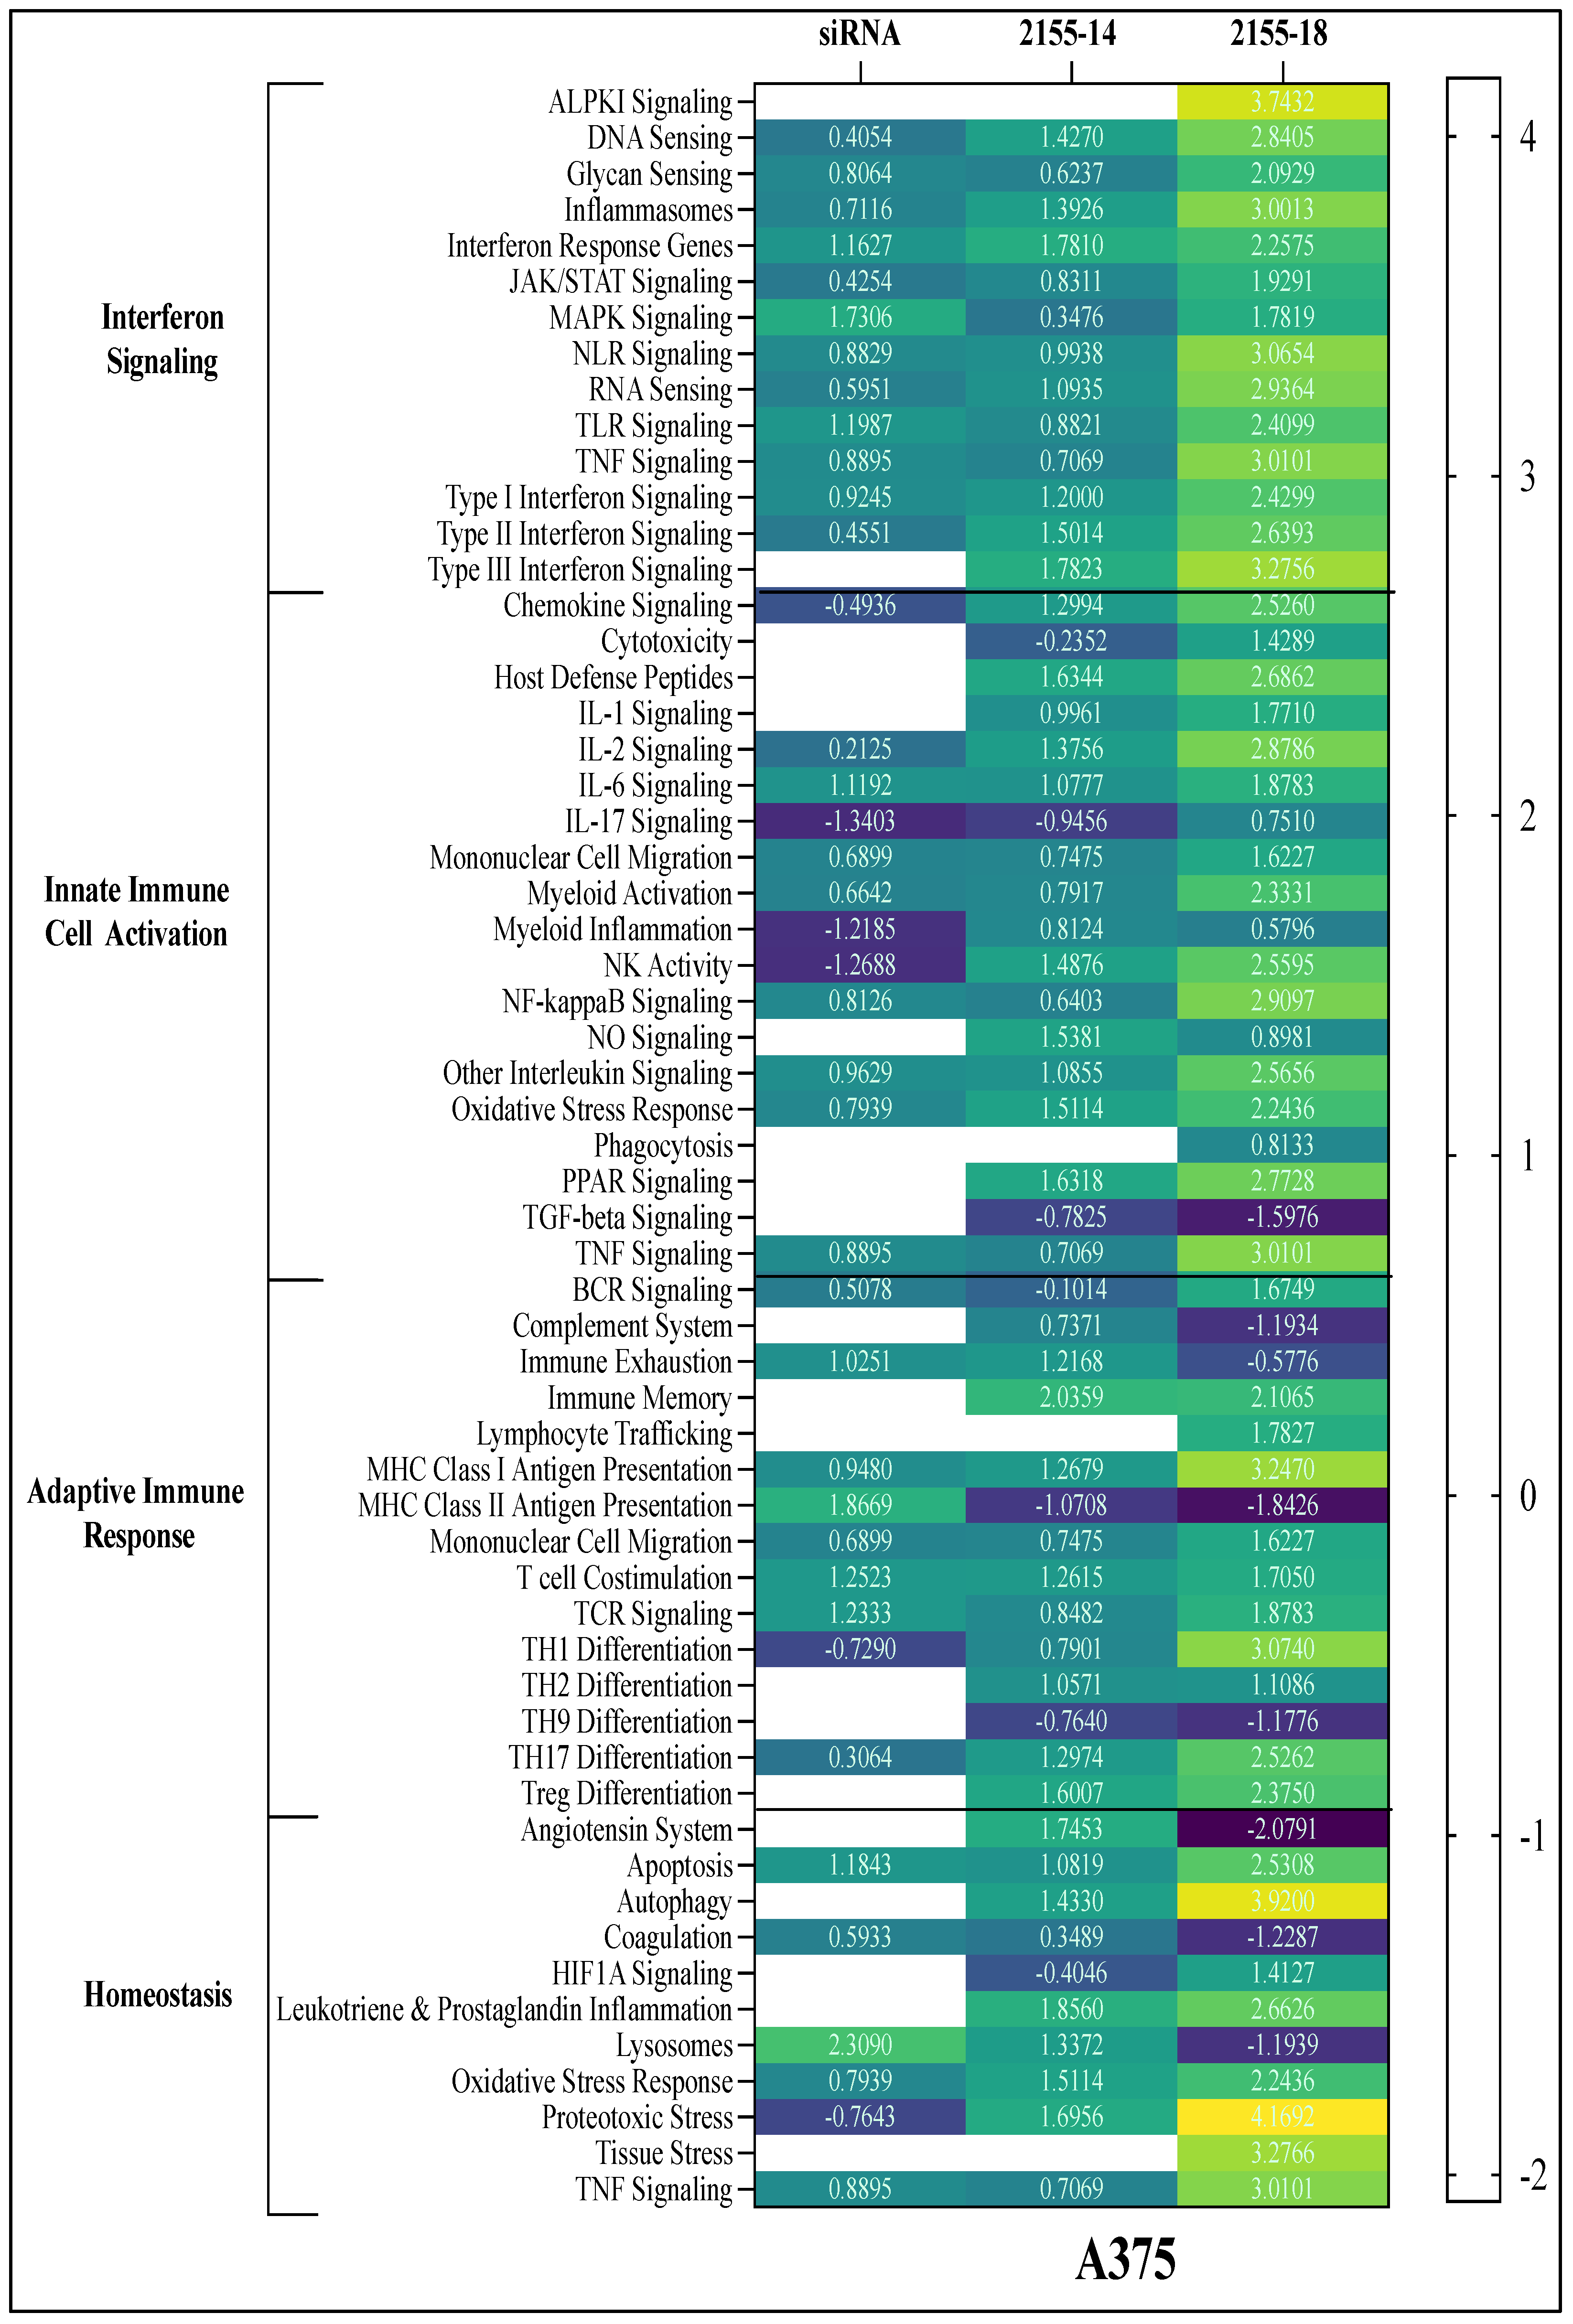
Figure 8.
NanoString-based annotation for immune signaling pathways in response to hnRNPH2 siRNA, 2155-14 and 2155-18 treatment of WM1366. All values represent DGSS scores.
Figure 8.
NanoString-based annotation for immune signaling pathways in response to hnRNPH2 siRNA, 2155-14 and 2155-18 treatment of WM1366. All values represent DGSS scores.
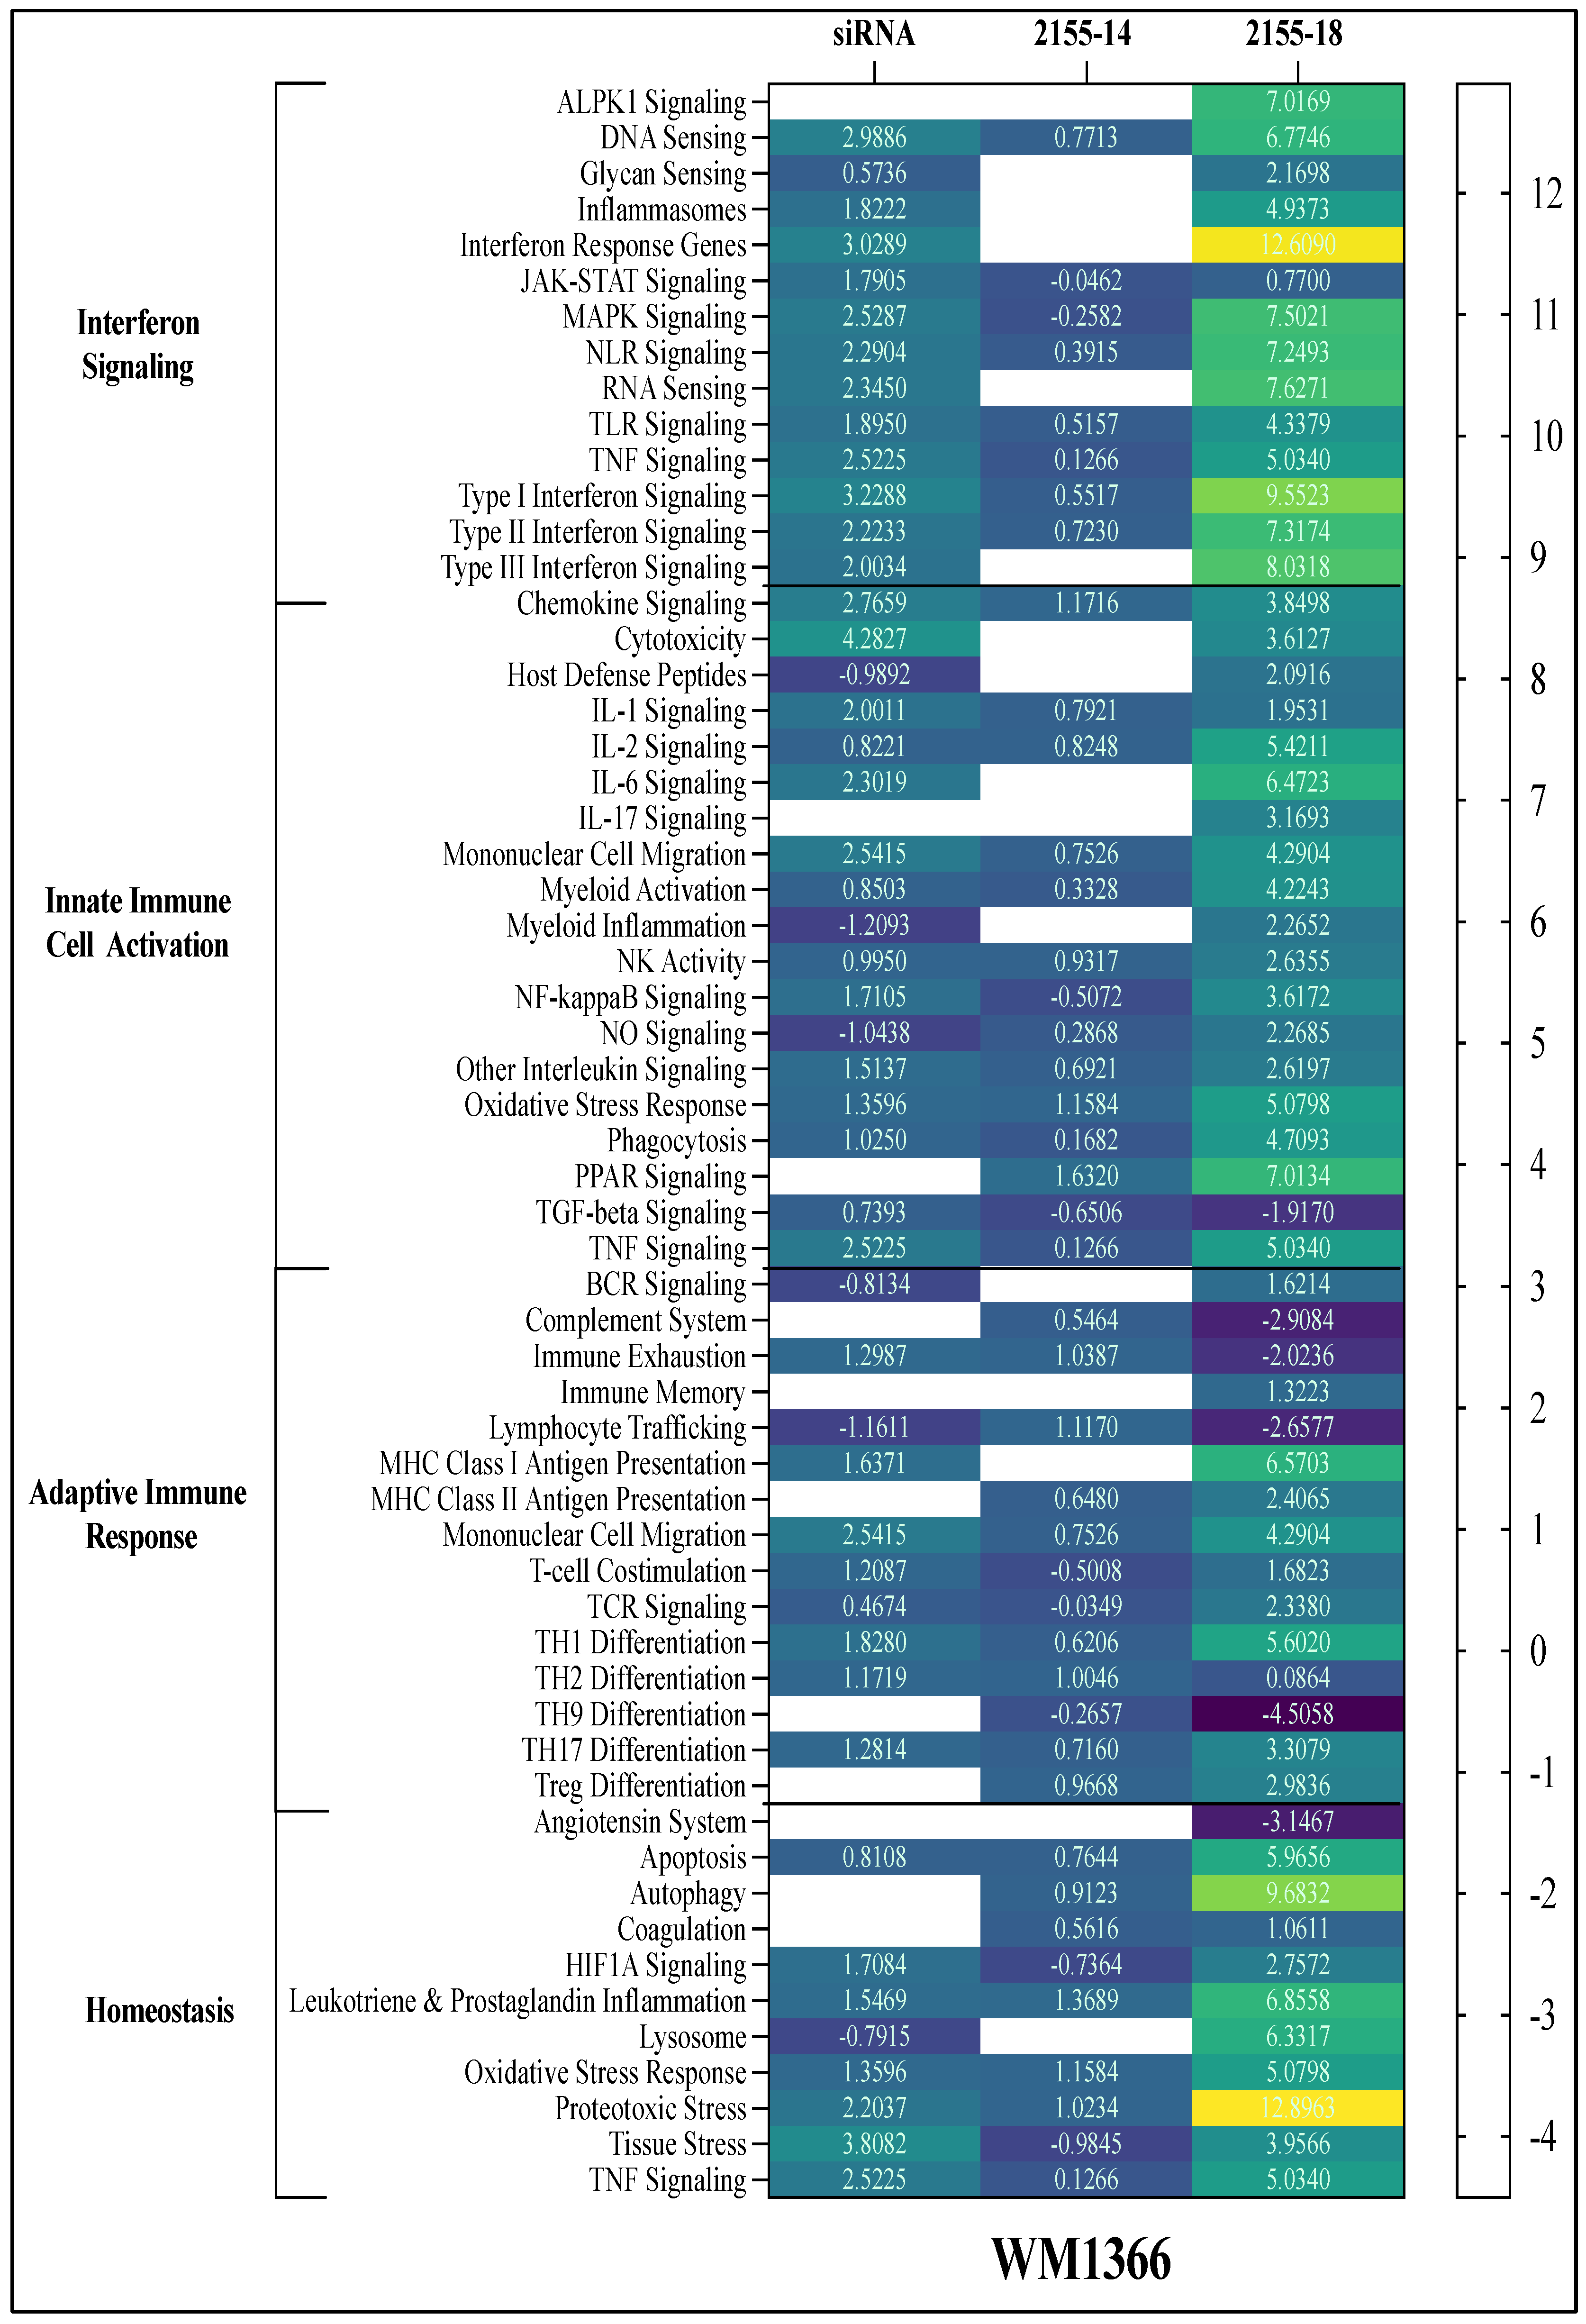

Table 1.
Viability assay results of 2155-14 and 2155-18 in melanoma and melanocyte cells. All results are presented as IC50 values (µM), Ave ± SD (n=3). WM266-4 - V600DBRAF/-/-PTEN, A375 - V600GBRAF/CDKN2AD61T, WM1366 – NRASQ61L/TP53D285K, WM3918 - CDKN2A-/-. All cell line information was obtained from cellosaurus.org.
Table 1.
Viability assay results of 2155-14 and 2155-18 in melanoma and melanocyte cells. All results are presented as IC50 values (µM), Ave ± SD (n=3). WM266-4 - V600DBRAF/-/-PTEN, A375 - V600GBRAF/CDKN2AD61T, WM1366 – NRASQ61L/TP53D285K, WM3918 - CDKN2A-/-. All cell line information was obtained from cellosaurus.org.
| Compound | A375 | WM266-4 | WM1366 | WM3918 | Melanocytes |
| 2155-14 | 16.6±1.8 | 11.3±1.2 | 15.5±1.2 | >100 | >100 |
| 2155-18 | 29.5±3.0 | 9.63±1.0 | 77.3±15.4 | >100 | >100 |
Disclaimer/Publisher’s Note: The statements, opinions and data contained in all publications are solely those of the individual author(s) and contributor(s) and not of MDPI and/or the editor(s). MDPI and/or the editor(s) disclaim responsibility for any injury to people or property resulting from any ideas, methods, instructions or products referred to in the content. |
© 2025 by the authors. Licensee MDPI, Basel, Switzerland. This article is an open access article distributed under the terms and conditions of the Creative Commons Attribution (CC BY) license (http://creativecommons.org/licenses/by/4.0/).
Copyright: This open access article is published under a Creative Commons CC BY 4.0 license, which permit the free download, distribution, and reuse, provided that the author and preprint are cited in any reuse.


