Submitted:
09 September 2025
Posted:
10 September 2025
You are already at the latest version
Abstract
METAS VNA Tools is a metrology-grade software suite developed to facilitate measurements using vector network analyzers. Its uncertainty analysis is founded on a comprehensive modeling of the entire measurement process and is implemented through multivariate uncertainty propagation via the METAS UncLib library, in accordance with GUM and EURAMET guidelines. Engineered to ensure traceability and compliance with ISO/IEC 17025, VNA Tools has been widely adopted by national metrology institutes, as well as calibration and industrial laboratories, owing to its robustness, transparency, and scientific rigor. As it is freely available, the software serves not only as a tool for the dissemination of calibration data but also enables advanced post-processing. Consequently, it provides added value that extends beyond the mere generation of calibration certificates, reinforcing both the seamlessness and integrity of the traceability chain.
Keywords:
radio frequency and microwave measurements
; scattering parameter
; vector network analyzer
; digital traceability chain
; measurement model
; multivariate uncertainty evaluation
; automatic differentiation
; METAS VNA Tools software
; METAS UncLib software
1. Introduction
Vector network analysis [1,2,3,4] is fundamental in high-frequency electrical metrology. Measurements with a vector network analyzer (VNA) enable the precise characterization of electrical components and systems. To ensure the reliability and traceability of these measurements to the International System of Units (SI) rigorous modeling of the measurement process is essential [5]. METAS VNA Tools [6] is a comprehensive metrology software suite developed by METAS to support the evaluation and uncertainty analysis of VNA measurements. Designed primarily for use in national metrology institutes and (calibration) laboratories, VNA Tools integrates measurement models in a modular fashion, facilitating standardized workflows and enabling detailed systematic investigations.
According to [7], metrological traceability requires “ ... an unbroken chain of calibrations, each contributing to measurement uncertainty.”. As noted in [5] the traceability chain is not necessarily a simple linear structure, it may branch into multiple paths that later converge. VNA Tools is built upon the uncertainty engine METAS UncLib [8,9], which implements uncertainty propagation in a specific way to support the integrity of traceability chains of diverse architectures. Specifically, it enables the propagation of uncertainty budgets along the traceability chain by maintaining a record of influence quantities and their associated uncertainties. This mechanism preserves the integrity of the traceability chain even in cases where, for example, devices under test (DUTs) calibrated at different times on the same measurement system and/or using the same reference standards are subsequently combined in a later measurement.
The paper is structured as follows: It begins with an introduction to measurements with VNAs and challenges related to it. This is followed by a review of the concept of multivariate linear uncertainty propagation and its implementation using uncertainty objects. Next, METAS VNA Tools and METAS UncLib are introduced and the implementation of uncertainty objects is described. Building on these more conceptual foundations, the paper continues by discussing how METAS VNA Tools provides added value to the end user in support of the digital traceability chain. Finally, the paper concludes with a brief discussion.
2. VNA Measurements
VNAs measure the reflection and transmission characteristics of a device under test (DUT) in amplitude and phase as a function of frequency, normalized to a reference impedance. VNAs exist in various form factors, ranging from relatively large, highly precise desktop models - typically employed at national metrology institutes (NMI) - to compact hand held devices. Most common configurations feature two or four measurement ports, although models with a larger number of ports are available as well. VNAs are used to perform measurements with different transmission media, including coaxial lines, metallic wave guides, and planar structures.
The quantities measured by VNAs are known as scattering parameters (S-parameters), which characterize components with respect to their reflective and transmissive behavior. S-parameters represent one of various possibilities for describing a linear electrical network, see Figure 1. The S-parameters of individual components can be cascaded to determine the behavior of a larger system, such as a measurement chain. Consequently, they play an important role in radio frequency (RF) and microwave (MW) system design. Moreover, S-parameters are fundamental quantities in RF and MW metrology, as their determination is often a prerequisite for accurately measuring other RF and MW quantities - such as RF power or RF noise - to the need to account for impedance mismatch effects.
S-parameters are two-dimensional quantities and may be presented either in polar (amplitude and phase) or Cartesian (complex numbers) coordinates, as illustrated in Figure 1.
S-parameters typically exhibit significant frequency dependence, necessitating repeated measurements at sufficiently small frequency intervals. For broad frequency ranges over tens of GHz, it is common to acquire several hundred measurement points to adequately capture the frequency response of the DUT.
A notable characteristic of VNAs is that the measurements are inherently inaccurate due to unavoidable systematic errors. These errors arise from leakage, loss, mismatch effects, and variations in electrical paths within the measurement setups. These systematic errors need to be determined by measuring a set of known characterized reflection and eventually also transmission standards, a process referred to as VNA calibration. The subsequent measurement with the DUT is then corrected with the error coefficients determined in VNA calibration, a process referred to as VNA error correction.
Various established VNA calibration algorithms are in use [10], with their suitability depending on the specific measurement scenario. Influencing factors include the DUT characteristics, VNA architecture, availability of calibration standards, required accuracy, and practical constraints. VNA calibration and VNA error correction are founded on error models, which are often represented graphically using so-called signal flow graphs. Signal flow graphs are particularly effective depicting linear networks, and established methods exist [11,12] for deriving mathematical equations that relate the measured S-parameters, the unknown S-parameters of the DUT, the characterization data of the calibration standards, and the error coefficients (systematic errors). These equations are used both to determine the error coefficients from the measurements of the calibration standards and to correct the DUT measurement.
The SI traceability of VNA measurements is established through the use of characterized calibration standards. At the top level, national metrology institutes (NMI) perform a primary electrical characterization of suitable calibration standards using a combination of analytical and numerical modeling, as well as dimensional and electrical measurements to establish direct traceability to the SI units [13,14,15]. These primary standards are used to calibrate a VNA, which then can be employed to characterize a set of secondary calibration standards. In this way, traceability is propagated through the various levels of the metrological pyramid to the end user, via sets of VNA calibration and verification standards. Calibration standards serve as reference standards for disseminating traceability, while verification standards provide an independent assessment of the validity of the measurement model and consequently also the associated uncertainty evaluation.
Central to the integrity of the traceability chain is the reliable determination of the measurement uncertainty associated with S-parameter measurements. According to the Guide to the Expression of Uncertainty in Measurement (GUM) [16], uncertainty evaluation should be based on a measurement model that relates the observed quantity to the true value of the measurand, accounting for all relevant influences. In VNA metrology, the modern form of a measurement model is derived from the error models used for VNA calibration and VNA error correction. The signal flow graphs of the error models are further extended to include additional effects influencing the measurements, such as VNA linearity, drift and noise, cable movement, and connector repeatability [10]. The mathematical equations derived from the signal flow graphs constitute the measurement models.
Due to the two-step measurement sequence (VNA calibration and VNA error correction) these equations become inherently complex. Furthermore, all terms in the model are two-dimensional, necessitating the use of multivariate methods [17,18,19] to account for correlation effects. Many influencing factors exhibit a significant frequency dependence, meaning that uncertainty calculations must be repeated for each frequency point. Overall, the evaluation of the measurement uncertainty associated with VNA measurements is a demanding task, which requires dedicated software.
3. Measurement Models and Uncertainty Evaluation
A measurement model is a fundamental element in the evaluation of uncertainties associated with the results of the measurements. It has the following basic mathematical form
In vector notation this can be expressed as
Each component of the output quantity is functionally dependent on the input quantities contained in . The uncertainty associated with the input quantities is represented by a covariance (uncertainty) matrix with squared standard uncertainties as the diagonal elements and covariances as the off-diagonal elements.
The correlations between input quantities are captured in the off-diagonal elements, which can be written as with denoting the correlation coefficient between and . It is well known, see e.g. [17], that the propagation of the uncertainties , associated with , to uncertainties , associated with , is governed by the following equation.
here, represents the Jacobian matrix (the ′ indicating the transpose), which contains the derivatives of the components in with respect to the components in .
These equations form the general mathematical framework of linear uncertainty propagation, as described in [16,17]. This approach relies on a linear approximation of the measurement model and is generally sufficient for a reliable evaluation of measurement uncertainties. In cases involving significant non-linearity, the GUM supplements [17,20] promote the use of the Monte Carlo method to propagate distributions representing the state of knowledge.
VNA Tools is to a large extent based on linear uncertainty propagation, largely for performance reasons. Accordingly, the subsequent discussion will focus on the linear approach, although a similar framework can be implemented for Monte Carlo based uncertainty propagation.
For simple cases, such as a single output quantity without correlations, linear uncertainty propagation can be performed manually or using spreadsheet software. However, this approach becomes impractical when multiple output quantities, correlations, or complex equations are involved. In such scenarios, software-based computation is preferred. An intuitive approach involves explicitly programming the derivatives, i.e. the Jacobian matrix of the entire set of equations, and computing using (2).
In the following, we discuss how (2) can be evaluated more efficiently using the technique of automatic or algorithmic differentiation (AD), see e.g. [21,22,23], and how the explicit storage of large covariance matrices can be avoided while still maintaining correlation tracking. The technique was introduced into metrology already some time ago [24,25,26], and is based on uncertainty objects.
4. Uncertainty Objects
Any measurement model represented by a mathematical equation, as in (1), can be decomposed into a sequence of elementary operations and functions, such as the basic arithmetic operations (addition, multiplication, etc.) and transcendental functions (trigonometric, logarithmic, etc.). This decomposition is illustrated graphically in Figure 2.
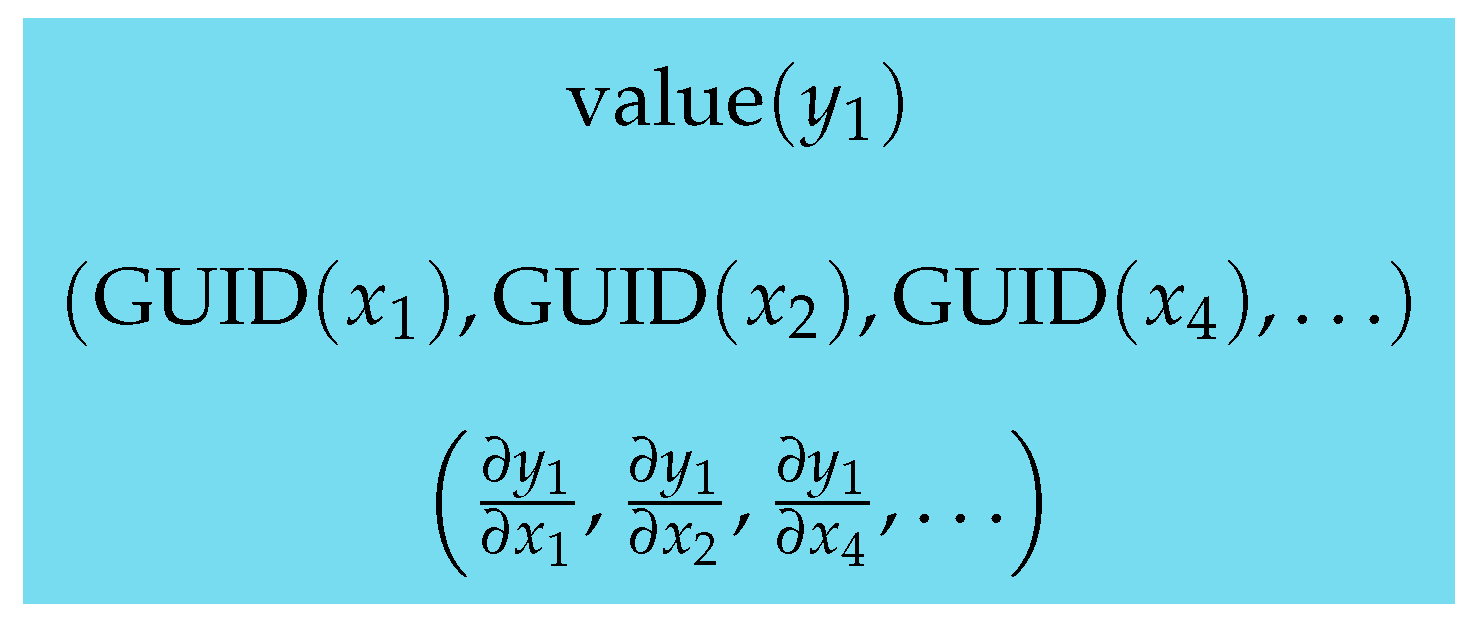
The top layer of blue boxes, labeled as , , represents the input quantities into the measurement model. The bottom layer, labeled , , corresponds to the output quantities. The intermediate blue boxes represent elementary operations with the arrows defining the inputs to these elementary operations. Each intermediate result serves as the input to the next elementary operation, ultimately constructing the full equation. Computers internally decompose arbitrarily complicated equations into such elementary steps<, a process that can be exploited through the implementation of the technique of AD. Each blue box in Figure 2 corresponds to an uncertainty object, which encapsulates the value, a list of dependencies and the sensitivities with respect to those dependencies, as shown in Figure 3.
The value represents the numerical estimate of the quantity. The list of dependencies identifies the relevant , on which the intermediate result depends. The list of sensitivities contains the derivatives of the intermediate result with respect to the relevant . As the equation tree is traversed, these lists are updated at each step. For operations involving a single input, the dependency list remains unchanged. For operations involving two inputs (e.g., binary arithmetic operations), the two dependency lists are concatenated, with duplicate entries removed. To ensure uniqueness and consistency, the are assigned globally unique identifiers upon creation. The list of sensitivities is updated using the chain rule and sum rule of differentiation. This requires the explicit programming of the derivatives for the entire but also manageable set of elementary mathematical functions. Once implemented, derivatives of arbitrary complicated equations can be computed automatically and with machine precision. For a more detailed introduction and examples, see [24].
The use of AD eliminates the need to manually program derivatives of complex equations, thereby reducing the potential for coding errors. Moreover, by employing object-oriented programming techniques, uncertainty objects can be manipulated as if they were ordinary numerical values, with the propagation of uncertainties handled automatically in the background.
With the information in the uncertainty objects, the covariance matrix for any set of intermediate or final results can be computed on demand using (2). Because dependencies are tracked explicitly, there is no need to store large covariance matrices, which offers significant advantages for both the evaluation and communication of measurement uncertainties. Questions regarding the extent of correlation information to be calculated, stored and transmitted become obsolete. Providing the and objects suffices to compute uncertainties and correlations as needed. Furthermore, correlations of measurements on the same measurement system but e.g. at different points in time will still be recognized, due to the unique identifiers of the shared input quantities.
5. METAS VNA Tools and METAS UncLib
VNA Tools is a free software suite that operates independently of the VNA firmware. The software controls VNA settings and measurement sequences directly from a PC, processes raw measurement data, and performs all calculations externally. It has a wide range of features, which are not further discussed here. Details can be found in [6,27,28]. In the following the focus remains on the evaluation of measurement uncertainties and the seamless dissemination of digital traceability.
VNA Tools integrates several key components to facilitate comprehensive and reliable uncertainty evaluation in accordance with the EURAMET VNA Guide [10], which advocates rigorous modeling of the entire measurement process. It incorporates relevant measurement models that consider all influence quantities across various calibration and error correction algorithms and different transmission line media. A dedicated database stores the characterization data of these influences, which are essential for determining the associated uncertainties. The software also features a measurement journal that logs all relevant actions during the measurement process with time stamps, such as measurements, re-connections, and cable movements, thereby enabling accurate tracking of uncertainty contributions. Both random and systematic effects are appropriately addressed, with particular attention given to the time-dependent nature of drift and its correlation across measurements. The software also generates comprehensive and detailed uncertainty budgets, which support further investigations by identifying dominant uncertainty sources and guiding improvements in measurement setups and procedures. A verification process is also supported to ensure the appropriateness of the applied measurement models.
Uncertainty propagation is handled by an engine based on the METAS UncLib library [8], which performs multivariate uncertainty propagation in accordance with GUM Supplement 2 [17]. The library supports three different modes of uncertainty propagation, linear propagation (according to [16,17]), numerical propagation via Monte Carlo methods (according to [17,20]) and propagation based on higher order Taylor approximations of the measurement model.
METAS VNA Tools centers around the linear uncertainty propagation module LinProp of the UncLib. The LinProp module adheres to the principles outlined in Section 3 and Section 4, encapsulating value, dependencies and sensitivities in so-called LinProp objects. Input quantities for the measurement models are instantiated as LinProp objects based on influence data stored in the VNA Tools database. Due to the object oriented implementation, any subsequent calculations with these objects automatically update the internal content of the LinProp objects in the background.
From a data management perspective, VNA Tools introduces a robust storage concept using dedicated and documented XML and binary formats [29], capturing the complete dependency and sensitivity information of the LinProp objects. This capability is particularly valuable for communicating measurement results, enabling modular and traceable uncertainty evaluation throughout the traceability chain. Export and import to and from other common data formats is supported as well.
A further valuable and convenient feature of VNA Tools is its virtualization capability. NMIs and accredited calibration laboratories are required to declare their measurement scope as part of their quality assurance and for mutual recognition. This scope includes measurement ranges and associated best uncertainties. The uncertainties associated with S-parameter measurements depend not only on frequency, but also on the value of the measurand. VNA Tools has built in a virtual VNA that samples possible measurand values in the complex plane and automatically generates tables of best uncertainties as a function of frequency and measurand value.
6. Support of the Digital Traceability Chain
The delivery of a calibration certificate often marks a discontinuity in the traceability chain, as the recipient typically receives only a list of values and associated uncertainties. Efforts related to digital calibration certificates aim to address this issue by providing the data in electronic form and enabling machine-readable certificates. VNA Tools offers significant added value to the end user, extending beyond the mere distribution of certificates and calibration data, particularly through its advanced handling of uncertainties.
METAS issues S-parameter calibration certificates in digitally signed electronic format. For illustrative purposes, the certificates include a limited subset of the data in tabular form. The complete dataset is provided electronically and referenced in the certificate via a hash key, ensuring unique assignment and enabling the detection of any deliberate or accidental modifications. The certificates are issued in PDF/A3 format (ISO 19005-3) [30], which supports direct embedding of calibration data within the certificate file. Embedding into a machine-readable digital calibration certificate, as promoted by [31,32], is also supported. The calibration data is stored in one of the documented VNA Tools data formats [29], allowing full restoration of the information contained in the LinProp objects.
Due to the free availability of VNA Tools, recipients of calibration certificates have full flexibility in utilizing the calibration data. By loading the data into the software, users can reconstruct the LinProp objects with the exact same state of information as the provider. This enables users to characterize their own working calibration standards based on the received characterized standards. The same mechanism applies when working standards are used to calibrate items at the next level of the traceability chain. In this way, traceability dissemination from one level to the next occurs without disruption or loss of information.
The approach to uncertainty handling, i.e. by keeping track of dependencies and sensitivities and by updating them at each calibration step, offers several advantages over traditional methods that rely solely on propagating uncertainties and covariance matrices. This mechanism ensures that the full uncertainty budget is propagated along the traceability chain and is incrementally supplemented with additional contributions from each measurement step. The end user thus gains access to the accumulated uncertainty budget of the entire traceability chain. This supports current trends in data provenance and scientific transparency and is valuable for systematic investigations of measurement processes. Furthermore, with the information contained in the LinProp objects, users can display uncertainties and correlations on demand.
Traceability chains that deviate from a simple linear structure are not uncommon. Typically, multiple calibration and verification standards are used in a VNA measurement. These standards may not have been calibrated during the same campaign, but their characterization may still be traceable to common reference standards. Such correlations are recognized during uncertainty evaluation and verification. Thanks to the unique identifiers of dependencies within the LinProp objects, shared influences are properly accounted for, helping to prevent both underestimation and overestimation of measurement uncertainty in complex traceability scenarios.
7. Discussion
Providing uncertainty and correlation information through LinProp objects introduces a certain level of abstraction. However, achieving the same level of comprehensiveness and integrity in the traceability chain using direct representations of uncertainties and covariances would be difficult, if not impossible.
End users, however, have different needs and may not be interested in the full detail offered by the mechanisms described thus far. Practical constraints, such as file size limitations, may also apply. Disseminating LinProp objects along the traceability chain can result in file sizes reaching tens or even hundreds of megabytes. To accommodate different needs and limitations, VNA Tools provides the capability to truncate dependencies and replace them with uncertainties and covariances at any desired level. This reduces file size at the expense of some information loss.
Commercial solutions are also available [33,34] that incorporate the VNA Tools suite. These tools offer a more guided and controlled approach to VNA measurements, which may be advantageous for less experienced users compared to the flexibility provided by VNA Tools. These commercial solutions maintain a high level of interoperability with VNA Tools through its documented data formats [29]. For example, the solution described in [33] allows exporting the entire project, including the measurement journal, for further analysis in VNA Tools. This feature is particularly useful when a technician performing routine calibration encounters an unusual result that requires more systematic investigation by a metrology specialist.
These commercial tools interact with VNA Tools via the Real Time Interface (RTI), a stable, high-level software interface that provides access to VNA Tools functionality. Many measurement laboratories already operate within overarching software environments that support testing, calibration, development, or production processes. The RTI facilitates the integration of VNA Tools into such environments, thereby promoting its adoption and usability.
The combination of interoperability, flexibility, and adaptability has made VNA Tools suitable for use across all levels of the traceability pyramid—from national metrology institutes to industrial laboratories. As a result, the software, along with its underlying models and data formats, has evolved into a quasi-standard that helps overcome fragmented structures and supports the digital transformation of metrology [35].
Overall, VNA Tools contributes to the development towards a truly digital and seamless traceability chain, thereby promoting good metrological practice. Key elements include the use of uncertainty objects, which enable the propagation of uncertainty budgets and the tracking of correlations across diverse traceability chain designs. Equally important is the support provided to users beyond the calibration certificate, with flexibility and customizability tailored to specific needs. There is potential to extend this approach further by embedding the measurement journal and, potentially, the measurement models directly into the certificates, thereby advancing the concept of full data provenance [36] or data lineage in metrology.
Finally, METAS UncLib is freely available as a standalone, general-purpose uncertainty engine that incorporates the essential mechanisms discussed. It can be applied in other areas of metrology to implement systems similar to VNA Tools for VNA measurements. Solutions in other domains that utilize uncertainty objects carrying complete traceability information - readily shareable with customers - can play a pivotal role in driving the digitalization of the global metrology infrastructure.
Data Availability Statement
No new data were created or analysed in this study. Data sharing is not applicable to this article.
Acknowledgments
The authors are grateful to Marc-Olivier André and Peter Blattner for carefully reviewing this work.
Conflicts of Interest
The authors declare no conflicts of interest.
Abbreviations
The following abbreviations are used in this manuscript:
| AD | Automatic (Algorithmic) Differentiation |
| DUT | Device Under Test |
| GUM | Guide to the Expression of Uncertainty in Measurement [16] |
| MW | Microwave |
| NMI | National Metrology Institute |
| RF | Radio Frequency |
| RTI | Real Time Interface |
| S-Parameter | Scattering Parameter |
| SI | International System of Units |
| VNA | Vector Network Analyzer |
References
- Hiebel, M. Fundamentals of Vector Network Analysis; Rohde & Schwarz, 2007; ISBN 978-3-939837. [Google Scholar]
- Dunsmore, J. Handbook of Microwave Component Measurements with Advanced VNA Techniques; John Wiley & Sons, Ltd, 2012; ISBN 978-1-119-97955-5. [Google Scholar]
- Hernández, J.A.R.; Gaytan, M.A.P. Principles and Applications of Vector Network Analyzer Calibration Techniques; River Publishers, 2024. [Google Scholar]
- Shoaib, N. Vector network analyzer (VNA) measurements and uncertainty assessment; Springer, 2017; Vol. 1. [Google Scholar]
- Hall, B.D. Modelling Metrological Traceability. Metrology 2025, 5. [Google Scholar] [CrossRef]
- METAS VNA Tools. Available online: https://www.metas.ch/vnatools.
- BIPM, IEC, IFCC, ILAC, ISO, IUPAC, IUPAP and OIML. International Vocabulary of Metrology - Basic and General Concepts and Associated Terms (VIM 3rd edition), /: JCGM 200:2012; available at http, 2012. Available online: http://www.bipm.org/en/publications/guides/JCGM 200:2012.
- METAS UncLib. Available online: https://www.metas.ch/unclib.
- Zeier, M.; Hoffmann, J.; Wollensack, M. Metas.UncLib - a measurement uncertainty calculator for advanced problems. Metrologia 2012, 49, 809–815. [Google Scholar] [CrossRef]
- Guidelines on the Evaluation of Vector Network Analysers, EURAMET cg-12, 3.0 ed.; 2018; Available online: https://www.euramet.org.
- Somlo, P.I.; Hunter, J.D. Microwave Impedance Measurements - IEE electrical measurement series; 2; Peter Peregrinus Ltd, London, UK, 1985. [Google Scholar]
- Jeng, S.L.; Roy, R.; Chieng, W.H. A matrix approach for analyzing signal flow graph. Information (Basel) 2020, 11, 562. [Google Scholar] [CrossRef]
- Zeier, M.; Hoffmann, J.; Hürlimann, P.; Rüfenacht, J.; Stalder, D.; Wollensack, M. Establishing traceability for the measurement of scattering parameters in coaxial line systems. Metrologia 2018, 55, S23–S36. [Google Scholar] [CrossRef]
- Schramm, A.; Gellersen, F.; Rausche, F.; Kuhlmann, K. Traceable S-Parameter Measurements Up to 165 GHz Using 0.8 mm Coaxial Standards. IEEE Microwave and Wireless Technology Letters 2025, 35, 936–939. [Google Scholar] [CrossRef]
- Mubarak, F.A.; Mascolo, V.; Hussain, F.; Rietveld, G. Calculating S-Parameters and Uncertainties of Coaxial Air-Dielectric Transmission Lines. IEEE Transactions on Instrumentation and Measurement 2024, 73, 1–11. [Google Scholar] [CrossRef]
- BIPM, IEC, IFCC, ILAC, ISO, IUPAC, IUPAP and OIML. Evaluation of Measurement Data - Guide to the expression of uncertainty in measurement, 2008. JCGM 100:2008; available at https://www.bipm.org/en/committees/jc/jcgm/publications.
- BIPM, IEC, IFCC, ILAC, ISO, IUPAC, IUPAP and OIML. Evaluation of measurement data - Supplement 2 to the "Guide to the expression of uncertainty in measurement" - Extension to any number of output quantities, 2011. JCGM 102:2011; available at https://www.bipm.org/en/committees/jc/jcgm/publications.
- Hall, B. On the propagation of uncertainty in complex-valued quantities. Metrologia 2004, 41, 173. [Google Scholar] [CrossRef]
- Ridler, N.M.; Salter, M.J. An approach to the treatment of uncertainty in complex S-parameter measurements. Metrologia 2002, 39, 295–302. [Google Scholar] [CrossRef]
- BIPM, IEC, IFCC, ILAC, ISO, IUPAC, IUPAP and OIML. Evaluation of measurement data - Supplement 1 to the "Guide to the expression of uncertainty in measurement" - Propagation of distributions using a Monte Carlo method, 2008. JCGM 101:2008; available at https://www.bipm.org/en/committees/jc/jcgm/publications.
- Available online: https://en.wikipedia.org/wiki/Automatic_differentiation.
- Griewank, A.; Walther, A. Evaluating Derivatives - Principles and Techniques of Algorithmic Differentiation; Society for Industrial and Applied Mathematics, 2008. [Google Scholar]
- Naumann, U. The art of differentiating computer programs : an introduction to algorithmic differentiation; Software, environments, and tools, Society for Industrial and Applied Mathematics: Philadelphia, MS, 2012. [Google Scholar]
- Hall, B.D. Computing uncertainty with uncertain numbers. Metrologia 2006, 43, L56–L61. [Google Scholar] [CrossRef]
- Hall, B.D. The GUM tree design pattern for uncertainty software. In Advanced Mathematical andComputational Techniques in Metrology VI; Series onAdvances in Mathematics for Applied Sciences; World Scientific, 2004; Vol. 66, pp. 199–208. [Google Scholar]
- Hall, B.D. An extension of the Gum Tree method for complex numbers. In Advanced Mathematical andComputational Techniques in Metrology VI; Series onAdvances in Mathematics for Applied Sciences; World Scientific, 2009; Vol. 78, pp. 158–163. [Google Scholar]
- Wollensack, M.; Hoffmann, J.; Ruefenacht, J.; Zeier, M. VNA Tools II: S-parameter uncertainty calculation. In Proceedings of the 79th ARFTG Microwave Measurement Conference, number 79; 2012; p. 1. [Google Scholar]
- Zeier, M.; Hoffmann, J.; Ruefenacht, J.; Wollensack, M. Contemporary Evaluation of Measurement Uncertainties in Vector Network Analysis. CalLab: The International Journal of Metrology, Oct 2018; 24, 22–31. Available online: https://www.callabmag.com/contemporary-evaluation-of-measurement-uncertainties-in-vector-network-analysis/.
- Documentation on METAS VNA Tools (math reference and data formats). Available online: https://www.metas.ch/vnatools.
- Wollensack, M. METAS eCertificate. LaTeX template for an electronic calibration certificate with embedded data files. Available online: https://github.com/wollmich/metas-ecertificate.
- PTB. Digital Calibration Certificate. Available online: https://www.ptb.de/dcc/.
- PTB. DCC development platform. Available online: https://gitlab.com/ptb/dcc.
- Realtime measurement uncertainty analysis, Option K50, Rohde & Schwarz. Available online: https://www.rohde-schwarz.com.
- Insight Calibration and Measurement Software, Maury Microwave. Available online: https://www.maurymw.com.
- Hall, B.D. Communities of practice in metrology. In Proceedings of the IMEKO International Conference on Metrology and Digital Transformation, 2025. submitted. [Google Scholar]
- White, R.M. Provenance in the Context of Metrological Traceability. Metrology 2025, 5. [Google Scholar] [CrossRef]
Figure 1.
S-parameter describe reflection and transmission of an electromagnetic signal in a linear network. The example shown here is a two port network. The linear relationships are expressed as and . For compactness, this can be written in vector-matrix form: . All involved quantities are two-dimensional and can be expressed either in polar coordinates (amplitude and phase) or in Cartesian coordinates (real and imaginary components).
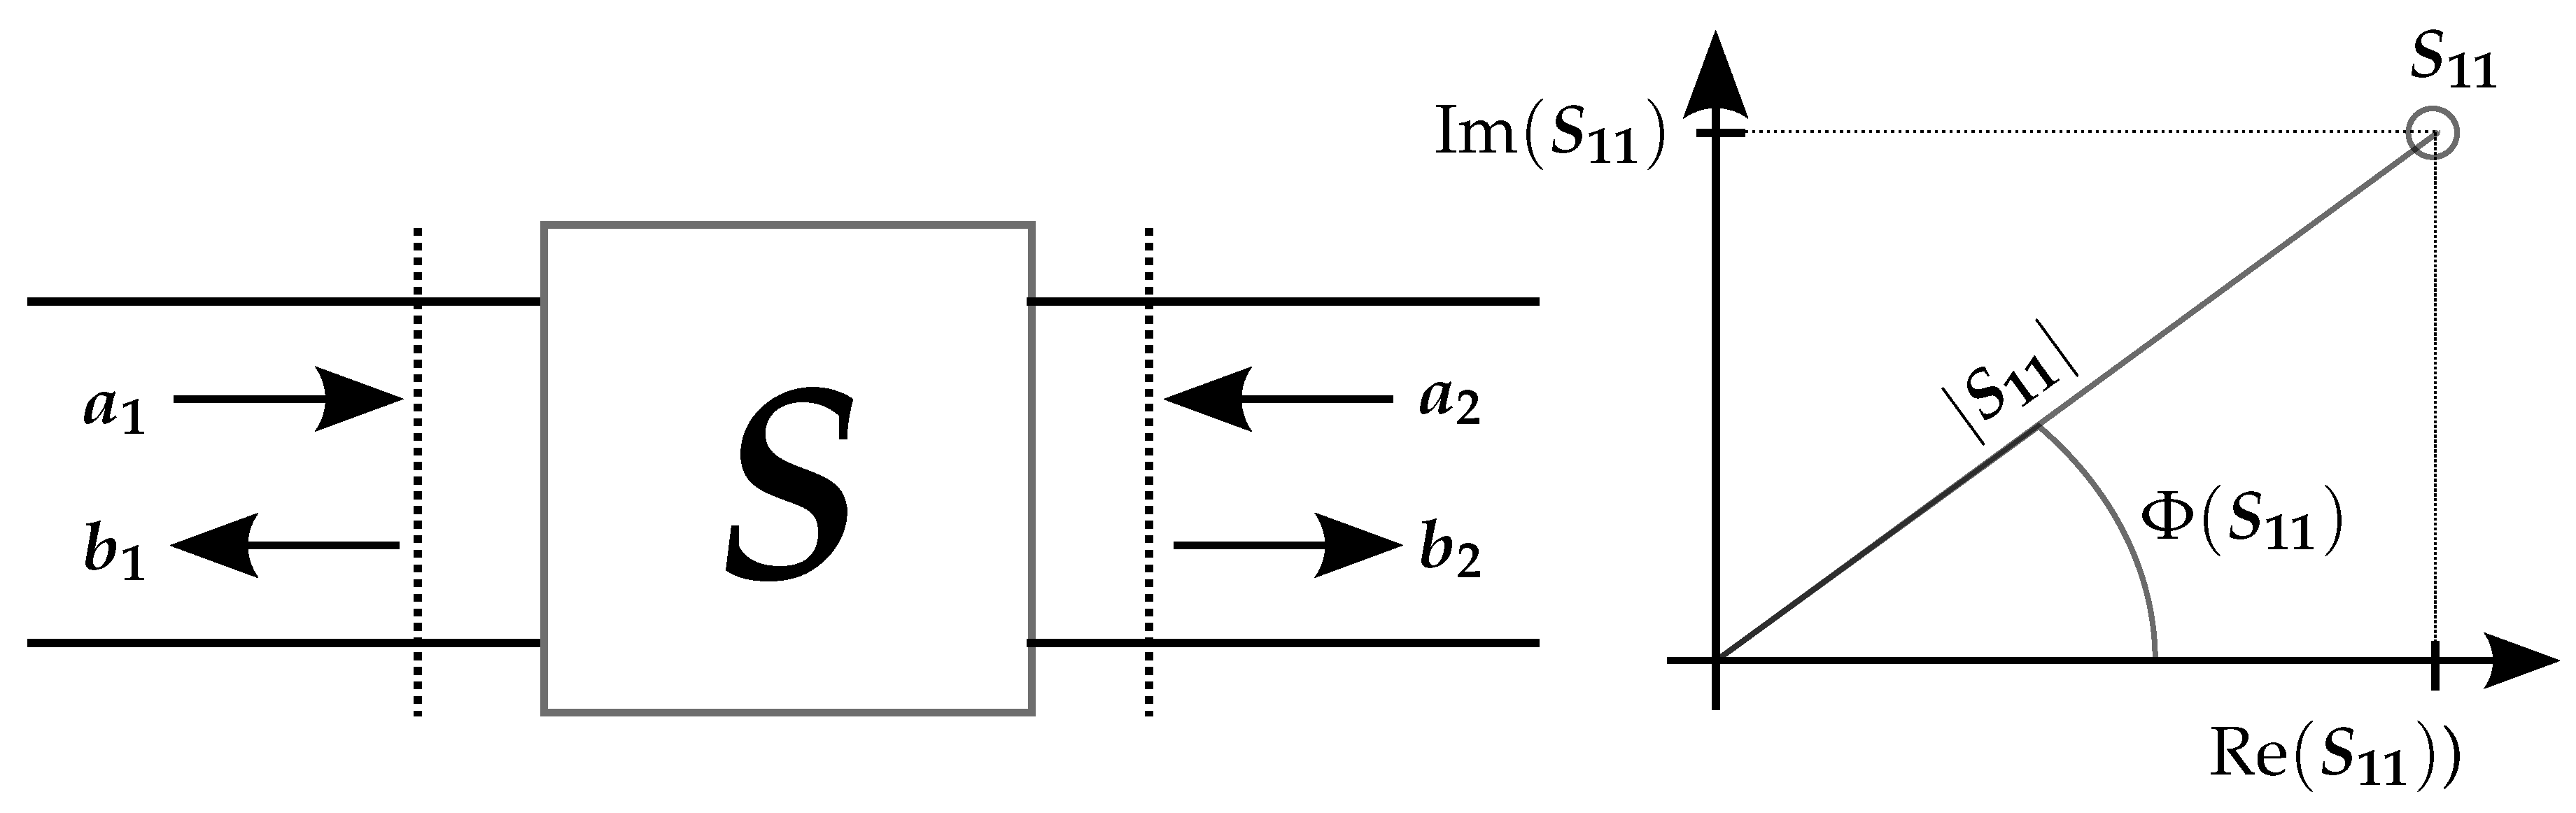
Figure 2.
Graphical representation of a measurement model (equation) decomposed into elementary operations and functions. , , … and , , … denote the input and output quantities, respectively. Each blue box in-between constitutes an elementary operation, the output of which becomes an input to the next operation. This is indicated by the arrows.
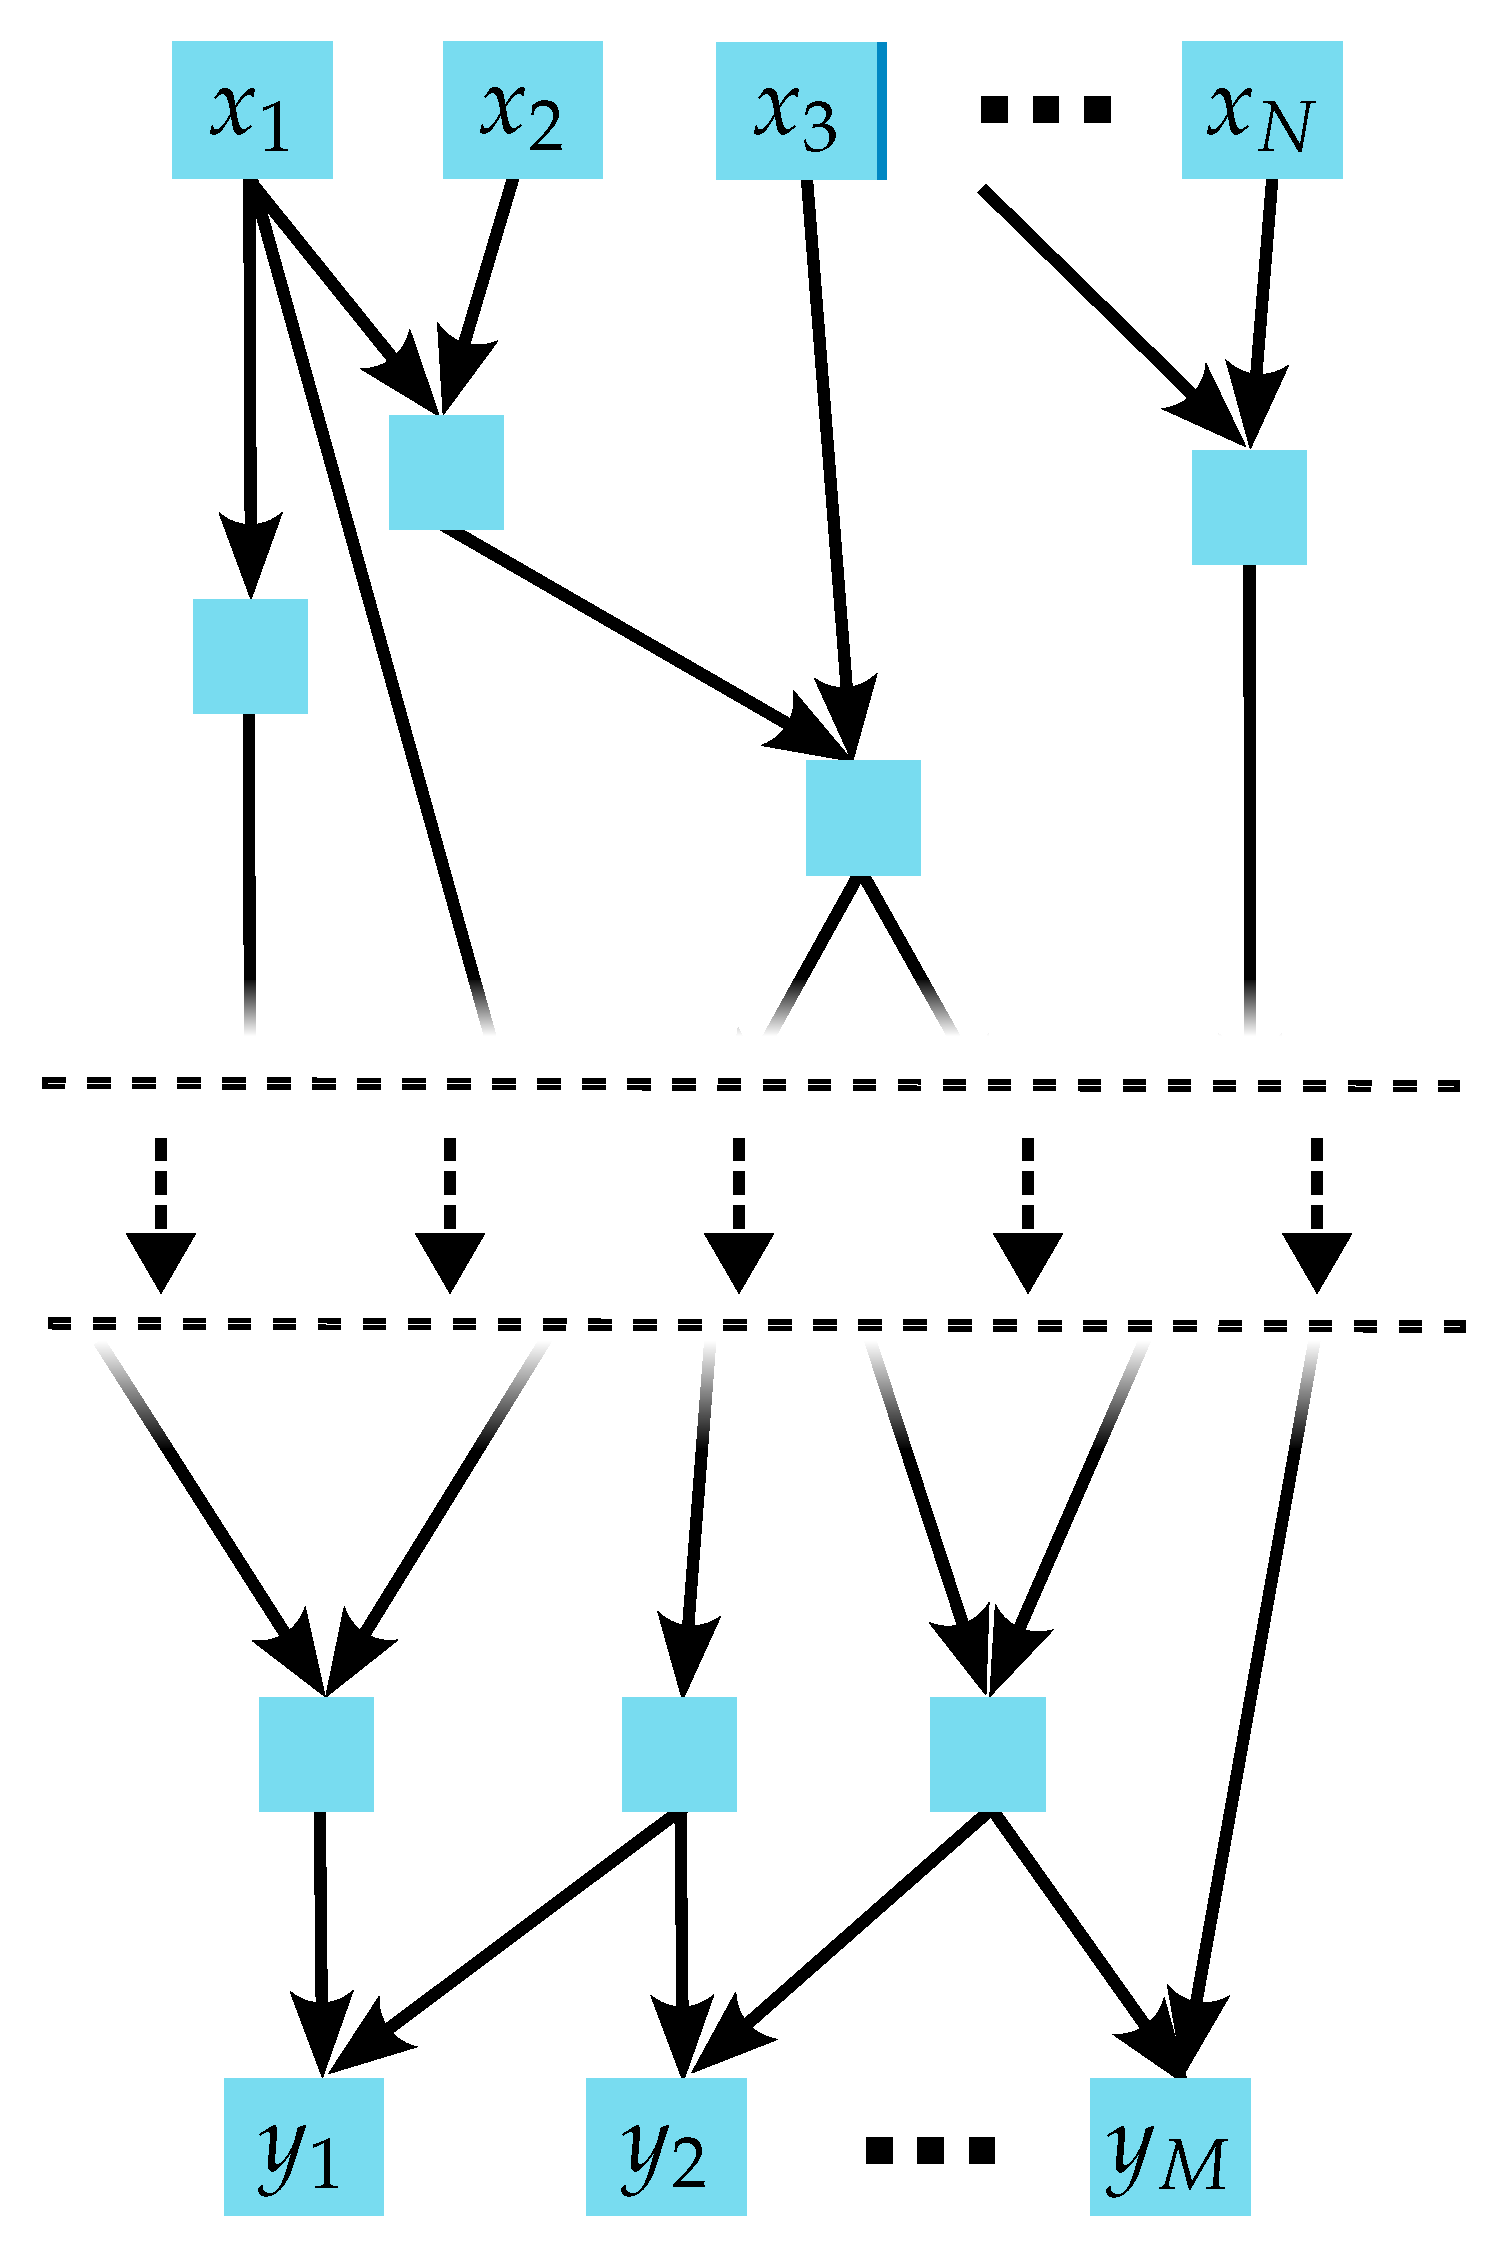
Figure 3.
Schematic representation of the contents of an uncertainty object, here illustrated for . It contains the value (best estimate), a list of input quantities on which depends (dependencies identified by GUIDs, globally unique identifiers) and the sensitivities (partial derivatives) of with respect to these dependencies.
Disclaimer/Publisher’s Note: The statements, opinions and data contained in all publications are solely those of the individual author(s) and contributor(s) and not of MDPI and/or the editor(s). MDPI and/or the editor(s) disclaim responsibility for any injury to people or property resulting from any ideas, methods, instructions or products referred to in the content. |
© 2025 by the authors. Licensee MDPI, Basel, Switzerland. This article is an open access article distributed under the terms and conditions of the Creative Commons Attribution (CC BY) license (http://creativecommons.org/licenses/by/4.0/).
Copyright: This open access article is published under a Creative Commons CC BY 4.0 license, which permit the free download, distribution, and reuse, provided that the author and preprint are cited in any reuse.


