Submitted:
05 September 2025
Posted:
09 September 2025
You are already at the latest version
Abstract
Background: Diabetic retinopathy (DR) is a leading cause of vision loss, and its progression from non-proliferative (NPDR) to sight-threatening proliferative diabetic retinopathy (PDR) is a critical event. Systemic lactate dehydrogenase (LDH), a marker of cellular hypoxia and turnover, has been implicated in various disease processes. We investigated the association between systemic LDH levels at the time of NPDR diagnosis and the 1-year risk of progression to PDR and other sight-threatening complications.
Methods: We conducted a retrospective, propensity-matched cohort study using the TriNetX US Collaborative Network. Patients with a new NPDR diagnosis were stratified into three groups based on a single LDH measurement taken within six months of the index date: low (< 200 U/L), moderate (201–280 U/L), and high (≥281 U/L). Two separate 1:1 nearest-neighbor propensity-matched analyses were performed: one comparing the low-LDH group to the moderate-LDH group, and a second comparing the low-LDH group to the high-LDH group. Matching was performed on a comprehensive set of demographic, metabolic, vascular, and ocular covariates. The primary outcomes were the 1-year absolute risks and risk ratios (RR) for PDR, tractional retinal detachment (TRD), and vitreous hemorrhage (VH).
Results: In the first analysis, the low-LDH cohort was compared to the moderate-LDH cohort. The moderate-LDH group had a higher 1-year absolute risk of PDR (3.93 % vs. 2.96 %, RR 1.33, 95 % CI 1.14–1.54), TRD (1.35 % vs. 0.99 %, RR 1.36, 95 % CI 1.07–1.73), and VH (4.38 % vs. 3.51 %, RR 1.25, 95 % CI 1.10–1.42). In the second analysis, comparing the low-LDH group to the high-LDH group, the high-LDH cohort showed an increased risk for PDR (3.66 % vs. 3.00 %, RR 1.22, 95 % CI 1.05–1.42), TRD (1.27 % vs. 0.96 %, RR 1.32, 95 % CI 1.04–1.67), and VH (1.27 % vs. 0.96 %, RR 1.22, 95 % CI 1.08–1.40).
Conclusion: Our findings demonstrate a consistent, dose-dependent relationship between higher systemic LDH levels and an increased risk of progression to PDR and its complications. This suggests that systemic LDH levels may be an independent and readily available biomarker for identifying patients with NPDR who are at higher risk for sight-threatening outcomes.
Keywords:
Proliferative Diabetic Retinopathy
; Non-Proliferative Diabetic Retinopathy
; LDH
; Biomarker
1. Introduction
Diabetic retinopathy (DR) is the most common microvascular complication of diabetes mellitus and a leading cause of new-onset blindness in working-age adults worldwide. The disease is characterized by a spectrum of vascular changes, beginning with non-proliferative diabetic retinopathy (NPDR) and potentially advancing to the more severe, sight-threatening stage of proliferative diabetic retinopathy (PDR). PDR is defined by the growth of new, fragile blood vessels on the surface of the retina or optic disc, which can lead to complications such as vitreous hemorrhage (VH) and tractional retinal detachment (TRD).[1]
The pathogenesis of DR progression is complex and involves multiple factors, including chronic hyperglycemia, inflammation, and cellular hypoxia.[2] Lactate dehydrogenase (LDH) is a ubiquitous intracellular enzyme that plays a crucial role in anaerobic glycolysis. Elevated systemic LDH levels in the bloodstream is often considered a non-specific marker of tissue damage, cellular turnover, or hypoxia. Previous studies investigated the association between serum LDH levels and DR, indicating a strong association between elevated LDH levels and DR.[3,4] However, its specific role as a predictive biomarker for the progression of NPDR and evaluating TRD and VH has not been studied in large patient population studies.
This study aimed to investigate whether varying systemic LDH levels at the time of NPDR diagnosis are associated with a higher 1-year risk of progression to PDR, TRD, or VH. We hypothesized that patients with higher LDH levels would be at increased risk for these adverse outcomes, even after accounting for known risk factors.
2. Materials and Methods
2.1. Study Design and Data Source
This was a retrospective, propensity-matched cohort study utilizing data from the TriNetX US Collaborative Network (Cambridge, MA, USA), a large-scale research database of electronic health records from numerous healthcare organizations. The network includes > 90 healthcare organizations (HCOs) in the United States and abroad, with > 130 million patients. The study period encompassed a 1-year follow-up from the index date for each patient. The University of Arkansas for Medical Sciences Institutional Review Board waived the approval since the patient data were deidentified. The study adhered to the tenets of the Declaration of Helsinki.
2.2. Patient Cohorts and Exposure Definition
The study cohort included patients with a first encounter coded for NPDR, which served as the index date. For each patient, a single LDH measurement was retrieved if it was recorded within six months before or after the index date. Based on this measurement, patients were assigned to one of three mutually exclusive exposure strata:
- Low LDH: LDH levels <200 Units per Liter (U/L).
- Moderate LDH: LDH levels = 201–280 U/L.
- High LDH: LDH levels ≥281 U/L.
To ensure a clean separation between groups, any patient who had ever recorded an LDH value outside the qualifying range of their assigned stratum was excluded from the analysis.
2.3. Propensity Score Matching
Two distinct analyses were performed, each involving a 1:1 greedy nearest-neighbor propensity-matched comparison. The two matched comparisons were as follows:
The matching process was designed to balance baseline characteristics and reduce confounding. The covariates used for matching included:
- Demographics: Current age, age at NPDR diagnosis, sex, race, and Hispanic ethnicity.
- Metabolic and Vascular Comorbidities: HbA1c, body-mass index (BMI), hypertension, dyslipidemia, and proteinuria.
- Ocular Disease Stage: Granular NPDR severity codes, presence of macular edema, and open-angle glaucoma.
- Prior Ophthalmic Procedures: Codes for prior intravitreal injections and other ophthalmic procedures.
Codes used in the study are listed in Table 3.
2.4. Outcomes
The primary outcomes, assessed within one year of the index date, were the absolute risk and relative risk for the development of:
- Proliferative diabetic retinopathy (PDR)
- Tractional retinal detachment (TRD)
- Vitreous hemorrhage (VH)
Risk ratios (RR) and their corresponding 95 % confidence intervals (CI) were calculated for each comparison. The significance level for this study was set at a P-value < 0.05 using two-sided tests.
3. Results
3.1. Comparison of Low vs. Moderate LDH Cohorts
We performed two distinct analyses based on the patients' stratification into three groups: low LDH (<200 U/L), moderate LDH (201–280 U/L), and high LDH (≥281 U/L). The first analysis compared the outcomes of patients with low LDH (<200 U/L) to a propensity-matched cohort of patients with moderate LDH (201–280 U/L). After matching, the cohorts were well-balanced on all predefined covariates. Three primary outcomes were assessed within one year of the index date: proliferative diabetic retinopathy (PDR), tractional retinal detachment (TRD), and vitreous hemorrhage (VH). For PDR, the 1-year absolute risk of PDR was 2.96 % in the low-LDH cohort and 3.93 % in the moderate-LDH cohort. This represented a 33 % increase in relative risk (RR 1.33, 95 % CI 1.14–1.54). TRD occurred in 0.99 % of the low-LDH cohort and 1.35 % of the moderate-LDH cohort. The relative risk was 1.36 (95 % CI 1.07–1.73). VH was observed in 3.51 % of the low-LDH cohort and 4.38 % of the moderate-LDH cohort, resulting in a relative risk of 1.25 (95 % CI 1.10–1.42) (Table 4 and Figure 1). In this comparison, a modest elevation of LDH levels from <200 U/L to 201–280 U/L was associated with small but statistically significant absolute risk increments of 0.4 to 0.9 percentage points for all three sight-threatening outcomes.
3.2. Comparison of Low vs. High LDH Cohorts
The second analysis compared the outcomes of the low-LDH group (<200 U/L) with a propensity-matched cohort of patients with high LDH (≥281 U/L). This analysis also showed well-balanced cohorts. In the high-LDH cohort, the 1-year absolute risk of PDR was 3.66 %, compared to 3.00 % in the matched controls. The relative risk was 1.22 (95 % CI 1.05–1.42). TRD developed in 1.27 % of the high-LDH patients versus 0.96 % of their matched controls. This corresponds to an RR of 1.32 (95 % CI 1.04–1.67). VH occurred in 1.27 % of patients with LDH ≥281 U/L and 0.96 % of the control group, yielding an RR of 1.22 (95 % CI 1.08–1.40) (Table 4 and Figure 1).
4. Discussion
The results of this study consistently demonstrate a positive and statistically significant association between higher systemic LDH levels and an increased 1-year risk of progression to the vision-threatening diabetic retinopathy. Across both propensity-matched comparisons, the direction of effect was uniform: as the LDH levels increased, so did the absolute probability of PDR, TRD, and VH. The observed relative risks for these outcomes ranged from approximately 20 % to 35 %, despite rigorous matching for a wide array of demographic, metabolic, and ocular confounding factors.
LDH is a ubiquitous enzyme crucial for cellular energy metabolism. As an indicator of systemic cell damage, circulating LDH levels are measured as enzymatic activity. While the reference range for adults is typically between 125 and 220 IU/L, this can vary among laboratories. Elevated LDH levels are a non-specific marker for a broad spectrum of pathologies, including tissue injury, malignancy, and blood disorders. Therefore, interpreting LDH activity requires correlation with other clinical and laboratory findings to identify the specific site of cellular necrosis or turnover. Our finding suggests that systemic LDH levels may be an independent marker of vulnerability to proliferative diabetic retinal disease. The underlying mechanism may be linked to LDH’s role in modulating cellular stress. In the context of diabetic retinopathy, elevated LDH could be a systemic reflection of the microvascular damage, chronic inflammation, and increased anaerobic metabolism occurring within the hypoxic retina. As retinal hypoxia worsens, cells shift towards anaerobic glycolysis, producing lactate and releasing LDH into the bloodstream upon cellular damage, which in turn fuels the neovascularization cascade characteristic of PDR. [5,6]
The use of a large, real-world database and a propensity-matched design are key strengths of this study. This approach allowed us to control for numerous potential confounders, lending greater confidence to the observed associations. The consistent dose-response relationship across two separate matched analyses further strengthens our conclusion. In addition, our study is the first to evaluate the association between LDH levels and VH and TRD. A previous study demonstrated the association between the elevated LDH levels (> 134 U/L) and the increased risk of DR in type 2 diabetic patients.[3] However, they didn’t evaluate the risk associated between the different categories of LDH levels with the progression of DR.
Serum LDH levels have been extensively studied as a biomarker for different human diseases.[7] It has been detected in other retinal diseases including retinoblastoma.[8] Taking that into consideration, it is important to note that our study introduces LDH as a biomarker for the risk progression of NPDR to PDR in addition to clinical observation and assessment of the patient. Our study provides compelling evidence that systemic LDH levels are not only a marker of general tissue damage but also a specific predictor of diabetic retinopathy progression. Integrating a simple, widely available laboratory test like the measurement of LDH levels into the clinical management of NPDR could help identify patients who require more frequent monitoring or more aggressive interventions to prevent vision loss.
5. Conclusions
Systemic lactate dehydrogenase levels, even at modest elevations above the normal range, is significantly and independently associated with a higher risk of developing proliferative diabetic retinopathy and its associated complications (TRD and VH) within one year. These findings suggest that LDH could serve as a valuable and accessible biomarker for risk stratification in patients with non-proliferative diabetic retinopathy.
Acknowledgments
The study was supported by an AHA Career Development Award (25CDA1446415) to ES, National Eye Institute (NIH/NEI) grants (R00 EY029373, R01 EY035658) to AYF.
Declarations of interest
none.
References
- Wilkinson, C.P., Ferris, F.L., Klein, R.E., Lee, P.P., Agardh, C.D., Davis, M., et al., 2003. Proposed international clinical diabetic retinopathy and diabetic macular edema disease severity scales. Ophthalmology 110:1677–1682. [CrossRef]
- Antonetti, D.A., Silva, P.S., Stitt, A.W., 2021. Current understanding of the molecular and cellular pathology of diabetic retinopathy. Nat Rev Endocrinol 17:195–206. [CrossRef]
- Yang, P., Xu, W., Liu, L., Yang, G., 2024. Association of lactate dehydrogenase and diabetic retinopathy in US adults with diabetes mellitus. J Diabetes 16:e13476. [CrossRef]
- Lian, X., Zhu, M., 2024. Factors related to type 2 diabetic retinopathy and their clinical application value. Front Endocrinol (Lausanne) 15:1484197. [CrossRef]
- Li, Q., Gui, X., Zhang, H., Zhu, W., Zhang, R., Shen, W., et al., 2022. Role of glucose metabolism in ocular angiogenesis (Review). Mol Med Rep 26:363. [CrossRef]
- van Noorden, C.J.F., Yetkin-Arik, B., Serrano Martinez, P., Bakker, N., van Breest Smallenburg, M.E., Schlingemann, R.O., et al., 2024. New Insights in ATP Synthesis as Therapeutic Target in Cancer and Angiogenic Ocular Diseases. J Histochem Cytochem 72:329–352. [CrossRef]
- Wu, Y., Lu, C., Pan, N., Zhang, M., An, Y., Xu, M., et al., 2021. Serum lactate dehydrogenase activities as systems biomarkers for 48 types of human diseases. Sci Rep 11:12997. [CrossRef]
- Ghiam, B.K., Xu, L., Berry, J.L., 2019. Aqueous Humor Markers in Retinoblastoma, a Review. Transl Vis Sci Technol 8:13. [CrossRef]
Figure 1.
Increased Risk of PDR, TRD and VH with Higher LDH Levels. Relative risk (RR) and 95% confidence intervals (CI) for proliferative diabetic retinopathy (PDR), tractional retinal detachment (TRD), and vitreous hemorrhage (VH) in individuals with moderate versus low lactate dehydrogenase (LDH) levels, and high versus low LDH levels. The dashed vertical line represents an RR of 1.0, indicating no difference in risk compared to the reference (low LDH) group. Each horizontal line represents the 95% CI for the relative risk, with the dot indicating the point estimate of the relative risk. For all three complications (PDR, TRD, and VH), both the "Moderate vs Low LDH" and "High vs Low LDH" groups show relative risks (RRs) greater than 1.0, indicating a statistically significant increased risk of PDR, TRD, and VH in individuals with moderate and high LDH levels compared to those with low LDH levels.
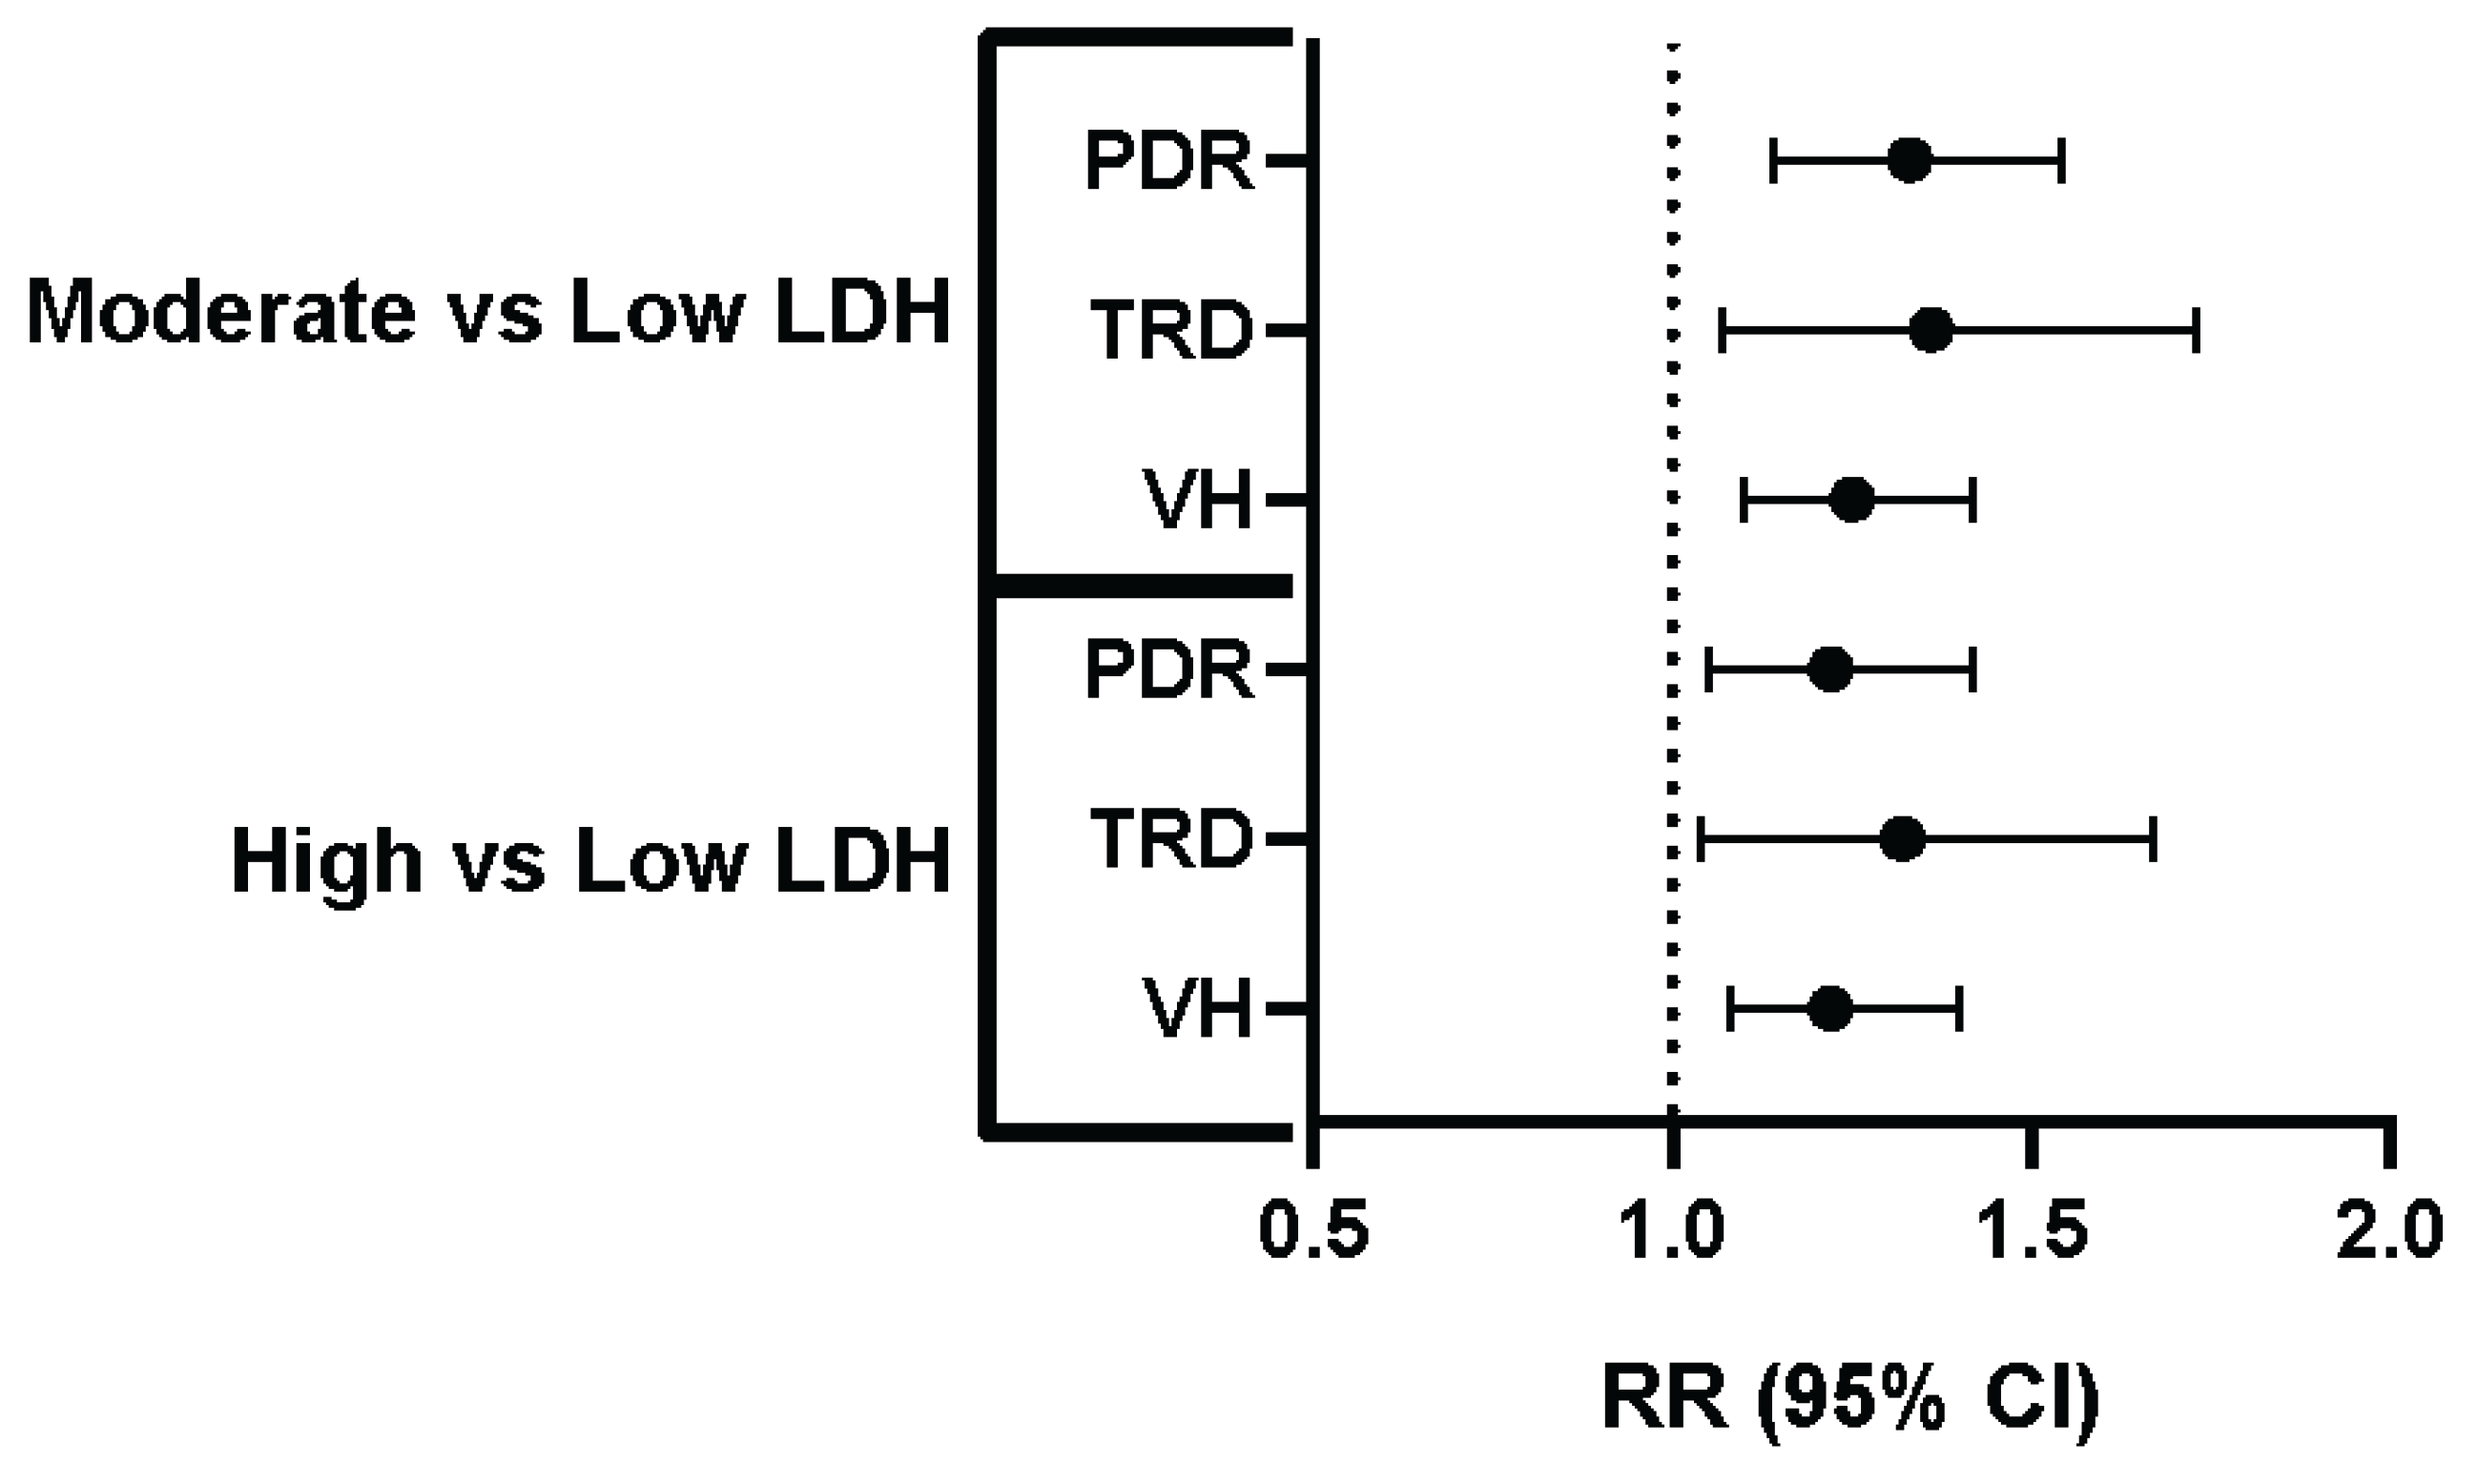

Table 1.
Baseline Characteristics of Patients With Non-Proliferative Diabetic Retinopathy: Moderate vs. Low LDH Cohorts Before and After Propensity Score Matching by LDH Level Before and After Propensity Score Matching.
Table 1.
Baseline Characteristics of Patients With Non-Proliferative Diabetic Retinopathy: Moderate vs. Low LDH Cohorts Before and After Propensity Score Matching by LDH Level Before and After Propensity Score Matching.
| Before Matching | After Matching | |||||
|---|---|---|---|---|---|---|
| Characteristics |
Moderate LDH (n = 14,615) |
Low LDH (n = 13,514) |
Standardized Difference |
Moderate LDH (n = 11,708) |
Low LDH (n = 11,708) |
Standardized Difference |
| Age, mean ± SD | 63.5 ± 13.5 | 62.9 ± 13.7 | 0.0473 | 63.1 ± 13.5 | 63.2 ± 13.6 | 0.0034 |
| Gender, No. (%) | ||||||
| Male | 6,878 (49.92%) | 6,493 (52.94%) | 0.0603 | 6,121 (52.28%) | 6,106 (52.15%) | 0.0026 |
| Race, No. (%) | ||||||
| White | 7,350 (53.35%) | 7,120 (58.05%) | 0.0947 | 6,708 (57.29%) | 6,712 (57.33%) | 0.0007 |
| Black or African American | 3,688 (26.77%) | 2,764 (22.53%) | 0.0983 | 2,762 (23.59%) | 2,734 (23.35%) | 0.0056 |
| Asian | 554 (4.02%) | 512 (4.17%) | 0.0077 | 477 (4.07%) | 485 (4.14%) | 0.0034 |
| Native Hawaiian or Other Pacific Islander | 145 (1.05%) | 100 (0.82%) | 0.0247 | 99 (0.85%) | 97 (0.83%) | 0.0019 |
| American Indian or Alaska Native | 133 (0.97%) | 93 (0.76%) | 0.0224 | 91 (0.78%) | 93 (0.79%) | 0.0019 |
| Other Race | 631 (4.58%) | 568 (4.63%) | 0.0024 | 537 (4.59%) | 540 (4.61%) | 0.0012 |
| Unknown Race | 1,277 (9.27%) | 1,109 (9.04%) | 0.0079 | 1,034 (8.83%) | 1,047 (8.94%) | 0.0039 |
| Ethnicity, No. (%) | ||||||
| Hispanic/LatinX | 1,791 (13.00%) | 1,549 (12.63%) | 0.0111 | 1,482 (12.66%) | 1,497 (12.79%) | 0.0038 |
| Comorbidities, No. (%) | ||||||
| Essential (primary) hypertension | 11,983 (86.97%) | 10,369 (84.53%) | 0.0698 | 10,041 (85.76%) | 10,051 (85.85%) | 0.0024 |
| Hyperlipidemia | 11,076 (80.39%) | 9,563 (77.96%) | 0.0598 | 9,269 (79.17%) | 9,264 (79.13%) | 0.0011 |
| T2DM with mild NPDR without macular edema | 4,092 (29.70%) | 3,722 (30.34%) | 0.0141 | 3,535 (30.19%) | 3,502 (29.91%) | 0.0061 |
| T2DM with mild NPDR with macular edema | 787 (5.71%) | 656 (5.35%) | 0.0159 | 631 (5.39%) | 639 (5.46%) | 0.0030 |
| T2DM with moderate NPDR without macular edema | 1,423 (10.33%) | 1,141 (9.30%) | 0.0345 | 1,092 (9.33%) | 1,108 (9.46%) | 0.0047 |
| T2DM with moderate NPDR with macular edema | 764 (5.55%) | 607 (4.95%) | 0.0268 | 585 (5.00%) | 592 (5.06%) | 0.0027 |
| T2DM with severe NPDR without macular edema | 668 (4.85%) | 503 (4.10%) | 0.0362 | 474 (4.05%) | 489 (4.18%) | 0.0065 |
| T2DM with severe NPDR with macular edema | 464 (3.37%) | 353 (2.88%) | 0.0282 | 348 (2.97%) | 346 (2.96%) | 0.0010 |
| Primary open-angle glaucoma | 717 (5.20%) | 543 (4.43%) | 0.0363 | 531 (4.54%) | 533 (4.55%) | 0.0008 |
| Proteinuria | 3,442 (24.98%) | 2,599 (21.19%) | 0.0901 | 2,613 (22.32%) | 2,589 (22.11%) | 0.0049 |
| Alcohol dependence | 385 (2.79%) | 342 (2.79%) | 0.0004 | 320 (2.73%) | 327 (2.79%) | 0.0036 |
| Tobacco use | 783 (5.68%) | 679 (5.54%) | 0.0064 | 630 (5.38%) | 653 (5.58%) | 0.0086 |
| Central retinal artery occlusion | 57 (0.41%) | 45 (0.37%) | 0.0075 | 42 (0.36%) | 43 (0.37%) | 0.0014 |
| Retinal artery branch occlusion | 54 (0.39%) | 49 (0.40%) | 0.0012 | 49 (0.42%) | 47 (0.40%) | 0.0027 |
| Partial retinal artery occlusion | 43 (0.31%) | 41 (0.33%) | 0.0039 | 38 (0.33%) | 37 (0.32%) | 0.0015 |
| Central retinal vein occlusion | 199 (1.44%) | 160 (1.30%) | 0.0120 | 159 (1.36%) | 157 (1.34%) | 0.0015 |
| Tributary (branch) retinal vein occlusion | 193 (1.40%) | 150 (1.22%) | 0.0156 | 150 (1.28%) | 145 (1.24%) | 0.0038 |
| Low income | 68 (0.49%) | 41 (0.33%) | 0.0248 | 37 (0.32%) | 41 (0.35%) | 0.0059 |
| Intravitreal injection | 1,360 (9.87%) | 1,005 (8.19%) | 0.0585 | 998 (8.52%) | 993 (8.48%) | 0.0015 |
| Lab Values, mean ± SD | ||||||
| Hemoglobin | 10.5 ± 2.37 | 10.9 ± 2.42 | 0.1826 | 10.5 ± 2.39 | 10.9 ± 2.41 | 0.1474 |
| Hemoglobin A1c | 7.68 ± 1.97 | 7.64 ± 1.96 | 0.0246 | 7.69 ± 1.96 | 7.63 ± 1.96 | 0.0283 |
| Triglyceride | 148 ± 147 | 154 ± 136 | 0.0408 | 150 ± 153 | 154 ± 135 | 0.0301 |
| Cholesterol | 154 ± 53.7 | 152 ± 50.3 | 0.0511 | 154 ± 52.6 | 152 ± 50.3 | 0.0370 |
| Body Mass Index | 31.2 ± 7.88 | 30.8 ± 7.56 | 0.0461 | 31.3 ± 7.89 | 30.8 ± 7.54 | 0.0597 |
LDH: Lactate dehydrogenase, SD: standard deviation, No.: Number of patients, T2DM: Type 2 diabetes mellitus, NPDR: Non-proliferative diabetic retinopathy.
Table 2.
Baseline Characteristics of Patients With Non-Proliferative Diabetic Retinopathy: High vs. Low LDH Cohorts Before and After Propensity Score Matching by LDH Level Before and After Propensity Score Matching.
Table 2.
Baseline Characteristics of Patients With Non-Proliferative Diabetic Retinopathy: High vs. Low LDH Cohorts Before and After Propensity Score Matching by LDH Level Before and After Propensity Score Matching.
| Before Matching | After Matching | |||||
|---|---|---|---|---|---|---|
| Characteristics |
High LDH (n = 21,915) |
Low LDH (n = 13,514) |
Standardized Difference |
High LDH (n = 12,154) |
Low LDH (n = 12,154) |
Standardized Difference |
| Age, mean ± SD | 62.6 ± 13.2 | 62.9 ± 13.7 | 0.0187 | 62.9 ± 13.3 | 62.9 ± 13.7 | 0.0009 |
| Gender, No. (%) | ||||||
| Male | 10,257 (50.05%) | 6,493 (52.94%) | 0.0577 | 6,468 (53.22%) | 6,417 (52.80%) | 0.0084 |
| Race, No. (%) | ||||||
| White | 10,202 (49.78%) | 7,120 (58.05%) | 0.1664 | 7,087 (58.31%) | 7,039 (57.92%) | 0.0080 |
| Black or African American | 6,169 (30.10%) | 2,764 (22.53%) | 0.1725 | 2,721 (22.39%) | 2,757 (22.68%) | 0.0071 |
| Asian | 909 (4.44%) | 512 (4.17%) | 0.0129 | 531 (4.37%) | 505 (4.16%) | 0.0106 |
| Native Hawaiian or Other Pacific Islander | 143 (0.70%) | 93 (0.76%) | 0.0071 | 96 (0.79%) | 93 (0.77%) | 0.0028 |
| American Indian or Alaska Native | 199 (0.97%) | 100 (0.82%) | 0.0166 | 91 (0.75%) | 99 (0.82%) | 0.0075 |
| Other Race | 862 (4.21%) | 568 (4.63%) | 0.0207 | 556 (4.58%) | 560 (4.61%) | 0.0016 |
| Unknown Race | 2,009 (9.80%) | 1,109 (9.04%) | 0.0261 | 1,072 (8.82%) | 1,101 (9.06%) | 0.0084 |
| Ethnicity, No. (%) | ||||||
| Hispanic/LatinX | 2,355 (11.49%) | 1,549 (12.63%) | 0.0349 | 1,504 (12.38%) | 1,527 (12.56%) | 0.0057 |
| Comorbidities, No. (%) | ||||||
| Essential (primary) hypertension | 18,027 (87.97%) | 10,369 (84.53%) | 0.0998 | 10,311 (84.84%) | 10,300 (84.75%) | 0.0025 |
| Hyperlipidemia | 16,602 (81.01%) | 9,563 (77.96%) | 0.0756 | 9,536 (78.46%) | 9,508 (78.23%) | 0.0056 |
| T2DM with mild NPDR without macular edema | 5,704 (27.83%) | 3,722 (30.34%) | 0.0553 | 3,703 (30.47%) | 3,673 (30.22%) | 0.0054 |
| T2DM with mild NPDR with macular edema | 980 (4.78%) | 656 (5.35%) | 0.0258 | 663 (5.46%) | 649 (5.34%) | 0.0051 |
| T2DM with moderate NPDR without macular edema | 1,958 (9.55%) | 1,141 (9.30%) | 0.0086 | 1,166 (9.59%) | 1,125 (9.26%) | 0.0115 |
| T2DM with moderate NPDR with macular edema | 928 (4.53%) | 607 (4.95%) | 0.0198 | 608 (5.00%) | 600 (4.94%) | 0.0030 |
| T2DM with severe NPDR without macular edema | 951 (4.64%) | 503 (4.10%) | 0.0264 | 501 (4.12%) | 501 (4.12%) | 0.0000 |
| T2DM with severe NPDR with macular edema | 589 (2.87%) | 353 (2.88%) | 0.0002 | 366 (3.01%) | 351 (2.89%) | 0.0073 |
| Primary open-angle glaucoma | 1,044 (5.09%) | 543 (4.43%) | 0.0314 | 516 (4.25%) | 542 (4.46%) | 0.0105 |
| Proteinuria | 5,033 (24.56%) | 2,599 (21.19%) | 0.0803 | 2,598 (21.38%) | 2,591 (21.32%) | 0.0014 |
| Alcohol dependence | 720 (3.51%) | 342 (2.79%) | 0.0415 | 323 (2.66%) | 340 (2.80%) | 0.0086 |
| Tobacco use | 1,155 (5.64%) | 679 (5.54%) | 0.0044 | 678 (5.58%) | 678 (5.58%) | 0.0000 |
| Central retinal artery occlusion | 86 (0.42%) | 45 (0.37%) | 0.0084 | 43 (0.35%) | 45 (0.37%) | 0.0027 |
| Retinal artery branch occlusion | 74 (0.36%) | 49 (0.40%) | 0.0062 | 46 (0.38%) | 49 (0.40%) | 0.0040 |
| Partial retinal artery occlusion | 65 (0.32%) | 41 (0.33%) | 0.0030 | 39 (0.32%) | 41 (0.34%) | 0.0029 |
| Central retinal vein occlusion | 243 (1.19%) | 160 (1.30%) | 0.0107 | 155 (1.28%) | 157 (1.29%) | 0.0015 |
| Tributary (branch) retinal vein occlusion | 252 (1.23%) | 150 (1.22%) | 0.0006 | 149 (1.23%) | 146 (1.20%) | 0.0023 |
| Low income | 86 (0.42%) | 41 (0.33%) | 0.0139 | 38 (0.31%) | 41 (0.34%) | 0.0043 |
| Intravitreal injection | 1,779 (8.68%) | 1,005 (8.19%) | 0.0175 | 991 (8.15%) | 1,000 (8.23%) | 0.0027 |
| Lab Values, mean ± SD | ||||||
| Hemoglobin | 10.1 ± 2.32 | 10.9 ± 2.42 | 0.3197 | 10.2 ± 2.34 | 10.9 ± 2.42 | 0.2917 |
| Hemoglobin A1c | 7.7 ± 2.01 | 7.64 ± 1.96 | 0.0340 | 7.69 ± 1.99 | 7.64 ± 1.96 | 0.0256 |
| Triglyceride | 155 ± 129 | 154 ± 136 | 0.0081 | 157 ± 131 | 154 ± 136 | 0.0202 |
| Cholesterol | 154 ± 54.2 | 152 ± 50.3 | 0.0466 | 152 ± 53.7 | 152 ± 50.4 | 0.0048 |
| Body Mass Index | 31 ± 7.79 | 30.8 ± 7.56 | 0.0169 | 30.9 ± 7.69 | 30.8 ± 7.55 | 0.0091 |
LDH: Lactate dehydrogenase, SD: standard deviation, No.: Number of patients, T2DM: Type 2 diabetes mellitus, NPDR: Non-proliferative diabetic retinopathy.
Table 3.
Codes Used in the Study.
| Code System | Code | Description |
|---|---|---|
| ICD-10-CM | I10 | Essential (primary) hypertension |
| ICD-10-CM | E78 | Disorders of lipoprotein metabolism and other lipidemias |
| ICD-10-CM | E11.329 | Type 2 diabetes mellitus with mild NPDR without macular edema |
| ICD-10-CM | R80 | Proteinuria |
| ICD-10-CM | E11.339 | Type 2 diabetes mellitus with moderate NPDR without macular edema |
| ICD-10-CM | E11.321 | Type 2 diabetes mellitus with mild NPDR with macular edema |
| ICD-10-CM | Z72.0 | Tobacco use |
| ICD-10-CM | E11.331 | Type 2 diabetes mellitus with moderate NPDR with macular edema |
| ICD-10-CM | H40.11 | Primary open-angle glaucoma |
| ICD-10-CM | E11.349 | Type 2 diabetes mellitus with severe NPDR without macular edema |
| ICD-10-CM | E11.341 | Type 2 diabetes mellitus with severe NPDR with macular edema |
| ICD-10-CM | F10.2 | Alcohol dependence |
| ICD-10-CM | H34.81 | Central retinal vein occlusion |
| ICD-10-CM | H34.83 | Tributary (branch) retinal vein occlusion |
| ICD-10-CM | H34.23 | Retinal artery branch occlusion |
| ICD-10-CM | H34.1 | Central retinal artery occlusion |
| ICD-10-CM | H34.21 | Partial retinal artery occlusion |
| ICD-10-CM | Z59.6 | Low income |
| CPT | 67028 | Intravitreal injection of a pharmacologic agent (separate procedure) |
| TNX Curated | 9014 | Hemoglobin [Mass/volume] in Blood |
| TNX Curated | 9037 | Hemoglobin A1c/Hemoglobin.total in Blood |
| TNX Curated | 9004 | Triglyceride [Mass/volume] in Serum, Plasma or Blood |
| TNX Curated | 9083 | Body Mass Index (BMI) |
| TNX Curated | 9000 | Cholesterol [Mass/volume] in Serum or Plasma |
| ICD-10-CM | E11.33 | Type 2 diabetes mellitus with moderate NPDR |
| ICD-10-CM | E11.31 | Type 2 diabetes mellitus with unspecified diabetic retinopathy |
| ICD-10-CM | E11.32 | Type 2 diabetes mellitus with mild NPDR |
| ICD-10-CM | E11.34 | Type 2 diabetes mellitus with severe NPDR |
| TNX Curated | 9052 | Lactate dehydrogenase [Enzymatic activity/volume] in Serum or Plasma |
ICD-10-CM = International Classification of Diseases, 10th Revision, Clinical Modification; CPT = Current Procedural Terminology; TNX = TriNetX curated variable; NPDR = Non-Proliferative Diabetic Retinopathy; BMI = Body Mass Index; LDH = Lactate Dehydrogenase.
Table 4.
Risk of Proliferative Diabetic Retinopathy and Related Complications by LDH Level.
| Comparison | Outcome | Risk (%) - Low LDH | Risk (%) - Comparison Group | Relative Risk (95% CI) |
|---|---|---|---|---|
| Low vs. Moderate LDH | PDR | 2.96% | 3.93% | 1.33 (1.14-1.54) |
| Low vs. Moderate LDH | TRD | 0.99% | 1.35% | 1.36 (1.07-1.73) |
| Low vs. Moderate LDH | VH | 3.51% | 4.38% | 1.25 (1.10-1.42) |
| Low vs. High LDH | PDR | 3.00% | 3.66% | 1.22 (1.05-1.42) |
| Low vs. High LDH | TRD | 0.96% | 1.27% | 1.32 (1.04-1.67) |
| Low vs. High LDH | VH | 0.96% | 1.27% | 1.22 (1.08-1.40) |
PDR: Proliferative Diabetic Retinopathy: TRD: Tractional Retinal Detachment: VH: Vitreous Hemorrhage: LDH: Lactate Dehydrogenase: CI: Confidence Interval.
Disclaimer/Publisher’s Note: The statements, opinions and data contained in all publications are solely those of the individual author(s) and contributor(s) and not of MDPI and/or the editor(s). MDPI and/or the editor(s) disclaim responsibility for any injury to people or property resulting from any ideas, methods, instructions or products referred to in the content. |
© 2025 by the authors. Licensee MDPI, Basel, Switzerland. This article is an open access article distributed under the terms and conditions of the Creative Commons Attribution (CC BY) license (http://creativecommons.org/licenses/by/4.0/).
Copyright: This open access article is published under a Creative Commons CC BY 4.0 license, which permit the free download, distribution, and reuse, provided that the author and preprint are cited in any reuse.


