Submitted:
06 September 2025
Posted:
08 September 2025
You are already at the latest version
Abstract
This paper examines the environmental and infrastructure determinants of respiratory disease mortality (TRD) across European nation-states through an original combination of econometric, machine learning, clustering, and network-based approaches. The primary scientific inquiry is how structural environmental variables, such as land use, energy mix, sanitation, and climatic stress, co-interact to affect respiratory mortality across regions. Although prior literature has addressed individual environmental predictors in singleton settings, this paper fills an integral gap by using a multi-method, systems-level analysis that accounts for interdependencies as well as contextual variability. The statistical analysis draws on panel data covering several years and nation-states using fixed effects regressions with robust standard errors for evaluating the effects of variables such as agricultural land use (AGRL), access to electricity (ELEC), renewable energy (RENE), freshwater withdrawals (WTRW), cooling degree days (CDD), and sanitation (SANS). We employ cluster analysis and density-based methodology to identify spatial and environmental groupings, while machine learning regressions—specifically, K-Nearest Neighbors (KNN)—are utilized for predictive modeling and evaluating feature importance. Lastly, network analysis identifies the structural connections between variables, including influence metrics and directional weights. We obtain the following results: Consistently, across all regressions, AGRL, WTRW, and SANS feature importantly when determining the effect for TRD. Consistently across all networks, influencer metrics identify AGRL, WTRW, and SANS as key influencers. Consistently across all models, the best-performing predictive regression identifies the nonlinear (polynomial or non-monotone), context-sensitive nature of the effects. Consistent with the network results, the influencer metrics suggest strong connections between variables, with a particular emphasis on the importance of holistic environmental health approaches. Combining the disparate yet complementary methodological tools, the paper provides robust, understandable, yet policy-relevant insights into the environmental complexity driving respiratory health outcomes across Europe.
Keywords:
Respiratory Disease Mortality
; Environmental Determinants
; Machine Learning Regression
; Network Analysis
; Panel Data Models
1. Introduction
Rising rates of respiratory diseases across Europe have caused increasing alarm among policymakers, public health authorities, and environmental researchers. Regarding shifting air quality, changing energy futures, and climatic stress caused by urbanization and climate change, understanding the mechanisms by which environmental conditions and infrastructure contribute to respiratory mortality has emerged as a priority for public health. Despite the vital contributions in environmental epidemiology, many previous studies have been sectoral or fragmented in scope, often failing to consider the systemic integration between ecological, infrastructural, and climatic variables. Such compartmentalization in methodology has led to the widespread application of linear or econometric models, which are not capable of capturing the multidimensionality and spatial heterogeneity characteristic of environmental-health linkages. Such gaps have been addressed by recent studies. For instance, Genowska et al. (2023) provide Polish birth cohort evidence associating robustly industrious air pollution with respiratory mortality, while Liu et al. (2022) and Gutman et al. (2022) unveil long-term air pollution exposure to extensively increase mortality due to pneumonia, as well as acute respiratory distress syndrome, respectively, across large European cohorts. Similarly, the EXHAUSTION project (Zafeiratou et al., 2023) reveals the mediation by localized climatic features, such as heat exposure, of respiratory mortality across the scale of small areas. Such findings reaffirm the need for multiscale, contextualized modeling, which is rare in mainstream approaches. This paper fills these gaps by offering an expansive, data-intensive description of the determinants of respiratory disease mortality (TRD) across European nation-states, utilizing a combined methodology of econometric regression, machine learning (KNN), and network analysis. Our principal research question is: How do structural environmental variables—electricity access, freshwater withdrawals, sanitation coverage, agricultural land use, fossil and renewable energy use, and heat-related climatic stress—intersect to influence respiratory disease mortality across European national contexts? Second, the present study extends prior findings in the literature exploring the broader determinants of respiratory health. For instance, Bush et al. (2024) and Yang & Zou (2025) pay attention to the role of social and subjective environmental determinants—early-life exposure and perceived ecologic quality—ramifying with material infrastructure in long-term respiratory endpoints. In a similar manner, Xu et al. (2023) and Zhang et al. (2024) provide evidence that cause-specific respiratory mortality is mediated by environmental greenness, as well as by long-term aerosol exposure, with a preference for combination with air pollution. Such findings mirror the non-linear effects uncovered by the KNN models in this paper, specifically for renewable energy sources (RENE) and sanitation exposure (SANS), with context-dependent relations with TRD. In an alternative spatial-epidemiological line, Cortes-Ramirez et al. (2023) unveil respiratory infection risk mapping across Colombian urban divisions, highlighting the value of high-grain, location-specific analysis—a strategy repeated here through European environmental-health profile clustering, as well as density-based partitioning. Prieto-Flores et al. (2021) also identify geographic disparities in respiratory mortality in urban regions such as Madrid, emphasizing the spatially non-uniform environmental risk on which the current study’s cluster analysis focuses. In this sense, the study is novel on three key fronts. Firstly, the study increases the analytical scope by integrating environmental, structural, and climatic variables on an overarching high-dimensionality platform. Rather than ignoring or omitting one or two exposures, the study models multi-dependencies among variables such as land use, electrification, sanitation, and temperature stress. Secondly, its structural composition is multicomponent: its econometric models allow causal inference, machine learning models reveal non-linear interactions, yet network analysis preserves structural interdependencies—balancing the weaknesses or incapacities of mainstream statistical thinking. Thirdly, the study employs additive feature attribution procedures (similar to SHAP values) to visualize the model’s predictions for easier interpretation, with the intention that the results are not only statistically robust but also deployable. The model identifies variables such as agricultural land use (AGRL) and coal-based electricity (COAL) as consistently associated with high respiratory mortality, presumably due to their contribution to particulate pollution. In contrast, access to electricity (ELEC) and freshwater withdrawals (WTRW) are highlighted as protectants, presumably by virtue of enabling cleaner indoor conditions and access to better sanitation. Notably, sanitation (SANS) has a seemingly counterintuitive positive connection with TRD—potentially hinting at urban transition systems or correlated urban air pollution, similar to the results obtained by Pona et al. (2021), among others, on the inadequacy of using indicators based solely on physical infrastructure. Model comparison also identifies instance-based machine learning strategies—namely K-Nearest Neighbors (KNN)—as better positioned than linear regression models in terms of prediction, due to their better ability to identify spatially nuanced, as well as structural, inclinations. This is particularly crucial, especially considering results such as those of Zhang et al. (2024), among others, including Liu et al. (2022), which report multi-exposure interactions for the risk of respiratory mortality. In unison, the network analysis employed in the current study depicts how variables such as sanitation, in addition to land use, hold key structural positions, serving as brokers between disparate environmental subsystem interactions. By grounding the analysis in cross-national panel data, the study offers not only theoretical novelty but also implementable knowledge for the construction of health-environment policy. Findings support growing calls for multisectoral, whole-of-society responses combining environmental planning, energy sector transitions, and public health interventions. Such an integration is crucial in mitigating the long-standing respiratory disease burden, particularly in light of increasing climatic volatility and urbanization pressures throughout Europe. In the long term, the paper makes an original contribution to the environmental health literature by deriving a multidimensional empirical model for the system complexity of respiratory mortality. This research directly aligns with the most current environmental health literature on climate, air pollution, infrastructure, and spatial health inequities—from long-term exposure studies to spatial inequity mapping—providing an empirical foundation for stronger, fairer, and contextually rooted policy countermeasures to respiratory disease throughout Europe and other regions.
Section 2 shows a comprehensive literature review that situates respiratory disease mortality within environmental, climatic, infrastructural, and social determinants, emphasizing oxidative stress pathways, climate impacts, and inequalities. Section 3 shows the integrated analytical framework and variable definitions, detailing the eight key indicators (TRD, ELEC, AGRL, WTRW, CDD, COAL, SANS, RENE) that underpin the analysis. Section 4 shows the econometric results from fixed- and random-effects panel models, while Section 4.1 shows a robustness check with Driscoll–Kraay errors, confirming most associations but weakening significance for WTRW, CDD, and RENE. Section 5 shows the use of DBSCAN clustering to uncover environmental-health profiles, while Section 6 shows KNN regression as the best-performing predictive model, highlighting the influence of AGRL, RENE, and WTRW. Section 7 shows the network analysis, exposing systemic interdependencies among variables. Section 8 shows policy implications, Section 9 shows analytical limitations, and Section 10 shows the study’s conclusions on integrated approaches to respiratory health.
2. Literature Review
In an increasingly voluminous body of interdisciplinary literature, the realization is growing that respiratory health is not solely defined by direct pollutant exposures, but by the complex interlinkage between environmental, climatic, infrastructural, and socio-demographic determinants. Our selected articles provide a fundamental understanding of the multifaceted system, offering insights into causal mechanisms, distributional injustices, and the potential for integrative policy interventions. Such perspectives directly verify the evidence from our study, which innovates the field with systems-level, multi-methods analysis. With the combination of panel econometrics, machine learning (KNN), clustering, and network science, the study identifies agricultural land use (AGRL), sanitation (SANS), electricity access (ELEC), and climatic stress (CDD) as structural key drivers for respiratory disease mortality (TRD) in European contexts. At the mechanisms level, Albano et al. (2022) and Bălă et al. (2021) identify oxidative stress as an overarching biological pathway through which airborne toxins cause inflammation and tissue disruption in the respiratory system. Such evidence corroborates the connections between land use, sources of pollution, and respiratory mortality in your model, particularly where AGRL and COAL use function as surrogates for particulate exposures. In a similar measure, Lee et al. (2021) confirm that outdoor impurities, including PM, SO₂, and NO₂, are predominant precipitants for chronic respiratory disease. However, Maung et al. (2022) unveil that indoor exposures—including VOCs and cookstove-related particulates—amplify the risks among the vulnerable. Such evidence aligns with the findings in your study, which observed that expanded access to electricity (ELEC) has likely reduced respiratory mortality, most likely due to a decrease in indoor biomass dependence. Climate-related stress or stressors have a disproportionately severe effect on most workers. Agache et al. (2022) and Bell et al. (2024) list climate change as an aggravating factor among the determinants of respiratory health, with the mediating effect of extreme heat, quantified by Cooling Degree Days (CDD), in your study. Grigorieva & Lukyanets (2021) deconstruct the accretive effect of heat and pollution, echoing the evidence from your study on the interactive effect between environmental exposures. Momtazmanesh et al. (2023), in the GBD 2019 update, confirm the predominance of air pollution, climate, and occupational exposures as global risk factors for respiratory disease—directly replicating the explanatory power of COAL, AGRL, and SANS in your fixed-effects models. Urban configuration and greenness reveal themselves as principal mediating variables. Ali et al. (2022) and Bauwelinck et al. (2021) demonstrate that access to proximal urban green space reduces respiratory risk, particularly among the elderly. Bikis (2023) offers dual commentary on greenness, quantifying its buffering effect but cautioning its pollutant-trapping effect in poorly ventilated spots. Qualifiers are corroborated by your network and cluster analyses, which demonstrate context-sensitive connections between RENE, land use, and TRD. Additional corroboration is provided by Wu et al. (2021), whose results replicate that vegetation-based urban configurations hold promise for reducing respiratory burden when species selection, density, and spatial distance are optimized. Wu et al. (2024) corroborate the promise of roadside green space in enhancing air quality near old-age homes, highlighting the need for localized spatial interventions. Environmental benefits, however, are not programmatically distributed. Berberian et al. (2022) chronicle racialized gaps in respiratory health outcomes resulting from climate stress in the U.S., while Chang et al. (2024) critique the lack of global protocols addressing governmental respiratory inequities and the appreciation of Indigenous communities. Such inequities are revealed by Pona et al. (2021), who discover catastrophic infrastructural failings in Nigeria, challenging the assumption that access to services, including sanitation, will automatically bestow health benefits—a factor appearing in your counterintuitive conclusion that larger SANS corresponds positively with TRD, potentially indicating in-transition or unquantified urban density effects. COVID-19 has recently spotlighted the effect of compounded vulnerability. Bloom et al. (2021) reveal that individuals with pre-existing respiratory diseases enjoyed lower risks during the pandemic, indicating that environmental resilience must be coupled with public health readiness. This co-occurs with the time dummies in your study, registering the TRD peaks occurring during 2020–2021. Sophistication also arises from Silveyra et al. (2021), who reveal sex and gender differences in pulmonary responses to environmental challenges. Though not directly simulated by you, such heterogeneity provides an intriguing axis for future stratification. Likewise, Solomon et al. (2023) link environmental exposure to clinical progression in interstitial lung disease, providing pharmaceutical evidence—through pirfenidone—of how environment-elicited diseases necessitate both preventive and treatment strategies. Lastly, Wilkinson & Woodcock (2022) connect asthma inhaler environmental externalities, offering systems of health as both drivers and potential correctives for environmental loss. This is analogous to how you conclude that RENE has ambiguous effects on TRD, an artifact most likely where “renewables” would still be typical biomass. Collectively, these all provide support for three overarching findings: (1) respiratory health is governed by systemic interdependencies across environmental, climactic, infrastructural, and social scales; (2) biological, and clinical pathways—such as oxidative stress—provide mechanistic support for these relations; as well as (3) environmental health risks aren’t proportionally allocated, so need socially aware, cross-sectoral approaches. This European paper takes a step further by demonstrating how network centrality, clustering heterogeneity, and nonlinear predictive modeling (through KNN) can disclose hidden structures and also serve as foci for policy-amenable leverage. In doing so, it provides an excellent empirical foundation for constructing combined interventions with the potential to reduce the respiratory disease burden in an environmental change scenario (Table 1).
3. Integrated Analytical Framework and Variable Definitions
This quantitative analysis examines eight predictors for how environmental and infrastructural variables relate to respiratory disease mortality (TRD). TRD represents the number of deaths due to respiratory diseases for 100,000 residents. Access to electricity (ELEC) represents the proportion of the population with access to stable electric power. Agricultural land (AGRL) represents the proportion of cropland area. Water withdrawals (WTRW) represent the intensity of consumptive water. Cooling Degree Days (CDD) represent equivalent space cooling demand due to heat. Coal electricity (COAL) represents the proportion of power generated by coal. Safe sanitation (SANS) offers access to improved sanitation. Renewable energy (RENE) represents the proportion of clean energy. These indicators establish public health and sustainability (Table 2).
Methodology. This study combines several analytical approaches, including panel data analysis, clustering methods, machine learning regression, and network analysis, to examine the environmental determinants of respiratory disease mortality among European states. In its multi-approach design, the study offers an in-depth, multi-level set of findings on complex relations across the space of infrastructure, climatic, and health variables. By connecting approaches instead of dividing them, the study presents an overarching analytical framework where each approach has its counterpart findings, providing validity as well as interpretation for the results. Allowing for identification over time as well as between-country dynamic effects, the analysis begins with the use of panel data models to estimate over-time changes in respiratory disease mortality relative to environmental variables. Allowing for identification over time as well as between countries, the models capture both persistence and variability across European country settings for effects. The models for identification feature both fixed effects models and random effects models, further substantiated by robustness checks across alternative settings for the models. In these approaches, Vasilescu et al. (2024) align with the author, who applies panel clustering regression across the analysis to explore income inequalities across the EU, with explicit consideration of the extent to which structural heterogeneity has the potential to provide policy-relevant findings. In a similar fashion to the Leogrande et al. (2022a) panel-based designs, the panel-based approaches feature methodology counterparts for exploring the dynamics of digital governance across European states, with the implication that panel econometrics offers useful approximations for the multi-country complexity. Having followed through on the findings across the econometrics, the study applies unsupervised clustering procedures—hierarchical, including DBSCAN (density-based clustering)—to identify typological subgroups with similar configurations across environmental health. These procedures identify structural heterogeneity across the dataset, providing insights into country typologies as well as combinations of variables associated with high or low mortality burdens. In its application for clustering, the approach investigated by Krstić (2023) examined climate change configurations across the EU, where the integration of regression and clustering identified varied regional trajectories. Similarly, Leogrande et al. (2023) employ the application of k-means clustering with predictive learning in the extraction of typologies from European scientific outputs, thereby offering evidence for the suitability of clustering for typological partitioning in high-dimensional data. To analyze the predictive relations, the study employs a set of supervised machine learning algorithms—viz. K-Nearest Neighbors (KNN), Random Forests, Support Vector Machines (SVM), and Artificial Neural Networks (ANN)—to analyze the relations between the variables. All these are quantified with the performance metrics such as MSE, RMSE, MAE, and R². In these, the KNN algorithm emerges as the best-performing algorithm, striking a balance between predictive power and understandability. This outcome aligns with the results of Leogrande et al. (2022b), who employed machine learning regressions to examine the determinants of European digital literacy. The results indicate that instance-based algorithms, such as KNN, outperform their parametric counterparts in handling multidimensional, nonlinear relations. Model understandability is promoted through the application of additive feature attribution techniques (similar to SHAP), whereby predictions are broken down by identifying the contribution of individual predictors—a methodology also advocated by ML-attuned conduct, as proposed by Leogrande et al. (2023). This last analytical tier also employs network analysis to present the interdependencies between environmental, infrastructural, and climatic variables. Salient metrics, such as degree centrality, betweenness, closeness, and expected influence, are applied to identify variables playing structural hubs or bridges. Weights are quantified with the assistance of coefficients by the econometric models, as well as by machine learning algorithms, thereby combining the unifying predictive evidence with the inferential evidence on the network. This systemic perspective offers an overarching relevance to the contributions made by variables such as agricultural land use, sanitation, and water withdrawals—confirming the postulation that respiratory health is nested in an interactive environmental system. Joint application of these techniques is one of the study’s most robust findings. One among these compensates for the deficiencies revealed by the rest: panel data provides causal inference with the addition of temporal controls; clustering identifies heterogeneity with the addition of country typologies; machine learning identifies nonlinear, high-dimensional relations; and network analysis identifies systemic structure. This interdisciplinary forum offers best practices in environmental modeling, data science for climate issues, and digital governance studies. By doing so, the paper provides an interdisciplinary examination of the determinants of respiratory mortality, thereby enhancing both its empirical validity and policy usefulness. By combining structural insights with statistical rigor, the methodology demonstrates how the integration (and not the separate, solo application) of analytical strategies provides an optimal strategy for addressing complex public health challenges in the context of an environmental change regime (Figure 1).
4. Environmental-Infrastructural Determinants of Respiratory Disease Mortality (TRD Model)
This subsection presents the primary econometric analysis, examining the impact of environmental and infrastructural indicators on total respiratory disease mortality (TRD) among European countries. Based on a panel data set comprising 238 observations across 38 national units over several years, the model specification accommodates both random-effects and fixed-effects regressions. Estimating the former, the primary objective is to identify the statistical connection between TRD and the explanatory set, which consists of access to power supply, agricultural proportion, abstracted water volumes, cooling degree days (used as a proxy for heat stress), coal-based power plants, safe sanitation, and renewable power penetration. Employing both random and fixed effects models, the analysis not only controls for the panel structure explicitly found in the data, but also for the possibility of unobserved country heterogeneity—a methodological practice consonant with recent European health and sustainability scholarship. For example, Stanciu et al. (2024) employ a similar panel data design to unravel the determinants of total mortality in the EU, highlighting the interactive effects among structural variables such as infrastructure, access to healthcare facilities, and environmental pressure on the construction of public health outcomes. Similarly, Andrei (2023) employs panel econometrics to analyze the environmental cost of economic growth among EU states, validating the importance of using fixed-effects specifications when examining complex, multivariate environmental-health relationships over the long term. A comparison between fixed and random effects, further enriched by diagnostic tests (e.g., Breusch–Pagan, Hausman, and joint significance tests), provides an evaluation of the robustness of the models as well as the validity of the specifications. This multilayered methodological practice ensures that the estimated TRD-environmental relations hold not only statistically but also substantively, thereby strengthening the policy relevance of the empirical findings. Notably, this study not only aligns with the larger strategy employed by the bulk of applied environmental health models but also contributes its voice to the emerging literature on socioeconomic-environmental determinants of population-level outcomes, in the tradition of life expectancy and disease burden. For example, Karma (2023) shows that socioeconomic indicators such as energy and the proportionate burden for infrastructure significantly impact the variability in life expectancy across Southeastern Europe—findings similar to the current study’s focus on the power supply access, the proportionate sanitation volume, and the proportionate volume for abstracted renewables in the construction that attaches to the construction for TRD. By integrating these layers of analysis, the econometric component provides empirical specificity as well as methodological rigor, offering an overarching picture of how infrastructural and environmental conditions shape respiratory health trajectories throughout European nation-states. We estimated the following equation:
Where i=411 and t=[2010;2021] (Table 3).
This discussion analyzes the determinants of respiratory disease mortality (TRD) across 38 national contexts by using an unbalanced panel data set with 238 observations across six to eleven years. TRD is defined as an energy access and composition function, with further controls for land use, freshwater withdrawals, climate heat stress, access to sanitation, and renewable energy penetration. We employ both random-effects generalized least squares (GLS) and fixed-effects estimation approaches, designing the specification to allow for robust analysis across all units as well as between-unit variance, while taking into account potential biases due to unobserved heterogeneity. This analytical arrangement follows on the heels of recent literature applying the panel data methodology for the analysis of environmental sustainability, energy transitions, as well as European climate adaptation (e.g., Galiński, 2023; Bonar, 2024; Andrei, 2023; Bytyqi et al., 2024), where the environmental stress-macro-/infra-variable interactions are increasingly analyzed using static as well as dynamic specifications. In particular, the GLS, as well as the fixed-effects arrangement, corresponds to some applied uses in public health epidemiology (e.g., Stanciu et al., 2024; see also environmental fiscal works by Anastasiou et al., 2024), providing support for the design’s robustness and practicability. TRD, the dependent variable, measures the number of respiratory-related deaths across 100,000 inhabitants, and it varies substantially across the panel (mean = 38.9; SD = 16.8), providing an informative interval for inference. Exogenous variables are power access (ELEC), agricultural shares (AGRL), freshwater withdrawals (WTRW), summer heat stress (cooling degree days; CDD), coal power for the purpose of electricity (COAL), access to safe sanitation (SANS), as well as renewable power force (electricity mix; RENE). In the random-effects setup, power access has a statistically significant protective effect on respiratory mortalities (coefficient: −0.8129; SE = 0.2515; z = −3.233), consistent with improved indoor air quality and better health access. This finding aligns with the broader European evidence on environmental health convergence during structural change (e.g., Wojciechowski et al., 2023; Mirović et al., 2021), where access to power infrastructure helps buffer population resilience against stressors caused by climate change and air pollution. In contrast, agricultural land share demonstrates a strong positive association (0.5151, SE = 0.1018, z = 5.061), potentially due to higher dust, drift of pesticides, or combustion of biomass—mechanisms characteristic for rural trace exposure pathways cited in agrarian-focussed health-environment studies (e.g., Maji & Boruah, 2025). Freshwater withdrawals (−0.1084, SE = 0.0395, z = −2.742) are negatively associated with TRD, presumably due to better hygiene infrastructure. Still, the interpretation must be corrected for the concern for the lack of ecological sustainability—a factor discussed in green growth evaluations for post-transition economies (see Andabayeva et al., 2025). Heat stress, operationalized through the term cooling degree days (CDD), emerges as the key risk factor (0.00449, SE = 0.00121, z = 3.694), aligning with the growing evidence linking weather-related thermal heat exposure to respiratory morbidity and mortality (Walkowiak et al., 2025). Similarly, coal-based electricity generation (0.1149, SE = 0.0416, z = 2.759) reaffirms the known respiratory risks associated with carbon-based energy sources (cf. Wojciechowski et al., 2023), while paralleling environmental tax and transition investigations in EU settings (Mirović et al., 2021). Positive coefficient for safe sanitation (SANS) (0.2605, SE = 0.0528, z = 4.929) comes somewhat counterintuitively, but potentially due to transition-phase or urban density or externality effects—findings which have nuanced meanings for public service expansion during rapid transformations (cf. Andrei, 2023; Stanciu et al., 2024). Similarly, the positive association for renewable energy penetration (RENE) (0.2497, SE = 0.0737, z = 3.390) may originate due to definitional ambiguity (e.g., inclusion or non-exclusion of traditional biomass) or transition-phase effects, highlighted in European- and Central Asian-type green economy studies (see Andabayeva et al., 2025). With the assumption for the fixed effects, results qualitatively hold: electricity access continues associating with lower TRD (−0.8178, SE = 0.2541, t = −3.218), agricultural land use registers an even larger positive effect (0.5987, SE = 0.1334, t = 4.486), and freshwater withdrawals associate protectively (−0.1364, SE = 0.0453, t = −3.009). Impact for CDD (0.00426), COAL (0.1209), SANS (0.2688), and RENE (0.2346) also holds with strong statistical support. Model fit statistics clearly favor the fixed-effects specification: the residual variance decreases from 60,652 to 766.6, the log-likelihood increases significantly (from −997.0 to −476.9), and all information criteria (AIC, BIC, HQIC) improve. The standard error of regression decreases by 16.2 to 1.99, also resulting in a better within-unit fit. Although fixed-effects models forgo the estimation of time-invariant covariates, they enable better control for latent heterogeneity—an issue also raised by fiscal and demographic panel studies (Anastasiou et al., 2024). Diagnostic checks reaffirm the panel structure. Both the Breusch–Pagan Lagrange Multiplier test (χ² = 580.15, p < 10⁻¹²⁷) and the F-test for heterogeneity across units (F = 341.85, p < 10⁻¹⁵⁶) both indicate using panel estimators. The Hausman test (χ² = 7.93, p = 0.339) indicates no statistically significant difference between fixed and random effects, corroborating the convergent validity of the approaches. High shrinkage parameter (θ = 0.9505) also supports the conclusion that the random-effects estimate approximates the fixed-effects estimate. Variance decomposition reveals that most variability in TRD occurs across countries (262.0) rather than within country observations (3.97), corroborating cross-sectional heterogeneity as the primary explanatory variation—a dynamic also observed in other EU-wide panel studies on mortality and environmental expenditure (Galiński, 2023). Positive serial correlation (ρ = 0.5004, Durbin–Watson = 0.7431) suggests the application of robust standard errors or dynamic specifications to correct the resulting downward bias, a point also raised by recent environmental panel studies (Mirović et al., 2021; Bytyqi et al., 2024). Despite this, the major results are robust across specifications and estimators. Joint tests support strong explanatory power: χ² = 109.1 (p < 10⁻²⁰) for random effects, F = 15.32 (p < 10⁻¹⁵) for fixed effects. Substantially, the effect sizes indicate that electrification lowers TRD by ~0.82 deaths per 100,000, and agricultural land expansion adds ~0.6 deaths. Heat exposure results in ~0.0045 deaths per degree per day, with coal-based electricity contributing ~0.12 deaths. Access to water protects, but sanitation and renewables paradoxically associate with high TRD—possibly due to compositional effects, urban unmeasured confounders, or policy implementation delays. Finally, the analysis offers robust, cross-validated panel evidence on the environmental and infrastructural determinants of respiratory mortality. The findings are robust, aligning with larger European panel data studies on energy, public finance, and health-environment interactions. They identify implementable channels—through electrification, climate adjustment, and structural reforms—through which environmental health performance can be improved, yet also present evidence on the complexity and transition nature of the European systems’ sustainability dynamics.
4.1. Robustness Analysis Using Driscoll–Kraay Standard Errors: Addressing Cross-Sectional Dependence and Temporal Correlation
To establish the reliability and credibility of the primary findings generated in the fixed- and random-effects panel estimations, robustness check with Driscoll–Kraay standard errors was conducted. Robustness checks feature as an integral part of empirical econometrics, especially when dealing with macro-panel data for numerous countries over the long haul. In these conditions, cross-sectional dependence, heteroskedasticity, and serial dependence are rampant validity dangers for inference. Heteroskedasticity-robust or clustered standard deviations would classically underestimate true standard deviations when the data feature cross-sectional dependence, hence generating overconfident test statistics. This problem is solved by the Driscoll–Kraay methodology by producing heteroskedasticity-consistent standard deviations resistant to quite general spatial as well as temporal dependence, hence facilitating more conservative yet plausible inference. Such adjustment comes particularly with the characteristic of the data: the European states are highly economically interdependent states, yet also highly interdependent states environmentally. This is expressed by the illustration by the observation by Yıldırım & Baycan (2023), where the booting energy productivity dynamics among the states in the EU would yield strong spatiotemporal dependencies whose effects would demand robust estimating strategies to avoid biased inference. In an alternative regional context, Fotio et al. (2024) demonstrate how environmental decay engages economic growth to determine the Sub-Saharan Africa child mortality, with particular reference to the need for observational spatially correlated processes when studying the health-environment relationships. Air pollutant diffusion, climate change stress, or coherent change resulting from policies (e.g., EU climate policies or COVID-19 pandemic change responses) instigate unobserved shocks to gain association across units as well as across time. Such is pertinent with regard to environmental and economic interdependence discussions relevant to the transition regimes where the blue economy, inclusive growth, as well as sustainability co-entwine (Han et al., 2025). Through the Driscoll–Kraay adjustment, potential bias resulting from such unobserved, spatially correlated processes is hence diminished, and the respective previous significant coefficients are tested with regard to whether they would persist in the stricter scale from which inference results (Table 4).
The Driscoll–Kraay specification keeps the fixed-effects estimator for controlling unobserved, time-invariant unit-level heterogeneity but exchanges the standard error estimation procedure for one that corrects for autocorrelation as well as for spatial correlation, using two lags. The model has 238 observations through 38 countries, consistent with the previous fixed-effects format. Overall model fit is still respectable, with an in-the-walls R-squared = 0.3909, so that close to 39% of the variability in respiratory disease mortality (TRD), across countries, is explained by the covariates. Of key importance, the covariates’ joint significance remains ultra-strong (F(17, 10) = 62,298.16, p < 0.001), substantiating the explanatory power even with this stringent correction. Of policy relevance, access to electricity (ELEC) keeps its negative relationship with respiratory mortality (coefficient = −1.2757), but statistically less so (t = −2.16, p = 0.056), indicating marginal statistical significance at the 10% level. This is substantively informative and consonant with widespread evidence globally that electrification helps reduce the dependence on biomass in the household sector, hence removing many sources of bad air that cause respiratory diseases, especially in settings with weak rural electrification—transition economies among others—a factor also highlighted by Owusu & Acheampong (2025), who note the role of the green finance, renewable energy, and digitization in providing access, on the one hand, but also facilitating inclusive growth, on the other. Agriculture land share (AGRL), on the other hand, is robust (coefficient = 0.6356), remaining statistically significant (t = 3.75, p = 0.004), noting the enduring respiratory risk with agriculture activities, including dust, drift losses due to pesticides, as wells as field burning. This is consonant with environmental health concerns represented by Akther et al. (2025), when they researched the dynamics of the municipals wastes in Europe with rural mismanagement and particulates exposure potentially degrading the human body. Freshwater withdrawals (WTRW), on the other hand, insists on the coefficient with the minus sign, but with less statistical power (t = −1.93, p = 0.082), indicating how the access to clean freshwater has an indirect contribution to the respiratory health through hygiene and mitigation of diseases. This outcome is in line with broader evidence by Han et al. (2025), who emphasize the need for alignment between blue economy principles as well as inclusive growth for transition economies, as well as by Samreen & Majeed (2022), who emphasize the need for the socio-political as well as environmental quality determinants in the construction of population health as well as ecological footprints. Cooling degree days (CDD) also retains its positive sign (0.00366), but the relevance fades (t = 1.59, p = 0.143), corroborating the challenge in positively estimating temperature effects in models where the autocorrelations are a problem. In any event, the directionality is consistent with findings such as by Yıldırım & Baycan (2023), who present how energy intensity multiplies with climate stress to expand inefficiencies as well as environmental risks across the EU. The coal-based electricity (COAL) term retains its statistically significant association with high TRD (coefficient = 0.1122, t = 2.47, p = 0.033), reconfirming the relevance of coal as a major environmental health risk due to particulate emissions as well as poor air quality. This is comparable with the evidence by Chu & Le (2022), who suggest fossil fuel intensity as the major cause of the pollution-related health risk among G7 economies even when they control for policy uncertainty as well as economic sophistication. Safe sanitation access (SANS) among all the variables has the most stable as well as robust association with TRD, retaining high statistical relevance (coefficient = 0.1755, t = 5.13, p < 0.001). This is somewhat surprising but would most likely connect with urbanization dynamics as well as transition infrastructure, in line with Abdi et al. (2025), who suggest that population growth density as well as infrastructual transitions across Sub-Saharan Africa will often generate ecological as well as health trade-offs. Note the renewable energy proportion (RENE) loses statistical relevance when using the Driscoll–Kraay correction (t = 1.20, p = 0.259), although the coefficient remains positive (0.1252). This loss may originate with the collinear problem with other variables representing the infrastructure or the fact that traditional biomass is counted as “renewable.” Similar complexities are addressed by Ofori et al. (2024), who examine the interdependencies between trade as well as innovation in the deployment of renewable across BRICS as well as MINT economies, as well as Hashemizadeh et al. (2021), who explore the contribution of the fiscal ability as well as public debt to the construction of the renewable energy paths. All the dummies for the years 2011-2020 have positive and statistically significant coefficients, for instance, 2019 (4.1117, t = 5.94, p < 0.001) and 2020 (3.8436, t = 5.17, p < 0.001). These potential determinants for world shocks—COVID-19, mobility shifts, disruptions for the macroeconomy, and access shifts for healthcare—favor the inclusion for the year’s fixed effects. As noted by Tursunov et al. (2025), the application for robust estimate procedures for the handling for the attrition biases and the missingness manages validity for the unbalanced longitudinal data for health. Again, the constant term is large (121.0853), but imprecise (p = 0.083), as would be expected when controls abound with fixed effects. Altogether, the Driscoll–Kraay estimator supports the robustness for the major results but legitimately reduce the list for the statistically significant predictors. Electricity access, agricultural land use, coal energy, and sanitation facilities preserve the directional and often statistically significant associations with TRD. Meanwhile, the diminished significance for freshwater withdrawals, renewable energy, and heat stress reveal the statistical power-robustness trade-off for the working assumption on the distribution for the data. The results also support the major claim for the critical importance for the modernization for the primary physical structure, the energy transition, as well as the integration for the environmental policies, for the achievement for the better change for the respiratory health—particularly for the transition economies with the rapid change. This conclusion corresponds with the comprehensive green transition narrative established by Majeed & Hashemizadeh (2021), as also Andrei (2023), and is also re-iterated by the studies for the inclusive growth (and also the transition economy literature by Han et al., 2025), with the crucial implication for the balancing for the economic growth with the environmental integrity with the evidence-based platforms.
5. Uncovering Environmental-Health Profiles with Density-Based Clustering (DBSCAN): Methodological Validation and Policy Insights
In deriving strong environmental as well as health profile for Europe, the current study applied many clustering algorithms for the investigation for the mortality for the respiratory disease as well as the environmental determinants. Through the application for six standard validity indices—comprising Dunn Index, Calinski–Harabasz Index, as well as Minimum Separation—there was systematic checking for the performance for each individual separate model. Of the algorithms checked, Density-Based Clustering (DBSCAN) was the most successful for the optimal balance for the inter-cluster separeibility as well as the intra-cluster compactness. To entrench its robustness, individual validity checks through silhouette scores, measures for the homogeneity for individual separate clusters, as well as visual checking through the assistance through the K-Distance as well as the t-SNE plots, also ensued. DBSCAN’s ability for successfully handling the points for the noise as well as ability for the identification for the non-regular shapes for the respective congregating clusters best suit for their disparate environmental-health data, hence the reason for selection for individual separate interpretation as well as for policy-worthy partitionings. Similar advantages for DBSCAN also have been shown for many individual separate applications including the optimization for the monitoring environmental through individual separate improvements for the algorithms (Regilan & Hema, 2024), the clustering the social behaviour among the wastes (Al Jauhar et al., 2025), as well as for nation-based health insurance participation (Nurmayanti et al., 2022). All these explorations all revolve on the flexibility for the algorithm for the derivation for the embedded for the high-dimension complex datasets. In the derivation for the optimum-performing clustering algorithm for the European nation-based for the description for the mortality for the respiratory disease as well as its environmental determinants, many individual models also underwent checking with the six standard validity indices: Maximum Diameter, Minimum Separation, Pearson’s γ, Dunn Index, Entropy, as well as the Calinski–Harabasz Index. All these simultaneously estimate the intra-cluster compactness, the inter-cluster separeibility, the homogeneity, as well as the overall partitioning quality. Of the algorithms checked, DBSCAN is the best bet. This conclusion also finds an echo for the methodological improvements for the robust density-based clustering such as the partitioning through the assistance through DBSCAN+, for the individual separate statistical significance boost for the division for the datasets for the noisy (Xie et al., 2021). In the present study, DBSCAN had the highest minimum separation score as 1.00 with the Dunn index also as 1.00, indicating the best compactness as well as the best separation. This Pearson’s γ value for the DBSCAN as 0.62 reflects an accepting but not strong relationship between distances along with membership. Comparing with the Hierarchical Clustering where the best Pearson’s γ reached is 1.00 and the Calinski—Harabasz index reached is respectable 0.95 but where by the very low minimum separation (0.26), the Dunn index (0.44), it found its performance dampened for practical interpretation. Likewise, these weaknesses for the particular hierarchical and partitioning approaches have been reported in Saliba et al. (2025) for precipitation clustering for Romania as well as in Syahzaqi et al. (2024) for environmental pollution profiling for Indonesia. Fuzzy C-Means and Model-Based Clustering under-performed across all metrics, particularly in entropy reduction and cohesion. Neighborhood-Based Clustering reached the highest Calinski–Harabasz index (1.00) and entropy (0.95), but its very low minimum separation (0.14) shown revealed over-partitioning. Random Forest, however, occasionally strong for classification settings, failed to best DBSCAN on unsupervised metrics relevant for this data set. DBSCAN’s superiority is also demonstrated in recent comparative studies, e.g., its use for clustering obesity risk trends (Geovani et al., 2024) as well as for the policy analysis for circular economy (Henriques et al., 2022), where uncovering hidden structures possesses explicit policy usefulness. Further, the versatility for DBSCAN for public health settings has an echo for its successful integration for the illustration for the depiction for the forecasts for an epidemic (Papageorgiou, 2025). Altogether, DBSCAN achieves the best balance for compactness, for separation, as well as for generalizability, making it the most appropriate solution for the spatially segmenting for environmental-health data. By its robustness for the noxious shapes as for distribution with considerable noise, it ensures that the delicate interdependencies are preserved rather than over-simplified by the rigid use for the partition. By these facts, DBSCAN becomes the selected the best clustering algorithm for the characterization for the description for the environmental-health for the profiles for Europe (Table 5).
Density-Based Clustering (DBSCAN), the top-performing unsupervised method by our comparison, demonstrates an unambiguous and meaningful separation of the data set in the data space into four clear clusters with one noise point. This corresponds with the intrinsic logic of the algorithm: it puts points in the clusters only when points are embedded in an appropriate density of neighbors so that core relations but not outliers are distinguished. Such insensitivity to noises as well as non-convex shapes of the clusters has furthermore been advocated for in advanced revisions on the method, for instance, DBSCAN+, adding statistical guarantees to density-based partitional clustering (Xie et al., 2021). In the current example, Cluster 1 dominates by 219 of 238 observations, indicating an intrinsic or majoritarian behavioral regularity in the environmental determinants across sampled countries. The other clusters (2, 3, and 4), with six observations only, are smaller in scale but potentially capturing edge regions or dissimilar policy conditions. Nevertheless, the smaller but high-cohesion-subclusters (2, 3, and 4) achieve highly high silhouette scores—0.853, 0.776, and 0.798 respectively—reflecting strong cohesion among points on the interior but excellent separation with regard to the rest of the clusters. We observe these outputs in line with the quality of DBSCAN to identify subgroups with high density but highly defined subgroups, shown for instance by the identification of pollutant monitoring sub-watersheds by the help of IoT (Regilan & Hema, 2024) through to geo-industrial clustering for Europe’s transition towards the circular economy (Mendez Alva et al., 2021). In contrast, the large but not exceptionally high silhouette score by part of the DBSCAN (0.165 by Cluster 1), suggests that the resulting DBSCAN group will bear some borderline points or heterogeneity on the interior. Explained proportion in the sense whereby the heterogeneity on the interior (and hence controlled by the respective shape parameters), it is exceptionally high for the overwhelming Cluster 1 (0.998), but near to zero for the other clusters, hence additionally emphasizing the overwhelming role for the DBSCAN-cluster 1 for the interior data structure. Following the very same tendency, the sum-of-squares-W (WSS) values are also most compact for the overwhelming DBSCAN-cluster 1 (WSS = 1.474), with the smaller DBSCAN-clusters also accepting appropriate dispersion for the number. All in all, the DBSCAN outputs indicate data where most sampled countries follow an individual environmental-mortality profile with few but distinctive cases on the outliers. Such smaller high-cohesion-subclusters may indicate exceptional socio-environmental paths, for which focused research in the policy analysis is justified (Table 6).
DBSCAN-extracted cluster means reveal explicit segregation in environmental and infrastratural configurations with respiratory disease mortality (TRD). Most abundant set, Cluster 1 (n = 219), concentrates near zero on all the variables with the implication for a rather balanced and regular set with mean exposure values along with intermediate values for health outcomes. With mean TRD values of 0.096, it indicates an average mortality rate comparable with the total European trends. In comparison, Cluster 0 and Cluster 2 yield significantly negative values for TRD (−1.647 and −1.686, respectively), indicating significantly below-average mortality for the respiratory tract. However, their respective configurations differ considerably in terms of infrastruture. Cluster 0 with one data anomaly (noise point), registers the bottom values across all the variables, particularly for water (WTRW = −3.748), electricity (ELEC = −0.656), and has the potential for representing an ultra-underdeveloped or data-anomalous situation. On the contrary, Cluster 2 has exceptionally high access to electricity (ELEC = 3.129), high renewable energy penetration (RENE = 0.197), but low agricultural land use—dimensions harmonious with successful respiratory outcomes. Clusters 3 and 4 with below-average TRD values (−0.996 and −0.529, respectively), register high access to electricity (ELEC = 3.459 and 2.014), with exceptionally high values for RENE (4.436 and 1.886), indicating regions with highly developed renewable installations. However, these deviate on sanitation (SANS = −1.074 for Cluster 3), agricultural land use (AGRL = 1.316 for Cluster 3 but −0.964 for Cluster 4), indicating non-uniform modes of development. These differences reflect findings for De Ridder et al. (2024), who observe how the environmental variables combined with the geographical ones influence the health outcomes in contradictory ways, demonstrated in the space-time dispersion of SARS-CoV-2. Individually, these signify the manner in which low values for the respiratory mortality are accompanied by high electrification, integration with renewals, and efficacious use of resources but with sanitation service and agricultural land use nuances dampening the relationship. Efficacy in identifying such subtle clusters for DBSCAN also reflects its larger uses in environmental and social system analysis, ranging from optimizing monitoring of ecological parameters using the Internet of Things (IoT) (Regilan & Hema, 2023) to clustering behavioral indicators for managing wastes (Al Jauhar et al., 2025). Such observations also highlight context-specialized strategies for the infrastructure in contributing to the determinants of public health (Table 7).
Figure 2 depicts two key visual diagnostics for validating and interpreting the DBSCAN (Density-Based Spatial Clustering of Applications with Noise) algorithm. To the left, the K-Distance Plot depicts the distance to the fifth nearest neighbor for each observation, in ascending order. We note an abrupt “elbow” at an approximate distance of 1.41, the equivalent to the curvature-maximum point itself, indicating an data-informed estimate for the epsilon (ε) parameter. This threshold is key in DBSCAN for the identification of the neighborhood radius where observations belong to the same cluster. Such data-driven parameter selection approaches follow along with current improvements in methodology, such as the K-NN–based ε calibration (Delgado & Morales, 2021), as with procedures for the stratified sampling in order to accurately refine DBSCAN parameterization (Monko & Kimura, 2023). This abrupt change after this point identifies the transition between denser clusters to less dense regions or potential outliers. To the right, the t-SNE Cluster Plot illustrates the two-dimensional embedding for the high-dimensional data space colored by the resulting membership for the identified clusters. Cluster 1 (pink), with most observations (n = 219), identifies the bulk as the central structure. In contrast, Clusters 2, 3, and 4 (yellow, green, blue), with six separated, compact observations each, indicate the identification of separate sub-structures for the data. One observation stands out identified by DBSCAN as an outlier (noise point; purple), an identification that holds correct. This visual evidence supports the successful identification by DBSCAN for relevant density-based structures successfully discriminating between the dense clusters, the transition regions, as with the isolated outliers. This combining the visual diagnostics with the outputs through the t-SNE visualizations is widespread recognized as an effective combination for the validation for non-linear structures across the multidimensional data (Bajal et al., 2022). This combination between the identification with the ε-threshold identification with the explicit space separation observed on the t-SNE plot supports the robustness for the identification by the algorithm for the complex non-linear groupings found on the environmental- and respiratory-mortality data (Figure 2).
Lastly, application of Density-Based Clustering (DBSCAN) provides an optimal, context-adaptive method for discovering environmental-health profiles among the European states. With high performance on many validity indices and ability to discover well-separated, self-coherent groupings—along with noise points—DBSCAN holds promise for complex, heterogeneous data. Equivalent to broader DBSCAN application, such as for environmental monitoring with the IoT (Regilan & Hema, 2023), to clustering garbage management behavior (Al Jauhar et al., 2025), the algorithm excels in processing irregular, real-world data to reveal structural, hidden relations. In comparison with highly structured traditional clustering algorithms, DBSCAN accommodates the irregularity and diversity emanating in public health and environmental systems. Output typologies reveal an overarching bulk demarcating average conditions with smaller, distinctive clusters denoting characteristic developmental or infrastructural conditions. Such capability to map systemic differentiation complements its application for geo-based industrial clustering for urban symbiosis and circularity by European regions (Mendez Alva et al., 2021), where identification of centers of convergence/divergence provides sustainable policy directions. Such patterns as identifying respiratory mortality with the assistance of the likes of access to electric power, sanitation access, or renewable energy penetration not only validate the methodology selection but also provide policy-significant evidence on the reciprocal effects between the environmental exposures on the one, with respective health outcomes on the other. With identification connecting the dots between respiratory mortality with the assistance of electric power access, sanitation access, or renewable energy penetration, the analysis provides evidence for the imperative for bespoke, region-by-region intervention strategies. DBSCAN thus demonstrates itself as at once technology-justified, yet substantively relevant to the tools applied in the field for environmental-epidemiologic analysis as for the design for spatial health policy.
6. KNN Regression for Environmental Determinants of Respiratory Mortality
In exploring the predictive relationship between European respiratory disease mortality and environmental variables, many machine learning models (algorithms) were tested for their accuracy, robustness, and interpretation. Of these, the most successful strategy turned out to be the K-Nearest Neighbors (KNN) algorithm. With its non-parametric expression, with predictions rendered through similarity between data points in high dimensional space, KNN sidesteps parametric assumptions on data distribution, instead taking advantage of complex, non-linear interactions among variables. This is especially relevant in heterogeneous environmental-health data, where structural variability as well as context-specific relations between the variables abound. Such KNN efficacy for environmental as well as for health prediction has also been reported among other recent applications, including the prediction of air pollution (Evitania, 2023) as well as the identification of lung cancers (Moon & Jetawat, 2024). See the following analysis for the following in-depth discussion on the superior prediction ability of the KNN model, including comparative bench-marking among other algorithms and feature interpretation. See also the discussion on the advantage of additive interpretation for the identification of individual-variable contribution to predicted values. In conclusion, KNN proves not only statistically the best but also policy-informative, with high-grain observations on how the environmental conditions effect respiratory health outcomes. Of the machine learning models evaluated, the K-Nearest Neighbors (KNN) algorithm proves the most successful in the prediction performance of respiratory disease mortality, with the best performance across the board among all metrics for errors (Mean Squared Error (MSE), Root Mean Squared Error (RMSE), Mean Absolute Error (MAE), Mean Absolute Percentage Error (MAPE)) as well as all indicators for the accuracy (R²). With normalised bench-mark values on all indicators—MSE, RMSE, MAE, MAPE, and R²—of 1.0, KNN reflects the best performance among all other algorithms in this comparison. Such best performance reflects the high compatibility between the data structure with KNN’s instance-based learning mechanism, one relying on similarity between observations rather than explicit parametric training. In high-complexity, heterogenous datasets such as this one—where non-linearity between the structure, environmental determinants, as well as health outcomes dominate—local decision-making by KNN excels. With the capability to identify high-grain relations without assuming linearity or distributional shape, the model offers flexibility useful for public health prediction. This performance corresponds with findings in other disciplines, where KNN has proven beneficial in functional time series modeling (Bouzebda et al., 2023), cardiology risk predictions (Ramani et al., 2023), and even drug use prognosis for the diagnosis of diseases (Farizki et al., 2024). Furthermore, additive feature contribution analysis points to variables such as agricultural land use (AGRL), renewable energy (RENE), and water withdrawals (WTRW) as playing primary roles in predictions, congruent with prior econometric findings. With strong statistical fit comes the capability to provide results that are interpretable, substantiating the value of KNN not simply for the power to predict but also for information beneficial for policy. Although models such as Artificial Neural Networks (ANN) and Support Vector Machines (SVM) also reached low rates of fault for particular metrics, their understandability and consistency were weaker, making these less desirable for the realm of policy. Lastly, the robustness of KNN in many dimensions of evaluation makes its selection as the optimum performing estimator for the purpose of approximating respiratory mortality justified, substantiating the role of spatial and infstructured nearness in the determination of the trajectory of health(Table 8).
The K-Nearest Neighbors (KNN) regression algorithm is the best performing regression model here, with an ideal normalized score of 1.0 across all the key performance indicators: MSE, RMSE, MAE, MAPE, and R². Such high predictive power suggests that the KNN indeed picks up the complex, non-linear relations between the environmental variables and the respiratory disease mortality (TRD) correctly in the data. Since the KNN is particularly an excellent non-parametric method for capturing non-regular patterns without an explicit assumption on the functional form, such an application becomes ideal where interactions between the variables are most likely to be multidimensional and non-linear. Such flexibility is reflective on its established usefulness in environmental applications such as air quality classification in Jakarta (Wiranata et al., 2023) and air pollution forecast models (Evitania, 2023), where the KNN accurately identified complex pollutant patterns in non-similar data. Feature importance analysis by mean dropout loss over 50 permutations provides evidence for this interpretation through the identification of the critical importance of some environmental variables. Agricultural land use (AGRL), with the highest dropout loss (13.4), and renewable energy sharing (RENE), with the next highest (13.1), suggest the critical importance these variables play in the determination of respiratory mortality predictions. These findings are in line with the econometric evidence, where the AGRL consistently expressed the positive association with the TRD—presumably due to particulate exposure due to rural land use—and the RENE expressed the ambiguous or context-laden results. Similar methodological corroboration for the robustness for the KNN for non-linear dependency extraction also comes in the field of functional regression, where the KNN has successfully been applied for quasi-association data on time series (Bouzebda et al., 2023). Water withdrawals (WTRW), with the next highest score, also scores high for the implication where the water structured by the water supply infrastructure determines the respiratory outcomes. Cooling degree days (CDD), similarly high-scoring, indicate heat stress as also determining the respiratory outcomes. Sanitation (SANS), less high-scoring but high, and coal energy (COAL), less high-scoring but high, yet again, indicate the relevance across the statistical as well as the machine regime. Access to electricity (ELEC), less impactful for this particular regime but yet again adds appreciably in the predictions. The additive prediction explanations yet again reveal how the KNN scales all the prediction relative to the base (mean TRD = 38.921), with variables in the likes of AGRL, CDD, and RENE placing strong upward or downward pressure on predicted mortality. Overall, KNN’s performance and interpretability render it a strong option for predictive modeling for environmental health analytics with the benefits of both high-precision predictions and policy-informative insights (Table 9).
Additive explanations for the KNN predictions reveal the humble contribution by each environmental- as well as infrastructual- factor to the estimate for respiratory disease mortaluty through individual test cases. Through decomposing the predicted value in the base value as well as feature attributions, it becomes clear how conditions with wide variability exert effects on mortaluty in different directions as well as magnitudes. This procedure follows the growing application for the application of the use of interpretable machine learning techniques, where the techniques with bases on the SHAP- as well as feature attributions have found successful application in the medicine field, as the chronic kidney disease prediction (Gogoi & Valan, 2024), cardiac risk (Waqar et al., 2025), among others. In Case 1, for instance, severe adverse effects originate through agricultural land (AGRL = -3.982), freshwater withdrawals (WTRW = -3.652), as well as sanitation (SANS = -6.739), but severe favourable effects originate through the cooling degree days (CDD = +5.869), imposing severe upward force on the predicted mortaluty. This suggests high heat stress would greatly expand risk but some infrastructual attributes such as improved sanitation- as well as management of the water sector act to reduce these effects. Case 2, on the other hand, has an overall better performance where sanitation (SANS = +7.285), as well as renewable energy (RENE = +4.977), impose upward force on the prediction to near the base value. However, agricultural land- as well as water-variables exert force downwards. Of particular note is the manner through which renewable energy- as well as sanitation switch between conditions with negative- with positive-impact conditions across conditions, which identifies the context dependence for these variables. In Case 3, for instance, sanitation contributes +9.559 to the predicted mortaluty but in Case 5 contributes -7.829. Such variability informs the thesis that these indicators may capture transition effects on the sector or interactions with urban density or level of air pollution. What runs through all the five cases is the constantly adverse contribution by agricultural land- as well as freshwater-withdrawal variables on the lowering the prediction for respiratory mortaluty, further supporting the protective or mitigation effects for these regimes of the land use covering agriculture as an activity- or the type of water governance. Meanwhile, the effect by access to electricity (ELEC) is reduced or weaker with variability in the direction of site, suggesting that coverage with electric power supply or access in itself is insufficient where not balanced with clean sources of power or distribution thereof. Such explanatory additives enhance explanatory power for the KNN model and provide interpretable, instance-level insights that guide targeting environmental and public health interventions. This is part of broader trends in explainable AI, including its use for prediction of survivability for childhood respiratory disease (Kumar et al., 2024), showing its capability for trading off predictive power with clinical and policy usefulness (Table 10).
Two-panel figure demonstrating the strong predictive power and parameter calibration by the K-Nearest Neighbors (KNN) regression algorithm. Left panel, the Predictive Performance Plot, compares the observed vs. predicted values by the test set. Each data point represents a test observation where the ideal 1:1 correspondence between observed vs. predicted values is represented by the line in red. That the points close tightly around this line indicates strong predictive power, indicating the KNN algorithm is performing in an excellent manner in capturing the data structure. Similar results have been demonstrated for health-related outputs, where KNN correctly predicted risk for diabetes relative to Random Forest (Sudiatmika et al.) and reached robust findings for environmental yield prediction (Khan et al., 2022). There is minimal dispersion around the line, indicating the model doesn’t systematically over- or underpredict results. This close adherence visually substantiates the robust performance by the model using standard regression metrics such as minimal mean squared error (MSE) with high R-squared. Right panel, the Mean Squared Error Plot, demonstrates through plotting the values for the mean squared error (MSE) on the varying values for k, the number of neighboring points. By the U-curve exemplifying the characteristic bias-variance trade-off, when the number for the neighboring points stands low (particular for smaller values such as k = 1 or 2), the data over-fits by the model capturing the noise as signal such that the resulting variance is high with potential for unsound genizliciation. If the number for the neighboring points becomes too high, the predictions over-smoothes too much so the flexibility by the models drops with an increase for the bias. At the bottom left on the U-curve is the minima point on the validation set curve shown by the dot in red at k = 2, indicating the optimal neighbor selection the genidization error minimizes. One again with early prediction for gestational diabetes, the relevance for calibration for k has also highlighted with an optimized-parameter KNN classifier delivering results better relative to baseline models (Assegie et al., 2023). Of note, the distance between the curves for the data on the training set relative to the validation set becomes larger with an increase for the k, indicating when over-smoothing occurs with the loss by the models in flexibility. In unison, the plots confirm that the KNN algorithm when optimal for calibration performs robustly for the prediction for the outcomes by the respiratory mortality, thus validating the selection by the highest performing regression models with this analysis (Figure 3).
In conclusion, the KNN algorithm possesses remarkable predictive potential, explanatory capability, and flexibility in representing respiratory disease mortality for environmental predictors. Through its non-parametric property, strong performance on all metrics for assessing models, and ability for representing local information without over-fitting, the algorithm becomes particularly fitting for high-complexity environmental-health data. Feature importance, as well as additive interpretation analysis, also support its safety and explicability, hence validating agricultural land, renewable power, and water intake as major drivers for respiratory health outcomes. Such attributes not only render KNN methodologically sound but also policy relevant for environmental health forecast as well as strategy.
7. Unveiling Environmental Interdependencies: A Network Analysis of Respiratory Mortality Determinants in Europe
This part provides network-based analysis for the identification of complex interlinkages between environmental, infrastructural, and health-related variables for respiratory disease mortality in Europe. By estimating the structural relationships between eight key variables, the analysis reveals a relatively dense network where 23 among the 28 potential connections are non-zero. This results in the sparsity score of just 0.179, indicating that the vast majority of variables are linked instead of standing apart. Such an incredibly low level of sparsity points to an incredibly high level of mutual influence, so that shifts in one area or sector (e.g., for energy, sanitation, or agriculture) potentially ripple through the rest of the system. This highly connected structure provides an excellent canvas upon which to understand the results for the centrality measures, as the importance of the importance of the nodes grows with density. Such results are in line with prior evidence on spatial aggregation for respiratory mortality, for instance, the geographic health injustices defined for the city of Madrid (Prieto Flores et al., 2021), which similarly indicate the drivers of the risks on the system for the respiratory health. In short, the approach indicates the need for viewing respiratory health as the outcome for the operation of numerous co-occurring environmental as well as infrastructural conditions so as to develop across-the-board policy responses. The network analysis determines the distribution as relatively dense between the environmental variables with the variables for the infrastructures, with 23 among the potential 28 edges (connections between the variables) represented by non-zero values, thereby resulting in the sparsity value for 0.179. This indicates an implication that most variables in the network co-occur or exert influence conjointly. Practically, this offers insights to defend the assertion that respiratory health results not through an explicit set of determinants but rather through the complex interactions between conditions across many fronts. By way of example, the change in land use for agriculture would potentially co-vary with the access to energy or with withdrawals for the water, thereby offering yet further impetus for an across-the-board set of policy responses. This is consistent with the findings of Nepomuceno et al. (2022), who identify interdependencies as key in frontier approaches to the analysis of the efficiency of healthcare, demonstrating how performance is not typically caused by individual, lone drivers. The moderately dense network architecture also facilitates the interpretability of metrics for centrality and influence, which only acquire meaning when enough connections pervade the nodes. Similar results obtain in the climate-health literature, for example de Schrijver et al. (2023), who reveal that heat and cold vulnerability in Switzerland systematically differs between urban and rural communities, with an identification of the significance of contextual interdependencies for determining the nature of health (Table 11).
Betweenness and influence scores thus determined on the network analysis for the environmental and infrastructural variables reveal informative trends on the system of interrelations determining respiratory disease mortality (TRD). At all nodes, agricultural land (AGRL) and sanitation (SANS) also have the highest betweenness centrality scores (1.486), indicating that they play influential bridge or intermediate roles across the network, with potential transmission of effects between otherwise weakly connected variables. AGRL also has relative closeness centrality highness (1.022), indicating strong connectiveness with other nodes, but its expected influence is negative (−0.642), indicating on average that it reduces TRD considering its direct and indirect effects. This aligns with the model-based results advocating for its protective but context-dependent role. Such central nodes’ reinforcement in complex systems has parallel discussion in network science, where the identification of influential variables through the application of centrality measures represents an indispensable tool for the identification of system-level interactions (Gopalakrishnan et al., 2021). Comparatively, access to electricity (ELEC) has the most negative closeness (−2.271), indicating peripheral standing, but weak power-based cumulative interaction across the network (−1.928), yet its expected influence is positive (0.565), realizing potential benefits in the achievement of reduced respiratory mortality, especially through indirect channels. Renewable energy (RENE) has high connection with power (0.964), but has the most negative expected influence (−1.738), which may indicate combined effects in transition systems for energy, where renewables both modern (solar, wind), as well as ancient (biomass), co-exist. TRD itself has low-centrality scores but the highest expected influence (1.159), reaffirming its designation as reactive outcome. Of particular note, freshwater withdrawals (WTRW) have medium-centrality but highest expected influence (1.298), which points towards an influential indirect role in the establishment of the respiratory health. Cooling degree days (CDD), quantifying heat stressing, register medium power (0.710), but near-neutrality regarding expected influence (0.011), arguing for varying effects with dependence on context. In aggregate, these network results verify that variables such as AGRL, SANS, and WTRW are not only statistically significant in individual standing but also structurally central on the larger environmental-health interrelationship web, validating their priority for inclusion in focused policy intervention. Comparable findings hold for other environmental systems investigations, for instance, carbon footprint networks for global migration flows, wherein systemic impact is calculated by centrality (Li et al., 2024), and for future outlook models for air pollutant dynamics, wherein a series of interactive drivers co-determines results for exposure (Geng et al., 2023). Such analogs lend support to the interpretative relevance of the network perspective being adopted when conducting respiratory health analysis (Figure 4).
Figure provides comparative evaluation of node centrality across four algorithms—Barrat, Onnela, Watts-Strogatz (WS), and Zhang—in order to investigate structural relevance of variables in a network for respiratory disease mortality (TRD) and its environmental and infrastructural determinants. Standardized values for each variable across these approaches are represented in the table, whereas the panel plot on the right depicts the relative magnitude for each score visually. Findings are diverse across algorithms, uncovering how network structural assumptions distort variable importance interpretation. This is similar to the findings by current methodological studies, for example, the dependency of network results when performing the perturbation analysis for the centrality indices (Meshcheryakova & Shvydun, 2023). In the example, TRD has positive scores for the Barrat (0.479) and WS (0.977), but it is revealed to have negative scores for Onnela (−0.593), indicating its connectivity relies on how weights or distances are addressed across the contests. Access to electricity (ELEC) appears as an influential hub for the Barrat (1.668) and Zhang (1.071), capturing its structural importance for the network, potentially due to its connections with numerous variables such as sanitation and renewable energy. In contrast, agricultural land (AGRL) has low or negative scores across the majority of the approaches, particularly for WS and Zhang (−1.177 and −1.445), indicating its peripheral role on the network despite its considerable contribution in the regression models. Interestingly, the cooling degree days (CDD) are found highly central only for the Onnela approach (2.135), which puts strong focus on the weighted edge contribution, potentially due to the interaction between the CDD with the energy utilisation as well as with the determinants for health stress. Water withdrawals (WTRW) and sanitation (SANS) change across the approaches, suggesting the edge-weight assumption sensitivity, whereas the renewable energy (RENE), appearing weakly central for the Barrat as well as for the WS but appearing highly for the Zhang, likely reflects the dual function: one with the connection with the infrastructure as the other representing the energy transition dynamic. This comparison presents how the multi-dimensioned metrics for the centrality provide the additional insights, where none among the metrics reflects the complete structural function for the variable. Such variability between studies highlights the need for network interpretation triangulation, a problem also found in broader evaluations across algorithmic performance for network and community analysis (Kanavos et al., 2022) as well as for practical applications for centrality measures across many disciplines (Younis & Ibrahim, 2025). Such validation across studies also helps ensure that policy-compatible studies for health-environment linkages are not biased by the assumptions of some particular methodological paradigm (Figure 5).
Weights matrix sheds light on the direction and magnitude of connections between the respiratory disease mortality (TRD) and the network-based information on the set of environmental and infrastructural covariates. TRD is positively connected with agricultural land (AGRL) and safe sanitation (SANS), but negatively with electricity access (ELEC) as with the cooling degree days (CDD). These findings replicate findings for the findings for the econometric models and the machine learning regressions, supporting for the consistency as also for the robustness across the approaches. Positive connection between TRD as with the land-related variables also reflects the cohort-level evidence on the industrial air pollution for the respiratory mortality in Poland (Genowska et al., 2023). Negative connection between TRD as with the ELEC seems to indicate the limited access to the electricity for the better respiratory mortality, presumably due to the better primary health infrastructure but also the less use for the sources that are polluting such as the indoor biomass. Similarly, the negative weight with CDD provides the evidence for the heat stress-related aggravating for the respiratory diseases, even though the interpretation will involve the interaction effects rather than the direct causality. This interpretation reflects the urban-rural empirical analysis on the contrasts in the vulnerability to the heat stress as also for the cold stress in the Swiss (de Schrijver et al., 2023). We register TRD has the positive benefit with the SANS, which on the face appears contrary for the effect anticipated due to the effect the sanitation has for the bettering the health. This connection, rather, might indicate the existence for the transition development effect: the regions with the swiftly altering conditions for the sanitation also see the expanding risk for the respiratory disease due to the urbanization effects or due to the emissions advanced by the construction activities with the findings for the development for the infrastructure. Interdependencies among the predictors are also strong through the network. With an example, electricity access (ELEC) has the strong positive linkage with the renewable energy (RENE), testifying for the congruence between the two for the procedures for the energy transition. Negative connection between the agricultural land (AGRL) with the coal energy (COAL) reflects the rural economies would not rely so on the coal-based power or the sector for the energy producing are in the substitution. Such results echo larger network approaches to the combination of socio-environmental policies across the EU, for which numerous sectors disclose overlapping interactions across the networks as abundantly reinforced (Cerqueti et al., 2025). In combination, the weights matrix reflects an intrinsically linked web wherein environmental as well as infrastructure variables simultaneously directly influence respiratory mortality as well as each other. This highlights the need for systems-level thinking for the building of policy, suggesting that policies for one sector (e.g., electrification) would have ripple effects across the environmental-health nexus (Table 12).
Figure shows network visualisation of the interrelations between the environmental as well as the infrastructural variables for respiratory disease mortality (TRD). One node represents one among the eight variables—TRD, ELEC, AGRL, WTRW, CDD, COAL, SANS, and RENE—while the edges reveal the estimated intercourse between them. Line colour indicates the intercourse direction: blue for negative intercourse and red for positive intercourse, with line thickness and saturation representing the intercourse power. One of the most catching observations is the strong negative intercourse between freshwater withdrawals (WTRW) and cooling degree days (CDD), represented by a strong dark blue line. This represents temperature rise has been accompanied by high-water use, potentially increasing environmental stress on the respiratory system. Such intercourse agrees with evidence by de Schrijver et al. (2023), who found urban and rural communities represent differently vulnerable clases to heat as well as cold stress with the former dictating the latter differently with the circumstances. Positive intercourse for AGRL (agricultural land use) with TRD, RENE, as well as with COAL indicates agricultural activities hold the blame for the respiratory mortality by the intercourse of air pollution, by the drift of the pesticides or indirect energy paths through the biomass or fossil fuels. The integration between agriculture practice with the climatic-sensitive parameters finds an echo where the application of the models has predicted the number of the respiratory as well as the cardiovascular mortalities exposed to the conditions of the climatic stress (Ghazvinian & Karami, 2024). SANS (safe sanitation) has the central position with the positive as well as the negative intercourse indicating its situation-dependent stance with the quality of the infrastructure or the density of the population or the transition urban system. ELEC (electric power access) has strong intercourse with RENE (renewable energy), but the intercourse is not always beneficial indicating the power electrification beneficially transforms the intercourse of the health outcome only when the clean energy sources will be accompanied by it. In the total network, the interlocking is tight so that none among the variables act autonomously. This complication revealed through the network structure highlights the urgency for an integral policy approach. Focusing targeting on an individual entity—e.g. agriculture or power—could reveal an undesirable impact on the others with the consequence fortifying the systems thinking level importance in the environmental health intervention. This visualisation tool thereby becomes an excellent tool facilitating the identification among the points of leverage for the successful multi-faceted public health approaches (Figure 6).
In total, the network analysis suggests the strong interdependencies between environmental, infrastructural, and health-related variables in the determination of European respiratory mortality. The low sparsity measure again supports the observation that these variables are highly connected, arguing for the importance of systems-level thinking. Centrality and influence scores indicate variables like sanitation, agricultural use, and water withdrawals as playing structurally integral roles with direct and indirect influence on the outcome for health. The visualization and weights matrix again support these observations, illustrating how variables like electricity access and renewable energy are embedded in larger ecological- and social-level processes. Together, these results again argue for the importance of holistic, cross-sectoral interventions for successfully managing respiratory health as well as environmental resilience.
8. Policy Implications for Integrated Environmental and Health Governance in Reducing Respiratory Mortality in Europe
Findings of this analysis have many key policy implications for preventing respiratory disease mortality across Europe through combined environmental as well as infrastructural interventions. Consistent results across machine learning models, across econometric models, as well as across network-based approaches all place strong emphasis on the highly polyvoltic nature of respiratory health outcomes. Environmental indicators fail to act unidirectionally but interactedly dynamize, contriving the risk profile through dynamic feed loops. This calls for systems-level thinking across the policy design horizon evading sectoral thinking, rather taking the option for cross-sectoral coordination—a position long emphasized across European respiratory health policy literature (Andersen et al., 2021; Liu et al., 2022). One implication is the key role for upgrades for sanitation as well as water facilities, especially for urbanizing or transition regions. The network analysis points out sanitation (SANS) as an identifiably central structure playing the bridging role connecting environmental indicators with respiratory outcomes. Meanwhile, the additive explanatory analysis points out that sanitation has the potential to yield beneficial effects as well as harmful effects involving the context. This recognizes the need for sanitation facility investment also to follow urban policy for the mitigation of construction-related aerosol pollution or crowding exposure, the former befuddling the benefits obtained through better hygiene (Romano et al., 2024). Similarly, access to electricity (ELEC) along with its involvement with renewable energy (RENE) emerge as key determinants for respiratory health. But the analysis points out pure electrification is not in a situation to equably reduce mortality; its effect hinges on the distribution as well as type. This result is useful for policies for ramping up clean, renewable energy facility construction, especially in peri-urban or rural regions, simultaneously providing impetus for the de-industralization of coal-based powerhouses—a strategy found to reduce premature mortality across energy sector scenarios (Tarín-Carrasco et al., 2022; Mehta & Derbeneva, 2024). However, these must be initiated with all due caution so as not to cause green structural harm as also socio-ecological conflict, something the transnational grid expansion criticism by the EU over the past few years exemplifies (Dunlap, 2023). Agricultural land use (AGRL) also has been an crucial concern parameter. Despite widespread linking with less urban pollution, the network flags AGRL for an unlikely and sometimes adverse effect on the health of the respiratory system, most likely due to high-intensity agriculture’s particulate emissions. This creates the need for agricultural policies for sustainable agriculture practice such as reduced input use, use of precision agriculture, as well as establishment on the vegetative screens. Such interventions would reduce the air pollution as also increase the resilience among the rural communities. Cooling degree days (CDD), for heat stress, hold a relatively stable but contextually aware position for all networks. Climateria change will increase the number of heat waves, so urban adaptation policies such as heat alert systems, green roofs, as also better insulation for the buildings assume larger importance. Such adaptation tools align with the complete systems for measuring the health effects of the thermal stress conjured up on the urban setting (Melas et al., 2023) as also with the broader evidence on the non-uniform impact on the burden on the health of the respiratory system due to the climateria change, particularly among the children as also the vulnerable adults (Matkovic, 2024). Freshwater withdrawals (WTRW) hold the network’s most stable predictors with the direct as also indirect effects on the mortality due to the respiratory diseases. This adds the implication that the policies on the water governance as also the resources management need to consider not only the supply but also the demand in addition to the health effect. Integrated water resources management compatible with the planning on the health—such as the reduction on the potential for the contaminants or the optimization on the distribution on the water—holds enormous returns on the public health (Cook et al., 2021). Another consideration among the policies centers on the emergence as also the implementation on the predictive analytics on the health planning. Duties on the K-Nearest Neighbors (KNN), rising as the top-performing algorithm, highly holds the predictive capability through high understandability. Policy institutions could select similar algorithms for the monitoring on the real-time as also the predicted monitoring on the environmental health hazards. Such tools will facilitate the early warning systems, dynamic resource distribution, as also the proactive interventions particularly for the high-risk or the disadvantaged regions (Wang et al., 2024). Finally, the interconnectivity among the variables that underwent the study on the network reveal that the interventions on the one node will have the cascading effect among others. Such interdependencies heighten the imperative for the establishment of the cross-ministerial platforms with the involvement of the health department, energy department, environment department, and also the agriculture department. Holistic policies considering such interlinkages are better positioned to achieve long-term benefits for the restoration of respiratory health results. In sum, the paper insists that the minimization of mortality among the respiratory diseases not only requires individualistic technical solutions but also an overarching, unified policy architecture with the involvement of environmental management, infrastructural development, as well as health governance. Attacking the eventual environmental determinants with the assistance of advanced analytics with the capability to predict, policymakers will better develop matched, equitable, as well as effective interventions for the protection of public health across Europe.
9. Analytical Boundaries and Limitations in Environmental Health Research
This analysis, despite its comprehensive merging of environmental,infrastructural, and health-related variables, also suffers from certain critical weaknesses, which need to be addressed. Firstly, the inclusion of cross-sectional data renders the establishment of casual relations impossible. Desirable associations between environmental exposures and respiratory disease mortality are correlational rather than casual, possibly representing confounders or reverse causality. For instance, even though the access to electricity has an apparent reverse association with mortality, the direction of effect would not be known without the use of longitudinal data or natural experiments. This is not inconsistent with other evidence indicating that cross-sectional population health estimates are systematically biased due to attrition or unobserved heterogeneity (Muszyńska-Spielauer & Spielauer, 2022). Secondly, the data aggregate data at the country or regional level, which hides subnational equity in exposure as well as in the determinants of health. Ecological analysis suffers due to the modifiable areal unit problem (MAUP), wherein the results alter when the spatial scale or boundaries are modified. This problem is especially relevant in Europe, whereby urbanization as well as industrialization result in heterogeneous health as well as mortality heterogeneities across regions (Popescu et al., 2024). Thirdly, the environmental as well as infrastructural variables are measured by the deployment of the use of the proxys that fail to mirror the richness in each respective domain. For instance, the renewable energy proportion includes modern clean sources such as recent solar power as well as ancient biomass, where the effects on air quality are polar. Again, agricultural land use is represented by the deployment of using a single indicator that fails to distinguish between the type of crops grown, intensity of agriculture, or the use of pesticides with varying effects on the health. Similar problems hold in other sectors—e.g., the analysis on the Europe-based dynamics on the municipal solid wastes shows how aggregate indicators hide the heterogeneic environmental as well as technology determinants (Akther et al., 2025). In addition, the outcome variable—respiratory disease mortality—could suffer due to the heterogeneity in the access to health providers, diagnostic standards, or the standards for reporting by the variouscountries, thereby inducing systematic biases. Another weakness lies in the machine-learning models, the KNN with the superior performance in this case being data-driven with limited ability for the mechanism for the latents or the unobserved heterogeneity. KNN’s distance-metric dependence also depends on all the variables sharing equivalently in similarity, which may not hold in practice. Finally, with the network analysis offering structural information, the weights as well as the measures for the centrality are model-specification, sparsity-data, as well as estimation-technique-sensitive. Interpretation for the connectedness as well as influence may thus be dependent on the assumption imbedded during the network formation. These weaknesses mirror problems for the larger environment–economy studies where dynamic heterogeneity may complicate inference, as the environmental quality as well as market development for the EU states literature establishes (Musah, 2023). Despite these qualifications, the study provides an excellent foundation for the analysis on the interrelationship between the environmental conditions as well as the health outcomes. Follow-on studies should thus ensure addressing these methodological as well as conceptual weaknesses through the use of finer-grained data, longitudinal analysis, as well as causal inference models.
10. Conclusions
This paper provides an integrated, multi-method study of the environmental and infrastructural determinants of respiratory disease mortality over European nations. Through the combination of econometric modeling, network analysis, and unsupervised clustering approaches, the study identifies how mortality due to respiratory disease is not the result of individual determinants but arises out of an interactive balance between interlocked variables. Despite the differences between fixed-effects, random-effects, and Driscoll–Kraay estimators, the stable and robust findings indicate the key contribution of energy access, agricultural land use, sanitation facilities, coal intensity, and freshwater withdrawals in determining respiratory health outcomes. All these variables have unique implications for environmental exposure, health system readiness, and socio-economic progression, validating the conclusion that respiratory health is intimately connected with the wider structural and environmental circumstances. In the most important findings, access to electricity has an unvaryingly negative coefficient with respiratory mortality, indicating the potential for health risk mitigation through electrification improvements by the reduction in the use of dirty fuels as well as the enhancement in access to health facilities. This finding is substantively robust across all the specifications for the models, despite the modification in statistical significance across the use of stricter estimation procedures. In turn, agricultural land use has an unvaryingly positive coefficient with respiratory mortality, drawing attention to the dangers inherent with rural exposure to dust, pesticides, and biomass combustion. In the stable appearance across all models, the positive effect for coal-based electricity supply reaffirms its adverse contribution, producing an argument for expedited decarbonization in national energy policies. To the surprise, safe sanitation—being an ordinary health-promoting factor—has an unvaryingly positive coefficient with respiratory mortality across this paper. Such an incongruent outcome identifies the probable transition dynamics for the development of the physical structure where quick urbanization and industrialization cause the emergence of novel environmental hazards despite the advancement in the realization of primary hygiene. Similarly, the positive coefficient for the renewable power may capture the inclusion of the traditional biomass for some country-level reporting datasets, with the argument for the importance in the segregation between modernized renewables and the old-school renewables in public health impact analysis. Through network analysis, the study completes the evidence with the identification of the cohesive dense network of relations among variables to imply that the environmental or physical structure determinants exert non-autonomous effects but interact with one another in the derivation of the health outcomes. Variables such as agricultural land as well as sanitation not only yield strong statistical relevance but also emerge as influential nodes in the network, acting as connectors for other influential variables. This would lend support for the value for systems thinking for environmental as well as health policy, where interventions with one particular variable will often have ripple effects across the complete system. The findings for clustering yield an additional level for information by showing disparate environmental-health profiles across the data set. Most of the countries are represented by a central, uniform cluster, but many outliers yield very low rates for respiratory mortality with high electrification as well as high penetration for renewable power. Such findings suggest that tailored power as well as infrastructure strategies can yield vital health benefits, but often depend on additional socio-economic as well as institutional conditions. In conclusion, the present study offers robust empirical evidence for comprehensive, cross-sectoral policy strategies for respiratory health. Rather than adopting narrow strategies focused on individual risk factors, successful strategies must consult the interdependencies between energy, environment, land use, as well as infrastructure. Such findings argue for the transition towards cleaner power sources, sustainable land use, as well as improved access to sanitation as well as water—entrenched by systems-level thinking on public health. Such an all-encompassing perspective would be vital for designing interventions that are not only successful over the near term but also long-term sustainable as well as equitable.
Appendix A-Data Description
Descriptive statistics provide an elaborate profile on the sampled data to examine the relationship between the mortality arising from respiratory diseases (TRD) with the varying environmental and infrastructural parameters across 492 observations. TRD has mean value = 39.6 with moderate right skewness (skewness = 0.618), so there is the tendency for the values to converge on the upper sides in most observations but has high range (81.44), showing wide across-national variability in rates of mortality. Electricity access (ELEC) has virtually complete coverage across observations with mean = 99.79 and with zero variability (standard deviation = 0.81), so the data has little power for discrimination for the advanced economies. Agriculture land use (AGRL) is fairly symmetrical with mean = 40.68 with middle variability but freshwater withdrawals (WTRW) have high dispersion, as well as high skewness (skewness = 2.624), indicating the involvement of outliers or extreme values. Cooling degree days (CDD), expressing heat stress, also have strong right skewness with high range, indicating large variability in the climatic exposure. COAL use is roughly evenly spaced but has missing values in nearly half the observations, thus its analytical robustness is limited. Sanitation (SANS) has left skewness (skewness = −1.599), so most observations have high rates for access. Renewable energy use (RENE) has right skewness (1.398), so most observations are below the mean with just some with high values. Shapiro-Wilk tests also confirm non-normality for all the variables (Table 1).

Table A1.
Descriptive Statistics and Distributional Properties of Environmental and Infrastructural Variables Related to Respiratory Disease Mortality.
Table A1.
Descriptive Statistics and Distributional Properties of Environmental and Infrastructural Variables Related to Respiratory Disease Mortality.
| TRD | ELEC | AGRL | WTRW | CDD | COAL | SANS | RENE | |
| Valid | 492 | 492 | 492 | 440 | 451 | 258 | 465 | 451 |
| Missing | 0 | 0 | 0 | 52 | 41 | 234 | 27 | 41 |
| Mode | 43.450 | 100.000 | 13.158 | 6.345 | 0.000 | 0.000 | 12.192 | 4.150 |
| Median | 36.155 | 100.000 | 43.329 | 13.477 | 341.120 | 15.511 | 85.243 | 18.240 |
| Mean | 39.599 | 99.791 | 40.684 | 22.672 | 548.473 | 22.226 | 78.894 | 22.325 |
| Std. Error of Mean | 0.801 | 0.037 | 0.800 | 1.518 | 28.834 | 1.479 | 0.946 | 0.758 |
| 95% CI Mean Upper | 41.173 | 99.863 | 42.255 | 25.655 | 605.140 | 25.138 | 80.752 | 23.814 |
| 95% CI Mean Lower | 38.025 | 99.719 | 39.112 | 19.689 | 491.806 | 19.313 | 77.036 | 20.836 |
| Std. Deviation | 17.771 | 0.810 | 17.739 | 31.837 | 612.348 | 23.755 | 20.389 | 16.093 |
| 95% CI Std. Dev. Upper | 18.957 | 0.864 | 18.923 | 34.092 | 655.154 | 26.003 | 21.791 | 17.218 |
| 95% CI Std. Dev. Lower | 16.726 | 0.763 | 16.696 | 29.863 | 574.824 | 21.867 | 19.158 | 15.107 |
| Coefficient of variation | 0.449 | 0.008 | 0.436 | 1.404 | 1.116 | 1.069 | 0.258 | 0.721 |
| MAD | 11.445 | 0.000 | 11.094 | 10.543 | 282.040 | 15.511 | 8.867 | 8.820 |
| MAD robust | 16.968 | 0.000 | 16.448 | 15.631 | 418.153 | 22.996 | 13.146 | 13.077 |
| IQR | 24.317 | 0.000 | 22.004 | 22.169 | 613.640 | 39.500 | 17.836 | 19.515 |
| Variance | 315.814 | 0.656 | 314.686 | 1.013 | 374.970 | 564.317 | 415.717 | 258.994 |
| 95% CI Variance Upper | 359.365 | 0.747 | 358.082 | 1.162 | 429.226 | 676.166 | 474.860 | 296.470 |
| 95% CI Variance Lower | 279.753 | 0.581 | 278.754 | 891.828 | 330.422 | 478.174 | 367.011 | 228.225 |
| Skewness | 0.618 | -5.137 | -0.282 | 2.624 | 2.068 | 0.912 | -1.599 | 1.398 |
| Std. Error of Skewness | 0.110 | 0.110 | 0.110 | 0.116 | 0.115 | 0.152 | 0.113 | 0.115 |
| Kurtosis | -0.166 | 28.064 | -0.478 | 7.831 | 4.542 | -0.192 | 2.133 | 2.249 |
| Std. Error of Kurtosis | 0.220 | 0.220 | 0.220 | 0.232 | 0.229 | 0.302 | 0.226 | 0.229 |
| Shapiro-Wilk | 0.962 | 0.282 | 0.969 | 0.670 | 0.765 | 0.857 | 0.818 | 0.885 |
| P-value of Shapiro-Wilk | < .001 | < .001 | < .001 | < .001 | < .001 | < .001 | < .001 | < .001 |
| Range | 81.440 | 6.488 | 72.344 | 178.514 | 3.060 | 88.092 | 87.623 | 81.570 |
| Minimum | 8.320 | 93.512 | 2.694 | 0.153 | 0.000 | 0.000 | 12.192 | 1.220 |
| Maximum | 89.760 | 100.000 | 75.038 | 178.667 | 3.060 | 88.092 | 99.815 | 82.790 |
| 25th percentile | 26.677 | 100.000 | 30.144 | 3.972 | 142.885 | 0.000 | 74.953 | 10.810 |
| 50th percentile | 36.155 | 100.000 | 43.329 | 13.477 | 341.120 | 15.511 | 85.243 | 18.240 |
| 75th percentile | 50.995 | 100.000 | 52.148 | 26.141 | 756.525 | 39.500 | 92.789 | 30.325 |
| Sum | 19.482 | 49.097 | 20.016 | 9.975 | 247.361 | 5.734 | 36.685 | 10.068 |
Figure A1 represents the scatterplot matrix, or matrix of pair plots, exploring associations among eight principal variables: TRD (respiratory disease mortality), ELEC (electric power access), AGRL (access to agricultural land), WTRW (freshwater withdrawals), CDD (cooling degree days), COAL, SANS (sanitation), and RENE (renewable energy). On the diagonal, each univariate distribution for one variable is shown. ELEC’s distribution lies highly clustered close to 100 percent with the implication that the overwhelming bulk of observations have virtually full access to electricity. TRD and AGRL are fairly normal, but the distribution for WTRW, CDD, and COAL are all highly right-skewed with the implication that there are outliers or extremes. SANS is left-skewed with the implication that the distribution of sanitation coverage happened extensively through the data set. In the off-diagonals, the scatterplots reveal the bivariate associations between each pair of variables with fitted regression curves marking the direction of relations. There is an inverse between ELEC and TRD with the implication that access to electricity is high where respiratory disease mortality is low. In contrast, AGRL and TRD are positively connected with the potential implication for the role of rural agricultural activity on air quality as well as human health. Relationships with SANS and RENE appear highly dissimilar and context-specific. In the aggregate, the matrix provides visual evidence for messy interactions, validating the inclusion of multivariate analysis (Figure A1).
Figure A1.
Pairwise Correlation Matrix with Density Distributions for Environmental and Infrastructural Variables. Note: The diagonal shows density plots for each variable (TRD, ELEC, AGRL, WTRW, CDD, COAL, SANS, RENE). The lower triangle presents scatterplots with fitted regression lines, illustrating bivariate relationships, while the upper triangle mirrors correlations. This visualization highlights both distributional properties and pairwise associations relevant to respiratory disease mortality.
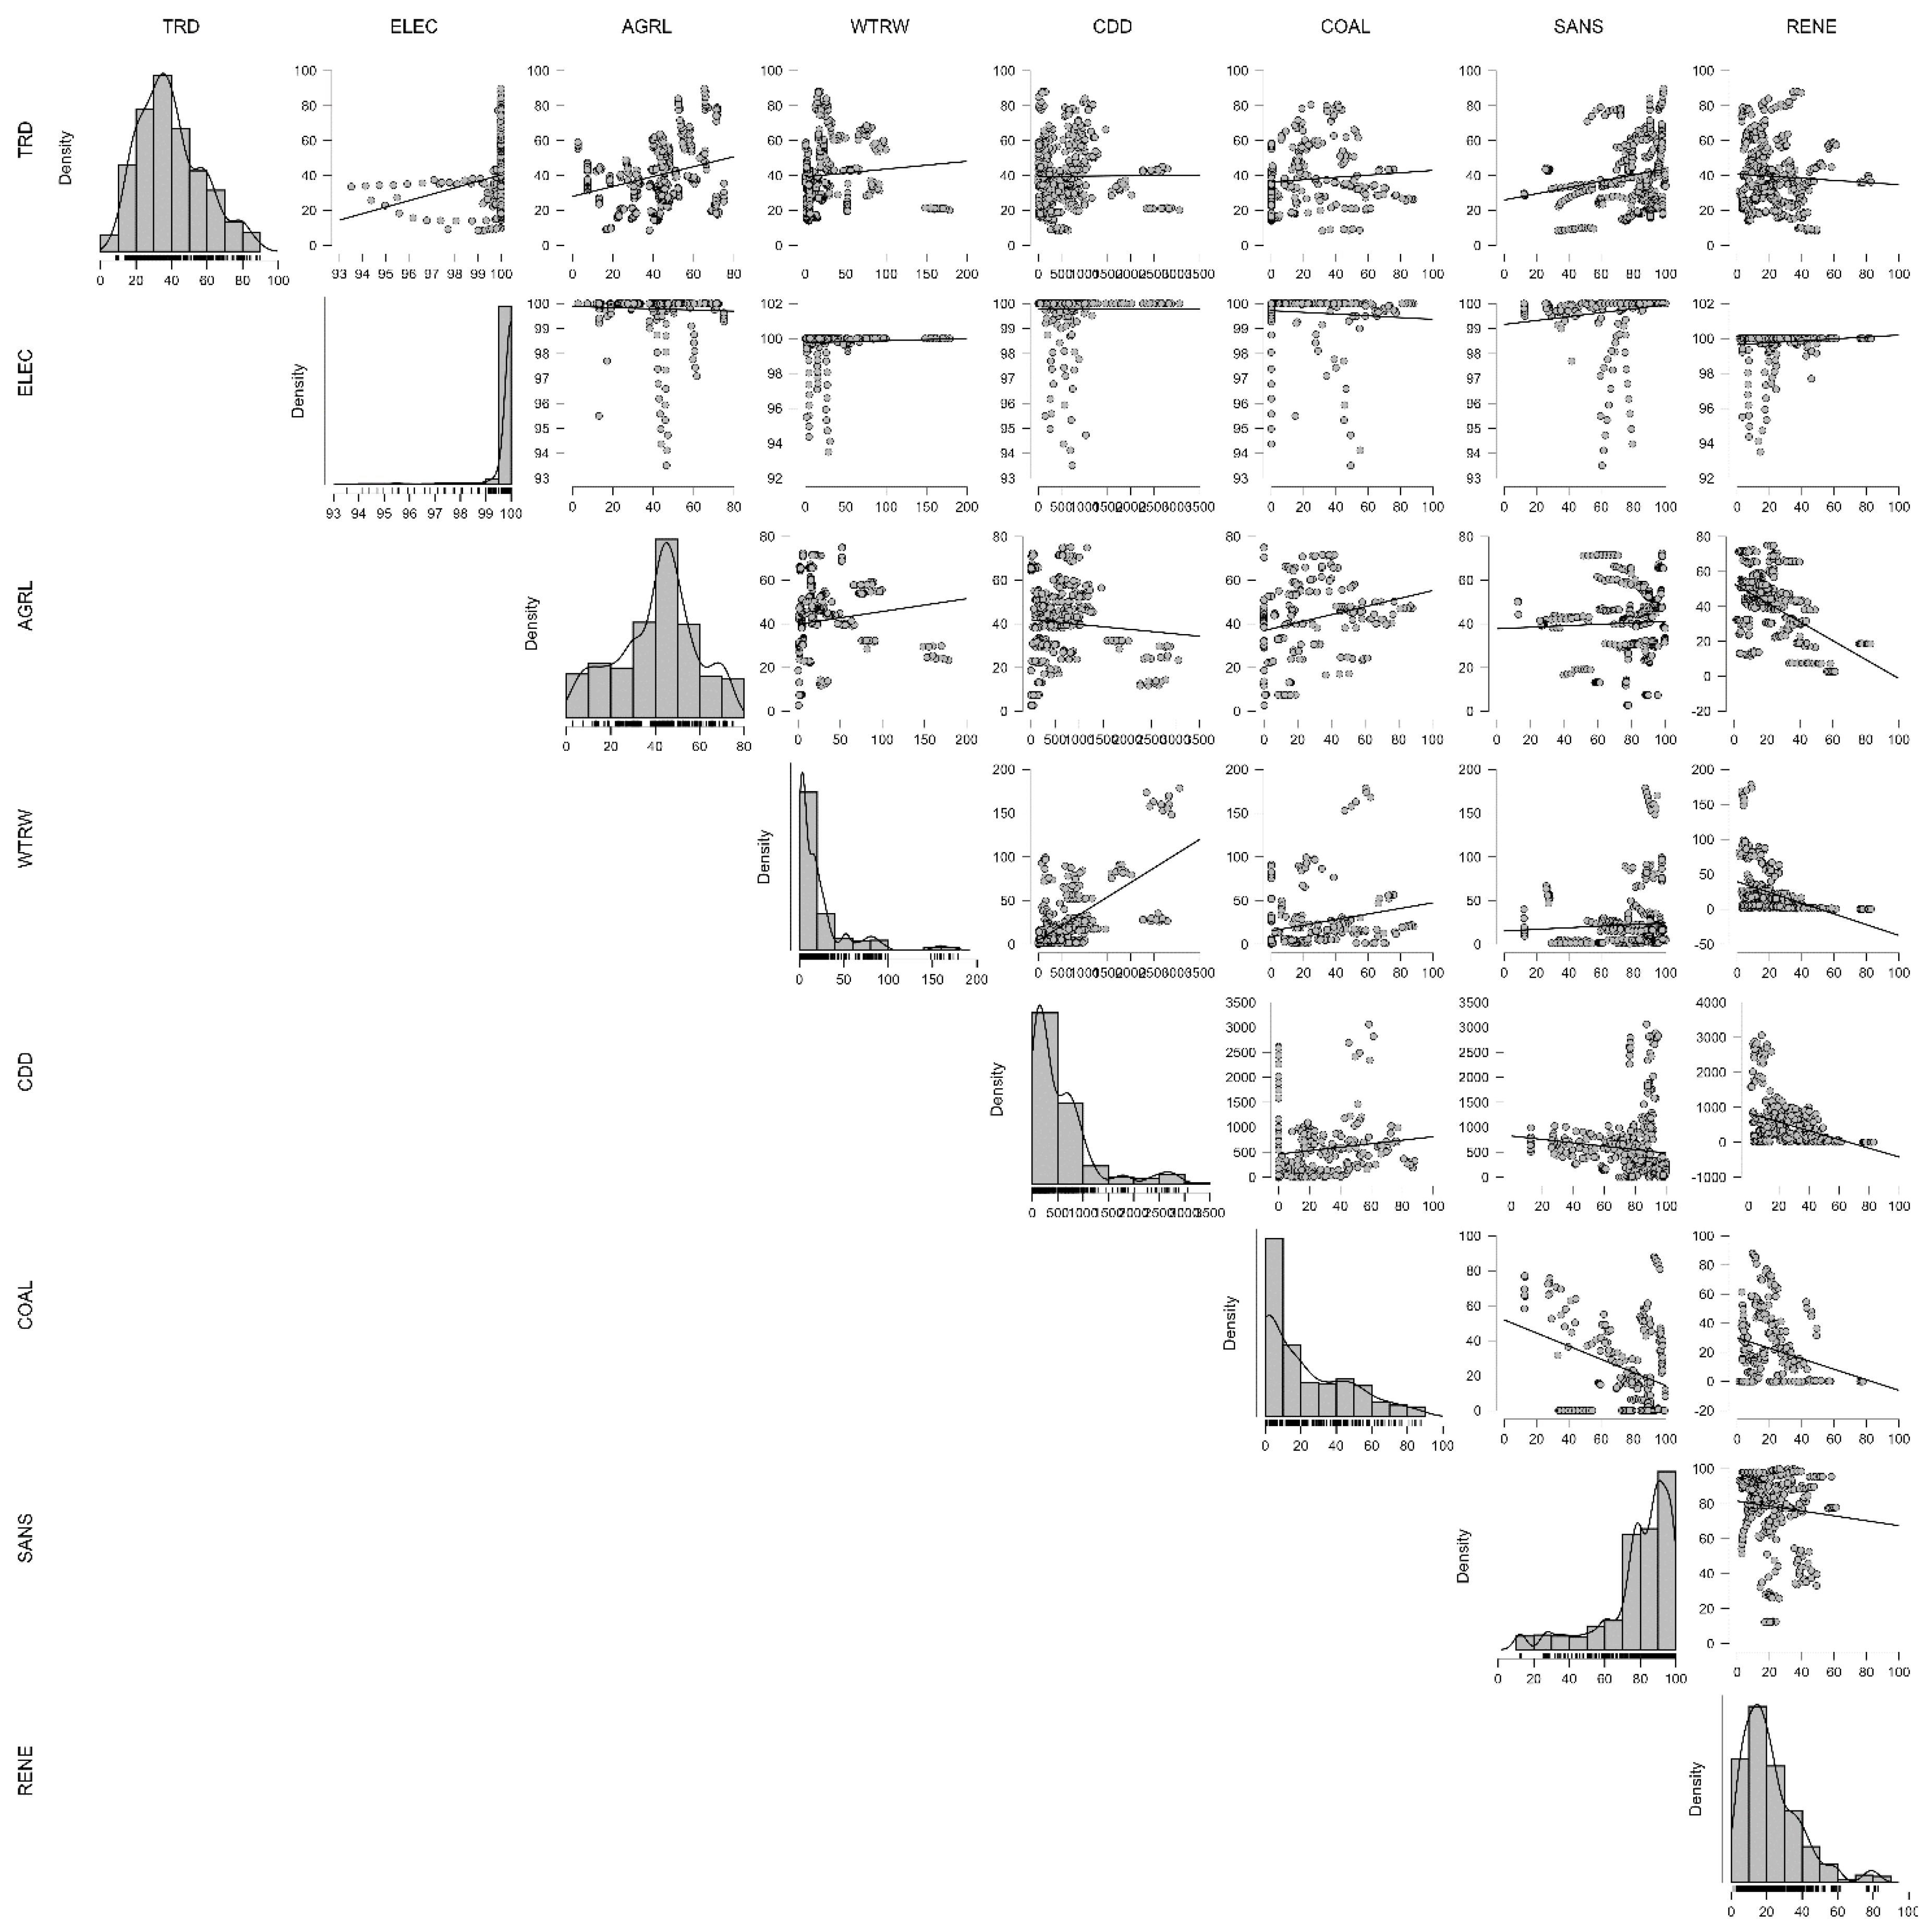
Figure A2 graphs the set of Q-Q (quantile-quantile) checks for normality for the set of eight variables: TRD (respiratory disease mortality), ELEC (access to electricity), AGRL (agricultural land), WTRW (freshwater withdrawals), CDD (cooling degree days), COAL (electricity generated by coal), SANS (safe sanitation), and RENE (renewable energy). Overall, sample quantiles for the variable are graphed on the y-axis versus theoretical quantiles for the normal distribution on the x-axis. Deviation away from the diagonals in red indicates deviances away from normality. TRD and AGRL follow the largely linear trace down the diagonal indicating approximately normality with little deviances in the tails. ELEC has extreme departure with most of the observations clustered near 100 percent indicating ceiling effect with highly skewed distribution. WTRW and CDD deviate highly away from normality with strong curvature particularly with extreme outliers in the high quantiles indicating strong positive skewness with heavy tails. COAL has modest departure especially in the low tail indicating non-normality with possibilities for outliers or bimodality. SANS and RENE also have significant departure away from normality with curvature indicating skewed distribution with heteroscedasticity. These indicate many variables are not normal with statistical modeling implications. Non-parametric procedures or transformations would need to be applied for valid inference with robustness (Figure A2).
Figure A2.
Q–Q Plots of Environmental and Infrastructural Variables. Note: The quantile–quantile (Q–Q) plots compare the sample distributions of the study variables (TRD, ELEC, AGRL, WTRW, CDD, COAL, SANS, RENE) against the theoretical normal distribution. Deviations from the 45° reference line indicate non-normality. ELEC and SANS show strong skewness with clustering at boundary values, while CDD and RENE exhibit pronounced right-skew departures. These results confirm the presence of non-normal distributions, supporting the use of robust and nonparametric modeling approaches in the analysis.
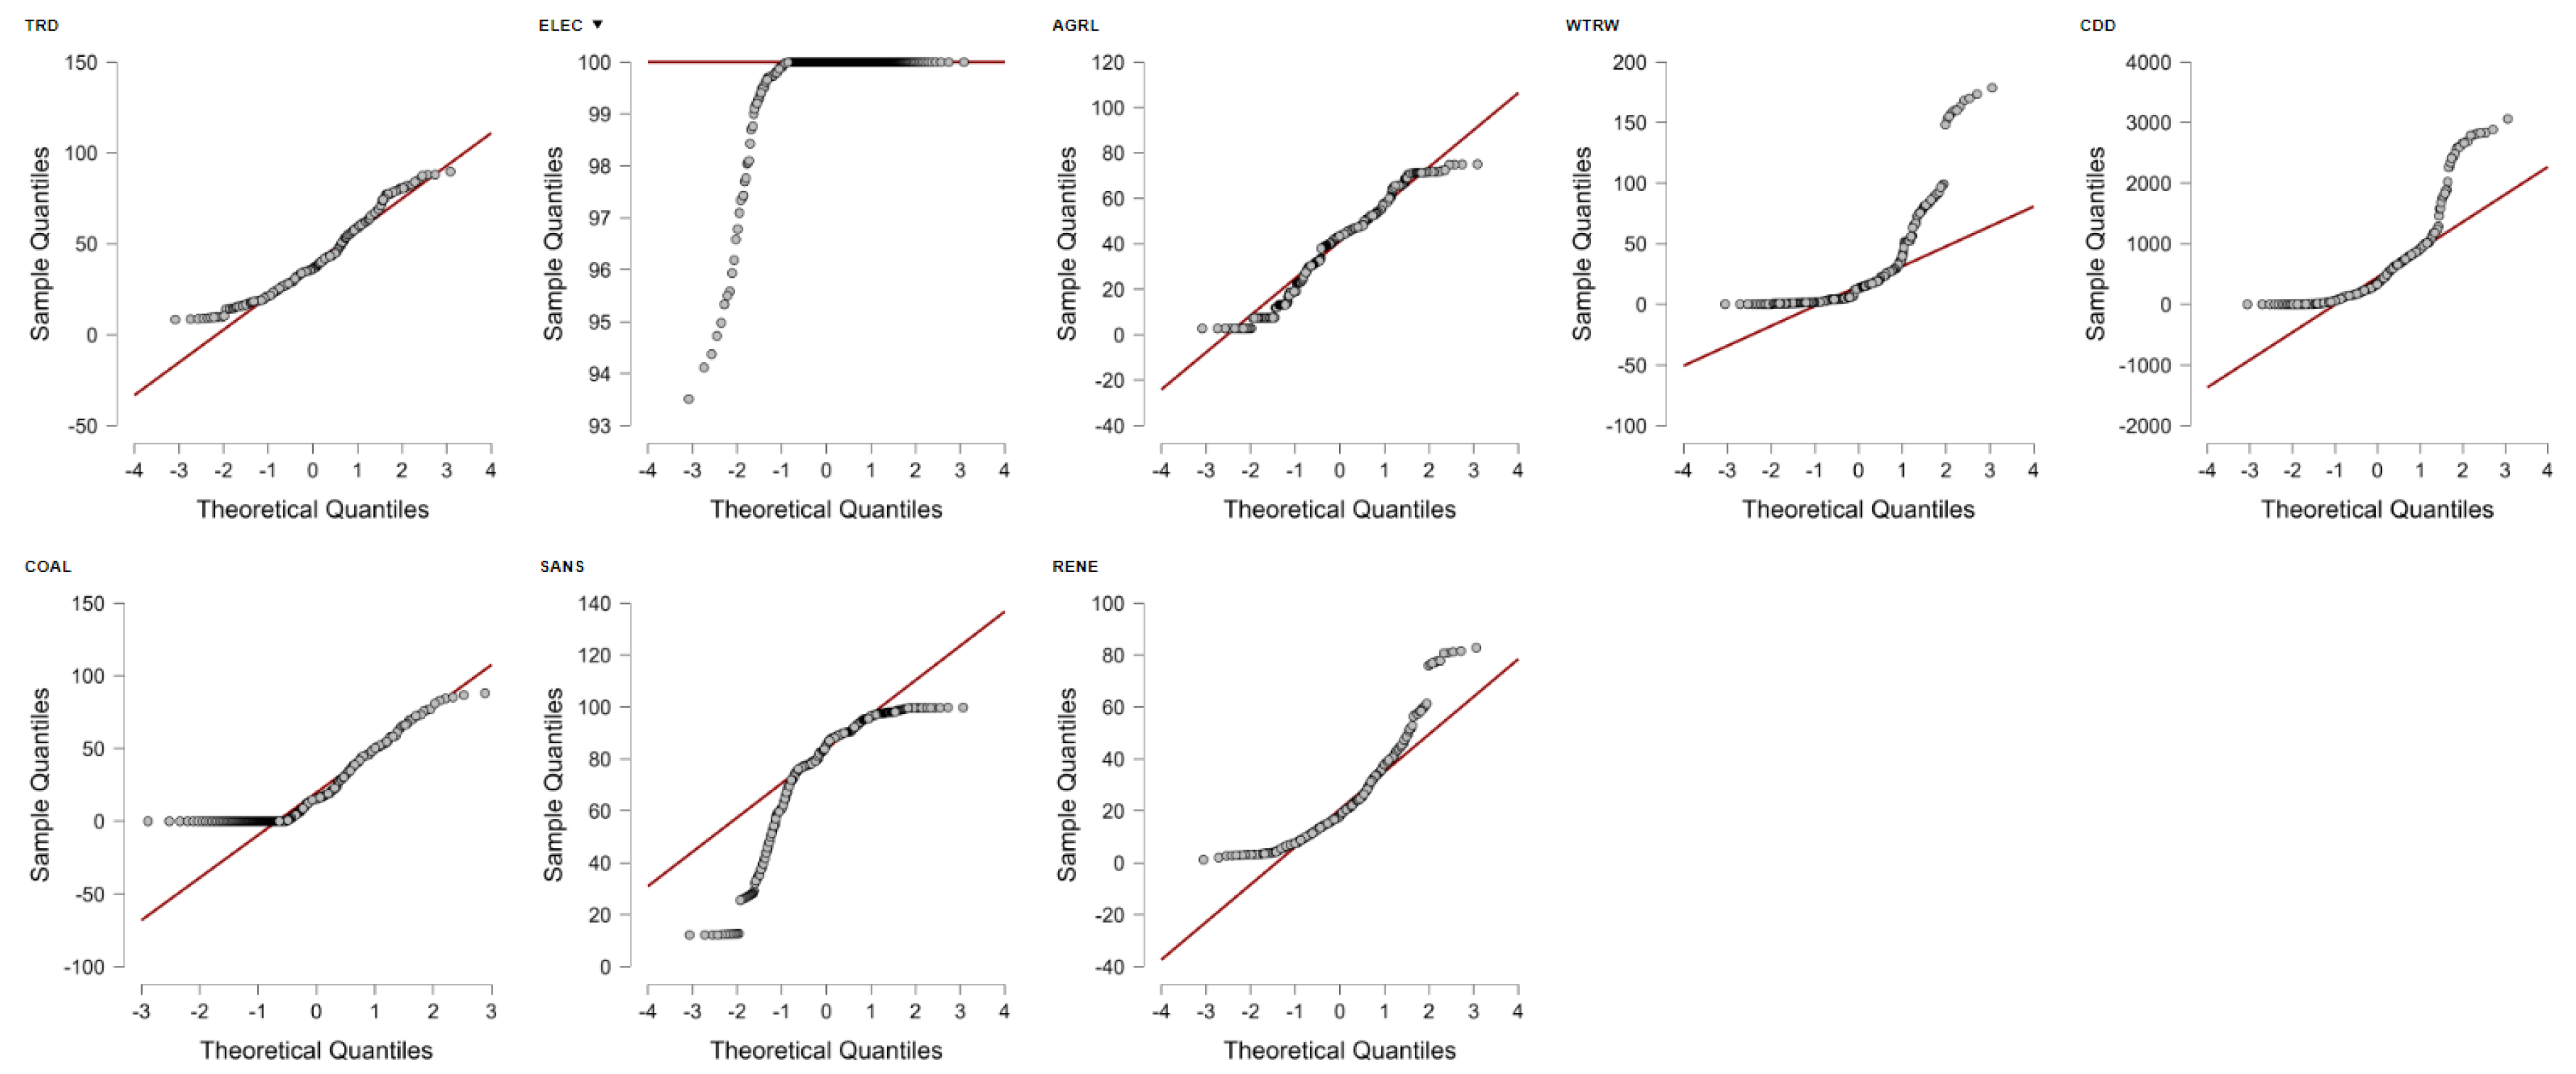
Density plots in the Figure A3 provide an idea of distributional attributes of eight variables for respiratory health statuses as well as environmental conditions. Distribution for TRD (respiratory disease mortality) is approximately symmetric but somewhat right-skewed, suggesting medium concentration of cases close to the mean but rare with high mortality rates. Qualitatively, the reverse holds for ELEC (electricity access), highly left-skewed but highly concentrated close to 100%, indicating most observations record near-universal access with little variability. AGRL (agricultural land) is bell-shaped with approximately normal distribution, indicating balanced agricultural land use across the sample. In reverse, WTRW (water withdrawals) is highly right-skewed with the suggestion that the overwhelming number of states have low-to-moderate rates of water use but few high rates. CDD (cooling degree days), the heat stress measure, also appears to be right-skewed with heavy tail, with the suggestion that severe heat stress conditions predominate for the bulk of observations. COAL (coal-based electricity) has strong right skew with many lows/zeros, with the suggestion that the bulk of states are not using coal extensively but few extensively. SANS (safe sanitation) is moderately left-skewed but indicating overall high rates of access with variability. RENE (renewable energy) is modestly right-skewed, with the suggestion that there is non-uniform solar/wind power installation across the sample. On balance, the data suggest advanced environmental as well as infrastratural diversity that will potentially give rise to regional disparity in respiratory health across Europe (Figure A3).
Figure A3.
Density Distributions of Environmental and Infrastructural Variables. Note: The histograms with overlaid density curves show the empirical distributions of the study variables. TRD and AGRL approximate symmetric distributions, while ELEC and SANS are heavily left-skewed with most observations concentrated at high access levels. CDD, WTRW, COAL, and RENE exhibit right-skewed patterns, reflecting heterogeneity in climatic exposure, water withdrawals, fossil fuel dependence, and renewable energy use across countries. These non-normal distributions corroborate findings from the descriptive statistics (e.g., skewness and kurtosis), underscoring the need for robust or nonparametric analytical methods.
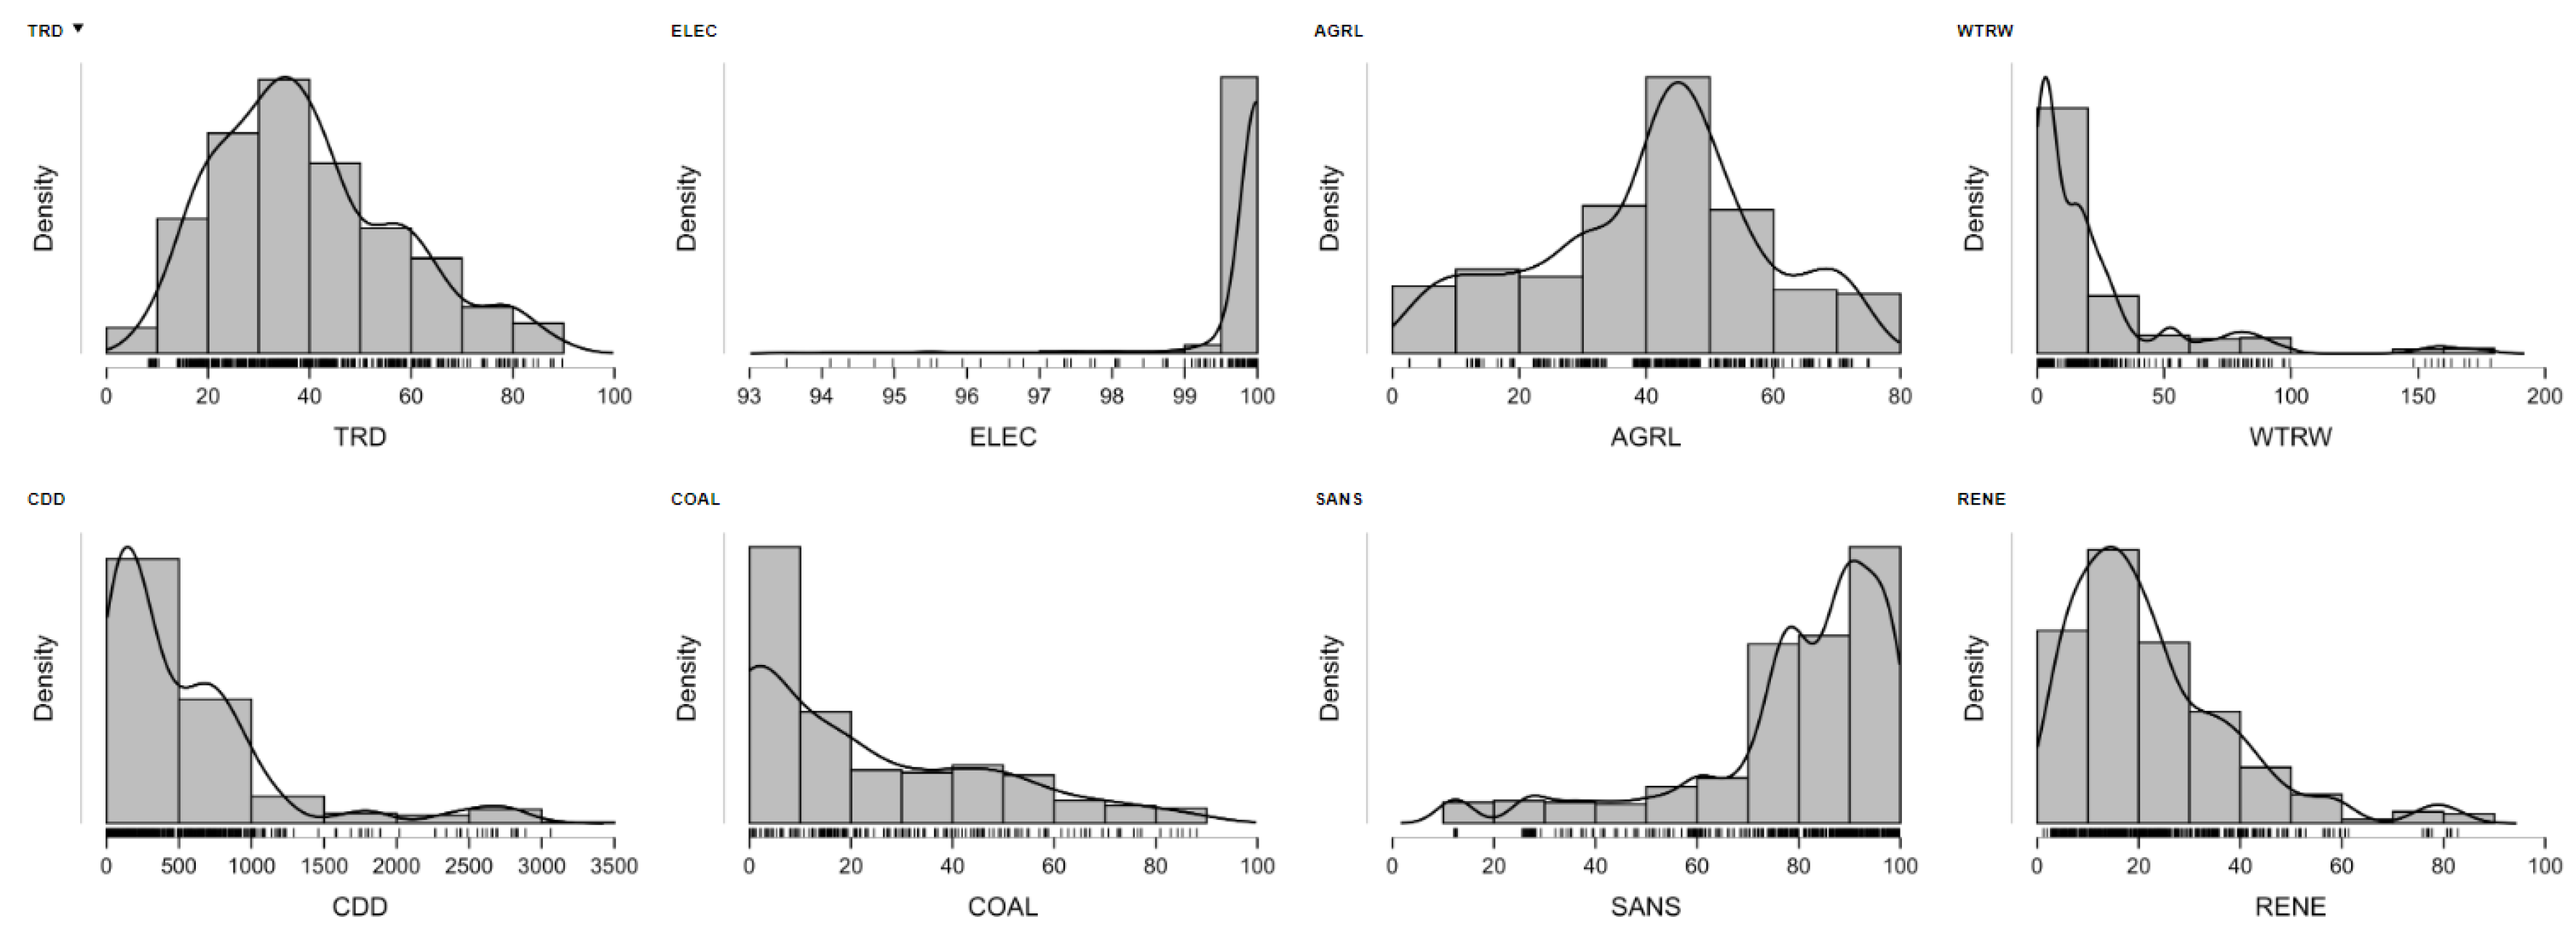
The Figure A4 shows the series of mean plots with 95% confidence intervals for the major variables for respiratory disease mortality (TRD) and its environmental and infrastructural determinants. These provide an immediate overview of the central tendency as well as distribution in the data set. Mean for TRD is concentrated near 39.6 with the narrow confidence interval suggesting minimal variability and high sample estimate precision. Electricity access (ELEC) has an extremely narrow interval with the mean near 99.8%, indicating universal coverage among the sampled locations. Similarly, agricultural land (AGRL) as well as freshwater withdrawals (WTRW) reveal narrow intervals with the mean values near 40.7 as well as 22.7 respectively, suggesting rather even distribution among these variables across the nations. Cooling Degree Days (CDD), the climate-exposure variables for heat stress, reveal broader confidence interval indicating high heterogeneity in the climatic exposure for Europe. Coal consumption (COAL) also depicts medium dispersion, consistent with country-level variations in the country-level energy mixes. Sanitation (SANS) as well as renewable energy (RENE) reveal somewhat wider intervals with the mean values 78.9 as well as 22.3 respectively, indicating the enduring gap in the distribution among the infrastructures as well as between the distribution among the energy transition. Overall, these plots reveal evidence for not only even but also heterogeneous distribution across variables, providing the support for the assumption that the respiratory health outcomes are the result of the combination between the uniformly as well as heterogeneously distributed environmental as well as infrastructural conditions (Figure A4).
Figure A4.
Mean Values with 95% Confidence Intervals for Environmental and Infrastructural Variables. Note: Each panel displays the mean (black dot) and corresponding 95% confidence interval (vertical bar) for the variables included in the analysis (TRD, ELEC, AGRL, WTRW, CDD, COAL, SANS, RENE). The narrow intervals for ELEC and SANS reflect low variability, consistent with near-universal electricity access and high sanitation coverage across most European countries. In contrast, wider intervals for CDD and WTRW indicate greater heterogeneity in climate exposure and water use intensity. These results highlight structural disparities across environmental and infrastructural dimensions that may shape respiratory health outcomes.
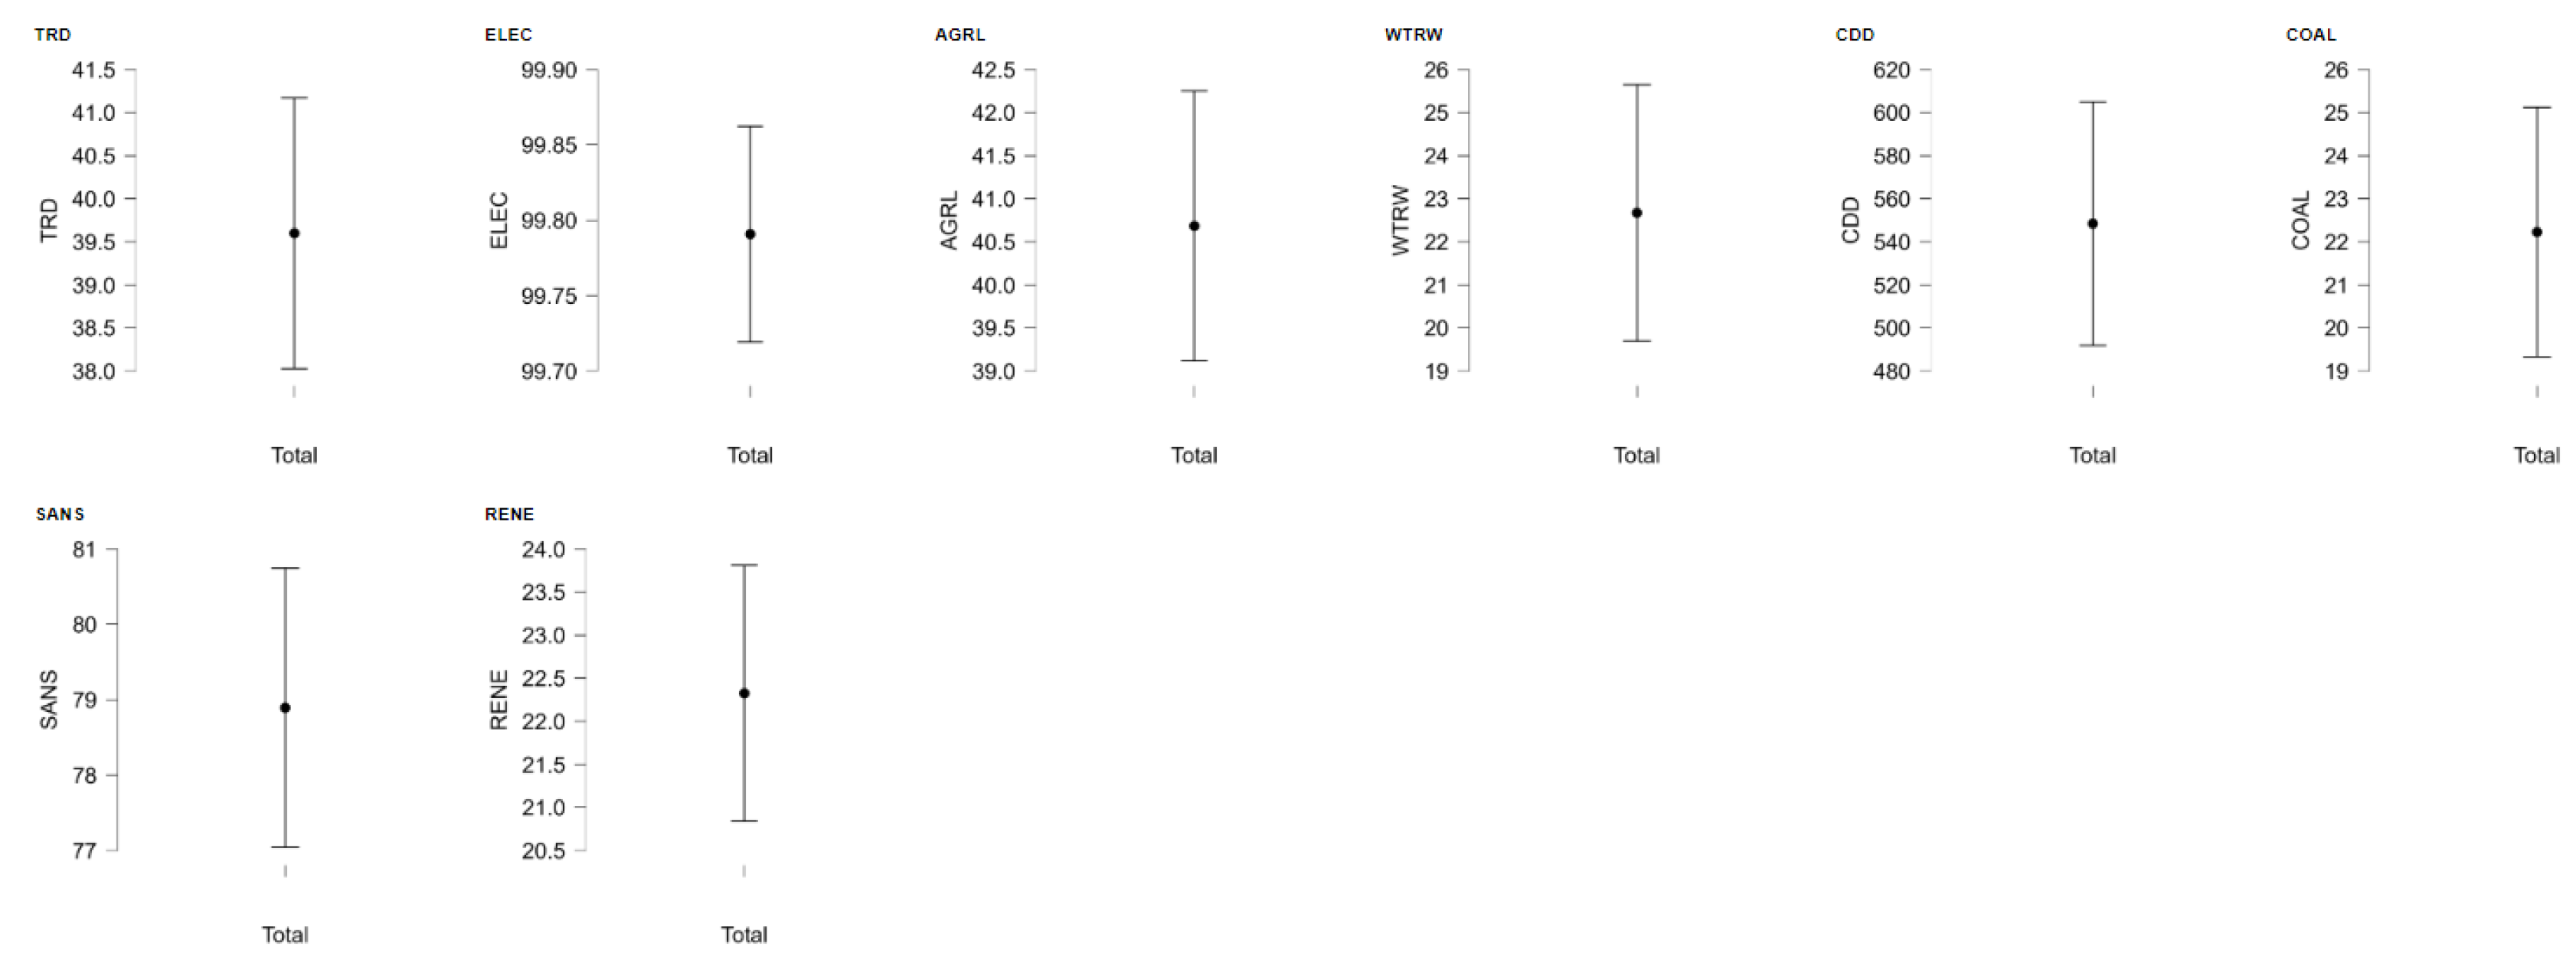
References
- Abdi, A.H.; Siyad, S.A.; Sugow, M.O.; Omar, O.M. Approaches to ecological sustainability in sub-Saharan Africa: evaluating the role of globalization, renewable energy, economic growth, and population density. Research in Globalization 2025, 10, 100273. [Google Scholar] [CrossRef]
- Agache, I., Sampath, V., Aguilera, J., Akdis, C. A., Akdis, M., Barry, M., ... & Nadeau, K. C. (2022). Climate change and global health: a call to more research and more action. Allergy, 77(5), 1389-1407. [CrossRef]
- Akther, A.; Tahrim, F.; Voumik, L.C.; Esquivias, M.A.; Pattak, D.C. Municipal solid waste dynamics: Economic, environmental, and technological determinants in Europe. Cleaner Engineering and Technology 2025, 24, 100877. [Google Scholar] [CrossRef]
- Al Jauhar, H.S.; Solimun, S.; Fitriani, R. APPLICATION OF DBSCAN FOR CLUSTERING SOCIETY BASED ON WASTE MANAGEMENT BEHAVIOR. BAREKENG: Jurnal Ilmu Matematika dan Terapan 2025, 19, 961–972. [Google Scholar] [CrossRef]
- Albano, G.D.; Gagliardo, R.P.; Montalbano, A.M.; Profita, M. Overview of the mechanisms of oxidative stress: impact in inflammation of the airway diseases. Antioxidants 2022, 11, 2237. [Google Scholar] [CrossRef]
- Ali, M.J.; Rahaman, M.; Hossain, S.I. Urban green spaces for elderly human health: A planning model for healthy city living. Land Use Policy 2022, 114, 105970. [Google Scholar] [CrossRef]
- Anastasiou, A.; Kalligosfyris, C.; Kalamara, E. Determinants of tax revenue performance in European countries: a panel data investigation. International Journal of Public Administration 2024, 47, 227–242. [Google Scholar] [CrossRef]
- Andabayeva, G.; Kakizhanova, T.; Yerezhepova, A.; Arzayeva, M.; Arpabayev, E.; Sabyrova, M. Impact of Good governance Indicators on Green Growth: Evidence from Kazakhstan. International Journal of Energy Economics and Policy 2025, 15, 217. [Google Scholar] [CrossRef]
- Andersen, Z. J., Gehring, U., De Matteis, S., Melen, E., Vicedo-Cabrera, A. M., Katsouyanni, K., ... & Hoffmann, B. (2021). Clean air for healthy lungs–an urgent call to action: European Respiratory Society position on the launch of the WHO 2021 Air Quality Guidelines. European Respiratory Journal, 58(6). [CrossRef]
- Andrei, F. Rethinking Economic Growth Policies in the Context of Sustainability: Panel Data Analysis on Pollution as an Effect of Economic Development in EU Countries. Sustainability 2023, 15, 15940. [Google Scholar] [CrossRef]
- Assegie, T.A.; Suresh, T.; Purushothaman, R.; Ganesan, S.; Kumar, N.K. Early prediction of gestational diabetes with parameter-tuned K-Nearest Neighbor Classifier. Journal of Robotics and Control (JRC) 2023, 4, 452–457. [Google Scholar] [CrossRef]
- Bajal, E.; Katara, V.; Bhatia, M.; Hooda, M. A review of clustering algorithms: comparison of DBSCAN and K-mean with oversampling and t-SNE. Recent Patents on Engineering 2022, 16, 17–31. [Google Scholar] [CrossRef]
- Bălă, G.P.; Râjnoveanu, R.M.; Tudorache, E.; Motișan, R.; Oancea, C. Air pollution exposure—the (in) visible risk factor for respiratory diseases. Environmental Science and Pollution Research 2021, 28, 19615–19628. [Google Scholar] [CrossRef]
- Bauwelinck, M., Casas, L., Nawrot, T. S., Nemery, B., Trabelsi, S., Thomas, I., ... & Vandenheede, H. (2021). Residing in urban areas with higher green space is associated with lower mortality risk: a census-based cohort study with ten years of follow-up. Environment International, 148, 106365. [CrossRef]
- Bell, M.L.; Gasparrini, A.; Benjamin, G.C. Climate change, extreme heat, and health. New England Journal of Medicine 2024, 390, 1793–1801. [Google Scholar] [CrossRef]
- Berberian, A.G.; Gonzalez, D.J.; Cushing, L.J. Racial disparities in climate change-related health effects in the United States. Current environmental health reports 2022, 9, 451–464. [Google Scholar] [CrossRef] [PubMed]
- Bikis, A. Urban air pollution and greenness in relation to public health. Journal of environmental and public health 2023, 2023, 8516622. [Google Scholar] [CrossRef] [PubMed]
- Bloom, C. I., Drake, T. M., Docherty, A. B., Lipworth, B. J., Johnston, S. L., Nguyen-Van-Tam, J. S., ... & Tanianis-Hughes, J. (2021). Risk of adverse outcomes in patients with underlying respiratory conditions admitted to hospital with COVID-19: a national, multicentre prospective cohort study using the ISARIC WHO Clinical Characterisation Protocol UK. The Lancet Respiratory Medicine, 9(7), 699-711. [CrossRef]
- Bonar, D.J. Do strict environmental policies in European countries reduce CO2 emissions? . Przegląd Statystyczny. Statistical Review 2024, 71, 1–22. [Google Scholar] [CrossRef]
- Bouzebda, S.; Laksaci, A.; Mohammedi, M. The k-nearest neighbors method in single index regression model for functional quasi-associated time series data. Revista Matemática Complutense 2023, 36, 361–391. [Google Scholar] [CrossRef]
- Bush, A., Byrnes, C. A., Chan, K. C., Chang, A. B., Ferreira, J. C., Holden, K. A., ... & Zar, H. J. (2024). Social determinants of respiratory health from birth: still of concern in the 21st century?. European Respiratory Review, 33(172). [CrossRef] [PubMed]
- Bytyqi, A.; Abazi-Alili, H.; Hadzimustafa, S. Economic Growth and Environmental Sustainability determinants: a panel ARDL evidence for EU Countries. Logistics, Supply Chain, Sustainability and Global Challenges 2024, 15, 71–82. [Google Scholar] [CrossRef]
- Cerqueti, R.; Ferraro, G.; Mattera, R.; Storani, S. Mapping socio-environmental policy integration in the European Union: A multilayer network approach. Journal of Cleaner Production 2025, 491, 144792. [Google Scholar] [CrossRef]
- Chang, A. B., Kovesi, T., Redding, G. J., Wong, C., Alvarez, G. G., Nantanda, R., ... & Gray, D. M. (2024). Chronic respiratory disease in Indigenous peoples: a framework to address inequity and strengthen respiratory health and health care globally. The Lancet Respiratory Medicine, 12(7), 556-574. [CrossRef]
- Chu, L.K.; Le, N.T.M. Environmental quality and the role of economic policy uncertainty, economic complexity, renewable energy, and energy intensity: the case of G7 countries. Environmental Science and Pollution Research 2022, 29, 2866–2882. [Google Scholar]
- Cook, E., Velis, C.A., Josh, C. (2021). Safely recovering value from plastic waste in the Global South: Opportunities and challenges for circular economy and plastic pollution mitigation.
- Cortes-Ramirez, J.; Gatton, M.; Wilches-Vega, J.D.; Mayfield, H.J.; Wang, N.; Paris-Pineda, O.M.; Sly, P.D. Mapping the risk of respiratory infections using suburban district areas in a large city in Colombia. BMC Public Health 2023, 23, 1400. [Google Scholar] [CrossRef]
- De Ridder, D., Ladoy, A., Choi, Y., Jacot, D., Vuilleumier, S., Guessous, I., ... & Greub, G. (2024). Environmental and geographical factors influencing the spread of SARS-CoV-2 over 2 years: a fine-scale spatiotemporal analysis. Frontiers in Public Health, 12, 1298177. [CrossRef]
- de Schrijver, E.; Royé, D.; Gasparrini, A.; Franco, O.H.; Vicedo-Cabrera, A.M. Exploring vulnerability to heat and cold across urban and rural populations in Switzerland. Environmental Research: Health 2023, 1, 025003. [Google Scholar] [CrossRef]
- Delgado, L., Morales, E.F. (2021, October). DBSCAN Parameter Selection Based on K-NN. In Mexican International Conference on Artificial Intelligence (pp. 187–198). Cham: Springer International Publishing.
- Dunlap, A. Spreading ‘green’infrastructural harm: mapping conflicts and socio-ecological disruptions within the European Union’s transnational energy grid. Globalizations 2023, 20, 907–931. [Google Scholar] [CrossRef]
- Evitania, C.G. Implementation of the K-Nearest Neighbor Algorithm to Predict Air Pollution. Information Technology and Systems 2023, 1, 45–54. [Google Scholar] [CrossRef]
- Farizki, R.; Supriatna, N.; Juliana, C. Classification of Drug Usage Patterns and Identification of Diseases in the Provision of Drug Types Using the K-Nearest Neighbors Method. Journal of World Science 2024, 3, 1554–1564. [Google Scholar] [CrossRef]
- Fishe, J.; Zheng, Y.; Lyu, T.; Bian, J.; Hu, H. Environmental effects on acute exacerbations of respiratory diseases: A real-world big data study. Science of The Total Environment 2022, 806, 150352. [Google Scholar] [CrossRef]
- Fotio, H.K.; Gouenet, R.M.; Ngo Tedga, P. Beyond the direct effect of economic growth on child mortality in Sub-Saharan Africa: does environmental degradation matter? . Sustainable Development 2024, 32, 588–607. [Google Scholar] [CrossRef]
- Galiński, P. Determinants of the expenditure side of environmental federalism-panel data research on countries in Europe. Ekonomia i Środowisko 2023, 86. [Google Scholar] [CrossRef]
- Geng, T.; Ju, T.; Li, B.; An, B.; Su, H. Prediction of the Tropospheric NO2 Column Concentration and Distribution Using the Time Sequence-Based versus Influencing Factor-Based Random Forest Regression Model. Sustainability 2023, 15, 2748. [Google Scholar] [CrossRef]
- Genowska, A.; Strukcinskiene, B.; Jamiołkowski, J.; Abramowicz, P.; Konstantynowicz, J. Emission of Industrial Air Pollution and Mortality Due to Respiratory Diseases: A Birth Cohort Study in Poland. International journal of environmental research and public health 2023, 20, 1309. [Google Scholar] [CrossRef] [PubMed]
- Geovani, D.; Umari, Z.; Ramadini, S. Cluster Analysis Of Obesity Risk Levels Using K-Means And Dbscan Methods. Computer Engineering & Applications Journal 2024, 13. [Google Scholar]
- Ghazvinian, H.; Karami, H. Investigating the effect of climatic parameters predicting the mortality rate due to cardiovascular and respiratory disease with soft computing methods. Computational Engineering and Physical Modeling 2024, 7, 1–21. [Google Scholar]
- Gogoi, P.; Valan, J.A. Interpretable machine learning for chronic kidney disease prediction: A Shap and genetic algorithm-based approach. Biomedical Materials & Devices 2024, 1–19. [Google Scholar]
- Gopalakrishnan, S., Sridharan, S., Venkatraman, S. Centrality measures in finding influential nodes for the big-data network. Handbook of Smart Materials, Technologies, and Devices: Applications of Industry 4.0 2021, 1-17.
- Grigorieva, E.; Lukyanets, A. Combined effect of hot weather and outdoor air pollution on respiratory health: literature review. Atmosphere 2021, 12, 790. [Google Scholar] [CrossRef]
- Gutman, L., Pauly, V., Orleans, V., Piga, D., Channac, Y., Armengaud, A., ... & Papazian, L. (2022). Long-term exposure to ambient air pollution is associated with an increased incidence and mortality of acute respiratory distress syndrome in a large French region. Environmental Research, 212, 113383. [CrossRef]
- Han, S.; Kamaruddin, B.H.B.; Shi, X. The Intertwined Threads of Blue Economy, Inclusive Growth, and Environmental Sustainability in Transition Economies. Sustainability 2025, 17. [Google Scholar] [CrossRef]
- Hashemizadeh, A.; Bui, Q.; Kongbuamai, N. Unpacking the role of public debt in renewable energy consumption: new insights from the emerging countries. Energy 2021, 224, 120187. [Google Scholar] [CrossRef]
- Henriques, J.; Ferrão, P.; Iten, M. Policies and strategic incentives for circular economy and industrial symbiosis in Portugal: A future perspective. Sustainability 2022, 14, 6888. [Google Scholar] [CrossRef]
- Kanavos, A.; Voutos, Y.; Grivokostopoulou, F.; Mylonas, P. Evaluating methods for efficient community detection in social networks. Information 2022, 13, 209. [Google Scholar] [CrossRef]
- Karma, E. Socioeconomic determinants of life expectancy: Southeastern European countries. European Journal of Sustainable Development 2023, 12, 25–25. [Google Scholar] [CrossRef]
- Khan, N., Kamaruddin, M.A., Sheikh, U.U., Yusup, Y., Bakht, M.P. (2022, September). Environment-based oil palm yield prediction using K-nearest neighbour regression. In 2022 IEEE International Conference on Artificial Intelligence in Engineering and Technology (IICAIET) (pp. 1–6). IEEE.
- Krstić, M. Climate change in the EU: Analysis by clustering and regression. Serbian Journal of Management 2023, 18, 111–132. [Google Scholar] [CrossRef]
- Kumar, R., Srirama, V., Chadaga, K., Muralikrishna, H., Sampathila, N., Prabhu, S., Chadaga, R. (2024). Using Explainable Machine Learning Methods to Predict the Survivability Rate of Pediatric Respiratory Diseases. IEEE Access.
- Lee, Y.G.; Lee, P.H.; Choi, S.M.; An, M.H.; Jang, A.S. Effects of air pollutants on airway diseases. International journal of environmental research and public health 2021, 18, 9905. [Google Scholar] [CrossRef]
- Leogrande, A.; Costantiello, A.; Laureti, L. k-Means Clusterization and Machine Learning Prediction of European Most Cited Scientific Publications. International Journal of Entrepreneurship 2023, 27, 1–43. [Google Scholar] [CrossRef]
- Leogrande, A., Magaletti, N., Cosoli, G., Massaro, A. (2022). e-Government in Europe. A Machine Learning Approach.
- Leogrande, A., Magaletti, N., Cosoli, G., Giardinelli, V., Massaro, A. (2022). The Determinants of Internet User Skills in Europe.
- Li, Y., Jiang, C., Li, X., Zhang, J., Wang, Y., Yang, X., ... & Liu, Y. (2024). The structural change and determinants of global carbon footprint network embodied in international migration: A social network analysis. Journal of Cleaner Production, 449, 141651. [CrossRef]
- Liu, S., Lim, Y. H., Chen, J., Strak, M., Wolf, K., Weinmayr, G., ... & Andersen, Z. J. (2022). Long-term air pollution exposure and pneumonia-related mortality in a large pooled European cohort. American journal of respiratory and critical care medicine, 205(12), 1429-1439. [CrossRef]
- Maji, S.G.; Boruah, R. Climate change risks and opportunities: do sustainable business practices matter? Climate Policy 2025, 1–14. [Google Scholar] [CrossRef]
- Matkovic, V. Climate Change Impacts on Respiratory Health: Bridging Inequalities in Children and Adults. European Journal of Public Health 2024, 34 Supplement_3, ckae144-286. [Google Scholar] [CrossRef]
- Maung, T.Z.; Bishop, J.E.; Holt, E.; Turner, A.M.; Pfrang, C. Indoor air pollution and the health of vulnerable groups: a systematic review focused on particulate matter (PM), volatile organic compounds (VOCs) and their effects on children and people with pre-existing lung disease. International journal of environmental research and public health 2022, 19, 8752. [Google Scholar] [CrossRef]
- Mehta, D.; Derbeneva, V. Impact of environmental fiscal reforms on carbon emissions of EURO-4 countries: CS-NARDL approach. International Journal of Thermofluids 2024, 21, 100550. [Google Scholar] [CrossRef]
- Melas, D., Parliari, D., Economou, T., Giannaros, C., Liora, N., Papadogiannaki, S., ... & Kelessis, A. (2023). Developing a System for Integrated Environmental Information in Urban Areas: An Estimation of the Impact of Thermal Stress on Health. Environmental Sciences Proceedings, 26(1), 117. [CrossRef]
- Mendez Alva, F.; De Boever, R.; Van Eetvelde, G. Hubs for circularity: Geo-based industrial clustering towards urban symbiosis in europe. Sustainability 2021, 13, 13906. [Google Scholar] [CrossRef]
- Meshcheryakova, N.; Shvydun, S. (2023, November). Perturbation analysis of centrality measures. In Proceedings of the International Conference on Advances in Social Networks Analysis and Mining (pp. 407–414).
- Mirović, V.; Kalaš, B.; Milenković, N. Panel cointegration analysis of total environmental taxes and economic growth in EU countries. Economic Analysis 2021, 54, 92–103. [Google Scholar] [CrossRef]
- Momtazmanesh, S., Moghaddam, S. S., Ghamari, S. H., Rad, E. M., Rezaei, N., Shobeiri, P., ... & Ibitoye, S. E. (2023). Global burden of chronic respiratory diseases and risk factors, 1990–2019: an update from the Global Burden of Disease Study 2019. EClinicalMedicine, 59.
- Monko, G.J., & Kimura, M. (2023, October). SS-DBSCAN: Epsilon Estimation with Stratified Sampling for Density-Based Spatial Clustering of Applications with Noise. In 2023 International Conference on Automation, Control and Electronics Engineering (CACEE) (pp. 72–76). IEEE.
- Moon, K.; Jetawat, A. Predicting lung cancer with k-nearest neighbors (knn): a computational approach. Indian J. Sci. Technol 2024, 17, 2199–2206. [Google Scholar] [CrossRef]
- Musah, M. Stock market development and environmental quality in EU member countries: a dynamic heterogeneous approach. Environment, development and sustainability 2023, 25, 11153–11187. [Google Scholar] [CrossRef]
- Muszyńska-Spielauer, M.; Spielauer, M. Cross-sectional estimates of population health from the survey of health and retirement in Europe (SHARE) are biased due to health-related sample attrition. SSM-Population Health 2022, 20, 101290. [Google Scholar] [CrossRef]
- Nepomuceno, T.C.C., Piubello Orsini, L., de Carvalho, V.D.H., Poleto, T., Leardini, C. (2022, July). The core of healthcare efficiency: a comprehensive bibliometric review on frontier analysis of hospitals. In Healthcare (Vol. 10, No. 7, p. 1316). MDPI.
- Nishida, C.; Yatera, K. The impact of ambient environmental and occupational pollution on respiratory diseases. International journal of environmental research and public health 2022, 19, 2788. [Google Scholar] [CrossRef] [PubMed]
- Nurmayanti, W.P.; Ratnaningsih, D.J.; Nisrina, S.; Rahim, A.; Malthuf, M.; Kusuma, W. Clustrering of BPJS National Health Insurance Participant Using DBSCAN Algorithm. Jurnal Varian 2022, 6, 25–34. [Google Scholar] [CrossRef]
- Ofori, E.K.; Bekun, F.V.; Gyamfi, B.A.; Ali, E.B.; Onifade, S.T.; Asongu, S.A. Prospect of trade and innovation in renewable energy deployment: A comparative analysis between BRICS and MINT Countries. Renewable Energy 2024, 229, 120757. [Google Scholar] [CrossRef]
- Ofremu, G.O.; Raimi, B.Y.; Yusuf, S.O.; Dziwornu, B.A.; Nnabuife, S.G.; Eze, A.M.; Nnajiofor, C.A. Exploring the relationship between climate change, air pollutants and human health: impacts, adaptation, and mitigation strategies. Green Energy and Resources 2025, 3, 100074. [Google Scholar] [CrossRef]
- Owusu, S.M.; Acheampong, P. Assessing the influence of green finance, renewable energy and digitization in stimulating economic expansion: Lessons from emerging economies. Renewable and Sustainable Energy Reviews 2025, 212, 115413. [Google Scholar] [CrossRef]
- Papageorgiou, V.E. Boosting epidemic forecasting performance with enhanced RNN-type models. Operational Research 2025, 25, 77. [Google Scholar] [CrossRef]
- Piracha, A.; Chaudhary, M.T. Urban air pollution, urban heat island and human health: a review of the literature. Sustainability 2022, 14, 9234. [Google Scholar] [CrossRef]
- Pona, H.T.; Xiaoli, D.; Ayantobo, O.O.; Tetteh, N.D. Environmental health situation in Nigeria: current status and future needs. Heliyon 2021, 7. [Google Scholar] [CrossRef]
- Popescu, G.H.; Nica, E.; Kliestik, T.; Alpopi, C.; Bîgu, A.M.P.; Niță, S.C. The impact of ecological footprint, urbanization, education, health expenditure, and industrialization on child mortality: Insights for environment and public health in Eastern Europe. International Journal of Environmental Research and Public Health 2024, 21, 1379. [Google Scholar] [CrossRef]
- Prieto Flores, M.E., Gómez-Barroso, D., Moreno Jiménez, A. (2021). Geographic health inequalities in Madrid City: exploring spatial patterns of respiratory disease mortality.
- Ramani, R., Trivedi, D., Talaviya, J., Diwan, A., Cruz, J.C.D. (2023, November). K-Nearest Neighbors in Cardiology: A Promising Tool for Heart Disease Prediction. In 2023 IEEE 15th International Conference on Humanoid, Nanotechnology, Information Technology, Communication and Control, Environment, and Management (HNICEM) (pp. 1–6). IEEE.
- Regilan, S.; Hema, L.K. Optimizing environmental monitoring in IoT: Integrating DBSCAN with genetic algorithms for enhanced clustering. International Journal of Computers and Applications 2023, 46, 21–31. [Google Scholar] [CrossRef]
- Romano, D., Novielli, P., Diacono, D., Cilli, R., Pantaleo, E., Amoroso, N., ... & Tangaro, S. (2024). Insights from explainable artificial intelligence of pollution and socioeconomic influences for respiratory cancer mortality in Italy. Journal of Personalized Medicine, 14(4), 430. [CrossRef]
- Saliba, Y., Barbulescu, A., Dumitriu, C.Ș. (2025). A critical approach to clustering precipitation series in the Dobrogea region, Romania. In E3S Web of Conferences (Vol. 608, p. 05027). EDP Sciences.
- Samreen, I.; Majeed, M.T. Economic development, social–political factors and ecological footprint: a global panel data analysis. SN Business & Economics 2022, 2, 132. [Google Scholar] [CrossRef]
- Silveyra, P., Fuentes, N., Rodriguez Bauza, D.E. (2021). Sex and gender differences in lung disease. In Lung Inflammation in Health and Disease, Volume II (pp. 227–258). Cham: Springer International Publishing.
- Solomon, J. J., Danoff, S. K., Woodhead, F. A., Hurwitz, S., Maurer, R., Glaspole, I., ... & Mackintosh, J. A. (2023). Safety, tolerability, and efficacy of pirfenidone in patients with rheumatoid arthritis-associated interstitial lung disease: a randomised, double-blind, placebo-controlled, phase 2 study. The Lancet Respiratory Medicine, 11(1), 87-96. [CrossRef]
- Stanciu, S. M., Rusu, E., Jinga, M., Ursu, C. G., Stanciu, R. I., Miricescu, D., ... & Barbu, E. (2024). Multivariate Analysis of the Determinants of Total Mortality in the European Union with Focus on Fat Intake, Diabetes, Myocardial Infarction, Life Expectancy, and Preventable Mortality: A Panel Data Fixed-Effects Panel Data Model Approach. Journal of Cardiovascular Development and Disease, 11(10), 328. [CrossRef]
- Sudiatmika, I.P.G.A., Saputra, P.S., Ulil, M.R. A COMPARATIVE STUDY OF K-NEAREST NEIGHBORS AND RANDOM FOREST CLASSIFIERS ON DIABETES.
- Syahzaqi, I.; Effendi, M.; Rahmawati, H.; Kuswanto, H.; Sediono, S. GROUPING PROVINCES IN INDONESIA BASED ON THE NUMBER OF VILLAGES AFFECTED BY ENVIROMENTAL POLLUTION WITH K-MEDOIDS, FUZZY C-MEANS, AND DBSCAN. BAREKENG: Jurnal Ilmu Matematika dan Terapan 2024, 18, 0923–0936. [Google Scholar] [CrossRef]
- Tang, M.; Liu, W.; Li, H.; Li, F. Greenness and chronic respiratory health issues: a systematic review and meta-analysis. Frontiers in public health 2023, 11, 1279322. [Google Scholar] [CrossRef]
- Tarín-Carrasco, P.; Im, U.; Geels, C.; Palacios-Peña, L.; Jiménez-Guerrero, P. Reducing future air-pollution-related premature mortality over Europe by mitigating emissions from the energy sector: assessing an 80% renewable energies scenario. Atmospheric Chemistry and Physics 2022, 22, 3945–3965. [Google Scholar] [CrossRef]
- Tran, H. M., Tsai, F. J., Lee, Y. L., Chang, J. H., Chang, L. T., Chang, T. Y., ... & Chuang, H. C. (2023). The impact of air pollution on respiratory diseases in an era of climate change: A review of the current evidence. Science of the Total Environment, 898, 166340. [CrossRef] [PubMed]
- Tursunov, B.; Nazarov, F.; Kenzhebayev, M. Handling Missing Data and Attrition Bias in Unbalanced Panel Data Sets: Multiple Imputation Techniques and Inverse Probability Weighting in Longitudinal Health Economics Research. Orient Journal of Emerging Paradigms in Artificial Intelligence and Autonomous Systems 2025, 15, 1–11. [Google Scholar]
- Vasilescu, M.D.; Stănilă, L.; Popescu, M.E.; Militaru, E.; Marin, E. Using panel data clustering regression analysis to revisit income inequalities in the European Union. Applied Economics Letters 2024, 1–6. [Google Scholar] [CrossRef]
- Walkowiak, M.P.; Bandurski, K.; Walkowiak, J.; Walkowiak, D. Outpacing climate change: adaptation to heatwaves in Europe. International Journal of Biometeorology 2025, 69, 989–1002. [Google Scholar] [CrossRef]
- Wang, Y., Zhang, C., Pennington, E. A., He, L., Yang, J., Yu, X., ... & Seinfeld, J. H. (2024). Short‐lived air pollutants and climate forcers through the lens of the COVID‐19 pandemic. Reviews of Geophysics, 62(4), e2022RG000773. [CrossRef]
- Waqar, M.; Shahnawaz, M.B.; Saleem, S.; Dawood, H.; Muhammad, U.; Dawood, H. Enhancing Heart Attack Prediction: Feature Identification from Multiparametric Cardiac Data Using Explainable AI. Algorithms 2025, 18, 333. [Google Scholar] [CrossRef]
- Wilkinson, A.; Woodcock, A. The environmental impact of inhalers for asthma: a green challenge and a golden opportunity. British Journal of Clinical Pharmacology 2022, 88, 3016–3022. [Google Scholar] [CrossRef] [PubMed]
- Wiranata, A.D.; Soleman, S.; Irwansyah, I.; Sudaryana, I.K.; Rizal, R. Klasifikasi Data Mining Untuk Menentukan Kualitas Udara Di Provinsi Dki Jakarta Menggunakan Algoritma K-Nearest Neighbors (K-Nn). Infotech: Journal of Technology Information 2023, 9, 95–100. [Google Scholar] [CrossRef]
- Wojciechowski, W.; Streimikiene, D.; Wojciechowski, A.; Bilan, Y. The role of nuclear energy in low carbon energy transition: evidence from panel data approach in EU. Environmental Science and Pollution Research 2023, 30, 124353–124373. [Google Scholar] [CrossRef]
- Wu, H.W.; Kumar, P.; Cao, S.J. The role of roadside green infrastructure in improving air quality in and around elderly care centres in Nanjing, China. Atmospheric Environment 2024, 332, 120607. [Google Scholar] [CrossRef]
- Wu, J.; Yang, M.; Xiong, L.; Wang, C.; Ta, N. Health-oriented vegetation community design: Innovation in urban green space to support respiratory health. Landscape and Urban Planning 2021, 205, 103973. [Google Scholar] [CrossRef]
- Xie, Y.; Jia, X.; Shekhar, S.; Bao, H.; Zhou, X. Significant DBSCAN+: Statistically robust density-based clustering. ACM Transactions on Intelligent Systems and Technology (TIST) 2021, 12, 1–26. [Google Scholar] [CrossRef]
- Xu, S., Marcon, A., Bertelsen, R. J., Benediktsdottir, B., Brandt, J., Engemann, K., ... & Johannessen, A. (2023). Long-term exposure to low-level air pollution and greenness and mortality in Northern Europe. The Life-GAP project. Environment International, 181, 108257. [PubMed]
- Yang, M.; Zou, Y. Assessing environmental determinants of subjective well-being via machine learning approaches: a systematic review. Humanities and Social Sciences Communications 2025, 12, 1–15. [Google Scholar] [CrossRef]
- Yıldırım, M.Ş.; Baycan, İ.O. Analyzing the effects of energy productivity: the case of European Union countries. Environmental Science and Pollution Research 2023, 30, 117519–117530. [Google Scholar] [CrossRef]
- Younis, K.K.; Ibrahim, I.M. Real-World Implementations of Network Centrality Algorithms across Various. Asian Journal of Research in Computer Science 2025, 18, 147–162. [Google Scholar] [CrossRef]
- Zafeiratou, S., Samoli, E., Analitis, A., Gasparrini, A., Stafoggia, M., de’Donato, F. K., ... & EXHAUSTION project team. (2023). Assessing heat effects on respiratory mortality and location characteristics as modifiers of heat effects at a small area scale in Central-Northern Europe. Environmental epidemiology, 7(5), e269.
- Zhang, H., Ye, R., Yang, H., Liu, Y., Zhao, L., Zhao, Y., ... & Xia, Y. (2024). Long-term noise exposure and cause-specific mortality in chronic respiratory diseases, considering the modifying effect of air pollution. Ecotoxicology and Environmental Safety, 282, 116740. [CrossRef] [PubMed]
Figure 1.
Integrated Methodological Framework for Environmental Determinants of Respiratory Health.
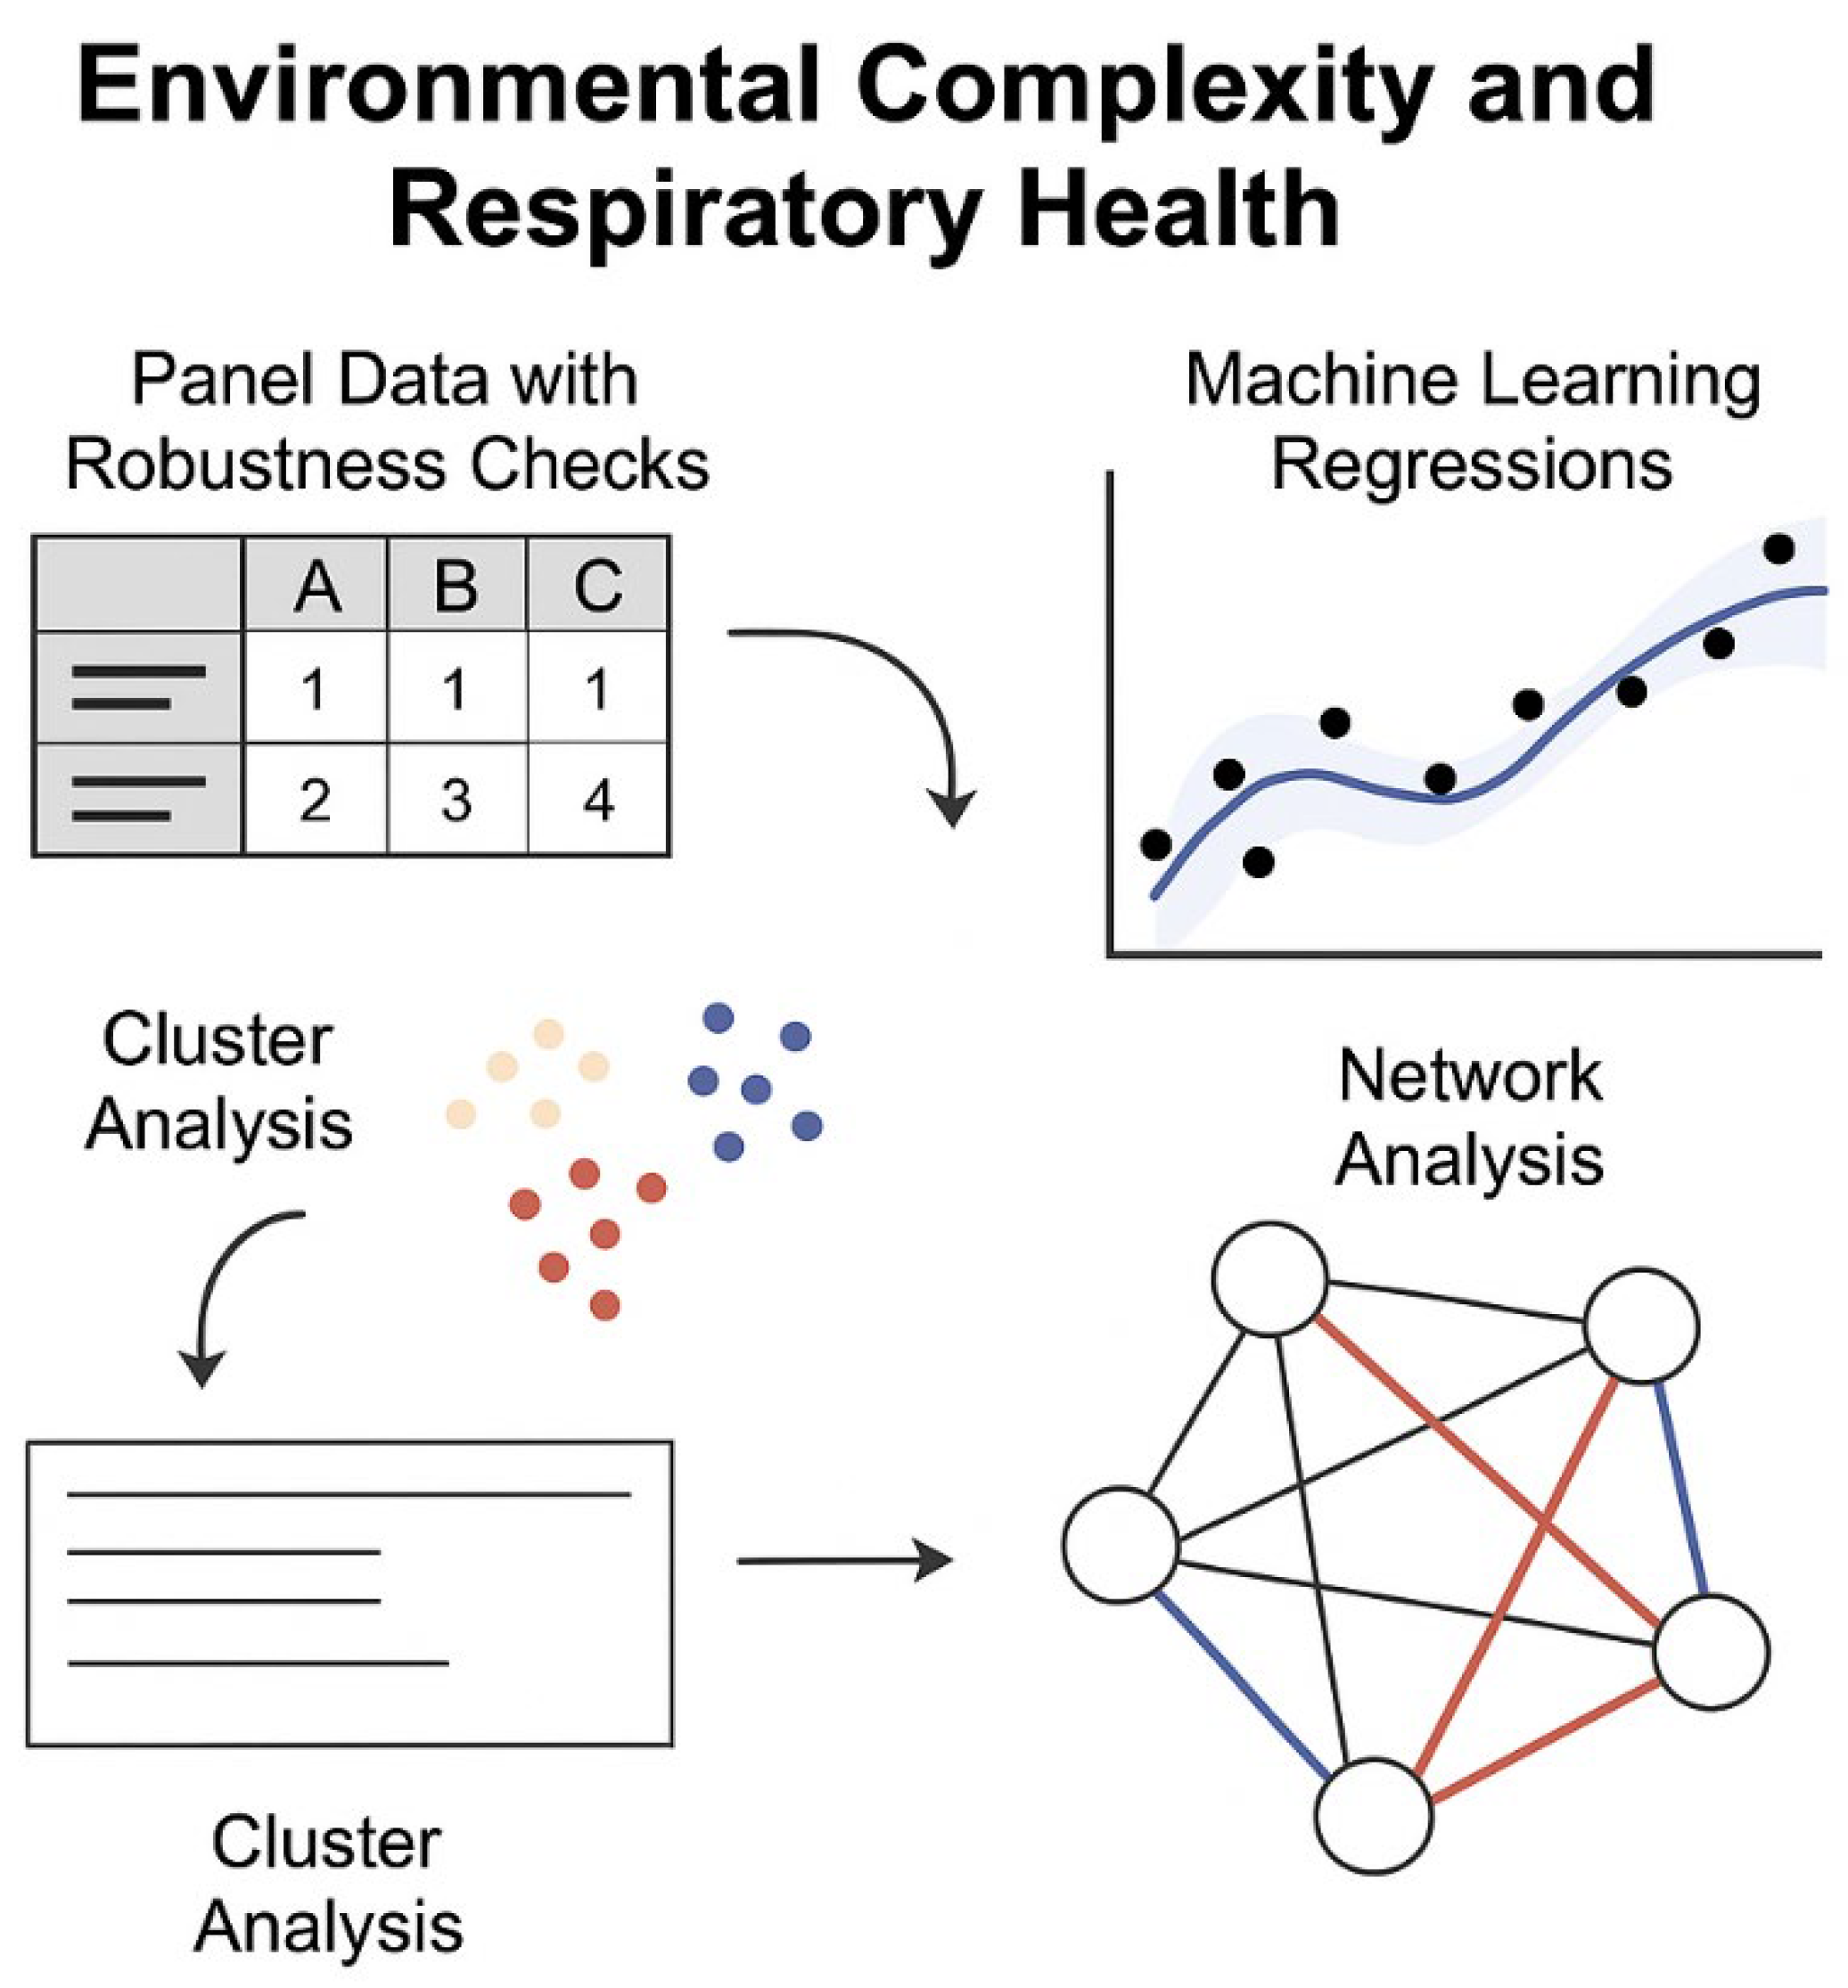
Figure 2.
DBSCAN Parameter Selection and Cluster Visualization.
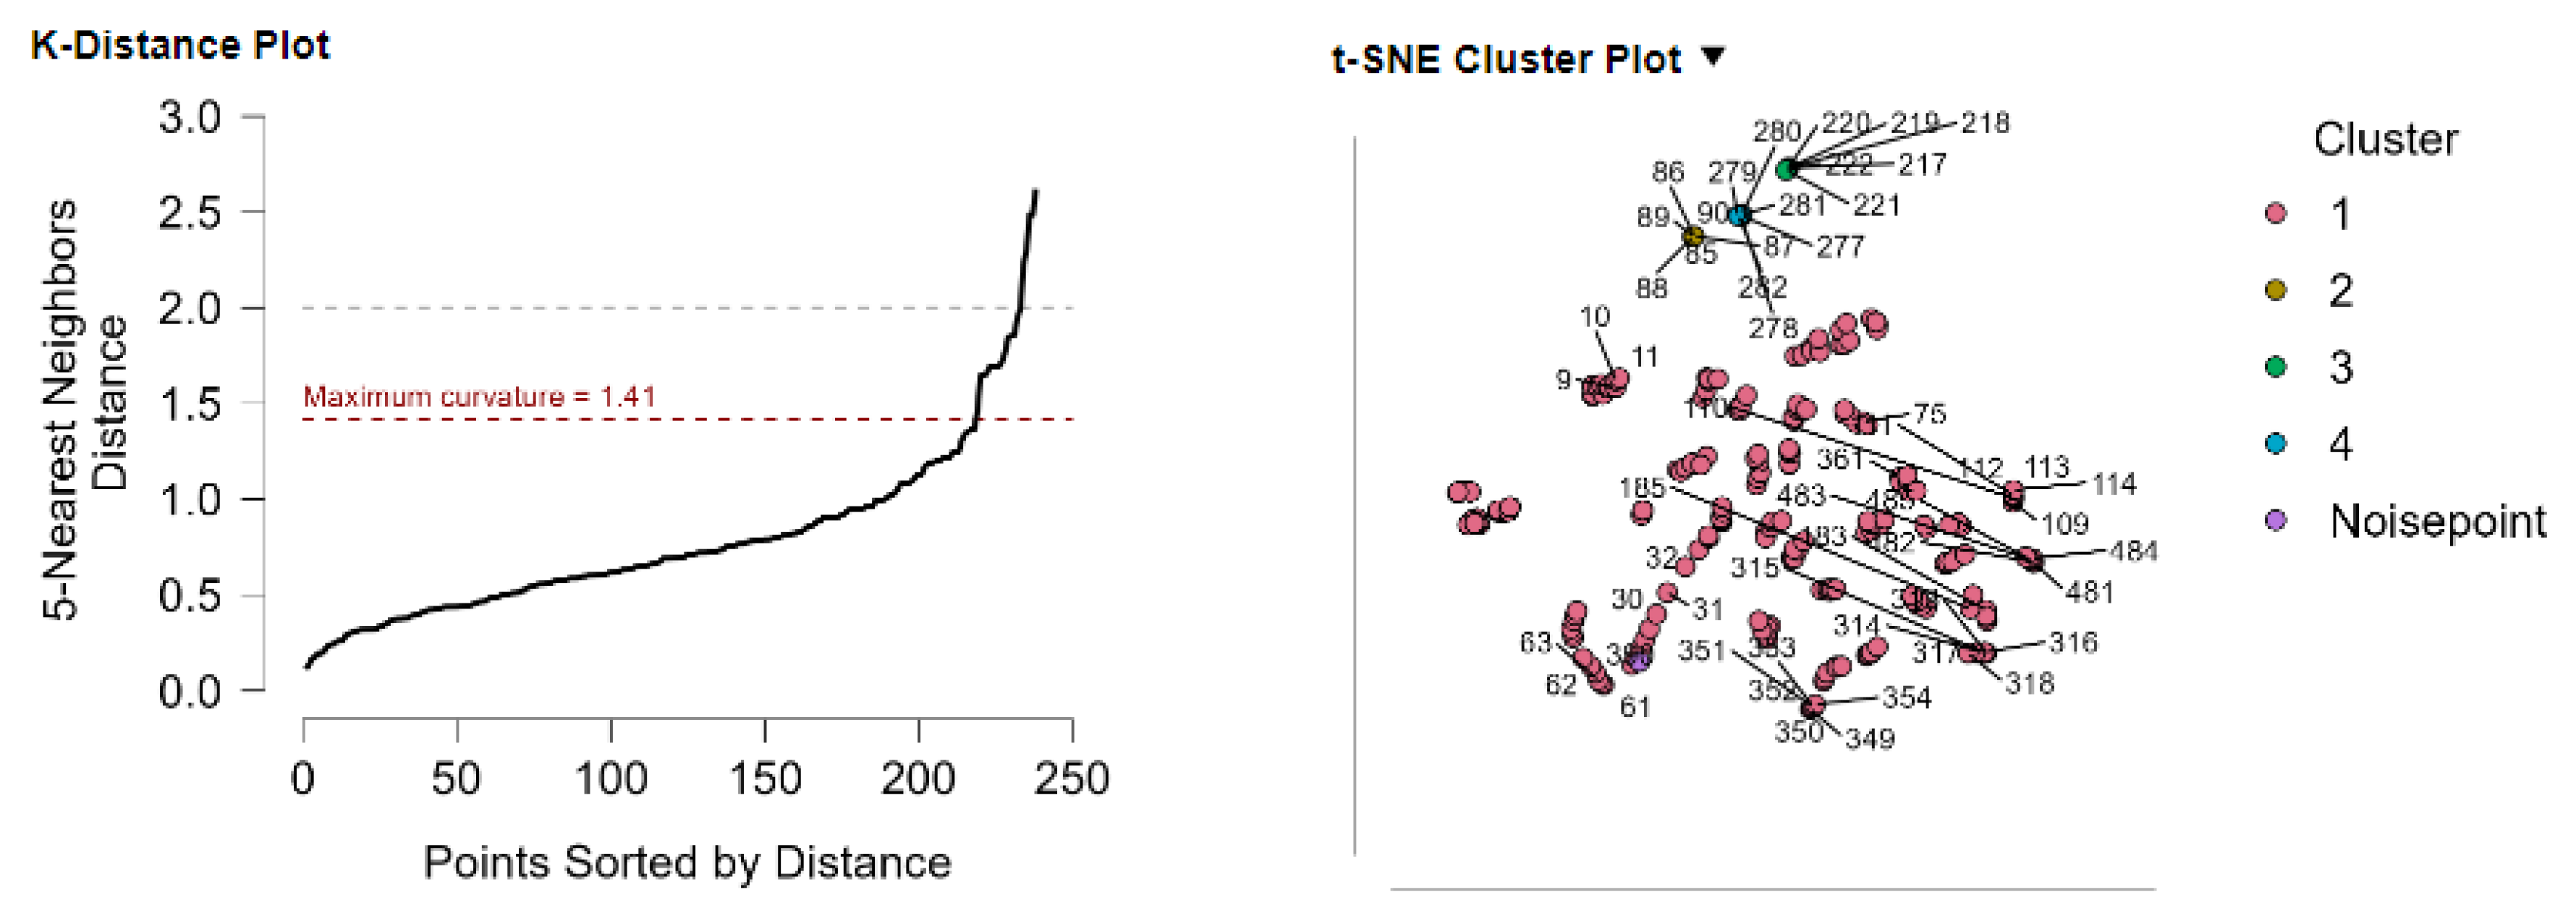
Figure 3.
Predictive Accuracy and Parameter Optimization of the KNN Model.
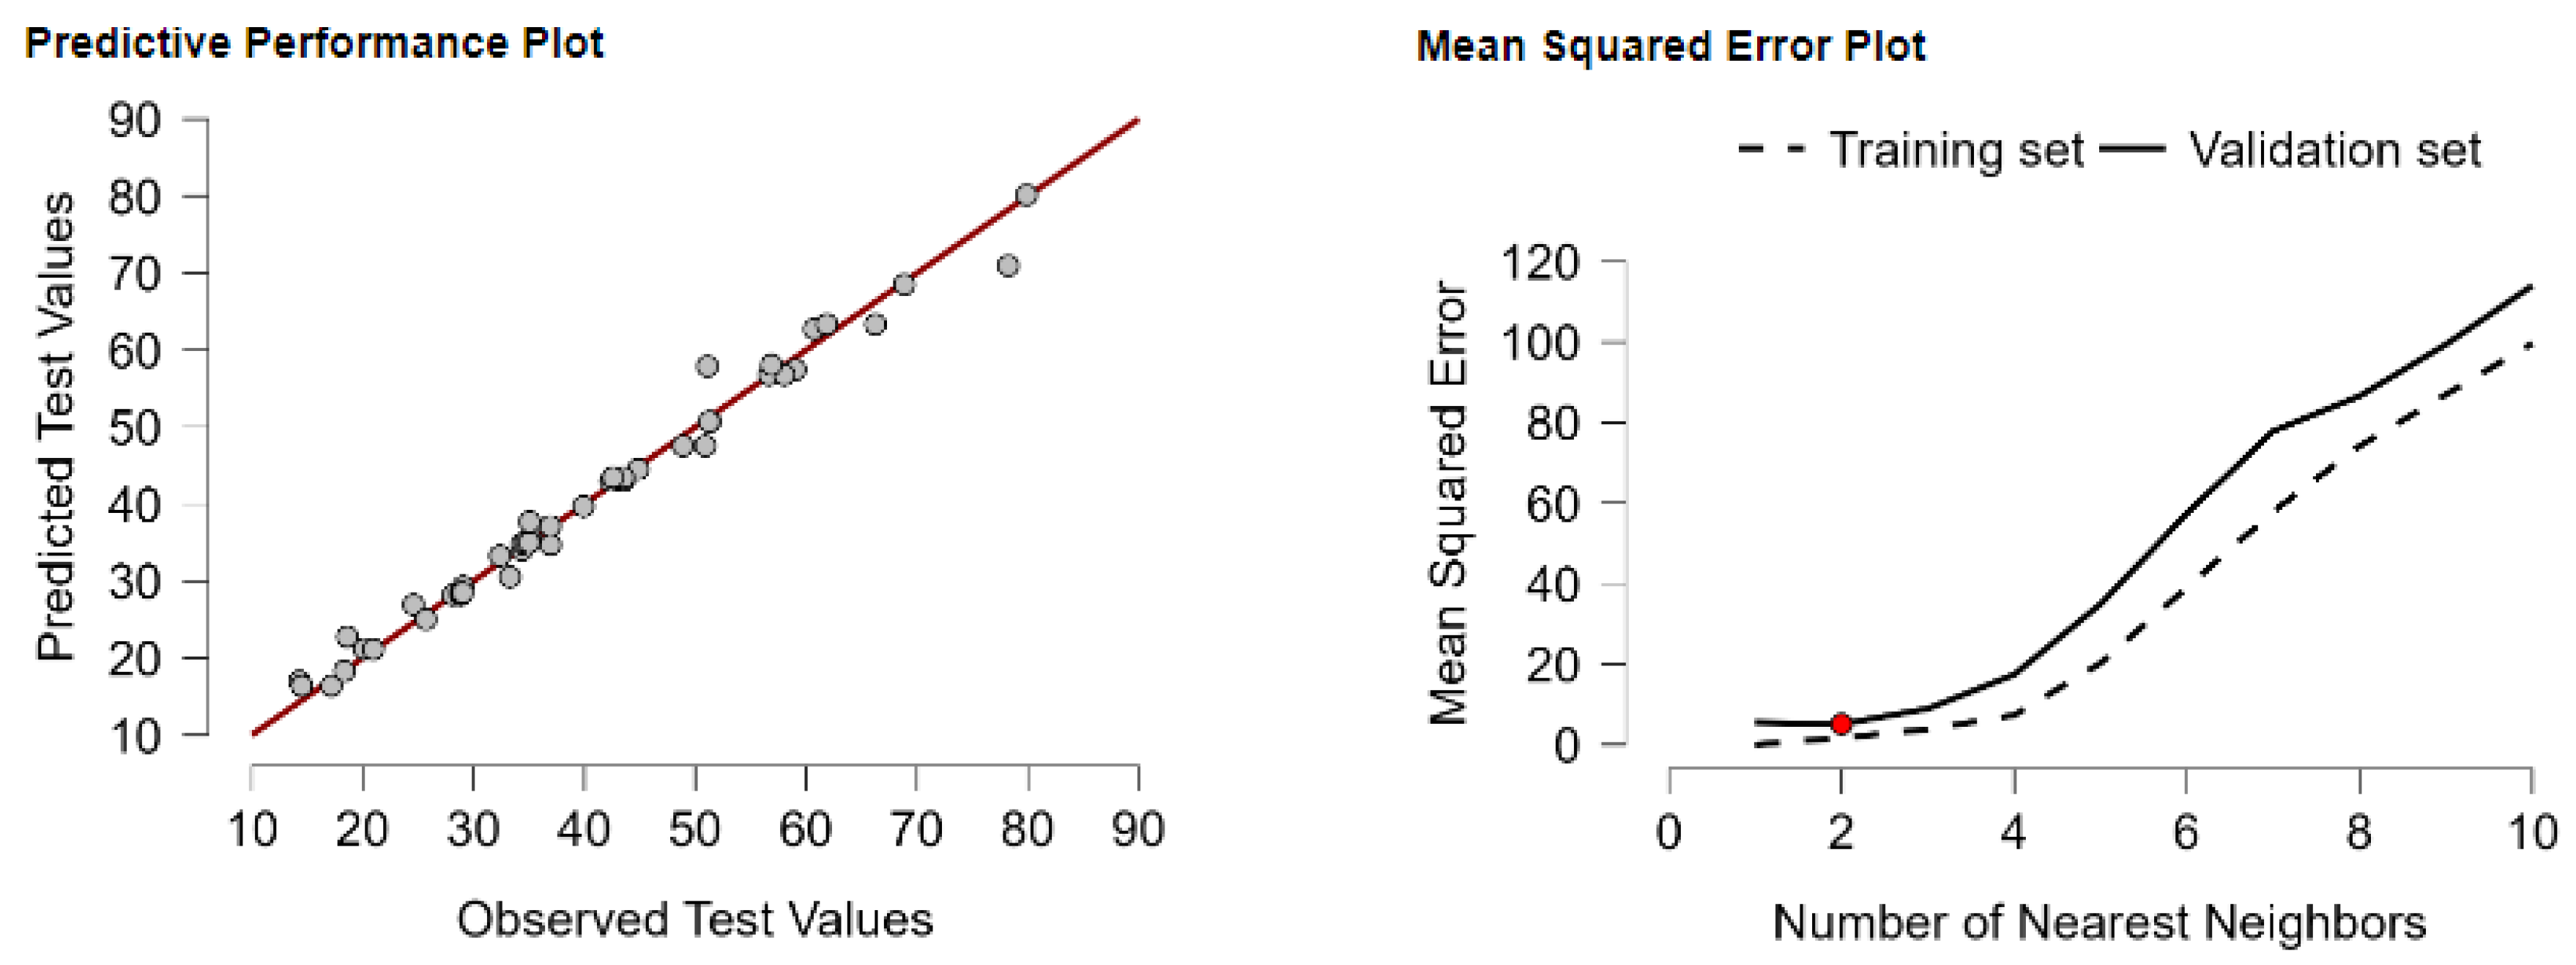
Figure 4.
Centrality and Influence Metrics of Environmental and Infrastructural Variables in the Respiratory Mortality Network. Note. The left panel shows tabulated values for four metrics—betweenness, closeness, strength, and expected influence—across AGRL, CDD, COAL, ELEC, RENE, SANS, TRD, and WTRW. The right panel visualizes the same metrics with line plots, highlighting comparative structural roles and systemic influence of each variable in the network.
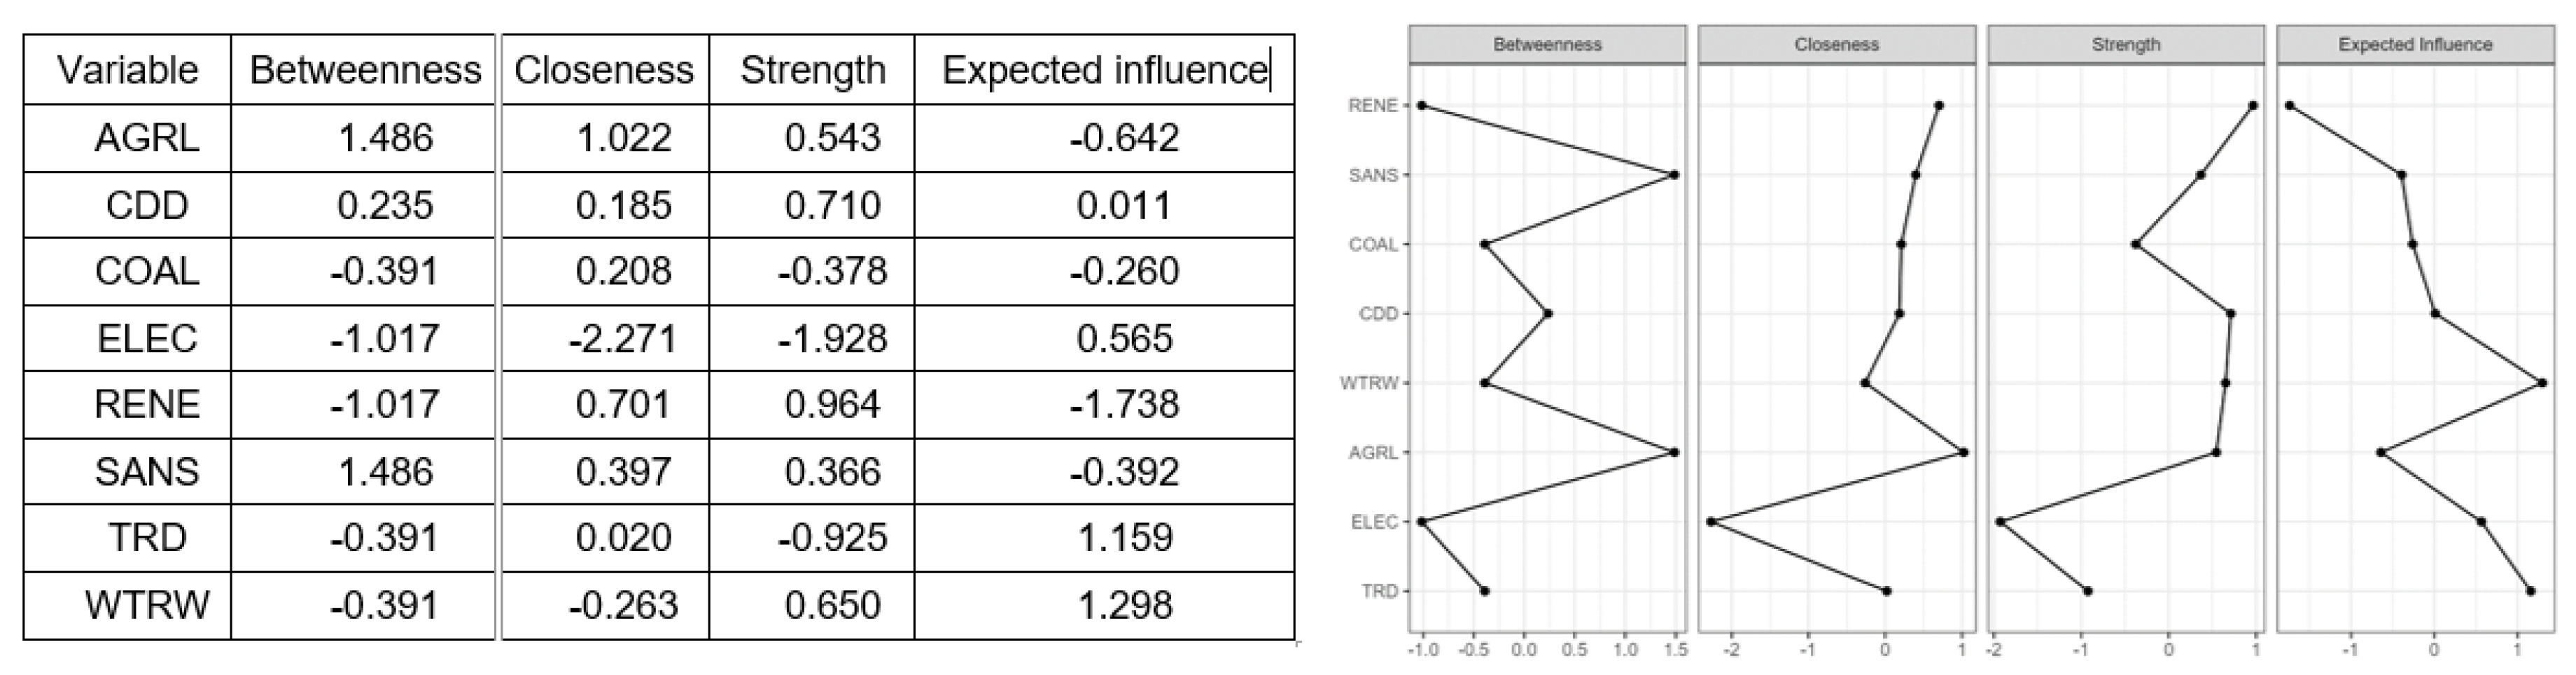
Figure 5.
Comparative Centrality Scores of Environmental and Infrastructural Variables Across Four Algorithms. Note: The left panel presents tabulated standardized centrality values (Barrat, Onnela, WS, and Zhang) for TRD, ELEC, AGRL, WTRW, CDD, COAL, SANS, and RENE. The right panel visualizes these results through line plots for each algorithm, highlighting how methodological assumptions shape the perceived structural importance of variables in the network.
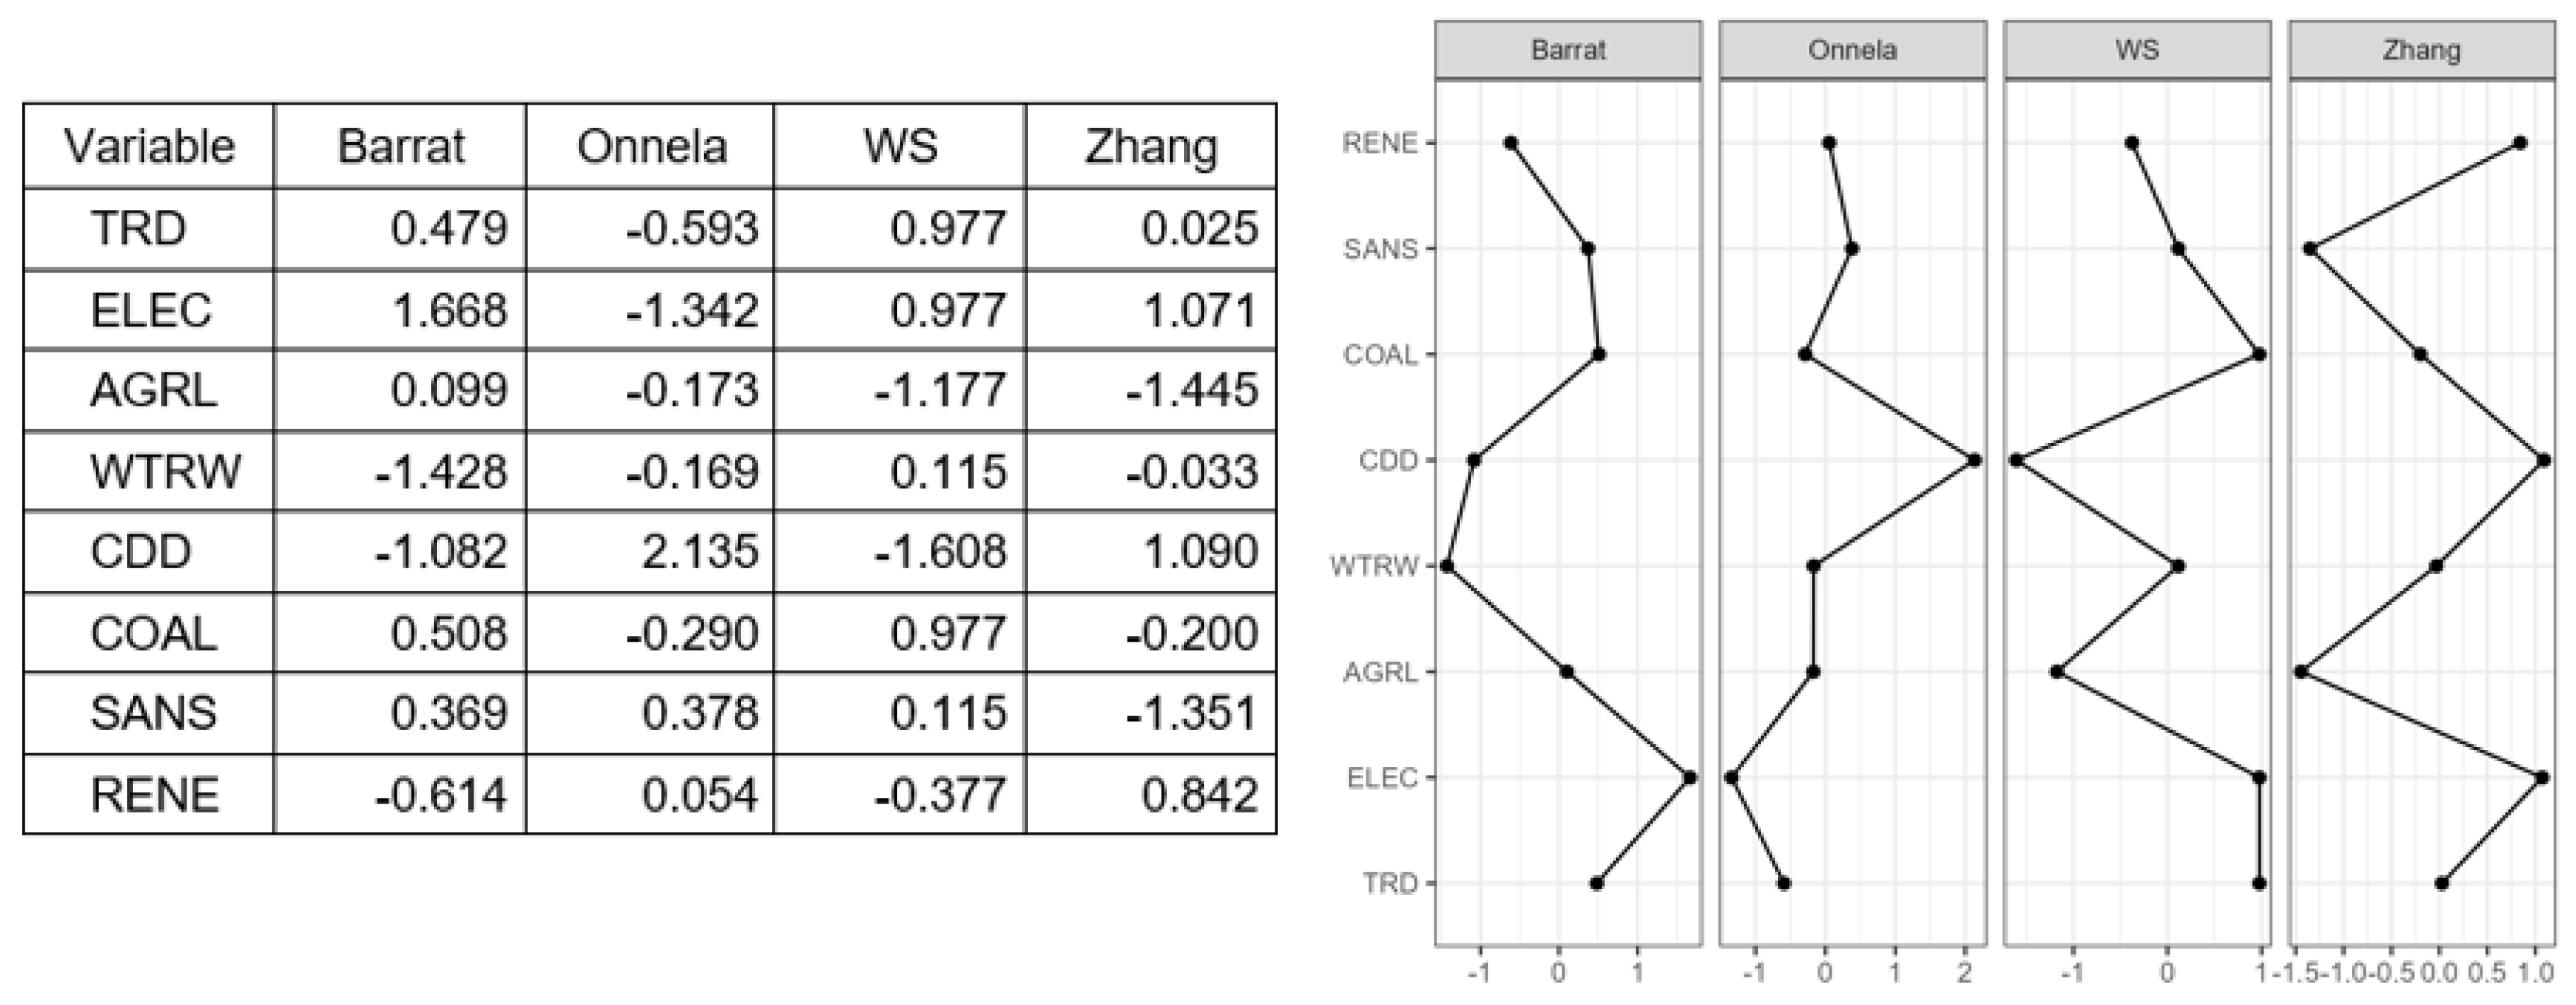
Figure 6.
Network Visualization of Environmental and Infrastructural Variables Associated with Respiratory Disease Mortality (TRD). Note: Nodes represent variables (TRD, ELEC, AGRL, WTRW, CDD, COAL, SANS, RENE), while edges indicate the direction and strength of associations. Red lines represent positive relationships, blue lines represent negative relationships, and line thickness reflects the magnitude of the connection. The strong negative link between CDD and WTRW stands out, while SANS appears central with multiple connections to other variables, underscoring its bridging role in the environmental–health system.
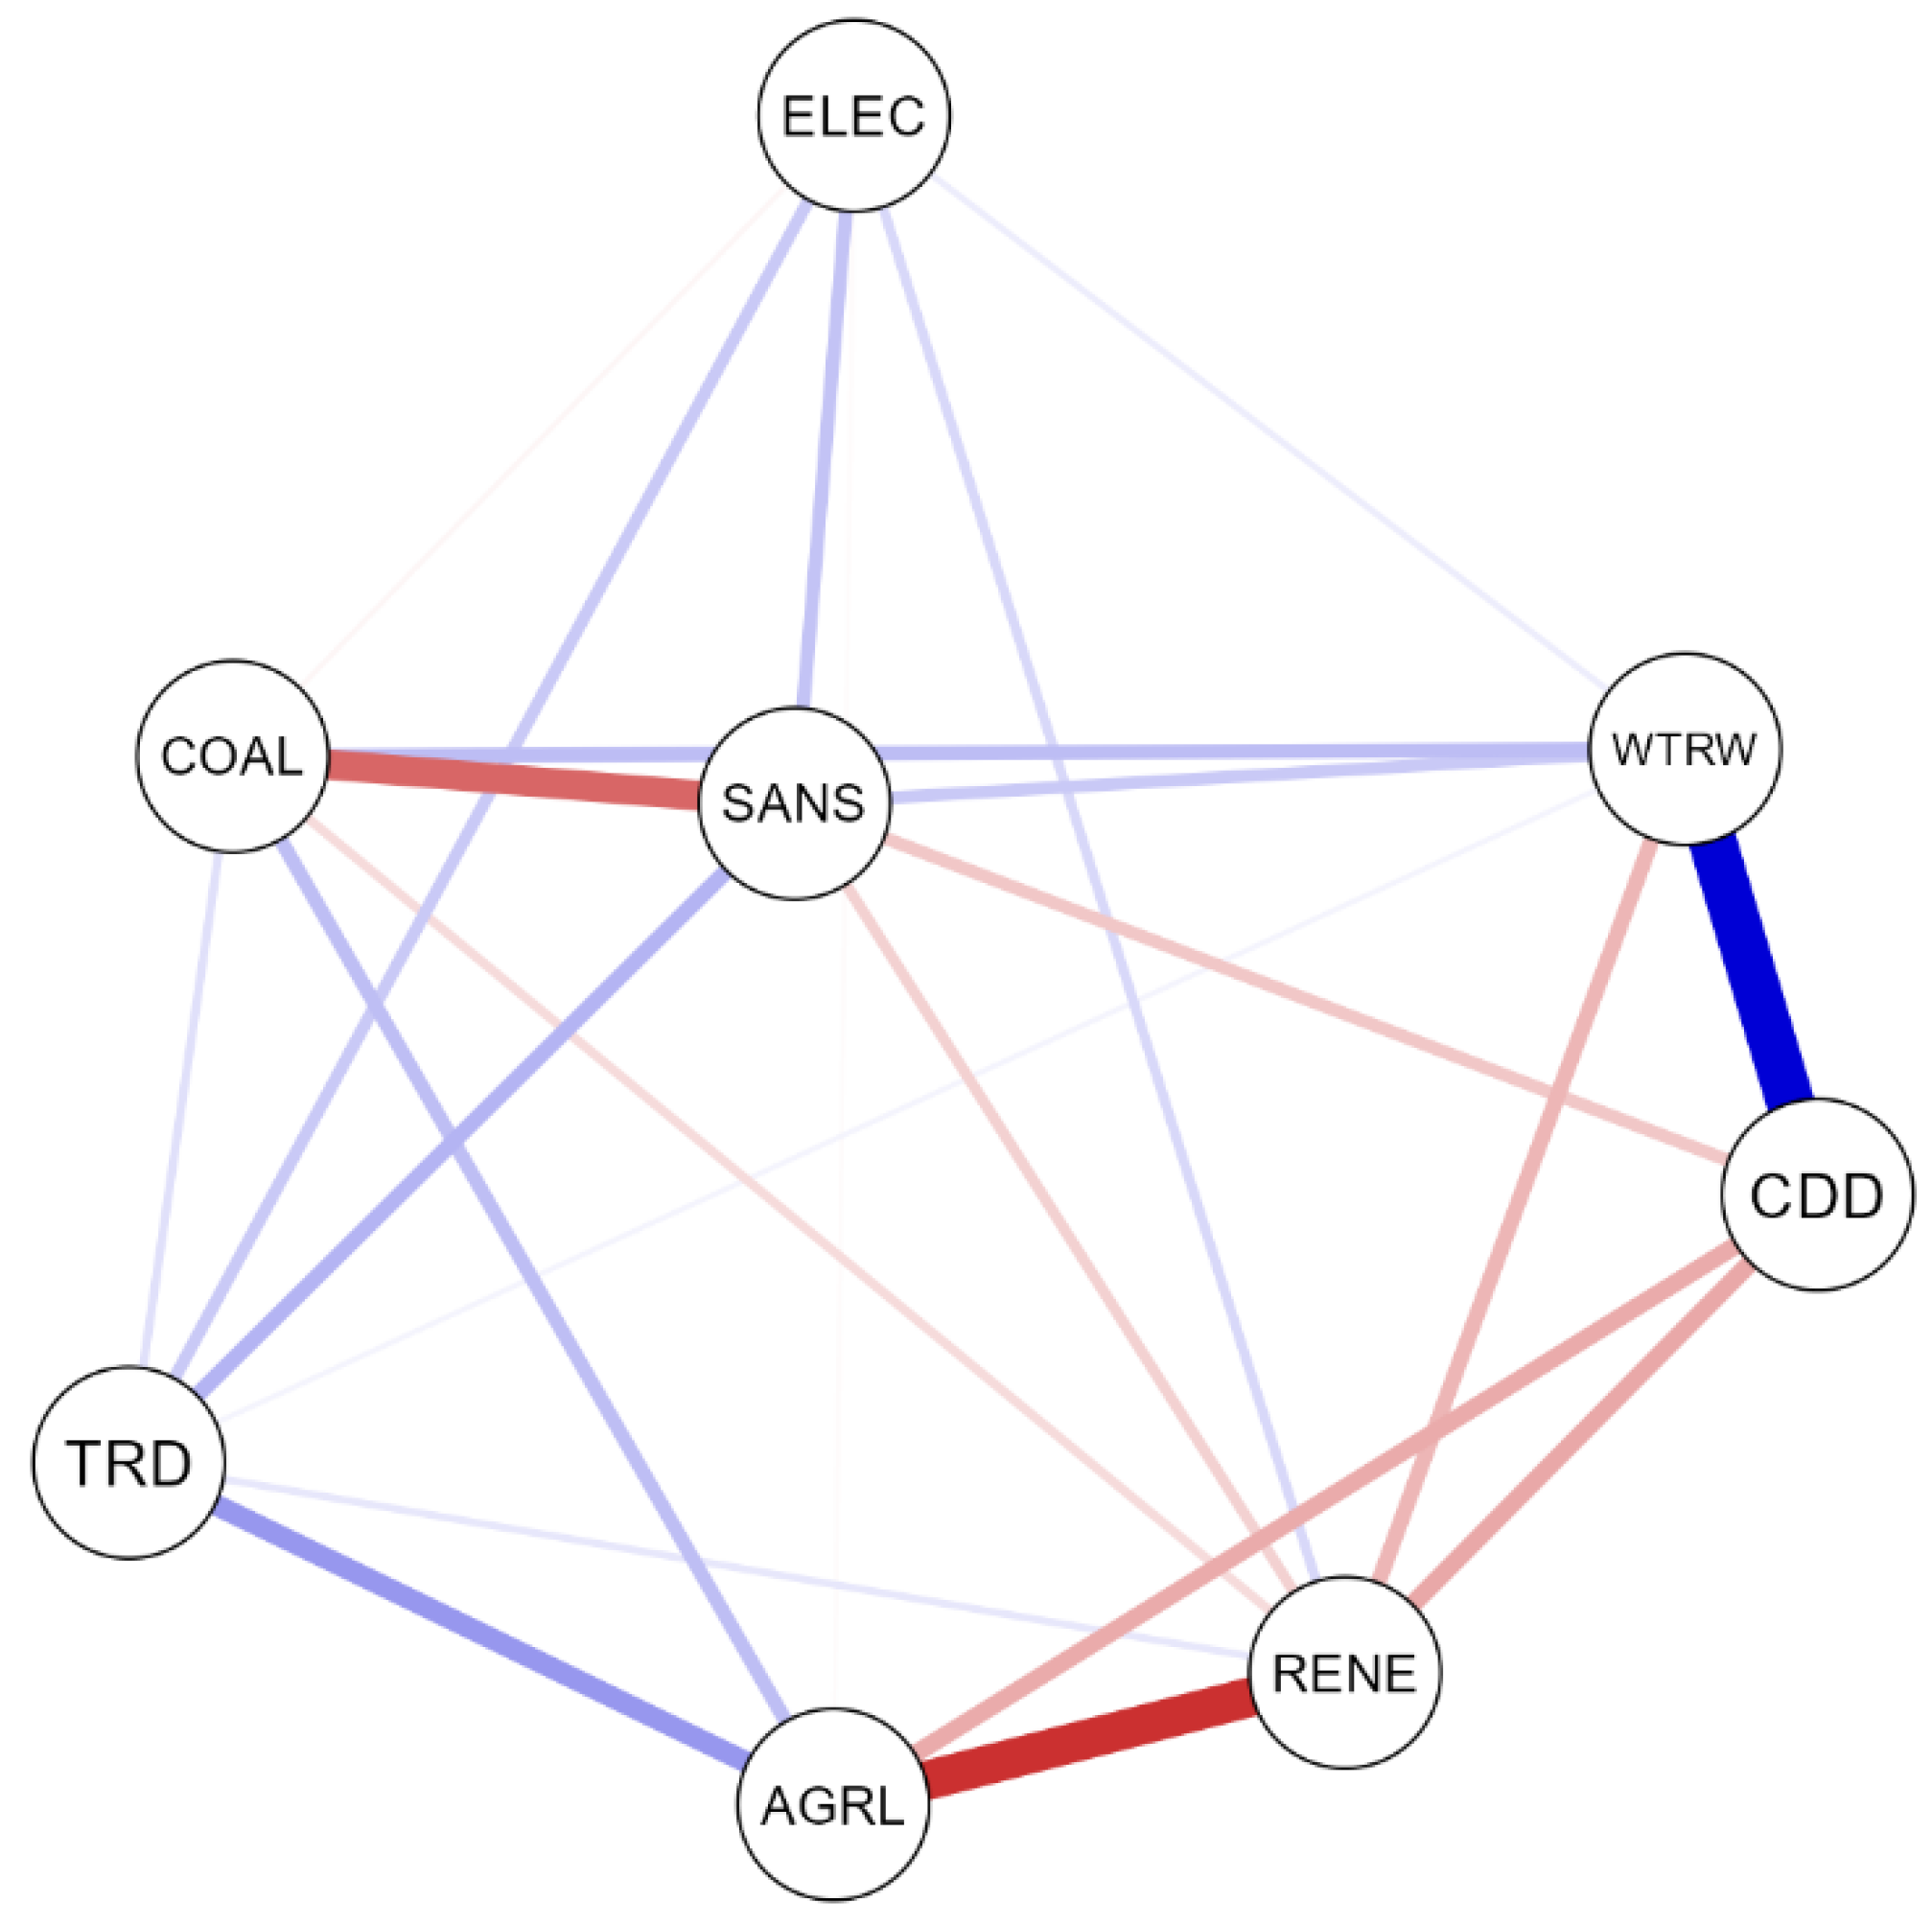
Table 1.
Environmental–Health Interdependencies: Evidence, Risks, and Corrective Strategies.
| Macro-Area | Key References | Main Findings | Methodologies Used |
| Mechanistic and Environmental Pathways | Albano et al. (2022); Bălă et al. (2021); Lee et al. (2021); Maung et al. (2022); Solomon et al. (2023); Wilkinson & Woodcock (2022) | - Airborne pollutants (PM, NO₂, SO₂, VOCs) trigger oxidative stress and inflammation.- Indoor pollution worsens respiratory risks in vulnerable populations.- Clinical treatments (pirfenidone) linked to environmental exposure.- Asthma inhalers have carbon footprints. | - Experimental & clinical reviews- Epidemiological cohort studies- Environmental toxicology |
| Climate, Urban Form, and Infrastructure | Agache et al. (2022); Bell et al. (2024); Grigorieva & Lukyanets (2021); Momtazmanesh et al. (2023); Ali et al. (2022); Bikis (2023); Bauwelinck et al. (2021); Tang et al. (2023); Wu et al. (2021, 2024) | - Heatwaves intensify respiratory morbidity (Cooling Degree Days as indicator).- Urban green spaces can buffer or exacerbate pollution effects.- Infrastructure type (electricity, sanitation) mediates exposure.- Climate change acts as a systemic stress multiplier. | - Systematic reviews- Environmental exposure modelling- Urban spatial analysis |
| Equity, Vulnerability, and Governance | Berberian et al. (2022); Chang et al. (2024); Pona et al. (2021); Bloom et al. (2021); Silveyra et al. (2021) | - Social inequalities (race, indigeneity, gender) shape differential respiratory outcomes.- Pandemic revealed compounding vulnerabilities in at-risk groups.- Infrastructure gaps reduce benefit of sanitation/healthcare.- Gender influences pulmonary responses. | - Sociodemographic & policy analysis- Qualitative reviews- Health disparities research |
Table 2.
Key Environmental and Infrastructural Predictors of Respiratory Disease Mortality (TRD).
| Acronym | Variable | Definition |
| TRD | Mortality Rate by Respiratory Disease | Respiratory disease mortality rate (TRD) measures the number of deaths directly resulting from diseases affecting the respiratory system, such as chronic obstructive pulmonary disease, pneumonia, asthma, or lung cancer. In units of 100,000 residents, the indicator offers an estimate of environmental as well as health-related risk factors such as air pollution, smoking exposure, occupational hazard, and access to health services. This is among the major indicators for estimating the burden for respiratory diseases, public health interventions, as well as accomplishment in avoiding avoidable deaths. Surveillance of TRD reflects the impact on environmental quality, the health system, as well as socio-economic determinants, facilitating evidence-informed policy decision-making. |
| ELEC | Access to electricity | Access to electricity (ELEC) represents the percentage of a country’s population with reliable and secure connections to an electricity supply. It is a core development indicator reflecting progress in infrastructure, energy systems, and social inclusion. High ELEC values indicate greater household well-being, access to education and healthcare, and opportunities for economic growth, while low access signals energy poverty and inequality. This variable is crucial in sustainable development frameworks, as electricity enables modern living standards and industrial productivity. It also reflects energy system resilience, affordability, and policy effectiveness in expanding networks. ELEC is monitored globally to assess progress toward universal energy access, a key goal in international climate and sustainable development commitments. |
| AGRL | Agricultural land | Agricultural land (AGRL) is the share of the country’s total land area for agricultural activities, including arable land, permanent crops, and permanent pastures. AGRL is an indicator for resource use for food supply, rural livelihoods, and land management strategies. AGRL shares rely on geographic, climatic, and economic factors, as well as land use policies. Large shares for agricultural land might indicate dependence on agrarian economies, whereas lower shares could represent urbanization, industrialization, or loss of land through degradation. This is key to food security, sustainable agriculture, and conservation for the protection of biodiversity, as ecosystem changes impact climate. AGRL is monitored closely to balance the objective for high productivity, high sustainability, and environmental protection at the national as well as the international level. |
| WTRW | Freshwater withdrawals | Freshwater withdrawals (WTRW) involve the total volume of water abstracted for human purposes from the freshwater sources such as rivers, lakes, aquifers, and reservoirs. This is shown as a percentage of attainable renewable water resources and demonstrates water sustainability pressures. High values indicate scarcity risk, environmental stress, as well as use competition. Sustainable development is represented by an efficient management. Quantification of the withdrawals on water enlightens the water governance, use efficacy, as well as climate resilience. This is a crucial parameter in monitoring overexploitation risk, safe access for drinking water supply, as well as world water security realization. This is a crucial indicator needed in environmental as well as in economic analysis for the world’s sustainability. |
| CDD | Cooling Degree Days | Cooling Degree Days (CDD) is an estimate of how much energy demand is needed to cool buildings based on the temperature departures above the baseline threshold, which is generally 18°C (65°F). CDD is calculated by adding the daily outdoor temperature differences with the baseline during the warm spells. Large values for CDD represent hotter climates or heatwaves, exerting high demand on air conditioning use as well as on electricity demand. This factor is crucial for estimating energy use, power infrastructure planning, and climate adaptation measures. CDD also indicates public health risks, as heat stress heightens the risk for heat-related diseases. Monitoring CDD helps with sustainable energy policy, integration of renewables, and adaptation planning for the world’s future climate change scenarios. |
| COAL | Coal electricity | Coal electricity (COAL) is the proportion of total power produced by burning coal. COAL is an energy policy influencer, emissions tracker, and sustainability indicator. Coal is one of the most carbon-intensive fuels with high air impurities, releases of greenhouses, and the risk to health. High percentages for COAL are an indication of fossil dependence with transition problems to low-carbon environments, while percentages in retreat are an indication of decarbonization achievements. This indicator also shows energy security, economic coal dependence, as well as the effectivity of integration policies for renewable sources. Through the tracking of COAL, compatibility with climate policies, environmental impact, as well as country-level emissions reductions for the Paris Agreement, are traceable. |
| SANS | Safe sanitation | Safe sanitation (SANS) refers to the proportion for the population with access for the safely managed sanitation services, including toilet or latrine facilities that are hygienic with the capability to stop human contact with excreta with appropriate treatment for the wastes. SANS is an indicator for quality for water, sanitation, and hygiene (WASH) facilities, which are crucial for public health, dignity, and well-being. High values for SANS mean successful management for the wastes, reduced risk for the waterborne diseases, better standards for the living conditions, but lower values imply risks for the health with social inequity. This is among the key indicators for Sustainable Development Goal 6 for the targets for the universal coverage for the clean water, sanitation, and hygiene. Monitoring for the SANS helps in the development for the policies for the health equity with the environmental safety and resilience for the communities. |
| RENE | Renewable energy | Renewable energy (RENE) is the proportion or ratio of primary power or energy generated by renewables such as solar, wind, hydropower, geothermal, and clean bioenergy. RENE is a key sustainability indicator that is an outcome resulting from activities involving the decoupling of energy systems from carbonization, resilience building, and reduced environmental footprints. Increased RENE shares indicate the transition on to cleaner technologies, reduced fossil fuel intensity, and alignment with climate targets. Renewable energy increases energy security, economic diversification, and clean technology. RENE tracking helps ESG performance monitoring and achievement of the world’s climate accords. In the process, it also highlights opportunities through challenges in scale-up of technologies, investment in infrastructure, as well as access to energy on an equitable basis. |
Source: Institute for Health Metrics and Evaluation, Link: https://www.healthdata.org/ , World Bank, Sovereign ESG Data Portal, https://esgdata.worldbank.org/ , Accessed: 12 January 2025.
Table 3.
Comparison of Random-Effects GLS and Fixed-Effects Panel Estimates for TRD.
| Random-effects (GLS), using 238 observations Included 38 cross-sectional units Time-series length: minimum 6, maximum 11 Dependent variable: TRD |
Fixed-effects, using 238 observations Included 38 cross-sectional units Time-series length: minimum 6, maximum 11 Dependent variable: TRD |
||||||
| Coefficient | Std. Error | z | Coefficient | Std. Error | t-ratio | ||
| Constant | 71.8429*** | 26.5207 | 2.709 | 68.5274** | 27.4772 | 2.494 | |
| ELEC | −0.812949*** | 0.251489 | −3.233 | −0.817795*** | 0.254146 | −3.218 | |
| AGRL | 0.515128*** | 0.101779 | 5.061 | 0.598683*** | 0.133445 | 4.486 | |
| WTRW | −0.108395*** | 0.0395357 | −2.742 | −0.136371*** | 0.0453283 | −3.009 | |
| CDD | 0.00448602*** | 0.00121438 | 3.694 | 0.00425614*** | 0.00124855 | 3.409 | |
| COAL | 0.114889*** | 0.0416424 | 2.759 | 0.120864*** | 0.0447108 | 2.703 | |
| SANS | 0.260469*** | 0.0528428 | 4.929 | 0.268765*** | 0.0596388 | 4.507 | |
| RENE | 0.249678*** | 0.0736594 | 3.390 | 0.234613*** | 0.0795161 | 2.951 | |
| Statistics | Mean dependent var | 38.90282 | Mean dependent var | 38.90282 | |||
| Sum squared resid | 60652.10 | Sum squared resid | 766.6315 | ||||
| Log-likelihood | −997.0434 | Log-likelihood | −476.9059 | ||||
| Schwarz criterion | 2037.865 | Schwarz criterion | 1200.064 | ||||
| rho | 0.500441 | rho | 0.500441 | ||||
| S.D. dependent var | 16.76668 | S.D. dependent var | 16.76668 | ||||
| S.E. of regression | 16.20380 | S.E. of regression | 1.993034 | ||||
| Akaike criterion | 2010.087 | Akaike criterion | 1043.812 | ||||
| Hannan-Quinn | 2021.282 | Hannan-Quinn | 1106.784 | ||||
| Durbin-Watson | 0.743128 | Durbin-Watson | 0.743128 | ||||
| Tests | ‘Between’ variance = 261.997 ‘Within’ variance = 3.97218 mean theta = 0.950485 Joint test on named regressors - Asymptotic test statistic: Chi-square(7) = 109.074 with p-value = 1.42877e-20 |
Joint test on named regressors - Test statistic: F(7, 193) = 15.3211 with p-value = P(F(7, 193) > 15.3211) = 6.93623e-16 |
|||||
| Breusch-Pagan test – Null hypothesis: Variance of the unit-specific error = 0 Asymptotic test statistic: Chi-square(1) = 580.148 with p-value = 3.48302e-128 |
Test for differing group intercepts - Null hypothesis: The groups have a common intercept Test statistic: F(37, 193) = 341.847 with p-value = P(F(37, 193) > 341.847) = 1.59215e-156 |
||||||
| Hausman test - Null hypothesis: GLS estimates are consistent Asymptotic test statistic: Chi-square(7) = 7.92934 with p-value = 0.338866 |
|||||||
Table 4.
Fixed-Effects Regression with Driscoll–Kraay Standard Errors for TRD (2010–2021).
| Item | Value | Item | Value | |||
| Regression type | Fixed-effects regression | Standard errors | Driscoll-Kraay | |||
| Number of observations | 238 | Number of groups | 38 | |||
| Group variable (i) | n | Maximum lag | 2 | |||
| F(17. 10) | 62298.16 | Prob > F | 0 | |||
| Within R-squared | 0.3909 | |||||
| Variable | Coefficient | Std. Err. | t | P>|t| | 95% Conf. Interval (Lower) | 95% Conf. Interval (Upper) |
| elec | -1.275732 | 0.5914737 | -2.16 | 0.056 | -2.59362 | 0.042153 |
| agrl | 0.6356186 | 0.1693837 | 3.75 | 0.004 | 0.258208 | 1.013029 |
| wtrw | -0.1101754 | 0.0570997 | -1.93 | 0.082 | -0.2374 | 0.017051 |
| cdd | 0.0036617 | 0.0023021 | 1.59 | 0.143 | -0.00147 | 0.008791 |
| coal | 0.112175 | 0.0454085 | 2.47 | 0.033 | 0.010999 | 0.213352 |
| sans | 0.1754656 | 0.0342018 | 5.13 | 0 | 0.099259 | 0.251672 |
| rene | 0.1252182 | 0.1045846 | 1.2 | 0.259 | -0.10781 | 0.358247 |
| 2010 | 0 | |||||
| 2011 | 0.4547721 | 0.0899156 | 5.06 | 0 | 0.254428 | 0.655117 |
| 2012 | 0.4229765 | 0.3033247 | 1.39 | 0.193 | -0.25287 | 1.098826 |
| 2013 | 0.9434794 | 0.1875431 | 5.03 | 0.001 | 0.525607 | 1.361351 |
| 2014 | 0.7501732 | 0.3067781 | 2.45 | 0.035 | 0.066629 | 1.433717 |
| 2015 | 1.470395 | 0.5637292 | 2.61 | 0.026 | 0.214328 | 2.726462 |
| 2016 | 1.975931 | 0.3715582 | 5.32 | 0 | 1.148048 | 2.803815 |
| 2017 | 2.724181 | 0.4535995 | 6.01 | 0 | 1.713499 | 3.734864 |
| 2018 | 3.496986 | 0.5331224 | 6.56 | 0 | 2.309115 | 4.684857 |
| 2019 | 4.111679 | 0.6920344 | 5.94 | 0 | 2.569731 | 5.653628 |
| 2020 | 3.84362 | 0.7440419 | 5.17 | 0 | 2.185791 | 5.501448 |
| 2021 | 0 | |||||
| _cons | 121.0853 | 62.92762 | 1.92 | 0.083 | -19.1261 | 261.2968 |
Table 5.
Cluster Validity Indices for Competing Algorithms in Environmental–Health Data.
| Model | Maximum diameter | Minimum separation | Pearson’s γ | Dunn index | Entropy | Calinski-Harabasz index |
| Density Based Clustering | 0.79 | 1.00 | 0.62 | 1.00 | 0.00 | 0.00 |
| Fuzzy C-Means Clustering | 1.00 | 0.00 | 0.00 | 0.00 | 0.86 | 0.18 |
| Hierarchical Clustering | 0.13 | 0.26 | 1.00 | 0.44 | 0.88 | 0.95 |
| Model Based Clustering | 0.61 | 0.05 | 0.45 | 0.06 | 0.94 | 0.52 |
| Neighborhood Based Clustering | 0.00 | 0.14 | 0.86 | 0.29 | 0.95 | 1.00 |
| Random Forest | 0.39 | 0.37 | 0.29 | 0.51 | 1.00 | 0.64 |
Table 6.
Cluster Cohesion and Separation Metrics for DBSCAN-Derived Environmental–Health Profiles.
| Cluster | Noisepoints | 1 | 2 | 3 | 4 |
| Size | 1 | 219 | 6 | 6 | 6 |
| Explained proportion within-cluster heterogeneity | 0.000 | 0.998 | 2.849×10⁻⁴ | 0.001 | 5.126×10⁻⁴ |
| Within sum of squares | 0.000 | 1.474 | 0.421 | 2.076 | 0.758 |
| Silhouette score | 0.000 | 0.165 | 0.853 | 0.776 | 0.798 |
Table 7.
Cluster Means of Environmental and Infrastructural Variables Associated with Respiratory Mortality.
Table 7.
Cluster Means of Environmental and Infrastructural Variables Associated with Respiratory Mortality.
| TRD | ELEC | AGRL | WTRW | CDD | COAL | SANS | RENE | |
| Cluster 0 | -1.647 | -0.656 | -0.342 | -3.748 | -1.199 | -0.856 | -0.687 | -0.638 |
| Cluster 1 | 0.096 | -0.233 | 0.018 | -0.009 | 0.088 | -0.030 | 0.039 | -0.176 |
| Cluster 2 | -1.686 | 3.129 | -0.964 | 0.320 | -0.781 | -0.032 | 0.236 | 0.197 |
| Cluster 3 | -0.996 | 3.459 | 1.316 | 0.320 | -1.047 | 0.589 | -1.074 | 4.436 |
| Cluster 4 | -0.529 | 2.014 | -0.964 | 0.320 | -1.194 | 0.686 | -0.482 | 1.886 |
Table 8.
Comparative Performance of Machine Learning Models for Predicting Respiratory Mortality.
| Model | MSE | MSE(scaled) | RMSE | MAE / MAD | MAPE | R^2 | Mean normalized score |
| KNN | 1.0 | 1.0 | 1.0 | 1.0 | 1.0 | 1.0 | 1.0 |
| Random Forest | 0.9013 | 0.8888 | 0.7557 | 0.7736 | 0.7215 | 0.8283 | 0.8115 |
| Decision Tree | 0.7329 | 0.8008 | 0.5367 | 0.5762 | 0.5006 | 0.7041 | 0.6419 |
| Boosting Regression | 0.5086 | 0.5969 | 0.3333 | 0.3622 | 0.2849 | 0.4514 | 0.4229 |
| Regularized Linear | 0.3068 | 0.292 | 0.1869 | 0.1821 | 0.0712 | 0.1674 | 0.2011 |
| SVM | 0.3042 | 0.0 | 0.1851 | 0.2044 | 0.0 | 0.0 | 0.1156 |
| Linear Regression | 0.048 | 0.2517 | 0.0271 | 0.0329 | 0.1614 | 0.1371 | 0.1097 |
| ANN | 0.0 | 0.208 | 0.0 | 0.0 | 0.0341 | 0.108 | 0.0583 |
Table 9.
Feature Importance in KNN Predictions of Respiratory Mortality.
| Mean dropout loss | |
| AGRL | 13.412 |
| RENE | 13.111 |
| WTRW | 11.635 |
| CDD | 11.552 |
| SANS | 9.176 |
| COAL | 7.968 |
| ELEC | 5.848 |
Table 10.
Case-Level Additive Explanations of KNN Predictions for Respiratory Mortality.
| Case | Predicted | Base | ELEC | AGRL | WTRW | CDD | COAL | SANS | RENE |
| 1 | 25.695 | 38.921 | -1.182 | -3.982 | -3.652 | 5.869 | -3.190 | -6.739 | -0.351 |
| 2 | 35.450 | 38.921 | 0.890 | -5.386 | -4.062 | -3.529 | -3.645 | 7.285 | 4.977 |
| 3 | 37.135 | 38.921 | 0.907 | -5.848 | -3.999 | -3.571 | -3.333 | 9.559 | 4.499 |
| 4 | 16.995 | 38.921 | -8.800 | -0.940 | -0.934 | -1.121 | -6.175 | 0.528 | -4.485 |
| 5 | 16.380 | 38.921 | 0.039 | -0.522 | -4.229 | -4.087 | -1.192 | -7.829 | -4.721 |
Table 11.
Case-Level Additive Explanations of KNN Predictions for Respiratory Mortality.
| Number of nodes | Number of non-zero edges | Sparsity |
| 8 | 23 / 28 | 0.179 |
Table 12.
Network Weights Matrix of Environmental and Infrastructural Predictors of Respiratory Mortality.
Table 12.
Network Weights Matrix of Environmental and Infrastructural Predictors of Respiratory Mortality.
| Variable | TRD | ELEC | AGRL | WTRW | CDD | COAL | SANS | RENE |
| TRD | 0.000 | -0.188 | 0.145 | -0.009 | -0.462 | 0.000 | 0.232 | 0.000 |
| ELEC | -0.188 | 0.000 | 0.000 | 0.000 | -0.195 | -0.126 | 0.000 | 0.570 |
| AGRL | 0.145 | 0.000 | 0.000 | -0.020 | -0.080 | -0.343 | 0.069 | 0.147 |
| WTRW | -0.009 | 0.000 | -0.020 | 0.000 | 0.087 | 0.133 | 0.121 | 0.041 |
| CDD | -0.462 | -0.195 | -0.080 | 0.087 | 0.000 | -0.103 | 0.054 | -0.162 |
| COAL | 0.000 | -0.126 | -0.343 | 0.133 | -0.103 | 0.000 | 0.167 | 0.120 |
| SANS | 0.232 | 0.000 | 0.069 | 0.121 | 0.054 | 0.167 | 0.000 | 0.024 |
| RENE | 0.000 | 0.570 | 0.147 | 0.041 | -0.162 | 0.120 | 0.024 | 0.000 |
| 1 | Countries are: Albania, Austria, Belarus, Belgium, Bosnia and Herzegovina, Bulgaria, Croatia, Cyprus, Czechia, Denmark, Estonia, Finland, France, Germany, Greece, Hungary, Iceland, Ireland, Israel, Italy, Latvia, Lithuania, Luxembourg, Malta, Moldova, Montenegro, Netherlands, North Macedonia, Norway, Poland, Portugal, Romania, Russian Federation, Serbia, Slovak Republic, Slovenia, Spain, Sweden, Switzerland, Ukraine, United Kingdom. |
Disclaimer/Publisher’s Note: The statements, opinions and data contained in all publications are solely those of the individual author(s) and contributor(s) and not of MDPI and/or the editor(s). MDPI and/or the editor(s) disclaim responsibility for any injury to people or property resulting from any ideas, methods, instructions or products referred to in the content. |
© 2025 by the authors. Licensee MDPI, Basel, Switzerland. This article is an open access article distributed under the terms and conditions of the Creative Commons Attribution (CC BY) license (http://creativecommons.org/licenses/by/4.0/).
Copyright: This open access article is published under a Creative Commons CC BY 4.0 license, which permit the free download, distribution, and reuse, provided that the author and preprint are cited in any reuse.


