Submitted:
07 September 2025
Posted:
09 September 2025
You are already at the latest version
Abstract
College graduates earn substantially more and are more likely to be employed. Consequently, it is critically important to understand the predictors of college dropout so that students and administrators can make a difference in college graduation outcomes. Previous studies remain limited in the scope of evaluating machine learning models for dropout prediction. Leveraging a dataset of 4,424 students that includes graduation outcome, demographic, socioeconomic and course data, and macroeconomic data, the objective of this paper is to identify the optimum machine learning model for predicting college dropout as a classification problem. We (a) perform extensive exploratory data analysis, (b) perform feature optimization (c) identify the best performing machine learning model across seven models evaluated, (d) study different testing-to-training ratios, (e) perform a comprehensive model evaluation, and (f) compare a multi-class classification approach to a binary classification one. The models were fine-tuned leveraging a grid search optimization algorithm and validated with k-fold cross-validation. Optimizing the hyperparameters, the grid search optimized random forest model performed the best in predicting college dropout with 0.85 accuracy, 0.72 sensitivity, 0.92 specificity, 0.82 precision, and 0.89 AUC-ROC. Furthermore, the optimized random forest model suggested the key predictors of dropout, in order of importance to be: number of curricular units in the second semester, number of curricular units in the first semester and whether the tuition and fees are up-to-date. The findings underscore the value of using machine learning for timely dropout risk prediction, enabling targeted resource allocation to mitigate risk and support successful graduation outcomes.
Keywords:
Machine Learning
; Dropout
; Graduation
; Random Forest
; XG Boost
; Optimization
; feature importance
; grid search optimization
; binary classification
; multi-class classification
; education
; performance
1. Introduction
A college degree is key in today’s economy for ensuring a successful career and life [1]. College graduates earn more than college dropouts and have considerably lower unemployment rates [2]. Though college enrollment has been increasing across the world in recent years, college completion rates have been lagging behind – many college students do not persist in college beyond the first one or two semesters, and never graduate, despite often earning a significant number of credits [3,4]. Hence, it is critical to understand the factors that contribute to dropping out of college, as only by knowing these factors, can we start to address the significant college dropout problem of today.
An existing literature has identified various factors contributing to these low college graduation rates, pointing out that low completion is pervasive among institutions with less resources [5]. With the availability of newer datasets which provide fuller and more comprehensive records on each student, this literature has now evolved significantly – recent academic work has also leveraged newly-developed tools in machine learning to improve our understanding of the completion rate crisis. Using the XGBoost machine learning classifier model and data from the U.S. Department of Education’s National Center for Education Statistics (NCES), a study predicted dropout rates among U.S. non-traditional students [6]. They analyzed data from the 2012–2014 Beginning Postsecondary Students Longitudinal Study of the NCES, which contains data on students’ demographic characteristics, their school and work experiences, and college persistence, transfer, and degree attainment. However, the study is constrained by limited data on students’ undergraduate college readiness and background information, including student transcripts, and measures of high school performance. The authors found the XGBoost model and logistic regression model (with features identified by the XGBoost model) were able to deliver superior performance in predicting college dropout.
Another study employed data from a different setting – distance (online) education in South Korea [7]. They looked at different potential predictor variables for their dropout risk modelling, including student demographics and residence, academic records, admissions, tuition and scholarships, and evaluations of classroom lectures. They argued that the Light Gradient Boosting Machine (LGBM) algorithm excelled in prediction accuracy, with the ROC-AUC metric affirming its superiority. However, and in line with the findings in the above study, logistic regression also demonstrated its competitive performance – the authors concluded that merging advanced algorithms like LGBM with the interpretive strength of logistic regression is integral to efficient student support strategies. Continuing on the work with online education, a more recent study used data on student activity logs from the Moodle platform, a free open-source learning management system of distance education [8]. The authors’ model trained on all weeks’ data and using hyperparameter optimization achieved an average F1-score of 0.8. Using student data from the South Campus of the University of Education, Winneba, Ghana and utilizing machine learning models with comparative cross-validation techniques, another study predicted the dropout rate and found that random forest was the best-performing model with an accuracy of 70.98% for the 10-fold cross-validation implementation [9].
This paper contributes to the literature in four ways. First, it considers a broader set of machine learning models than the literature – specifically, seven models with different levels of complexities – to detect the optimum model for predicting dropout. The motivation behind using many more models was to more accurately detect the best performing model. Our second point of departure is in the choice of evaluation metrics. We consider six evaluation metrics while the existing literature considers many less. Third, we engage in feature optimization by extensively examining what the most important features in predicting dropout are. This step is critical as findings from this part of our research can be used to devise solutions to prevent college dropout. Fourth, our dataset includes some key features that are not present in the existing studies. In addition to the demographic data used in other studies, our dataset also includes (a) course information and grades (b) financial information and (c) comprehensive data on the state of the macroeconomy, all of which may have important roles in predicting dropout. To summarize, a systematic evaluation using multiple sets of feature variables and feature optimization, utilization of a comprehensive test suite of models with careful hyperparameter fine-tuning of each model and a comparative analysis of all these models through the same set of comprehensive benchmarks have not been carried out before. This paper fills this important gap.
The dataset utilized in this study incorporates graduation outcome, demographic background, data on economic conditions like unemployment rate and inflation rate, and granular data on academic achievement such as courses enrolled and passed as well as grades earned in each course. The graduation outcome takes three values in the data — whether the student dropped out (“dropout”), graduated (“graduate”) or is still enrolled (“enrolled”) at the end of the normal duration of the course.
The paper starts with performing exploratory data analysis, namely studying summary statistics and the correlation coefficient of the graduation outcome with each of the features. We ranked the features in order of the strength of correlation to understand which features are more tightly correlated with the graduation outcome. Next, a feature engineering and optimization approach was implemented to assess model performance with different selections of features. Ranking the features in terms of the strength of their correlation with the graduation outcome, we started with models that included the top features in terms of correlation, but we also experimented with multiple sets of features – with some models including features that are more tightly correlated than the top ten features while some others that expand the set of features to those that are slightly less correlated than the top ten features. Subsequently, we solidified the optimum set of features to be utilized in modeling using model performance statistics.
For feature optimization and for identifying the best performing model, first we investigated a broader, binary classification approach where the graduation outcome takes on two values – dropped out or not (“dropout” and “non-dropout”). Subsequently, a more granular three class classification (“dropout,” “graduate,” or “enrolled”) approach was explored in addition to the binary classification approach where the model was tasked with classification of students to enrolled, dropped out and graduated categories. This study leveraged several machine learning classification models both for binary and multi-class classifications, including logistic regression, decision tree, random forest, artificial neural network (ANN), support vector machine (SVM), XGBoost and K-nearest neighbor (KNN). We engaged in grid search optimization with 3-fold, 5-fold, and 10-fold cross-validation and hyperparameter fine-tuning to identify the best performing model. Moreover, our study employed various training-testing splits, with the training set encompassing 60%, 75% and 90% of the data, respectively, while the remaining data was used to test the models and find the most efficient model for college dropout. The statistics used here to measure performance are accuracy, confusion matrix, sensitivity, specificity, precision and AUC-ROC. The results of our analysis clearly point to the grid-search optimized random forest model to be the highest performing model based on accuracy, sensitivity, specificity, precision and AUC-ROC. The model achieved 0.85 accuracy, 0.72 sensitivity, 0.92 specificity, 0.82 precision and 0.89 AUC-ROC. The strongest predictors of the probability of dropout from this grid search random forest model, in order, are: number of curricular units in the second semester, number of curricular units in the first semester and whether the tuition and fees are up-to-date.
Our findings throw light on the factors which rank most highly in paving the road to student success in higher education. The expansive but rigorous analysis should be highly instructive for a broad range of audience – including academic researchers, public policy makers, university administrators and college students themselves.
2. Methods
2.1. Dataset
This paper used a comprehensive dataset of 4,424 students enrolled in an undergraduate degree course in a postsecondary education institution [10]. It includes data on each student’s graduation outcome (“Target”) in addition to key characteristics both before and after entering college. Specifically, for each student, the dataset reports 34 features in addition to the graduation outcome. It includes demographic data, socio-economic factors and academic performance data giving key information about each student prior to enrolling in college as well as information on courses and grades in college. Additionally, the dataset reports macroeconomic indicators such as unemployment rate, inflation rate and GDP from the region, these variables can correlate with the probability of graduating, staying enrolled or dropping out. For example, a study finds that dropout probability decreased as a result of the recession as the lower opportunity cost of education due to a weak job-market encouraged students to continue studying in colleges [11]. Importantly, this dataset includes a target variable (graduation outcome) that indicates whether the student graduated, is still enrolled or dropped out. This is the variable we will try to predict using the demographic, socioeconomic and educational features. Please refer to Figure 2 and Figure 3 for a full list of features.
2.2. Models
The data was split into training and testing samples — the training data was used to train alternative machine learning models while the testing data was used to test out-of-sample performance of these models. The testing-to-training ratio was varied and we used three alternative ratios: 0.4, 0.25, 0.10. These ratios were chosen as these present three disparate estimation-testing sample sizes. To determine the optimal set of features, we used three alternative machine learning models – logistic regression, decision tree and random forest. Starting with the features that are more highly correlated with the graduation outcome, model performance was assessed as the number of features used to train these models were varied to identify the optimal set of features. The performances of seven different machine learning models were then optimized using a grid search optimization algorithm trained on the optimized set of features with 3-fold, 5-fold and 10-fold cross-validations. Furthermore, we compared the outcome from a binary classification approach to a multi-class classification approach by investigating a multi-class classification problem. The purpose was to identify the best performing machine learning model based on a set of performance metrics. This paper utilized the following machine learning classification models both for binary and multi-class classifications: logistic regression, decision tree, random forest, artificial neural network (ANN), support vector machine (SVM), XGBoost and K-nearest neighbor (KNN).
3. Methods
3.1. Exploratory Data Analysis
We first assess the distribution of our outcome variable “Target”, the graduation outcome. Target is a categorical variable — it is formulated as a three-category classification task (dropout, enrolled, and graduate). The histogram shown in Figure 1 depicts the distribution of the three-class graduation outcome. The dataset includes 4,424 students. As depicted in the histogram in Figure 1, 1,421 students were dropouts, 2,209 students were graduates, and 794 students continued to be enrolled at the end of the normal duration of the course.
Next, to begin to identify the key features that would be incorporated in the model to predict dropout, we compute correlation coefficient of target with each of the other variables. Apart from target, the dataset contains 34 features. The horizontal bar chart in Figure 2 shows the correlations. Each bar shows the correlation coefficient of that feature with the target variable, the graduation outcome. The chart below shows that the probability of graduation is positively correlated with curricular units in second and first semesters (approved, grade, enrolled), whether the student’s tuition and fees are up-to-date, whether the student is a scholarship holder, while it is negatively correlated with whether the student is older, a debtor, married, female. Table A1 in the Appendix A includes the exact values of the correlations.
In the horizontal bar chart in Figure 3, the correlation coefficients are arranged in order of magnitude to understand which features are more strongly correlated with target, regardless of the direction. The feature that is most tightly correlated with Target is curricular units in 2nd semester (approved), followed by curricular units 2nd semester (grade), curricular units 1st semester (approved), curricular units second semester (grade), whether tuition and fees are up-to-date, whether the student is a scholarship holder and so on. Table A2 in the Appendix A includes the absolute values of the correlations.
As the initial point of feature screening, the top 10 features according to the magnitude of correlation coefficient between the graduation outcome and the various features, were considered. The top ten bars in Figure 3 above show the correlation coefficients of the ten features that are most strongly correlated with our target variable, the graduation outcome. Each of these correlations is higher than 0.2.
In Table 1, summary statistics of ten features that are most highly correlated with target are presented. We see that the mean number of curricular units that are approved in the second semester is 4.44, with a standard deviation of 3, a minimum of 0 and maximum of 20. These numbers are respectively 4.7, 3.1, 0 and 26 for the first semester. The grade average for the second semester is 10.2, with a standard deviation of 5.2, a min of 0 and a maximum of 18.6. These numbers for the first semester respectively are 10.6, 4.8, 0 and 18.9. We find below that 88% of the students are up-to-date with tuition and fees, 11% are debtors, 35% are male students and that the average age at enrollment is approximately 23.
Calculating pairwise correlations, we find that (a) curricular units 2nd semester (approved) and curricular units 2nd semester (grade) are very highly correlated, with a correlation coefficient of 0.761 and (b) curricular units 1st semester (approved) and curricular units 1st semester (grade) are very highly correlated with a correlation coefficient of 0.696. Therefore, to avoid multicollinearity issues, we include curricular units 2nd semester (approved) and curricular units 1st semester (approved) in the list of features instead of including all four. These two features will capture the features curricular units 2nd semester (grade) and curricular units 1st semester (grade) adequately.
We start with a broader, binary classification approach looking at students who dropped out and who did not. In this two-class classification, we classify students into two categories – students who dropped out (“dropout”) and students who graduated or were enrolled (“non-dropout”) at the end of the normal duration of the course. Figure 4 below shows the distribution of this binary variable. As depicted in Figure 4, 1,421 students were dropouts, 3,003 students were non-dropouts. To address this class imbalance, hyperparameters for class weighting and classification thresholds were empirically optimized in the grid-search optimization models in Section 3.3.
3.2. Feature Optimization and Model Training
We started with a logistic model as a baseline for feature engineering purposes. Table 2 below reports the features we use in the different logistic models, where the features are chosen in order of their correlation with the dropout variable. For simplicity and ease of reference, we call these sets of features F1-F8. Recall from section 3.1 that we exclude “curricular units 2nd semester (grade)” and “curricular units 1st semester (grade)” for multicollinearity concerns as they highly correlate respectively with “curricular units 2nd semester (approved)” and “curricular units 1st semester (approved)”.
Table 3 reports the results from logistic models with features F1-F8 and different testing to training ratios. The objective of this feature engineering and optimization exercise is to let the data decide which sets of features are most important in predicting dropout. For this purpose, we compare the accuracy and confusion matrix of the logistic models below with different sets of features F1-F8.
As shown in Table 3, models with features F3, F5 and F6 perform the best in terms of accuracy and the confusion matrix. Since there is not one set of features for which the logistic model dominates the models with other sets of features, we next conduct a more expansive analysis to screen the optimal set of features.
Specifically, as a next step in finalizing the optimum set of features, while considering features F3, F5, F6: (a) we examined a more comprehensive set of machine learning models (logistic, decision tree, random forest) (b) we considered three different testing to training ratios rather than two: 40%, 25% and 10% and (c) we investigated a wider set of performance metrics (accuracy, sensitivity, specificity, precision, AUC-ROC).
Table 4 presents results from logistic model, decision tree and random forest models using features F3, F5 and F6 respectively and three testing-to-training ratios (40%, 25%, 10%). As shown in Table 4, all models provided an acceptable performance. Notably, a training to testing ratio of 75:25% provided a tradeoff between data availability, avoiding overfitting the model, and achieving high classification performance. That said, the models performed well even at a lower training to testing ratio (60:40%) showing the successful training approaches implemented across all models. Additionally, while the 90:10% training-to-testing ratio can lead to overfitting, the performance metrics remain comparable across the various ratios, indicating that the models are learning the patterns rather than memorizing the data. This signifies that the models are robust and the performance does not worsen when we use a lower percentage of training data. In terms of the various performance metrics considered, the logistic and random forest models perform better. An exception is that the decision tree model dominates in terms of specificity except two cases when the logistic model has a higher specificity. The random forest model dominates in terms of sensitivity. The logistic and random forest models do better in terms of accuracy and the confusion matrix diagonal elements. All models have comparable AUC-ROC. Focusing on logistic and random forest models (as they perform better), and comparing models across the different sets of features, the models with the set of features denoted by F6 perform the best, even though the performance metrics remain similar across models with different features attesting to the robustness of the models. Moving forward, we focus on the set of features denoted by F6, which also subsumes F3 and F5. We consider training-to-testing ratio of 75:25% to strike a balance as discussed above.
3.3. Grid Search Optimization
Next, leveraging a comprehensive suite of machine learning models, grid search optimization was applied and validated with 3-fold, 5-fold and 10-fold cross validation. The machine learning models we utilize below are: logistic, decision tree, random forest, XGBoost, Artificial Neural Network (ANN), K-Nearest Neighbors (KNN) and Support Vector Machine (SVM). The set of features we use here is F6. We continue to use 25:75% testing-to-training ratio for reasons mentioned above. Since we are using k-fold cross validation, the performance metrics reported represent means across all the folds (as indicated by “macro” in the top row of Table 5 and Table 6). In subsection 3.3.1, A1 (“dropout” and “non-dropout”). In sub-section 3.3.2, we consider a multi-class classification of the graduation outcome (“dropout”, “enrolled”, “graduate”).
3.3.1. Binary Classification
As seen in Table 5, the grid-search optimized random forest model dominated in terms of most of the performance metrics. In terms of accuracy, specificity, precision and AUC-ROC, it is the best performing model. It is noteworthy that the ANN has the same values for specificity, precision and AUC-ROC but lower values of accuracy and sensitivity. Logistic has the same values of sensitivity and AUC-ROC but has lower values of accuracy, specificity and precision. XGBoost has higher sensitivity than Random Forest, but has lower specificity, precision and AUC-ROC. SVM has the same specificity as random forest but has lower values of accuracy, sensitivity, precision and AUC-ROC. Random Forest performs better than Decision Tree and KNN in terms of all the measures below. To summarize, using grid search optimized machine learning models with k-fold cross-validation in Table 5, we find that the model that performs the best in predicting dropout is the grid-search optimized random forest model.
Next, using the grid-search optimized random forest model, we examine which features predict dropout rate the best. This is an important exercise as with this knowledge administrators and students can use corresponding measures to reduce the probability of dropout. In Figure 5 below, we plot the importance of the features in predicting dropout from the binary grid-search optimized random forest model. We observe that the number of curricular units that are approved in the second semester is the most important factor and by far exceeds the importance of the other factors. The next in importance is the number of curricular units that are approved in the first semester. In terms of descending order of importance, the other features are whether the tuition and fees are up-to-date, the age at enrollment, the application mode, whether the student is a debtor, a scholarship holder and gender. This analysis suggests that higher number of approved curricular units can increase the probability of not dropping out. Being up-to-date in terms of tuition and fees, which may be positively correlated with parental resources, also lowers the risk of dropout. On the other hand, a higher age at enrollment increases the chance of college dropout.
3.3.2. Three-Class Classification
While so far we have considered a Two-Class Classification where the outcome of interest is classified into two-categories: dropout and non-dropout, in the analysis below, we move to a three-way classification, where the outcome of interest is classified into three categories: dropout, enrolled and graduate. In Table 6 below, we report findings from grid-search optimized machine learning models for three-classification. Once again, grid-search optimized logistic, decision tree, random forest, XG Boost, ANN, KNN and SVM models were estimated, and validated with 3-fold, 5-fold and 10-fold cross validation. Comparing the performance metrics of this model to the performance metrics of the grid search optimized binary model, we clearly see that the two-class models were considerably higher performing than the three-class models. As Table 6 shows, the grid-search optimized random forest models dominates the other models. It is the best performing model in terms of accuracy, sensitivity, and AUC-ROC. In terms of specificity and precision, the XGBoost model dominates the random forest model, but the difference is marginal.
Next using the 3-class classification grid-search optimized model, we analyze which features are most important for predicting dropout probability. The results are presented in Figure 6. The features, in order of importance, are the same between the 3-class and 2-class grid search models, even though the magnitudes are slightly different. As in the case of the binary classification, number of curricular units approved for the second semester is the strongest predictor, followed by number of curricular units approved for the first semester, and then whether tuition and fees are up-to-date. This implies once again that students who have a higher number of approved curricular units are less likely to dropout, indicating that educational investment and quality matter. Students who are up-to-date in paying tuition and fees are also more likely to graduate, suggesting that parental resources also help graduation.
4. Discussion
Dropping out of college has strong adverse consequences on labor market outcomes such as employment and earnings. Hence it is (a) important to understand the correlates of dropping out of college and (b) to develop a model that can optimally predict dropout probability based on the student information. To this end, this paper aimed to develop an optimal model of dropout probability. Such a model, along with an accurate understanding of the predictors of dropout, would enable policymakers, administrators, students and families to get an early indication of dropout risk of students. This, in turn, would enable them to devise measures and interventions and channel resources to prevent dropouts. Building on the existing literature, this paper expanded on the literature by using a broader suite of machine learning models and evaluation metrics, by conducting extensive feature optimization and by using a dataset that captures, in addition to other attributes, course information and grades, financial information, and macroeconomic data that are not present in the existing studies.
Using a dataset of 4,424 students that contains a comprehensive set of features, this paper conducted feature optimization, performed a comprehensive model evaluation, identified the best performing machine learning model comparing seven grid search optimized models, and identified the most important predictors of dropout risk. Additionally, we considered several training-to-testing ratios and finally considered a ratio that avoids the hazard of over/under-fitting while allowing an appreciable split between by training and testing samples. Grid search optimized versions of seven ML models with k-fold cross-validation were utilized and compared – logistic regression, decision tree, random forest, artificial neural network, support vector machine, XGBoost and K-nearest neighbor – to find the optimum model for predicting the likelihood of dropout. Models with a binary classification as well multi-class classification were estimated and compared.
Grid search optimized random forest model dominated the other models in terms of most of the performance metrics, for both binary and multi-class classifications. It was the best performing model in terms of accuracy, specificity, precision and AUC-ROC with 0.85 accuracy, 0.72 sensitivity, 0.92 specificity, 0.82 precision, and an AUC-ROC of 0.89 in the binary classification model. XGBoost provided a comparable performance, providing a higher sensitivity than random forest but lower specificity, precision, and AUC-ROC. Examining the predictors of dropout risk using the grid search optimal random forest model, we found that in order of importance, these are: the number of curricular units approved in the second semester, the number of curricular units approved in the first semester and whether the tuition and fees were paid up-to-date, signifying that both educational quality and parental resources play important roles in student success, consistent with the results from the correlation analysis.
To make this model broadly accessible, we are using the best performing grid search random forest model for developing (and launching) a web application that students and administrators can use to input students’ data to understand dropout probability. Additionally, college administrators and students can undertake countervailing measures to mitigate dropout risk based on the web app findings. Future work could expand on this research by collecting and utilizing a larger dataset extending across several colleges. Moreover, additional features such as high school scores, health status of students, special education and limited-English-proficient status might improve model performance and its predictive power. Furthermore, hybrid machine learning models that integrate multiple machine learning techniques to draw on their individual strengths may lead to improved performance and accuracy. These improvements could potentially advance our knowledge by increasing representativeness and predictability while providing deeper insights into the mechanisms behind college success, which could, in turn, be used by the colleges and students to further limit college dropout.
Acknowledgments
I am grateful to Morteza Sarmadi for mentorship, guidance, encouragement, and many insightful suggestions and discussions.
Appendix A

Table A1.
Correlation of Target with other Variables.
| Curricular units 2nd semester (approved) | 0.624 |
| Curricular units 2nd semester (grade) | 0.567 |
| Curricular units 1st semester (approved) | 0.529 |
| Curricular units 1st semester (grade) | 0.485 |
| Tuition fees up to date | 0.410 |
| Scholarship holder | 0.298 |
| Age at enrollment | -0.243 |
| Debtor | -0.241 |
| Gender | -0.229 |
| Application mode | -0.212 |
| Curricular units 2nd semester (enrolled) | 0.176 |
| Curricular units 1st semester (enrolled) | 0.156 |
| Displaced | 0.114 |
| Curricular units 2nd semester (without evaluations) | -0.094 |
| Curricular units 2nd semester (evaluations) | 0.093 |
| Previous qualification | -0.091 |
| Marital status | -0.090 |
| Application order | 0.090 |
| Daytime/evening attendance | 0.075 |
| Curricular units 1st semester (without evaluations) | -0.069 |
| Curricular units 2nd semester (credited) | 0.054 |
| Father's occupation | 0.052 |
| Mother's occupation | 0.048 |
| Curricular units 1st semester (credited) | 0.048 |
| Curricular units 1st semester (evaluations) | 0.044 |
| GDP | 0.044 |
| Mother's qualification | -0.038 |
| Inflation rate | -0.027 |
| Unemployment rate | 0.009 |
| Course | 0.008 |
| Educational special needs | -0.007 |
| Nationality | -0.005 |
| International | 0.004 |
| Father's qualification | 0.000 |
Table A2.
Absolute Correlation of Target with other variables.
| Curricular units 2nd semester (approved) | 0.624 |
| Curricular units 2nd semester (grade) | 0.567 |
| Curricular units 1st semester (approved) | 0.529 |
| Curricular units 1st semester (grade) | 0.485 |
| Tuition fees up to date | 0.410 |
| Scholarship holder | 0.298 |
| Age at enrollment | 0.243 |
| Debtor | 0.241 |
| Gender | 0.229 |
| Application mode | 0.212 |
| Curricular units 2nd semester (enrolled) | 0.176 |
| Curricular units 1st semester (enrolled) | 0.156 |
| Displaced | 0.114 |
| Curricular units 2nd semester (without evaluations) | 0.094 |
| Curricular units 2nd semester (evaluations) | 0.093 |
| Previous qualification | 0.091 |
| Marital status | 0.090 |
| Application order | 0.090 |
| Daytime/evening attendance | 0.075 |
| Curricular units 1st semester (without evaluations) | 0.069 |
| Curricular units 2nd semester (credited) | 0.054 |
| Father's occupation | 0.052 |
| Mother's occupation | 0.048 |
| Curricular units 1st semester (credited) | 0.048 |
| Curricular units 1st semester (evaluations) | 0.044 |
| GDP | 0.044 |
| Mother's qualification | 0.038 |
| Inflation rate | 0.027 |
| Unemployment rate | 0.009 |
| Course | 0.008 |
| Educational special needs | 0.007 |
| Nationality | 0.005 |
| International | 0.004 |
| Father's qualification | 0.000 |
References
- G. Psacaropolous. Returns to education: a brief history and an assessment. Education Economics 32(5), 561-565 (2024).
- Bureau of Labor Statistics. Education Pays: Earnings and unemployment rates by educational attainment. U.S. Bureau of Labor Statistics, Washington DC. 2024. https://www.bls.gov/emp/chart-unemployment-earnings-education.htm.
- B. Berg, J. Causey, J. Cohen, M. Ibrahim, M., D. Shapiro. Some College, No Credential: Student outcomes, annual progress report – Academic Year 2022/23. Herndon, VA: National Student Clearinghouse Research Center (2025). https://nscresearchcenter.org/wp-content/uploads/SCNCReport2024.pdf.
- J. Fink, D. Jenkins, E. Kopko, F.X. Ran. Using Data Mining to Explore Why Community College Transfer Students Earn Bachelor’s Degrees With Excess Credits. Community College Research Center Working Paper No. 100. 2018. https://ccrc.tc.columbia.edu/wp-content/uploads/2018/02/using-data-mining-explore-why-community-college-transfer-students-earn-bachelors-degrees-excess-credits.pdf.
- J. C. Calcagno, T. Bailey, D. Jenkins, G. Kienzl, T. Leinbach. Community college student success: What institutional characteristics make a difference? Economics of Education Review, 27 (6), 632-645 (2008). [CrossRef]
- H. Huo, J. Cui, S. Hein, Z. Padgett, M. Ossolinski, R. Raim, J. Zhang,. Predicting dropout for nontraditional undergraduate students: A Machine Learning approach. Journal of College Student Retention: Research, Theory & Practice, 24(4), 1054-1077 (2020). [CrossRef]
- E. Seo, J. Yang, J. Lee, G. So. Predictive modelling of student dropout risk: Practical insights from a South Korean distance university. Heliyon, 10 (11), 1-17 (2024). [CrossRef]
- M. R. Marcolino, T. R. Porto, T. T. Primo, R. Targino, V. Ramos, E. M. Queiroga, R. Munoz, C. Cechinel. Student dropout prediction through machine learning optimization: insights from moodle log data. Nature Scientific Reports, 15(9840), 2025. [CrossRef]
- D. K. Dake, C. Buabeng-Andoh, Using Machine Learning techniques to predict learner drop-out rate in higher educational institutions, Mobile Information Systems, 2022. [CrossRef]
- V. Realinho, J. Machado, L. Baptista, M. V. Martins. Predict students' dropout and academic success (1.0) [Data set]. Zenodo, (2021). [CrossRef]
- E. Adamopoulou, G. M. Tanzi. Academic drop-out and the Great Recession. Journal of Human Capital, 11(1), 35-71 (2017). [CrossRef]
Figure 1.
Distribution of Graduation Outcome, 3-class classification.
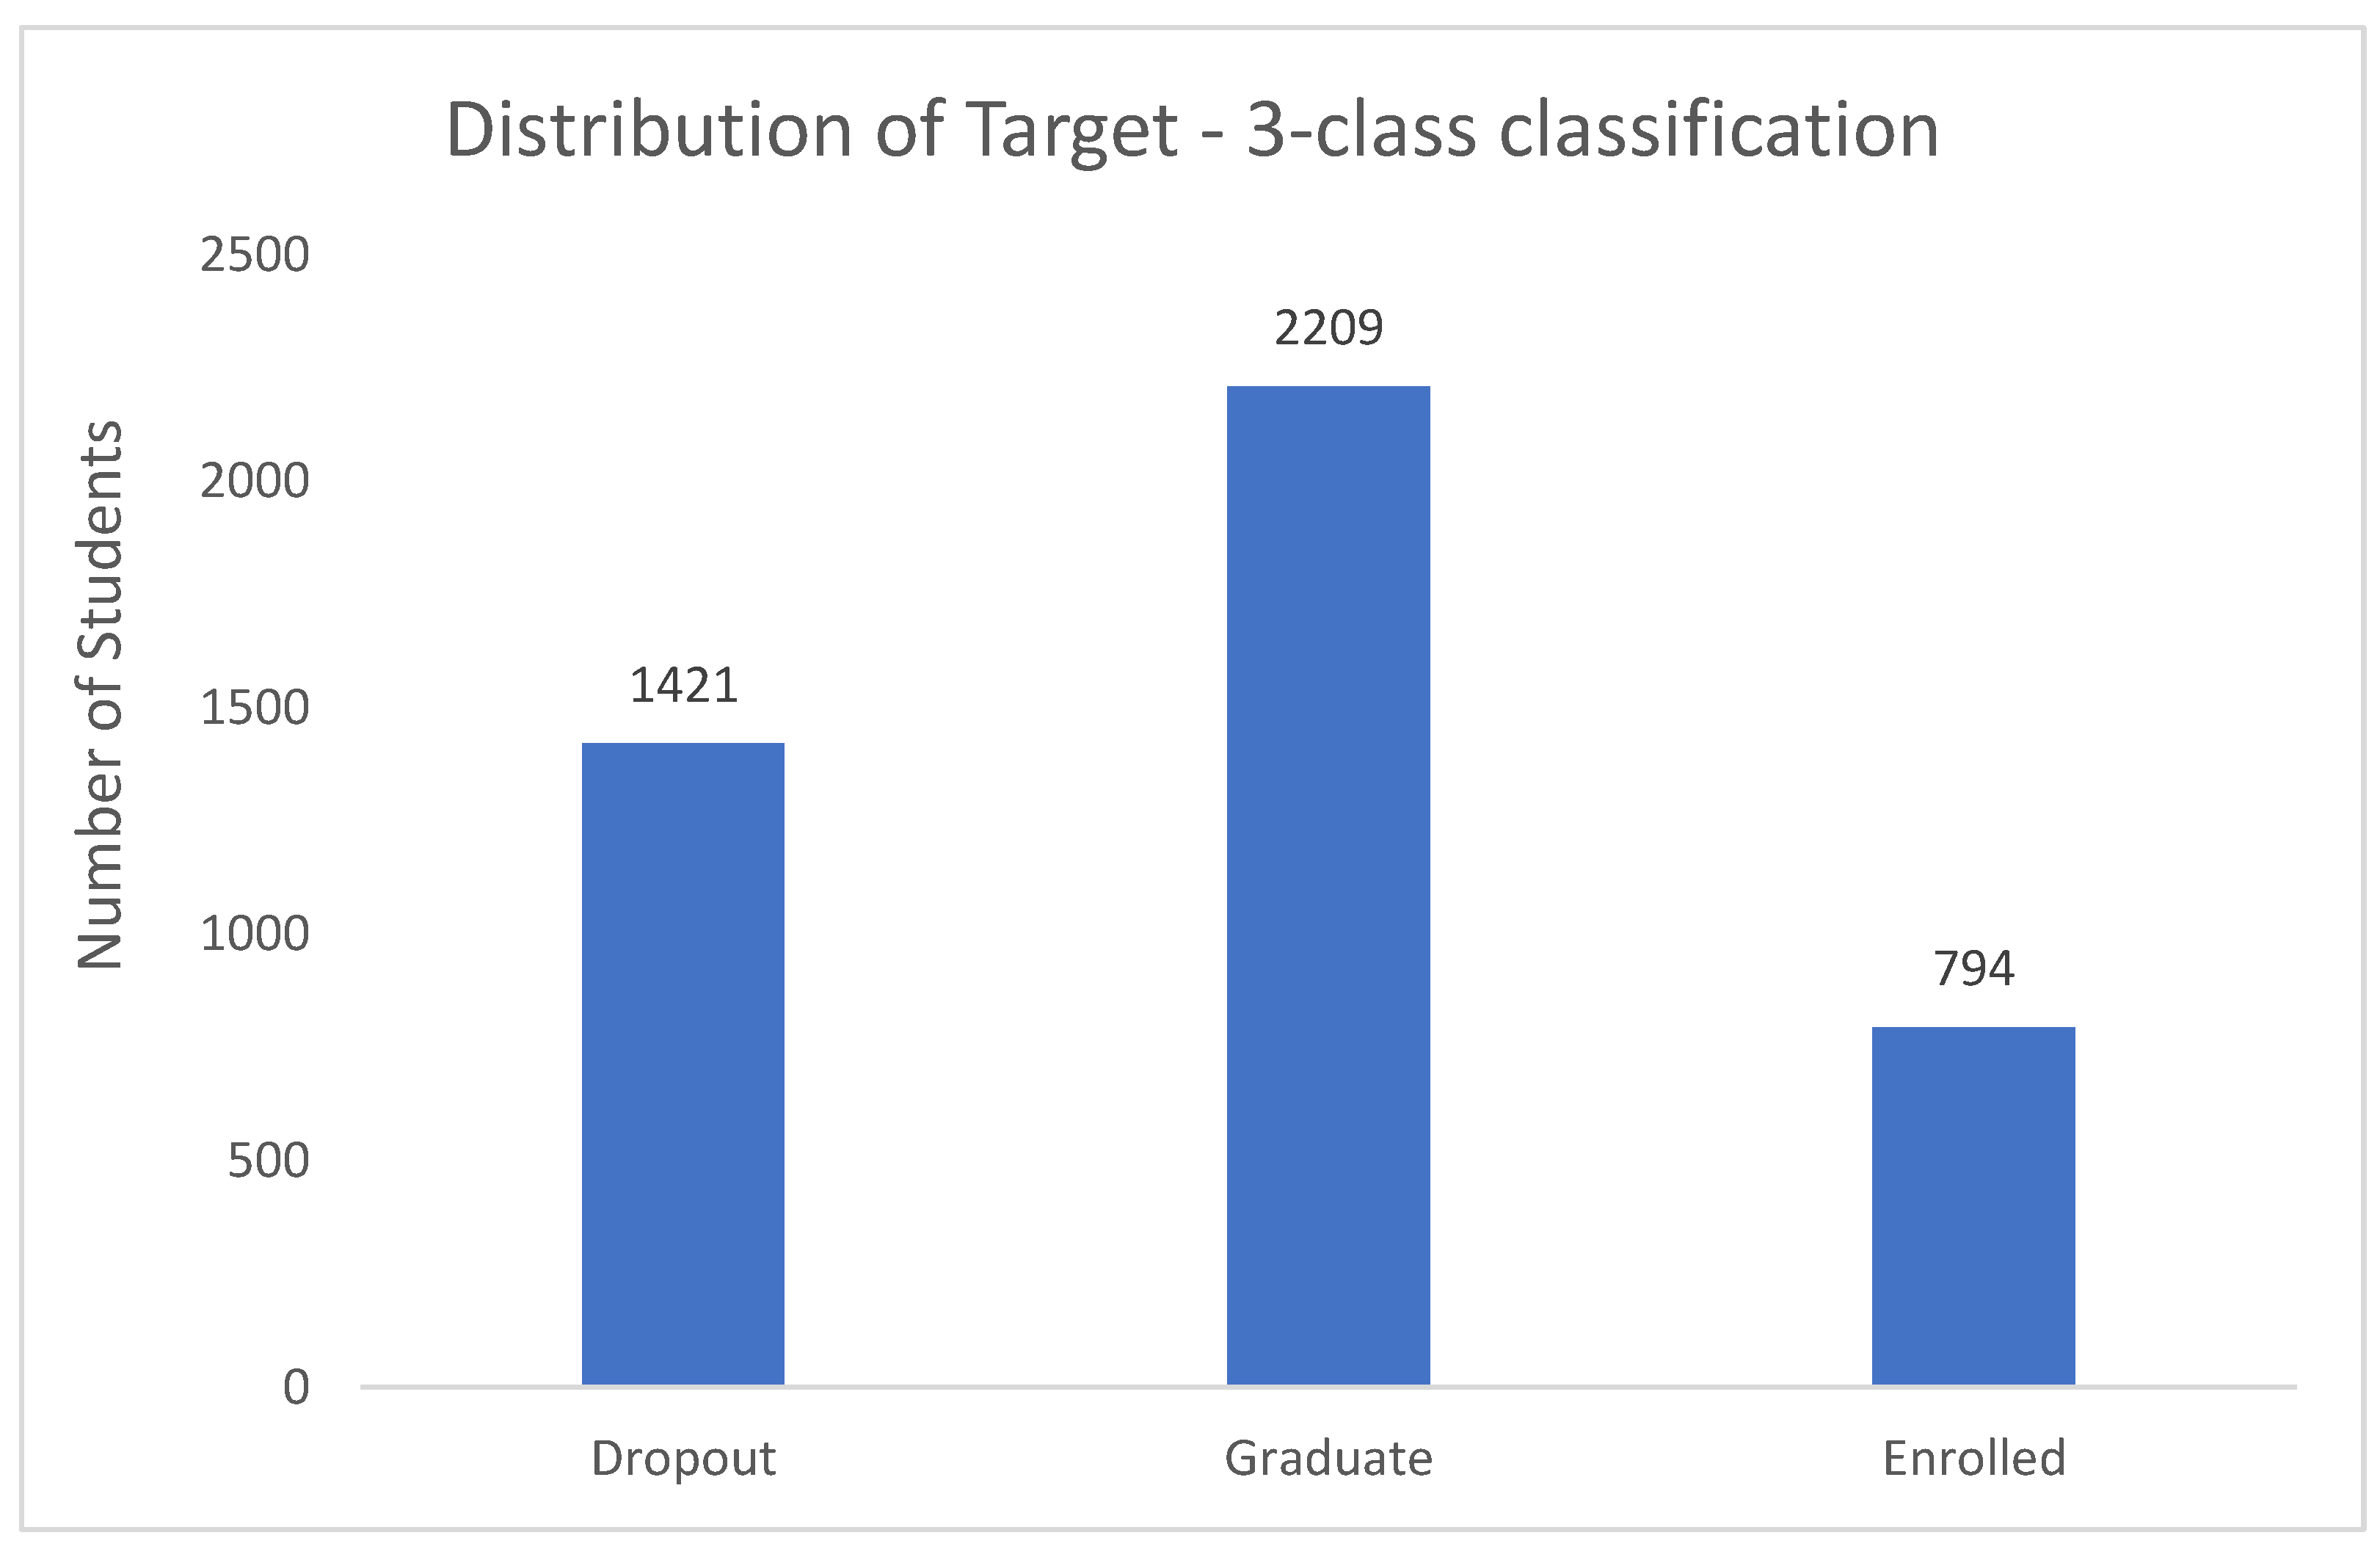
Figure 2.
Correlation of Target with other Variables.
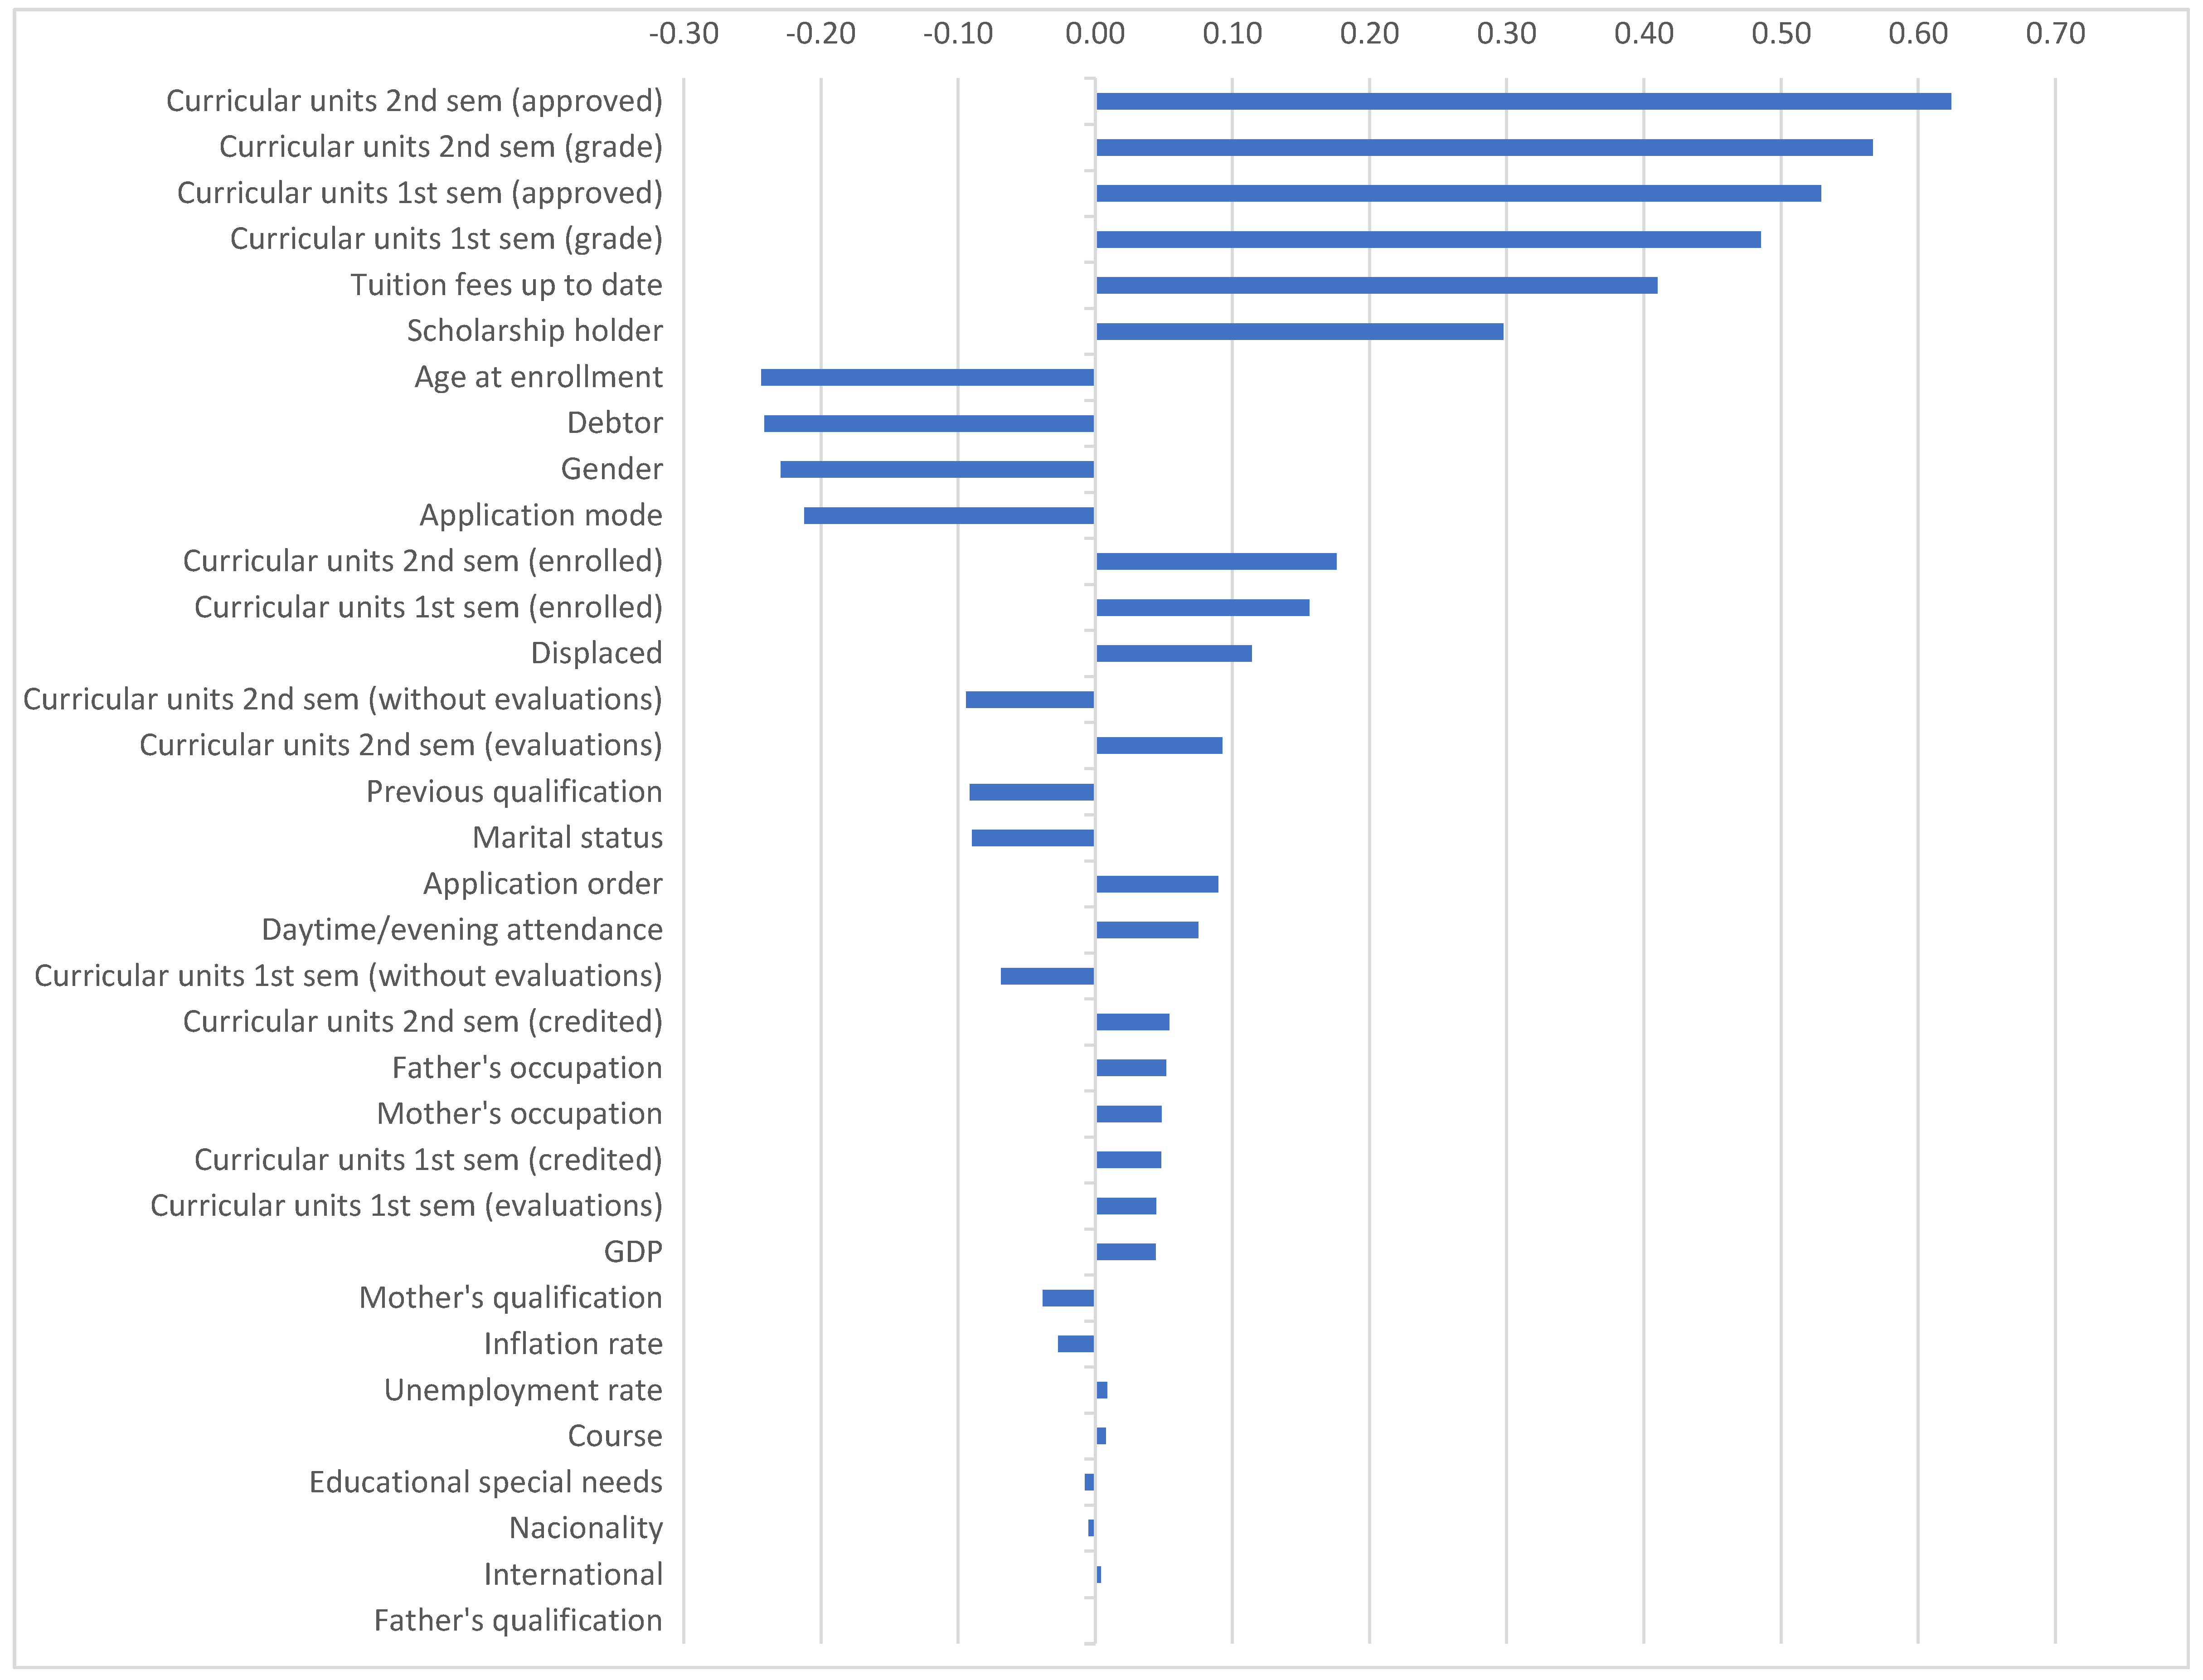
Figure 3.
Absolute Correlation of Target with other variables.
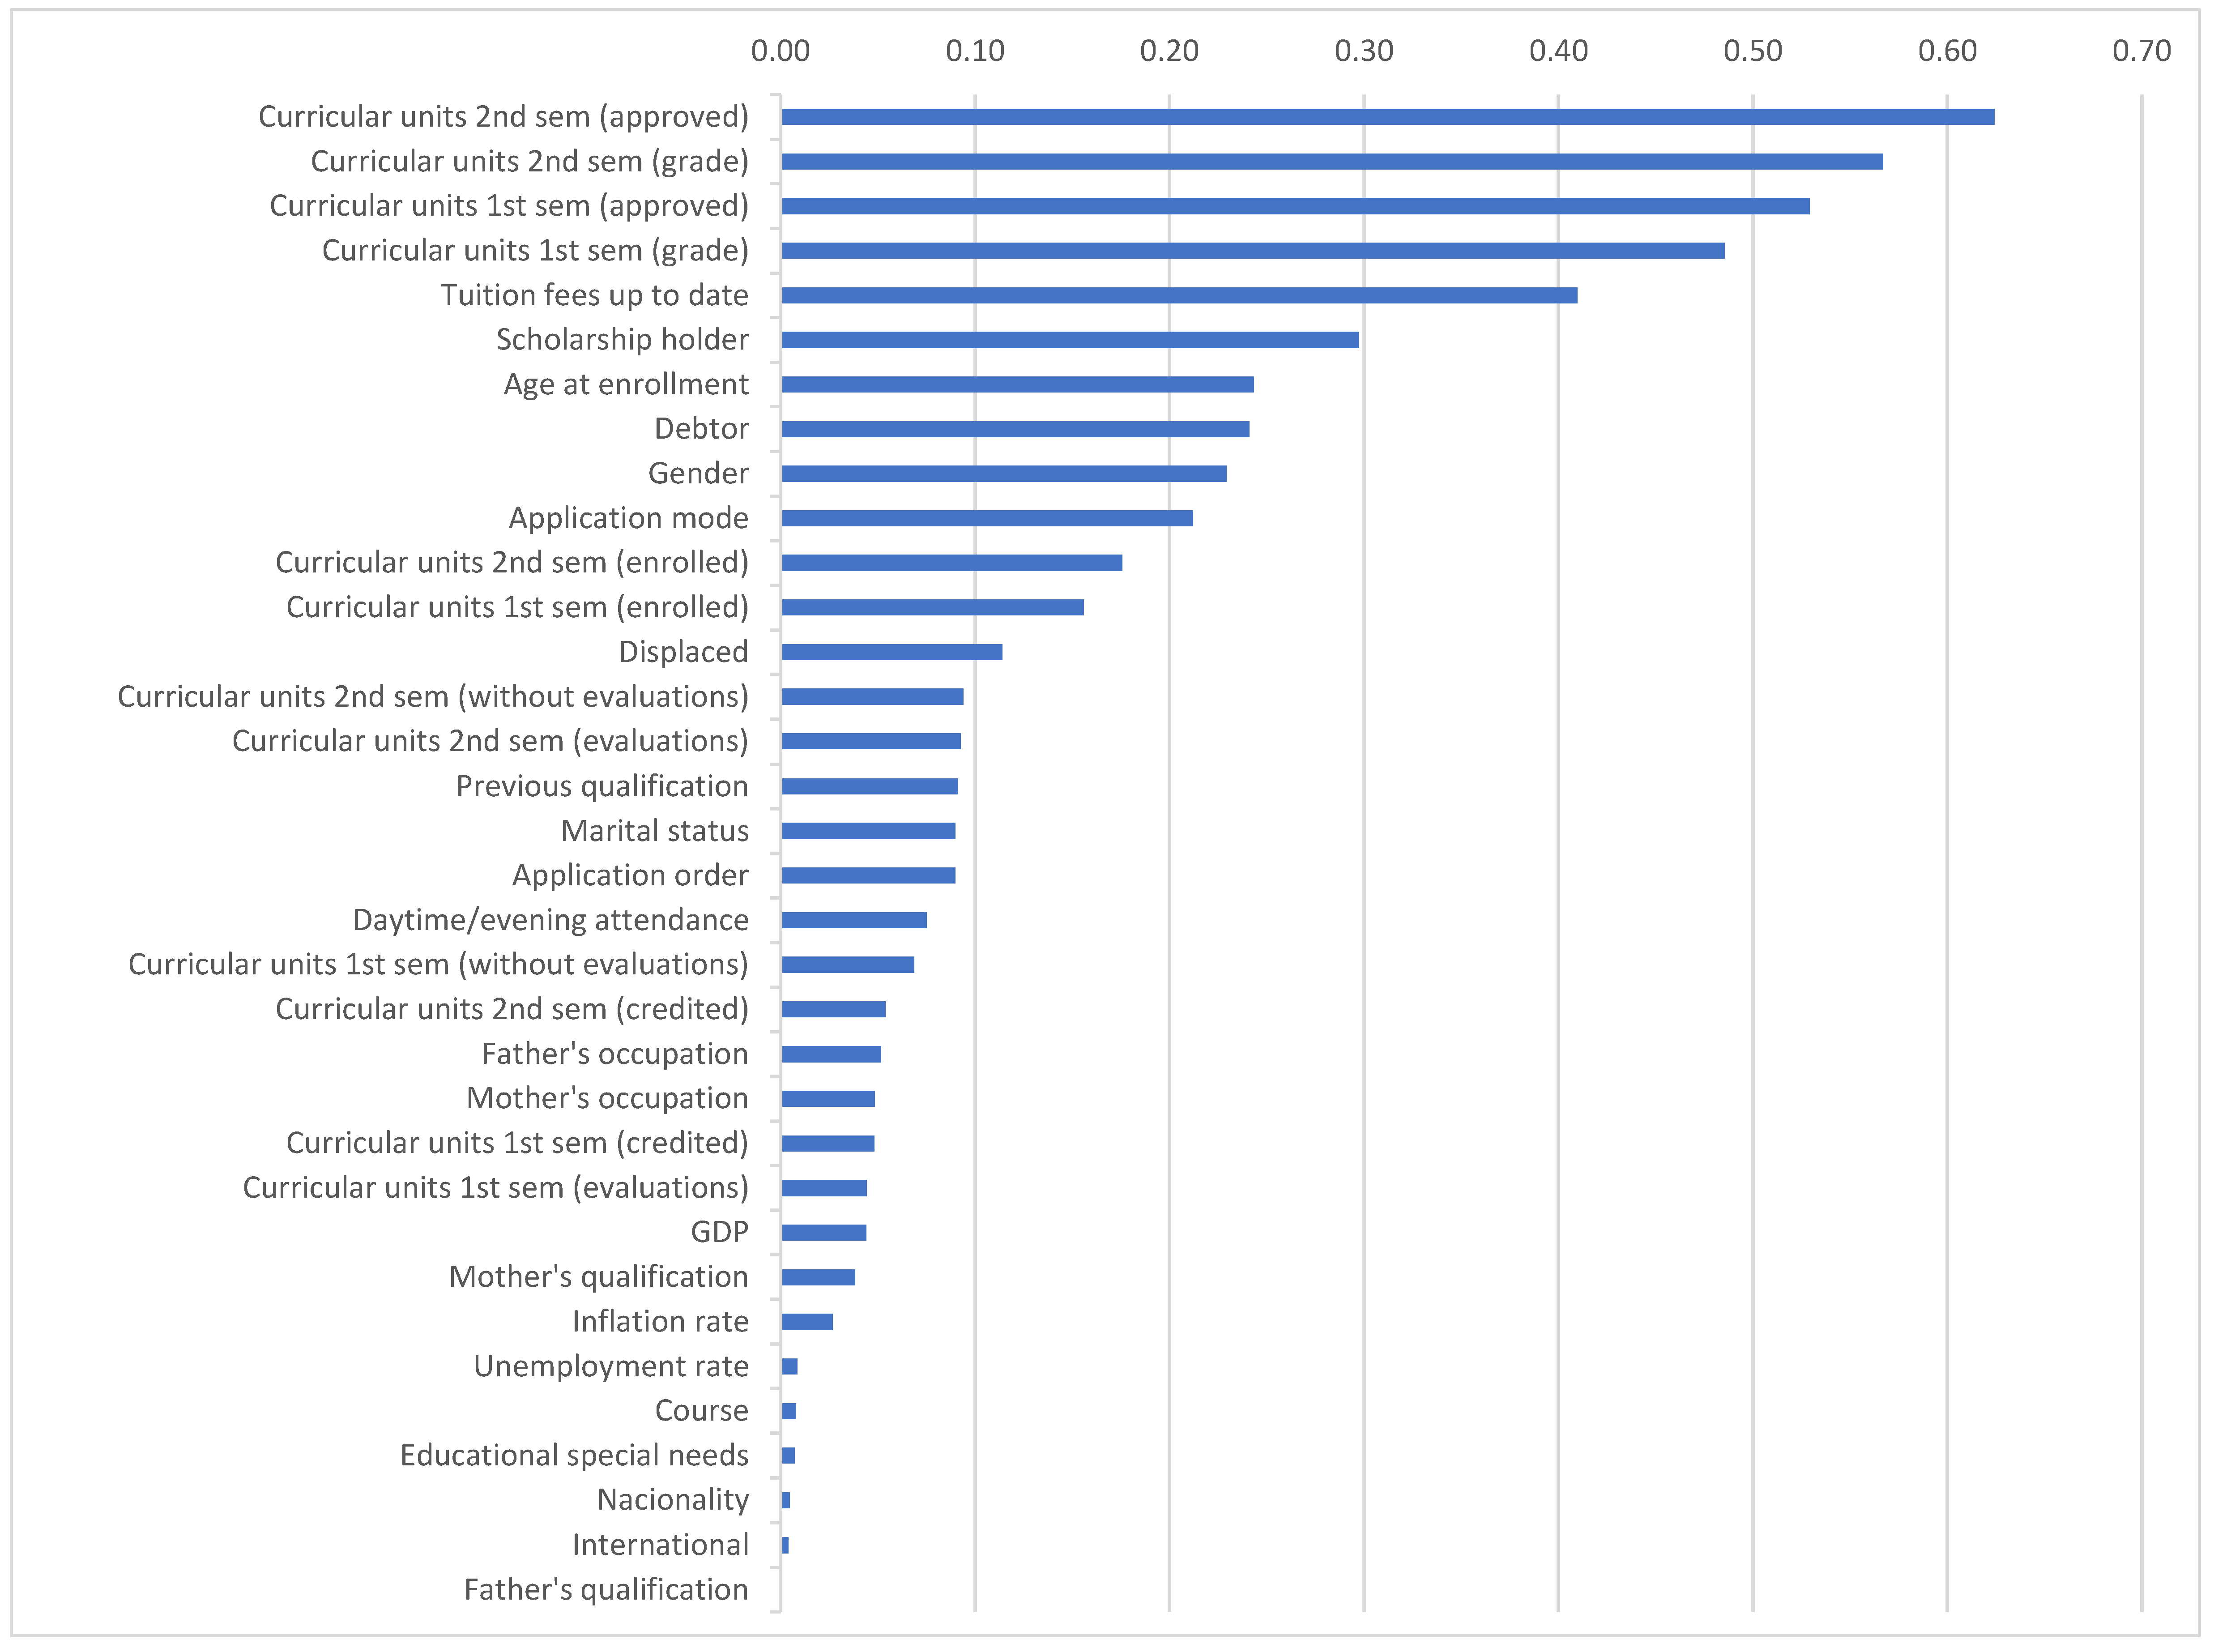
Figure 4.
Distribution of Graduation Outcomes, 2-class classification.
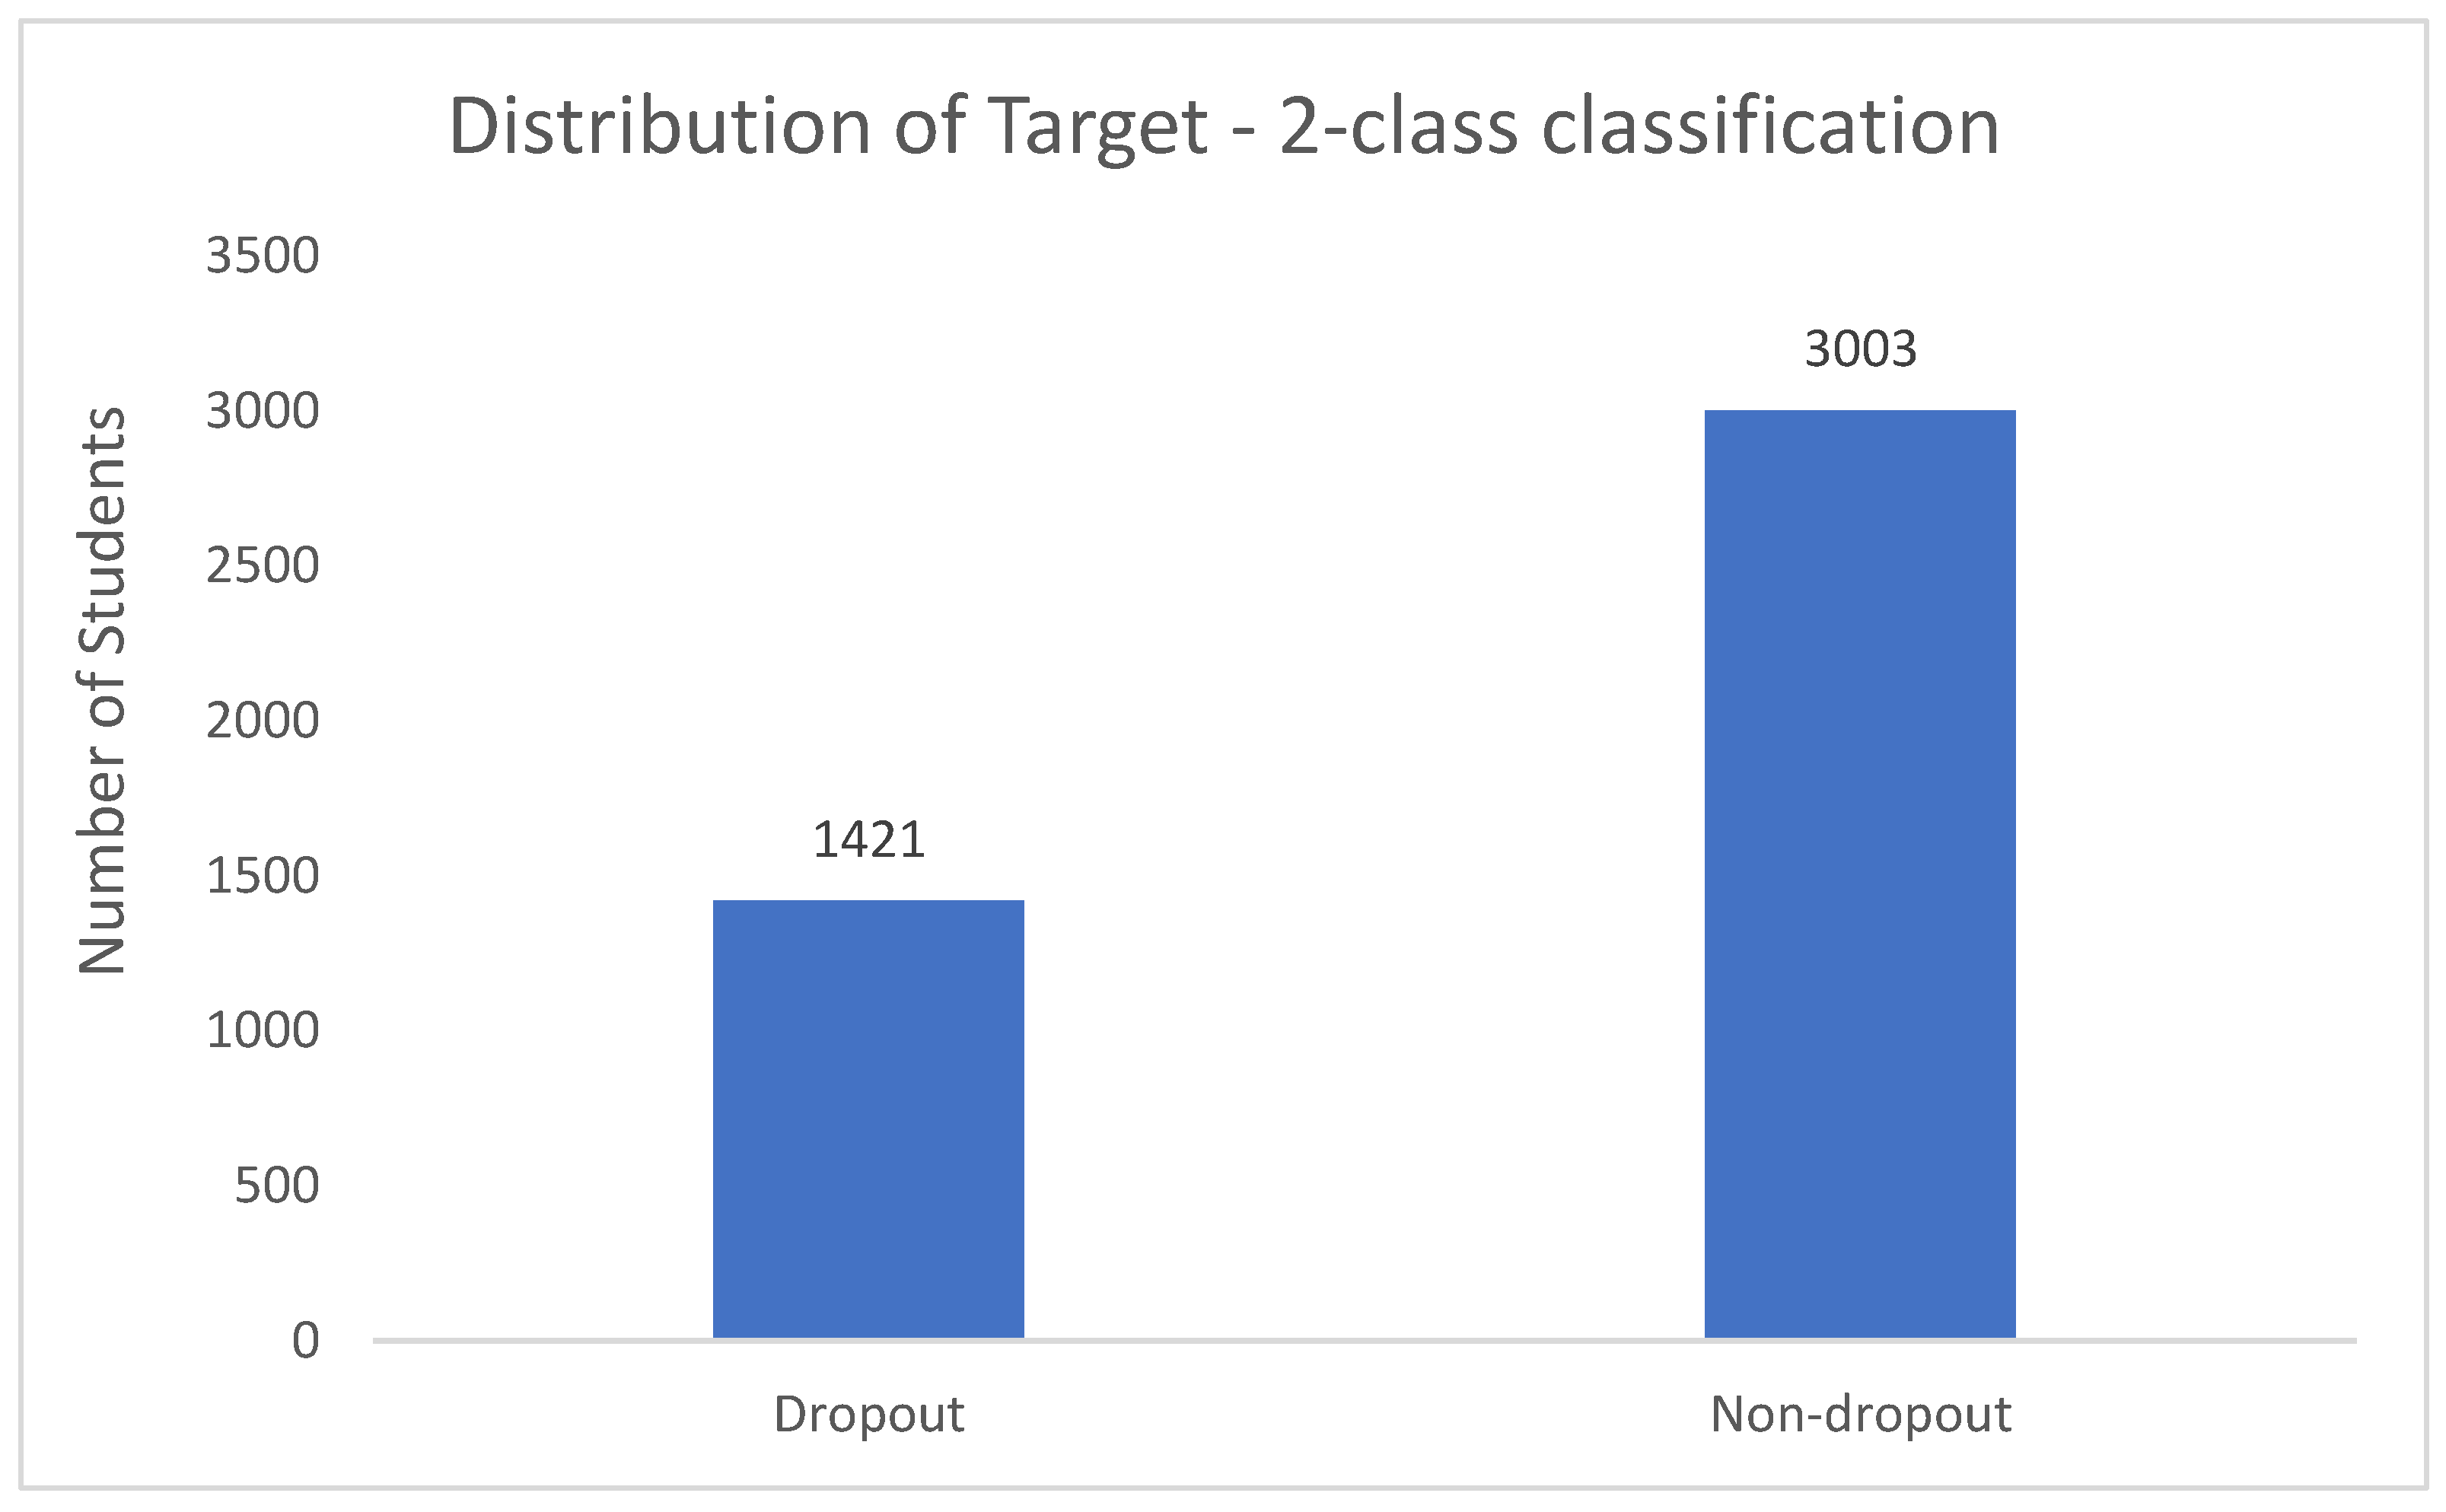
Figure 5.
Grid Search Optimization of Random Forest (2-class): Top Features by Importance. Features used: F6 = {Curricular units 2nd semester (approved), Curricular units 1st semester (approved), Tuition Fees up to date, scholarship holder, Age at enrollment, Debtor, Gender, Application mode} Testing-to-training ratio = 0.25.
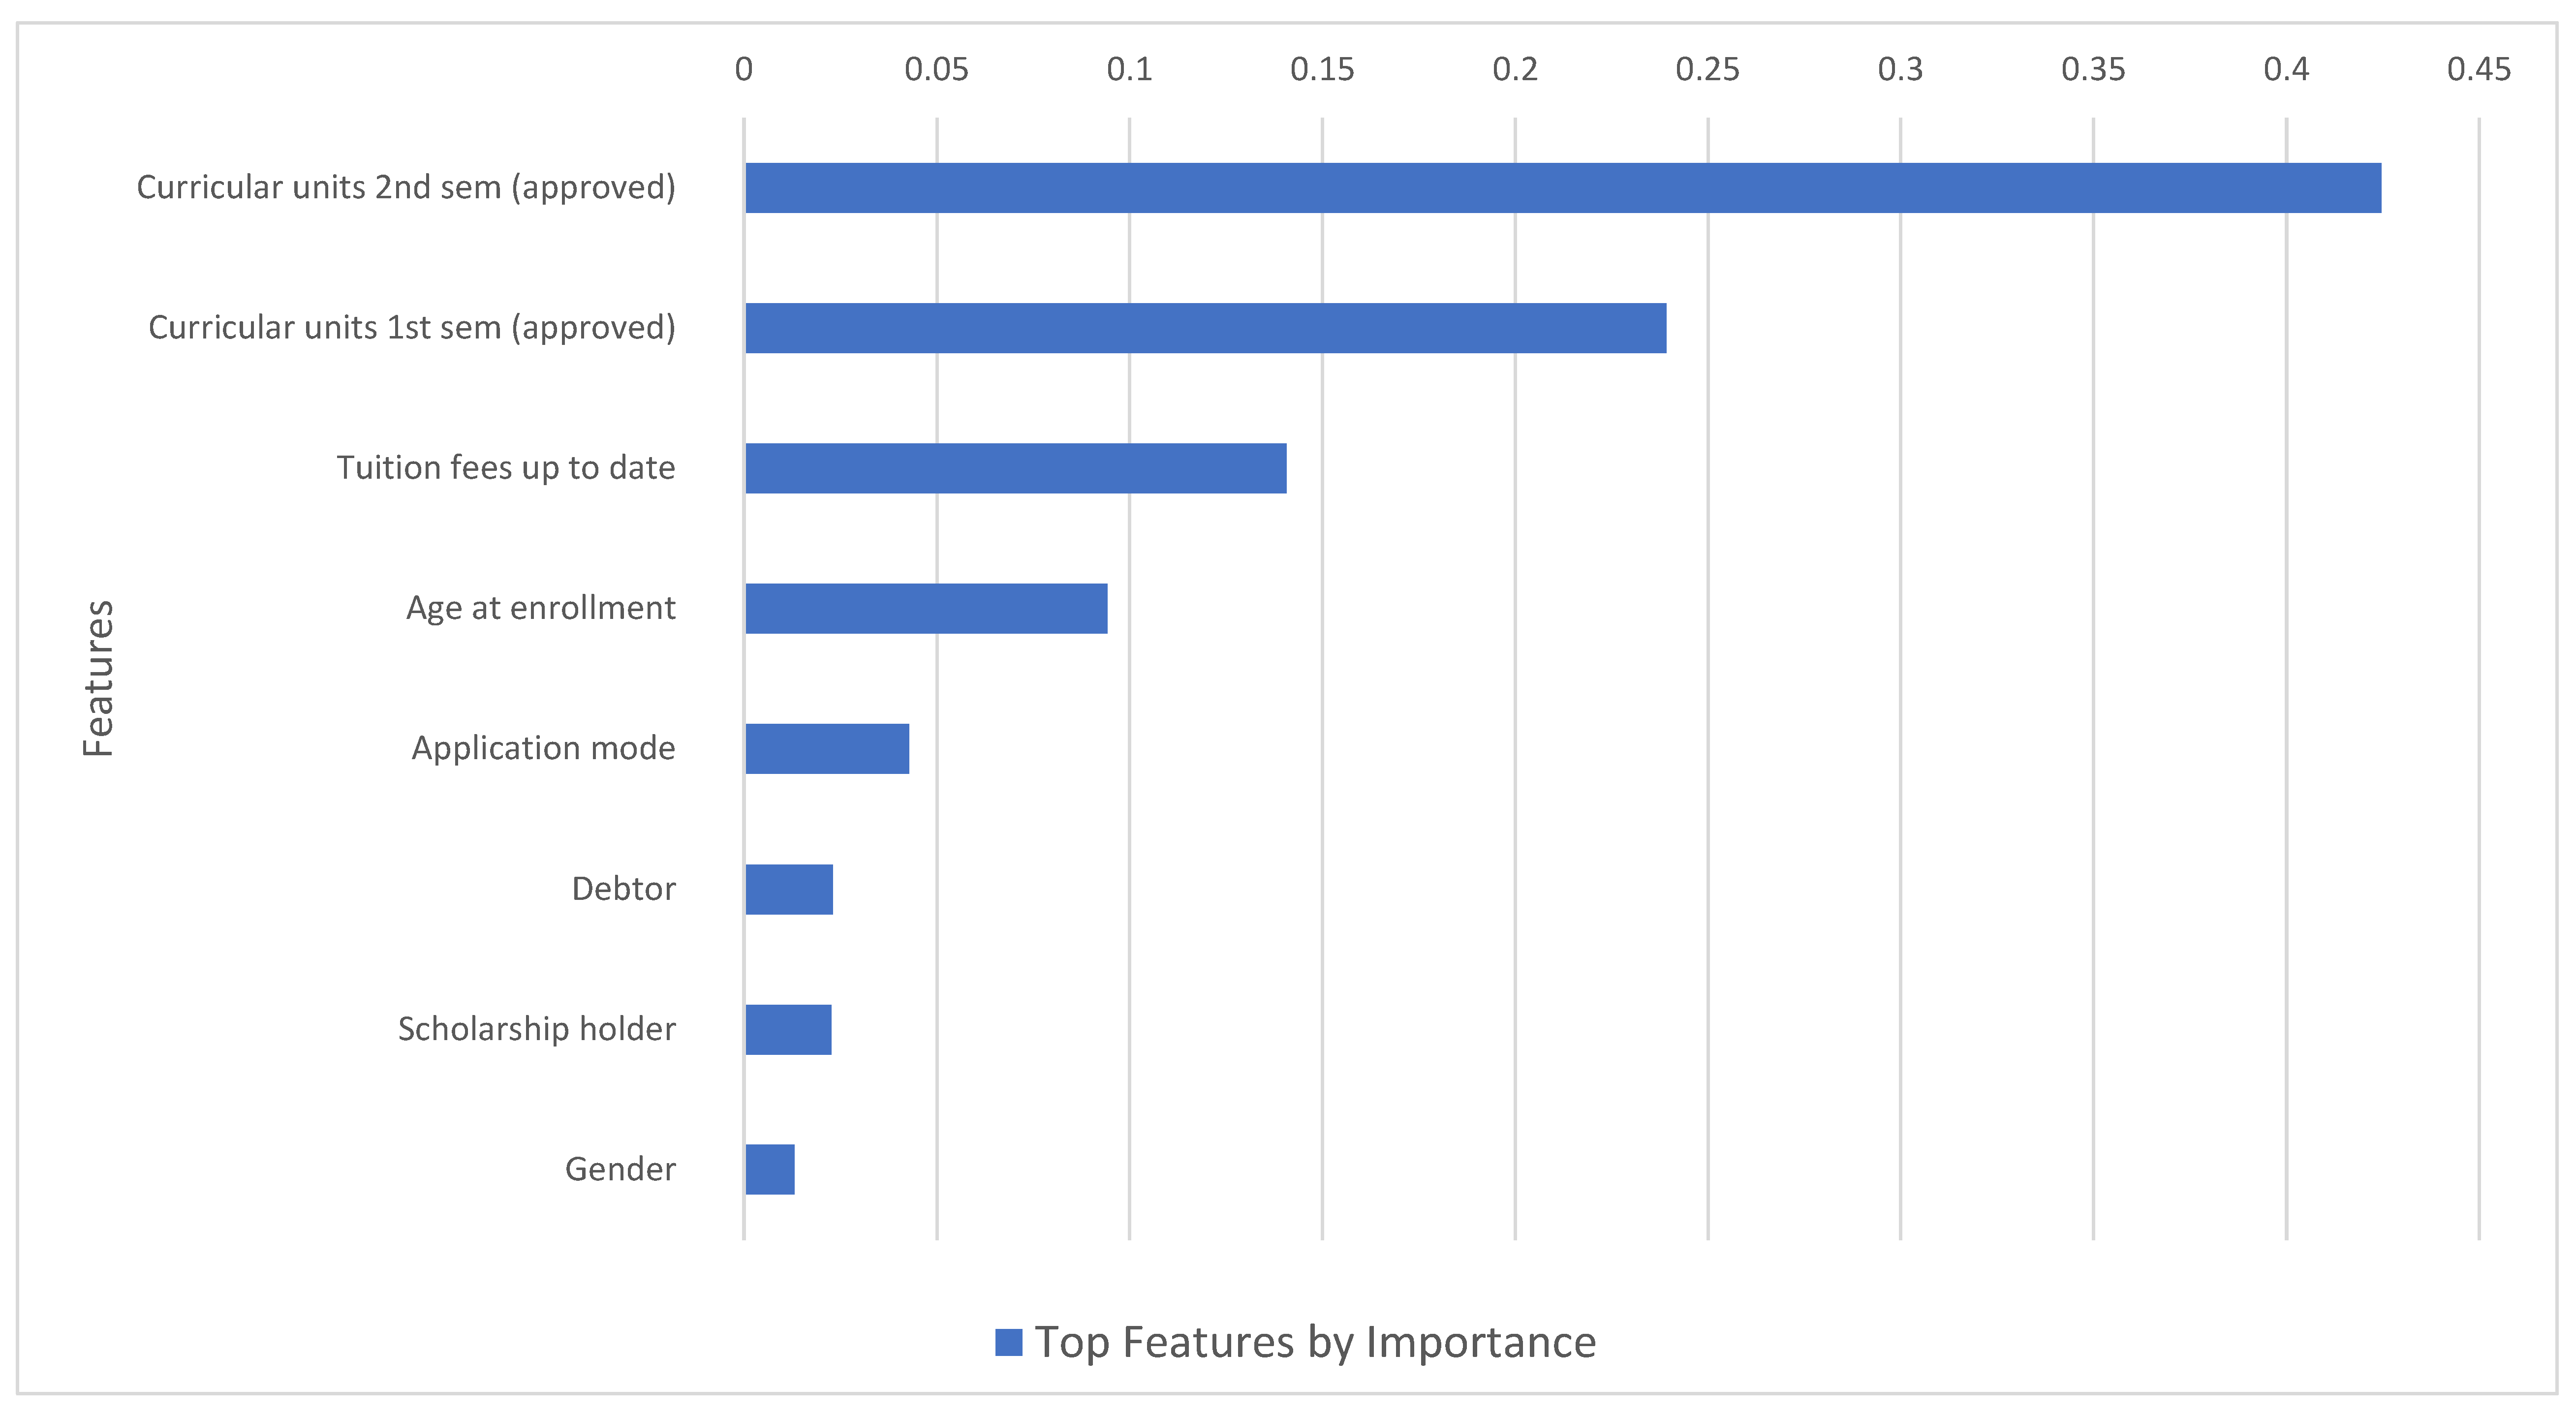
Figure 6.
Grid Search Optimization of Random Forest (3-class): Top Features by Importance; Features used: F6 = {Curricular units 2nd semester (approved), Curricular units 1st semester (approved), Tuition Fees up to date, scholarship holder, Age at enrollment, Debtor, Gender, Application mode}; Testing-to-training ratio ( r) = 0.25 .

Table 1.
An Overview of the Features Statistics Utilized to Predict the Dropout Outcome (N=4424 Students).
Table 1.
An Overview of the Features Statistics Utilized to Predict the Dropout Outcome (N=4424 Students).
| Statistic | Mean | Standard deviation | Minimum | 25th percentile | 50th percentile (median) | 75th percentile | Maximum | |
| Curricular units 2nd semester (approved) | 4.4 | 3 | 0 | 2 | 5 | 6 | 20 | |
| Curricular units 2nd semester (grade) | 10.2 | 5.2 | 0 | 10.8 | 12.2 | 13.3 | 18.6 | |
| Curricular units 1st semester (approved) | 4.7 | 3.1 | 0 | 3 | 5 | 6 | 26 | |
| Curricular units 1st semester (grade) | 10.6 | 4.8 | 0 | 11 | 12.3 | 13.4 | 18.9 | |
| Tuition fees up to date | 0.88 | 0.32 | 0 | 1 | 1 | 1 | 1 | |
| Scholarship holder | 0.25 | 0.43 | 0 | 0 | 0 | 0 | 1 | |
| Age at enrollment | 23.27 | 7.59 | 17 | 19 | 20 | 25 | 70 | |
| Debtor | 0.11 | 0.32 | 0 | 0 | 0 | 0 | 1 | |
| Gender | 0.35 | 0.48 | 0 | 0 | 0 | 1 | 1 | |
| Application mode | 6.89 | 5.3 | 1 | 1 | 8 | 12 | 18 |
Table 2.
Sets of Features Used.
| F1 = {Curricular units 2nd semester (approved), Curricular units 1st semester (approved), Tuition Fees up to date} |
| F2 = {Curricular units 2nd semester (approved), Curricular units 1st semester (approved), Tuition Fees up to date, scholarship holder} |
| F3 = {Curricular units 2nd semester (approved), Curricular units 1st semester (approved), Tuition Fees up to date, scholarship holder, Age at enrollment} |
| F4 = {Curricular units 2nd semester (approved), Curricular units 1st semester (approved), Tuition Fees up to date, scholarship holder. Age at enrollment, Debtor} |
| F5 = {Curricular units 2nd semester (approved), Curricular units 1st semester (approved), Tuition Fees up to date, scholarship holder. Age at enrollment, Debtor, Gender} |
| F6 = {Curricular units 2nd semester (approved), Curricular units 1st semester (approved), Tuition Fees up to date, scholarship holder. Age at enrollment, Debtor, Gender, Application mode} |
| F7 = {Curricular units 2nd semester (approved), Curricular units 1st semester (approved), Tuition Fees up to date, scholarship holder. Age at enrollment, Debtor, Gender, Application mode, previous qualification, marital status} |
| F8 = {Curricular units 2nd semester (approved), Curricular units 1st semester (approved), Tuition Fees up to date, scholarship holder. Age at enrollment, Debtor, Gender, Application mode, previous qualification, marital status, Displaced} |
Table 3.
Evaluating Model Accuracy and Confusion Matrix by Varying Features Used to Predict Dropout - Feature optimization highlighted F3, F5, F6 as the best predictive set of features.
Table 3.
Evaluating Model Accuracy and Confusion Matrix by Varying Features Used to Predict Dropout - Feature optimization highlighted F3, F5, F6 as the best predictive set of features.
| Features Used | Testing to Training ratio |
Accuracy | Confusion Matrix |
| F1 | 0.25 | 0.829 | [[665 67] |
| [122 252]] | |||
| 0.1 | 0.851 | [[273 23] | |
| [43 104]] | |||
| F2 | 0.25 | 0.835 | [[663 69] |
| [114 260]] | |||
| 0.1 | 0.858 | [[272 24] | |
| [39 108]] | |||
| F3 | 0.25 | 0.845 | [[668 64] |
| [107 267]] | |||
| 0.1 | 0.871 | [[273 23] | |
| [34 113]] | |||
| F4 | 0.25 | 0.843 | [[664 68] |
| [105 269]] | |||
| 0.1 | 0.869 | [[274 22] | |
| [33 111]] | |||
| F5 | 0.25 | 0.845 | [[665 67] |
| [104 270]] | |||
| 0.1 | 0.864 | [[273 23] | |
| [37 110]] | |||
| F6 | 0.25 | 0.844 | [[665 67] |
| [105 269]] | |||
| 0.1 | 0.876 | [[276 20] | |
| [35 112]] | |||
| F7 | 0.25 | 0.843 | [[665 68] |
| [106 268]] | |||
| 0.1 | 0.871 | [[275 21] | |
| [36 111]] | |||
| F8 | 0.25 | 0.843 | [[662 70] |
| [104 270]] | |||
| 0.1 | 0.874 | [[275 21] | |
| [35 112]] |
Table 4.
Comparing Models to Predict Dropout - Feature optimization highlighted F6 as the best predictive set of features.
Table 4.
Comparing Models to Predict Dropout - Feature optimization highlighted F6 as the best predictive set of features.
| Features | ML Model Type | Testing to Training Ratio | Accuracy | Sensitivity | Specificity | Precision | AUC-ROC |
| F3 | Logistic | 0.4 | 0.841 | 0.72 | 0.9 | 0.78 | 0.89 |
| 0.25 | 0.845 | 0.71 | 0.91 | 0.81 | 0.88 | ||
| 0.1 | 0.871 | 0.77 | 0.92 | 0.83 | 0.9 | ||
| Decision Tree | 0.4 | 0.84 | 0.69 | 0.91 | 0.8 | 0.89 | |
| 0.25 | 0.84 | 0.67 | 0.92 | 0.82 | 0.88 | ||
| 0.1 | 0.86 | 0.69 | 0.94 | 0.86 | 0.89 | ||
| Random Forest | 0.4 | 0.84 | 0.77 | 0.87 | 0.75 | 0.89 | |
| 0.25 | 0.84 | 0.76 | 0.88 | 0.76 | 0.88 | ||
| 0.1 | 0.86 | 0.8 | 0.89 | 0.79 | 0.9 | ||
| F5 | Logistic | 0.4 | 0.842 | 0.72 | 0.9 | 0.79 | 0.89 |
| 0.25 | 0.845 | 0.72 | 0.91 | 0.8 | 0.89 | ||
| 0.1 | 0.864 | 0.75 | 0.92 | 0.83 | 0.9 | ||
| Decision Tree | 0.4 | 0.83 | 0.69 | 0.91 | 0.78 | 0.91 | |
| 0.25 | 0.83 | 0.67 | 0.91 | 0.8 | 0.89 | ||
| 0.1 | 0.85 | 0.73 | 0.91 | 0.8 | 0.9 | ||
| Random Forest | 0.4 | 0.84 | 0.77 | 0.87 | 0.75 | 0.89 | |
| 0.25 | 0.84 | 0.76 | 0.88 | 0.77 | 0.89 | ||
| 0.1 | 0.86 | 0.79 | 0.89 | 0.78 | 0.9 | ||
| F6 | Logistic | 0.4 | 0.846 | 0.73 | 0.91 | 0.79 | 0.89 |
| 0.25 | 0.844 | 0.72 | 0.91 | 0.8 | 0.89 | ||
| 0.1 | 0.876 | 0.76 | 0.93 | 0.85 | 0.9 | ||
| Decision Tree | 0.4 | 0.83 | 0.68 | 0.91 | 0.78 | 0.91 | |
| 0.25 | 0.82 | 0.67 | 0.9 | 0.78 | 0.89 | ||
| 0.1 | 0.86 | 0.71 | 0.93 | 0.83 | 0.9 | ||
| Random Forest | 0.4 | 0.84 | 0.77 | 0.88 | 0.76 | 0.9 | |
| 0.25 | 0.84 | 0.76 | 0.88 | 0.76 | 0.89 | ||
| 0.1 | 0.86 | 0.8 | 0.89 | 0.78 | 0.9 |
Table 5.
Grid Search Optimized Model.
| ML Model Type | Accuracy | Sensitivity | Specificity | Precision | AUC-ROC |
| (macro) | (macro) | (macro) | (macro) | (macro) | |
| Logistic | 0.84 | 0.72 | 0.91 | 0.8 | 0.89 |
| Decision Tree | 0.84 | 0.71 | 0.91 | 0.8 | 0.88 |
| Random Forest | 0.85 | 0.72 | 0.92 | 0.82 | 0.89 |
| XGBoost | 0.84 | 0.78 | 0.87 | 0.76 | 0.89 |
| ANN | 0.84 | 0.68 | 0.92 | 0.82 | 0.89 |
| KNN | 0.82 | 0.65 | 0.91 | 0.79 | 0.85 |
| SVM | 0.84 | 0.68 | 0.92 | 0.81 | 0.88 |
Table 6.
Grid Search Optimized Model for Three-Class Classification .
| ML Model Type | Accuracy | Sensitivity | Specificity | Precision | AUC-ROC |
| (macro) | (macro) | (macro) | (macro) | ||
| Logistic | 0.72 | 0.59 | 0.84 | 0.63 | 0.83 |
| Decision Tree | 0.73 | 0.65 | 0.85 | 0.67 | 0.82 |
| Random Forest | 0.74 | 0.74 | 0.85 | 0.72 | 0.85 |
| XGBoost | 0.72 | 0.72 | 0.86 | 0.73 | 0.85 |
| ANN | 0.72 | 0.61 | 0.84 | 0.67 | 0.83 |
| KNN | 0.72 | 0.63 | 0.84 | 0.67 | 0.82 |
| SVM | 0.72 | 0.61 | 0.84 | 0.67 | 0.83 |
Disclaimer/Publisher’s Note: The statements, opinions and data contained in all publications are solely those of the individual author(s) and contributor(s) and not of MDPI and/or the editor(s). MDPI and/or the editor(s) disclaim responsibility for any injury to people or property resulting from any ideas, methods, instructions or products referred to in the content. |
© 2025 by the authors. Licensee MDPI, Basel, Switzerland. This article is an open access article distributed under the terms and conditions of the Creative Commons Attribution (CC BY) license (http://creativecommons.org/licenses/by/4.0/).
Copyright: This open access article is published under a Creative Commons CC BY 4.0 license, which permit the free download, distribution, and reuse, provided that the author and preprint are cited in any reuse.


