Submitted:
05 September 2025
Posted:
05 September 2025
You are already at the latest version
Preprints on COVID-19 and SARS-CoV-2
Abstract
Coagulation, although primarily regulated by platelets, endothelial cells, and clotting factors, can also be influenced by molecules that are not traditionally seen as related to coagulation, including cytokines, hormones, metabolites, reactive oxygen species, acute phase reactants, and more. Here, we derive pseudoserum or clotting factor-depleted fractions from control, type II diabetes mellitus, and Long COVID platelet-poor plasma (PPP) samples, and expose them to purified, exogenous fibrinogen obtained from healthy donors. Thrombin-induced fibrin networks were then formed and visualized using light and scanning electron microscopy. The results demonstrate that pseudoserum can greatly influence the organisation, density, and ultrastructure of fibrin networks formed from purified fibrinogen, emphasizing the role of non-clotting factors in fibrin formation. Fibrin networks formed from purified fibrinogen exposed to control pseudoserum appear homogeneous, exhibiting organized architecture with few regions of unusual density or aggregates, whereas the networks formed using patient pseudoserum show disorganisation, regions of density, fibre-like strands, and anomalous aggregates. These abnormalities are also observed in patient PPP samples, suggesting that fibrin network characteristics in PPP samples are also significantly influenced by non-clotting factors and are somewhat independent of endogenous fibrinogen. The ability of pseudoserum to drive these changes, despite the absence of endogenous fibrinogen and other classical clotting factors, suggests that soluble molecules retained in pseudoserum can directly modify fibrinogen’s structural conformation and functionality, influence thrombin-mediated fibrin formation and polymerization, and/or impact Factor XIII’s crosslinking capabilities. This study provides a systems-level perspective on the influence of pseudoserum on fibrin networks and highlights the potential of serum and other clotting factor–depleted fractions to yield deeper mechanistic and diagnostic insights into coagulation.
Keywords:
coagulation
; fibrin(ogen)
; pseudoserum
; Type 2 Diabetes Mellitus
; long COVID
INTRODUCTION
Coagulation is primarily regulated by platelets, endothelial cells, and clotting factors, as well as various enzymatic and non-enzymatic components [1]. Central to this cascade is fibrinogen, a 340 kDa soluble glycoprotein synthesized by the liver. Upon vascular injury, fibrinogen is cleaved by thrombin to form fibrin monomers, which spontaneously polymerize into insoluble fibrin fibres, forming a structural scaffold that stabilizes the platelet plug at the injury site [2,3]. The fibrin network is then degraded by plasmin, a serine protease responsible for clot dissolution [4]. The kinetics of coagulation as well as the architecture and mechanical properties of fibrin networks – including fibre thickness, branching, pore size, and susceptibility to lysis – are dynamically modulated by the functionality and concentrations of various factors within the coagulation cascade [5,6], and variations within these parameters influence cardiovascular risk [7].
Studying blood in its derivative states, including platelet-rich plasma (PRP), platelet-poor plasma (PPP), and serum, enables investigation of how each fraction and their components influence coagulation processes and clot characteristics, especially across disease cohorts [8]. Serum is defined as plasma depleted of clotting factors, and contains a wide variety of molecules including metabolites (lipids, carbohydrates, and amino acids), plasma proteins (enzymes, albumin, immunoglobulins, cytokines, and complement proteins), hormones, waste products, vitamins, and ions [9,10].
Due to the fact that serum mostly lacks fibrinogen and other clotting factors, and hence cannot coagulate, serum is typically viewed to lack clinical utility in the context of coagulation. However, certain components of serum, although not primarily related to coagulation, have been shown to modulate clotting processes and fibrin networks [11,12,13,14,15,16]. A number of these molecules, including proinflammatory cytokines [17], serum amyloid A [12], reactive species [18], hormones [19,20], and sugars [21], can directly interact with and alter the structure and function of fibrinogen, which can influence resulting clot networks, including fibre thickness, pore size, and resistance to fibrinolysis [13,20,22,23]. These findings suggest that serum, although devoid of functional clotting factors, might have clinically relevant effects in the context of the coagulation system.
While many of the aforementioned studies have involved exposing said molecule(s) to purified fibrinogen or blood, the impact of the serum milieu as a composite entity on clotting kinetics, fibrin ultrastructure, and fibrinolysis remains underexplored. This study aims to investigate the impact of exposing purified, exogenous fibrinogen to serum derived from control and patient plasma samples, technically termed pseudoserum [24], with a focus on the resulting fibrin network and ultrastructure. Due to the availability of stored plasma samples from type II diabetes mellitus (T2DM) and Long COVID cohorts, these two pathologies are used as disease models in this study.
By challenging purified fibrinogen with pseudoserum that is stripped of endogenous platelets, soluble fibrinogen, and other clotting factors, we isolate how disease-conditioned serum shapes fibrin ultrastructure. This serum-centric readout opens a window beyond routine coagulation tests. The result is a sharper mechanistic map of milieu-driven clot remodelling and a route to serum-based biomarkers for thrombotic risk stratification.
METHODS
Ethical clearance
Ethical clearance was granted by the Health Research Ethics Council (HREC) of Stellenbosch University, South Africa. This study (project ID: #31384) made use of anonymous samples collected under the Stellenbosch University Blood Laboratory Biorepository (project ID: #28804). All Biorepository samples were obtained with voluntary informed consent, including consent for storage and future use in approved studies. All research protocols were conducted in accordance with the Declaration of Helsinki, the South African Guidelines for Good Clinical Practice, and the Ethical Guidelines for Research issued by the South African Medical Research Council.
Sample Cohorts and Collection
In this study, 11 healthy control, 13 Long COVID, and 10 T2DM samples were used to constitute the study cohorts. Healthy control individuals were included if they were without disease, did not smoke, were not using anticoagulant, antiplatelet, or anti-inflammatory medication, and had not reported a known infection and/or received a vaccination within a month of sample collection. Long COVID participants, who were diagnosed by a medical professional, were excluded if they had coagulopathy or were taking anticoagulant drugs, were symptomatic for or recovering from an infection, and received a vaccination within a month of sample collection. For patients to have been diagnosed with Long COVID, symptom onset must have occurred following acute COVID-19 infection and persist for more than 3 months. Symptoms included in the diagnostic assessment of patients included brain fog, chronic fatigue, post-exertional malaise, joint and muscle pain, gastrointestinal issues, dyspnoea, and sleep disturbances. T2DM participants were excluded if they were diagnosed with Long COVID and had reported a known infection and/or received a vaccination within a month of sample collection. Table 1 shows the demographics and co-morbidities of the sample cohorts.
Stored PPP samples were used for this study, all of which had not yet been thawed. Blood samples were collected by a qualified medical professional in sodium citrate blood tubes (3.2%; BD Vacutainer®: 369714) and centrifuged at 3000g for 15 minutes at room temperature. The PPP were carefully collected, aliquoted into 1.5mL microcentrifuge tubes, and stored at -80ºC until further use.
Fibrin Network Formation of PPP Samples
PPP fibrin networks were formed using 3µL of PPP exposed to half volume thrombin (obtained from the South African National Blood Service at a stock concentration of 20 U/ml) and left to stand for 1 minute to form fibrin networks before placing a coverslip on the microscope slide. The sample was then viewed using the brightfield mode of the Zeiss Axio Observer 7 microscope with a Plan-Apochromat 63×/1.4 Oil DIC M27 objective (Carl Zeiss Microscopy, Munich, Germany).
Thromboelastography (TEG®) of PPP Samples, and Obtainment of Pseudoserum
Coagulation was induced in PPP samples in order to obtain pseudoserum, which represents a fraction depleted of fibrinogen and other clotting factors, mimicking serum as obtained from serum-collecting tubes. Pseudoserum was obtained via thromboelastography (TEG®). 340µL of PPP was exposed to 20µL of 0.01M calcium chloride in the TEG® cup. The test was promptly started, and completed once the maximum amplitude of clot production was achieved. Importantly, the collection of the pseudoserum occurred immediately once the maximum amplitude value was registered, in order to avoid fibrinolysis and the accumulation of fibrin degradation products in pseudoserum samples. The clot was carefully removed and pseudoserum collected in a microcentrifuge tube.
Fibrin Networks of Purified Fibrinogen Exposed to Pseudoserum: Light Microscopy
The collected pseudoserum from the TEG® cup post-test was exposed to 4.3mg/mL purified human fibrinogen (ThermoFisher Scientific: RP43142). 10µL of purified fibrinogen was exposed to 5µL of pseudoserum (final concentration of 2.87mg/mL), and left to incubate for 30 minutes. 3µL of the incubated sample was pipetted onto a microscope slide and then exposed to 1.5µL of purified human thrombin at the same concentration and left to rest for 1 minute to form fibrin networks. A coverslip was then placed on the sample, which was then viewed using the brightfield mode of the Zeiss Axio Observer 7 microscope. Pseudoserum was also exposed to half volume of exogenous thrombin to assess for the absence of fibrin networks and hence depletion of fibrinogen and other clotting factors during the TEG® experiment.
Thioflavin T Staining of Pseudoserum and Fibrin Networks
Pseudoserum samples were stained with thioflavin T (ThT), a fluorogenic amyloid probe used to detect fibrinaloid microclot complexes, at a final concentration of 5µM and left to incubate for 30 minutes. Samples were viewed using both the brightfield and fluorescence modes of the Zeiss Axio Observer 7 microscope with the excitation and emission wavelengths set at 450 - 488 nm and 499 - 529 nm, respectively. We also assessed whether the fibrin networks formed from purified fibrinogen exposed to pseudoserum stained positive for ThT. After fibrin formation on microscope slides, a ThT solution of 5µM was pipetted onto the fibrin networks and then washed twice with PBS, and viewed on the Zeiss Axio Observer 7 microscope. No ThT signal was apparent in these fibrin networks and hence such micrographs are not included here.
Fibrin Networks of Purified Fibrinogen Exposed to Pseudoserum: Scanning Electron Microscopy
In addition to using the Zeiss Axio Observer 7 to visualize fibrin networks formed from fibrinogen exposed to pseudoserum, 5 samples from each cohort were subject to scanning electron microscopy (SEM) to enable optimal study of fibrin ultrastructure. Fibrin networks were induced from purified fibrinogen exposed to pseudoserum and exogenous thrombin as previously described, but prepared on round glass coverslips. After a minute of allowing clot networks to form, the samples were transferred into 24-well plates and washed with PBS. The washed fibrin networks were then exposed to 4% paraformaldehyde and left to incubate for 30 minutes. The samples were washed three times with PBS before being fixed with 1% osmium tetroxide for 30 minutes. The samples were again washed three times with PBS and then dehydrated with increasing concentrations of ethanol, specifically 30%, 50%, 70%, 90%, and 100%. 1% hexamethyldisilazane (HMDS) (Sigma-Aldrich, 379212) (>99% purity) was added as the terminal dehydrating agent for 30 minutes. The coverslips were carefully lifted to prevent adhesion to the plate surface during HMDS exposure. The samples were then removed from each well and placed onto a glass microscope slide for carbon coating and SEM analysis using a Zeiss MERLINTM field emission scanning microscope. Micrographs were obtained using the InLens at 1kV. A depiction of the methodology carried out in this study is contained in Figure 1.
Statistical Analysis
All data were processed using GraphPad Prism (version 10.2.3). The Shapiro-Wilk test was used to test for normality. Statistical significance was determined using the Kruskall-Wallis test for nonparametric data, and the Brown-Forsythe and Welch tests for parametric data. Outliers were identified using the ROUT test with a Q value of 1%. Statistical significance was determined at p < 0.05. Significance levels are indicated by asterisks (* = p < 0.05, ** = p < 0.01, *** = p < 0.001, and **** = p < 0.0001). Parametric data are presented as mean ± standard deviation (SD) and nonparametric data represented as median [range].
RESULTS
Thrombin-Induced PPP Fibrin Networks
PPP samples were exposed to thrombin in order to assess naïve fibrin networks of participants (Figure 2). There are clear morphological distinctions between control and disease fibrin networks, with the latter showing enhanced density and disorganisation, dense granular regions, fibre thickness, and anomalous deposits. The control fibrin clots, in contrast, exhibit structural uniformity, almost lack regions of granular densities, and exhibit notable pore sizes and sparsely arranged networks.
Thromboelastography (TEG®)
PPP samples were analysed with thromboelastography (Table 1) which assesses almost the entire coagulation cascade in context of clotting factors (without platelets), encompassing clotting kinetics and clot size and strength. Four of the six parameters – R, α-angle, maximum rate to thrombus generation (MRTG), and time to MRTG (TMRTG) – are informative of clotting kinetics, whereas maximum amplitude (MA) and total thrombus generation (TTG) refers to clot strength and amount generated, respectively. The only statistically significant differences that exist between groups are those involving the R and TMRTG parameters, where the T2DM and Long COVID groups both exhibited significant reductions in clotting times [25,26]. These data emphasize greater clotting kinetics and highlight a degree of hypercoagulability within the disease groups, at least in the context of these two parameters. An outlier within each of the R and TMRTG assessments was removed from the analyses to prevent skewing of data, both from the T2DM group, therefore establishing a sample size of nine (n=9) for the T2DM cohort for these two parameters. TEG® analyses thus confirmed altered clotting kinetics in patient groups.
Pseudoserum Exposed to Thrombin
To confirm fibrinogen depletion, pseudoserum samples were exposed to thrombin. No fibrin networks formed (Figure 3), validating that endogenous fibrinogen has been all or mostly depleted. This validation step ensures that the fibrin networks formed in the following experiments where purified fibrinogen is exposed to pseudoserum are synthesized from exogenous, healthy fibrinogen and not endogenous, participant fibrinogen. This ensures effective comparison and experimental rigour when assessing how pseudoserum affects purified fibrinogen and resulting fibrin networks. It is important to state that although it appears that all or most of the fibrinogen has been depleted in the pseudoserum samples, there might still exist low levels of other clotting factors upstream in coagulation cascade. Indeed, the TEG® activates a variety of clotting factors in PPP samples, but it does not typically exhaust the clotting factor pool. Studies investigating other modes of fibrin synthesis where coagulation induction precedes thrombin-mediated conversion of fibrinogen to fibrin should keep this in mind.
Additionally, some but not all of the aggregates in the collected pseudoserum samples stained positive with ThT, which likely represent fibrinaloid microclot complexes. It must be noted that the prevalence of these complexes is much less in pseudoserum samples than usually observed in PPP samples, in both modern control and disease populations [27,28,29,30]. The aggregates can also be remnants of fibrin from the TEG® experiments, other protein aggregates, and cellular debris. Although these aggregates are not the primary focus of this study, further investigation into their presence and impact in both pseudoserum and serum samples is warranted – particularly in disease states, due to the greater prevalence of these aggregates observed in the patient cohorts.
Fibrin Networks of Purified Fibrinogen Exposed to Pseudoserum
In order to assess the effects that pseudoserum samples from healthy and diseased cohorts have on fibrin network structure, exogenous thrombin was exposed to purified fibrinogen incubated with pseudoserum. The resulting fibrin networks were visualized with light microscopy (Figure 4) and SEM (Figure 5). Control pseudoserum produced sparse, organised networks, while Long COVID and T2DM pseudoserum yielded dense, disorganised fibrin networks with anomalous aggregates and fibre-like strands. Scanning electron microscopy confirmed these ultrastructural abnormalities, emphasizing increased fibre density resulting from patient-derived pseudoserum. Direct comparison of fibrin networks formed from naïve PPP and purified fibrinogen exposed to pseudoserum showed similar pathological features in disease groups (Figure 6). This suggests that serum-derived factors are sufficient to reproduce many of the morphological and structural abnormalities seen in PPP fibrin networks, even in the absence of endogenous fibrinogen and platelets. This highlights that the state of naïve PPP fibrin networks can be somewhat mimicked by exposing pseudoserum to healthy, purified fibrinogen, thereby emphasizing the role of serum components (non-clotting factors) in fibrin formation.
Fibrin networks were also stained with ThT to assess amyloid areas in fibres and also to determine if fibrinaloid microclot complexes are structurally associated or embedded within the fibrin networks. However, no signal was observed within fibrin fibres or networks. Hence it seems that pseudoserum exposure to purified fibrinogen did not result in noticeable amyloid or fibrinaloid microclot complexes that are embedded in and structurally associated with the induced fibrin network. While no signal was observed within the fibrin network, there were some ThT-positive aggregates that appeared on top, under, and next to the networks, which we propose represent those already present in pseudoserum (Figure 3).
DISCUSSION
Coagulation is traditionally viewed as a process driven by platelets, endothelial cells, and clotting factors. However, a growing body of evidence shows that other plasma constituents, including inflammatory mediators, acute-phase proteins, hormones, and metabolic by-products, can also influence fibrin polymerisation and network architecture [12,15,16,19,21,22,31,32]. Despite these insights, the composite effect of serum as a whole on fibrin structure has remained underexplored. This study therefore investigated the impact of pseudoserum, or clotting factor–depleted plasma, obtained following TEG® analysis, on fibrin networks formed from purified fibrinogen.
Our results here demonstrate that pseudoserum can significantly influence fibrin formation, network morphology, and ultrastructure. Purified fibrinogen exposed to pseudoserum from T2DM and Long COVID patients produced dense, disorganised fibrin networks with anomalous aggregates, closely resembling the abnormalities observed in naïve PPP fibrin clots from the same cohorts (Figure 2, Figure 4, Figure 5 & Figure 6). The SEM analysis revealed comparatively significant ultrastructural characteristics, particularly notable fibrin density resulting from patient pseudoserum. In contrast, control pseudoserum yielded sparse, well-organised networks. Building on previous research, this study is among the first to examine pseudoserum as a composite milieu acting on fibrinogen and fibrin networks, extending previous molecule-specific studies to a systems-level perspective [33,34,35,36].
The mechanisms underlying these effects are likely multifactorial. Metabolic control analysis indicates that the flux through any biochemical pathway can be altered by any and all of the molecules that are present [37,38,39], and so it is to be expected that molecular clotting pathways can equally be so influenced. In this sense the clotting process can be seen as an integrator of plasma biochemistry. Proinflammatory cytokines such as IL-1β, IL-6, and IL-8 [15,40,41], hormonal factors including estradiol [19,20,22], and post-translational modifications of fibrinogen such as oxidation, glycation, and citrullination [21,31,32], have all been implicated in altering clotting kinetics, fibrin structure, and fibrinolytic susceptibility. In this particular study, pseudoserum may be expected to exert its effects at several levels, for instance by directly modifying fibrinogen conformation, by influencing thrombin-mediated cleavage, and/or by influencing crosslinking by Factor XIII. Disentangling these pathways will require targeted mechanistic studies of these dynamic divisions of fibrin formation.
Additionally, exposing pseudoserum to purified fibrinogen did not result in the formation of ThT-positive aggregates incorporated within fibrin networks. Instead, the aggregates already present in pseudoserum appeared excluded from further fibrin polymerization, even in the presence of exogenous fibrinogen and thrombin (Figure 3). Although this was evident from microscopy imaging, additional molecular-level experimentation will be needed to clarify the mechanisms underlying this exclusion. It is also notable that many aggregates in pseudoserum did not stain with ThT, suggesting the presence of a distinct non-amyloid fraction that still appears more prevalent in disease groups.
Our earlier work, prior to 2019, using SEM, demonstrated that when thrombin was added to plasma from patients with inflammatory conditions like T2DM, rheumatoid arthritis, Parkinson’s and Alzheimer’s disease, fibrin networks formed dense matted deposits [42,43,44, 45]. The same phenomenon was seen when LPS, LTA, and spike protein were added to either purified fibrinogen or plasma from healthy individuals [46,47]. When ThT was added to plasma prior to the addition of thrombin, we also observed amyloid deposits by fluorescence microscopy, although at that stage we did not establish that the amyloid signal was structurally integrated within the dense matted deposits themselves. In addition, In 2020, we reported that even without thrombin circulating deposits that bound ThT could be observed [30], suggesting spontaneous amyloidogenic activity. Here, in our pseudoserum study, we found that fibres formed by adding patient pseudoserum to purified fibrinogen retained a dense matted appearance, but these structures did not stain with ThT and were therefore not amyloid. This distinction suggests that some amyloid deposits represent insoluble fibrinogen that has misfolded into amyloid and become associated with pathological cellular debris and neutrophil extracellular traps (NETs), forming what we now define as fibrinaloid microclot complexes. In contrast, residual soluble fibrinogen in circulation may still polymerize into dense matted fibrin fibres that are structurally abnormal but not amyloid. Together, these findings reveal two distinct but co-existing pathological processes: (1) pre-formed amyloidogenic deposits in circulation, and (2) soluble fibrinogen that polymerizes into non-amyloid dense matted fibrin fibres.
By showing that patient pseudoserum can reproduce PPP fibrin abnormalities in the absence of endogenous fibrinogen, our findings strengthen the concept that non-clotting molecules in plasma are nonetheless powerful modulators of coagulation. This aligns with reports linking inflammatory mediators, acute-phase reactants, and metabolic products to dysregulated fibrin formation and reduced fibrinolysis, but extends these insights to a systems-level perspective. Importantly, this line of research highlights pseudoserum and other clotting factor-depleted fractions as valuable tools to identify novel serum-derived biomarkers and to improve risk stratification for coagulation disorders across diverse patient groups. While serum may only serve as a secondary point of assessment, complementing established measures such as clotting factors and D-dimer, it nonetheless offers a unique window into how circulating molecules outside the classical clotting cascade can shape fibrin architecture.
CONCLUSION AND FUTURE DIRECTIONS
Here, we show that pseudoserum obtained post TEG® analysis of PPP from two disease populations – Long COVID and T2DM – that was then exposed to purified fibrinogen results in noticeable and aberrant fibrin characteristics, and that similar fibrin abnormalities exist in naïve PPP samples exposed to thrombin. The ability of pseudoserum to drive these changes, despite the absence of fibrinogen and other clotting factors, emphasizes that soluble molecules retained in pseudoserum can modulate the coagulation process.
Future studies should broaden the scope of this assessment by including additional disease populations, particularly those with known or suspected coagulopathies. Comparative analyses across diverse patient cohorts may help uncover shared or unique serum-derived influences on fibrin networks, and could lead to the characterization of serum biomarkers associated with coagulopathy. Deriving further serum sub-fractions, such as exosome-depleted, immunoglobulin-depleted, lipid-depleted, or protein-specific isolates, or even individual metabolites and drugs, may help identify the components in question. Additionally, assessing fibrinolysis in this context of pseudoserum/serum-exposed fibrinogen is also of interest, to determine if serum can also influence fibrinolytic resistance.
Together, these data reposition pseudoserum and other clotting-factor–depleted fractions as a practical model to study serum-driven influences on fibrin architecture, expanding the biology of fibrin modulation and flagging serum-based assays as promising adjunct diagnostic and prognostic tools for coagulopathies.
Author Contributions
M.N.: Wrote and conceptualized the paper. A.K.: Clinician input; E.P.: Edited the paper, funding, co-corresponding author; study leader. B.F.: Editing of manuscript; D.B.K.: Editing of manuscript. All authors have read and agreed to the published this version of the manuscript.
Acknowledgements and Funding
M.N. thanks Kanro Foundation, E.P. thanks PolyBio Research Foundation, Balvi Foundation and Kanro Foundation for funding. The content and findings reported and illustrated are the sole deduction, view and responsibility of the researchers and do not reflect the official position and sentiments of the funders. The funders had no role in study design, data collection and analysis, decision to publish, or preparation of the manuscript.
Conflicts of Interest
The authors declare no conflict of interest.
References
- S. Palta, R. Saroa, A. Palta, Overview of the coagulation system, Indian Journal of Anaesthesia 58(5) (2014).
- S. Kattula, J.R. Byrnes, A.S. Wolberg, Fibrinogen and fibrin in hemostasis and thrombosis, Arteriosclerosis, thrombosis, and vascular biology 37(3) (2017) e13-e21. [CrossRef]
- R.I. Litvinov, M. Pieters, Z. de Lange-Loots, J.W. Weisel, Fibrinogen and Fibrin, in: J.R. Harris, J. Marles-Wright (Eds.), Macromolecular Protein Complexes III: Structure and Function, Springer International Publishing, Cham, 2021, pp. 471-501.
- C. Longstaff, K. Kolev, Basic mechanisms and regulation of fibrinolysis, Journal of Thrombosis and Haemostasis 13(S1) (2015) S98-S105. [CrossRef]
- S.T. Lord, Molecular mechanisms affecting fibrin structure and stability, Arteriosclerosis, thrombosis, and vascular biology 31(3) (2011) 494-499. [CrossRef]
- J.W. Weisel, R.I. Litvinov, Fibrin formation, structure and properties, Fibrous proteins: structures and mechanisms (2017) 405-456.
- M. Ząbczyk, R.A.S. Ariëns, A. Undas, Fibrin clot properties in cardiovascular disease: from basic mechanisms to clinical practice, Cardiovascular Research 119(1) (2023) 94-111. [CrossRef]
- S. Bloemen, D. Huskens, J. Konings, R.M. Kremers, A. Miszta, B. de Laat, H. Kelchtermans, Interindividual Variability and Normal Ranges of Whole Blood and Plasma Thrombin Generation, The Journal of Applied Laboratory Medicine 2(2) (2017) 150-164. [CrossRef]
- W.B. Dunn, D. Broadhurst, P. Begley, E. Zelena, S. Francis-McIntyre, N. Anderson, M. Brown, J.D. Knowles, A. Halsall, J.N. Haselden, A.W. Nicholls, I.D. Wilson, D.B. Kell, R. Goodacre, Procedures for large-scale metabolic profiling of serum and plasma using gas chromatography and liquid chromatography coupled to mass spectrometry, Nat Protoc 6(7) (2011) 1060-83. [CrossRef]
- W.B. Dunn, W. Lin, D. Broadhurst, P. Begley, M. Brown, E. Zelena, A.A. Vaughan, A. Halsall, N. Harding, J.D. Knowles, S. Francis-McIntyre, A. Tseng, D.I. Ellis, S. O'Hagan, G. Aarons, B. Benjamin, S. Chew-Graham, C. Moseley, P. Potter, C.L. Winder, C. Potts, P. Thornton, C. McWhirter, M. Zubair, M. Pan, A. Burns, J.K. Cruickshank, G.C. Jayson, N. Purandare, F.C. Wu, J.D. Finn, J.N. Haselden, A.W. Nicholls, I.D. Wilson, R. Goodacre, D.B. Kell, Molecular phenotyping of a UK population: defining the human serum metabolome, Metabolomics 11(1) (2015) 9-26. [CrossRef]
- M. Levi, Inflammation and Coagulation, Inflammation2017, pp. 833-860.
- M.J. Page, G.J. Thomson, J.M. Nunes, A.-M. Engelbrecht, T.A. Nell, W.J. De Villiers, M.C. De Beer, L. Engelbrecht, D.B. Kell, E. Pretorius, Serum amyloid A binds to fibrin (ogen), promoting fibrin amyloid formation, Scientific reports 9(1) (2019) 3102. [CrossRef]
- J.J. de Vries, C.J.M. Snoek, D.C. Rijken, M.P.M. de Maat, Effects of Post-Translational Modifications of Fibrinogen on Clot Formation, Clot Structure, and Fibrinolysis, Arteriosclerosis, Thrombosis, and Vascular Biology 40(3) (2020) 554-569.
- Z. Zhang, M. Rodriguez, Z. Zheng, Clot or Not? Reviewing the Reciprocal Regulation Between Lipids and Blood Clotting, Arteriosclerosis, Thrombosis, and Vascular Biology 44(3) (2024) 533-544. [CrossRef]
- J. Bester, C. Matshailwe, E. Pretorius, Simultaneous presence of hypercoagulation and increased clot lysis time due to IL-1β, IL-6 and IL-8, Cytokine 110 (2018) 237-242. [CrossRef]
- J.A. Fernández, H. Deguchi, D.J. Elias, J.H. Griffin, Serum amyloid A4 is a procoagulant apolipoprotein that it is elevated in venous thrombosis patients, Research and Practice in Thrombosis and Haemostasis 4(2) (2020) 217-223. [CrossRef]
- A. Sahni, M. Guo, S.K. Sahni, C.W. Francis, Interleukin-1β but not IL-1α binds to fibrinogen and fibrin and has enhanced activity in the bound form, Blood 104(2) (2004) 409-414. [CrossRef]
- M. Becatti, R. Marcucci, G. Bruschi, N. Taddei, D. Bani, A.M. Gori, B. Giusti, G.F. Gensini, R. Abbate, C. Fiorillo, Oxidative Modification of Fibrinogen Is Associated With Altered Function and Structure in the Subacute Phase of Myocardial Infarction, Arteriosclerosis, Thrombosis, and Vascular Biology 34(7) (2014) 1355-1361. [CrossRef]
- J.R. Coleman, E.E. Moore, L. Schmitt, K. Hansen, N. Dow, K. Freeman, M.J. Cohen, C.C. Silliman, Estradiol provokes hypercoagulability and affects fibrin biology: A mechanistic exploration of sex dimorphisms in coagulation, Journal of Trauma and Acute Care Surgery 94(2) (2023). [CrossRef]
- A.C. Swanepoel, A. Visagie, Z. de Lange, O. Emmerson, V.G. Nielsen, E. Pretorius, The clinical relevance of altered fibrinogen packaging in the presence of 17β-estradiol and progesterone, Thrombosis Research 146 (2016) 23-34. [CrossRef]
- F. Nencini, A. Bettiol, F.R. Argento, S. Borghi, E. Giurranna, G. Emmi, D. Prisco, N. Taddei, C. Fiorillo, M. Becatti, Post-translational modifications of fibrinogen: implications for clotting, fibrin structure and degradation, Molecular Biomedicine 5(1) (2024) 45. [CrossRef]
- G. Targher, I. Pichiri, G. Zoppini, E. Bonora, M. Chonchol, Hemostatic and fibrinolytic abnormalities in endocrine diseases: a narrative review, Seminars in thrombosis and hemostasis, © Thieme Medical Publishers, 2009, pp. 605-612. [CrossRef]
- J.J. de Vries, T. Hoppenbrouwers, C. Martinez-Torres, R. Majied, B. Özcan, M. van Hoek, F.W.G. Leebeek, D.C. Rijken, G.H. Koenderink, M.P.M. de Maat, Effects of Diabetes Mellitus on Fibrin Clot Structure and Mechanics in a Model of Acute Neutrophil Extracellular Traps (NETs) Formation, International Journal of Molecular Sciences 21(19) (2020) 7107. [CrossRef]
- P.E. Makris, E. Pithara, Clinical evaluation of new global clotting assay for monitoring of LMWH treatment: pilot study, Int Angiol 17(2) (1998) 69-79.
- B. Hu, L. Zhang, Z.-S. Zhao, Y.-C. Qi, W. Zhou, Y.-L. Ma, The predictive value of Thromboelastography (TEG) parameters in vascular complications in patients with type 2 diabetes mellitus, Journal of Diabetes and its Complications 36(8) (2022) 108236. [CrossRef]
- L. Pretorius, G.J.A. Thomson, R.C.M. Adams, T.A. Nell, W.A. Laubscher, E. Pretorius, Platelet activity and hypercoagulation in type 2 diabetes, Cardiovascular Diabetology 17(1) (2018) 141. [CrossRef]
- S. Turner, G.J. Laubscher, M.A. Khan, D.B. Kell, E. Pretorius, Accelerating discovery: A novel flow cytometric method for detecting fibrin (ogen) amyloid microclots using long COVID as a model, Heliyon 9(9) (2023). [CrossRef]
- C.F. Dalton, M.I. de Oliveira, P. Stafford, N. Peake, B. Kane, A. Higham, D. Singh, N. Jackson, H.E. Davies, D.A. Price, Increased fibrinaloid microclot counts in platelet-poor plasma are associated with Long COVID, medRxiv (2024) 2024.04. 04.24305318.
- A. Kruger, M. Vlok, S. Turner, C. Venter, G.J. Laubscher, D.B. Kell, E. Pretorius, Proteomics of fibrin amyloid microclots in long COVID/post-acute sequelae of COVID-19 (PASC) shows many entrapped pro-inflammatory molecules that may also contribute to a failed fibrinolytic system, Cardiovascular Diabetology 21(1) (2022) 190. [CrossRef]
- E. Pretorius, C. Venter, G.J. Laubscher, P.J. Lourens, J. Steenkamp, D.B. Kell, Prevalence of readily detected amyloid blood clots in ‘unclotted’Type 2 diabetes mellitus and COVID-19 plasma: a preliminary report, Cardiovascular Diabetology 19 (2020) 1-8. [CrossRef]
- J. Štikarová, R. Kotlín, T. Riedel, J. Suttnar, K. Pimková, L. Chrastinová, J.E. Dyr, The Effect of Reagents Mimicking Oxidative Stress on Fibrinogen Function, The Scientific World Journal 2013(1) (2013) 359621. [CrossRef]
- F. Nencini, E. Giurranna, S. Borghi, N. Taddei, C. Fiorillo, M. Becatti, Fibrinogen Oxidation and Thrombosis: Shaping Structure and Function, Antioxidants 14(4) (2025) 390. [CrossRef]
- M.F. Ruberto, S. Marongiu, T. Congiu, L. Barberini, M. Conti, C. Porcu, D.M. Ntoukas, G. Faa, F. Marongiu, D. Barcellona, The Hypercoagulable State: A Study of Clot Waveform Analysis, Thrombin Generation, and Clot Scanning Electron Microscopy, Archives of Pathology & Laboratory Medicine (2025). [CrossRef]
- O.M. Mereuta, S. Fitzgerald, T.A. Christensen, A.L. Jaspersen, D. Dai, M. Abbasi, T. Puttappa, R. Kadirvel, D.F. Kallmes, K.M. Doyle, W. Brinjikji, High-resolution scanning electron microscopy for the analysis of three-dimensional ultrastructure of clots in acute ischemic stroke, Journal of NeuroInterventional Surgery 13(10) (2021) 906-911. [CrossRef]
- L. Wolff-Trombini, A. Ceripa, J. Moreau, H. Galinat, C. James, N. Westbrook, J.-M. Allain, Microrheology and structural quantification of hypercoagulable clots, Biomed. Opt. Express 14(8) (2023) 4179-4189. [CrossRef]
- E. Pretorius, A.C. Swanepoel, S. DeVilliers, J. Bester, Blood clot parameters: Thromboelastography and scanning electron microscopy in research and clinical practice, Thrombosis research 154 (2017) 59-63. [CrossRef]
- D.A. Fell, Metabolic control analysis: a survey of its theoretical and experimental development, Biochemical Journal 286(2) (1992) 313-330. [CrossRef]
- H. Kacser, J.A. Burns, The control of flux, Symp Soc Exp Biol 27 (1973) 65-104.
- D.B. Kell, H.V. Westerhoff, Metabolic control theory: its role in microbiology and biotechnology, FEMS Microbiology Reviews 2(4) (1986) 305-320.
- J. Bester, E. Pretorius, Effects of IL-1β, IL-6 and IL-8 on erythrocytes, platelets and clot viscoelasticity, Scientific Reports 6(1) (2016) 32188. [CrossRef]
- S.Y. Wang, P. Adejumo, C. See, O.K. Onuma, E.J. Miller, E.S. Spatz, Characteristics of patients referred to a cardiovascular disease clinic for post-acute sequelae of SARS-CoV-2 infection, American Heart Journal Plus: Cardiology Research and Practice 18 (2022) 100176. [CrossRef]
- E. Pretorius, J. Bester, N. Vermeulen, S. Alummoottil, P. Soma, A.V. Buys, D.B. Kell, Poorly controlled type 2 diabetes is accompanied by significant morphological and ultrastructural changes in both erythrocytes and in thrombin-generated fibrin: implications for diagnostics, Cardiovascular Diabetology 14(1) (2015) 30. [CrossRef]
- E. Pretorius, H.M. Oberholzer, W.J. van der Spuy, A.C. Swanepoel, P. Soma, Scanning electron microscopy of fibrin networks in rheumatoid arthritis: a qualitative analysis, Rheumatology international 32(6) (2012) 1611-1615. [CrossRef]
- G.M. De Waal, L. Engelbrecht, T. Davis, W.J. De Villiers, D.B. Kell, E. Pretorius, Correlative Light-Electron Microscopy detects lipopolysaccharide and its association with fibrin fibres in Parkinson’s Disease, Alzheimer’s Disease and Type 2 Diabetes Mellitus, Scientific reports 8(1) (2018) 16798. [CrossRef]
- E. Pretorius, J. Bester, M.J. Page, D.B. Kell, The potential of LPS-binding protein to reverse amyloid formation in plasma fibrin of individuals with Alzheimer-type dementia, Frontiers in aging neuroscience 10 (2018) 257. [CrossRef]
- E. Pretorius, M.J. Page, L. Hendricks, N.B. Nkosi, S.R. Benson, D.B. Kell, Both lipopolysaccharide and lipoteichoic acids potently induce anomalous fibrin amyloid formation: assessment with novel Amytracker™ stains, Journal of The Royal Society Interface 15(139) (2018) 20170941. [CrossRef]
- L.M. Grobbelaar, C. Venter, M. Vlok, M. Ngoepe, G.J. Laubscher, P.J. Lourens, J. Steenkamp, D.B. Kell, E. Pretorius, SARS-CoV-2 spike protein S1 induces fibrin (ogen) resistant to fibrinolysis: implications for microclot formation in COVID-19, Bioscience reports 41(8) (2021) BSR20210611. [CrossRef]
Figure 1.
Depiction of the methodology carried out in the present study. PPP samples, after exposing to thrombin and forming naïve fibrin networks, were subjected to TEG® analyses. The resulting pseudoserum was collected, and exposed to thrombin to confirm the depletion of fibrinogen. Next, pseudoserum samples were incubated with purified, exogenous fibrinogen obtained from healthy donors, and exposed to thrombin to form fibrin networks. Morphological analyses were conducted using light, fluorescence and scanning electron microscopy.
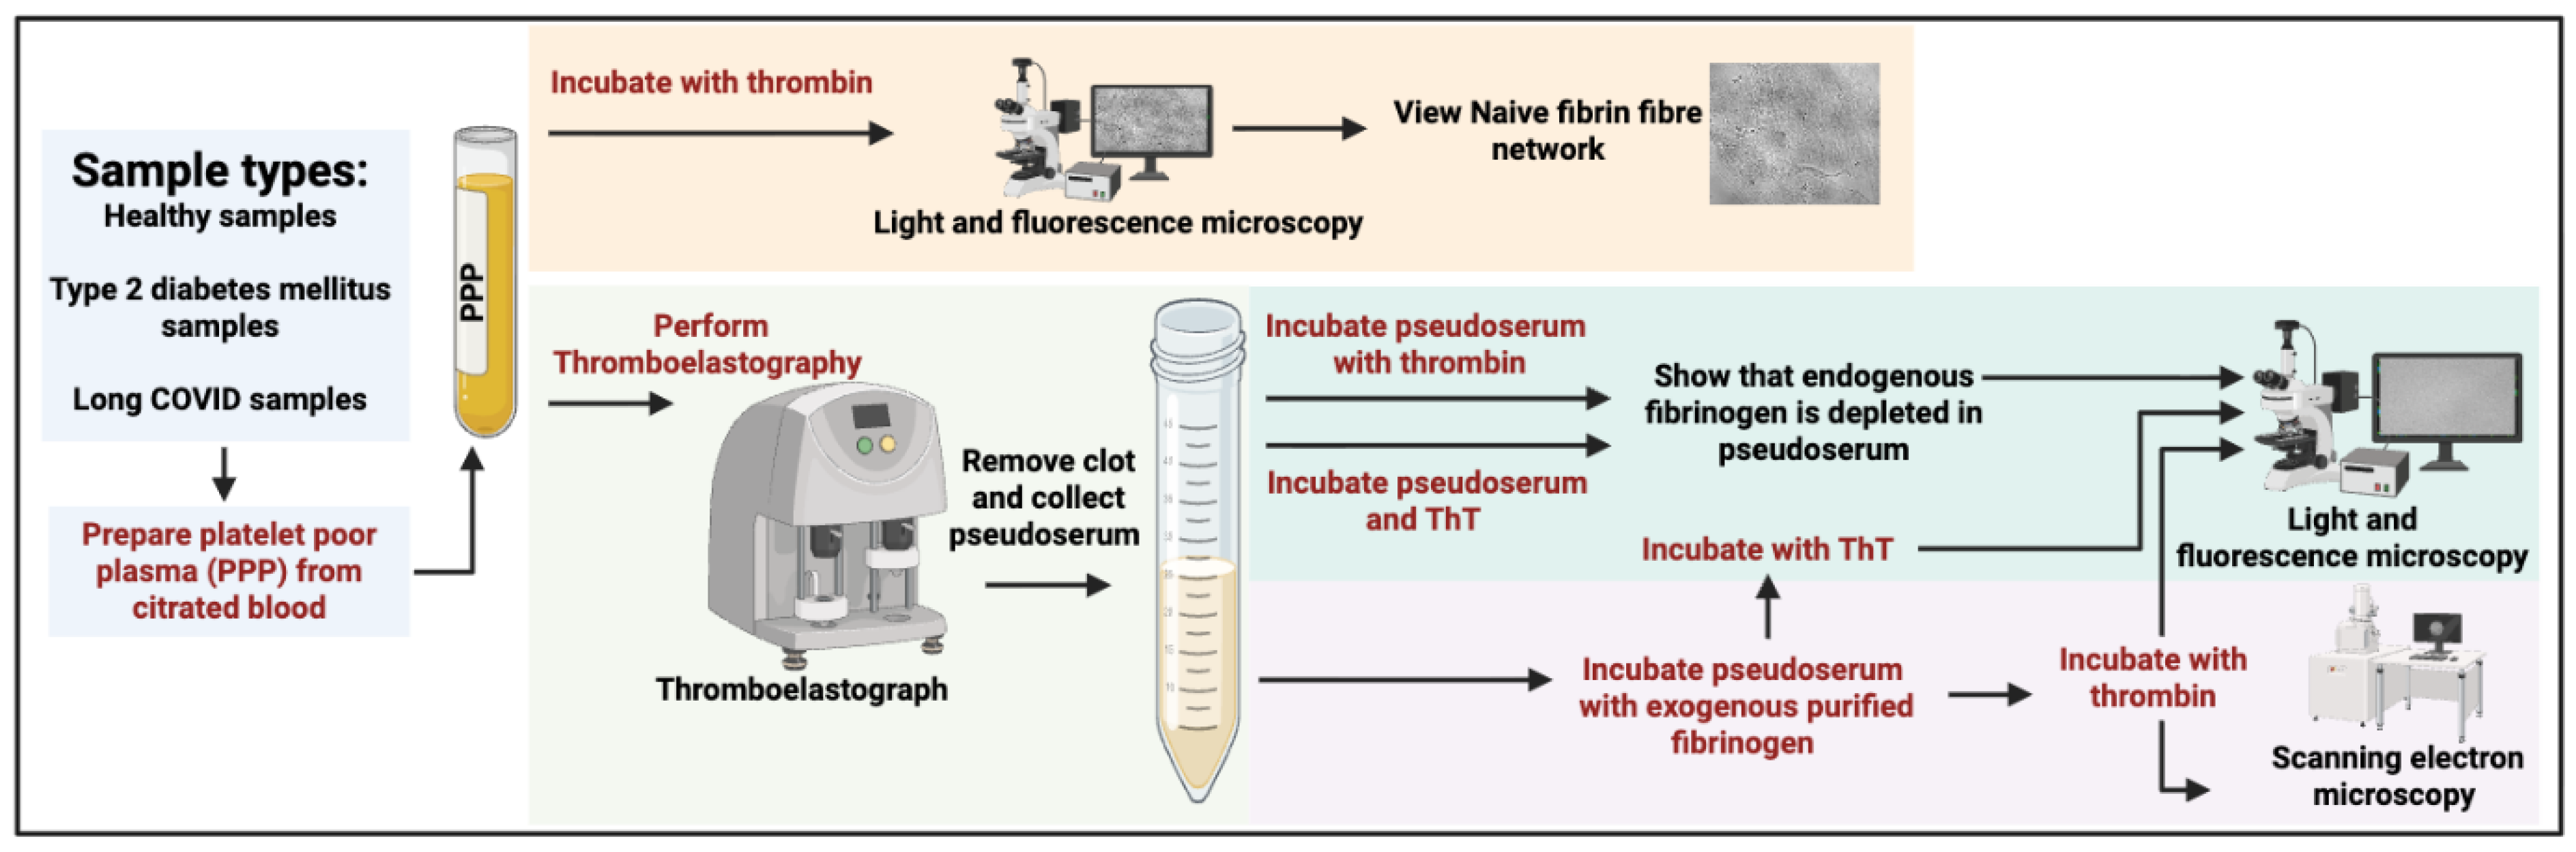
Figure 2.
Micrographs of PPP fibrin networks using light microscopy. All micrographs within a row represent different participants within a cohort. Images were obtained at 63X magnification using the brightfield mode of the Zeiss Axio Observer 7 microscope.
Figure 2.
Micrographs of PPP fibrin networks using light microscopy. All micrographs within a row represent different participants within a cohort. Images were obtained at 63X magnification using the brightfield mode of the Zeiss Axio Observer 7 microscope.
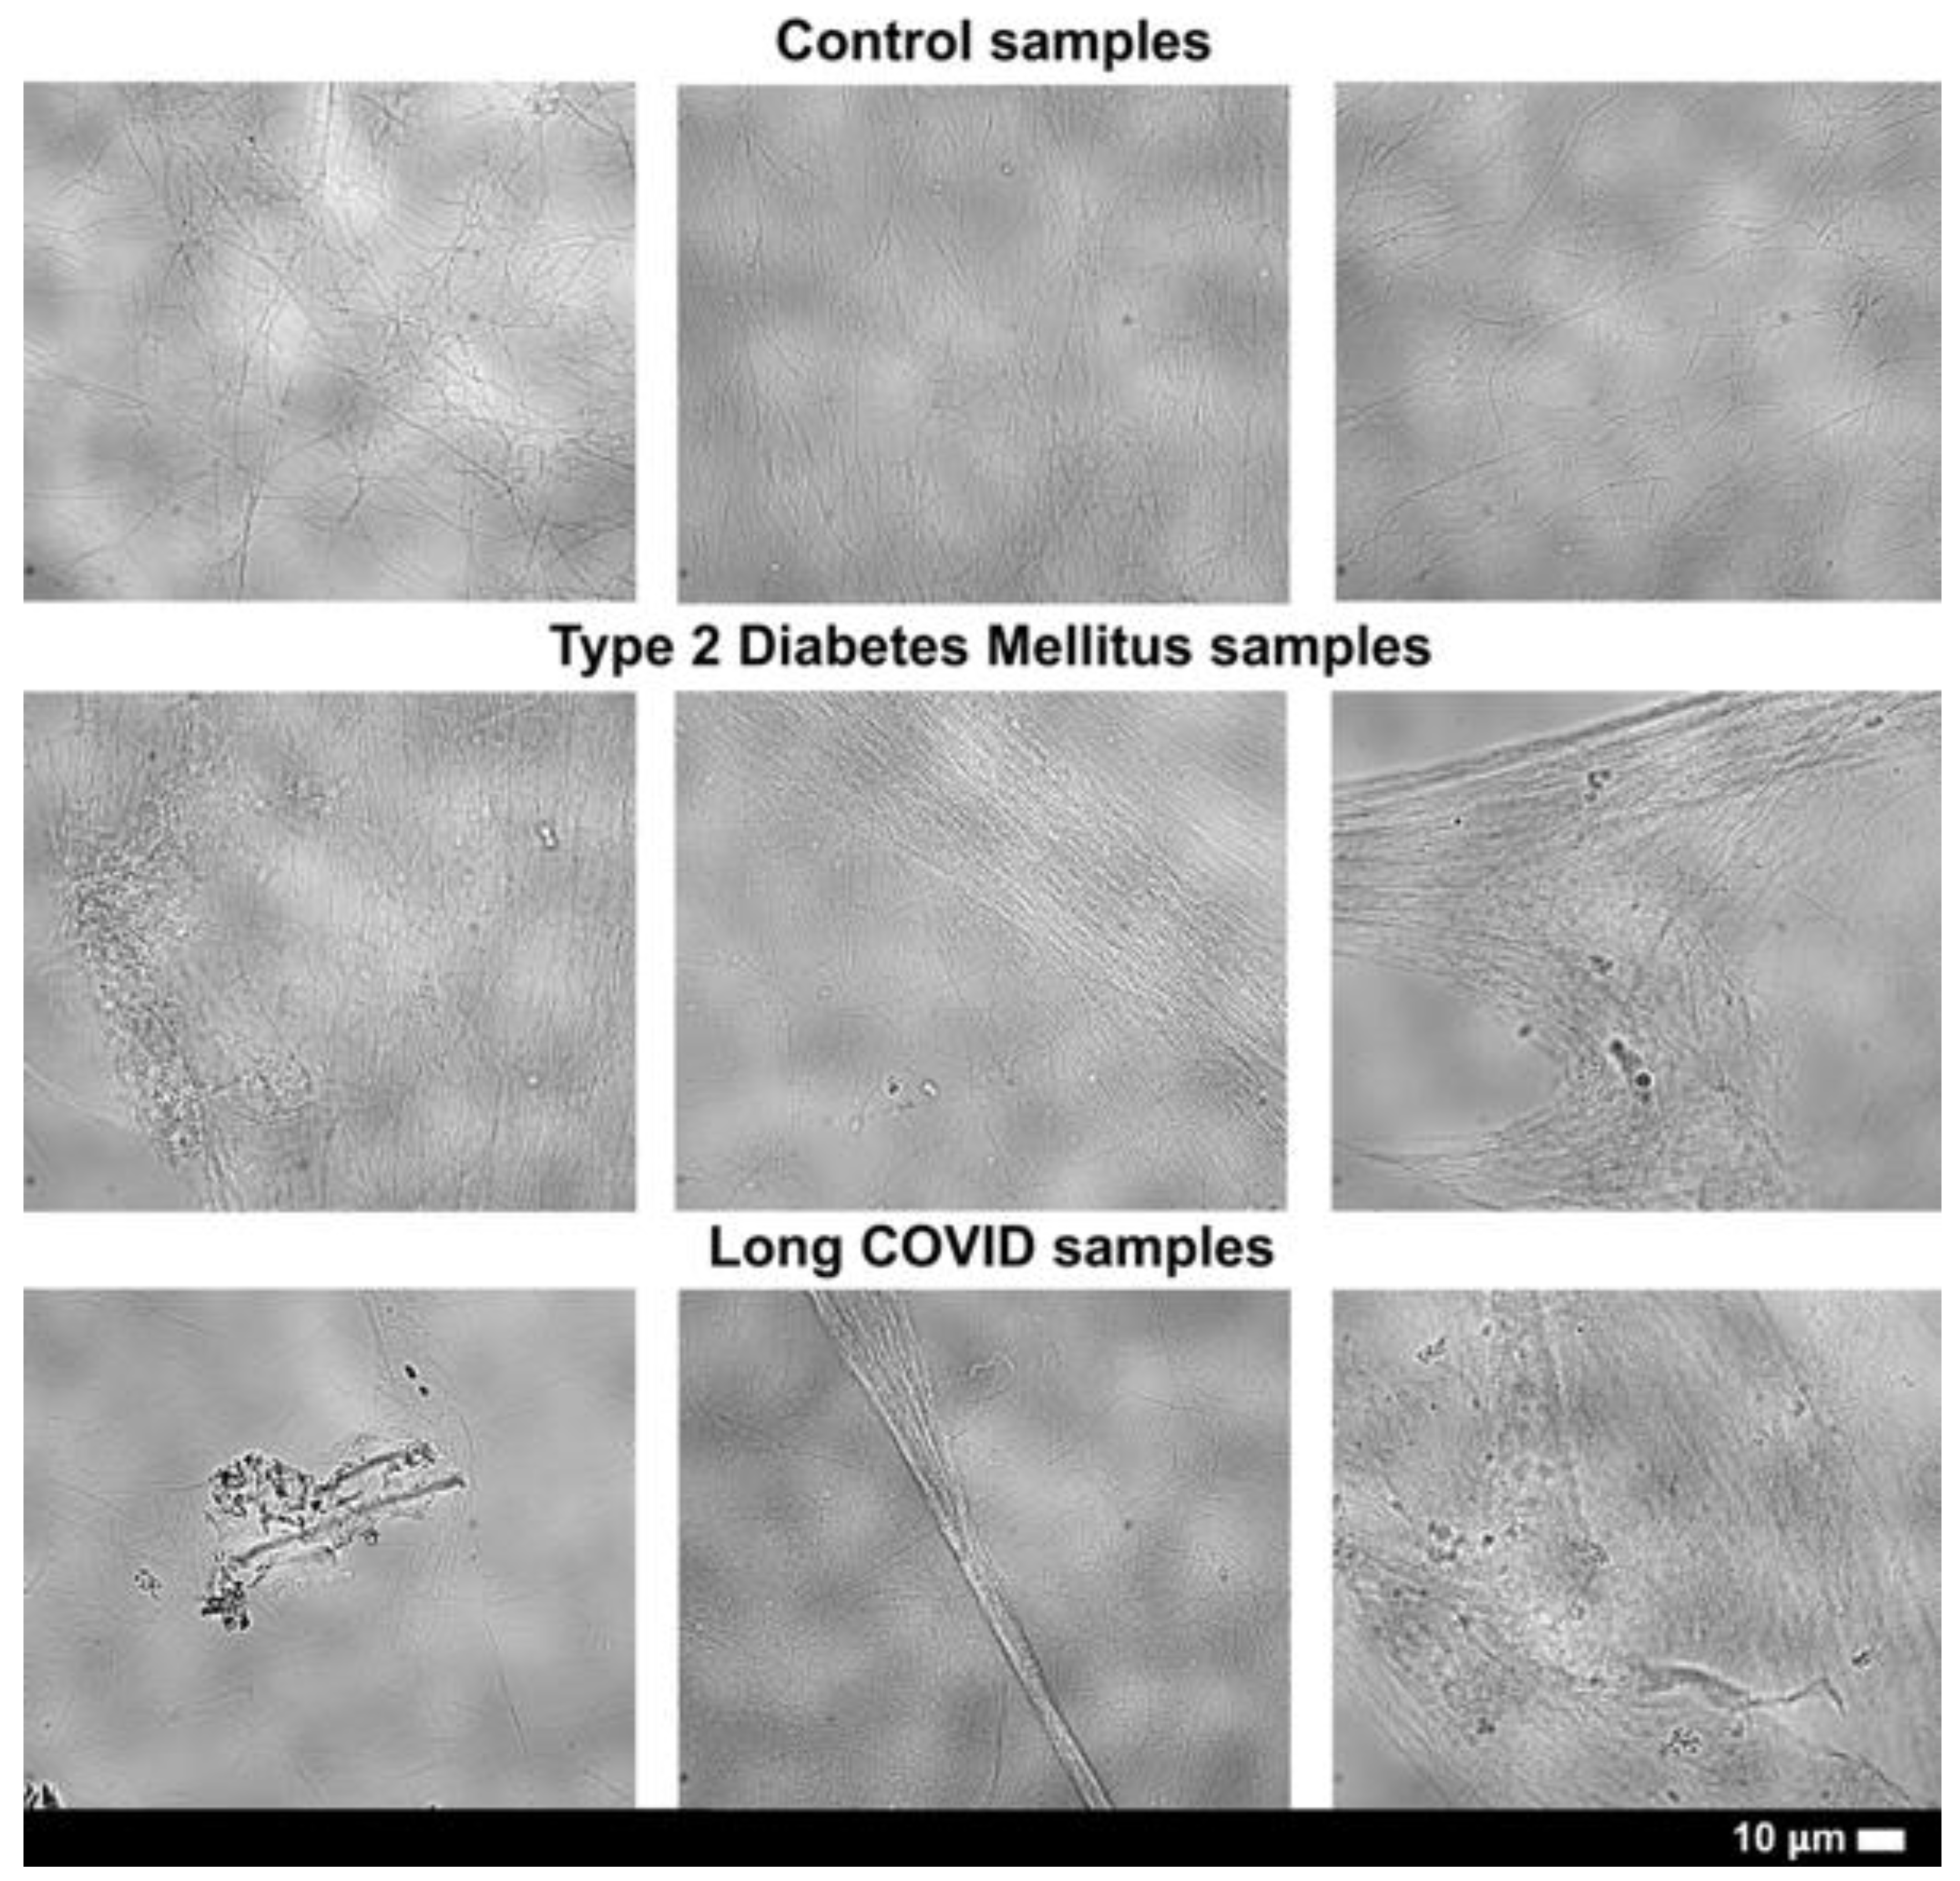
Figure 3.
Micrographs of pseudoserum samples exposed to exogenous thrombin. The lack of fibrin networks indicates that all or most of the fibrinogen in PPP samples, i.e. endogenous fibrinogen, has been depleted in the TEG® experiments. The last column represents ThT-stained pseudoserum, shown as an overlay in the patient cohorts. Some but not all of the aggregates in pseudoserum stained positive with ThT. All micrographs within a row represent different participants in a cohort, and were obtained at 63X magnification using the Zeiss Axio Observer 7 fluorescence microscope.
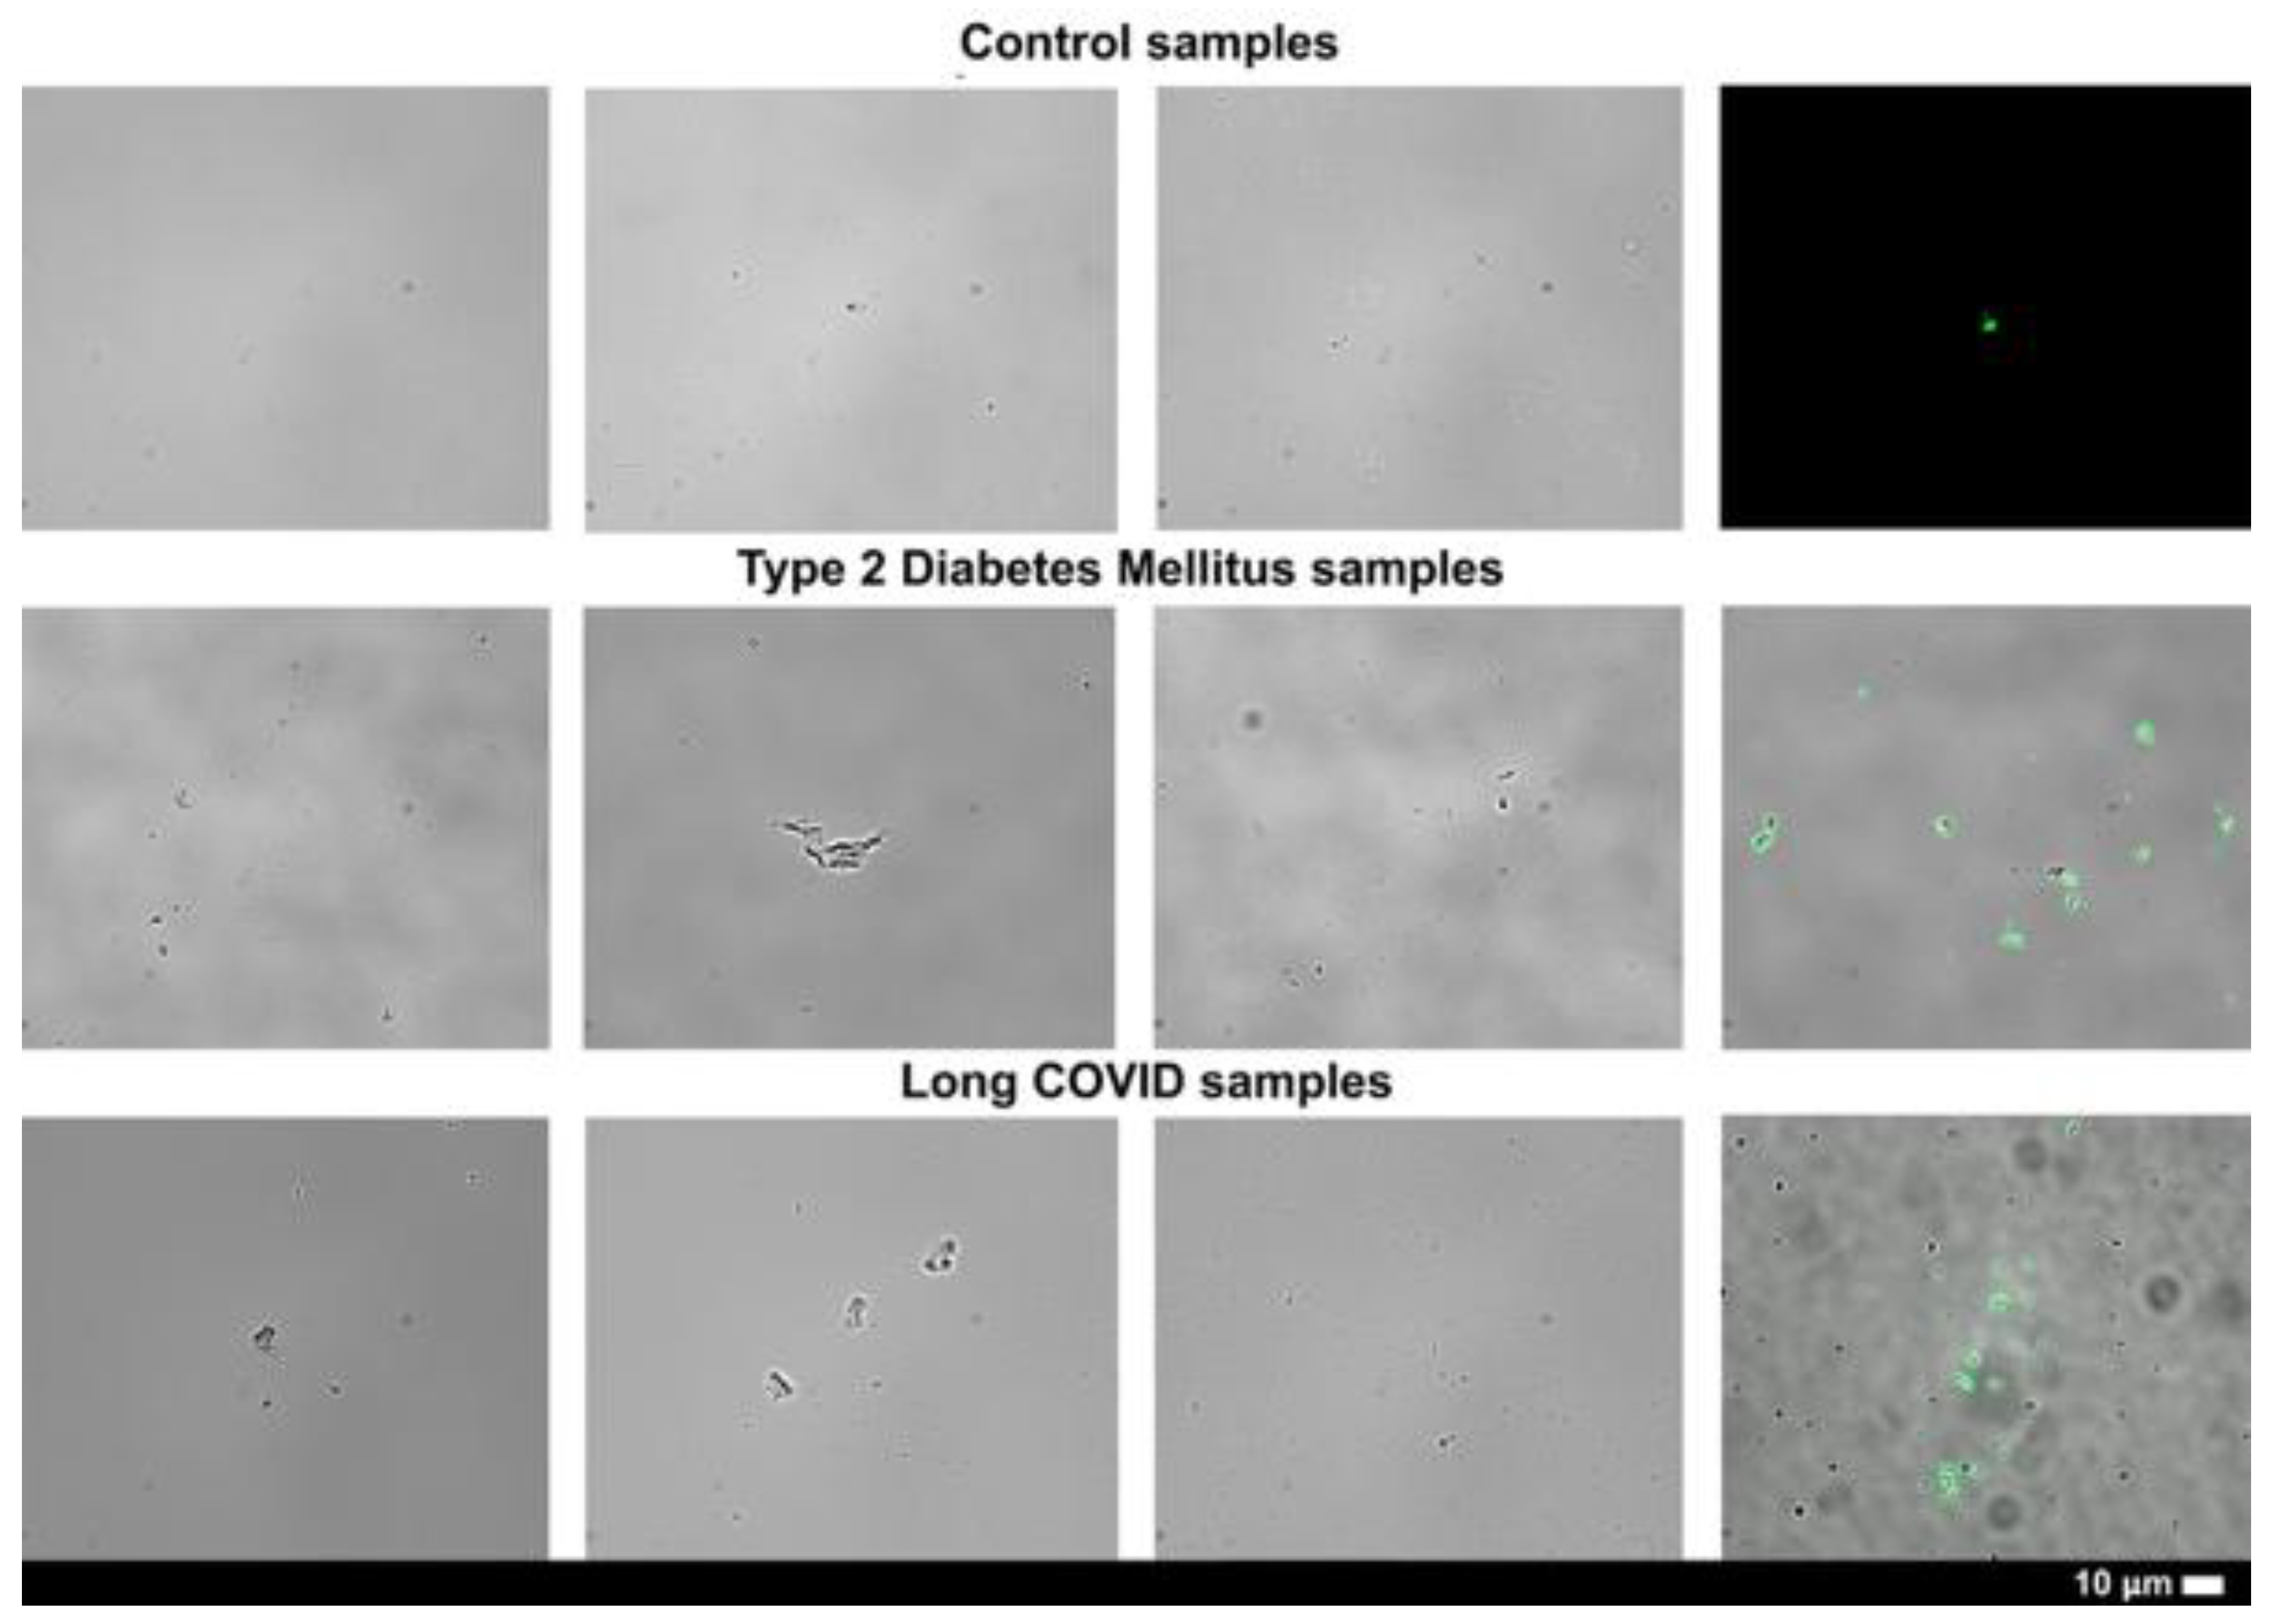
Figure 4.
Micrographs of thrombin-induced fibrin networks formed from purified fibrinogen exposed to pseudoserum samples using light microscopy. All micrographs within a row represent different participants within a cohort, and were obtained at 63X magnification using the brightfield mode of the Zeiss Axio Observer 7 microscope.
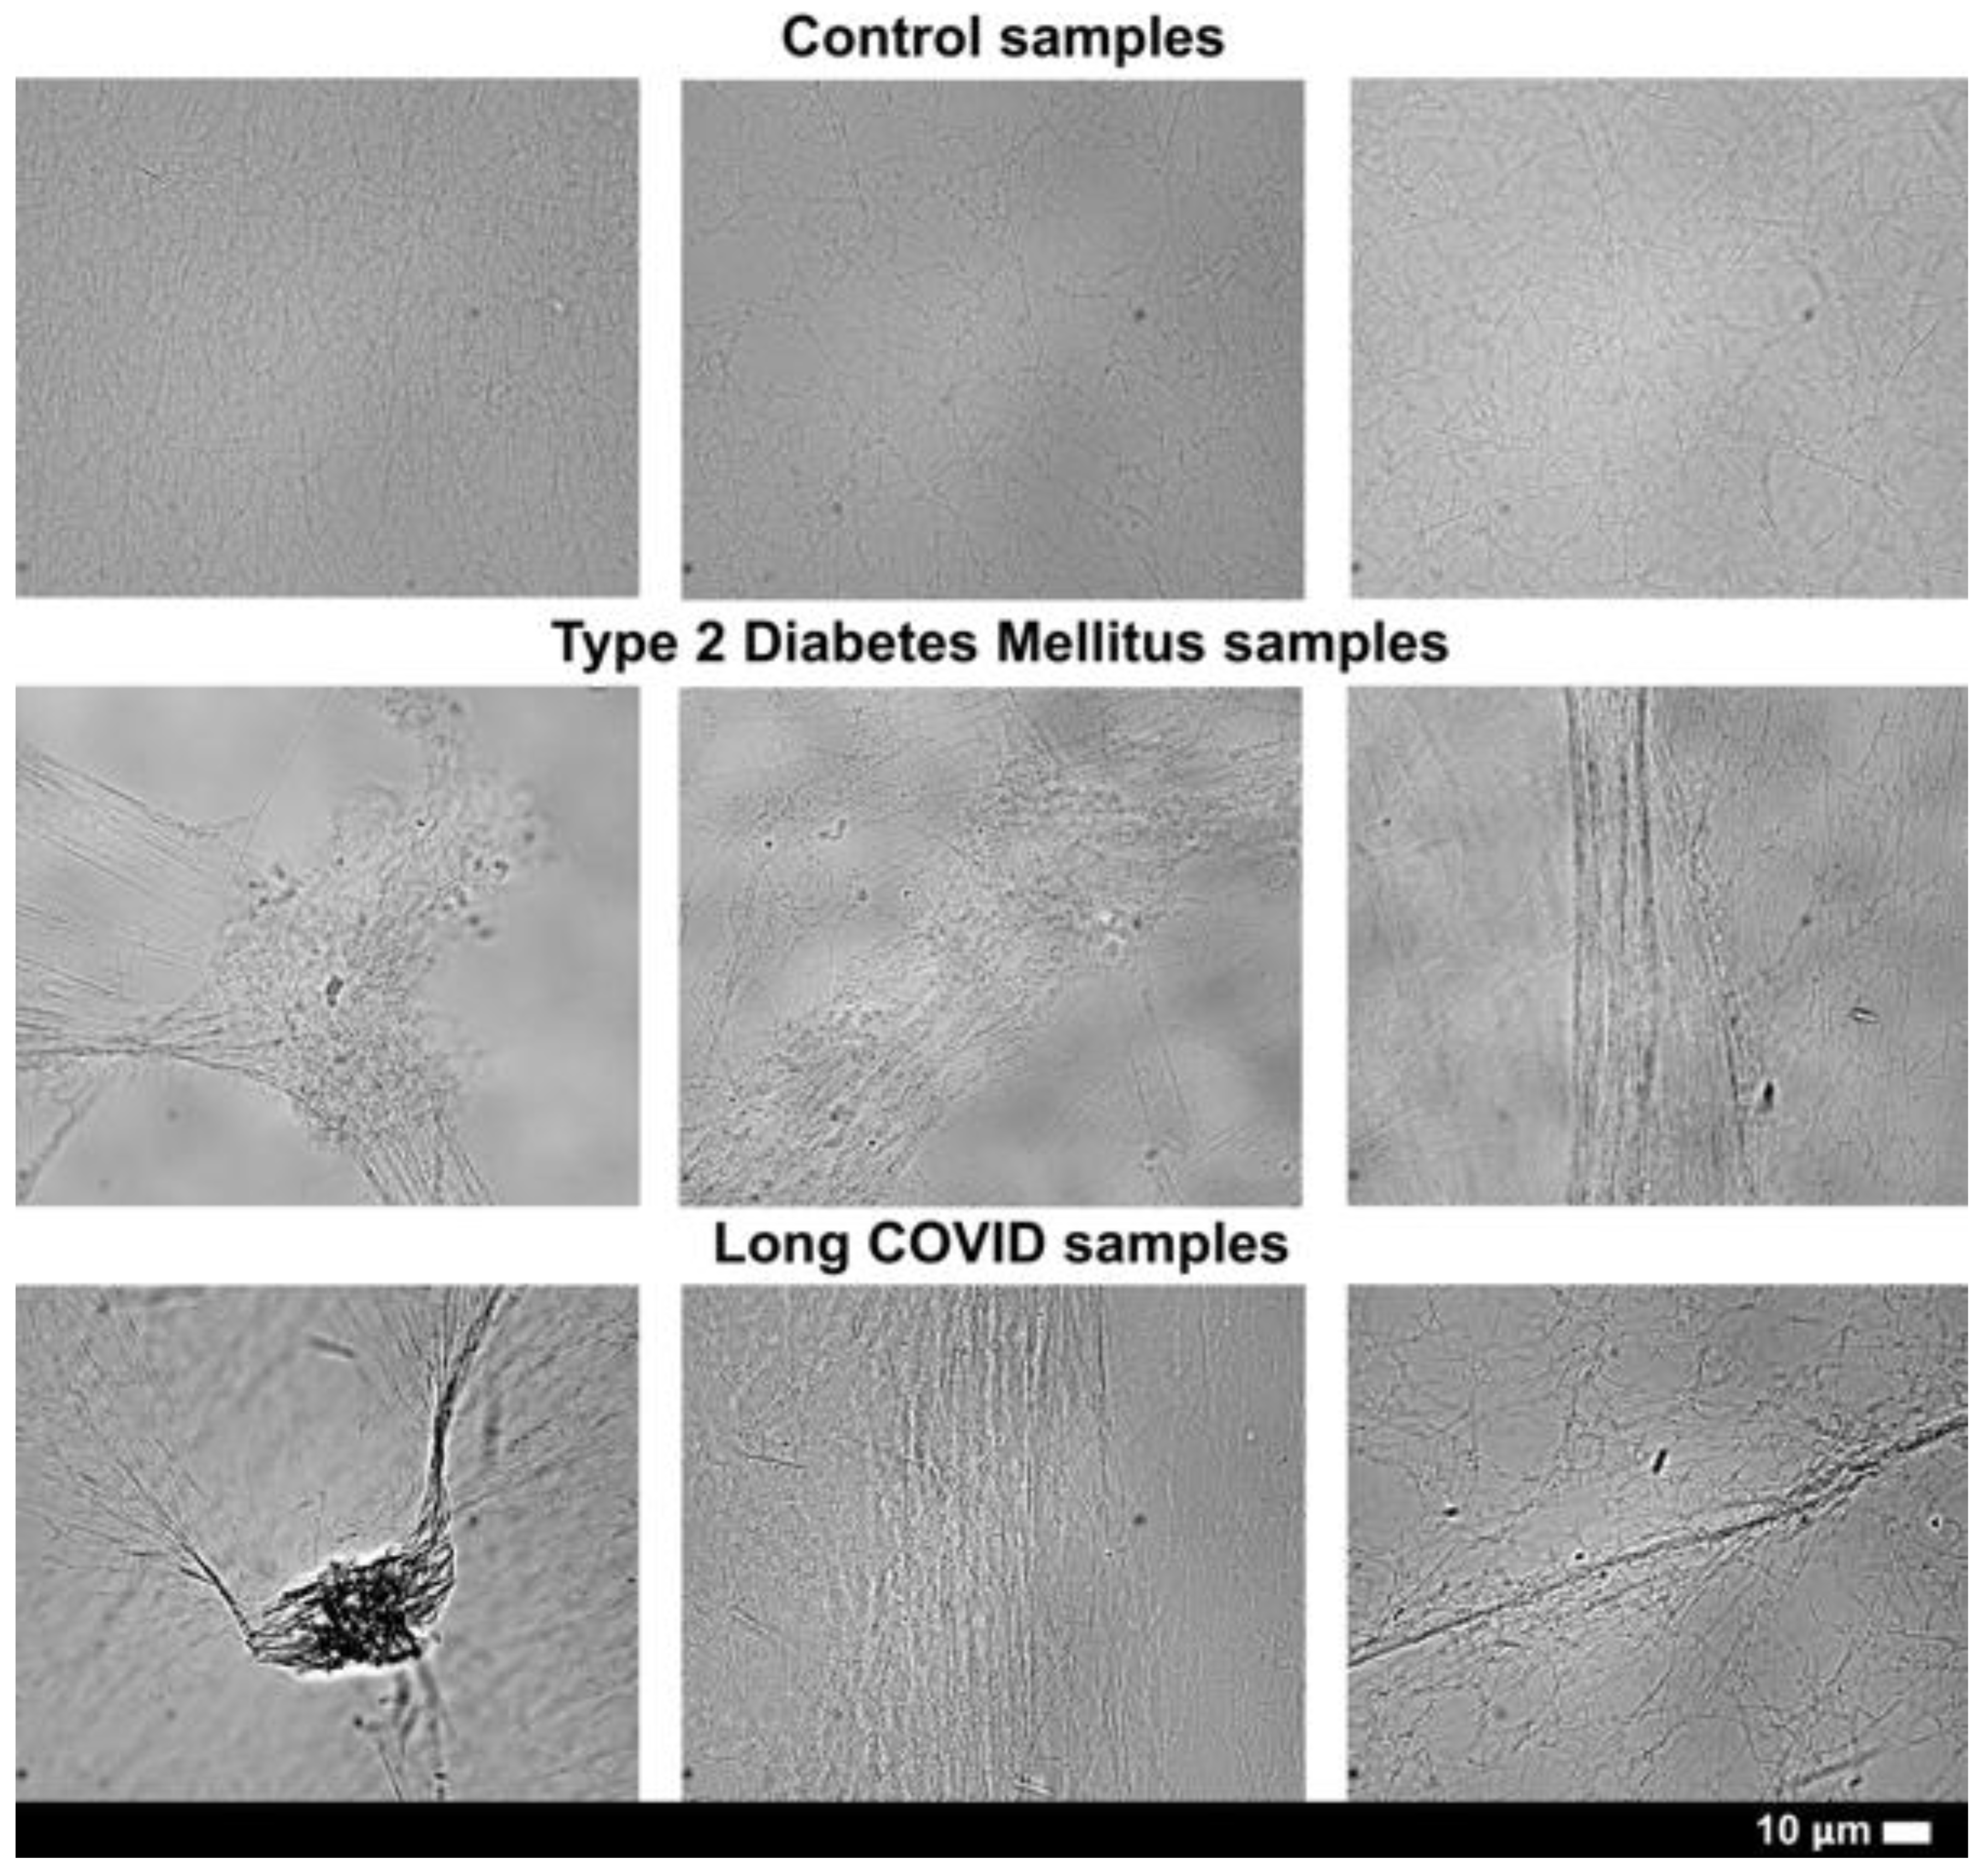
Figure 5.
Micrographs of thrombin-induced fibrin networks formed from purified fibrinogen exposed to pseudoserum samples using SEM. All micrographs within a row represent different participants within a cohort, and were obtained at 10000X magnification using the Zeiss MERLINTM field emission scanning microscope.
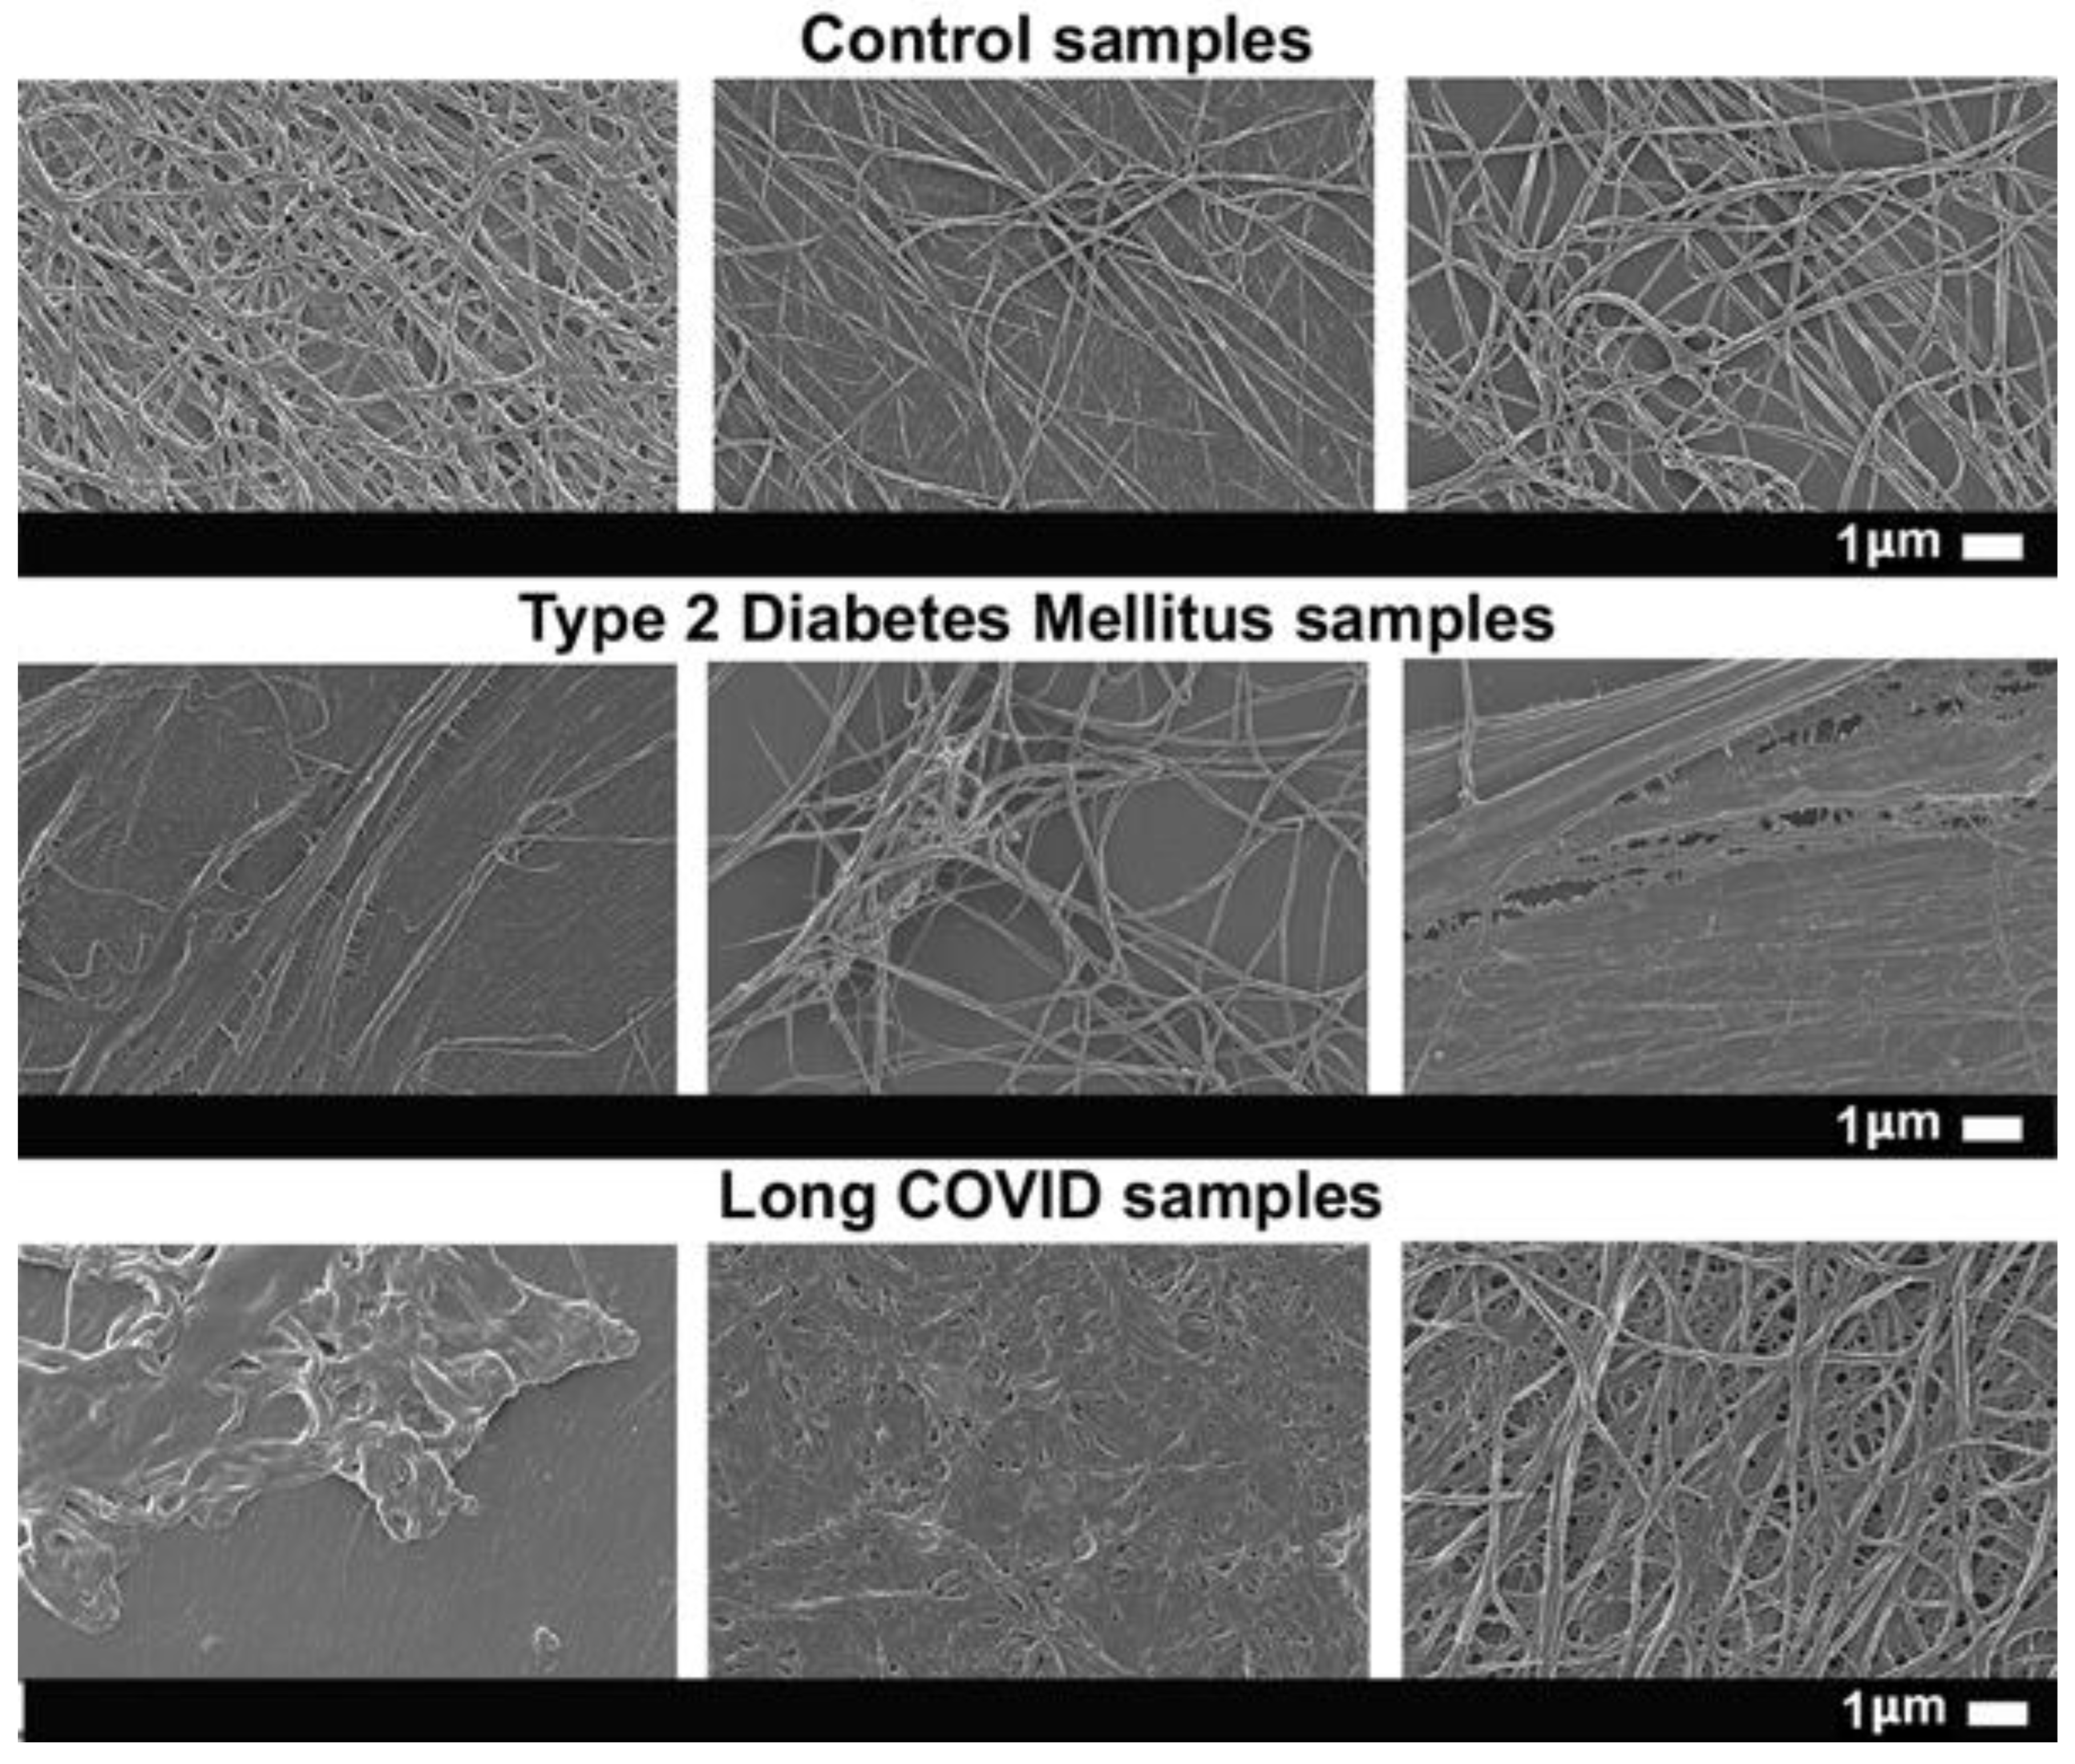
Figure 6.
Micrographs of naïve PPP networks captured via light microscopy (column 1), and thrombin-induced fibrin networks formed from purified fibrinogen exposed to pseudoserum obtained by light (column 2) and scanning electron microscopy (column 3). All images within a row represent the same sample (PPP or pseudoserum), emphasizing naïve PPP fibrin network morphology and structure can be somewhat mimicked with pseudoserum and without endogenous fibrinogen. Light microscopy micrographs were obtained at 63X magnification and SEM micrographs at 5000X magnification.
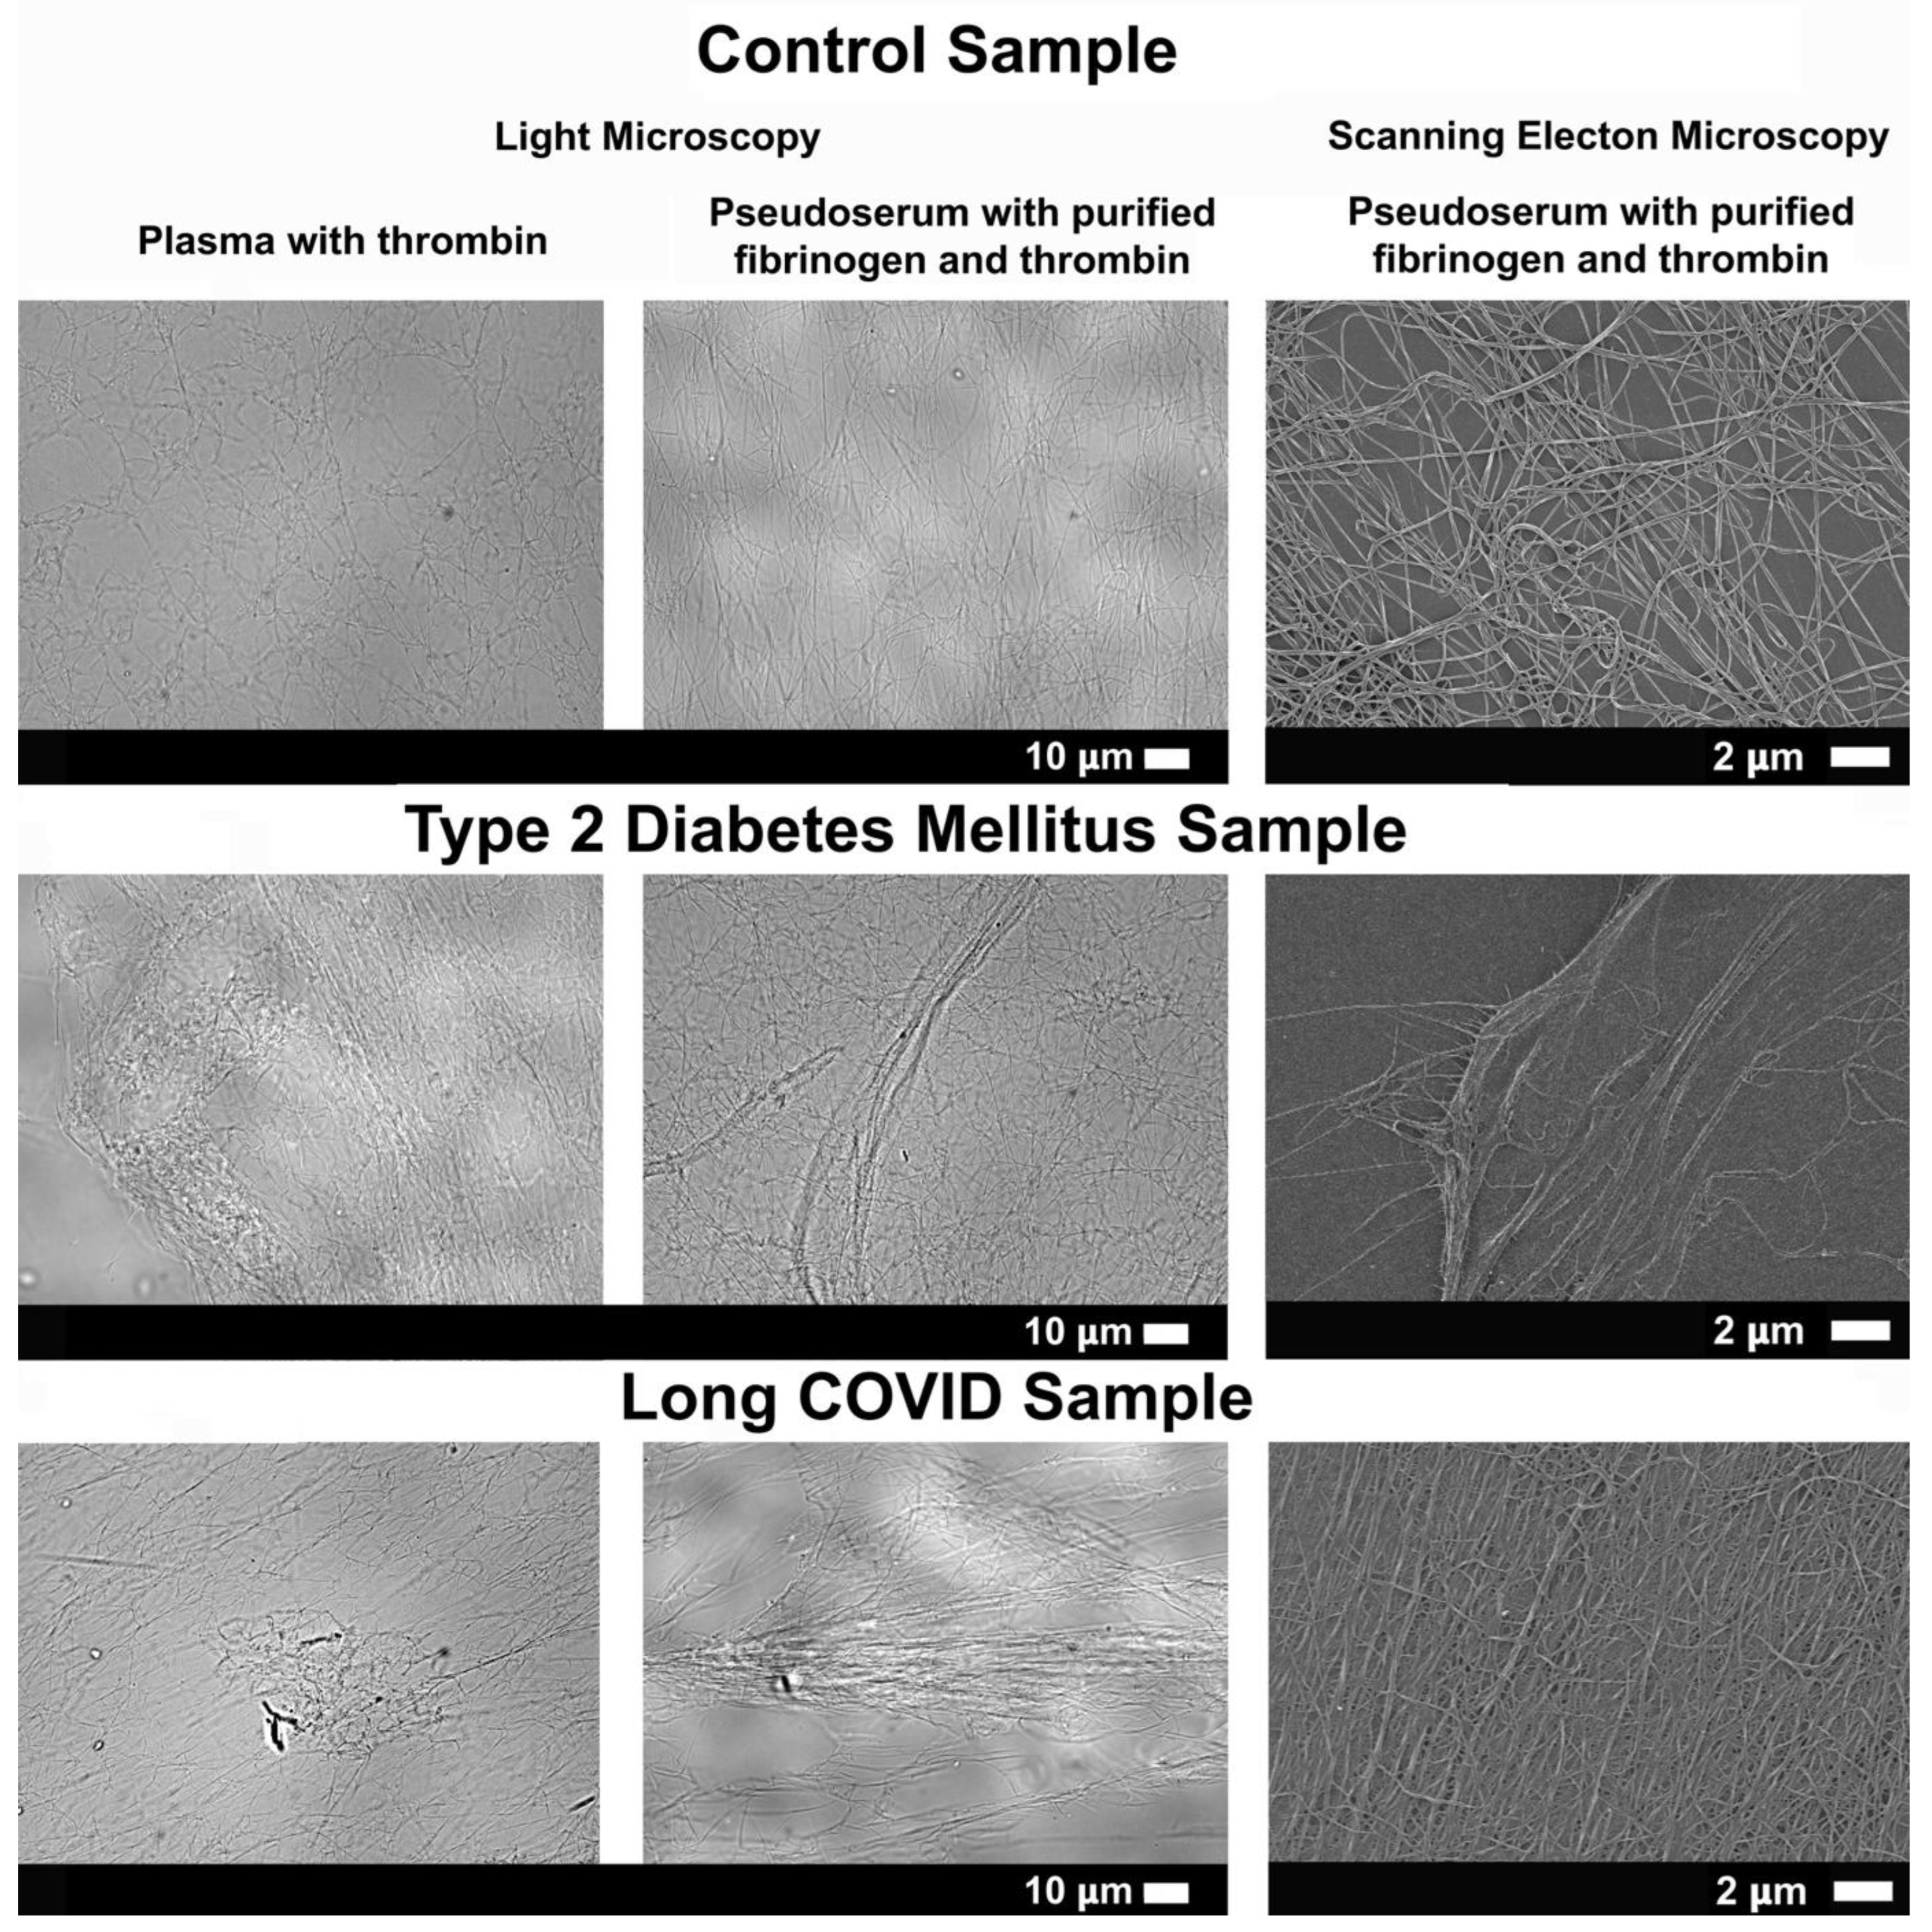

Table 1.
Demographics and comorbidities of the sample cohorts. Data are represented as mean ± standard deviation.
Table 1.
Demographics and comorbidities of the sample cohorts. Data are represented as mean ± standard deviation.
| Demographics | ||||||
|---|---|---|---|---|---|---|
| Control | Long COVID | T2DM | p-value (C vs LC) | p-value (C vs T2DM) | p-value (LC vs T2DM) | |
| Age | 40.55 ± 17.26 | 42.32 ± 12.94 | 52.60 ± 9.66 | 0.99 | 0.17 | 0.11 |
| Sex | 8 Females, 3 Males | 8 Females, 5 Males | 5 Females, 5 Males | Not Applicable | Not Applicable | Not Applicable |
| Comorbidities | ||||||
| T2DM | ||||||
| Hypercholesterolaemia | 80% (8/10) | Polycythemia | 10% (1/10) | |||
| Hypertension | 70% (7/10) | Colon Cancer | 10% (1/10) | |||
| Ischaemic Heart Disease | 30% (3/10) | Glaucoma | 10% (1/10) | |||
| Depression | 30% (3/10) | Hypothyroidism | 10% (1/10) | |||
| Anxiety | 20% (2/10) | Chronic Obstructive Pulmonary Disease | 10% (1/10) | |||
| Asthma | 20% (2/10) | Gout | 10% (1/10) | |||
| Long COVID | ||||||
| Hypercholesterolaemia | 15% (2/13) | Epilepsy | 8% (1/13) | |||
| Hypertension | 8% (1/13) | Rheumatoid Arthritis | 8% (1/13) | |||
Table 1.
Thromboelastography results of stored PPP samples. All parameters except maximum amplitude (MA) and total thrombus generation (TTG) pertain to clotting kinetics, while MA and TTG refers to clot strength and clot accumulated/formed, respectively. One outlier was identified and removed in the T2DM group for each the R and TMRTG parameters. Parametric data are presented as mean ± SD, and nonparametric data as median [range]. Statistical significance was set at p < 0.05. Significance levels are indicated by asterisks (* = p < 0.05, ** = p < 0.01, *** = p < 0.001, and **** = p < 0.0001).
| Parameter | Control | Long COVID | T2DM | p-value (C vs LC) | p-value (C vs T2DM) | p-value (LC vs T2DM) |
|---|---|---|---|---|---|---|
| R | 19.10 [24.40] | 11.70 [13.60] | 13.40 [11.30] | 0.01* | 0.03* | >0.99 |
| α-Angle | 30.88 ± 16.48 | 43.53 ± 10.57 | 43.41 ± 14.57 | 0.12 | 0.22 | >0.99 |
| MA | 33.30 [32.80] | 23.90 [30.40] | 30.65 [19.90] | 0.07 | >0.99 | 0.19 |
| MRTG | 5.00 [10.92] | 5.01 [7.93] | 7.40 [9.76] | >0.99 | 0.36 | 0.98 |
| TMRTG | 21.00 [29.34] | 13.00 [14.75] | 15.25 [13.09] | 0.01* | 0.03* | >0.99 |
| TTG | 399.30 [394.70] | 286.00 [365.10] | 367.80 [238.80] | 0.07 | >0.99 | 0.20 |
Disclaimer/Publisher’s Note: The statements, opinions and data contained in all publications are solely those of the individual author(s) and contributor(s) and not of MDPI and/or the editor(s). MDPI and/or the editor(s) disclaim responsibility for any injury to people or property resulting from any ideas, methods, instructions or products referred to in the content.a |
© 2025 by the authors. Licensee MDPI, Basel, Switzerland. This article is an open access article distributed under the terms and conditions of the Creative Commons Attribution (CC BY) license (http://creativecommons.org/licenses/by/4.0/).
Copyright: This open access article is published under a Creative Commons CC BY 4.0 license, which permit the free download, distribution, and reuse, provided that the author and preprint are cited in any reuse.


