
Submitted:
04 September 2025
Posted:
05 September 2025
You are already at the latest version
Abstract
This study investigates the impact of moisture content on agricultural fertilizers' flowabil-ity, compressibility, and caking behavior. We assessed how varying moisture levels in-fluence the physical properties of commercial and experimental fertilizer mixtures by uti-lizing advanced testing methodologies, including shear cell technology and powder rheometry. Our findings reveal that moisture significantly enhances particle agglomera-tion, increasing the cohesive forces within the material and adversely affecting its flowa-bility. Moreover, the presence of moisture was found to exacerbate caking tendencies, par-ticularly under compressive storage conditions, which could impede material handling and application. The study also explores the effectiveness of surface modifications and the use of anti-caking agents to mitigate these effects, aiming to optimize fertilizer formula-tions for improved storage stability and field performance. Results from this research pro-vide crucial insights into the design and manufacturing of fertilizer products that are more resilient to environmental variations and offer enhanced usability in agricultural applications.
Keywords:
powder characterization
; flowability
; caking
; cohesive powders
; aeration test
1. Introduction
In 2006, the Global Footprint Network introduced the concept of Earth Overshoot Day, signaling when humanity’s annual resource consumption exceeds Earth’s capacity to replenish them. Each year, Overshoot Day arrives earlier due to the growing global population, with 1969 being the last time Earth sustained such consumption levels [1,2,3].
The global population growth is predicted to reach just over 9 billion in 2050, preceded by a rise in global food demand by 15% by 2030 [3,4]. Using mineral fertilizers is one of the main factors responsible for global food security. Without fertilizers, the world would produce approximately half of the staple foods, and more forested areas would need to be converted into crop-production areas [5].
Thus, fertilizers contribute significantly to the global food supply by increasing crop yields and improving plant health. However, fertilizers’ physical and chemical properties can significantly influence their efficiency and application.
Usually, fertilizers are divided into two main groups according to particle size: granular and powder. Granular fertilizers are easy to apply, usually have better storage and handling properties, and have a lower tendency to dust formation due to higher particle size. On the other hand, the smaller particle size of powdered fertilizers increases the fertilizer’s surface area per unit mass. This enhances the contact of powdered fertilizer with the soil, roots, and microorganisms, improving fertilizer efficiency and exhibiting a more homogeneous distribution in the soil. This prevents certain areas from receiving excessive nutrients while others receive insufficient nutrients, thus avoiding inefficient fertilizer utilization. However, they tend to cake more significantly than granular ones [3,5,6,7].
However, unlike chemical compositions, the physical properties of fertilizers are not controlled by regulations [2]. Usually, the physical conditions of fertilizer could be modified according to buyer demands. Therefore, each product specification leads to different physical properties, which are susceptible to the process used to attempt the desired conditions. These properties are influenced by various factors, including particle size distribution (PSD), particle shape, surface texture, and moisture content.
Moisture content in fertilizers can alter their physical state, transforming free-flowing powders into cohesive masses that resist flow and complicate handling and application. This transformation, known as caking, is driven by various mechanisms, such as mechanical, thermal, environmental, and chemical, facilitated by the presence of water [8,9,10,11,12]. These changes not only affect the mechanical properties such as flowability and density but also impact the nutrient availability and uniformity of application [7].
Caking occurs as a result of the contact points formed between solid fertilizer particles, leading to the formation of undesired agglomerates during storage due to enhanced particle-particle interactions such as cohesion, liquid bridge, or solid bridge from crystallized linkages [7,13,14,15]. Caking occurs primarily due to moisture adsorption, where water molecules act as a binding agent between particles, forming liquid bridges that enhance the cohesive forces within the powder [7,14,15,16].
Capillary bridges are pivotal in the context of fertilizer storage and handling. Their formation and stability are influenced by particle size distribution, surface roughness, and environmental humidity [17]. The mechanical strength of these bridges can lead to significant reductions in flowability [18], which poses challenges during fertilizer application.
Hence, regardless of the mechanism, the ability to predict and control caking and agglomeration helps maintain the physical integrity of fertilizers over time, ensuring that they remain free-flowing and easy to apply, even after extended storage. This is crucial for maintaining the efficacy of the fertilizers, as clumped material can lead to uneven distribution in the field, potentially resulting in suboptimal crop yields and increased environmental impact due to the overuse of localized fertilizer patches.
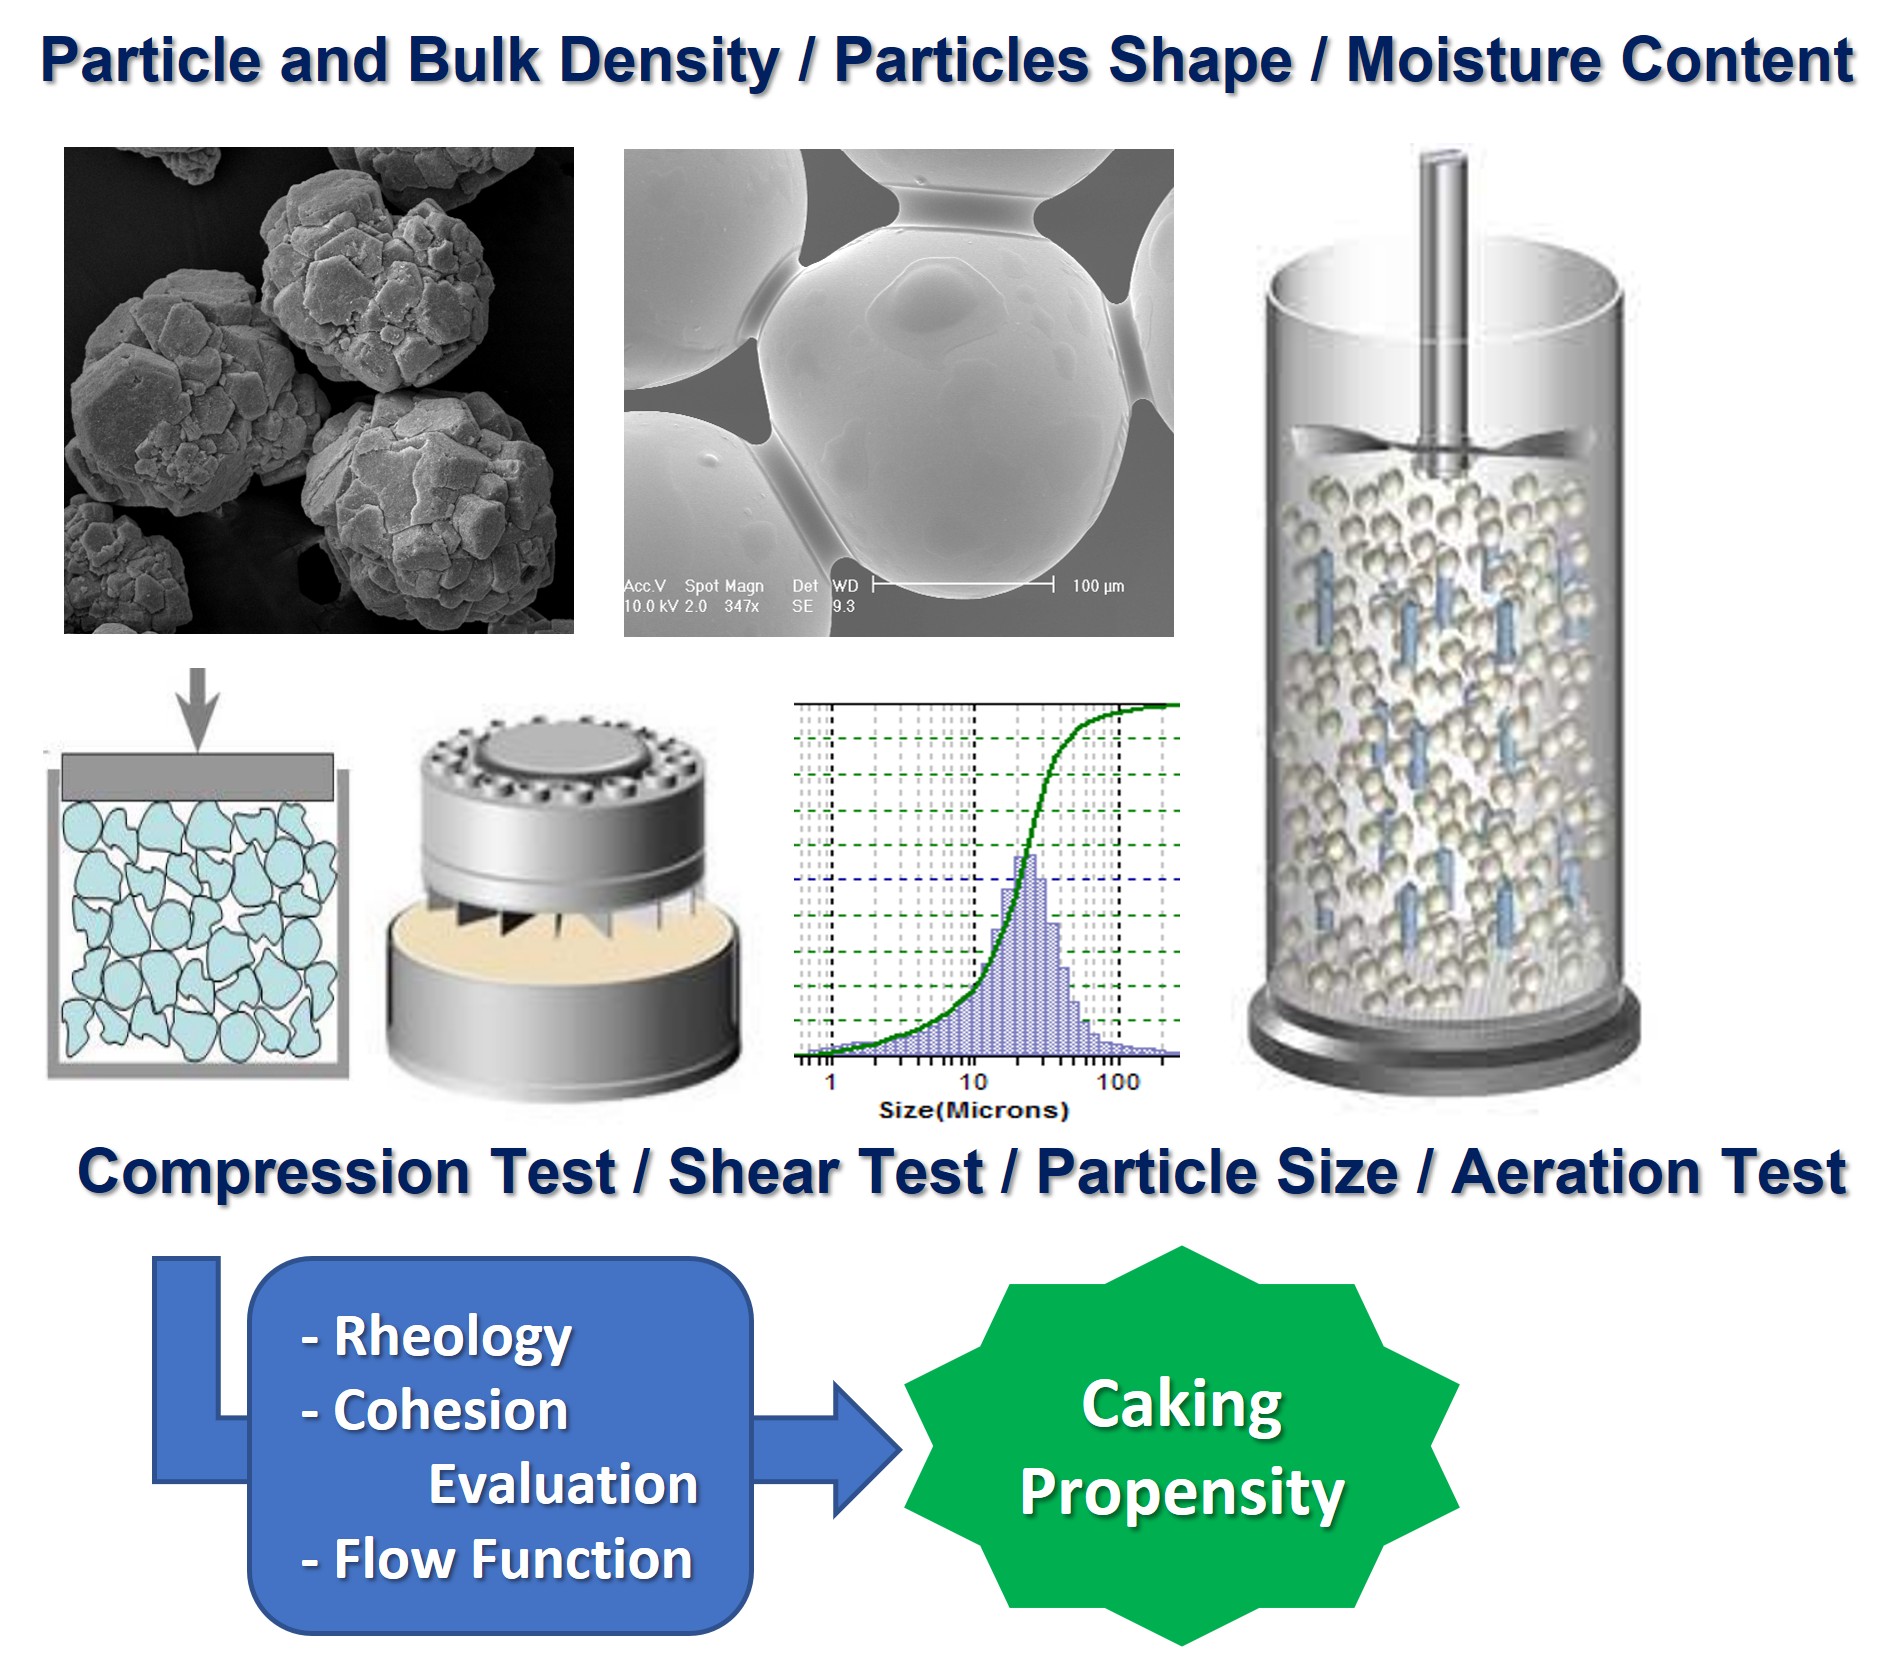
1.1. Particle Technology Overview
The practical applications of understanding flow properties, compressibility, and caking are vast in the agricultural sector, particularly in formulating and using fertilizers. Industry standards, largely based on empirical research, provide benchmarks for manufacturing processes, storage conditions, and application methods that ensure product quality and effectiveness. For instance, standards on the maximum allowable caking and the optimal range of particle hardness and size help manufacturers consistently produce fertilizers that meet user expectations for ease of application and effectiveness.
The interplay between particle size, cohesion, densities, and compressibility holds paramount importance in powder technology [19,20,21], profoundly influencing the manufacturing process and the application of agricultural fertilizers. While Garg et al. [22] primarily explore these dynamics in pharmaceutical powders, their principles directly apply to fertilizers, particularly concerning storage and handling challenges highlighted by Fitzpatrick et al. [23]. Particle size and shape significantly affect flow properties, cohesion, and compressibility, with smaller particles typically exhibiting greater cohesion and compressibility due to increased surface area. Elevated cohesion levels can challenge material flow during processing, necessitating more robust machinery and potentially increasing energy costs associated with manufacturing.
The relationship between particle size, cohesion, densities, and compressibility is intricate, particularly in cohesive materials such as fertilizers containing fine particles that tend to exhibit higher moisture adsorption rates due to their larger specific surface area relative to volume. This increased moisture content at the particle surface facilitates more extensive capillary bridge formations, enhancing the material’s cohesive strength and reducing its flowability [22]. Under compression, particles compact and rearrange, potentially increasing density and compressibility, and mainly the number of contact points between particles in the bulk. Research by Saleski et al. [24] on assessing cake strength provides methodologies for quantifying these effects, aiding manufacturers in predicting and managing compressive, cohesive, and density-related behaviors during granulation and compaction.
Optimizing fertilizer physical properties, such as particle size distribution, cohesion, densities, and compressibility, is crucial for ensuring product stability and performance. Density, including bulk and tapped density, influences material packing and porosity, affecting handling characteristics. Compressibility, indicating volume reduction under pressure, directly impacts mechanical stability and flowability. Althaus [25] stresses the importance of understanding these properties in equipment and storage facility design, highlighting implications for material compaction and degradation.
Farm fertilizer manufacturers can adapt their production techniques to minimize these effects by understanding the specific conditions under which caking and agglomeration occur. Several cases about the relationship between particle size and caking of all kinds of powders are also available in the literature, so the use of anti-caking agents [17,20,26,27,28,29,30,31], which is an alternative when changing the particle size, is not an option. However, in some cases, these additives do not match the application.
It was noted that different raw materials exhibited unique responses to moisture content changes, affecting the fertilizer mixtures’ overall behavior. Such material-specific responses underscore the complexity of predicting bulk material behavior based solely on overall moisture content. This aspect of the findings dovetails with the discussions by Brockbank et al. [21], who emphasized the variability in caking behavior based on individual component properties within a mixture.
Given the complexities associated with moisture in fertilizers, there is a critical need to systematically understand how varying moisture levels affect the physical properties of fertilizers and to develop strategies to mitigate negative effects such as caking. This study aims to explore the relationship between moisture content and the flow properties of a commercially used agricultural fertilizer. Moreover, a comprehensive characterization of the primary compounds within the fertilizer matrix, milled before formulation at the same grade, enabled the avoidance of particle size influence on flowability and cohesiveness, thereby reflecting the chemical nature of each compound in these properties. By integrating rigorous experimental methodologies with advanced analytical techniques, this research seeks to provide actionable insights that can improve fertilizer formulations focused on the problematic compound.
2. Materials and Methods
The commercial fertilizer under study was provided by an agricultural fertilizer industry. To safeguard the company’s intellectual property, the material will be referred to as “fertilizer,” and its three main raw materials will be designated RM A (source of B), RM B (source of Mn), and RM C (source of Zn). These materials comprise over 85% of the fertilizer’s composition.
Quality control for particle size distribution is performed using a sieving technique, ensuring the final product meets the following specifications: 100% of the samples must pass through a 100-mesh sieve, 80-90% through a 200-mesh sieve, and 70-60% through a 325-mesh sieve.
For more precise quality results, particle size distribution was assessed using a laser diffraction device (Bluewave - Microtrac) dispersed in ethanol to avoid partial dissolution of the inorganic salt and compromise results. Table 1 shows each raw material’s particle size and the commercial fertilizer’s composition.
Initially, the commercial fertilizer, which serves as the reference sample for this study, was characterized for its moisture content and particle size distribution. The standard sample was then moistened to theoretical moisture levels of 4%, 7%, and 10% by mass, chosen to respect the premise of a design of experiment. Calculations were performed to determine the required mass of water needed to achieve these moisture levels.
The necessary amounts of water were weighed using a precision balance (ATY224 - Shimadzu) and added to the fertilizer samples in airtight bags using a pipette. This process was repeated until the water was fully incorporated. The samples were stored at room temperature in airtight bags for approximately 7 days. An infrared moisture analyzer (IV-2000 - Gehaka) was then used to determine the exact moisture content.
Five mixtures were prepared using the three main raw materials following a 22 + 1 central point experimental design to study the effect of raw material concentration on the powdered fertilizer’s flowability. These mixtures maintained the same particle size parameters as the standard sample by grinding in a ball mill for about 1 h. The ground samples were then sieved, and the particles passing through the 100, 200, and 325 mesh sieves were used to prepare the mixtures as per the concentrations detailed in Table 2
All samples (moistened fertilizers, raw materials, and prepared mixtures) were analyzed using a gas pycnometer (Accupyc II 1324 – Micromeritics) to estimate their true particle density, and an auto tap equipment (Tap 2S – Logan Instruments) to evaluate bulk and tapped densities.
A powder rheometer (FT-4 – Freeman Technology) was also used to evaluate the basic flow energy (BFE), permeability, aeration, compressibility, cohesion, angle of internal friction, and to obtain the flow function of all used samples. A detailed description of the FT-4 principles and methodology is described elsewhere in the literature [32,33,34].
3. Results and Discussion
Main physical properties of raw materials, commercial fertilizer, and moistened fertilizers are shown in Table 3.
It is observed that the moistened samples did not reach the theoretical moisture content desired. However, distinct behavioral patterns at each moisture level suggest an increase in particle size, likely due to agglomeration, with rising moisture levels, as evidenced in Figure 1. Although the size of the agglomerates appears consistent across all samples, their quantity is greater at elevated moisture levels, which affected the volumetric mean particle size (d4,3). Despite variations in moisture content, the samples show distinct bulk density and porosity values.
The saturation level of as-received and moistened fertilizers was calculated according to Althaus et al.’s work [24] and is also presented in Table 3.
The raw materials with distinct particle sizes and densities show specific bulk density and porosity characteristics. However, under-tapped conditions exhibit maximum compaction with a minimum porosity of around 0.63. Notably, the raw material with the smallest particle size demonstrates the lowest bulk density and highest porosity values, suggesting a more cohesive behavior influenced minimally by particle interactions or vibrations from tapping.
The compressibility test (Figure 2b) revealed that more humid samples of fertilizer are more compressible compared to others, displaying pronounced effects on particle agglomeration above 5.0 % moisture content, as evidenced in Figure 1.
Analysis of the Basic Flow Energy (BFE) test results (Figure 2a) suggested that the behavior of the 5.0 % moisture samples closely resembles that of the 7.5 % moisture samples despite slight differences in particle sizes. This similarity across physical properties in the humidified samples suggests that the variations in BFE may be attributed to the extent and nature of agglomeration, with more cohesive agglomerates in the 5.0 % moisture samples remaining intact, requiring more energy for displacement. In conclusion, BFE increased with increasing particle size, and the initial low moisture content slightly alters the properties of as-received fertilizers.
These observations resemble similar results obtained by Scicolone et al. [27] and Collet et al. [34], which support the fact that the first amount of liquid added to the dry sample is distributed at the surface of the particles without forming liquid bridges. But at some amount of liquid, which is high enough to form capillary bridges between particles. Thus, the medium becomes more cohesive, and a rapid increase in energy consumption is observed. This condition is defined as a pendular state, identified by Collet [34] at a saturation level in the range of 5.0 to 12.0 %, which is exactly the condition of our experiments.
Examining raw materials with similar moisture content (2.5 and 3.0 %), higher basic flow energy (BFE) was observed for raw materials with larger bulk densities, as illustrated by Figure 3a. A common behavior where the displacement of denser bulk (e.g., RM C) in the same bed volume is more pronounced than lighter particles (e.g., RM A). Hence, RM C is the fertilizer’s most compressible constituent, as evidenced in Figure 3b, indicating a possible cohesive behavior. Once voids exist between agglomerates of cohesive particles, they are replaced/filled by particles during the compression test. The results agree with those observed by Leturia et al. [33] and Takeuschit et al. [34].
Notably, the reduction in both particle and bulk densities leads to lower basic flow energy (BFE), suggesting that interparticle interactions are predominantly influenced by the inherent properties of each raw material. This supports Leturia’s et al. [33] assertion that powder behavior depends on (i) intrinsic particle characteristics, (ii) bulk solid properties, and (iii) external conditions. Given the consistent external conditions in this study and the parallel decrease in either bulk or particle densities aligning with BFE results, it remains inconclusive which one predominantly governs the flow pattern.
To elucidate the direct influence of each raw material’s proportion and specific physical-chemical properties on fertilizer behavior, we prepared and tested mixtures with varying contents of the major raw materials found in commercial fertilizer, employing several analytical techniques. The summarized physical properties of these five mixtures are presented in Table 4.
Comparing the BFE of the mixtures (Figure 4a), though they have almost the same particle size, different energy values were obtained. Results are in agreement with the observations of Takeuchi et al. [34], suggesting the total energy was not strictly correlated with particle size but involved other factors.
Thus, it can be concluded that mixtures with a higher content of raw material C (source of Zinc) required more energy to flow due to their higher specific density, despite their smaller particle size, and possibly. Lower concentrations of raw material C reduce BFE, but intermediate concentrations do not significantly alter the BFE pattern. Nonetheless, the compressibility behavior of all the mixtures is very similar, as shown in Figure 4b.
The aeration tests of moistened fertilizer indicated an increase in sample cohesion and a decrease in minimum fluidization velocity with the increase in moisture content, as illustrated in Figure 5. At different moisture levels, the energy plateau in aeration tests varied, ranging from 4-6 m/s for lower moisture contents (2.5 % and 3.0 %) to 8-10 m/s at 5.0 % and 7.5 % of moisture contents, reflecting residual particle interactions, frequently referred to as cohesive forces. Thus, samples with lower moisture contents were less cohesive.
About Raw materials, RM C was revealed to be the only cohesive constituent of fertilizer due to its behavior at the aeration test shown in Figure 8, which is consistent with the higher compressibility observed. This observation highlights the phenomenon of cohesive particles forming clusters that are heavier than individual particles. As these clusters agglomerate, they require a higher airflow rate to be fluidized effectively. This is indicated by the latter steady-state plateau observed in Figure 5.
Shear tests results (Figure 6), which allowed the estimation of cohesion (C), the angle of internal friction (AIF), and the effective angle of internal friction (EAIF) for all samples under different consolidation stresses (3, 6, 9, and 15 kPa), confirm the cohesive tendencies observed in previous tests, particularly for raw material C and the commercial fertilizer at high moisture levels.
The linearized angle of friction of all moistened fertilizers is nearly identical, as shown in Figure 6. This agrees with the observations of Althaus et al. [25], Pierrat et al. [35], and Richefeu et al. [36], who measured the yield locus of wet powders and concluded that the yield locus slope is independent of the moisture content.
However, this is not the case for yield locus position, where each yield locus is displaced depending on the moisture content, especially in the 3.0 % to 5.0 % range.
No notable increases in cohesion were observed between moisture content levels of 2.5 % and 3.0 %, nor between 5.0 % and 7.5 %, across all consolidation states for the humidified fertilizer. These observations are better noticed when plotting a cohesion graph as a function of the moisture content, illustrated by Figure 7a.
However, cohesion experienced a significant enhancement between moisture contents of 3.0 % and 5.0 %. Substantial alterations were also observed in aeration test results (Figure 8) within this same moisture level range.
Interestingly, cohesion appears unaffected by moisture content at a consolidation stress of 3 kPa, whereas its dependence becomes more pronounced at higher stresses, particularly within the 3.0 % to 5.0 % moisture range. It is intriguing that the aeration test, conducted under loose-stress conditions, could reflect a similar cohesive trend to shear tests under high-stress conditions.
The effective angle of internal friction represents the relative contribution of cohesive/adhesive forces to the frictional force. It varied significantly with consolidation stress, indicating that lower stresses favored larger EAIF due to predominant cohesive forces, while higher stresses emphasized frictional resistance.
In humid materials, moisture present on particle surfaces may migrate to particle interstices under higher consolidation stress due to the applied compressive force. Consequently, depending on the nature and surface properties of the powder, moisture concentration at particle contact points could rise, forming liquid bridges. However, the role of liquid binders in wet powders is paradoxical, as they augment cohesion while also serving as lubricants between particles.
Upon observing the behavior of pure raw materials, a general decrease in the Effective Angle of Internal Friction (EAIF) is noted, indicating a reduction in cohesive contribution at higher stresses. At higher stresses, raw materials A and B exhibit similar frictional and cohesive interactions, which are lower than those of raw material C, demonstrating a higher cohesive behavior. These observations align with the quantitative cohesion values obtained from the shear test results, in which the cohesion of raw materials A and B becomes similar at higher stress levels, as shown in Figure 7b.
For moistened fertilizer, the graph of EAIF as a function of normal stress (Figure 7b) allows for the evaluation of moisture content on relative cohesion contribution at different consolidation states. For commercial fertilizer (2.5 % moisture content), the cohesion contribution in interparticle interactions reduces until 9 kPa of consolidation, whereas for moistened fertilizer at 7.5 % moisture content, relative cohesive forces reduce only until 6 kPa. Therefore, at 9 kPa, the effect of cohesive/adhesive forces on moistened fertilizer is higher, favoring the caking phenomena in these samples.
The influence of consolidation stress on the Effective Angle of Internal Friction (EAIF) across the five mixtures is depicted, typically ranging from 42° to 49° (not shown), with a significant influence from the presence of raw material C.
Although similar behavior is observed in cohesion values (Figure 8a), it is possible to establish that mixture 3 exhibits the lowest cohesiveness. However, the cohesion of the commercial fertilizer evaluated is higher than all mixtures prepared for this study, indicating that the other compounds comprising the remaining 14% of the commercial fertilizer composition influence its behavior.
Figure 8.
Cohesion as a function of applied normal stress for (a) prepared mixtures and (b) raw materials and fertilizers.
Figure 8.
Cohesion as a function of applied normal stress for (a) prepared mixtures and (b) raw materials and fertilizers.
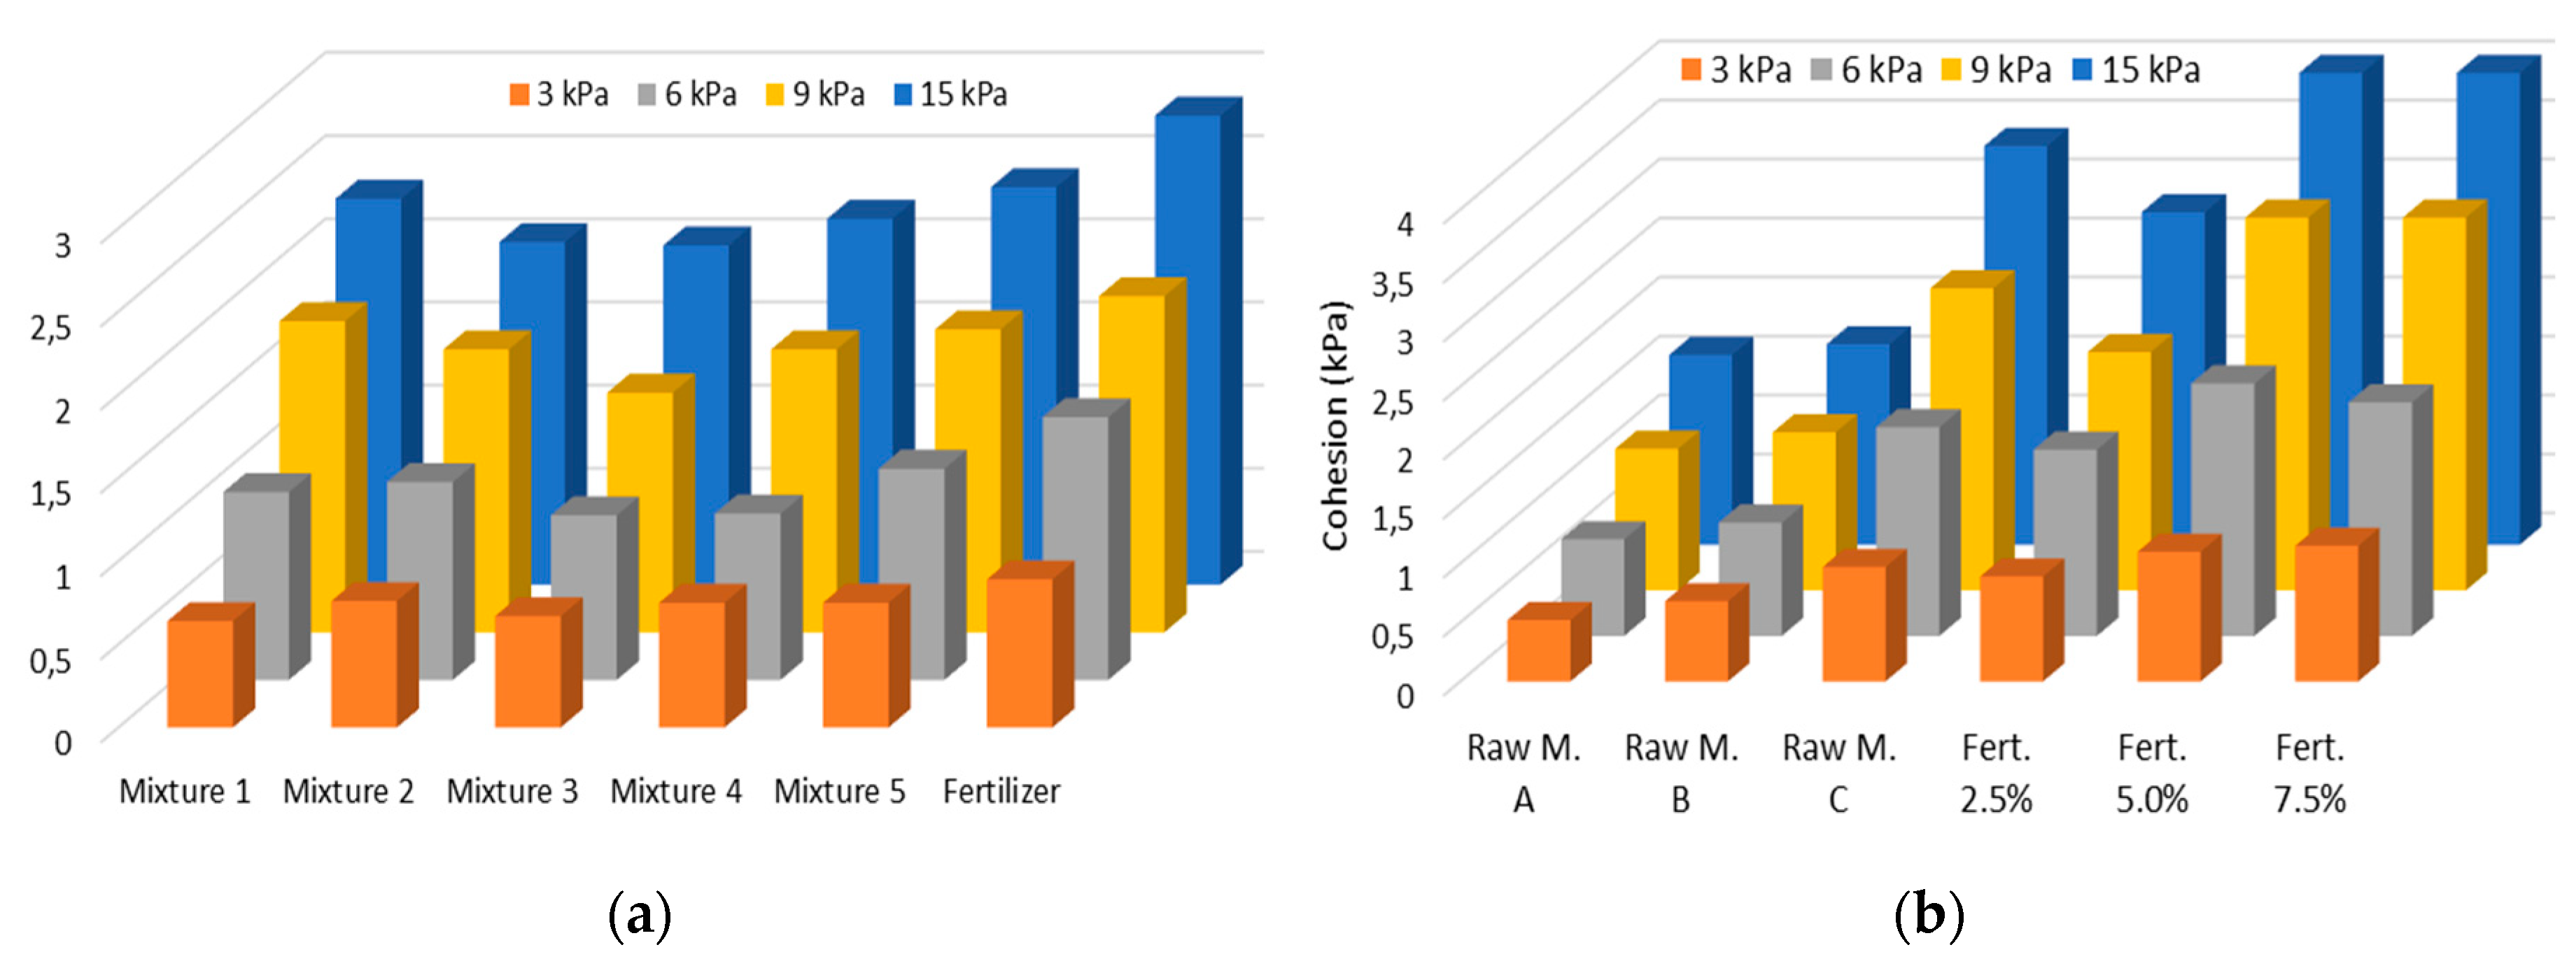
On the other hand, mixtures 1 and 5 emerge as the most cohesive samples, primarily composed of raw material C, recognized as the most cohesive component, as indicated in Figure 8b.
Although the cohesive behavior of the commercial fertilizer is lower than that of raw material C (its main constituent), a focused investigation on this raw material prior to the production process could serve as an alternative approach for quality control of the final product.
Moreover, moisture content stands out as the most significant variable affecting cohesive properties, potentially leading to flow issues during processing. When combined with storage conditions, such as consolidation caused by stockpiling, this may result in caking.
The flow function curves obtained from the shear tests (Figure 9) support all prior findings. Based on standard classification criteria, all mixtures and the commercial fertilizer are considered ‘easy-flowing’ powders, while raw material C and the moistened fertilizer at 7.5% moisture content are classified as ‘very cohesive’.
In conclusion, the parameters obtained from traditional shear testing — which quantify cohesion, estimate the internal friction angle, and define the flow function of particulate materials — are not capable of providing a clear distinction between the behaviors of mixtures or fertilizer samples with varying moisture contents under low consolidation stresses. In contrast, the aeration test effectively identified distinct behaviors among all tested samples, offering a viable alternative for cohesion assessment in loose conditions. Therefore, aeration tests and basic flow energy (BFE) can serve as valuable tools for predicting flowability and assessing the potential for caking in particulate and moist materials, as they are simpler and faster than traditional shear tests.
5. Conclusions
The synthesis of research on powder properties like flowability, density, and cohesion provides a comprehensive framework that can be applied to enhance fertilizer formulations, application and handling. Integrating findings from different studies offers a multidimensional view of how individual material characteristics interact within various environmental and mechanical contexts to affect overall product performance.
The implications of this synthesis are significant for the agricultural industry. Manufacturers can improve product reliability and enhance usability by understanding and manipulating the powder properties of fertilizers or their raw materials. This leads to more precise nutrient application, reduced environmental impact, and improved crop yields. Furthermore, these insights help drive innovation in fertilizer production, such as developing custom-tailored formulations that address specific soil deficiencies or crop needs.
This study effectively analyzed the impact of moisture content on the flowability and compressibility of commercial and experimental fertilizer mixtures, which are parameters directly related to caking phenomena generally observed in fertilizers when stored. Several key findings emerged:
- Moisture significantly influences particle size due to agglomeration, enhances cohesion, reduces powder flowability, and harms fluidization conditions.
- The inherent properties of the raw materials, such as particle size and density, primarily dictated the flowability and compressibility of the fertilizers.
- For these specific fertilizers, samples with 5.0 % and 7.5 % moisture content exhibited similar physical properties, suggesting that the extent of agglomeration was attempted at the pendular state of saturation. The most pronounced effects on powder properties and, thus, on the propensity for caking, were observed at moisture content over 3.0 %, suggesting a limit condition to fertilizer packing.
- Among the raw materials, the Zinc source (Raw Material C) exhibited the most pronounced impact on the flow properties of the mixtures. Mixtures with a higher proportion of Zinc required more energy to flow, confirming its role as a critical factor in the formulation of these fertilizers.
- Among the raw materials, the Zinc source (Raw Material C) exhibited the most pronounced impact on the flow properties of the mixtures. Mixtures with a higher proportion of Zinc.
- At a loose state of stress, typically encountered during fertilizer handling, the aeration test effectively identified distinct behaviors and serves as a valuable tool for predicting flowability and assessing the potential for caking in particulate and moist materials.
The findings from this study provide essential insights into the design and optimization of fertilizer mixtures for agricultural applications.
Author Contributions
B.F.O.: writing – original draft, investigation, formal analysis, visualization and methodology; R.C.: writing - review and editing, resources, supervision, conceptualization, project administration and data curation, All authors have read and agreed to the published version of the manuscript.
Funding
This study was financed in part by the Coordenação de Aperfeiçoamento de Pessoal de Nível Superior – Brasil (CAPES) – Finance Code 001 and by the Centro Universitário da Fundação Educacional Inaciana Padre Sabóia de Medeiros (FEI) – Brasil.
Institutional Review Board Statement
Not applicable.
Informed Consent Statement
Not applicable.
Data Availability Statement
The data supporting reported results can be accessed via email for the corresponding author (rcondotta@fei.edu.br).
Acknowledgments
The authors would like to acknowledge the structural support provided by Centro Universitário FEI and the financial support from CAPES. During the preparation of this manuscript, the authors did not use AI to generate content. However, AI-based tools were employed to enhance the English language, specifically Grammarly® software, to improve correctness, clarity, engagement, and delivery, as the authors are non-native speakers. The authors have reviewed and edited the output and take full responsibility for the content.
Conflicts of Interest
The authors declare no conflicts of interest.
References
- Global Footprint Network, 2023. https://data.footprintnetwork.org/#/countryTrends? 5001.
- Alexandratos, N.; Bruinsma, J. World agriculture towards 2030/2050: The 2012 revision. ESA Working paper No. 12-03, FAO. 2012. http://www.fao.
- Ulusal, A.; Avsar, C. Understanding caking phenomena in industrial fertilizers: a review. Chem. Biochem. Eng. Q. 2020, 34, 209–222. [Google Scholar] [CrossRef]
- Charles, H.; Godfray, J.; Crute I., R.; Haddad, L.; Lawrence, D.; Muir J., F.; Nisbett, N.; Pretty, J.; Robinson, S.; Toulmin, C.; Whiteley, R. The future of the global food system. Phil. Trans. R. Soc. B 2010, 365, 2769–2777. [Google Scholar] [CrossRef]
- Reetz, H. F. Fertilizers and Their Efficient Use. International Fertilizer Industry Association, IFA. 2016.
- Albadarin, A. B.; Lewis, T. D.; Walker, G. M. ; Granulated polyhalite fertilizer caking propensity. Powder Technology 2017, 308, 193–199. [Google Scholar] [CrossRef]
- Avsar, C. & Ulusal, A. Granular fertilizer caking: A research on the performance evaluation of coating agents. Eur. J. Chem. 2021, 12, 273–278. [Google Scholar] [CrossRef]
- Calvert, G.; Curcic, N.; Redhead, N.; Ahmadian, H.; Owen, C.; Beckett, D.; Ghadiri, M. A new environmental bulk powder caking tester. Powder Technology 2013, 249, 323–329. [Google Scholar] [CrossRef]
- Stevens, N.; Tedeschi, S.; Powers, K.; Moudgil, B.; El-Shall, H. Controlling unconfined yield strength in a humid environment through surface modification of powders. Powder Technology 2009, 191, 170–175. [Google Scholar] [CrossRef]
- Navar, R.; Semelsberger, T.A.; Davis, B.L. Impacts of caking on corn stover – An assessment of moisture content and consolidating pressure. Powder Technology 2024, 438, 119661. [Google Scholar] [CrossRef]
- Hartmann, M.; Palzer, S. Caking of amorphous powders — Material aspects, modelling and applications. Powder Technology 2011, 206, 112–121. [Google Scholar] [CrossRef]
- Brockbank, K.; Armstrong, B.; Chandorkar, Y.; & Freeman, T. Understanding Powder Caking as a Consequence of a Range of Mechanisms by Means of Powder Rheometry. Particulate Science and Technology 2015, 33, 102–108. [Google Scholar] [CrossRef]
- M. Rock, J. Schwedes, Investigations on the caking behaviour of bulk solids—macroscale experiments. Powder Technol. 2005, 157, 121–127. [Google Scholar] [CrossRef]
- Wahl, M.; Bröckel, U.; Brendel, L.; Feise, H.J.; Weigl, B.; Röck, M.; Schwedes, J. Understanding powder caking: Predicting caking strength from individual particle contacts. Powder Technology 2008, 188, 147–152. [Google Scholar] [CrossRef]
- Brockbank, K. , Armstrong, B., Clayton, J. Measurement and quantification of caking in excipients and food products with emphasis on the non-homogeneous interaction with ambient moisture. Particuology 2021, 56, 75–83. [Google Scholar] [CrossRef]
- Feeney, J. , Fitzpatrick, J.J. Visualization of the caking behaviour between two powder particles. Part. Sci. Technol. 2011, 29, 397–406. [Google Scholar] [CrossRef]
- Zafar, U. , Vivacqua, V., Calvert, G., Ghadiri, M., Cleaver, J.A.S. A review of bulk powder caking. Powder Technology 2017, 313, 389–401. [Google Scholar] [CrossRef]
- Iveson, S. , Page, N. The tensile bond strength developed between liquid bound pellets during compression. Powder Technology 2001, 117, 113–122. [Google Scholar] [CrossRef]
- Thakur, S.C.; Ahmadian, H.; Sun, J.; Ooi, J.Y. An experimental and numerical study of packing, compression, and caking behaviour of detergent powders. Particuology 2014, 12, 2–12. [Google Scholar] [CrossRef]
- Fu, X.; Huck, D.; Makein, L.; Armstrong, B.; Willen, U.; Freeman, T. Effect of particle shape and size on flow properties of lactose powders. Particuology 2012, 10, 203–208. [Google Scholar] [CrossRef]
- Shah, D.S.; Moravkar, K.K.; Jha, D.K.; Lonkar, V.; Amin, P.D.; Chalikwar, S.S. A concise summary of powder processing methodologies for flow enhancement. Heliyon 2023, 9, e16498. [Google Scholar] [CrossRef]
- Garg, V.; Mallick, S.S.; Garcia-Trinanes, P.; Berry, R.J. An investigation into the flowability of fine powders used in pharmaceutical industries. Powder Technology 2018, 336, 375–382. [Google Scholar] [CrossRef]
- Fitzpatrick, J.J.; Barry, K.; Cerqueira, P.S.M.; Iqbal, T. O’Neill, J.; Roos, Y.H. Effect of composition and storage conditions on the flowability of dairy powders. International Dairy Journal 2007, 17, 383–392. [Google Scholar] [CrossRef]
- Salehi, H.; Berry, R.; Deng, T.; Larsson, S.H.; Farnish, R.; Bradley, M. Development and application of a novel cake strength tester. Powder Technology 2019, 350, 36–42. [Google Scholar] [CrossRef]
- Althaus, T.O.; Windhab, E.J. Characterization of wet powder flowability by shear cell measurements and compaction curves. Powder Technology. [CrossRef]
- Chávez Montes, E.; Ardila Santamaría, N.; Gumy, J.-C. and Marchal, P. Moisture-induced caking of beverage powders. J. Sci. Food Agric. 2011, 91, 2582–2586. [Google Scholar] [CrossRef]
- Scicolone, J.V.; Metzger, M.; Koynov, S.; Anderson, K.; Takhistov, P.; Glasser, B.J. and Muzzio, F.J. Effect of liquid addition on the bulk and flow properties of fine and coarse glass beads. AIChE J. 2016, 62, 648–658. [Google Scholar] [CrossRef]
- Iveson, S.; Page, N. Dynamic strength of liquid-bound granular materials: the effect of particle size and shape. Powder Technology 2005, 152, 79–89. [Google Scholar] [CrossRef]
- Szulc, K.; Lenart, A. Effect of Agglomeration on Flowability of Baby Food Powders. Journal of Food Science 2010, 75, E276–E284. [Google Scholar] [CrossRef]
- Rutland D., W. , Fertilizer caking: mechanisms, influential factors and methods of prevention. Fertilizer Research 1991, 30, 99–114. [Google Scholar] [CrossRef]
- Silva, J.V.C.; O’Mahony, J.A. Flowability and wetting behaviour of milk protein ingredients as influenced by powder composition, particle size and microstructure. Int. J. Dairy Technol. 2017, 70, 277–286. [Google Scholar] [CrossRef]
- Freeman, R. Measuring the flow properties of consolidated, conditioned and aerated powders – a comparative study using a powder rheometer and a rotational shear cell. Powder Technol. 2007, 174, 25–33. [Google Scholar] [CrossRef]
- Leturia, M.; Benali, M.; Lagarde, S.; Ronga, I.; Saleh, K. Characterization of flow properties of cohesive powders: A comparative study of traditional and new testing methods. Powder Technology 2014, 253, 406–423. [Google Scholar] [CrossRef]
- Takeuchi, Y.; Tomita, T.; Kuroda, J.; Kageyu, A.; Yonekura, C.; Hiramura, Y.; Tahara, K.; Takeuchi, H. Characterization of mannitol granules and powder: A comparative study using two flowability testers. International Journal of Pharmaceutics 2018, 547, 106–113. [Google Scholar] [CrossRef]
- Pierrat, P.; Caram, H.; Agrawal, D. Effect of moisture on the yield locus of granular materials: theory of shift. Powder Technology 1998, 99, 220–227. [Google Scholar] [CrossRef]
- Richefeu, V.; Youssoufi, M.; Radjai, F. Shear strength properties of wet granular materials. Physical Review E 2006, 73, 1–11. [Google Scholar] [CrossRef]
- Collet, R.; Oulahna, D.; de Ryck, A.; Jezequel, P.H.; Martin, M. Mixing of a wet granular medium: Influence of the liquid addition method. Powder Technology 2011, 208, 367–371. [Google Scholar] [CrossRef]
Figure 1.
Fertilizer at real moisture content of (a) 2.5 %, (b) 3.0, (c) 5.0 % and (d) 7.5 %.
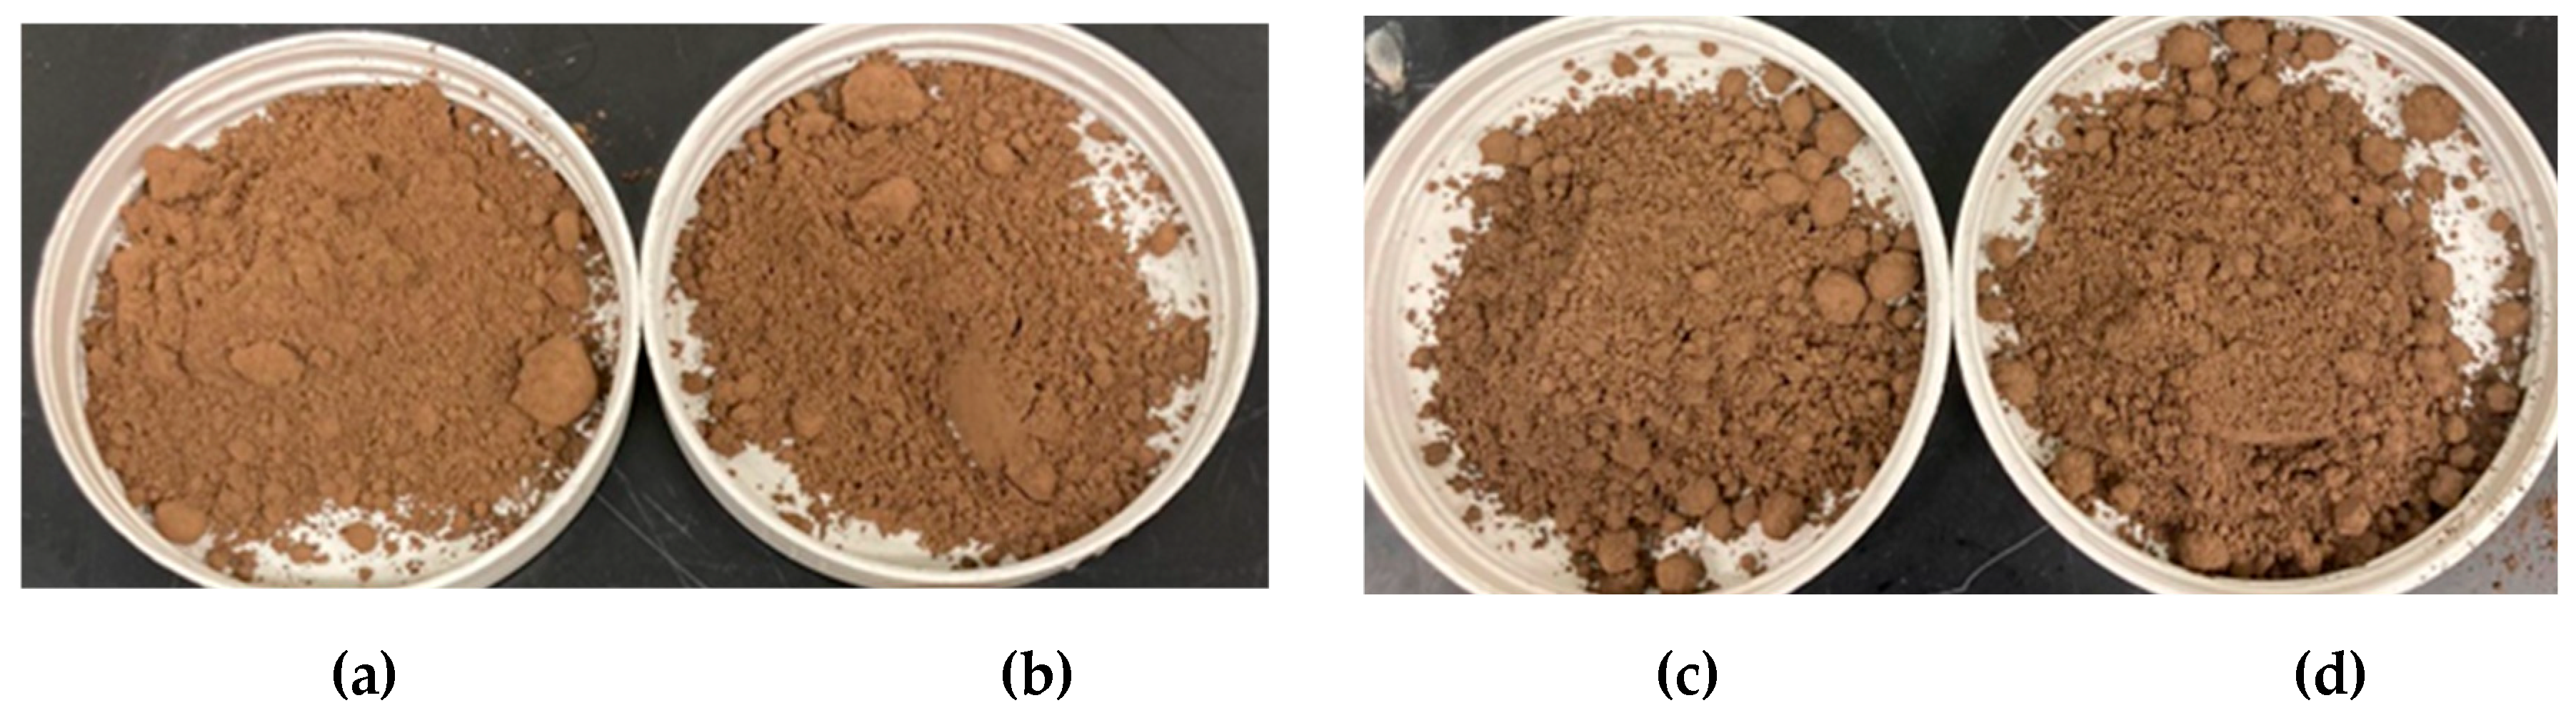
Figure 2.
Graphical results of (a) Basic Flow Energy (BFE) and (b) compression tests performed on moistened fertilizers.
Figure 2.
Graphical results of (a) Basic Flow Energy (BFE) and (b) compression tests performed on moistened fertilizers.
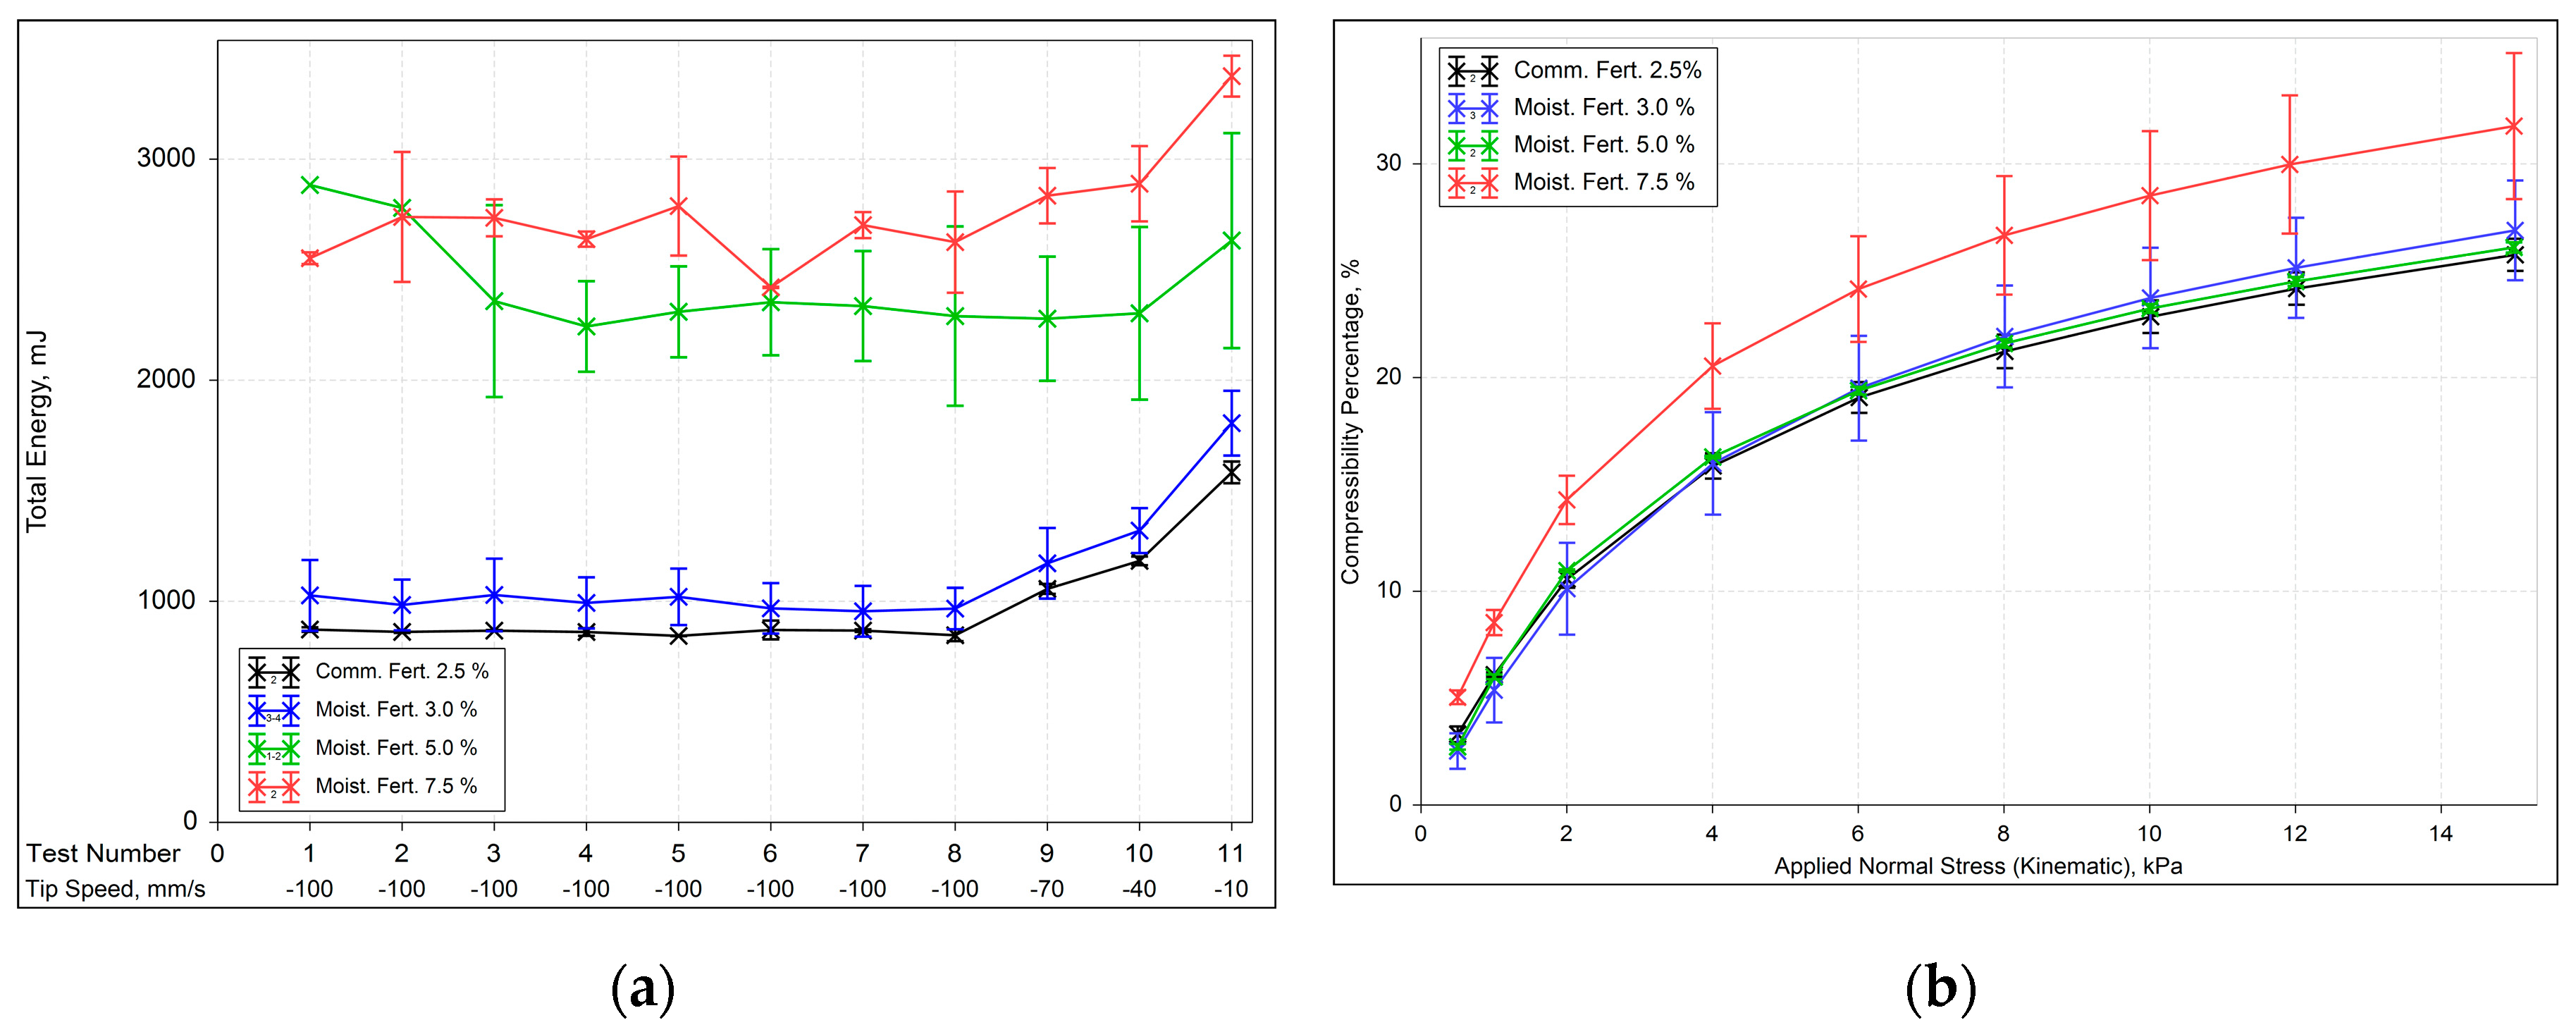
Figure 3.
Graphical results of (a) Basic Flow Energy (BFE) and (b) compression tests performed on raw materials.
Figure 3.
Graphical results of (a) Basic Flow Energy (BFE) and (b) compression tests performed on raw materials.
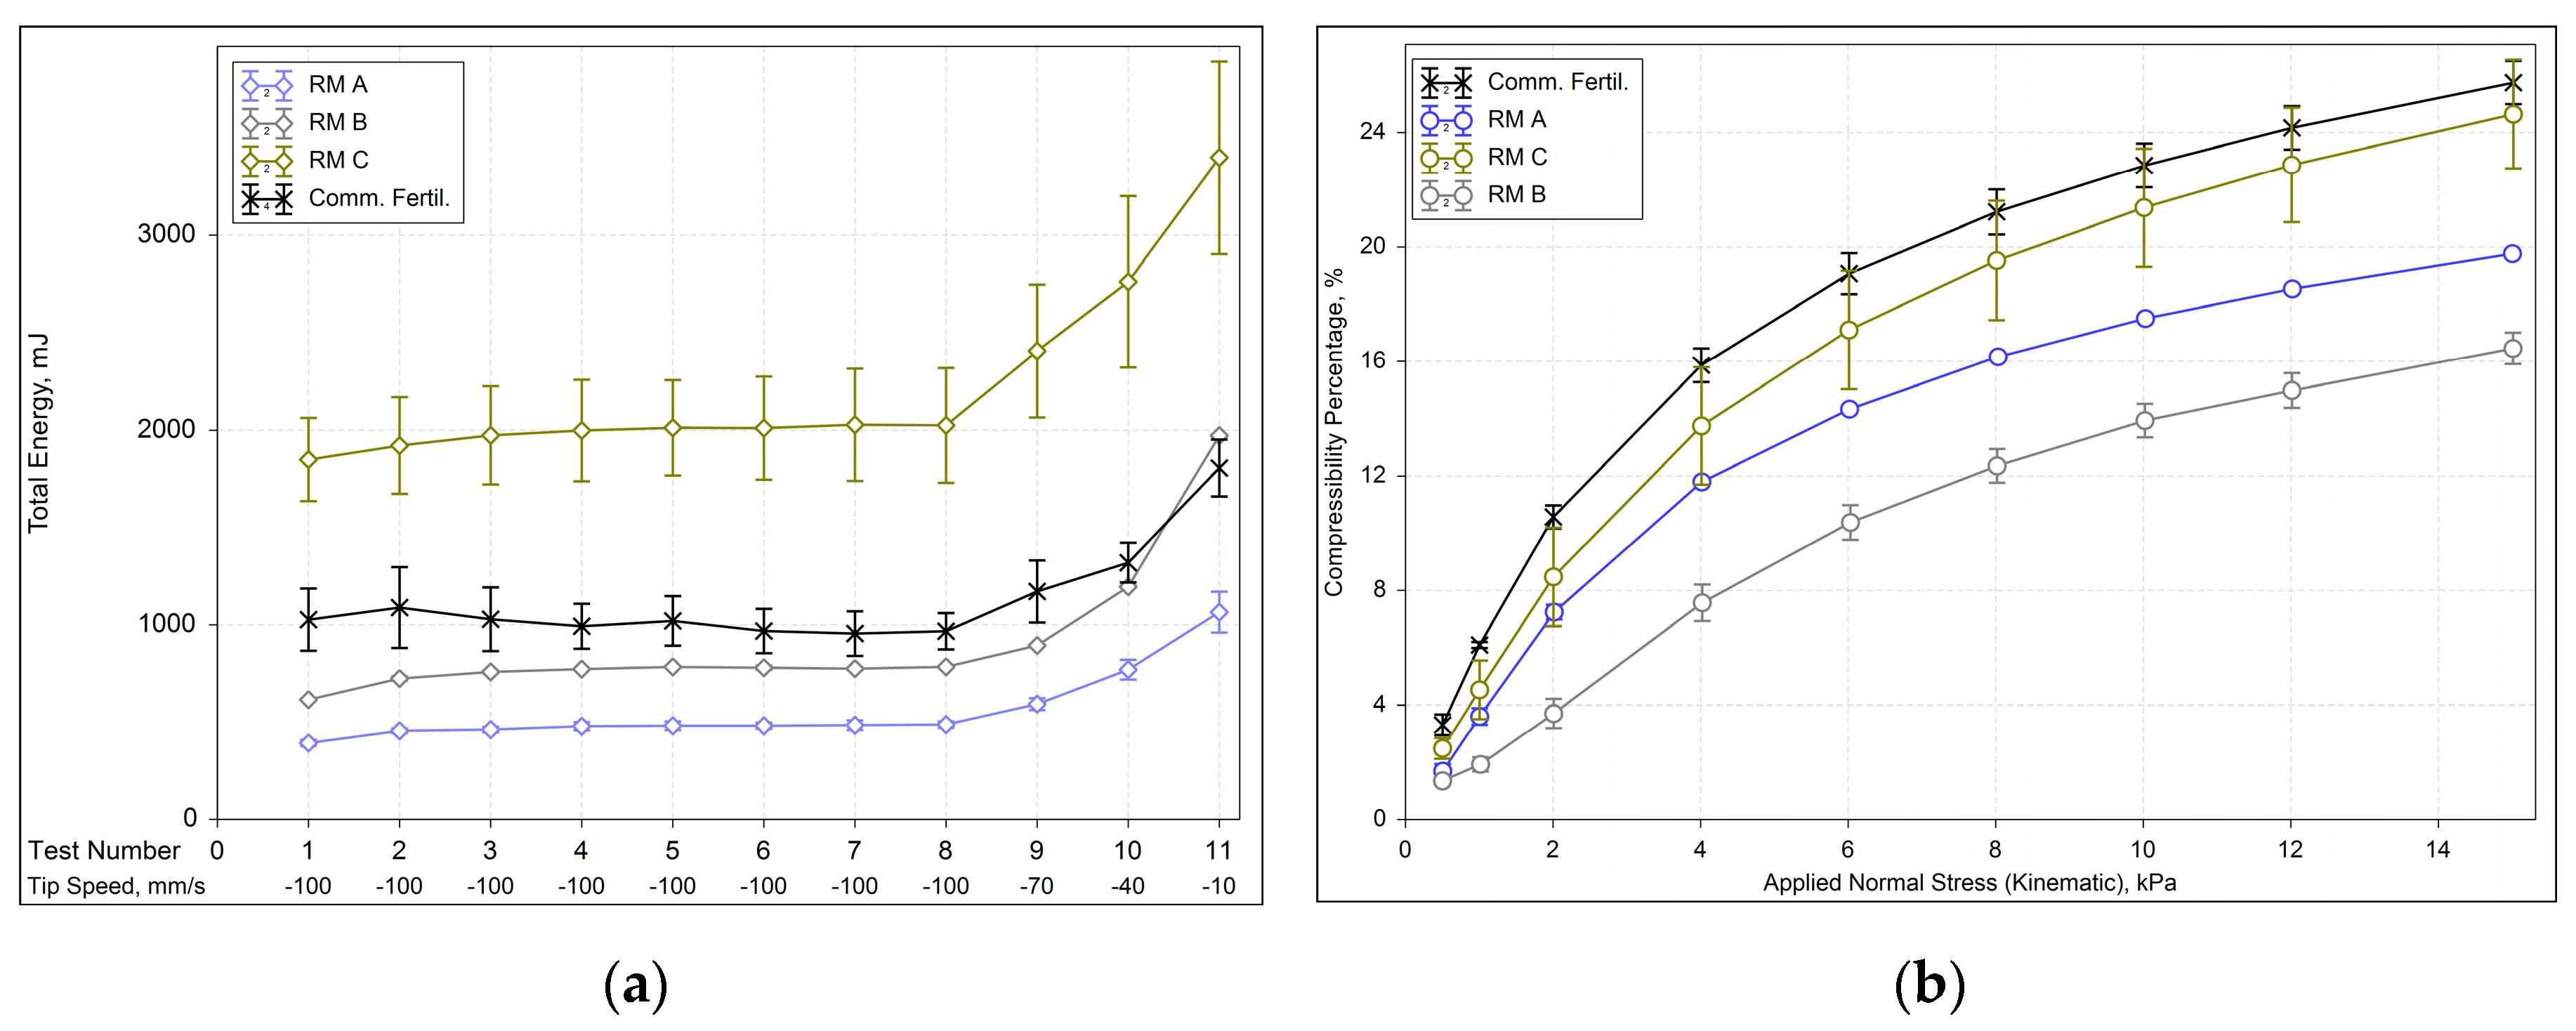
Figure 4.
Graphical results of (a) Basic Flow Energy (BFE) and (b) compression tests performed on prepared mixtures.
Figure 4.
Graphical results of (a) Basic Flow Energy (BFE) and (b) compression tests performed on prepared mixtures.
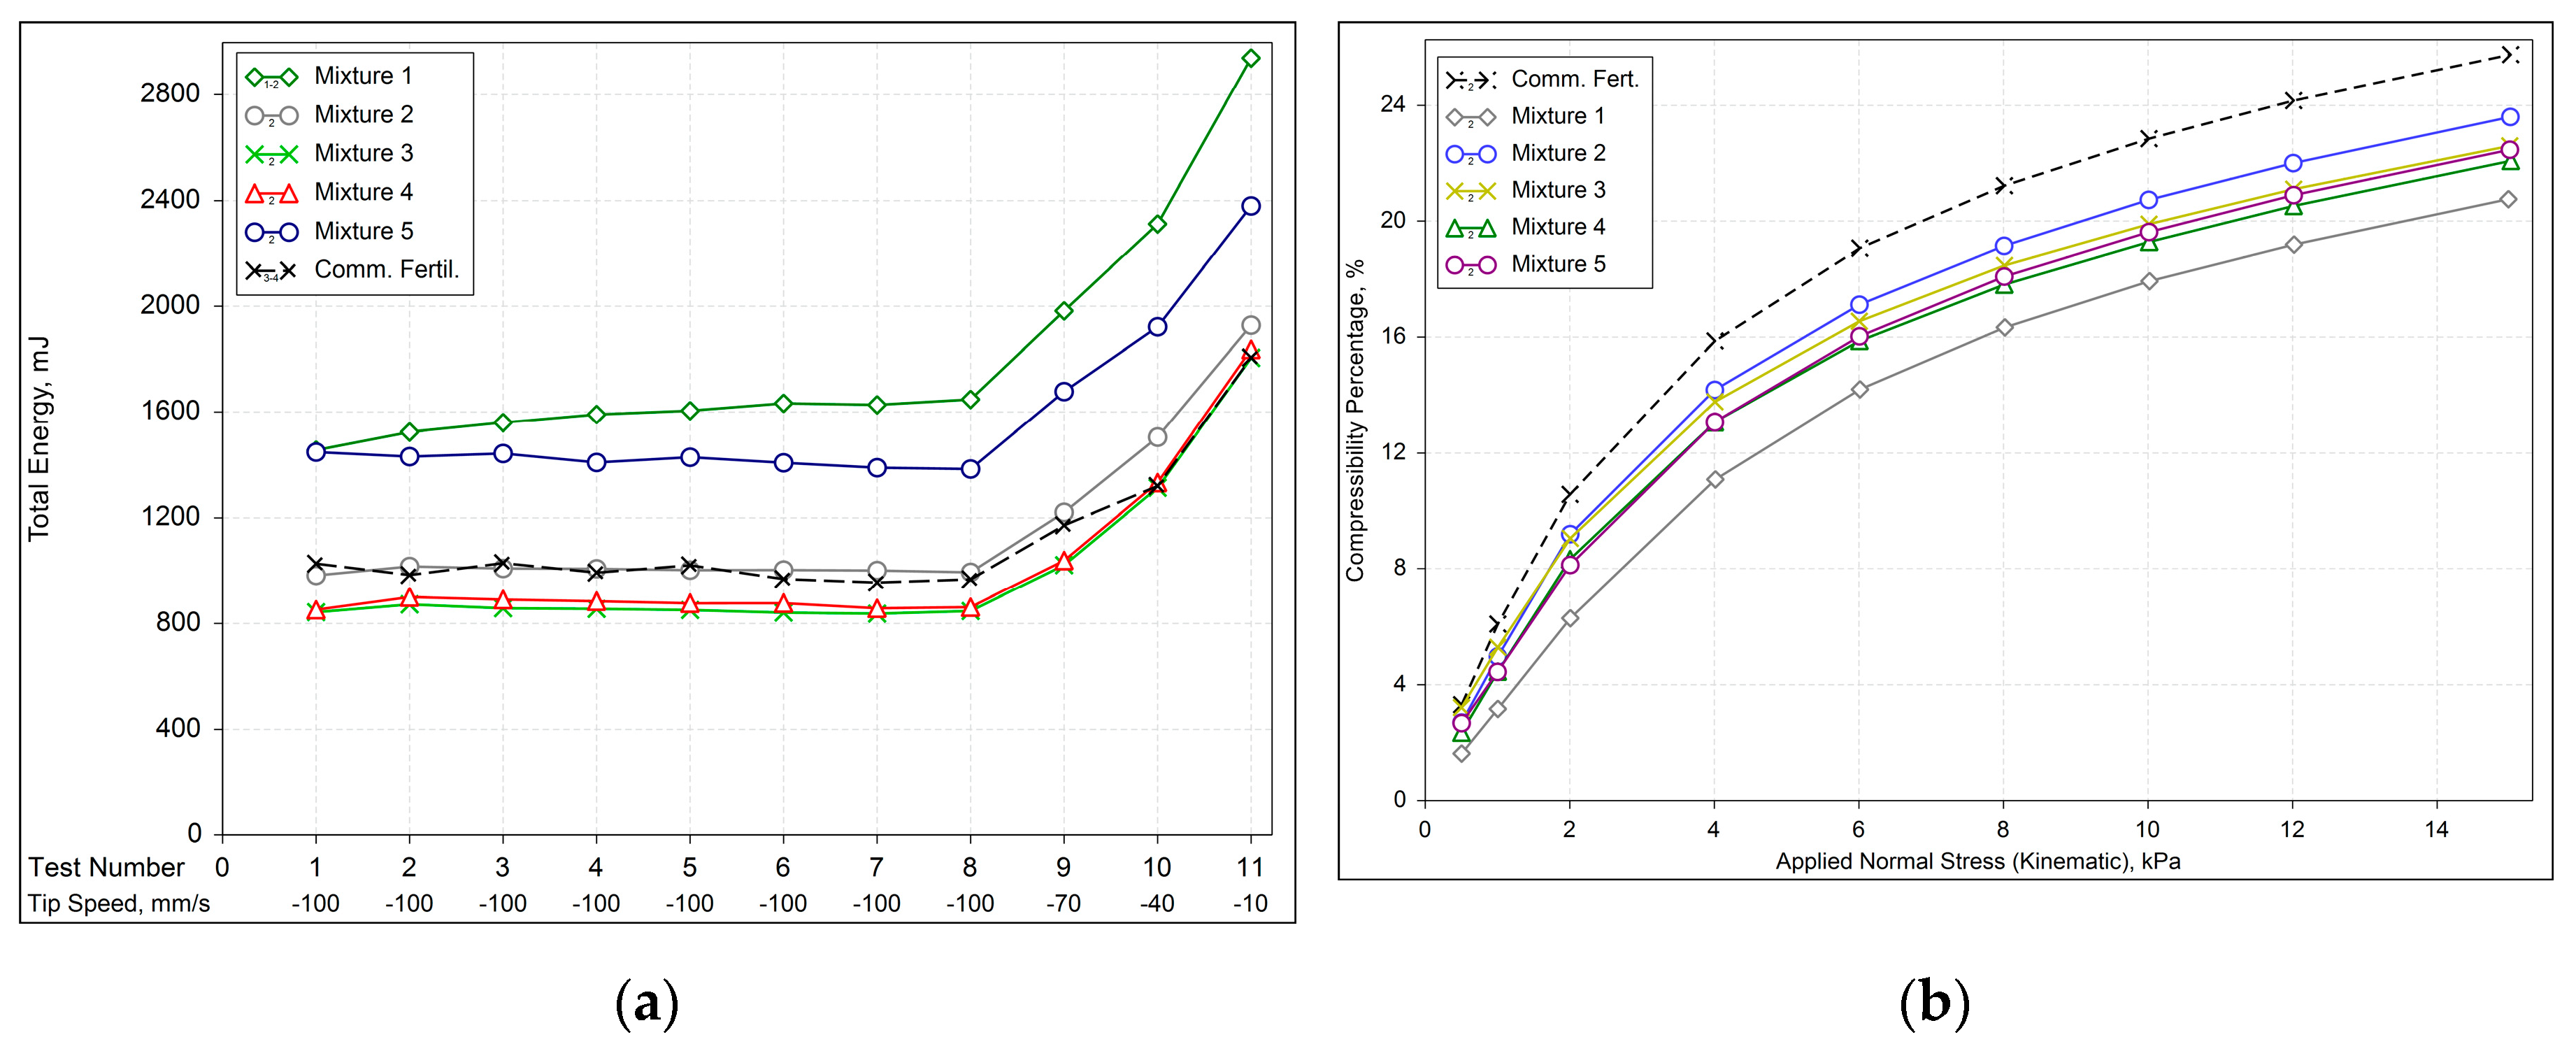
Figure 5.
Graphical results of aeration test for moistened fertilizers and raw materials.
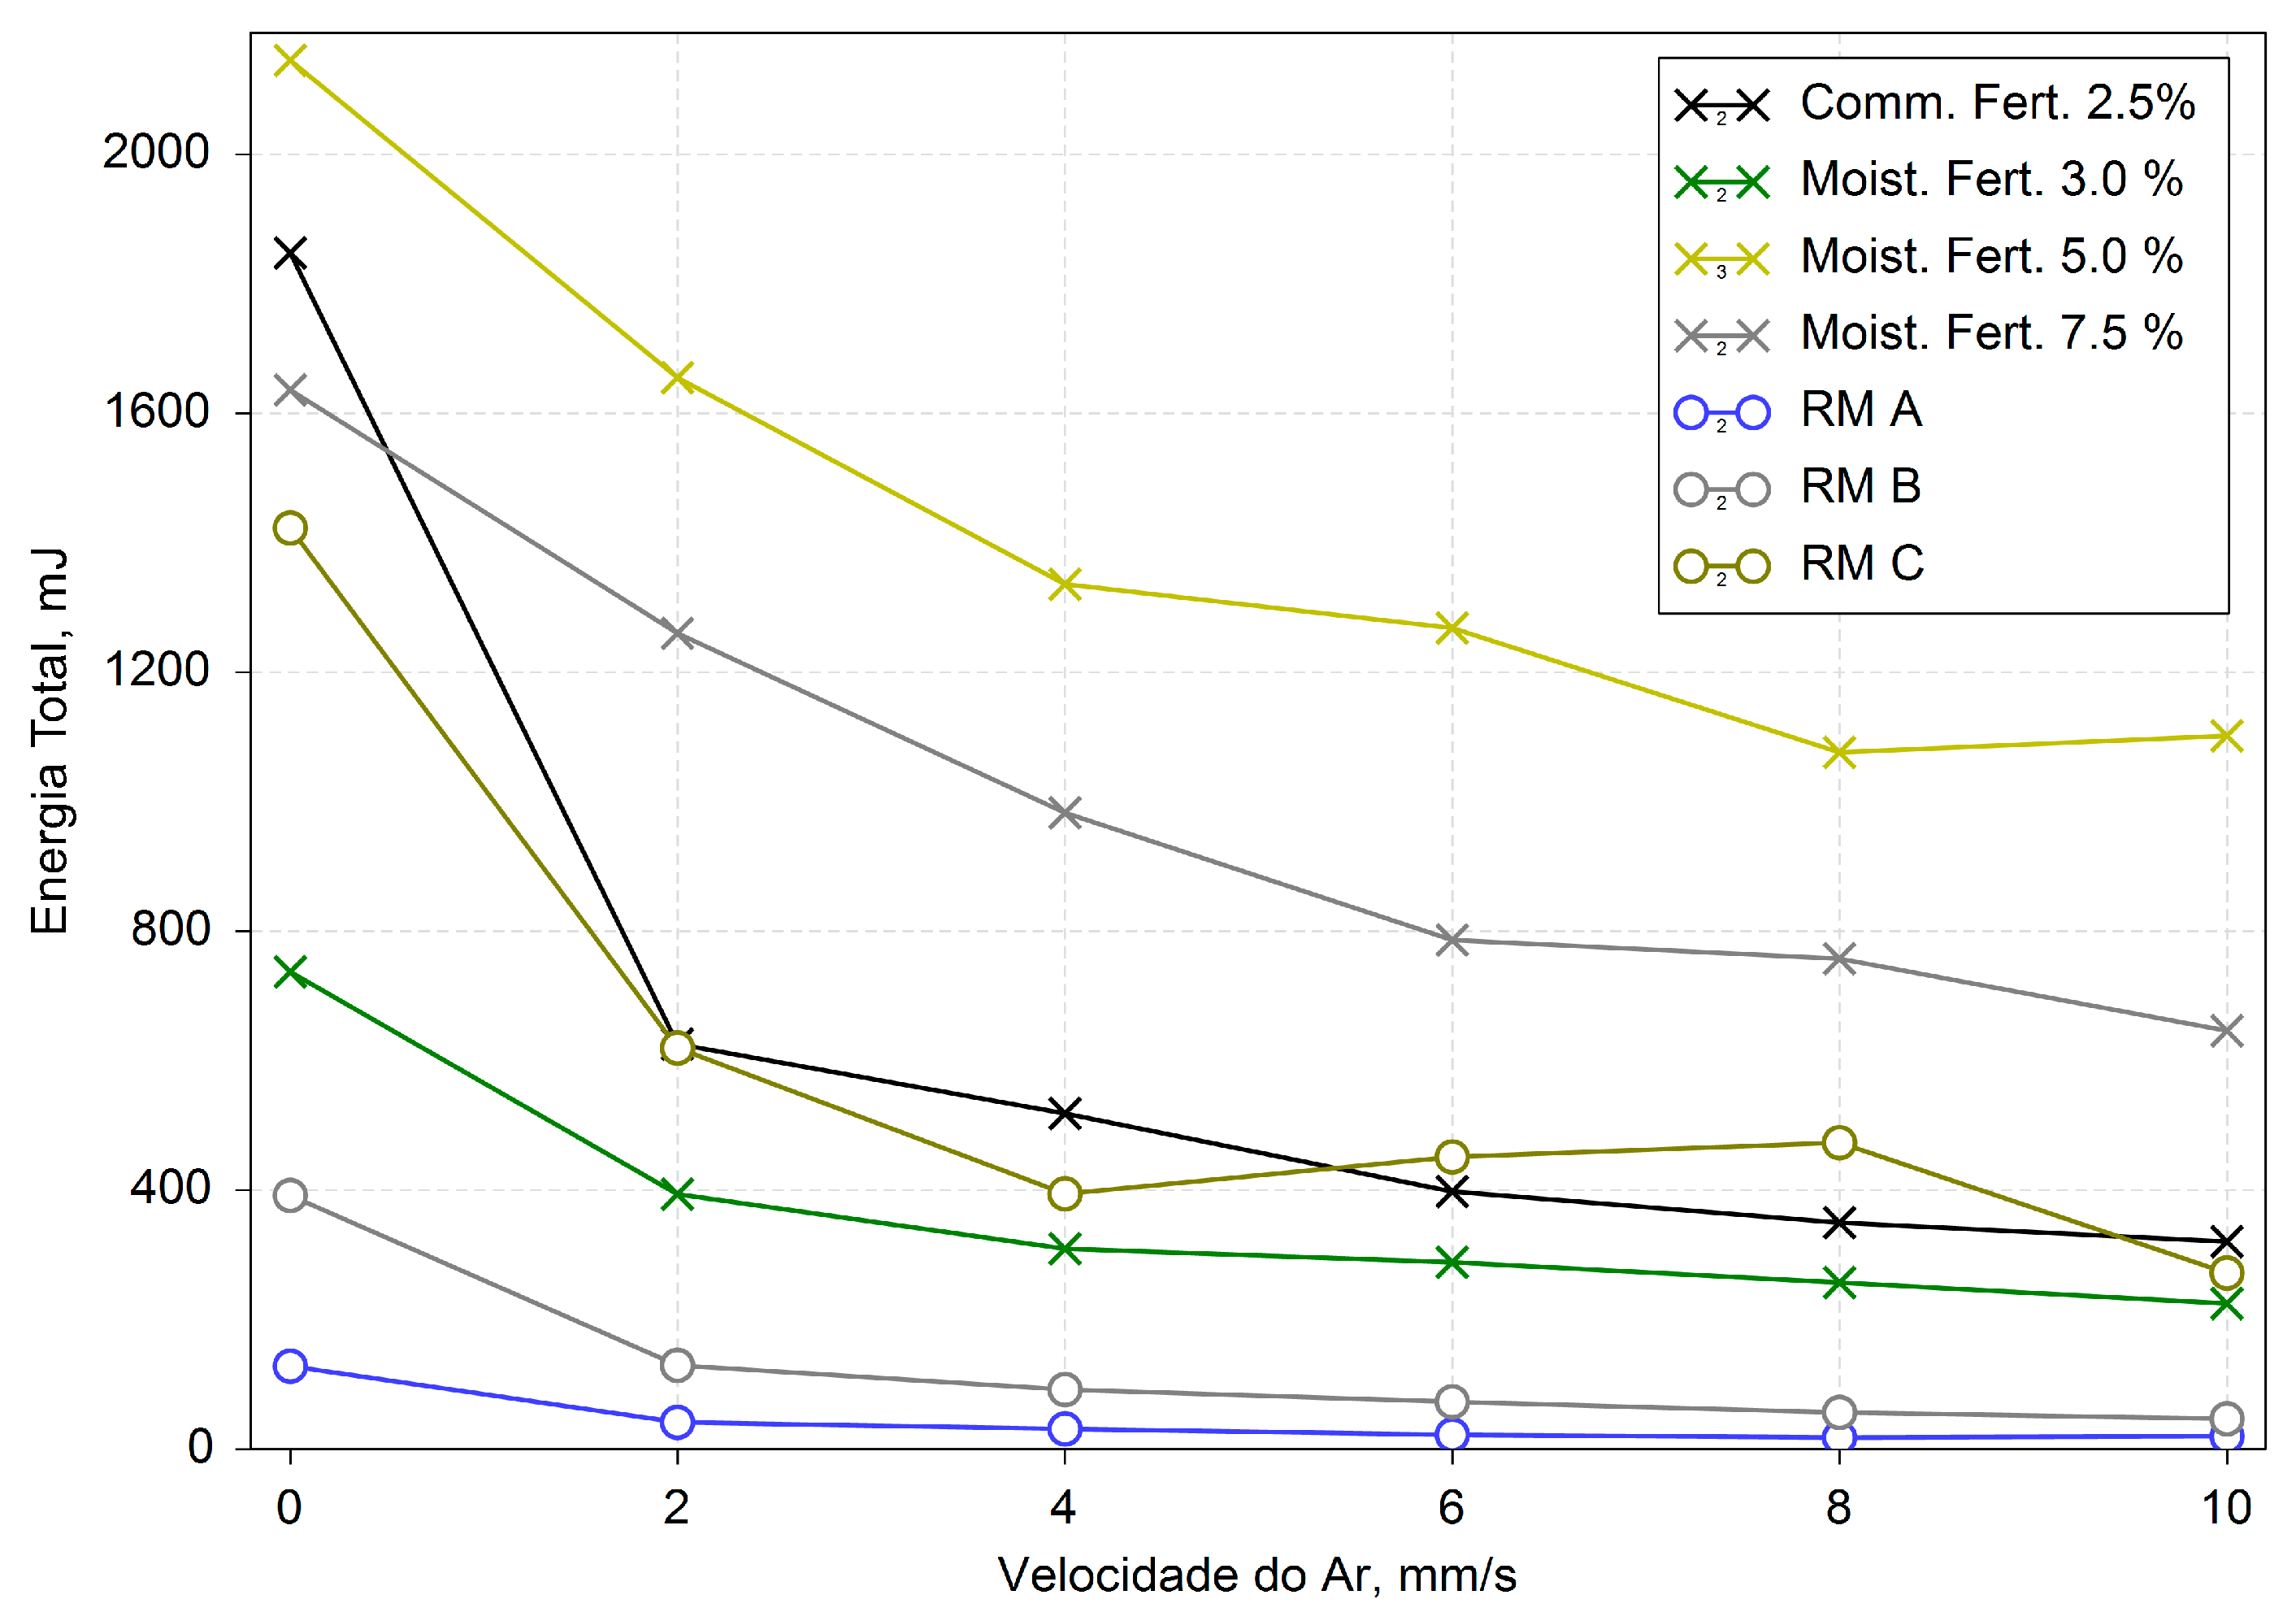
Figure 6.
Measured shear points and linearized yield loci of moistened fertilizers.
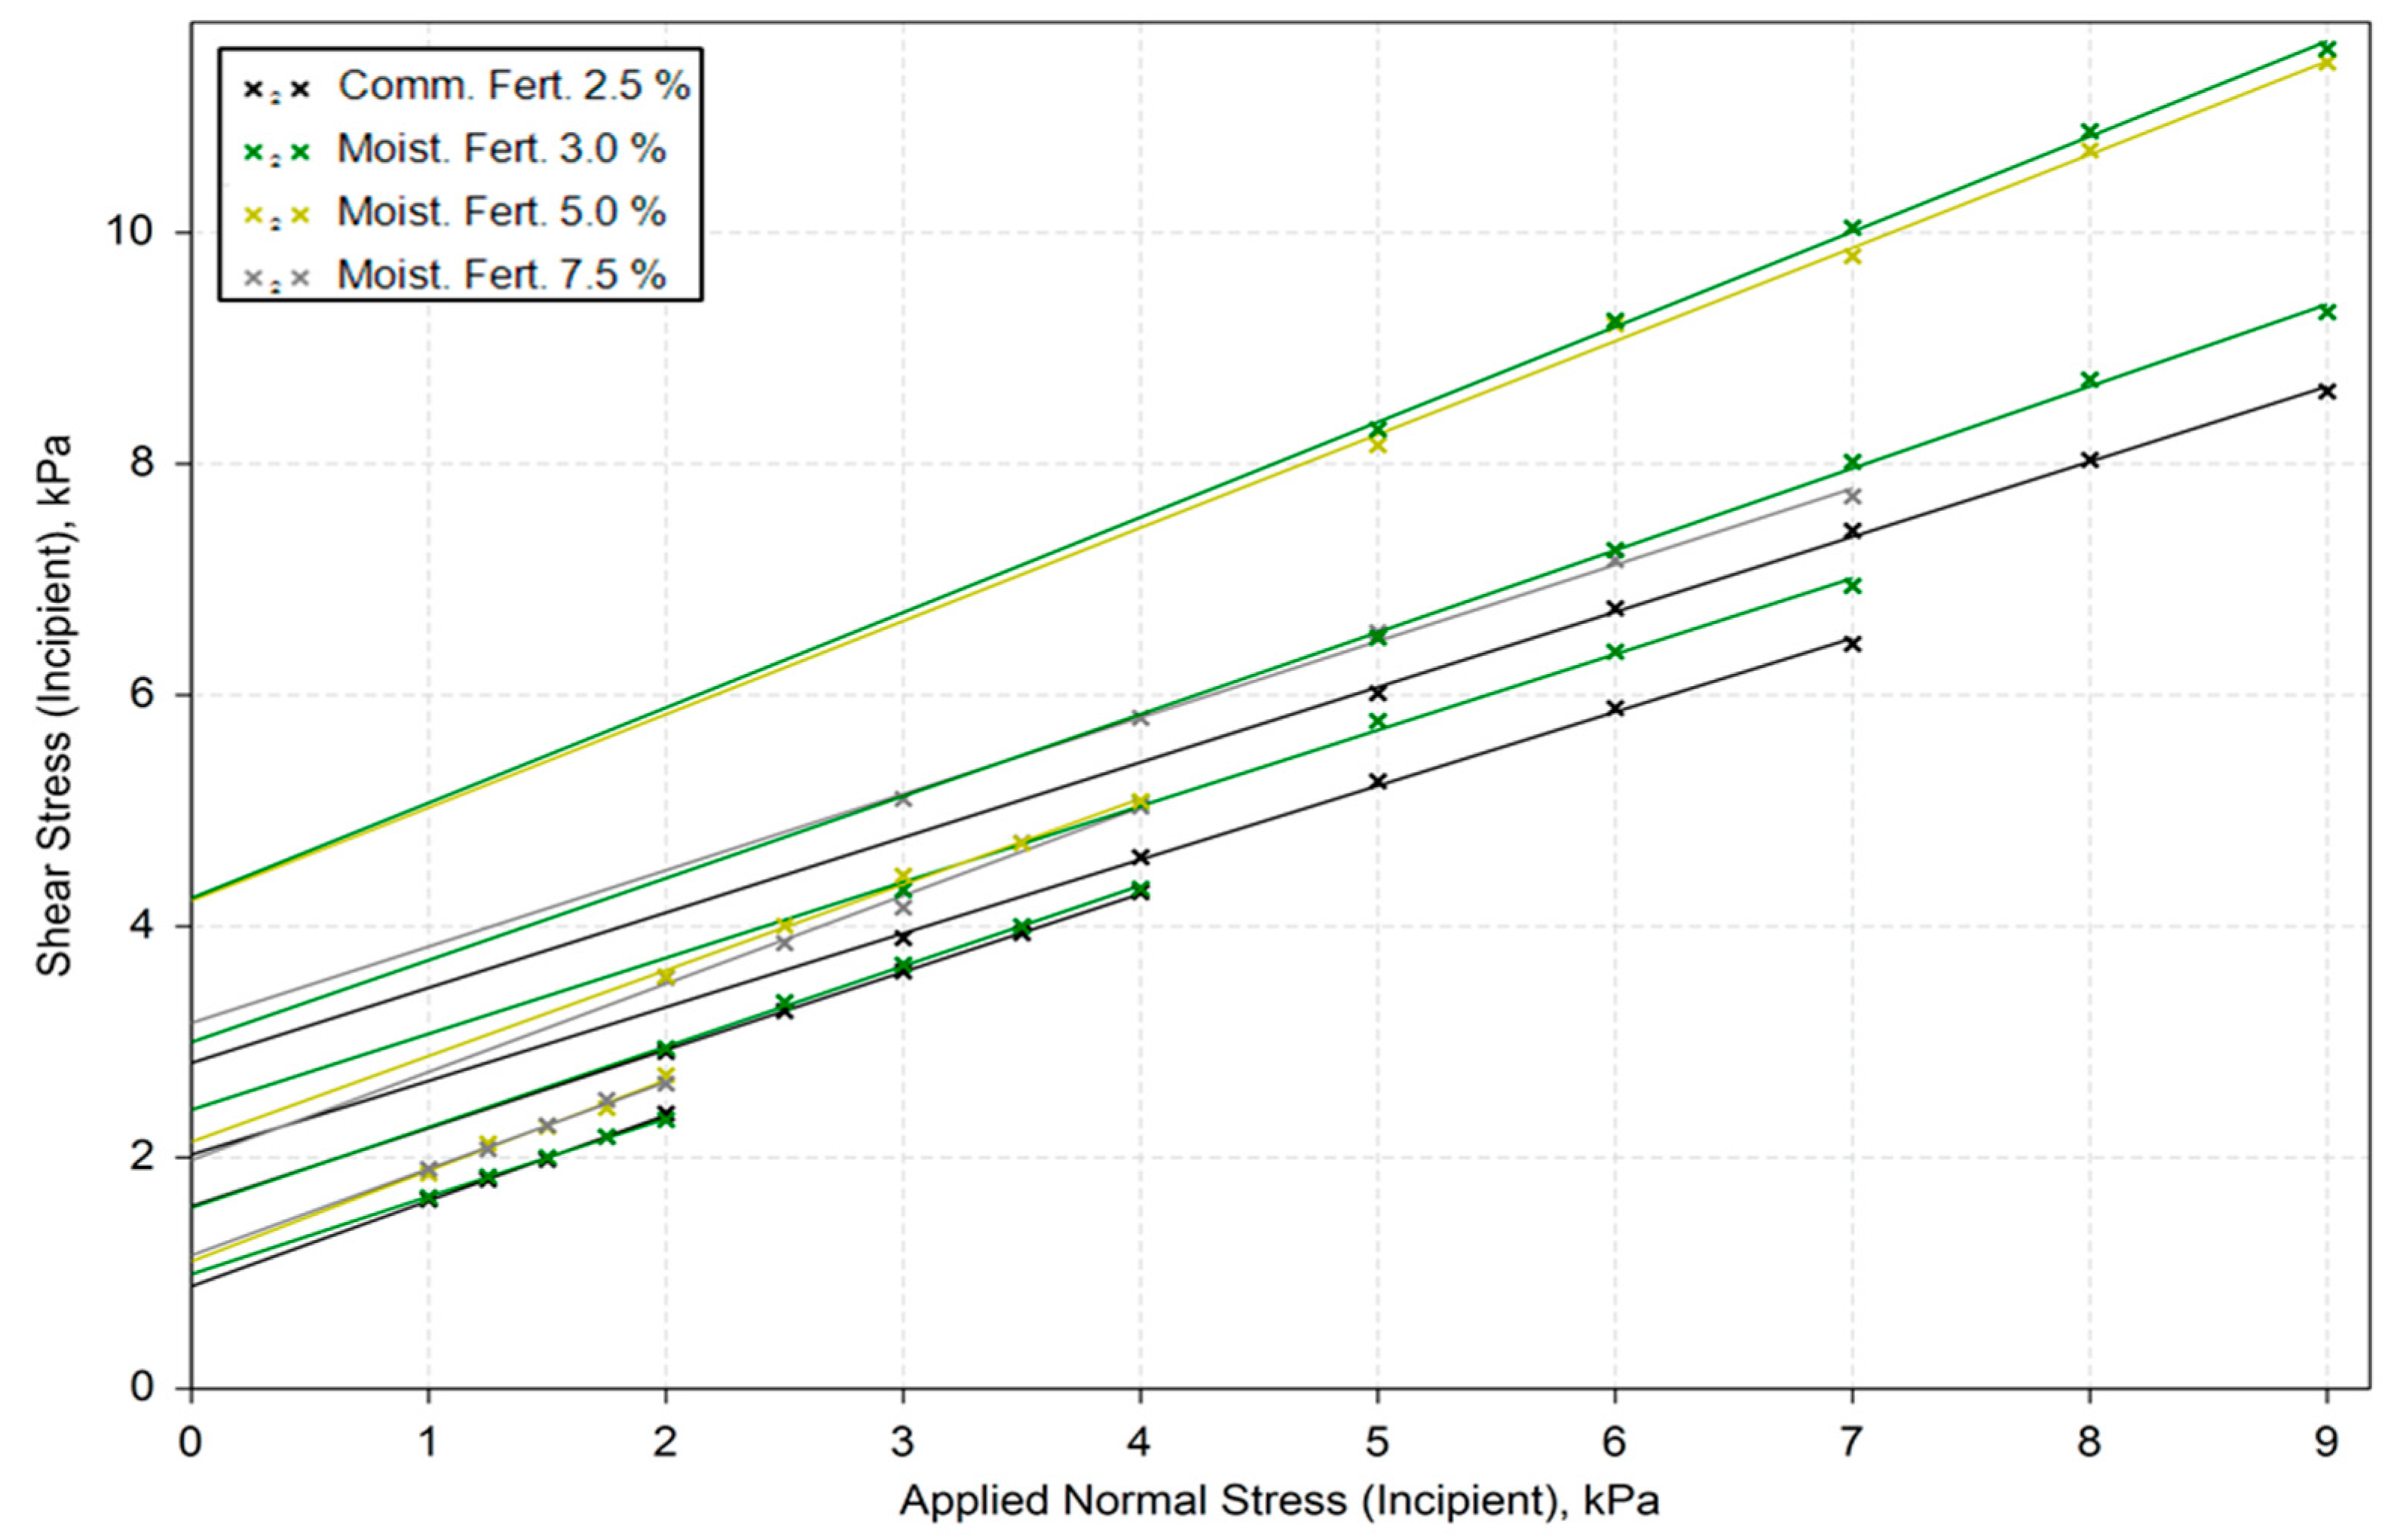
Figure 7.
Graphical representation of (a) the cohesion behavior of the commercial fertilizer under varying normal stress, and (b) the effective angle of internal friction (EAIF) of the samples as a function of consolidation stress.
Figure 7.
Graphical representation of (a) the cohesion behavior of the commercial fertilizer under varying normal stress, and (b) the effective angle of internal friction (EAIF) of the samples as a function of consolidation stress.
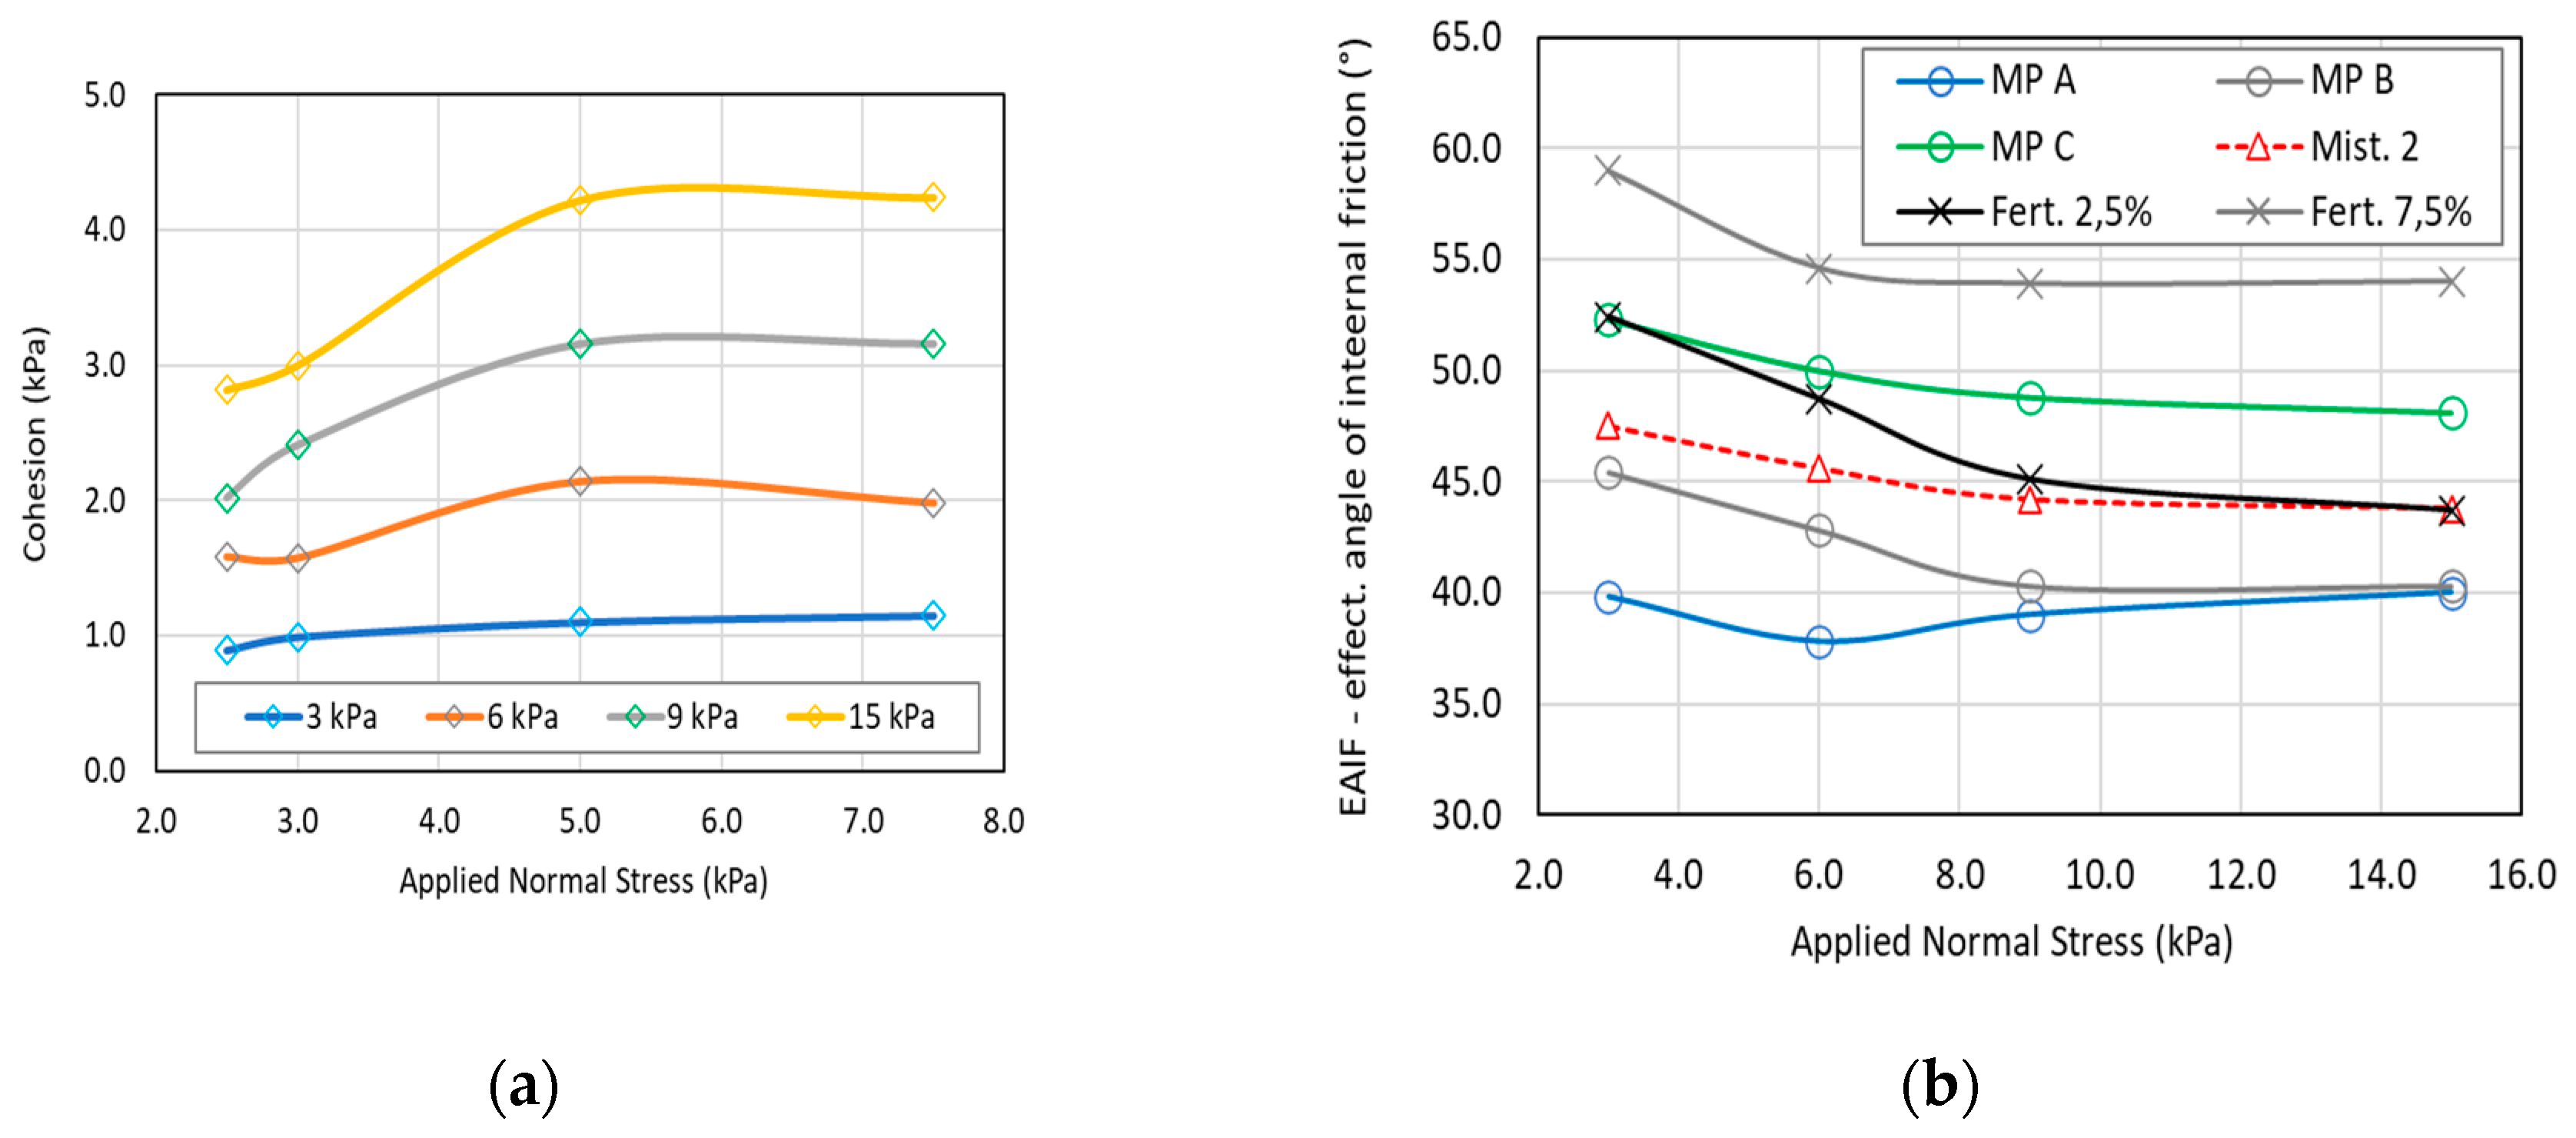
Figure 9.
Flow function of all mixtures compared to the moistened fertilizer, the commercial fertilizer, and raw material C.
Figure 9.
Flow function of all mixtures compared to the moistened fertilizer, the commercial fertilizer, and raw material C.
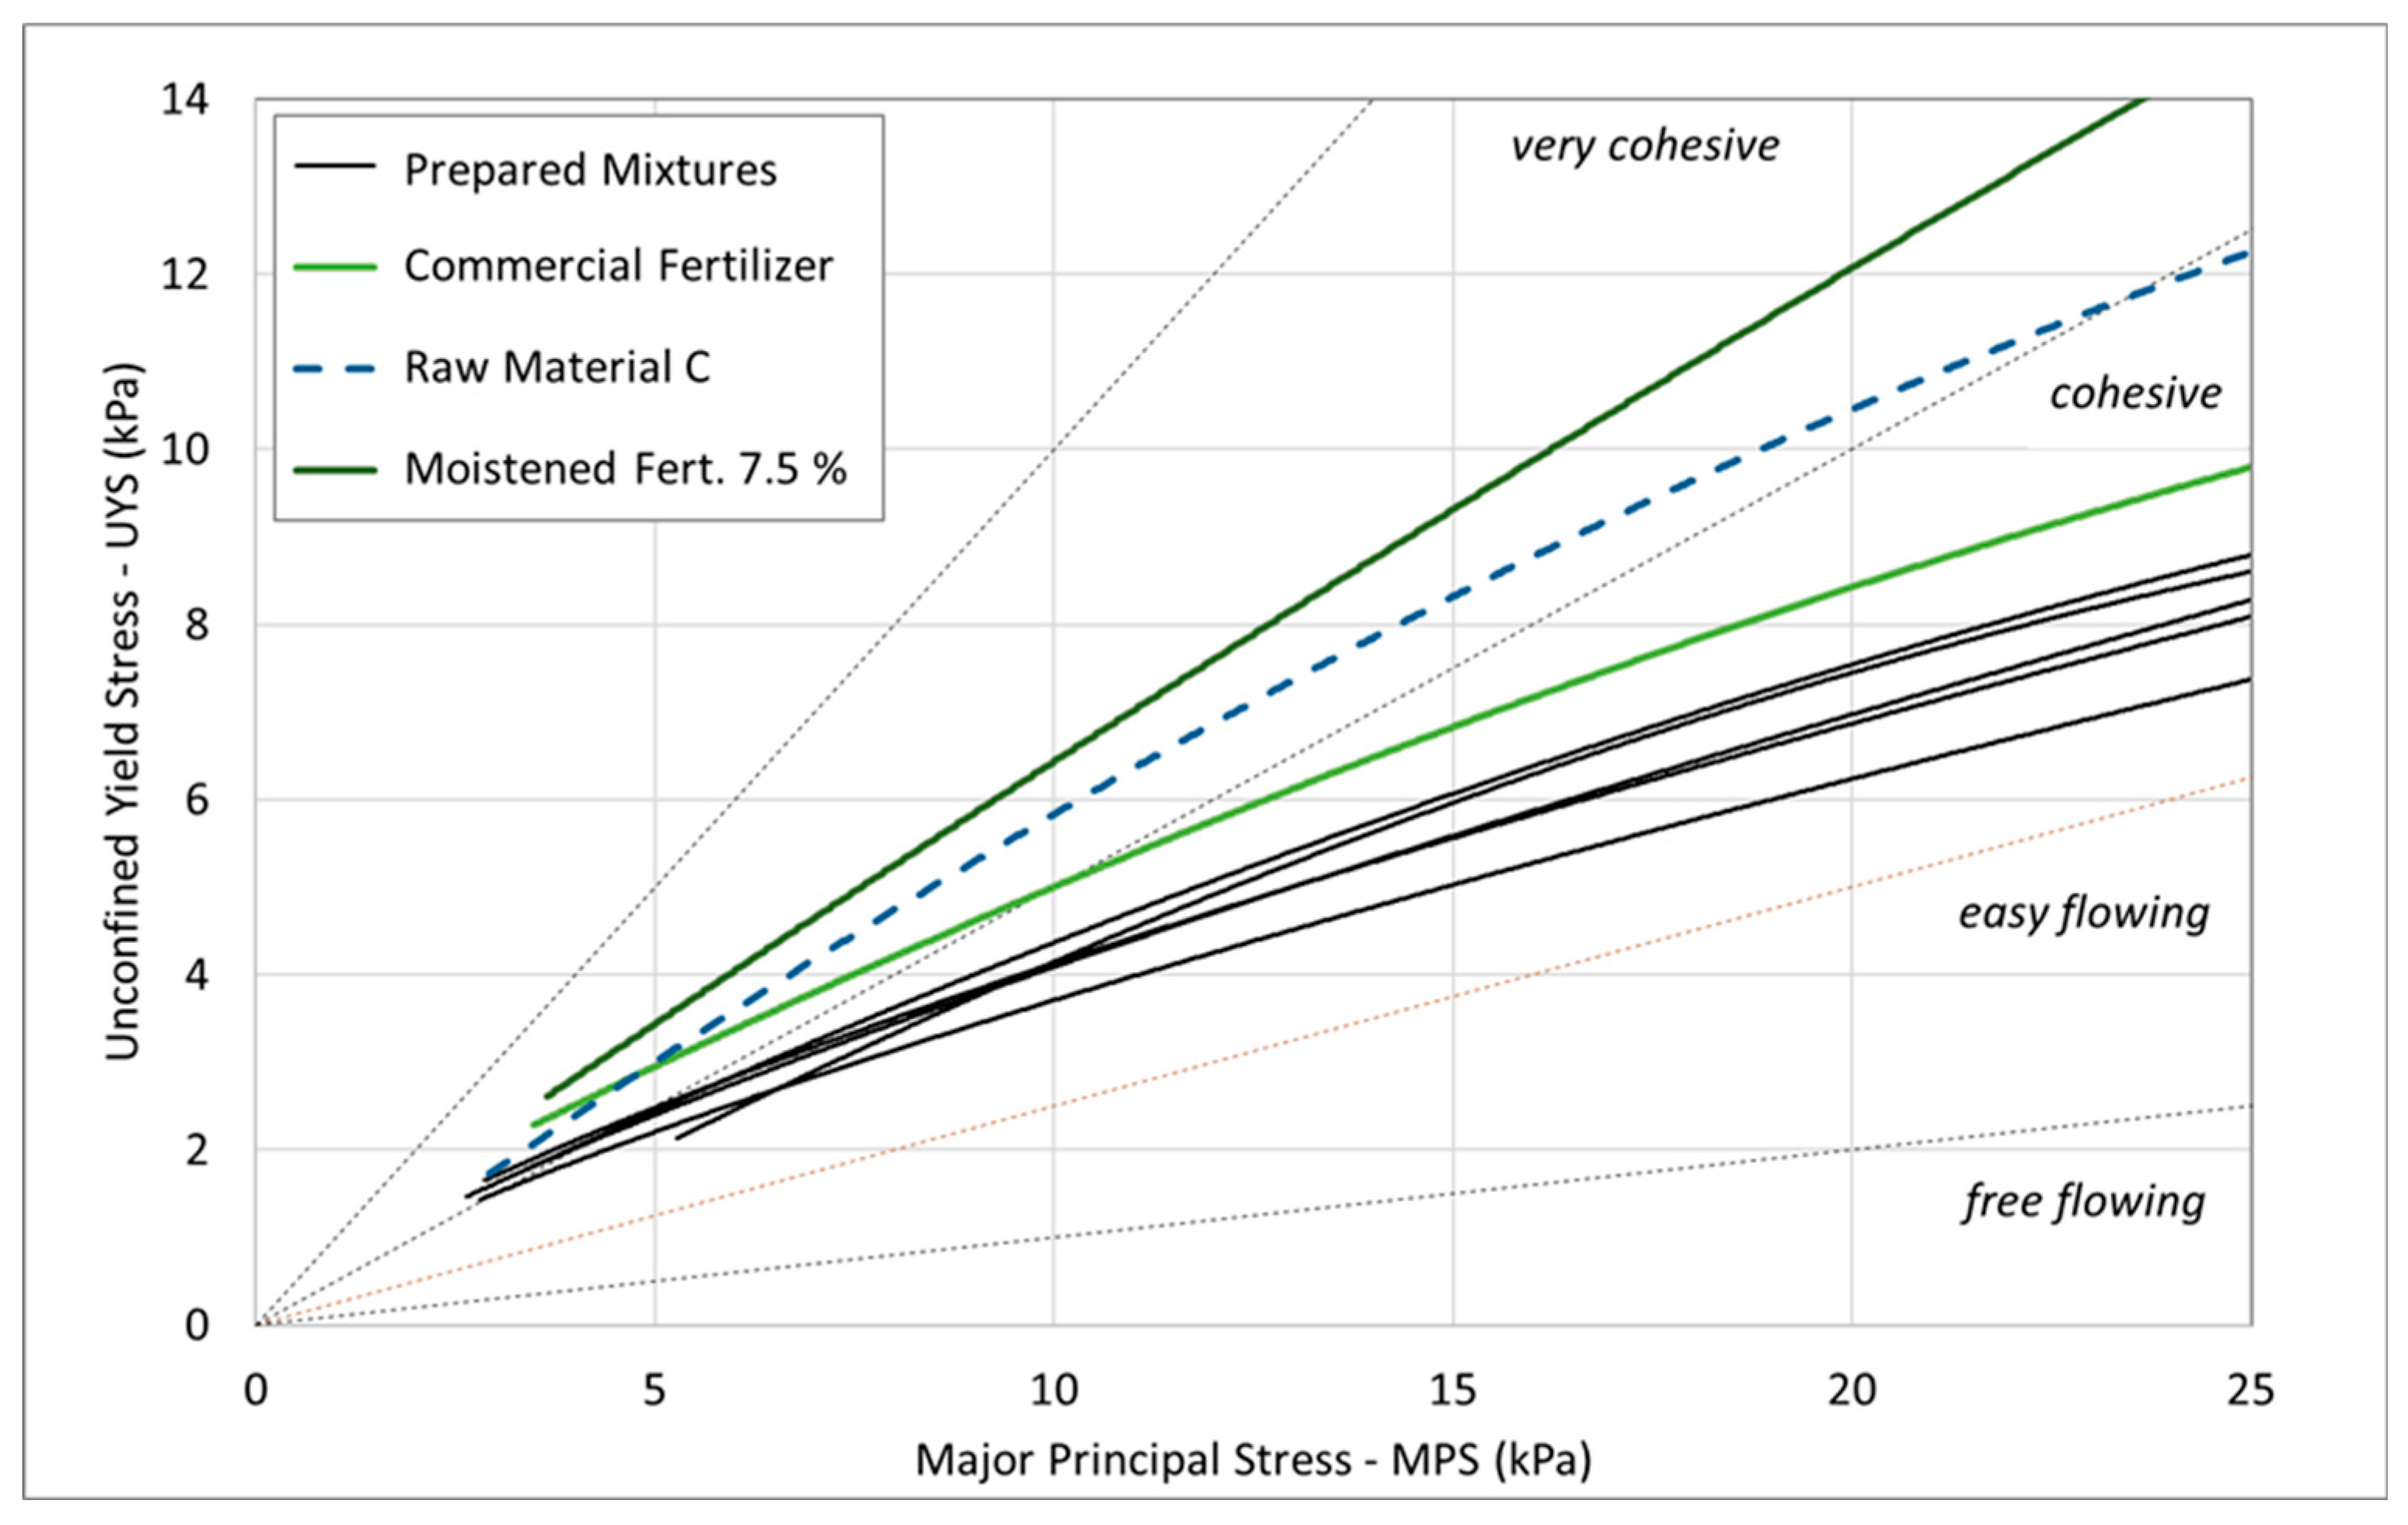

Table 1.
Composition of the commercial fertilizer by its major solid constituents.
| Material | Composition (%) | Main component (Compound source) |
Particle size d4,3 (mm) |
|---|---|---|---|
| Fertilizer | 100% | All components | 53.90 |
| Raw material A | 14% | Boron | 51.16 |
| Raw material B | 11% | Manganese | 55.93 |
| Raw material C | 61% | Zinc | 49.79 |
| Others | 14% | N/A | N/A |
Table 2.
Mixture Compositions and Experimental Variables (DOE).
| Mixtures | MP A (%) | MP B (%) | MP C (%) | ||
|---|---|---|---|---|---|
| 1 | 7.50 | 7.50 | 85.00 | 85.0 | 1.00 |
| 2 | 19.09 | 10.91 | 70.00 | 70.0 | 1.75 |
| 3 | 32.14 | 12.86 | 55.00 | 55.0 | 2.50 |
| 4 | 22.50 | 22.50 | 55.00 | 55.0 | 1.00 |
| 5 | 10.71 | 4.29 | 85.00 | 85.0 | 2.50 |
Table 3.
Raw materials and moistened fertilizers properties.
|
Sample |
Moisture Content | Particle Density (g.cm−3) |
Particle Size - d4,3 (mm) |
Bulk Density (g.cm−3) |
Bulk Porosity ε |
Tapped Density (g.cm−3) |
Tapped Porosity ε TAPPED |
Saturation Level (%) |
|---|---|---|---|---|---|---|---|---|
| Raw Mat. A | 2.5±0.19 | 2.11±0.0010 | 51.16 | 0.37±0.001 | 0.825 | 0.74±0.004 | 0.649 | - |
| Raw Mat. B | 2.5±0.18 | 3.02±0.0013 | 55.93 | 0.70±0.004 | 0.768 | 1.13±0.003 | 0.626 | - |
| Raw Mat. C | 2.6±0.22 | 3.79±0.0019 | 49.79 | 1.05±0.080 | 0.723 | 1.36±0.001 | 0.641 | - |
| Commercial Fertilizer | 2.5±0.18 | 3.24 ± 0.0031 |
53.90 | 0.68±0.075 | 0.790 | 1.02±0.021 | 0.685 | 2.21 |
| Moistened Fertilizer 1 | 3.0±0.20 | 137.4 | 0.68±0.012 | 0.790 | 0.93±0.002 | 0.713 | 2.67 | |
| Moistened Fertilizer 2 | 5.0±0.19 | 161.6 | 0.62±0.094 | 0.808 | 1.00±0.065 | 0.691 | 3.87 | |
| Moistened Fertilizer 3 | 7.5±0.21 | 398.7 | 0.67±0.003 | 0.793 | 1.01±0.010 | 0.688 | 6.86 |
Table 4.
Physical properties of the mixtures.
| Mixture | RM A Content (%) |
RM B Content (%) |
RM C Content (%) |
Particle Density (g.cm−3) |
Particle Size d4,3 (µm) |
Bulk Density (g.cm−3) |
Bulk Porosity ε |
Tapped Density (g.cm−3) |
Tapped Porosity ε TAPPED |
|---|---|---|---|---|---|---|---|---|---|
| 1 | 7.50 | 7.50 | 85.0 | 3.61 | 52.65 | 0.77 | 0.79 | 1.22 | 0.66 |
| 2 | 19.09 | 10.91 | 70.0 | 3.39 | 55.11 | 0.83 | 0.75 | 1.03 | 0.70 |
| 3 | 32.14 | 12.86 | 55.0 | 3.15 | 56.62 | 0.79 | 0.75 | 1.00 | 0.68 |
| 4 | 22.50 | 22.50 | 55.0 | 3.24 | 51.51 | 0.83 | 0.74 | 0.97 | 0.70 |
| 5 | 10.71 | 4.29 | 85.0 | 3.58 | 50.69 | 0.89 | 0.75 | 1.15 | 0.68 |
Disclaimer/Publisher’s Note: The statements, opinions and data contained in all publications are solely those of the individual author(s) and contributor(s) and not of MDPI and/or the editor(s). MDPI and/or the editor(s) disclaim responsibility for any injury to people or property resulting from any ideas, methods, instructions or products referred to in the content. |
© 2025 by the authors. Licensee MDPI, Basel, Switzerland. This article is an open access article distributed under the terms and conditions of the Creative Commons Attribution (CC BY) license (http://creativecommons.org/licenses/by/4.0/).
Copyright: This open access article is published under a Creative Commons CC BY 4.0 license, which permit the free download, distribution, and reuse, provided that the author and preprint are cited in any reuse.


