Submitted:
03 September 2025
Posted:
04 September 2025
You are already at the latest version
Abstract
Brain–computer interfaces using motor imagery (MI-BCIs) offer a promising noninvasive communication pathway between humans and engineered equipment such as robots. However, for MI-BCIs based on electro encephalography (EEG) the reliability of the interface across recording sessions is limited by temporal non-stationary effects. Overcoming this barrier is critical to translating MI‑BCIs from controlled laboratory environments to practical uses. In this paper we present a novel dual-validation framework to rigorously evaluate temporal robustness of EEG signals of a MI-BCI. We collected data from six participants performing four motor imagery tasks using their hands and feet, namely, left/right hand clench and left/right foot plantar flexion. Features were extracted using Common Spatial Patterns, and ten machine learning classifiers were assessed within a unified pipeline. Our method integrates within-session evaluation (stratified K-fold cross-validation) with cross-session testing (bidirectional train/test), complemented by multi-dimensional stability metrics and performance heterogeneity assessment. Findings reveal minimal performance loss between conditions, with an average accuracy drop of just 2.5%. Our AdaBoost classifier achieved the highest within-session performance (84.0% system accuracy, F1-score: 83.8%/80.9% for hand/foot), while K-nearest neighbors (KNN) classifier demonstrated the greatest cross-session robustness (81.2% system accuracy, F1-score: 80.5%/80.2% for hand/foot, 0.663 robustness score). This study shows that robust performance across sessions is attainable for MI‑BCI evaluation, supporting the pathway toward reliable, real-world clinical deployment.
Keywords:
brain-computer interface
; motor imagery
; dual-validation framework
; cross-session validation
; within-session validation
; temporal robustness
; machine learning
; EEG classification
; clinical translation
; performance degradation
1. Introduction
1.1. Background and Motivation
Brain-computer interfaces using motor imagery (MI-BCIs) show great promise for assistive devices and neurorehabilitation [1,2,3]. Numerous past studies, including our own, demonstrated the feasibility of classifying multiple motor imagery tasks with machine learning [4,5]. However, validation methods proposed were insufficient for predicting real-world performance. This study addresses that limitation with a comprehensive cross-session analysis to better evaluate the BCI’s practical potential.
A major challenge for BCI deployment is that EEG signals are unstable and change over time, even though single-session tests may look promising [6,7]. This instability is a known problem for MI-BCIs, as neural patterns often differ between sessions [8,9,10]. Therefore, the BCI’s reliability and usability suffer in real-world applications where users cannot afford poor performance or the need for frequent recalibration. Our previous paper [4] showed successful motor imagery classification, but its reliance on within-session testing likely overestimated its real-world performance. The main limitations were: (1) no cross-session validation to check performance over time, (2) a lack of metrics for clinical usefulness, (3) limited analysis of how performance varied across subjects and tasks, and (4) no assessment of the system’s efficiency.
The present paper addresses the limitations of past work through a novel dual-validation framework that systematically compares within-session and cross-session performance, providing a comprehensive assessment of laboratory-to-practice performance degradation in MI-BCIs. The framework integrates advanced statistical analysis with clinical translation metrics to establish evidence-based guidelines for BCI deployment readiness assessment.
1.2. Literature Review and Extended Research Context
Recent BCI research stresses that cross-session validation is crucial for reliable testing [3,8,11], because system performance often drops significantly when tested across different sessions [6,7]. For example, one longitudinal study [12], preparing a pilot for the CYBATHLON BCI Race, reported a substantial performance drop during the competition. The pilot’s race time worsened from an average of 120 seconds in training to 196 seconds in the official run, a performance degradation of over 60%. This failure happened because the EEG feature distribution changed, making the classifier unreliable. This shows a significant gap between encouraging lab results and practical use in real-world situations.
As deep learning continues to gain popularity in EEG analysis [13,14,15,16], traditional machine learning techniques still hold significant importance. They provide essential benefits such as interpretability, strong performance with limited datasets, and fast computation for real-time applications [3,4,17]. Methods such as Common Spatial Patterns (CSP) and ensemble classifiers continue to be effective and practical for clinical applications [18,19,20]. For instance, a study on multi-class motor imagery for lower-limb rehabilitation introduced an advanced Superimposed Filter Bank Common Spatial Pattern (SFB-CSP) method, pairing it with an SVM classifier to improve accuracy over conventional approaches [21]. Another study developed a novel CSP variant combined with LDA and SVM to significantly reduce the calibration effort required for new BCI users, directly addressing a key practical challenge in the field [22].
New assistive BCI technologies show promise for clinical use [1,5,23]. Motor imagery systems have been successfully applied in therapy and communication. However, a common weakness in existing research is the focus on within-session validation. This approach does not evaluate the system’s long-term stability. Advanced methods such as subject-independent classification [24] and multimodal analysis [25] are expanding the potential for creating reliable clinical BCI systems.
1.3. Key Contributions
This work introduces several novel contributions to the BCI field:
- (1)
- Dual-validation framework: a comprehensive methodology comparing within-session and cross-session performance.
- (2)
- Temporal robustness quantification: Systematic assessment of laboratory-to-practice performance degradation.
- (3)
- Clinical translation metrics: Integration of comprehensive performance analysis and deployment readiness assessment.
- (4)
- Statistical rigor enhancement: Advanced significance testing with effect sizes and multiple comparison corrections.
- (5)
- Task-specific stability analysis: Comprehensive comparison of hand versus foot imagery temporal robustness.
The primary objective of this study is to establish comprehensive validation standards for MI-BCIs that bridge the gap between laboratory research and practical deployment, with specific emphasis on temporal robustness and clinical translation readiness.
2. Materials and Methods
2.1. Participants and Experimental Protocol
Six healthy subjects (age: years, 4 males, 2 females) participated in this study with multiple recording sessions per participant. The experimental protocol was extended from our previous work [4] to include multiple sessions per subject, enabling comprehensive cross-session validation. Sessions were spaced 1-2 days apart to assess temporal robustness under realistic deployment conditions. Each session included 40 trials across 4 motor imagery tasks: left hand clench, right hand clench, left foot plantar flexion, and right foot plantar flexion (10 trials per class). The experimental paradigm is illustrated in Figure 1.
2.2. EEG Data Acquisition and Mathematical Signal Processing Framework
We recorded EEG signals at 250 Hz using a 16-channel OpenBCI Cyton Daisy system [26]. Following the international 10-20 system, we placed electrodes over sensorimotor areas, including C3, C4, Cz, and surrounding locations. The reference electrodes were placed on the earlobes and the ground electrode at AFz. This configuration was chosen because it was effective in our prior work [4,5,27]. The complete experimental setup and data processing pipeline are shown in Figure 2.
2.2.1. OpenBCI Data Acquisition
EEG Signal Scaling: The raw OpenBCI ADC values are converted to physical units using the scaling transformation [28]:
where is the raw ADC value and accounts for the 24-bit ADC resolution and voltage reference. This scaling approach ensures proper signal amplitude representation for subsequent processing stages.
Data Stream Organization: The consolidated data stream is structured as:
where contains 16 channels of scaled EEG data, contains trial labels and timing information, and N is the number of samples.
2.2.2. Signal Processing Pipeline
The EEG signal preprocessing employs a comprehensive mathematical framework consisting of several components described here.
Digital Bandpass Filtering: A finite impulse response (FIR) filter was applied using the discrete convolution:
where are the filter coefficients designed using the Kaiser window method for the 4-30 Hz frequency band targeting sensorimotor rhythms (SMR), is the raw EEG signal, and is the filtered output. The filter design ensures linear phase response and minimal signal distortion within the passband [29].
Covariance Matrix Estimation: For each motor imagery class c, the spatial covariance matrix is computed as [29]:
where is the i-th trial matrix with M channels and T time samples, and is the number of trials for class c.
Common Spatial Patterns (CSP): The Common Spatial Patterns (CSP) algorithm is a supervised spatial filtering technique widely used to enhance class separability in MI EEG analysis. Its main purpose is to find spatial filters that optimally enhance the separation between two distinct classes of EEG signals.
At its core, CSP operates on a simple but effective principle: it identifies spatial patterns that maximize the variance for one class while minimizing it for the other. This process effectively pulls the two classes apart in the data, making it easier to distinguish between them. [29,30].
Mathematically, CSP solves the following generalized eigenvalue problem:
where and represent the covariance matrices of the two classes. The sum captures the total variance across both classes. The solution yields a matrix of spatial filters, , and their corresponding eigenvalues . The eigenvectors within are ordered by their corresponding eigenvalues . The filters that provide the greatest discrimination between the two classes are those corresponding to the largest and smallest eigenvalues. For this reason, the first and last m eigenvectors are selected.
To prevent any bias caused by variations in signal strength across different trials, each trial’s covariance matrix was normalized by its trace (i.e., ) before the decomposition. This crucial step ensures that the algorithm focuses on the spatial patterns themselves rather than the signal amplitude.
Spatial Filtering and Variance Computation: For each trial X, the spatially filtered signal is computed as:
where contains the projected signals. The normalized variance features are then extracted:
where is the i-th filtered signal, and is a regularization term to prevent numerical instability. The logarithmic variance of the projected signals serves as the feature vector.
2.3. Machine Learning Classification Framework
We evaluated 10 machine learning classifiers to provide a comprehensive performance comparison, including:
- (1)
- Support Vector Machine (SVM) with RBF kernel
- (2)
- Naive Bayes Gaussian (NBG)
- (3)
- Random Forest (RF) with 100 estimators
- (4)
- K-Nearest Neighbors (KNN) with k=5
- (5)
- Decision Tree (DT) with maximum depth 10
- (6)
- Gradient Boosting (GB) with 100 estimators
- (7)
- AdaBoost (AB) with 50 estimators
- (8)
- Logistic Regression (LR) with L2 regularization
- (9)
- Multi-Layer Perceptron (MLP) with two hidden layers
- (10)
- Linear Discriminant Analysis (LDA)
Hyperparameter optimization was performed using GridSearchCV with 5-fold cross-validation, ensuring optimal performance for each classifier while preventing overfitting.
2.3.1. Dual Binary Classification Architecture
The dual binary classification system processes EEG signals to generate distinct control commands. This architecture use two specialized, independent classifiers to optimize performance for each limb modality, extending our previous work on multi-class motor imagery systems [4]. This approach aligns with recent advances in adaptive neural network architectures for BCI applications [31,32], providing robust control signals for assistive technologies.
- Hand Classifier: Trained to distinguish between left and right hand motor imagery.
- Foot Classifier: Trained to differentiate between left and right foot motor imagery.
This modular approach ensures specialized performance for each limb-specific task, and allows for independent evaluation and optimization of hand and foot motor imagery classification.
2.3.2. Binary Classifier Implementation and Training
Each binary classifier in the dual system was implemented using the same machine learning algorithms evaluated in the main study (SVM, KNN, Random Forest, etc.). The specialized training enables focused learning on limb-specific discriminative features:
- training: {Left Fist Clench} vs. {Right Fist Clench}
- training: {Left Foot Flexion} vs. {Right Foot Flexion}
This dual system approach offers several advantages over traditional single-classifier methods:
- (1)
- Specialized Performance: Each classifier focuses exclusively on its respective motor imagery modality (hand or foot).
- (2)
- Independent Optimization: Hand and foot classifiers can be optimized separately for maximum performance.
- (3)
- Modular Design: Individual classifiers can be retrained and updated independently.
- (4)
- Focused Evaluation: Enables separate analysis of hand and foot imagery classification performance.
- (5)
- Simplified Control Logic: Direct mapping from classifier output to robot commands without complex decision trees.
- (6)
- Robust Mapping: Natural correspondence between specific limb movements and robot actions.
For both logistic regression and MLP, the logistic sigmoid is used to compute posterior probabilities:
where w and b are the learned parameters for the positive class. For other classifiers, probabilities are estimated using model-specific approaches: KNN uses class frequency among neighbors; and tree-based models (Random Forest, AdaBoost) use the proportion of votes or class probabilities at the leaves.
The confidence of each independent classifier is then computed as:
where and represent the posterior probabilities for hand and foot classifiers, respectively.
2.4. Novel Dual-Validation Framework
The core methodological contribution of this extended work is the dual-validation framework that systematically compares within-session and cross-session performance.
2.4.1. Within-Session Validation
Within-session validation employed a stratified 5-fold cross-validation to establish baseline laboratory performance under controlled conditions. This methodology provides optimistic performance estimates with minimal temporal variation. The stratified k-fold partitioning preserves class distribution integrity across validation sets [33]:
where each fold maintains the original class proportion for class c, ensuring representative sampling across all motor imagery conditions.
The within-session validation error quantifies model performance under optimal laboratory conditions:
where represents the model trained on all folds except fold i, and denotes the 0–1 loss function, defined as . The random state parameter () ensures reproducible fold generation across experimental runs.
The optimal hyperparameter selection employs nested cross-validation to prevent overfitting and ensure generalizability [33]:
where represents the hyperparameter search space, denotes the model parameterized by , and is the validation subset within fold i.The scoring function Score is defined as the mean accuracy across validation folds. This approach provides unbiased performance estimates while optimizing model parameters for maximum classification accuracy.
2.4.2. Cross-Session Validation
Cross-session validation implemented a bidirectional train-test paradigm to assess temporal robustness and quantify real-world performance degradation. This approach addresses the critical limitation of within-session validation by evaluating model performance across temporally separated recording sessions, thereby simulating realistic deployment conditions where neural patterns may exhibit non-stationarity.
For each subject with n recording sessions, the methodology performs cross-session evaluations, systematically training models on individual sessions and testing on all remaining sessions. This exhaustive approach provides a comprehensive assessment of temporal generalizability and identifies session-specific performance variations that impact practical BCI deployment. The session permutation generation creates all possible bidirectional training-testing combinations:
where represents the complete set of recording sessions, and denotes the total number of cross-session evaluations per subject. This comprehensive enumeration ensures statistical robustness and captures bidirectional temporal effects.
The cross-session validation error quantifies performance degradation due to temporal non-stationarity [8,9,10]:
where represents the model trained exclusively on session , denotes the test data from session , and is the loss function. This metric directly quantifies the laboratory-to-practice performance gap.
2.4.3. Performance Ranking System:
To compare classifiers, we use a ranking system based on the mean of accuracy and F1-score for each classifier:
where represents the value of metric m (either accuracy or F1-score) for classifier c, and is the weight assigned to each metric. In our implementation, equal weights are typically used (i.e., )
2.4.4. Performance Comparison Metrics
Performance was assessed using the following metrics: system accuracy, accuracy degradation, coefficient of variation (CV) for stability, and a composite robustness score. Each metric is defined below.
- (1)
- System accuracy: Combined accuracy metric representing overall classifier performance across both motor imagery tasks:where Hand Accuracy and Foot Accuracy represent the classification accuracies for left/right hand and left/right foot motor imagery tasks, respectively. This metric provides a comprehensive performance assessment for the dual binary classification system and serves as the basis for temporal stability calculations.
- (2)
- Accuracy degradation: Percentage difference between within-session and cross-session system accuracy:where is the within-session system accuracy and is the cross-session system accuracy.
- (3)
- Stability metrics: Coefficient of variation across validation folds/sessions:where is the standard deviation and is the mean accuracy across folds or sessions.
- (4)
- Robustness scoring: Combined performance-stability quantification:where is the mean accuracy and is the coefficient of variation normalized to [0,1].
2.5. Statistical Analysis
To ensure methodological rigor, a multi-tiered statistical framework was implemented. It focused on three objectives: assessing data distribution, quantifying performance differences, and determining practical significance.
The framework included Shapiro-Wilk tests for normality, which justified the use of a non-parametric approach. Specifically, these tests indicated a non-normal distribution for within-session data (p=0.001), while cross-session data approached normality (p=0.142). Based on this, Wilcoxon signed-rank tests were used for paired comparisons between validation methods. Additionally, Cohen’s d was calculated to quantify the effect size, providing an assessment of practical significance beyond simple statistical significance.
3. Results and Discussion
3.1. Performance Evaluation
The dual-validation framework evaluation revealed consistently high classification performance across all machine learning algorithms. Table 1, Table 2, and Table 3 present comprehensive results encompassing accuracy, F1-score, Precision, Recall, and temporal robustness assessment, respectively.
3.1.1. Within-Session Performance Analysis
Within-session validation demonstrated consistently high performance across all classifiers and motor imagery tasks. AdaBoost achieved the highest system accuracy at 84.0%, followed closely by KNN at 83.3% and MLP at 83.2% (Table 1). The performance range extended from 73.1% (LDA) to 84.0% (AdaBoost), indicating robust classification capabilities across diverse algorithmic approaches. The within-session evaluation provides baseline performance under controlled laboratory conditions with minimal temporal variation between training and testing data.
Detailed performance metrics analysis (Table 2) reveals balanced precision-recall characteristics. F1-scores closely matched accuracy values (correlation r > 0.95), confirming stable discriminative capabilities. KNN demonstrated exceptional performance in hand imagery classification (F1: 85.1%), while AdaBoost excelled in foot imagery tasks (F1: 80.9%). The minimal variance between precision and recall metrics (typically <2%) validates the reliability of classification performance across both motor imagery modalities.
3.1.2. Cross-Session Performance Analysis
Cross-session validation revealed remarkably stable temporal performance, with minimal degradation from within-session conditions. AdaBoost and KNN emerged as top performers, achieving system accuracies of 81.4% and 81.2%, respectively (Table 1). The cross-session performance range spanned from 74.2% (LDA) to 81.4% (AdaBoost), demonstrating robust temporal generalization capabilities that challenge conventional expectations about motor imagery BCI stability.
Comprehensive cross-session evaluation maintained classification quality across all performance metrics (Table 2). The correlation between accuracy and F1-scores remained high (r > 0.95), indicating preserved balance between precision and recall under temporal variations. KNN showed exceptional stability with minimal degradation in precision (hand: 83.6%, foot: 83.2%) and recall (hand: 81.2%, foot: 81.1%), confirming its robustness for practical BCI deployment.
3.2. Temporal Robustness Analysis
The laboratory-to-practice performance comparison revealed minimal degradation from within-session to cross-session validation, with an average system accuracy reduction of only 2.5% across all classifiers (Table 1). This finding challenges conventional expectations about temporal robustness in BCIs and suggests greater stability than previously assumed [8].This minimal laboratory-to-practice performance gap represents a significant advancement toward practical BCI deployment.
KNN and MLP demonstrated exceptional temporal stability with degradation of just 2.6% and 2.7%, respectively. A detailed stability and robustness assessment (Table 3) provides a comprehensive temporal consistency evaluation through coefficient of variation and composite robustness scores. In cross-session validation, KNN achieved the highest robustness score (0.663), followed closely by AdaBoost (0.659) and MLP (0.653). This robustness scoring framework combines accuracy and stability metrics to assess readiness for clinical deployment. This analysis confirms that KNN, AdaBoost, and MLP show exceptional suitability for practical BCI applications, where temporal stability is crucial for reliable operation.
3.3. Task-Specific Performance and Statistical Analysis
Task-specific analysis revealed balanced performance between hand and foot imagery classification across temporal conditions (Figure 3). Hand imagery demonstrated slightly higher precision (76-82% cross-session range) compared to foot imagery (72-81% range), while both modalities maintained stable classification quality under temporal variations.
Comprehensive cross-session performance evaluation demonstrates consistent temporal robustness across all classification metrics. Accuracy analysis (Figure 4) reveals minimal performance degradation between hand and foot imagery tasks. F1-score distributions (Figure 5) confirm balanced precision-recall trade-offs across temporal domains. Precision assessment (Figure 6) demonstrates reliable positive predictive values, while recall analysis (Figure 7) validates consistent sensitivity across test sessions. This comprehensive metric evaluation supports the deployment readiness of identified robust classifiers for clinical BCI applications.
Statistical validation using Shapiro-Wilk tests confirmed non-normal distributions (p < 0.001), justifying non-parametric analysis. Wilcoxon signed-rank tests revealed statistically significant differences between validation approaches (p = 0.010) with medium effect size (Cohen’s d = 0.606). The combination of statistical significance with minimal practical degradation (2.5% average) provides strong evidence for temporal robustness, validating the clinical relevance of findings for motor imagery BCI deployment.
3.4. Limitations and Future Directions
Several limitations should be considered when interpreting these results. While the sample size of six subjects was adequate for this proof-of-concept study. It limits the generalizability of the findings and necessitates expansion to larger, more diverse populations for population-level conclusions. Additionally, the temporal intervals between sessions (1–2 days) reflect typical laboratory conditions but may not capture the challenges associated with long-term or real-world BCI deployment.
Future work should focus on: (1) larger, more diverse populations to assess generalizability across age groups and neurological conditions, (2) extended longitudinal studies with varied session spacing to determine optimal recalibration intervals, and (3) integration of advanced feature extraction methods and adaptive learning systems within the dual-validation framework. Integration of wireless EEG telemonitoring approaches [34] and adaptive user interface designs [32] could further enhance clinical BCI deployment capabilities.
While this study focuses on the classification of hand and foot motor imagery, the dual binary classification architecture is inherently modular. This makes it well-suited for future integration with real-time robot or assistive device control systems. In such applications, classifier outputs could be mapped to distinct control commands—for example, left/right turning or forward/backward movement—enabling intuitive and flexible BCI control schemes. Future research will explore the practical deployment of this architecture for closed-loop, BCI-driven robotic or assistive device control, leveraging its modularity and independent optimization to enhance real-world usability and flexibility.
4. Conclusions
This dual-validation framework establishes comprehensive MI-BCI evaluation methodology, revealing minimal laboratory-to-practice performance degradation (2.5% average) with high encouragement for the prospect of deploying reliable BCI systems. key contributions include: (1) novel dual-validation methodology addressing temporal robustness, (2) comprehensive cross-session validation demonstrating motor imagery classification stability, (3) systematic performance stability quantification providing realistic deployment readiness assessment, and (4) task-specific insights informing flexible BCI application design.
The validated framework provides foundation for clinical BCI applications, with robust classifiers (KNN, AdaBoost, MLP) achieving stable cross-session performance representing major advancement toward practical deployment. This research significantly extends previous work [4,5] by addressing critical validation limitations and demonstrating practical applications for clinical translation.
Extended Version Declaration
This manuscript represents a significant extension of our previous conference paper [4]. Key enhancements include:
- (1)
- Methodological Enhancement: Introduction of cross-session validation methodology to assess temporal robustness and quantify laboratory-to-practice performance degradation
- (2)
- Expanded Experimental Design: Extension from single-session to multiple-session data collection across 6 subjects, enabling systematic temporal robustness assessment under realistic deployment conditions
- (3)
- Comprehensive Performance Quantification: Addition of multi-dimensional stability metrics, robustness scoring, and detailed precision-recall analysis across all motor imagery tasks
- (4)
- Statistical Rigor: Implementation of advanced three-tier statistical testing framework (Shapiro-Wilk normality testing, Wilcoxon signed-rank tests, Cohen’s d effect size quantification) with multiple comparison corrections
- (5)
- Clinical Translation Metrics: Integration of deployment readiness assessment frameworks and evidence-based guidelines for practical BCI implementation
Funding
This research was funded by NSF EPSCOR Award 1849213.
Institutional Review Board Statement
The study was conducted and approved by the Institutional Review Board of University of Louisville (protocol code [19.0329] and date of approval [03/29/2025]).
Informed Consent Statement
Informed consent was obtained from all subjects involved in the study.
Data Availability Statement
Data can be found at https://github.com/MAHanafy/EEG_Data_Collector.git. The complete analysis pipeline is available at https://github.com/MAHanafy/Motor_Imagery_WS_CS.git
References
- Tarara, P.; Przybył, I.; Schöning, J.; Gunia, A. Motor Imagery-Based Brain-Computer Interfaces: An Exploration of Multiclass Motor Imagery-Based Control for Emotiv EPOC X. Frontiers in Neuroinformatics 2025, 19, 1625279. [Google Scholar] [CrossRef]
- Saibene, A.; Caglioni, M.; Corchs, S.; Gasparini, F. EEG-based BCIs on motor imagery paradigm using wearable technologies: a systematic review. Sensors 2023, 23, 2798. [Google Scholar] [CrossRef]
- Lotte, F.; Bougrain, L.; Cichocki, A.; Clerc, M.; Congedo, M.; Rakotomamonjy, A.; Yger, F. A review of classification algorithms for EEG-based brain–computer interfaces: a 10 year update. Journal of neural engineering 2018, 15, 031005. [Google Scholar] [CrossRef]
- Hanafy, M.A.; Yusufjonov, S.; Yusufjonov, D.; Sharafianardakani, P.; Rayguru, M.M.; Popa, D.O. A Robust EEG Brain-Computer Interface Approach for Decoding Hand and Foot Motor Imagery. In Proceedings of the Proceedings of the 18th ACM International Conference on PErvasive Technologies Related to Assistive Environments, 2025, pp. 92–100.
- Hanafy, M.A.; Reynolds, H.L.; Jones, J.; Harris, D.; Popa, D.O. Assessment of BCI performance for human-robot interaction. In Proceedings of the Proceedings of the 17th International Conference on PErvasive Technologies Related to Assistive Environments, 2024, pp. 252–258.
- Huang, G.; Zhao, Z.; Zhang, S.; Hu, Z.; Fan, J.; Fu, M.; Chen, J.; Xiao, Y.; Wang, J.; Dan, G. Discrepancy between inter-and intra-subject variability in EEG-based motor imagery brain-computer interface: Evidence from multiple perspectives. Frontiers in neuroscience 2023, 17, 1122661. [Google Scholar] [CrossRef]
- Vidaurre, C.; Ramos-Murguialday, A.; Haufe, S.; Gizzi, L.; Sannelli, C.; Braun, C.; Birbaumer, N. Enhancing sensorimotor BCI performance with assistive afferent activity: an online study. NeuroImage 2020, 199, 375–386. [Google Scholar] [CrossRef]
- Ma, J.; Yang, B.; Qiu, W.; Li, Y.; Gao, S.; Xia, X. A large EEG dataset for studying cross-session variability in motor imagery brain-computer interface. Scientific Data 2022, 9, 531. [Google Scholar] [CrossRef]
- Lotey, T.; Keserwani, P.; Wasnik, G.; Roy, P.P. Cross-session motor imagery EEG classification using self-supervised contrastive learning. In Proceedings of the 2022 26th International Conference on Pattern Recognition (ICPR). IEEE; 2022; pp. 975–981. [Google Scholar]
- Liu, W.; Guo, C.; Gao, C. A cross-session motor imagery classification method based on Riemannian geometry and deep domain adaptation. Expert Systems with Applications 2024, 237, 121612. [Google Scholar] [CrossRef]
- Abiri, R.; Borhani, S.; Sellers, E.W.; Jiang, Y.; Zhao, X. A comprehensive review of EEG-based brain–computer interface paradigms. Journal of Neural Engineering 2019, 16, 011001. [Google Scholar] [CrossRef] [PubMed]
- Hehenberger, L.; Kobler, R.J.; Lopes-Dias, C.; Srisrisawang, N.; Tumfart, P.; Uroko, J.B.; Torke, P.R.; Müller-Putz, G.R. Long-term mutual training for the CYBATHLON BCI race with a tetraplegic pilot: a case study on inter-session transfer and intra-session adaptation. Frontiers in Human Neuroscience 2021, 15, 635777. [Google Scholar] [CrossRef]
- Zhang, X.; Yao, L.; Wang, X.; Monaghan, J.; McAlpine, D.; Zhang, Y. A survey on deep learning-based non-invasive brain signals: recent advances and new frontiers. Journal of Neural Engineering 2021, 18, 031002. [Google Scholar] [CrossRef] [PubMed]
- Roy, Y.; Banville, H.; Albuquerque, I.; Gramfort, A.; Falk, T.H.; Faubert, J. Deep learning-based electroencephalography analysis: a systematic review. Journal of Neural Engineering 2019, 16, 051001. [Google Scholar] [CrossRef]
- Craik, A.; He, Y.; Contreras-Vidal, J.L. Deep learning for electroencephalogram (EEG) classification tasks: a review. Journal of Neural Engineering 2019, 16, 031001. [Google Scholar] [CrossRef]
- Baspınar, U.; Tastan, Y. Enhancing Motor Imagery EEG Classification in Brain-Computer Interfaces via TransformerNet. IEEE Access 2025. [Google Scholar] [CrossRef]
- Gwon, D.; Won, K.; Song, M.; Nam, C.S.; Jun, S.C.; Ahn, M. Review of public motor imagery and execution datasets in brain-computer interfaces. Frontiers in human neuroscience 2023, 17, 1134869. [Google Scholar] [CrossRef] [PubMed]
- Hu, H.; Yue, K.; Guo, M.; Lu, K.; Liu, Y. Subject separation network for reducing calibration time of MI-based BCI. Brain Sciences 2023, 13, 221. [Google Scholar] [CrossRef]
- Lin, C.L.; Chen, L.T. Improvement of brain–computer interface in motor imagery training through the designing of a dynamic experiment and FBCSP. Heliyon 2023, 9. [Google Scholar] [CrossRef] [PubMed]
- Wu, D.; Jiang, X.; Peng, R. Transfer learning for motor imagery based brain–computer interfaces: A tutorial. Neural Networks 2022, 153, 235–253. [Google Scholar] [CrossRef]
- Ma, S.; Situ, Z.; Peng, X.; Li, Z.; Huang, Y. Multi-Class Classification Methods for EEG Signals of Lower-Limb Rehabilitation Movements. Biomimetics 2025, 10, 452. [Google Scholar] [CrossRef]
- Wei, Q.; Ding, X. Intra- and Inter-Subject Common Spatial Pattern for Reducing Calibration Effort in MI-Based BCI. IEEE Transactions on Neural Systems and Rehabilitation Engineering 2023, 31, 904–916. [Google Scholar] [CrossRef]
- Lazcano-Herrera, A.G.; Fuentes-Aguilar, R.Q.; Chairez, I.; Alonso-Valerdi, L.M.; Gonzalez-Mendoza, M.; Alfaro-Ponce, M. Review on BCI virtual rehabilitation and remote technology based on EEG for assistive devices. Applied Sciences 2022, 12, 12253. [Google Scholar] [CrossRef]
- Kwon, O.Y.; Lee, M.H.; Guan, C.; Lee, S.W. Subject-independent brain–computer interfaces based on deep convolutional neural networks. IEEE transactions on neural networks and learning systems 2019, 31, 3839–3852. [Google Scholar] [CrossRef]
- Hosseini, M.P.; Tran, T.X.; Pompili, D.; Elisevich, K.; Soltanian-Zadeh, H. Multimodal data analysis of epileptic EEG and rs-fMRI via deep learning and edge computing. Artificial Intelligence in Medicine 2020, 104, 101813. [Google Scholar] [CrossRef]
- OpenBCI. OpenBCI Cyton Daisy Biosensing Board, 2023. Accessed: 2025-08-15.
- Reynolds, H.L.; Hanafy, M.A.; Jones, J.; Harris, D.; Popa, D.O. Comparative Study of One-Handed vs Two-Handed EEG Intent Recognition for Applications in Human-Robot Interaction. In Proceedings of the Proceedings of the 17th International Conference on PErvasive Technologies Related to Assistive Environments, 2024, pp. 496–503.
- OpenBCI. All-in-One EEG Electrode Cap Bundle, 2025. Accessed: August 15, 2025.
- Blankertz, B.; Tomioka, R.; Lemm, S.; Kawanabe, M.; Muller, K.R. Optimizing spatial filters for robust EEG single-trial analysis. IEEE Signal processing magazine 2007, 25, 41–56. [Google Scholar] [CrossRef]
- Ang, K.K.; Chin, Z.Y.; Zhang, H.; Guan, C. Filter bank common spatial pattern (FBCSP) in brain-computer interface. In Proceedings of the 2008 IEEE international joint conference on neural networks (IEEE world congress on computational intelligence). IEEE; 2008; pp. 2390–2397. [Google Scholar]
- Jose, N.; Gore, D.; Vivekanandan, G.; Nithya, E.; Nallarasan, V.; Krishnakumar, K. Efficient predefined time adaptive neural network for motor execution EEG signal classification based brain-computer interaction. Knowledge-Based Systems 2024, 303, 112270. [Google Scholar] [CrossRef]
- Sharafianardakani, P.; Hanafy, M.A.; Kondaurova, I.; Ashary, A.; Rayguru, M.M.; Popa, D.O. Adaptive User Interface With Parallel Neural Networks for Robot Teleoperation. IEEE Robotics and Automation Letters 2024. [Google Scholar] [CrossRef]
- Pedregosa, F.; Varoquaux, G.; Gramfort, A.; Michel, V.; Thirion, B.; Grisel, O.; Blondel, M.; Prettenhofer, P.; Weiss, R.; Dubourg, V.; et al. Scikit-learn: Machine learning in Python. the Journal of machine Learning research 2011, 12, 2825–2830. [Google Scholar]
- Hanafy, M.A.; Ali, H.S.; Shaalan, A.A. Rakeness with block sparse Bayesian learning for efficient ZigBee-based EEG telemonitoring. International Journal of Communication Systems 2020, 33, e4219. [Google Scholar] [CrossRef]
Figure 1.
The experimental paradigm. The top panel shows the timing of a single trial, including a 2-second planning phase, a 2-second motor imagery window, and a 2-second resting phase. The bottom panels display the visual cues presented to the user for each of the four tasks and the 10-20 EEG electrode layout used for data acquisition.
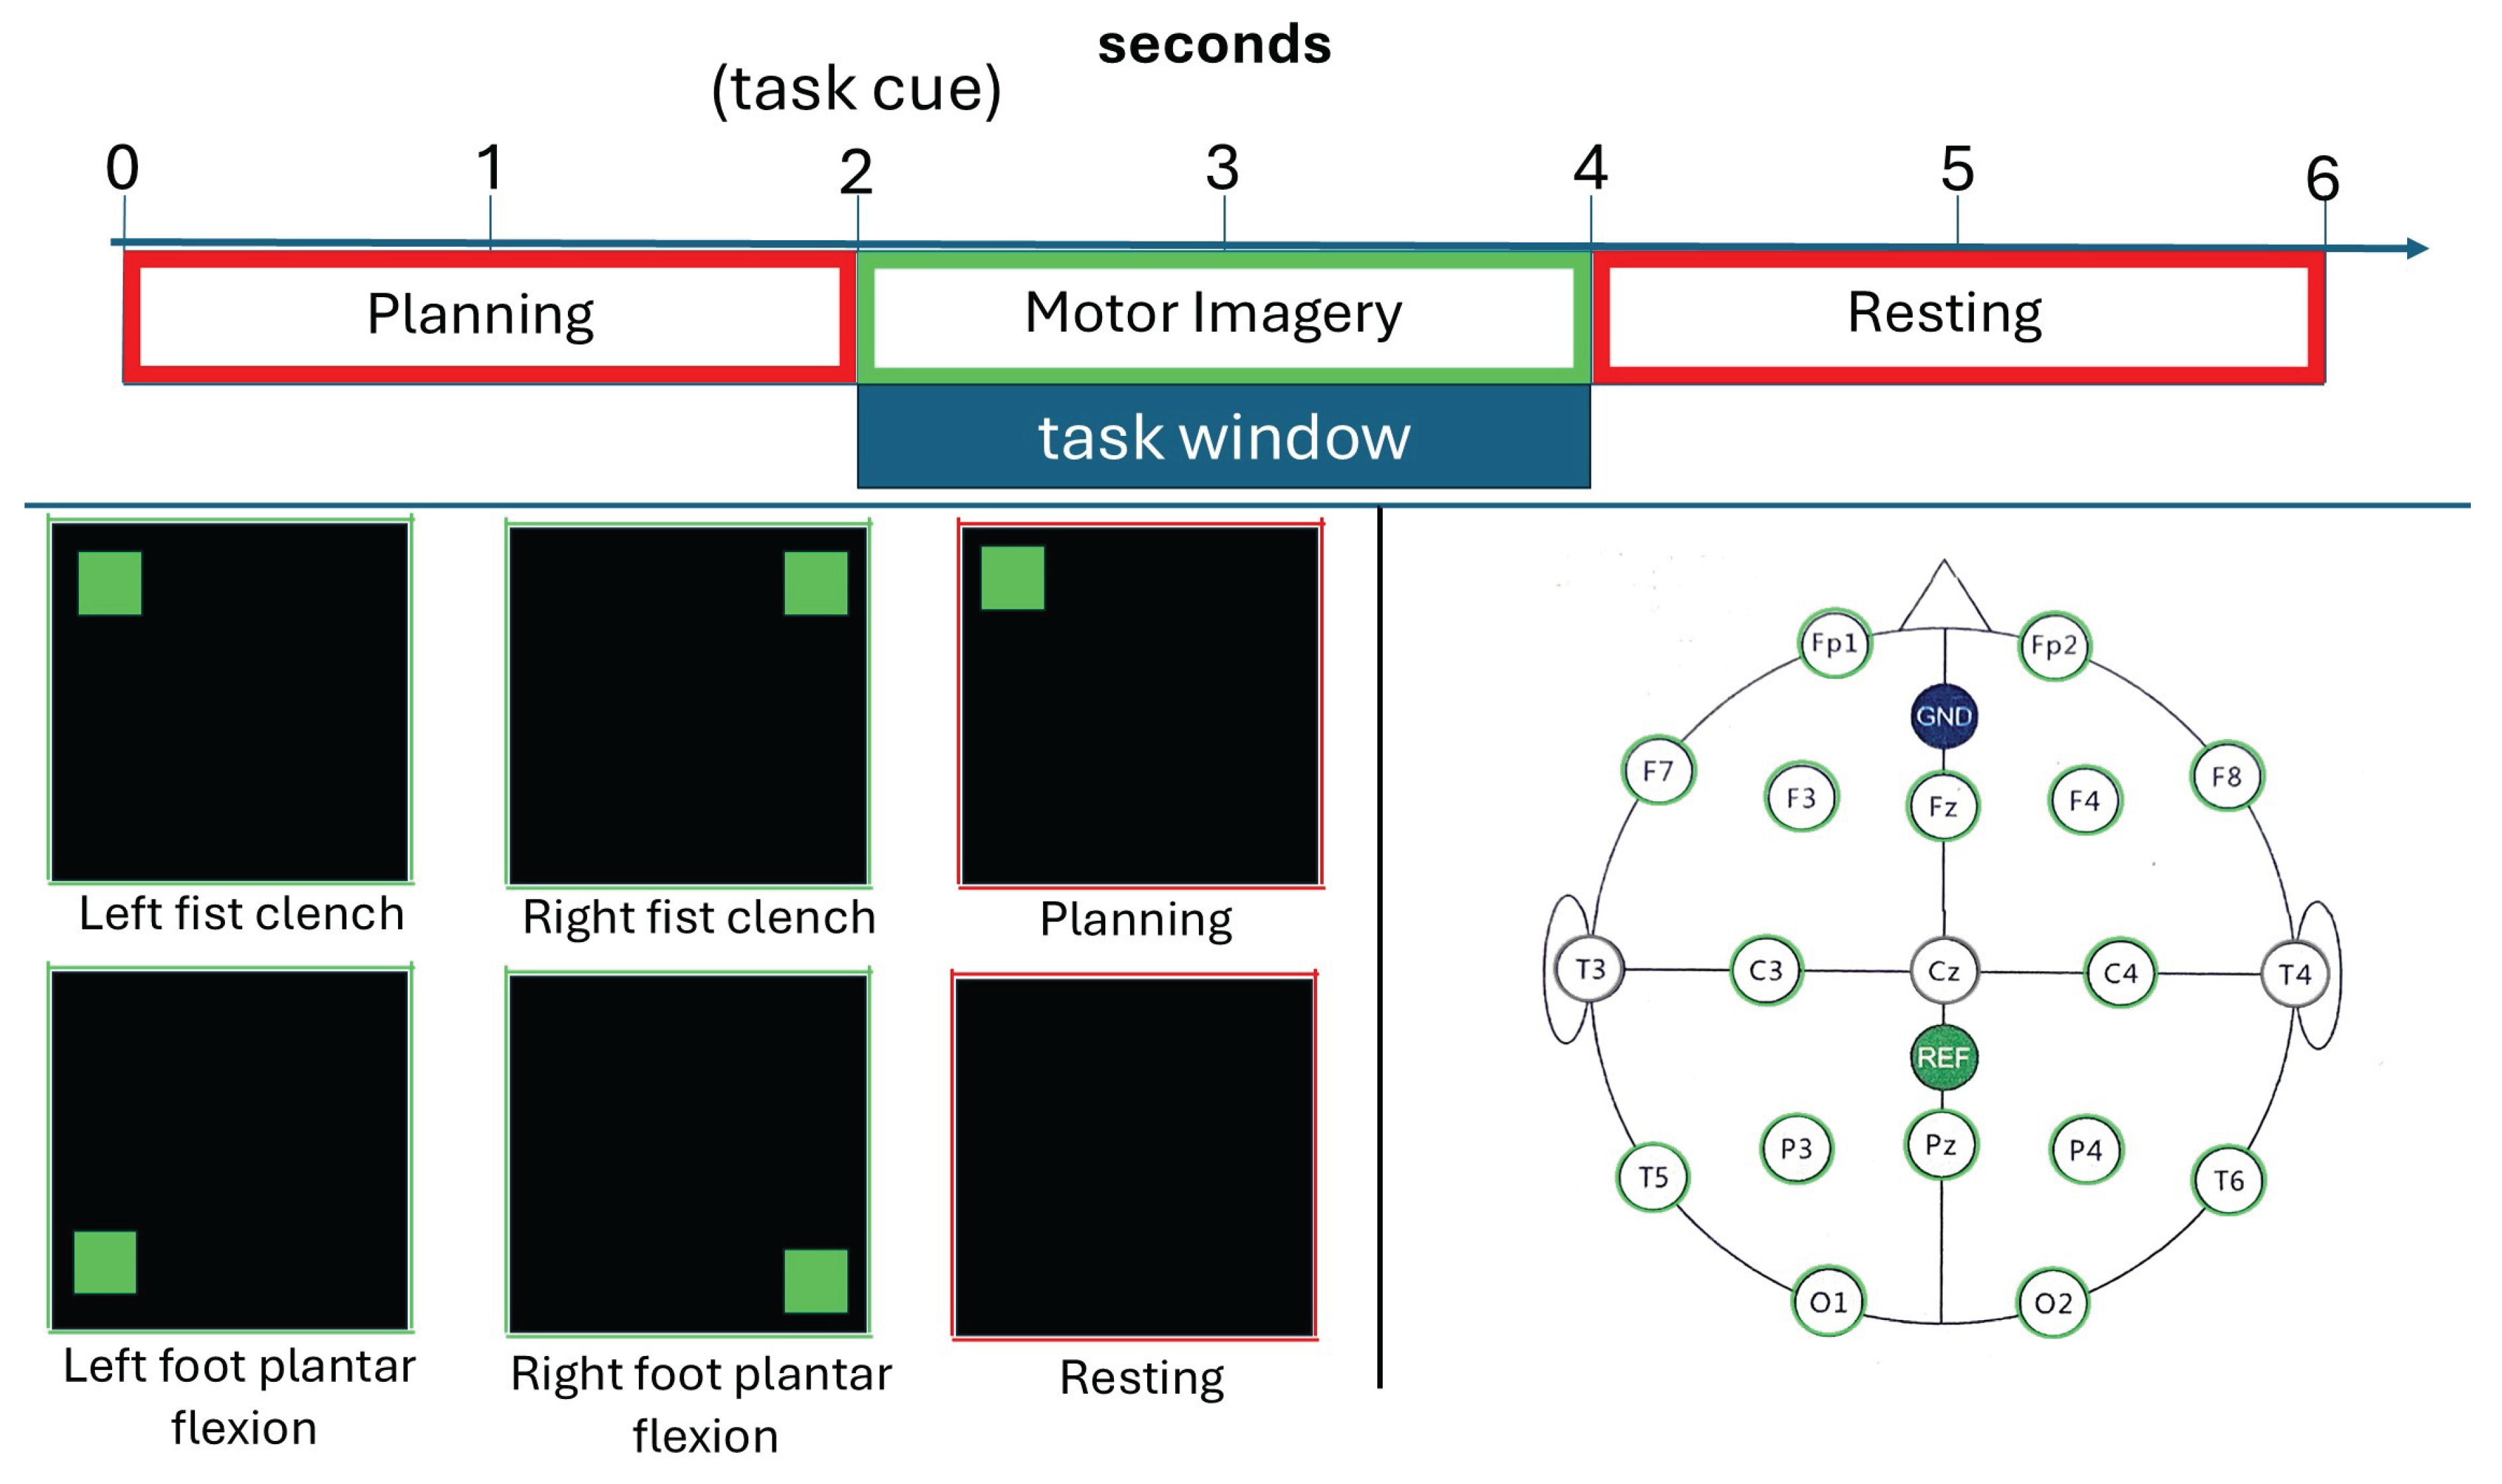
Figure 2.
The experimental and data processing workflow. The process begins with equipment setup and impedance checking, followed by the experiment demonstration and data acquisition. The acquired signals are then processed through an FIR filter, segmented, and subjected to spectral selection and feature extraction before classification.
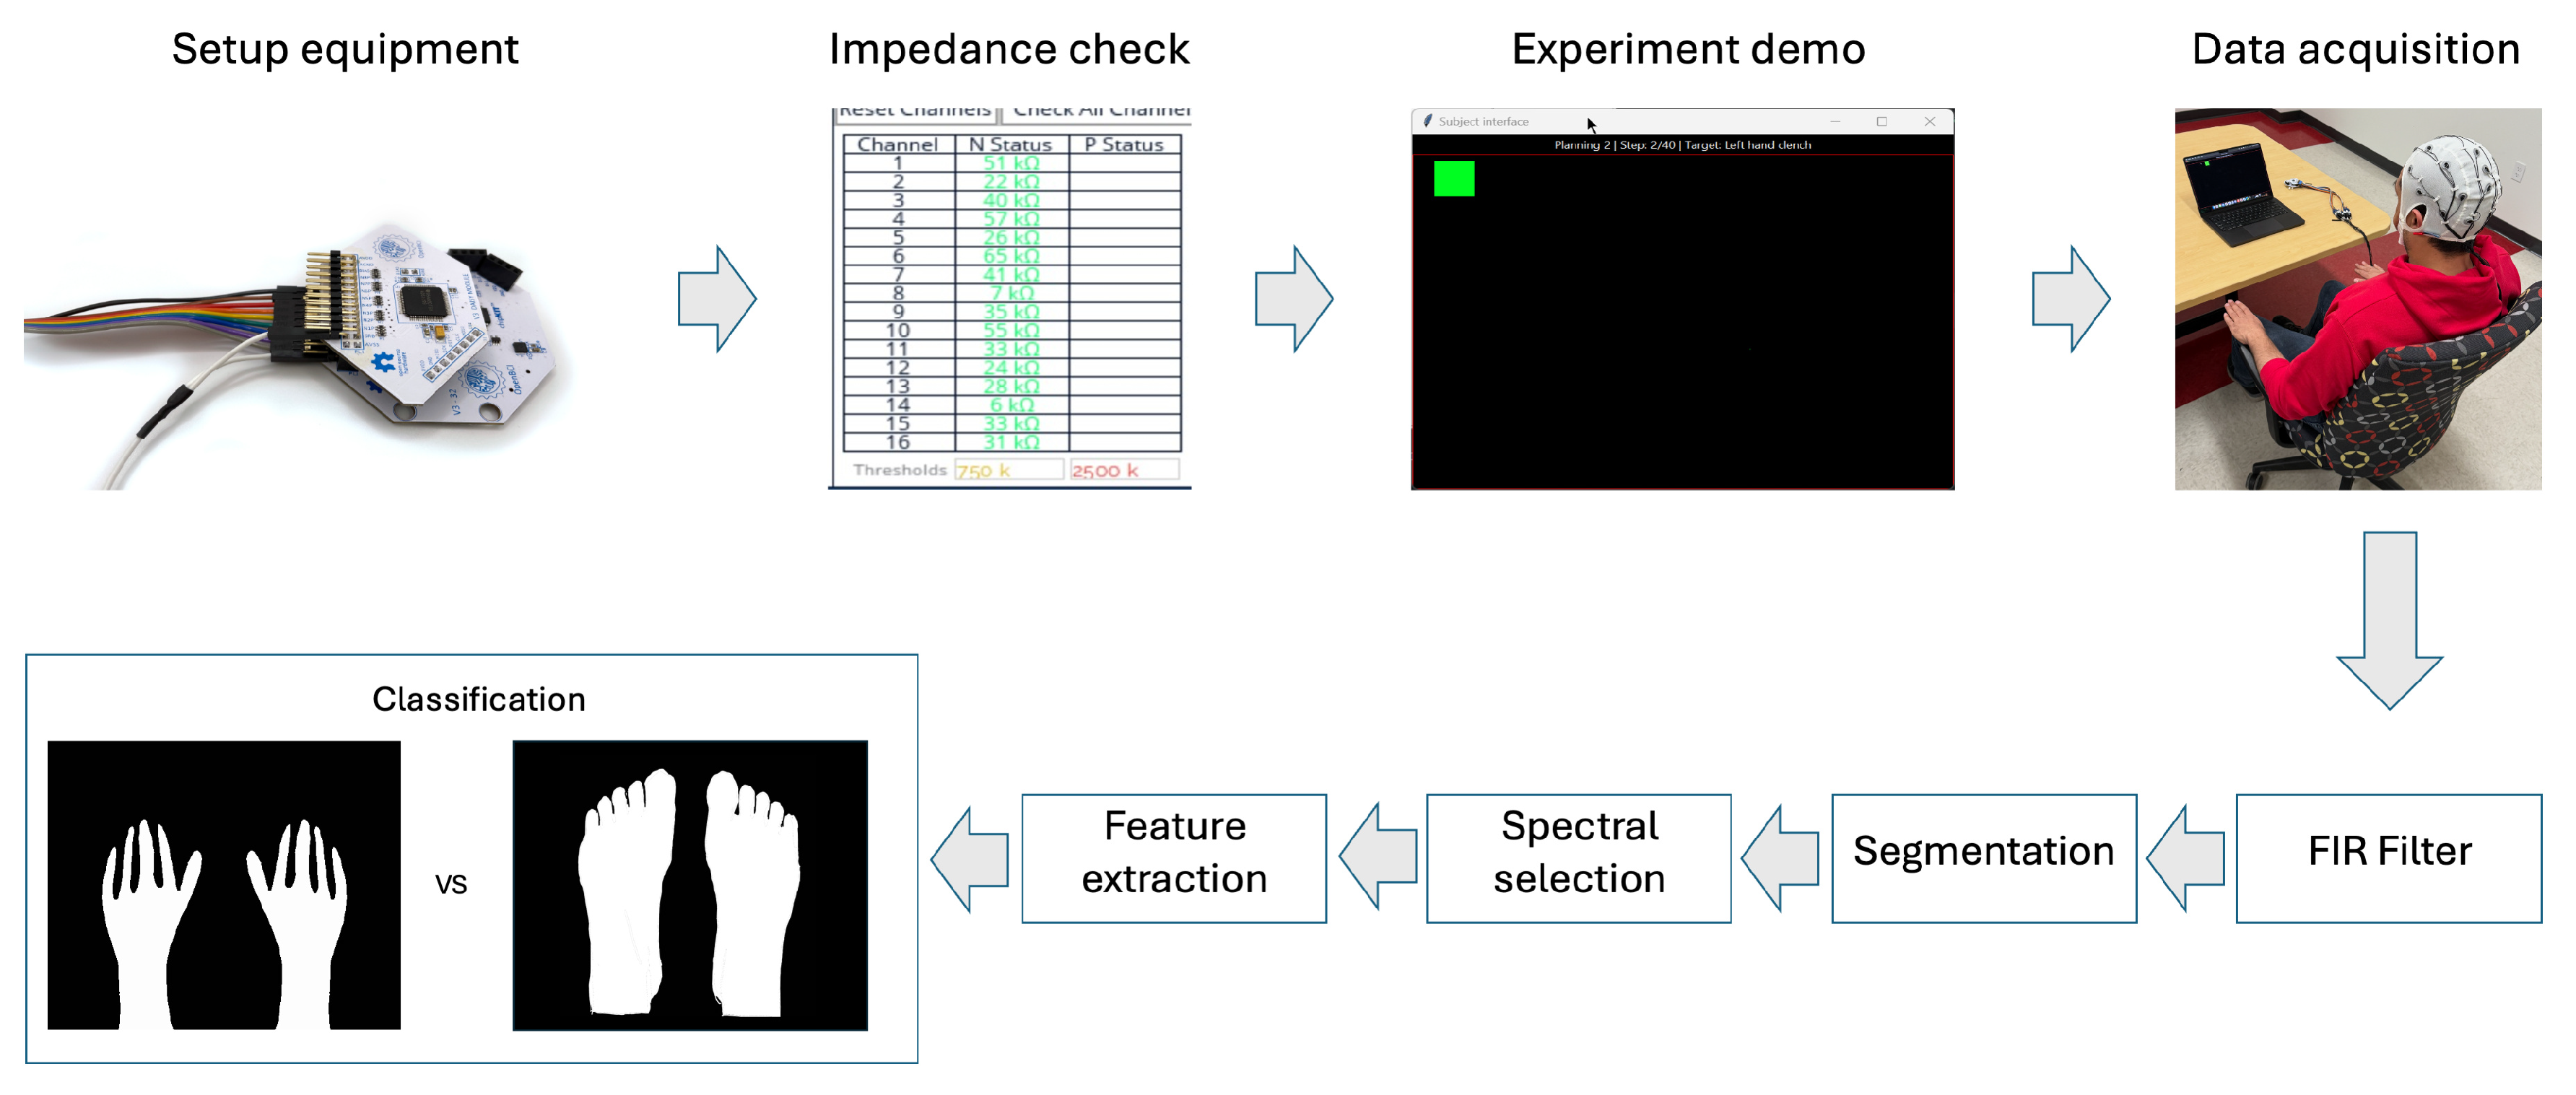
Figure 3.
Task-specific performance comparison. The plots show within-session and cross-session accuracy for hand vs. foot imagery, and the accuracy degradation from within- to cross-session validation across different classifiers.
Figure 3.
Task-specific performance comparison. The plots show within-session and cross-session accuracy for hand vs. foot imagery, and the accuracy degradation from within- to cross-session validation across different classifiers.
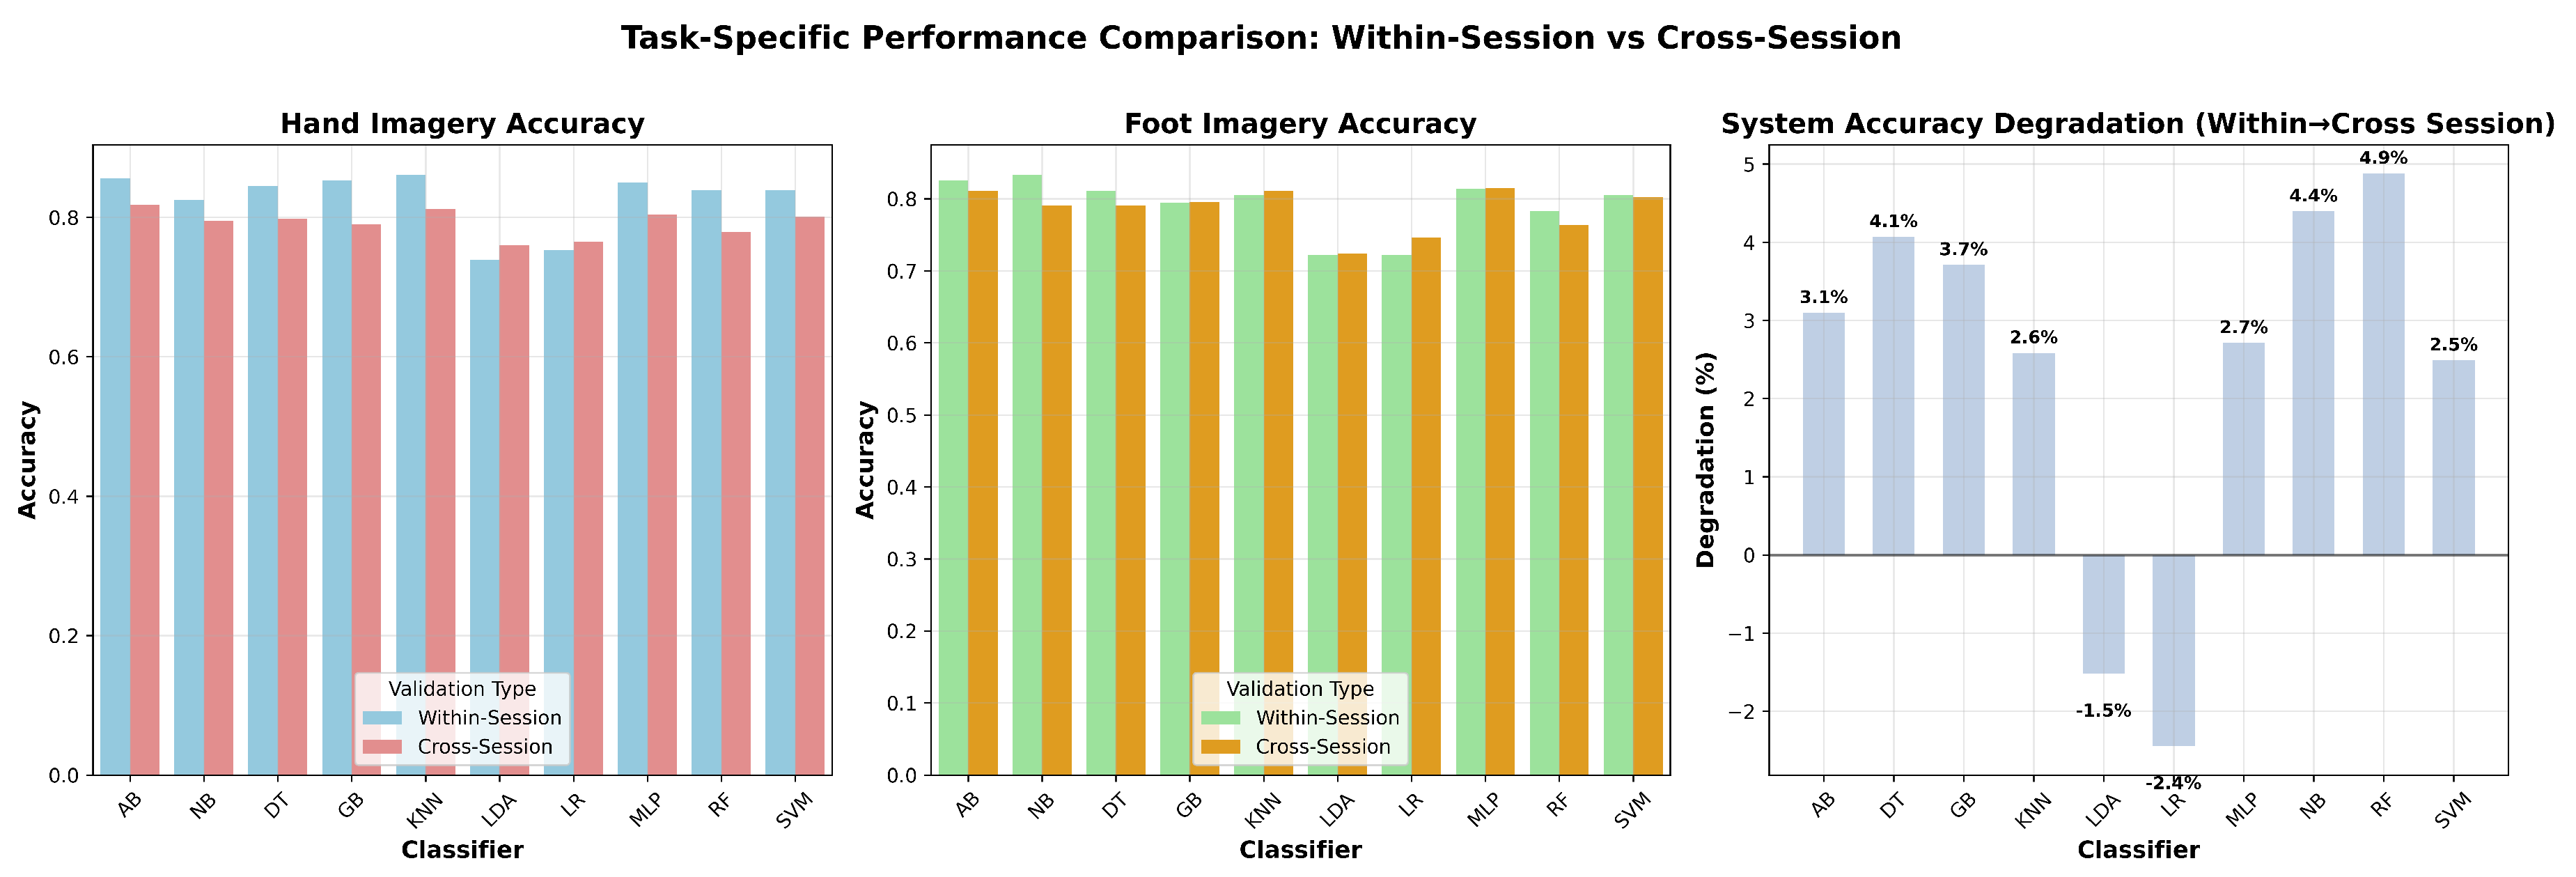
Figure 4.
Cross-session accuracy comparison between hand and foot motor imagery classification. The boxplots display accuracy distributions across different test sessions for each classifier, demonstrating temporal robustness and task-specific performance patterns.
Figure 4.
Cross-session accuracy comparison between hand and foot motor imagery classification. The boxplots display accuracy distributions across different test sessions for each classifier, demonstrating temporal robustness and task-specific performance patterns.
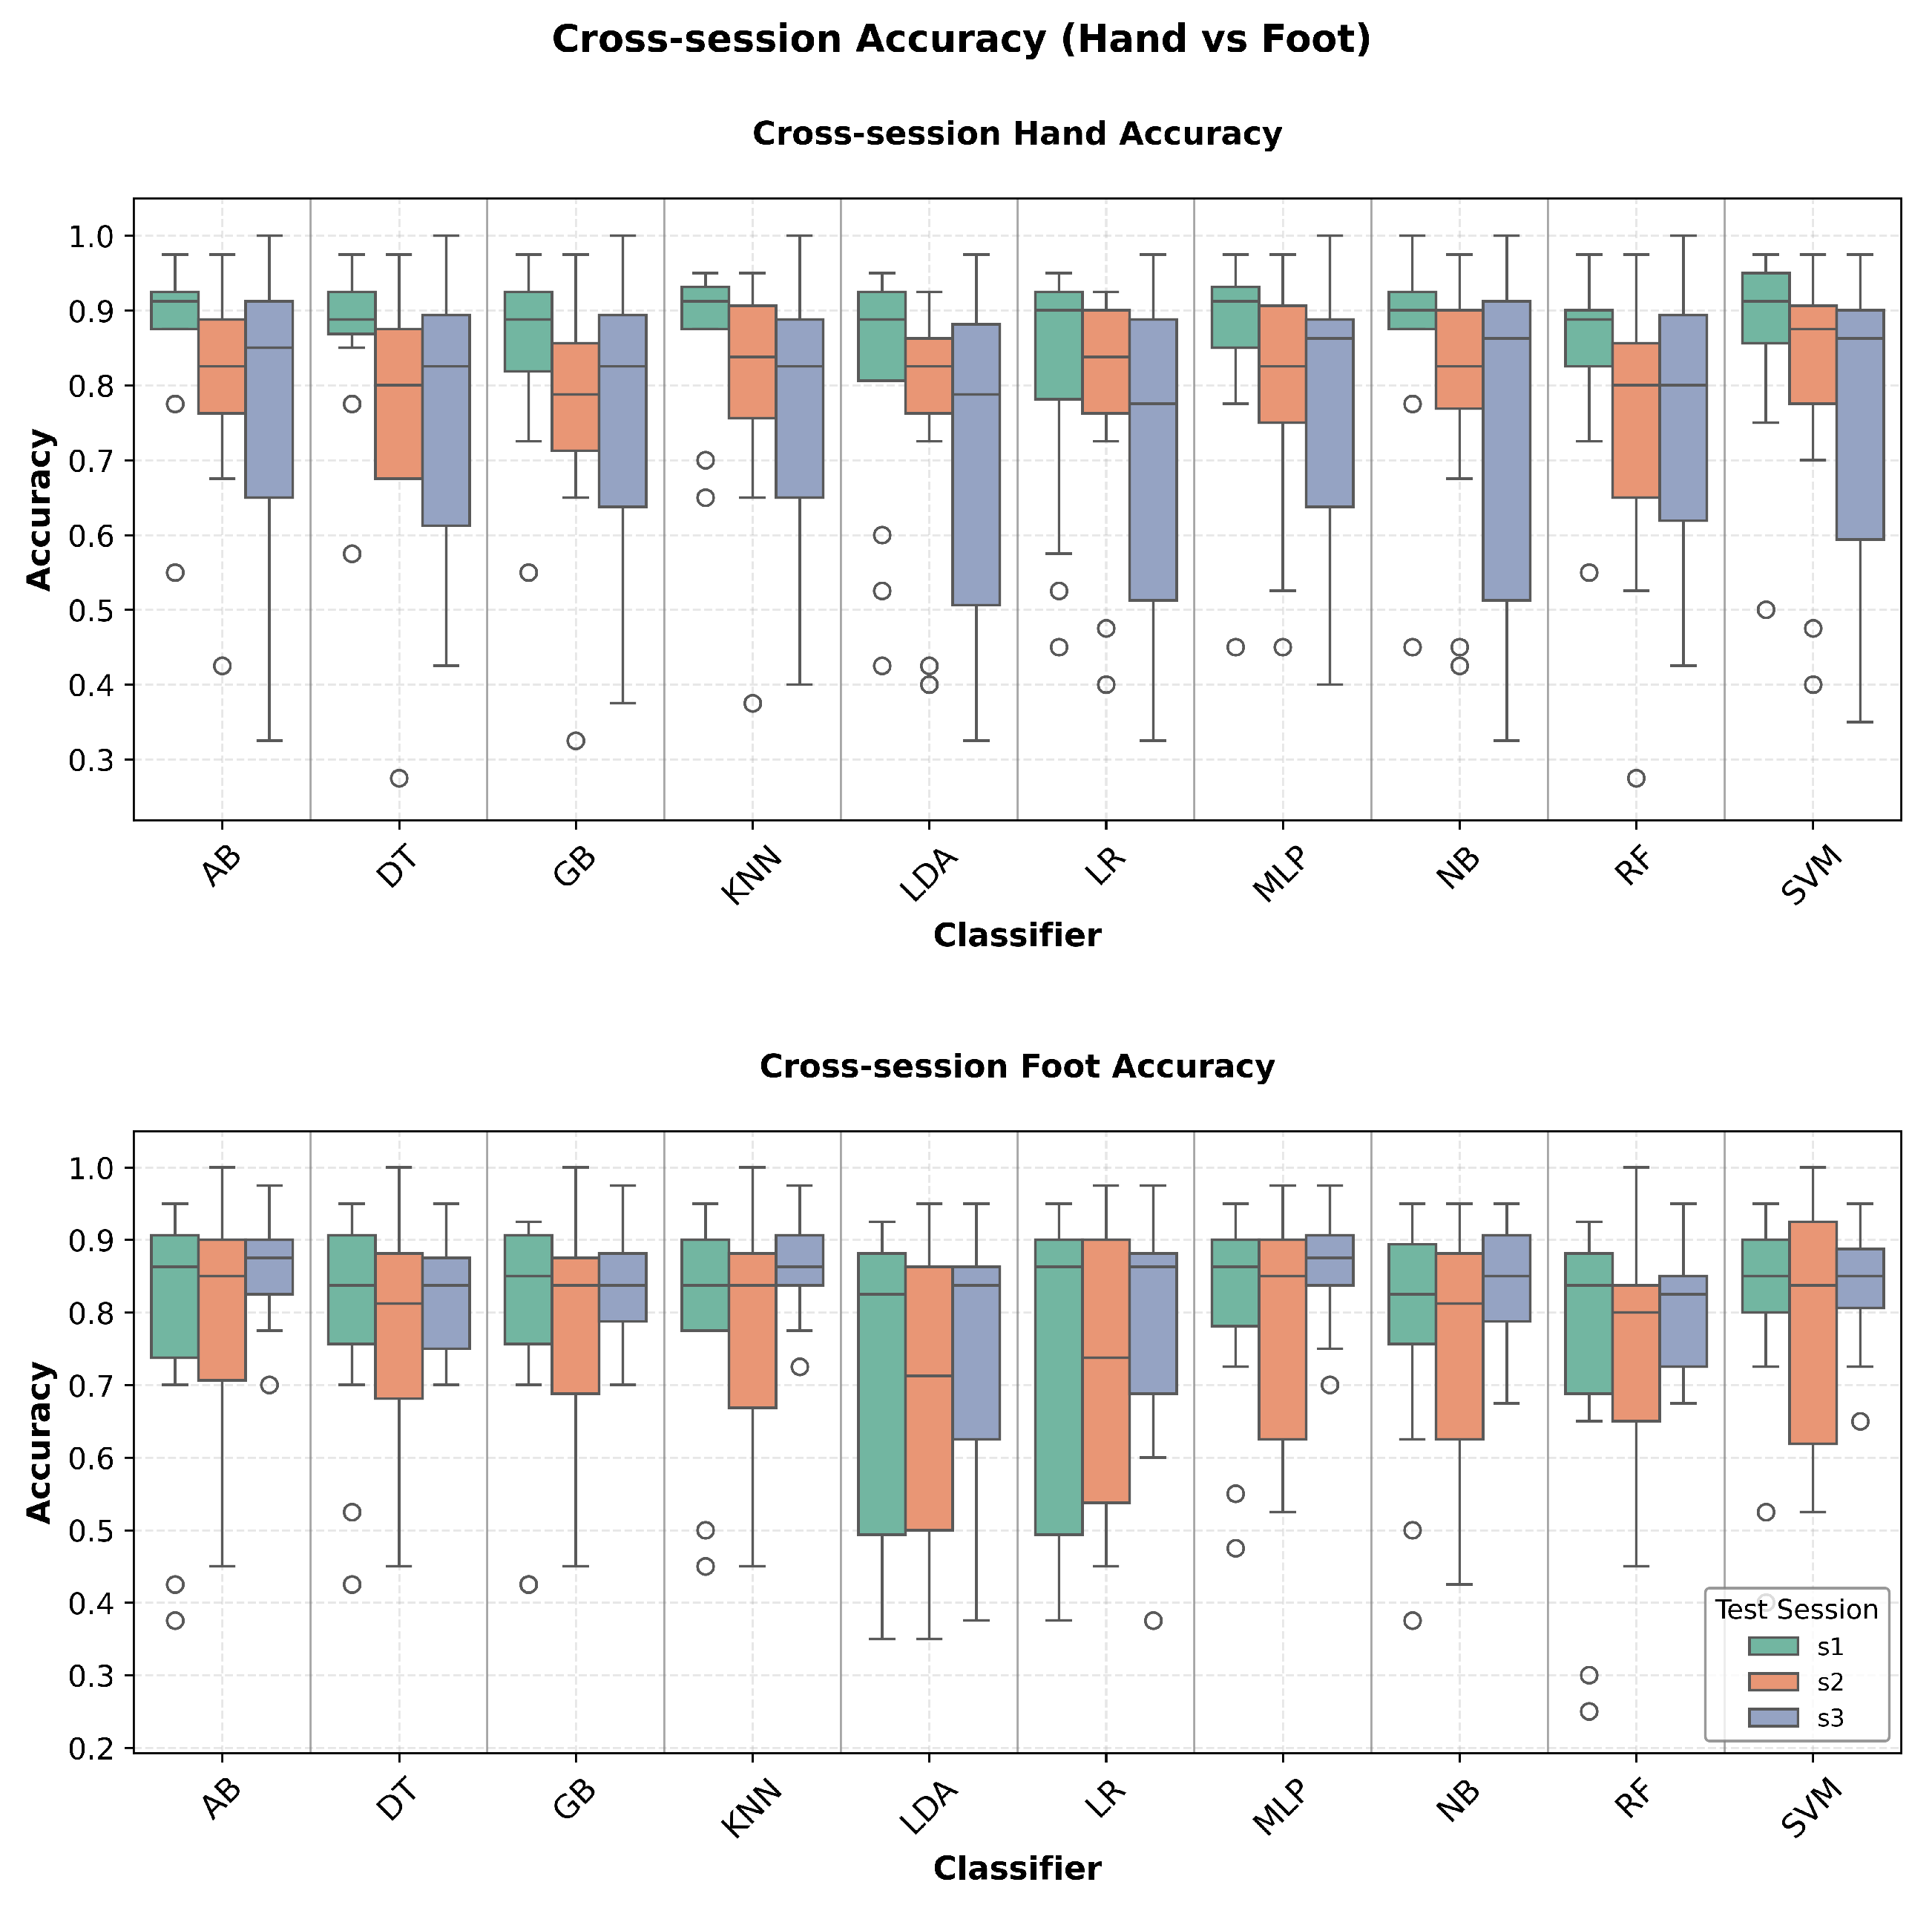
Figure 5.
Cross-session F1-score comparison between hand and foot motor imagery classification. The visualization demonstrates the balanced precision-recall trade-off across different classifiers and test sessions, providing insights into overall classification quality and temporal consistency.
Figure 5.
Cross-session F1-score comparison between hand and foot motor imagery classification. The visualization demonstrates the balanced precision-recall trade-off across different classifiers and test sessions, providing insights into overall classification quality and temporal consistency.
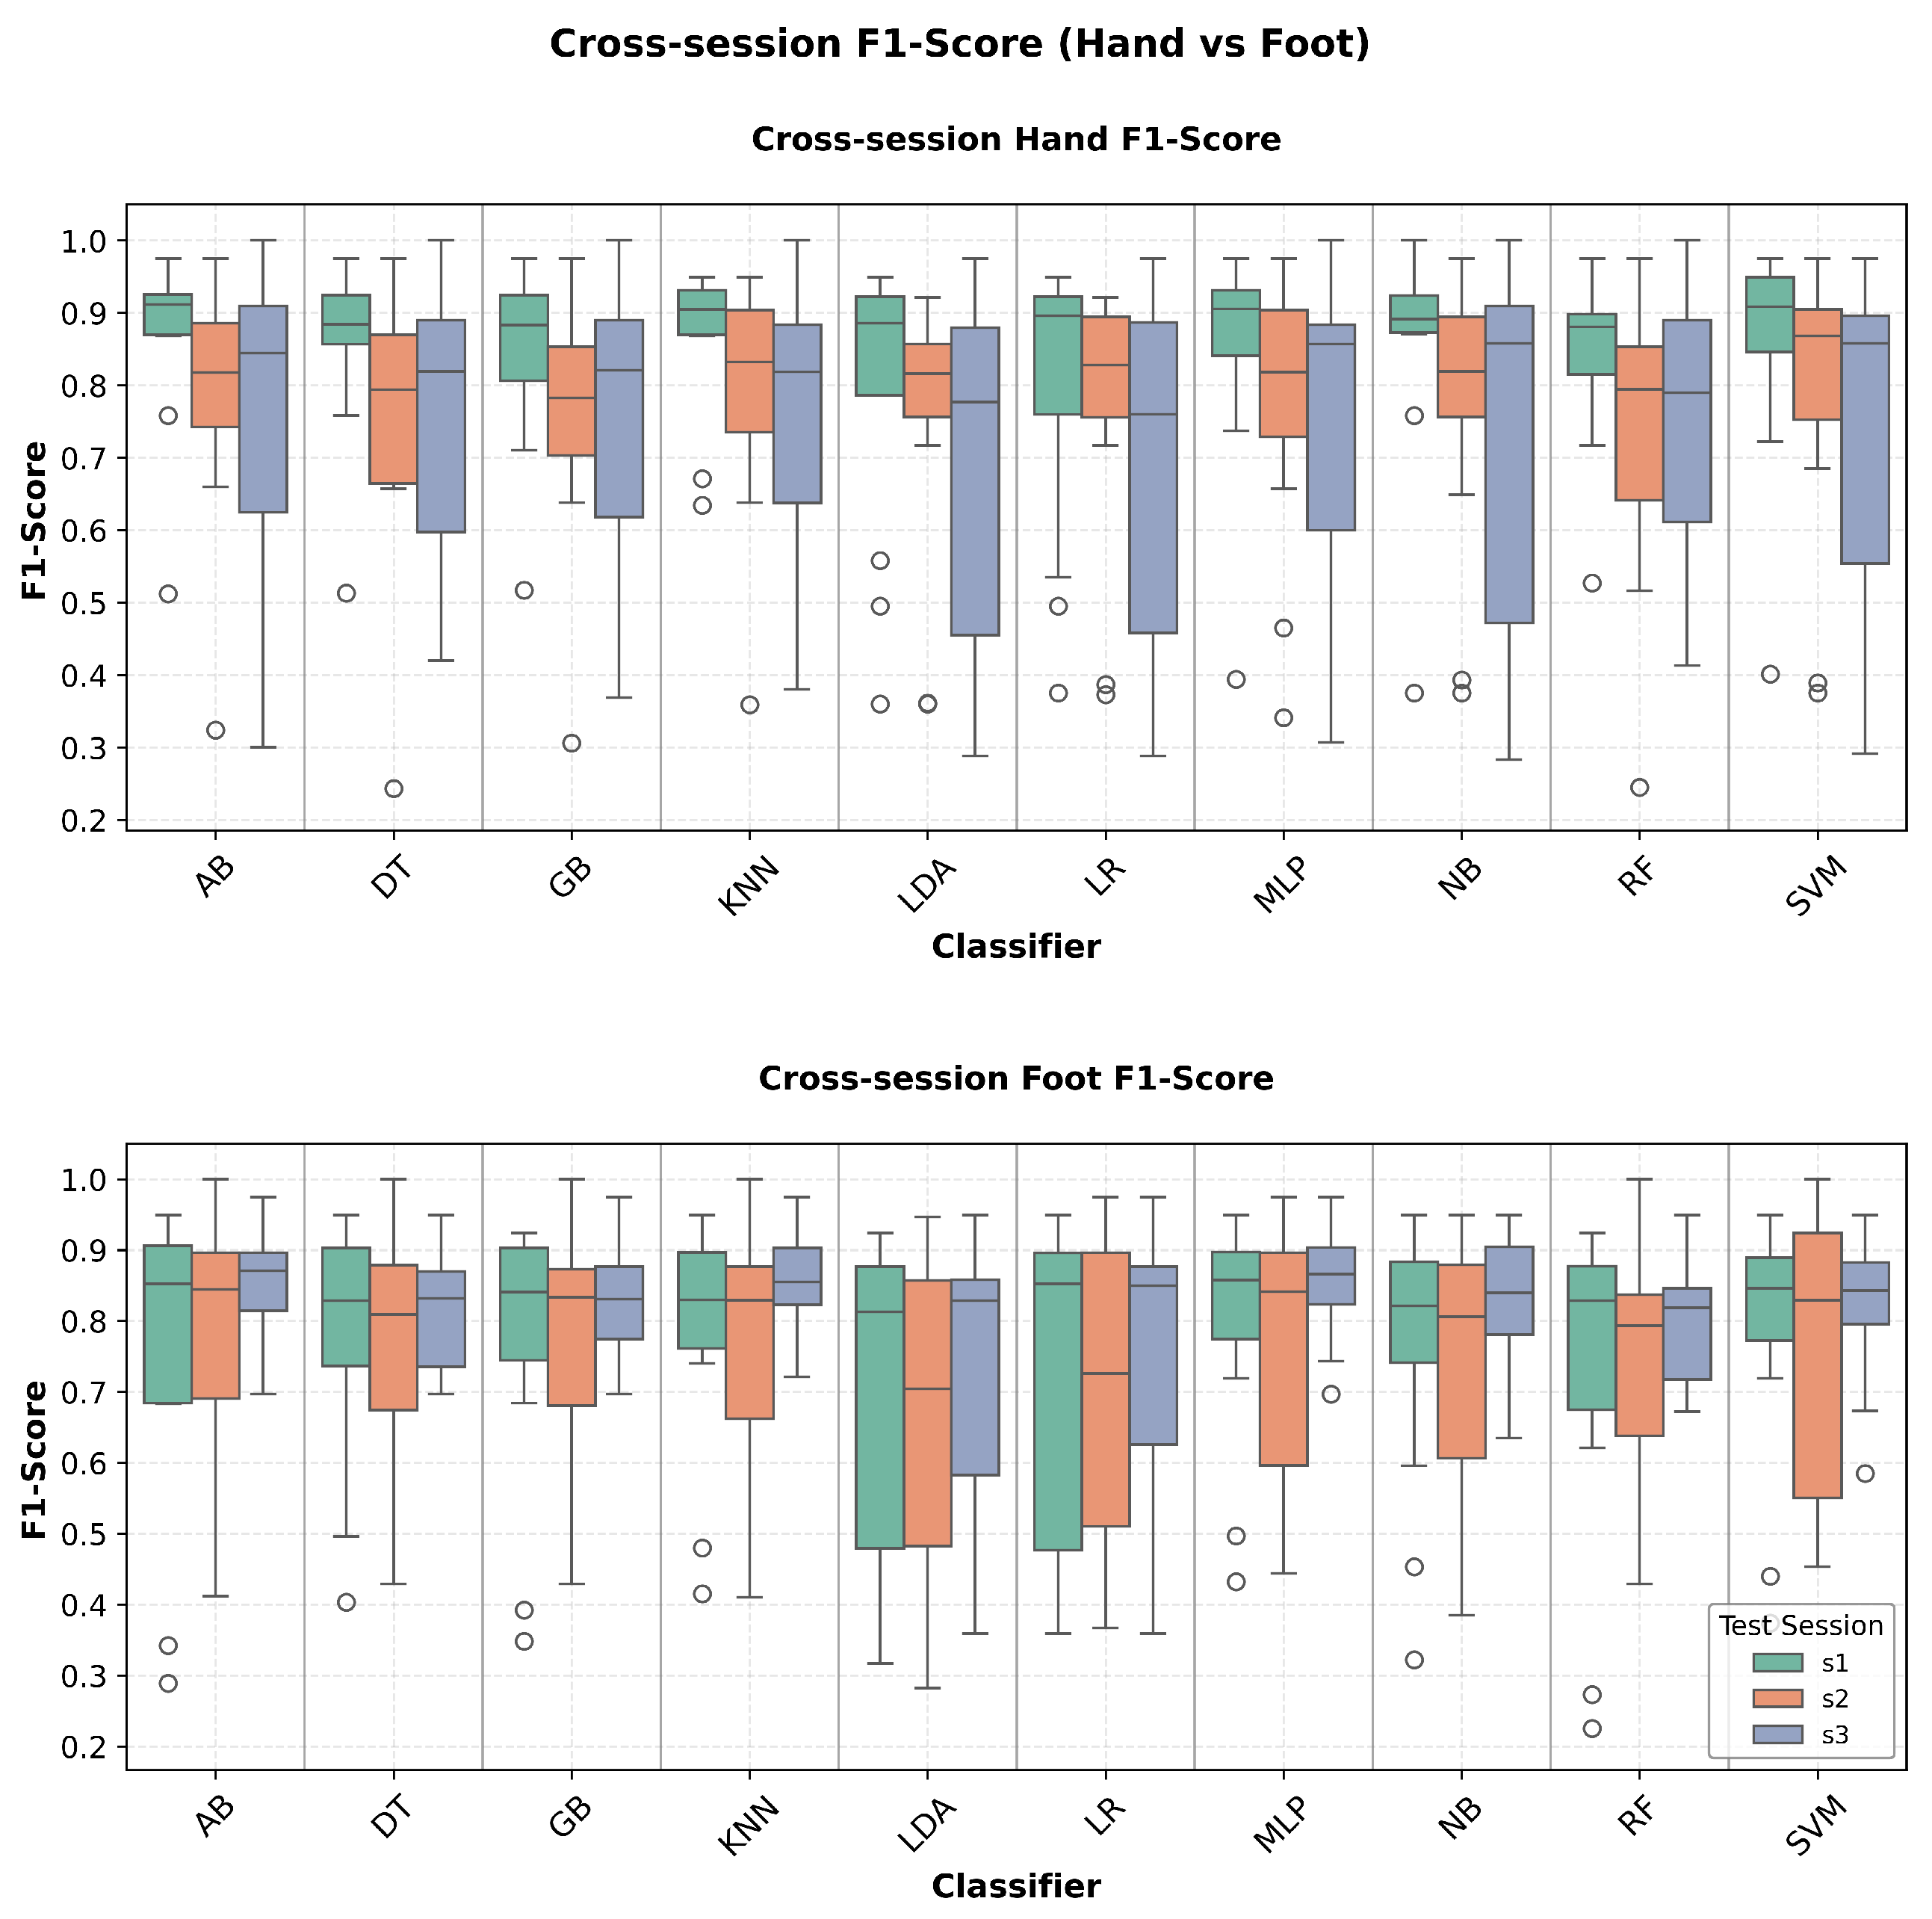
Figure 6.
Cross-session precision comparison between hand and foot motor imagery classification. The boxplots show the positive predictive value distributions across classifiers and sessions, indicating the reliability of positive classifications in temporal robustness assessment.
Figure 6.
Cross-session precision comparison between hand and foot motor imagery classification. The boxplots show the positive predictive value distributions across classifiers and sessions, indicating the reliability of positive classifications in temporal robustness assessment.
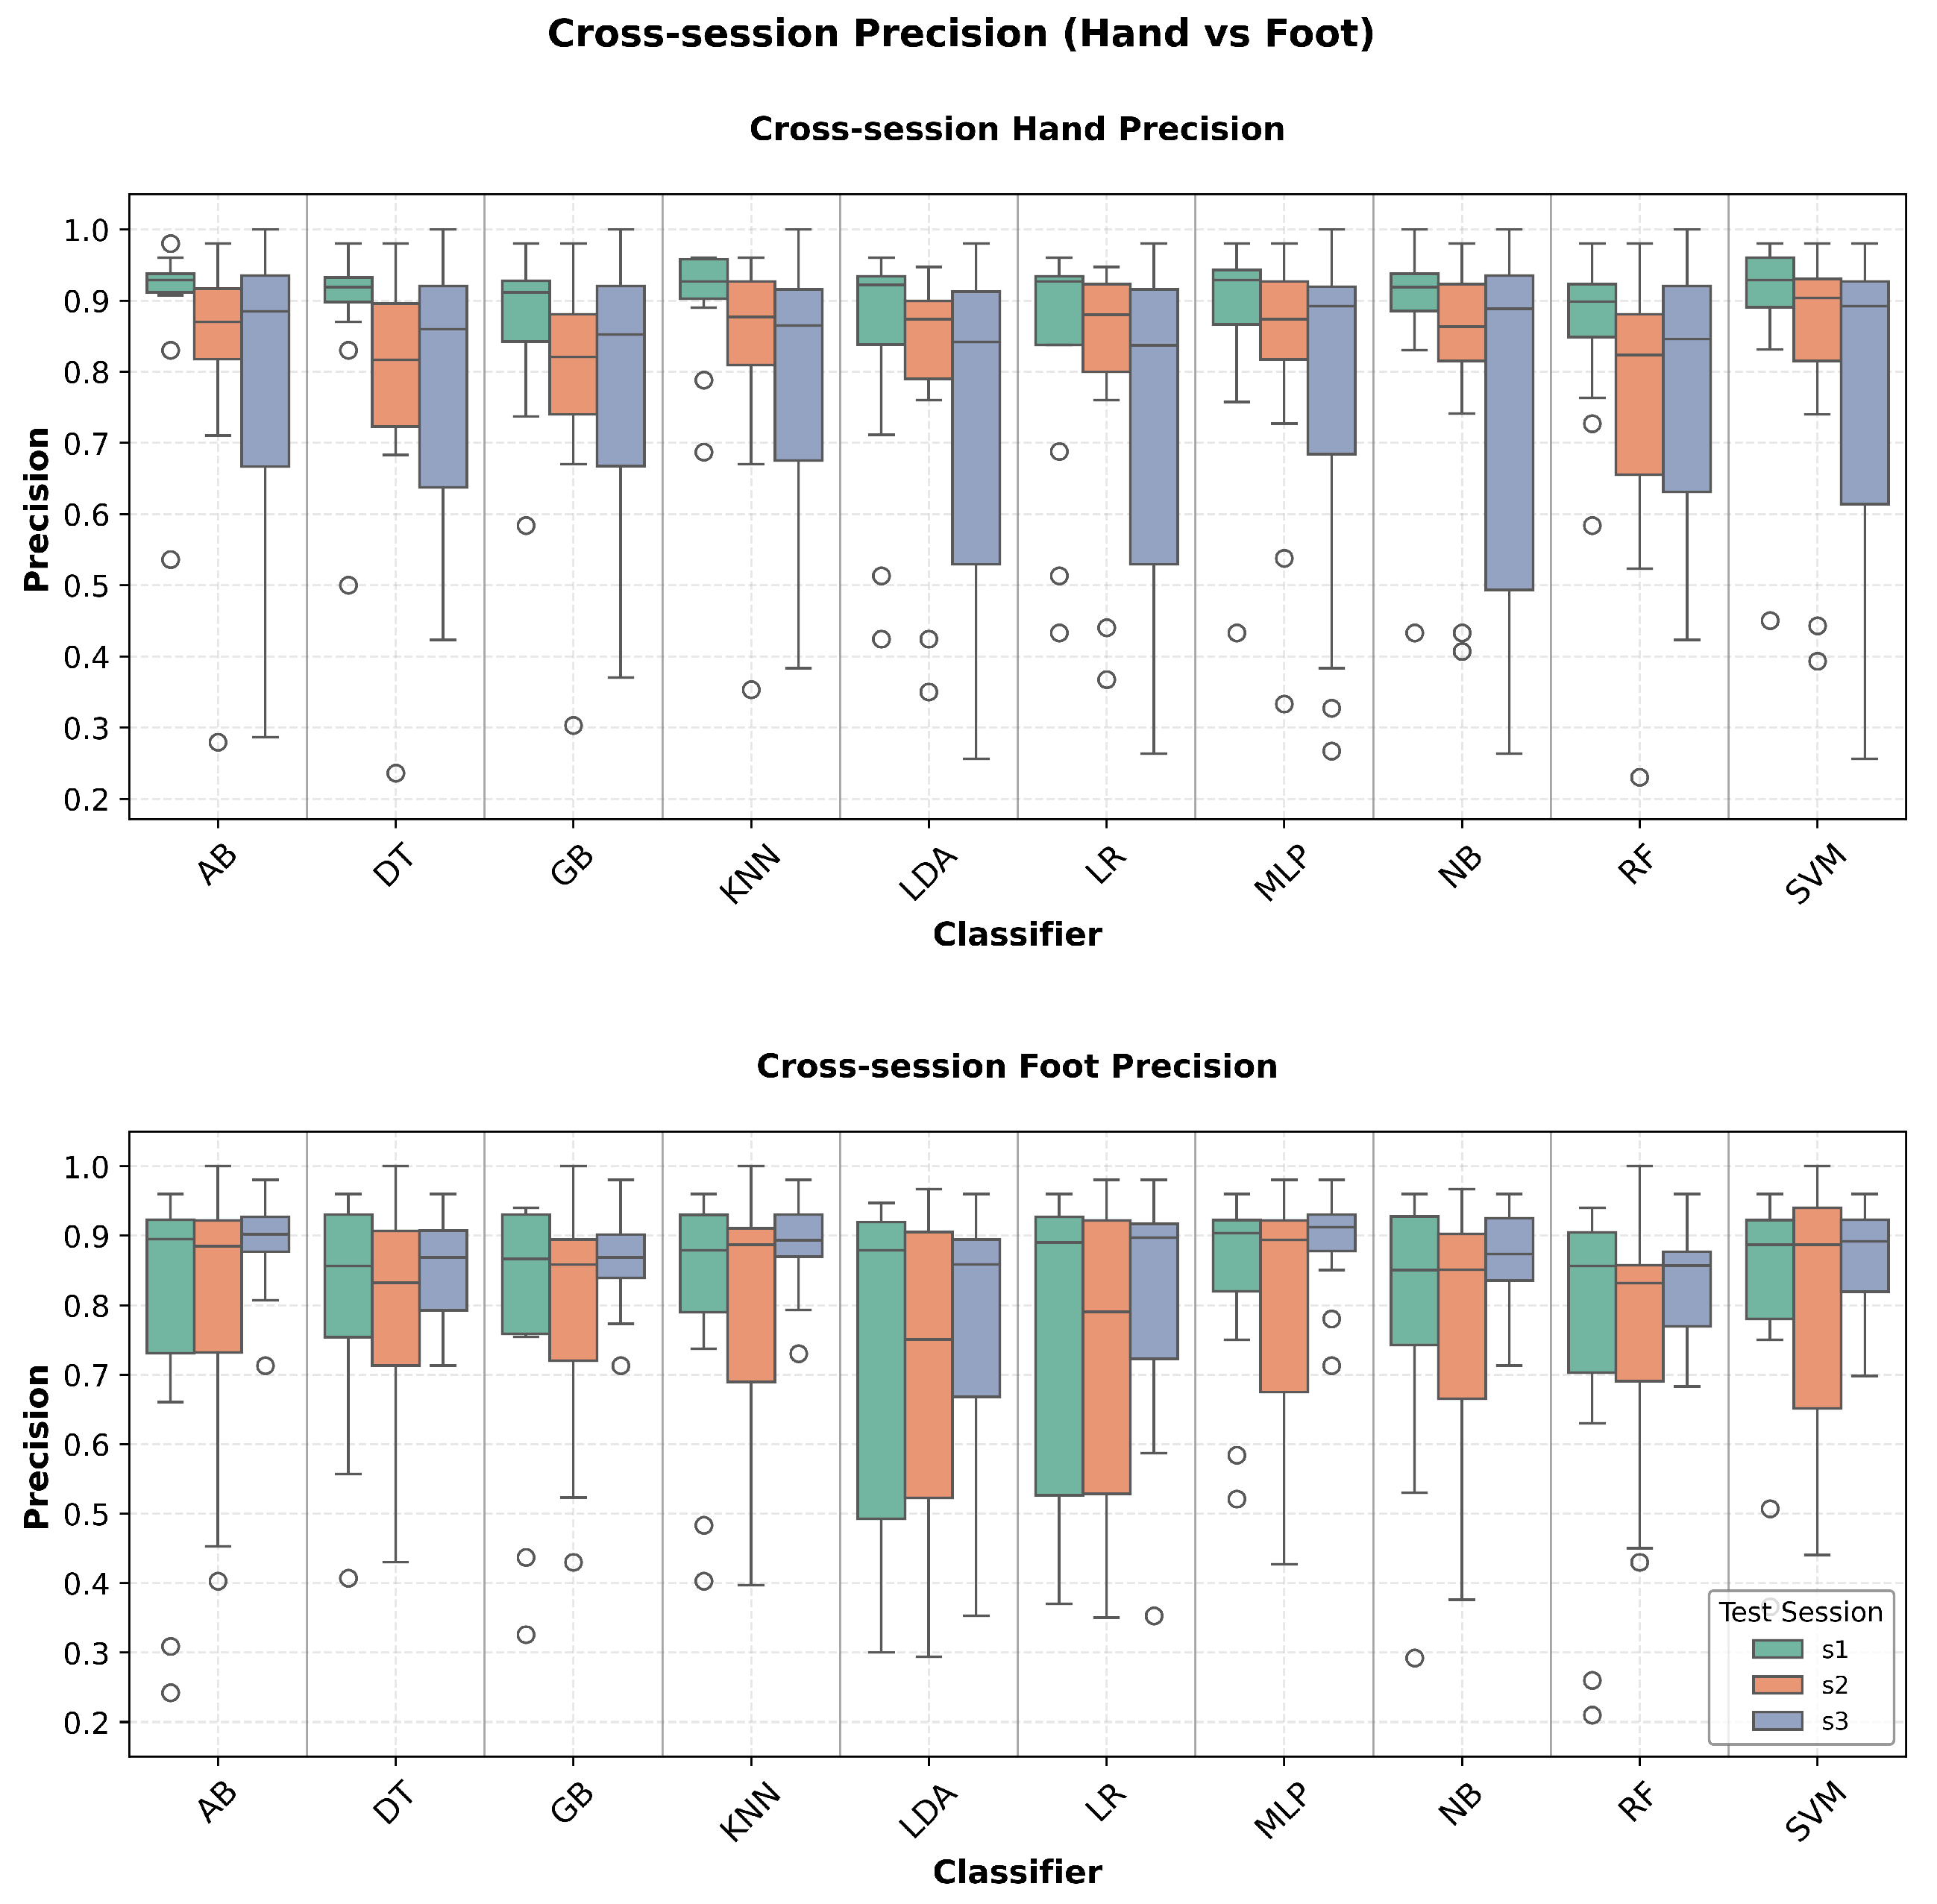
Figure 7.
Cross-session recall comparison between hand and foot motor imagery classification. The visualization displays sensitivity distributions across different test sessions, demonstrating the ability to correctly identify positive cases and temporal stability of true positive detection rates.
Figure 7.
Cross-session recall comparison between hand and foot motor imagery classification. The visualization displays sensitivity distributions across different test sessions, demonstrating the ability to correctly identify positive cases and temporal stability of true positive detection rates.
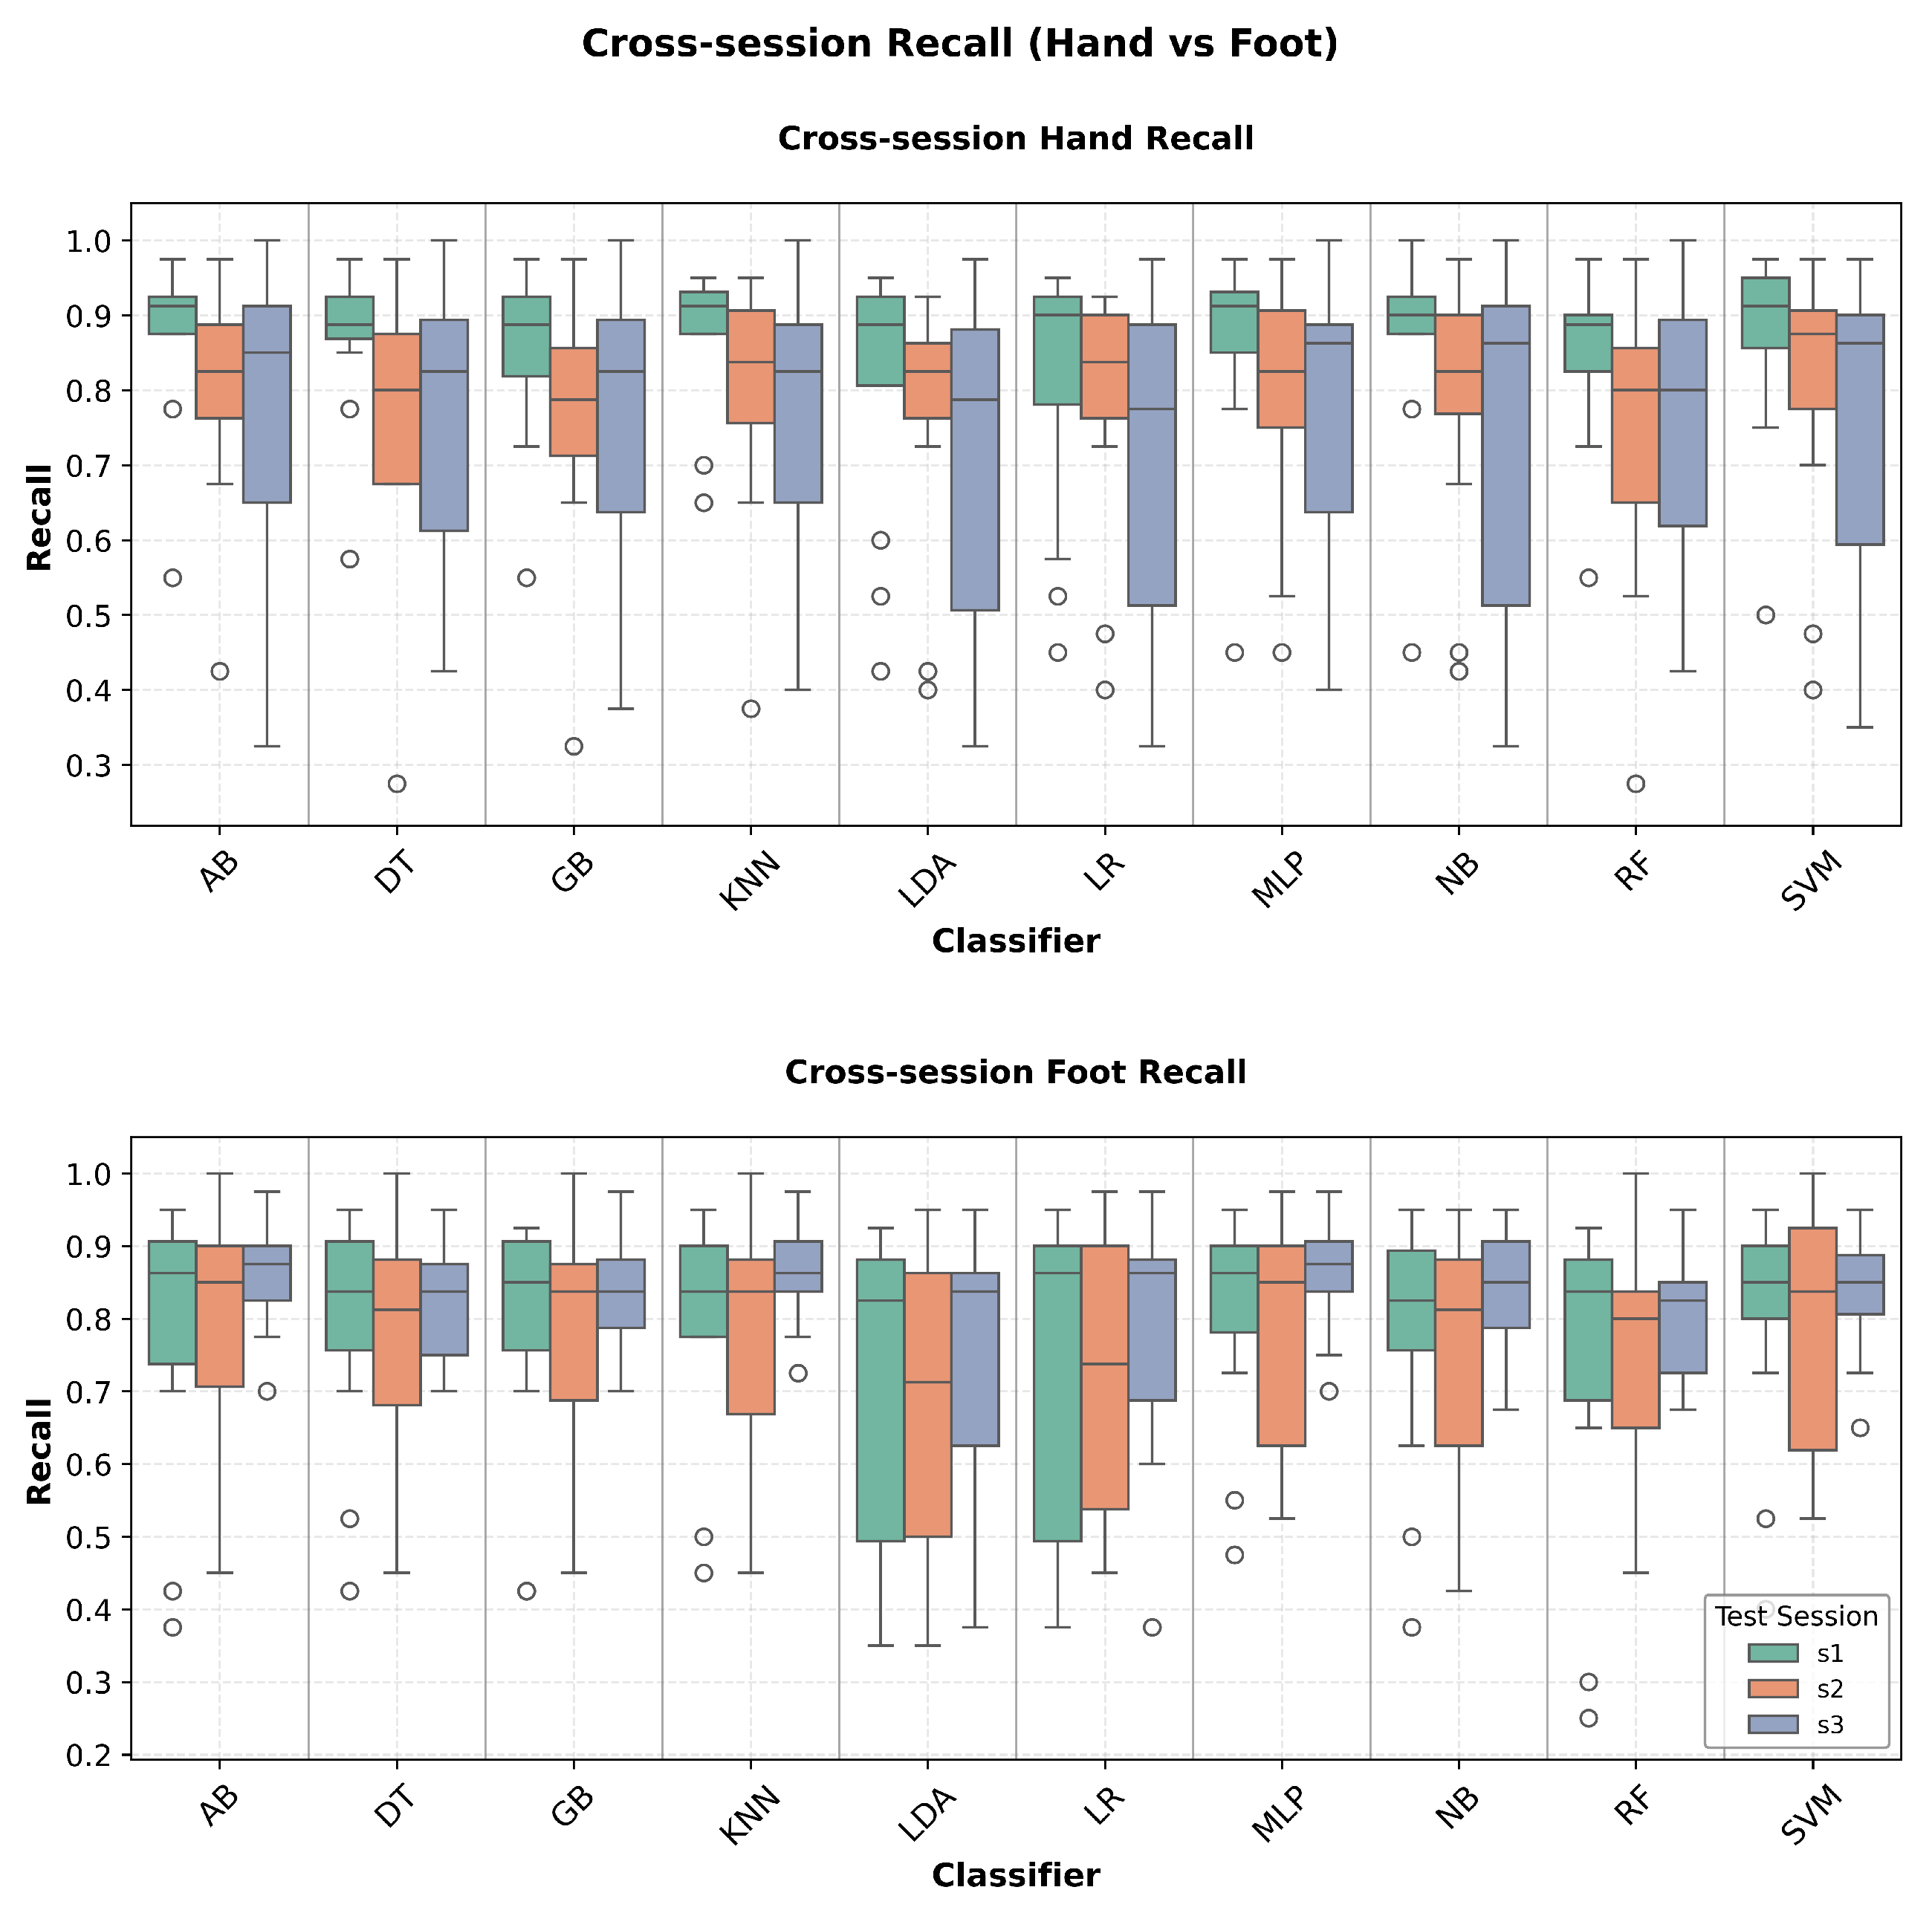

Table 1.
Comprehensive Classifier Performance Analysis
| Classifier | Within-Session (%) | Cross-Session (%) | Temporal | ||||
|---|---|---|---|---|---|---|---|
| Hand Acc. | Foot Acc. | System Acc. | Hand Acc. | Foot Acc. | System Acc. | Stability | |
| KNN | |||||||
| AdaBoost | |||||||
| MLP | |||||||
| Decision Tree | |||||||
| Gradient Boosting | |||||||
| SVM | |||||||
| Naive Bayes | |||||||
| Random Forest | |||||||
| Logistic Regression | |||||||
| LDA | |||||||
| Mean | |||||||
Table 2.
Detailed Performance Analysis: F1-Score, Precision, and Recall Metrics
| Classifier | Within-Session Performance (%) | Cross-Session Performance (%) | ||||
|---|---|---|---|---|---|---|
| F1-Score | Precision | Recall | F1-Score | Precision | Recall | |
| Hand Imagery Classification | ||||||
| KNN | ||||||
| AdaBoost | ||||||
| MLP | ||||||
| Decision Tree | ||||||
| Gradient Boosting | ||||||
| SVM | ||||||
| Naive Bayes | ||||||
| Random Forest | ||||||
| Logistic Regression | ||||||
| LDA | ||||||
| Foot Imagery Classification | ||||||
| KNN | ||||||
| AdaBoost | ||||||
| MLP | ||||||
| Decision Tree | ||||||
| Gradient Boosting | ||||||
| SVM | ||||||
| Naive Bayes | ||||||
| Random Forest | ||||||
| Logistic Regression | ||||||
| LDA | ||||||
Note: Values represent mean ± standard deviation across all subjects and sessions. The table shows detailed performance metrics for all evaluated classifiers, with separate sections for hand and foot imagery classification tasks.
Table 3.
Comprehensive Stability and Robustness Metrics Comparison
| Classifier | Coefficient of Variation (%) | Robustness Score | Stability Rank | ||
|---|---|---|---|---|---|
| Within | Cross | Within | Cross | ||
| KNN | 18.0 | 18.3 | 0.683 | 0.663 | 1 |
| AdaBoost | 16.9 | 19.0 | 0.698 | 0.659 | 2 |
| MLP | 19.3 | 19.3 | 0.671 | 0.653 | 3 |
| Decision Tree | 18.9 | 19.6 | 0.672 | 0.639 | 4 |
| Gradient Boosting | 20.1 | 19.6 | 0.658 | 0.638 | 5 |
| SVM | 19.8 | 20.8 | 0.659 | 0.635 | 6 |
| Naive Bayes | 21.2 | 22.4 | 0.653 | 0.615 | 7 |
| Random Forest | 21.7 | 22.0 | 0.635 | 0.602 | 8 |
| Logistic Regression | 32.9 | 25.7 | 0.495 | 0.561 | 9 |
| LDA | 31.8 | 26.8 | 0.498 | 0.543 | 10 |
Disclaimer/Publisher’s Note: The statements, opinions and data contained in all publications are solely those of the individual author(s) and contributor(s) and not of MDPI and/or the editor(s). MDPI and/or the editor(s) disclaim responsibility for any injury to people or property resulting from any ideas, methods, instructions or products referred to in the content. |
© 2025 by the authors. Licensee MDPI, Basel, Switzerland. This article is an open access article distributed under the terms and conditions of the Creative Commons Attribution (CC BY) license (http://creativecommons.org/licenses/by/4.0/).
Copyright: This open access article is published under a Creative Commons CC BY 4.0 license, which permit the free download, distribution, and reuse, provided that the author and preprint are cited in any reuse.


