Submitted:
02 September 2025
Posted:
03 September 2025
You are already at the latest version
Abstract
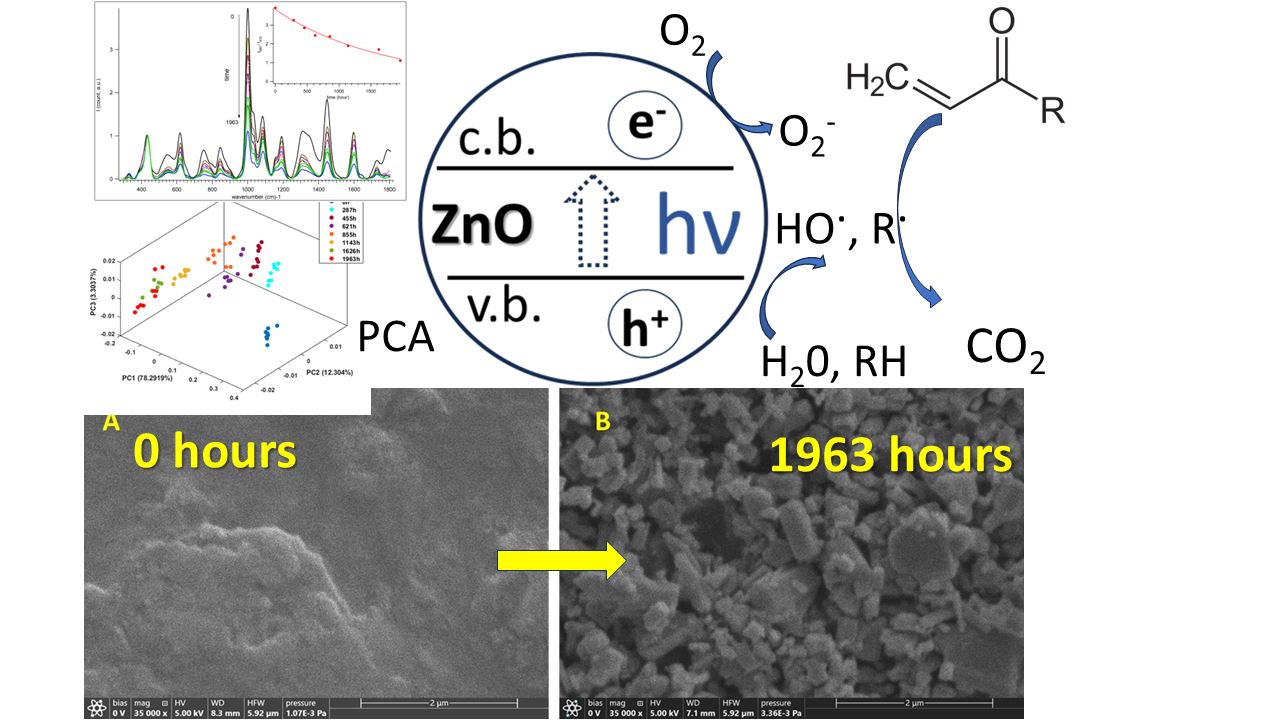
Accelerated artificial aging of ZnO PW4 acrylic artist’s paints was carried out for a total of 1963 hours (~8 107 lux.h) with aging assessment at specific intervals. Color change ΔE* < 2 (CIELab-76 system) over 1725 hours of aging, while the human eye notices color change at ΔE* > 2. Oxidative degradation of organic components in the paint to form volatile products was revealed by ATR-FTIR, Raman spectroscopy-microscopy and scanning electron microscopy with energy dispersive X-ray spectroscopy (SEM-EDS). It appears that deep oxidation of organic intermediates and volatilization of organic matter may be responsible for the relatively small value of ΔE* color difference during aging of the samples. To elucidate the degradation pathways, principal component analysis (PCA) was applied to the spectral data, revealing: 1) the catalytic role of ZnO in accelerating photodegradation, 2) the Kolbe photoreaction, 3) the decomposition of the binder to form volatile degradation products, 4) the relative photoinactivity of CaCO3 compared to ZnO, showing slower degradation in areas with higher CaCO3 content compared to those dominated by ZnO. These results provide fundamental insights into formulation-specific degradation processes, offering practical guidance for the development of more durable artist paints and conservation strategies for acrylic artworks.
Keywords:
1. Introduction
2. Materials and Methods
2.1. Samples Preparation
2.2. Artificial Daylight Ageing
2.3. Colorimetric Measurements
2.4. Scanning Electron Microscopy (SEM)
2.5. Attenuated Total Reflection Fourier Transform Infrared Spectroscopy (ATR-FTIR)
2.6. Raman Spectroscopy
2.7. ATR-FTIR, Raman Spectra Preprocessing
3. Results
3.1. Colometry

| time, hours | L* | a* | b* | ΔΕ* |
|---|---|---|---|---|
| 0 | 94.75 | -1.29 | 4.04 | 0.77 |
| 120 | 95.06 | -0.71 | 3.63 | 0.78 |
| 240 | 95.19 | -0.7 | 3.78 | 0.75 |
| 360 | 95.17 | -0.68 | 3.92 | 1.19 |
| 480 | 95.76 | -0.66 | 4.14 | 1.18 |
| 730 | 95.72 | -0.62 | 4.05 | 1.08 |
| 850 | 95.63 | -0.69 | 4.22 | 1.08 |
| 970 | 95.61 | -0.63 | 4.03 | 1.53 |
| 1090 | 95.81 | -0.62 | 3.66 | 1.31 |
| 1240 | 94.96 | -0.53 | 4.36 | 0.85 |
| 1360 | 95.56 | -0.55 | 4.07 | 1.1 |
| 1480 | 95.60 | -0.49 | 3.88 | 1.18 |
| 1600 | 95.64 | -0.44 | 3.74 | 1.27 |
| 1725 | 95.56 | -0.51 | 3.67 | 1.18 |
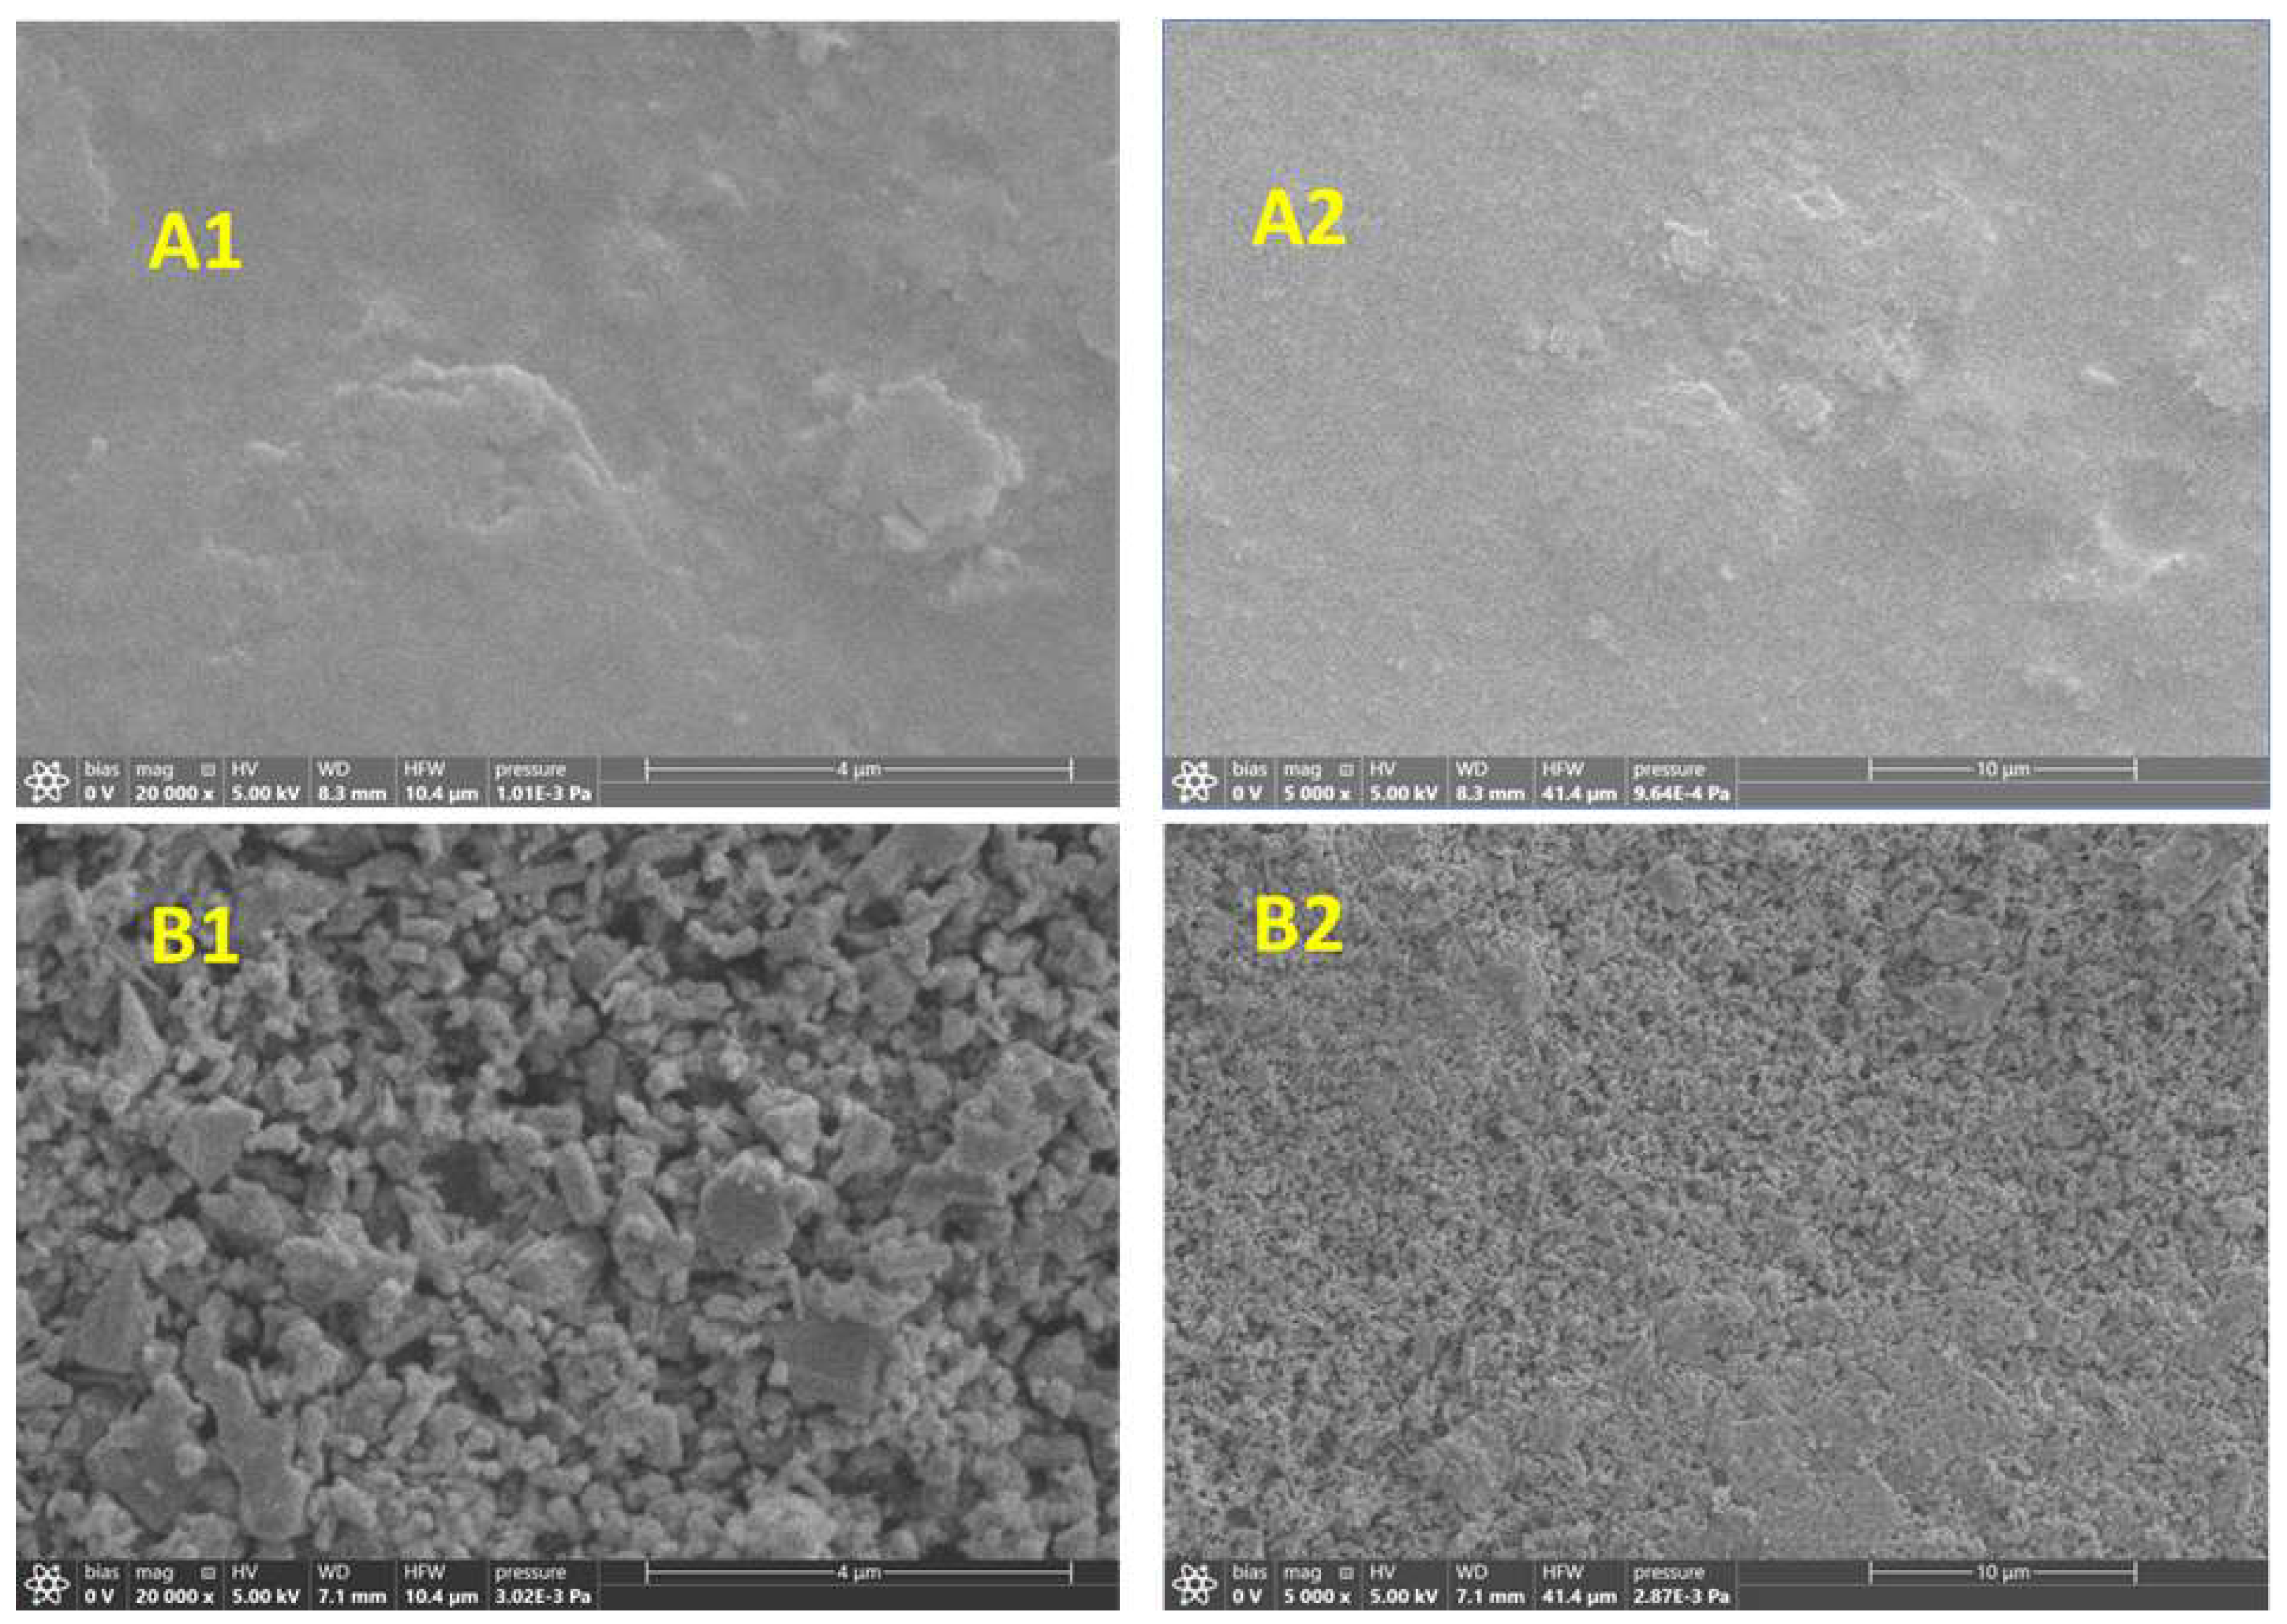
3.2. SEM Images
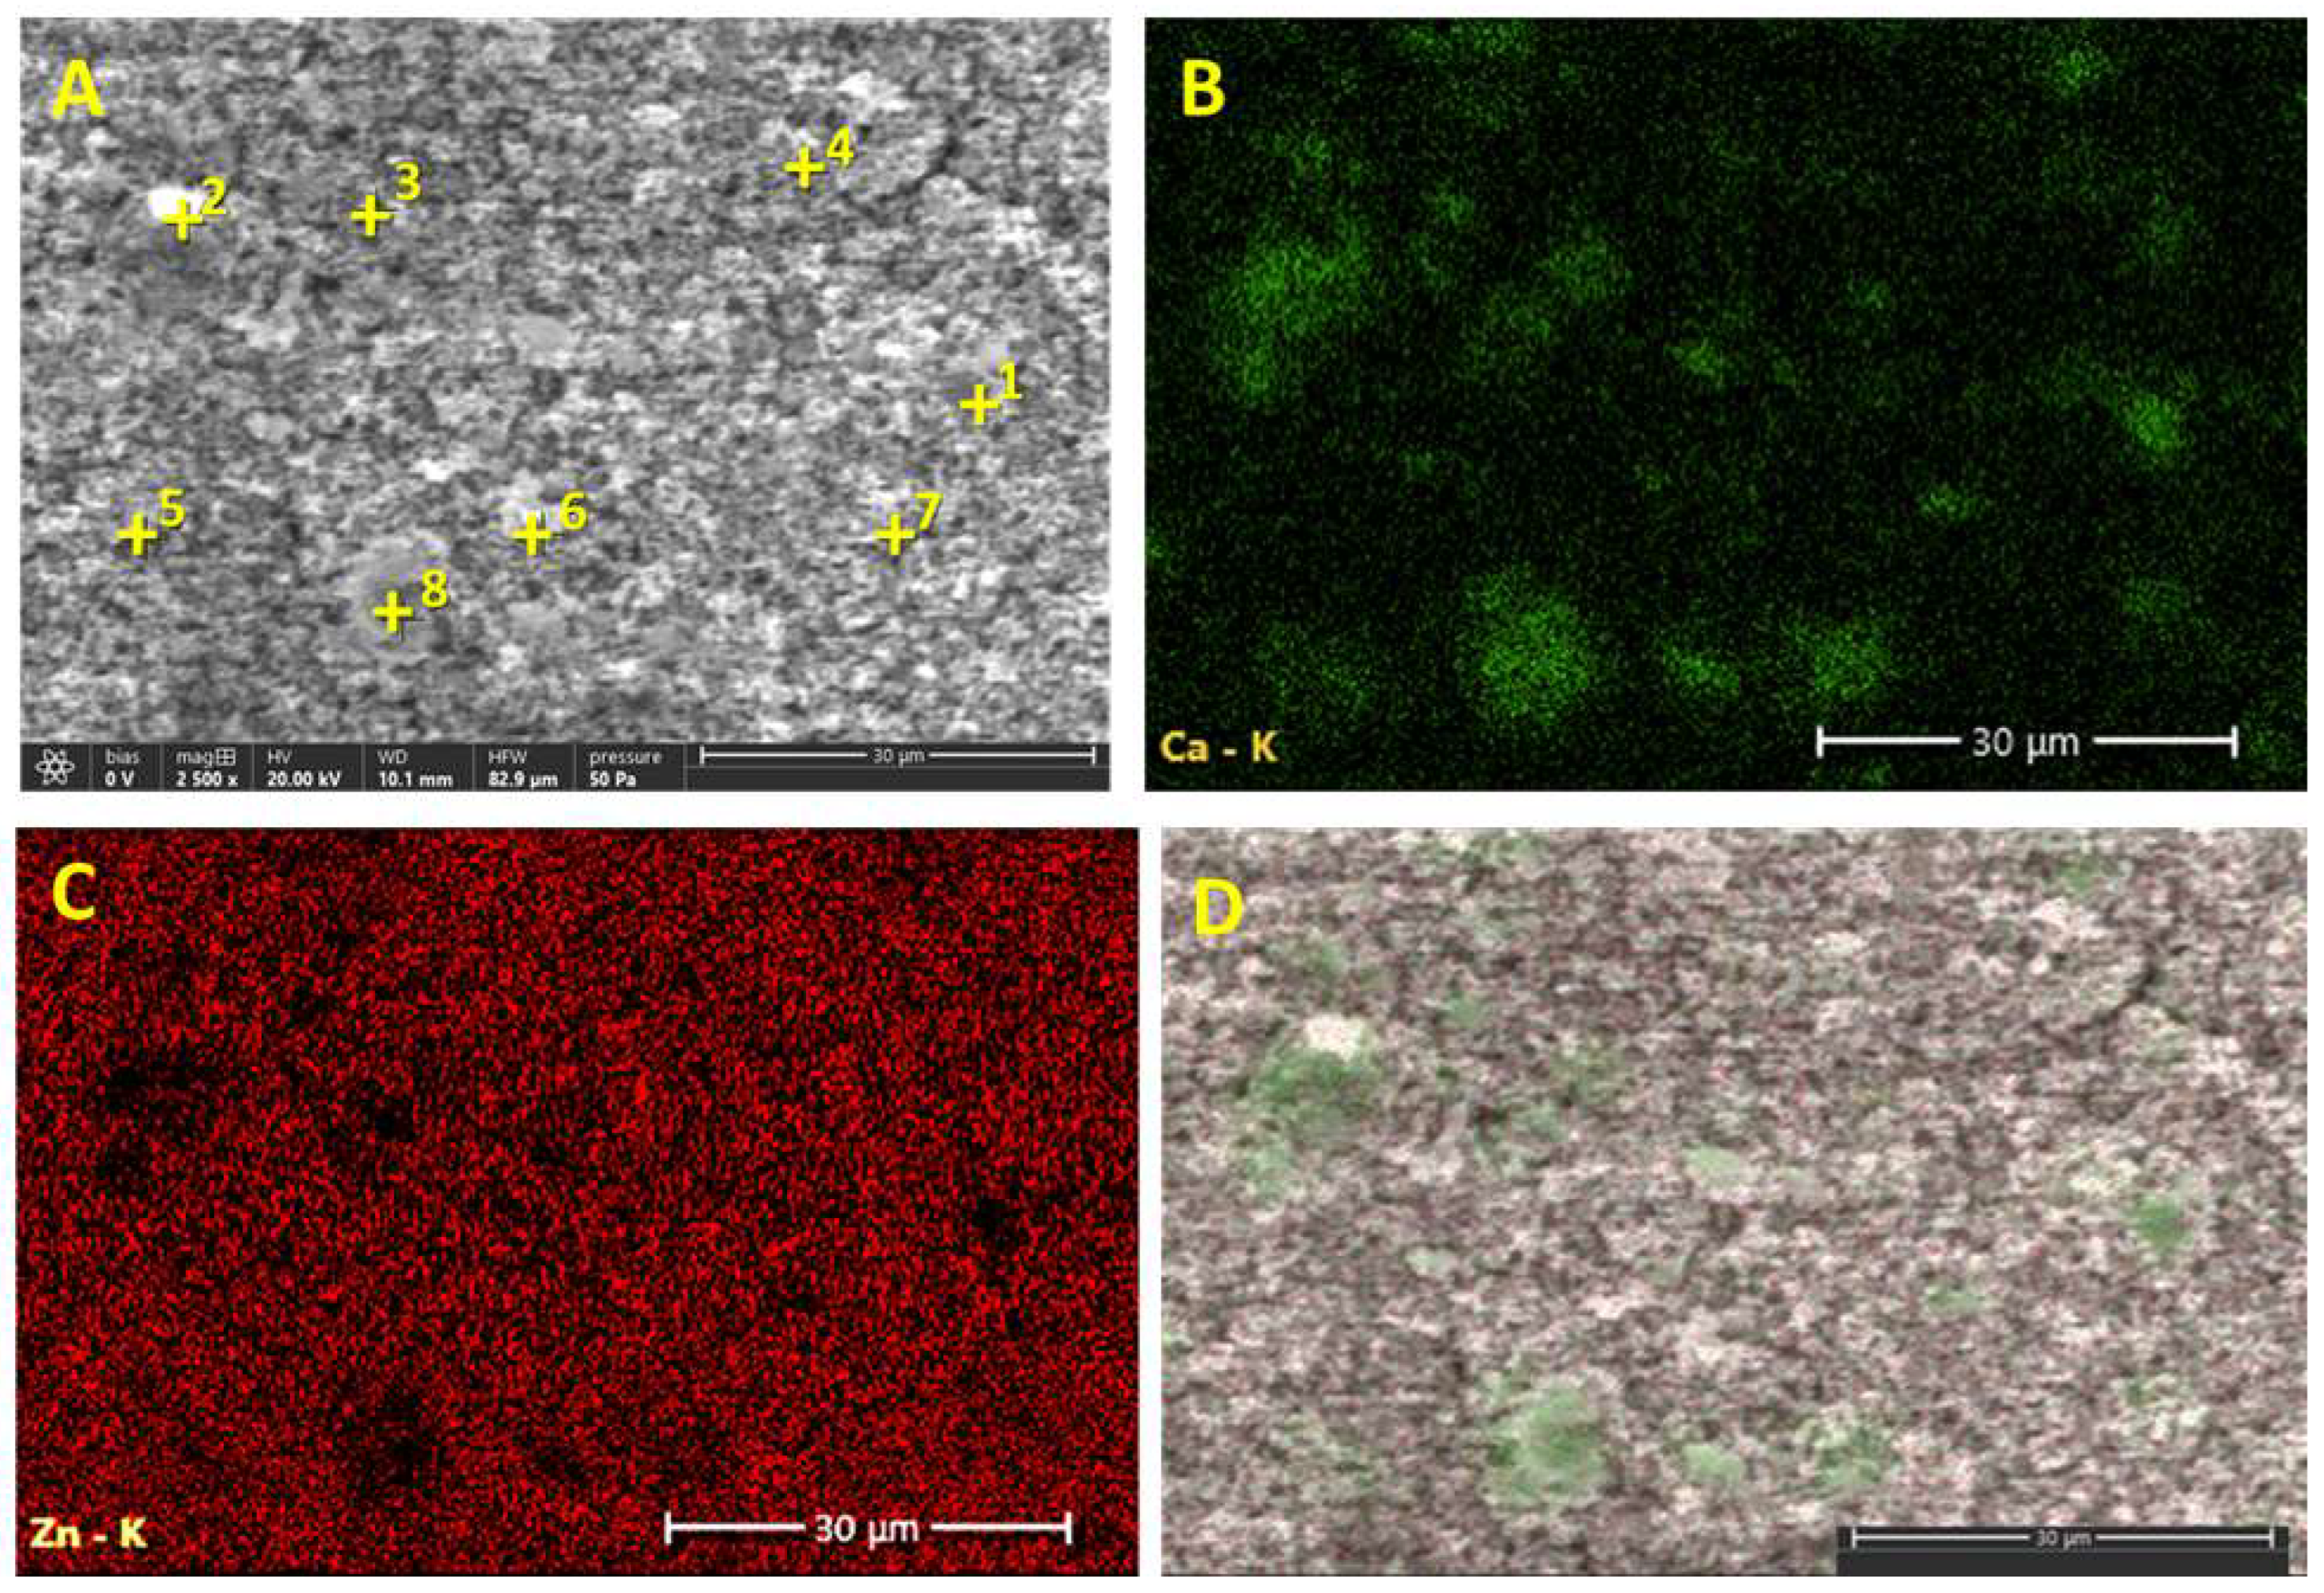
3.3. SEM-EDS Analysis of the Zinc White PW4 Acrylic Paint
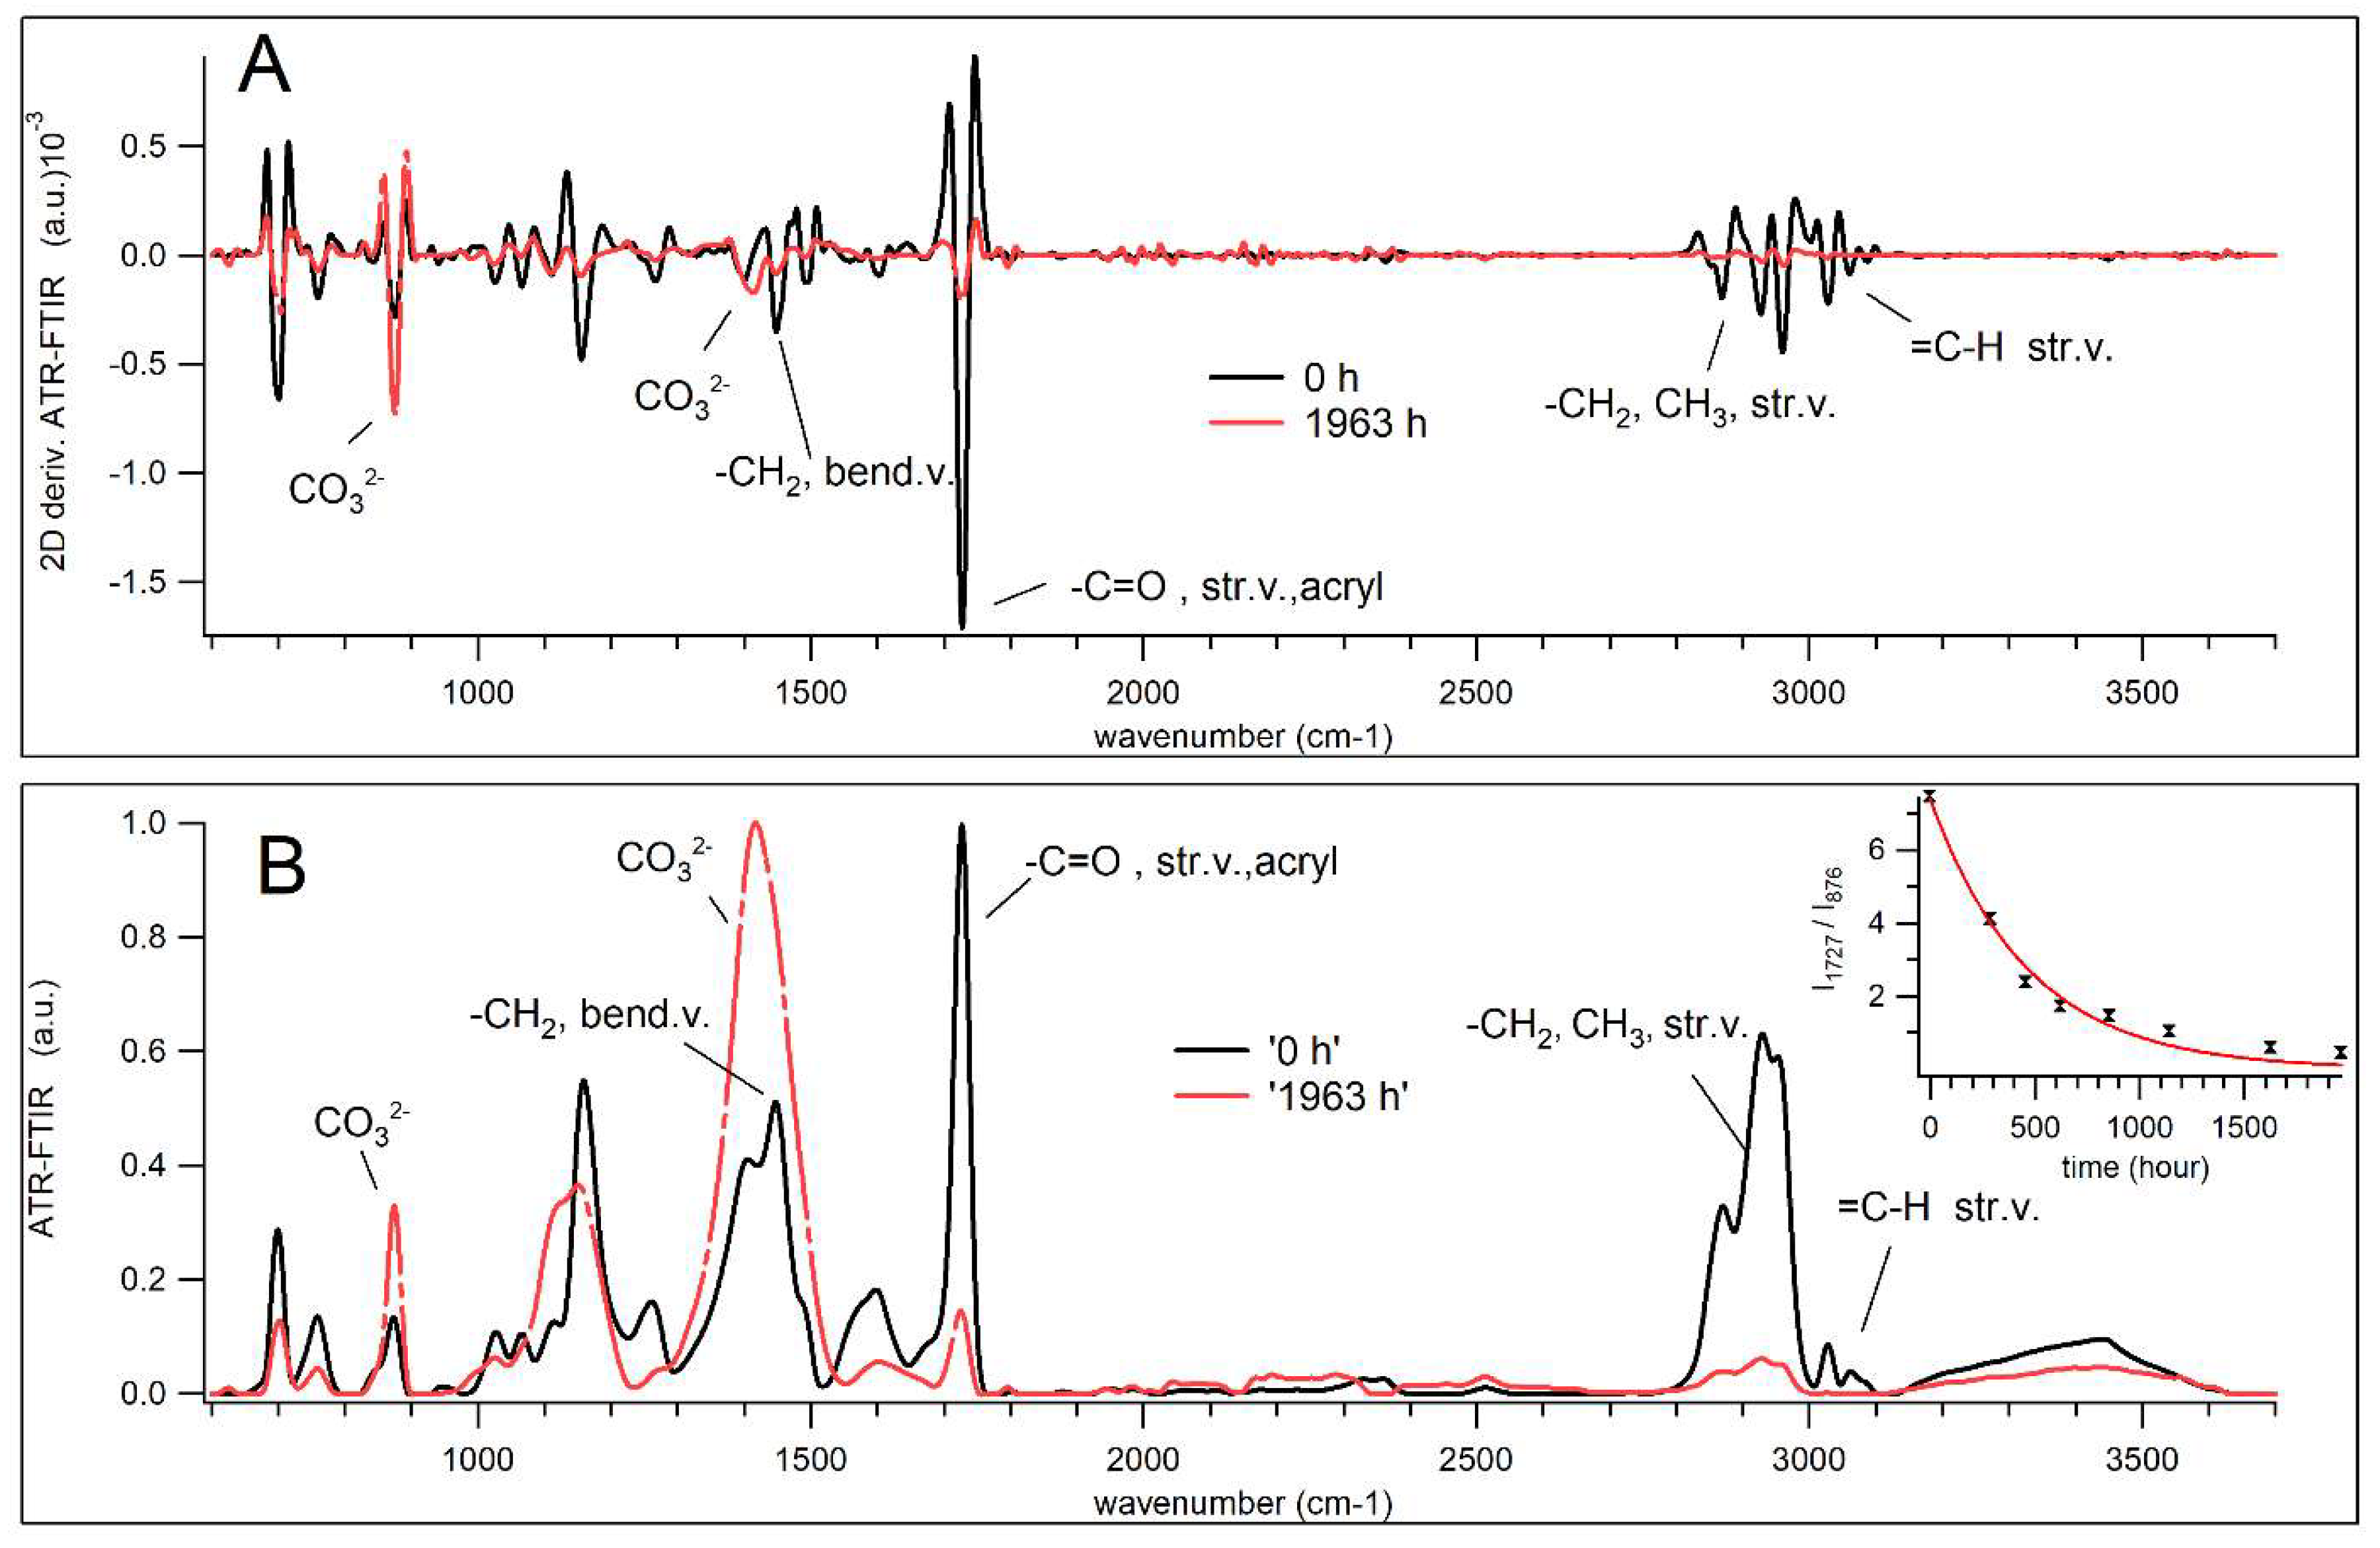
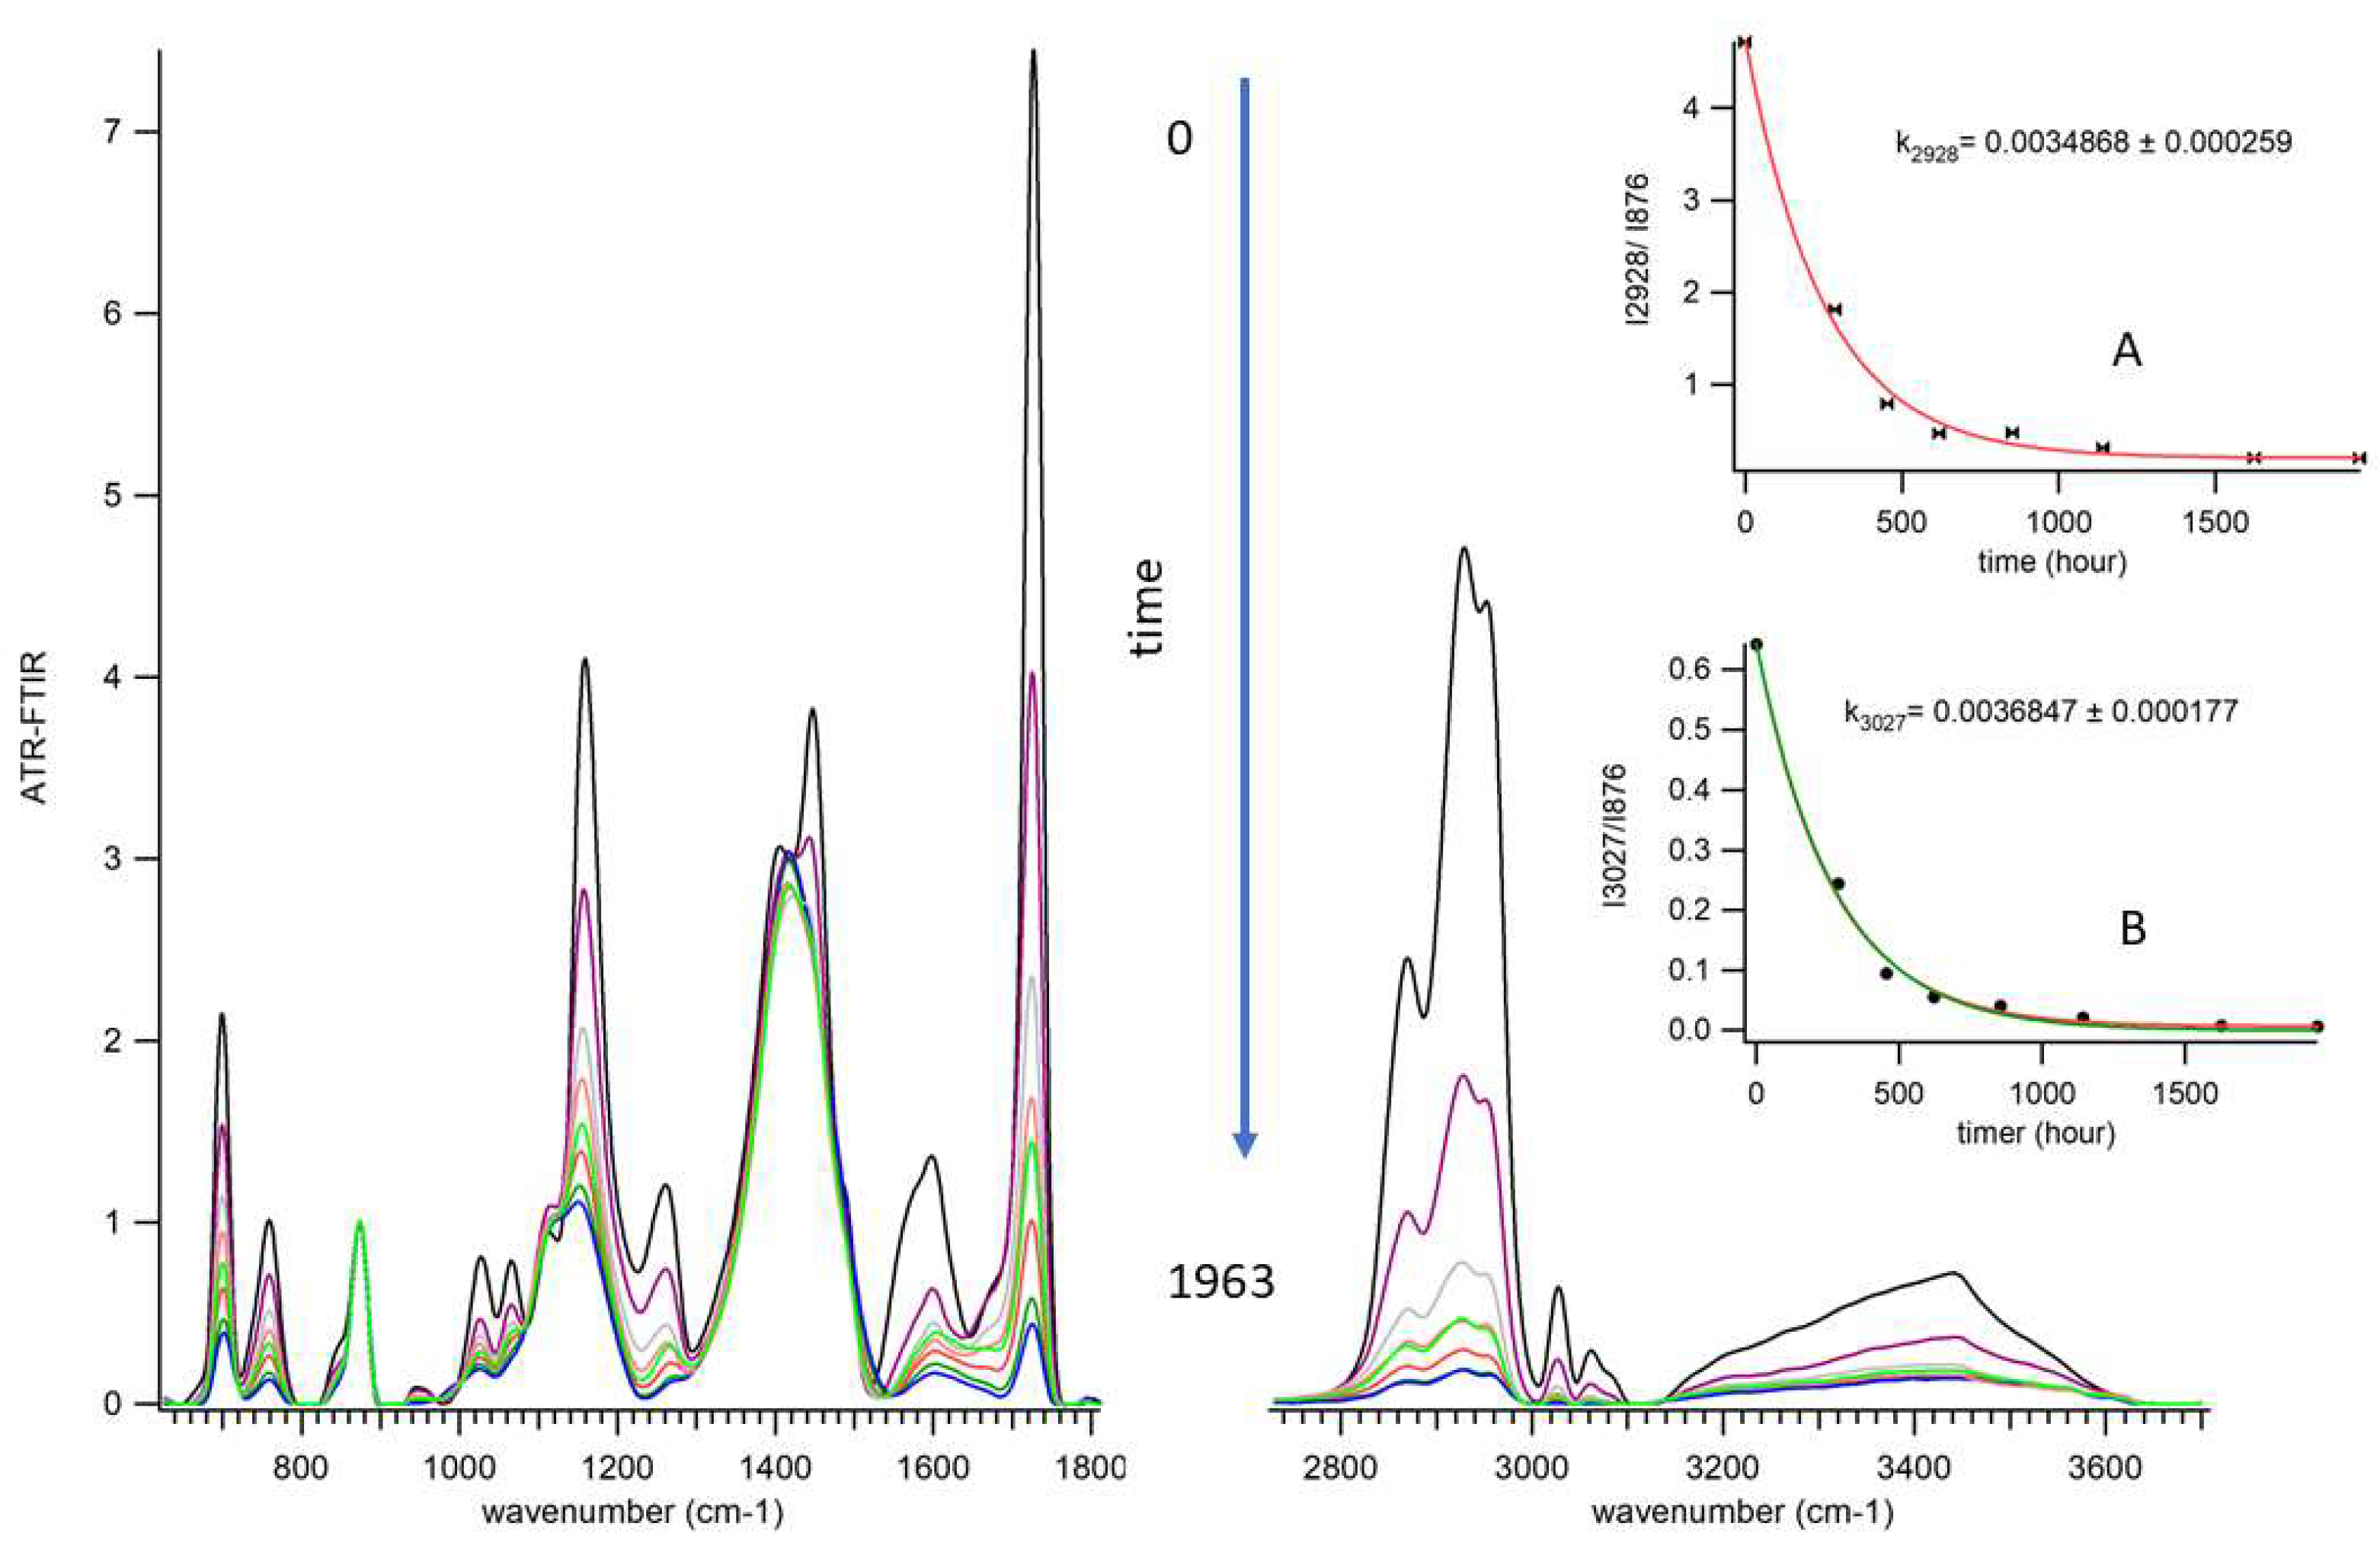
3.4. Aging of Acryl Zinc White PW4 Paint Revealed by ATR-FTIR Spectroscopy
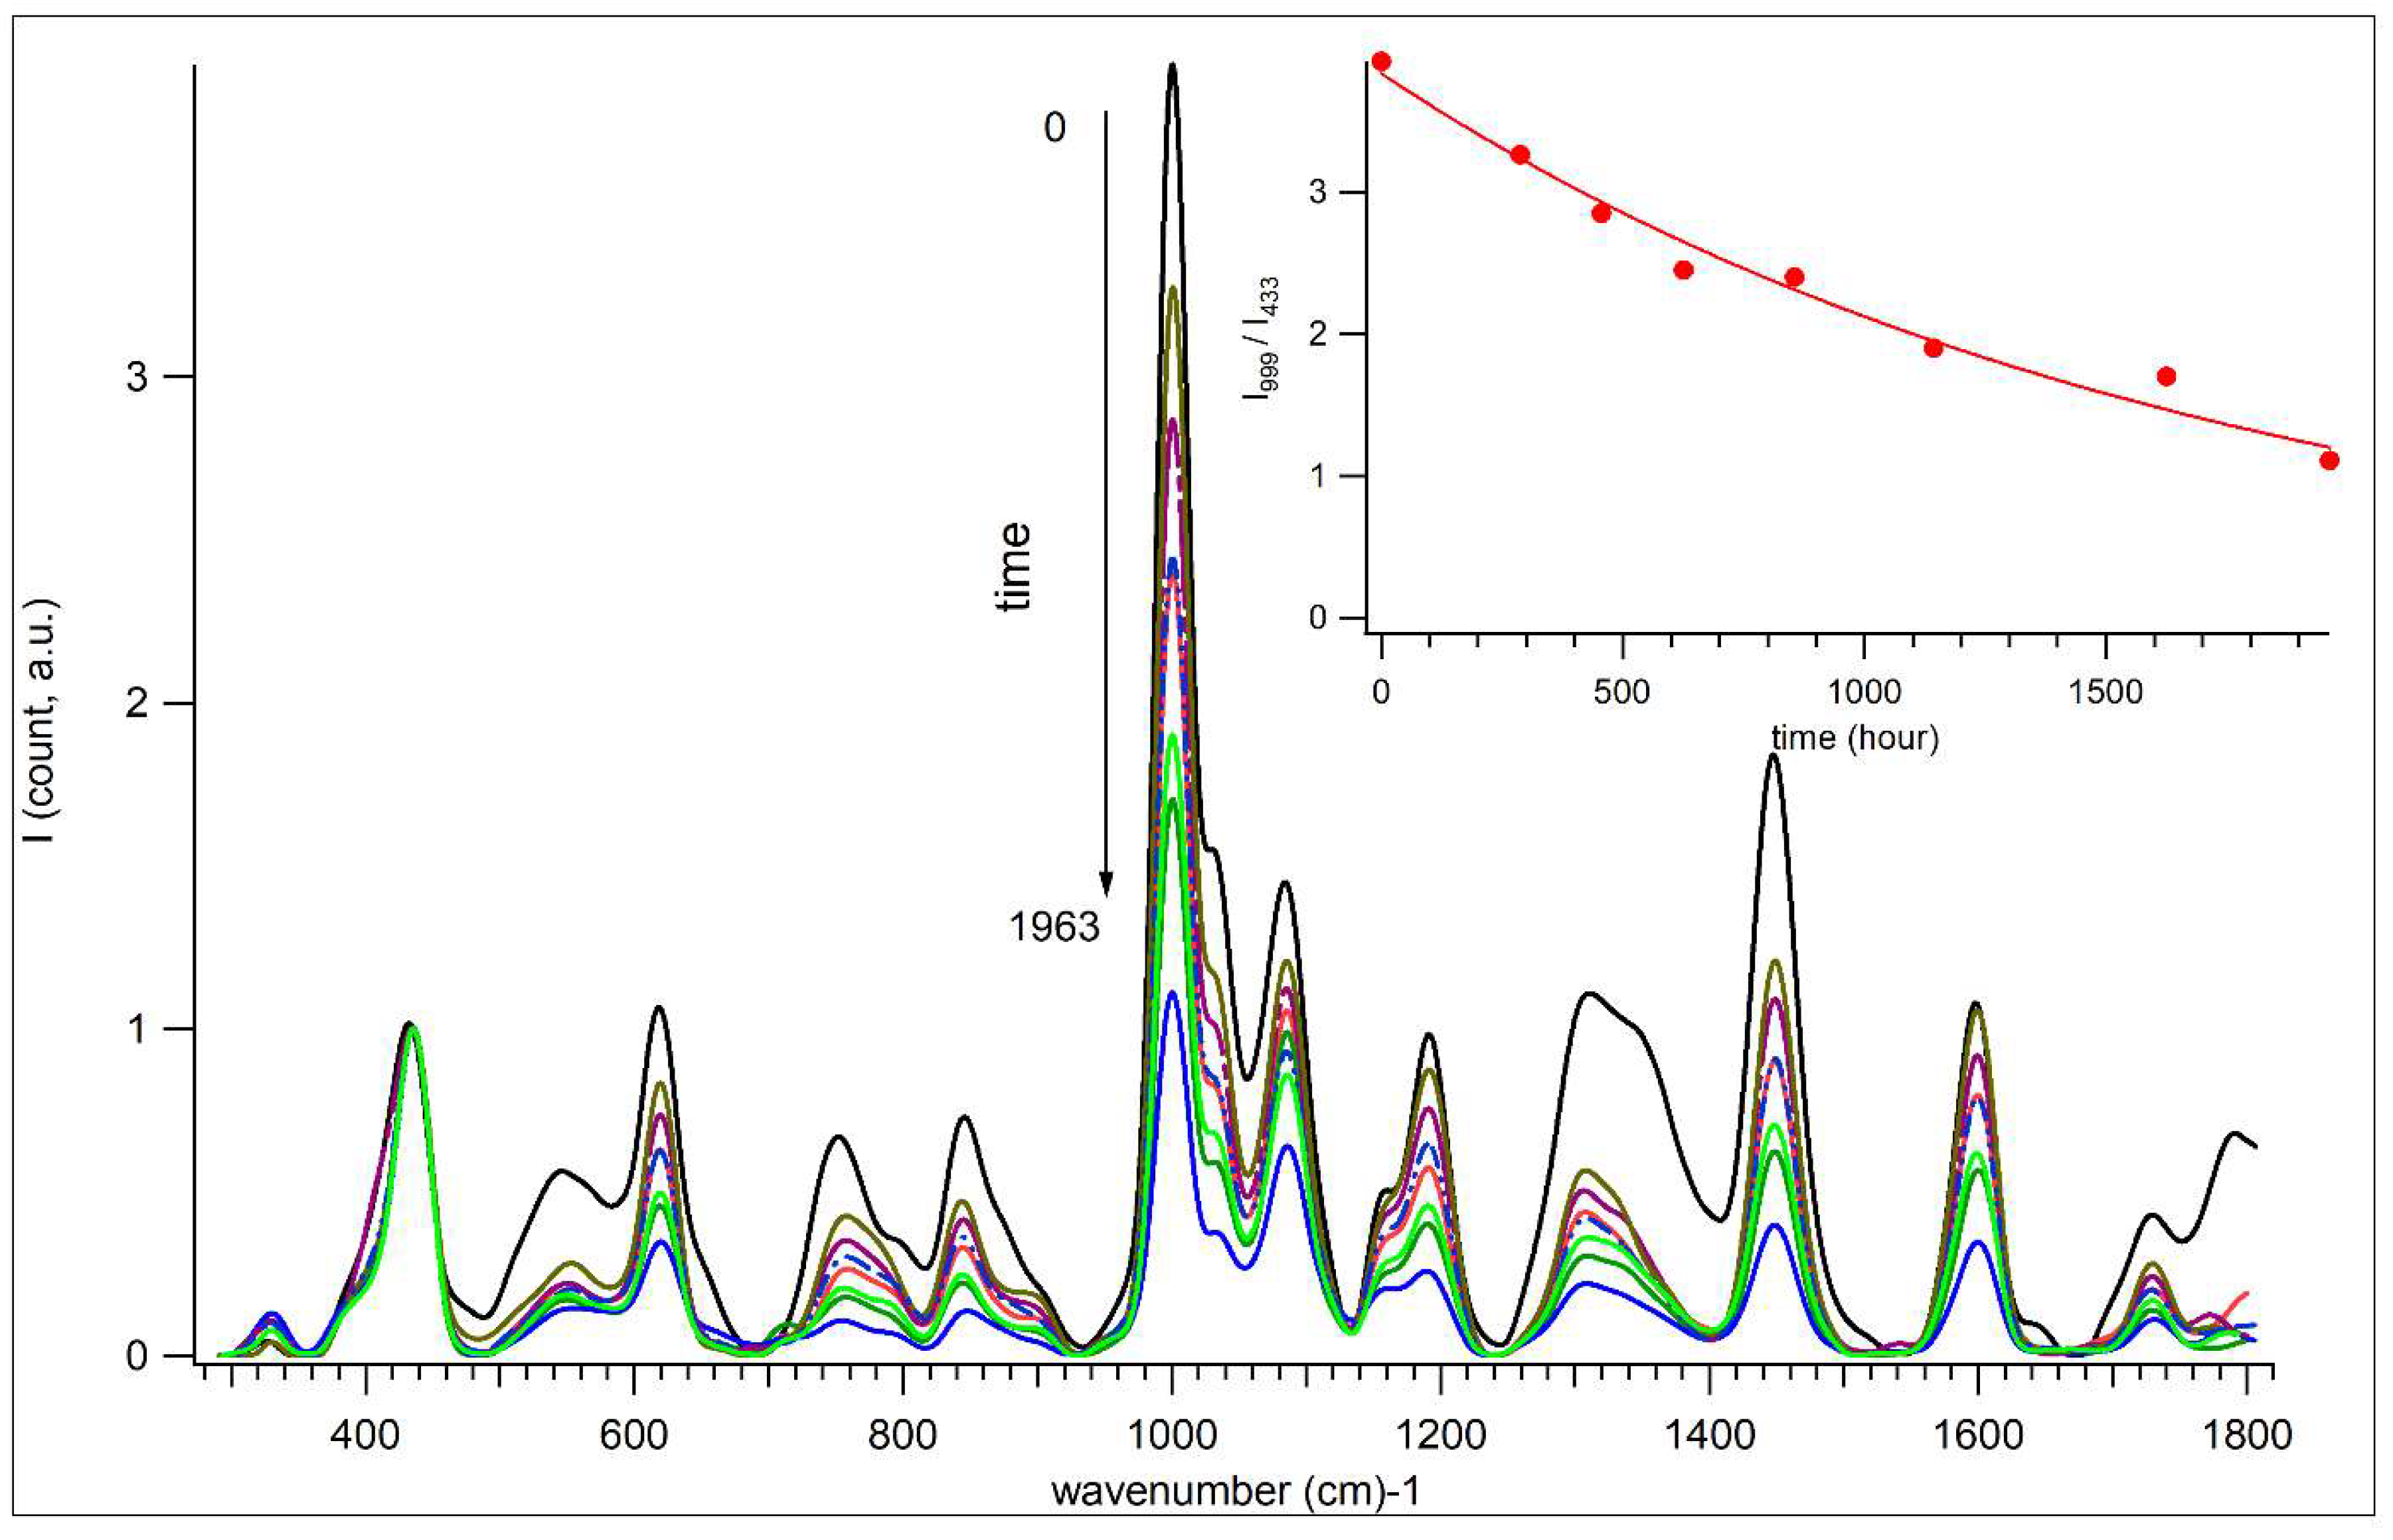
3.5. Aging of Acryl Zinc White PW4 Paint Revealed by Raman Spectroscopy-Microscopy
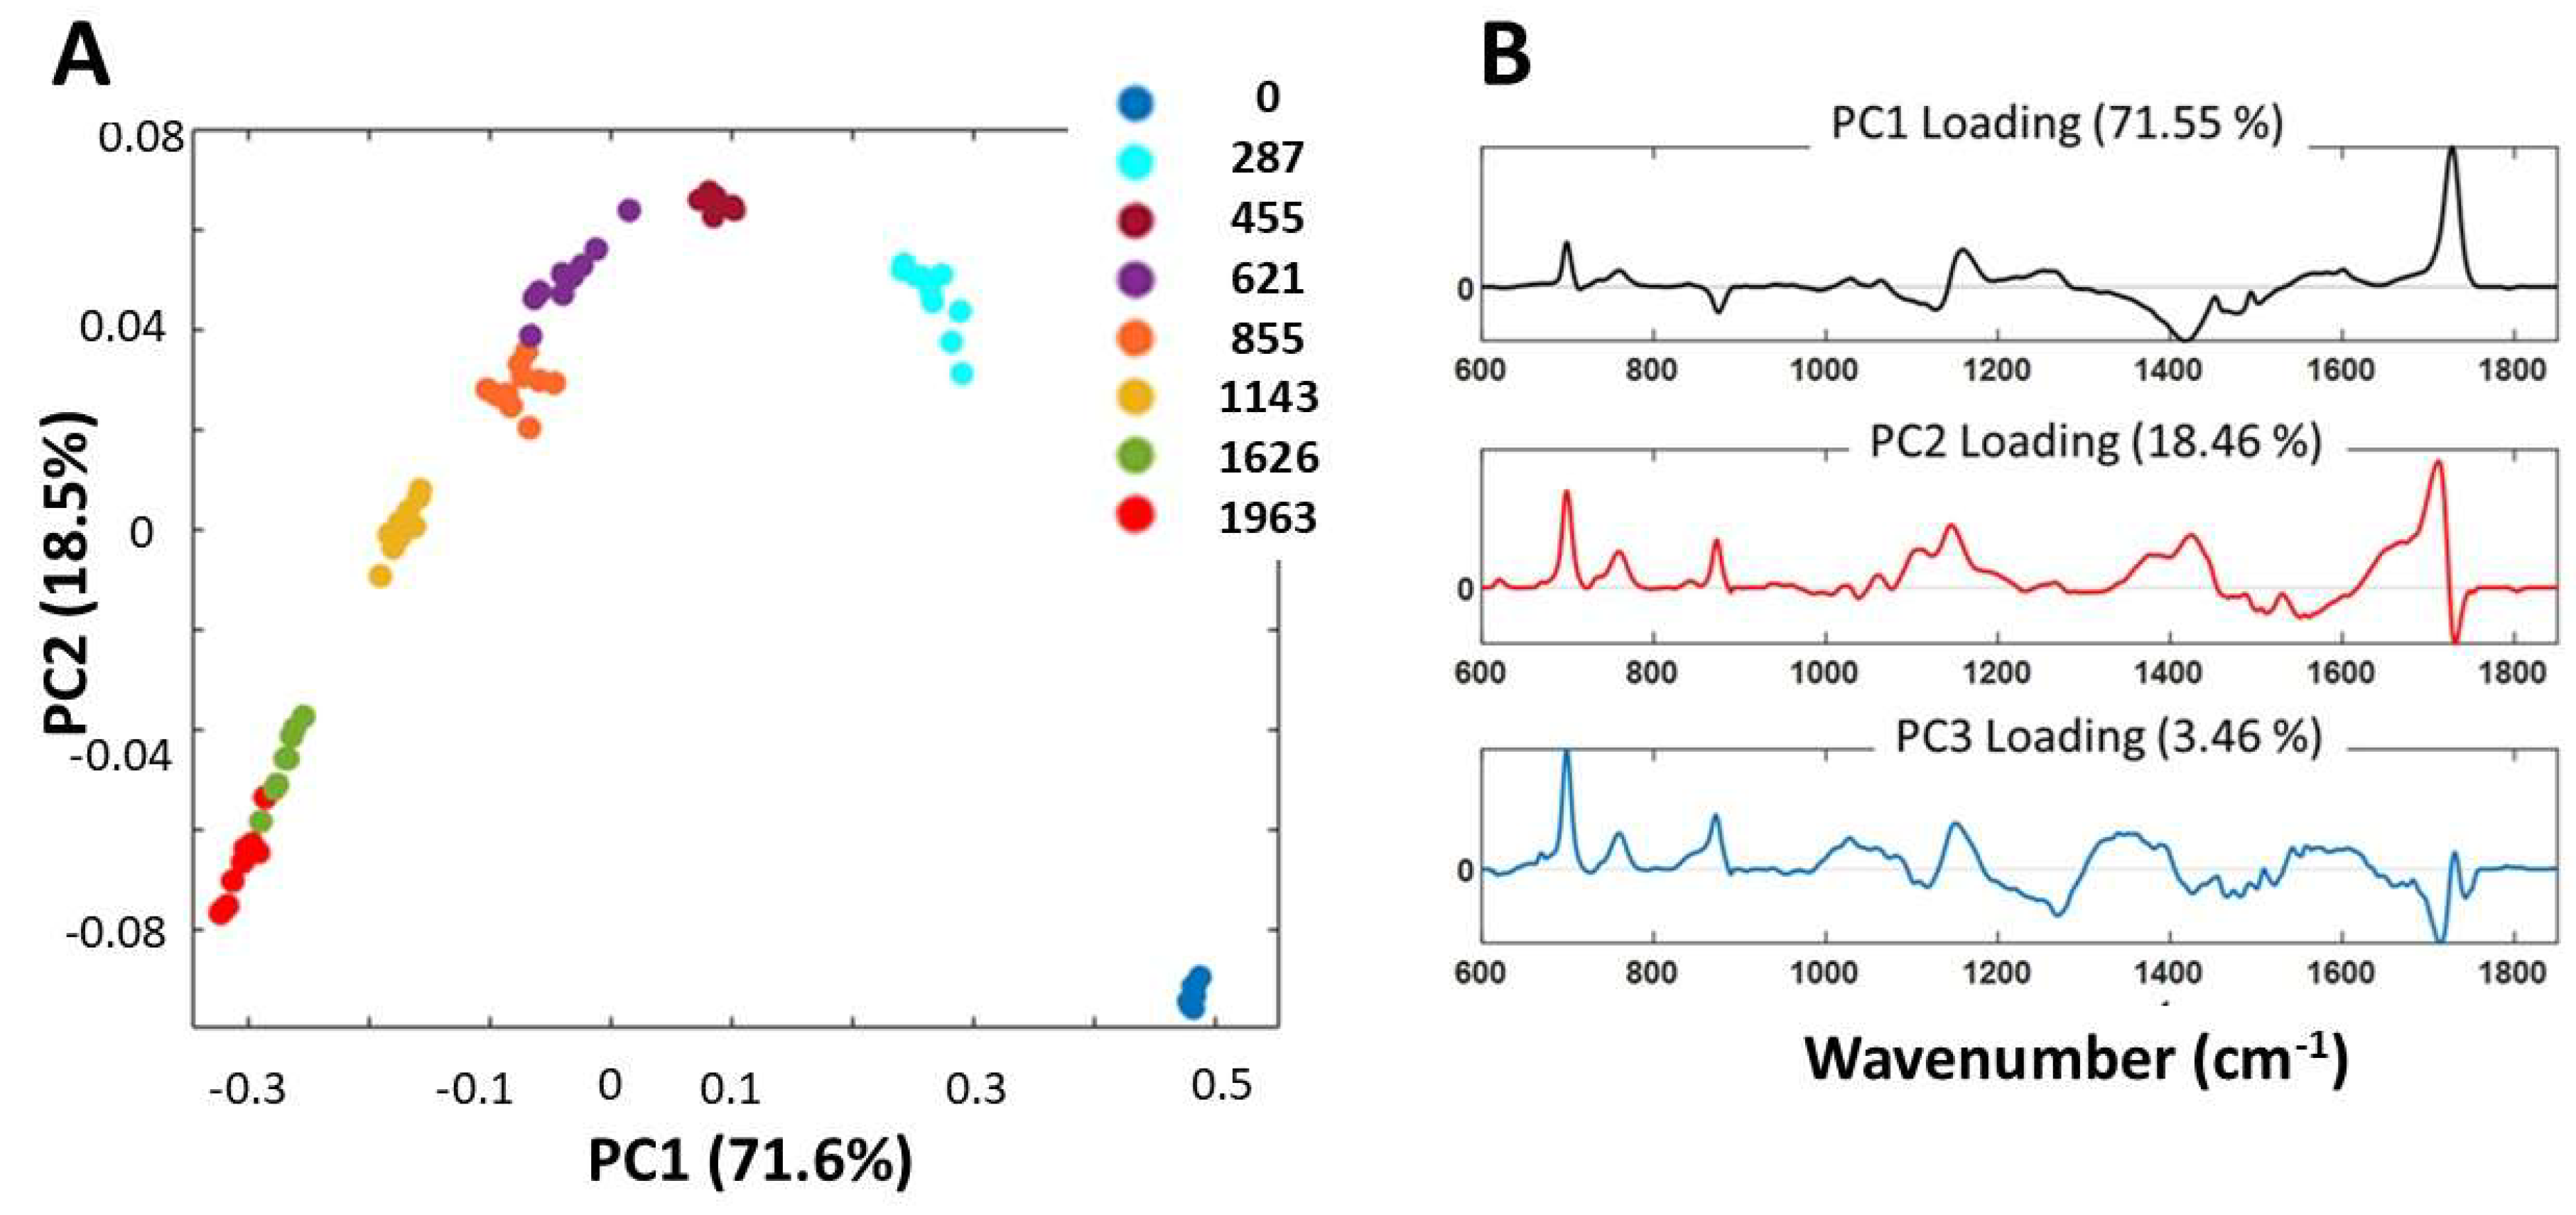
3.6. PCA Analysis of ATR-FTIR Spectra
- a)
- C–O stretching vibrations (at 1027, 1060, 1159, 1254, and 1267 cm−1) and carbonyl C=O stretching (at 1725 cm−1), indicating the degradation of the acrylic chains.
- b)
- Characteristic polystyrene vibrations (at 700, 732, 760, and 1604 cm−1) and out-of-plane deformations (906-940, 963 cm−1), confirming the polystyrene degradation.
- c)
- COO− stretching (at 1562 cm−1), suggesting disruption of metal-carboxylate complex.
- d)
- C=O (H-bonded) stretching vibration (at 1675, shoulder) attributed to the degradation of the dispersant PAA and further degradation of degradation products.
- a)
- Asymmetric broadening of the carbonyl peak (at 1725 cm−1) toward lower wavenumbers (~1710 cm−1), indicating the formation of new C=O species from oxidative degradation of the PAA, acrylic , and styrene chains[7];
- b)
- Narrowing of the carbonyl ester peak on the higher wavenumber side, consistent with oxidative cleavage ester groups in the acrylic binder;
- c)
- Increase in the shoulder intensity at 1675 cm−1, due to change in hydrogen-bonding induced shifts in carbonyl (C=O) stretching frequencies, providing additional evidence for the formation of new C=O groups;
- d)
- Broadening of the CaCO3 absorption band (1414cm-1) especially, near 1427 cm−1 and 1370 cm−1), due to the binder degradation and CaCO3 exposure;
- e)
- Broadening of C-O-C stretching bands (at the peak 1102cm−1 and shoulder 1118 cm−1) reflecting the migration and reorganization of the surfactant (PEO);
- f)
3.7. In the Spectral Range (2700–3700 cm−1)
- a)
- Stretching vibrations of CH3 and CH2 (at 2868, 2927, and 2959 cm−1) and =C–H (3027, 3044, 3060, 3086 cm−1), indicating the breakdown and degradation of the (acrylic-styrene) binder chains;
- b)
- The broad IR band (3130–3600 cm−1), attributed to O–H groups, suggesting weakened H-bonding between PEO and paint components, and initial water desorption at the beginning of the aging, and the formation of volatile products as aging advances.
- a)
- Asymmetric broadening of C-H stretching vibrations band (at∼ 2700-2850 cm−1), likely corresponds to the formation of the degradation products e.g., aldehyde 2695-2830 cm−1 (weak Fermi doublet at 2720, 2820 cm−1 that are registered for aged samples);
- b)
- Non-uniform reduction in peak intensity, where the PC2 positive loadings represented the spectral regions which were more resistant to decrease, such as (symmetric stretching vibrations at 2873cm-1). In contrast, negative loadings represented bands more susceptible to radical attack, including asymmetric stretching vibrations of the –C–H groups of alkenes and aromatic compounds.

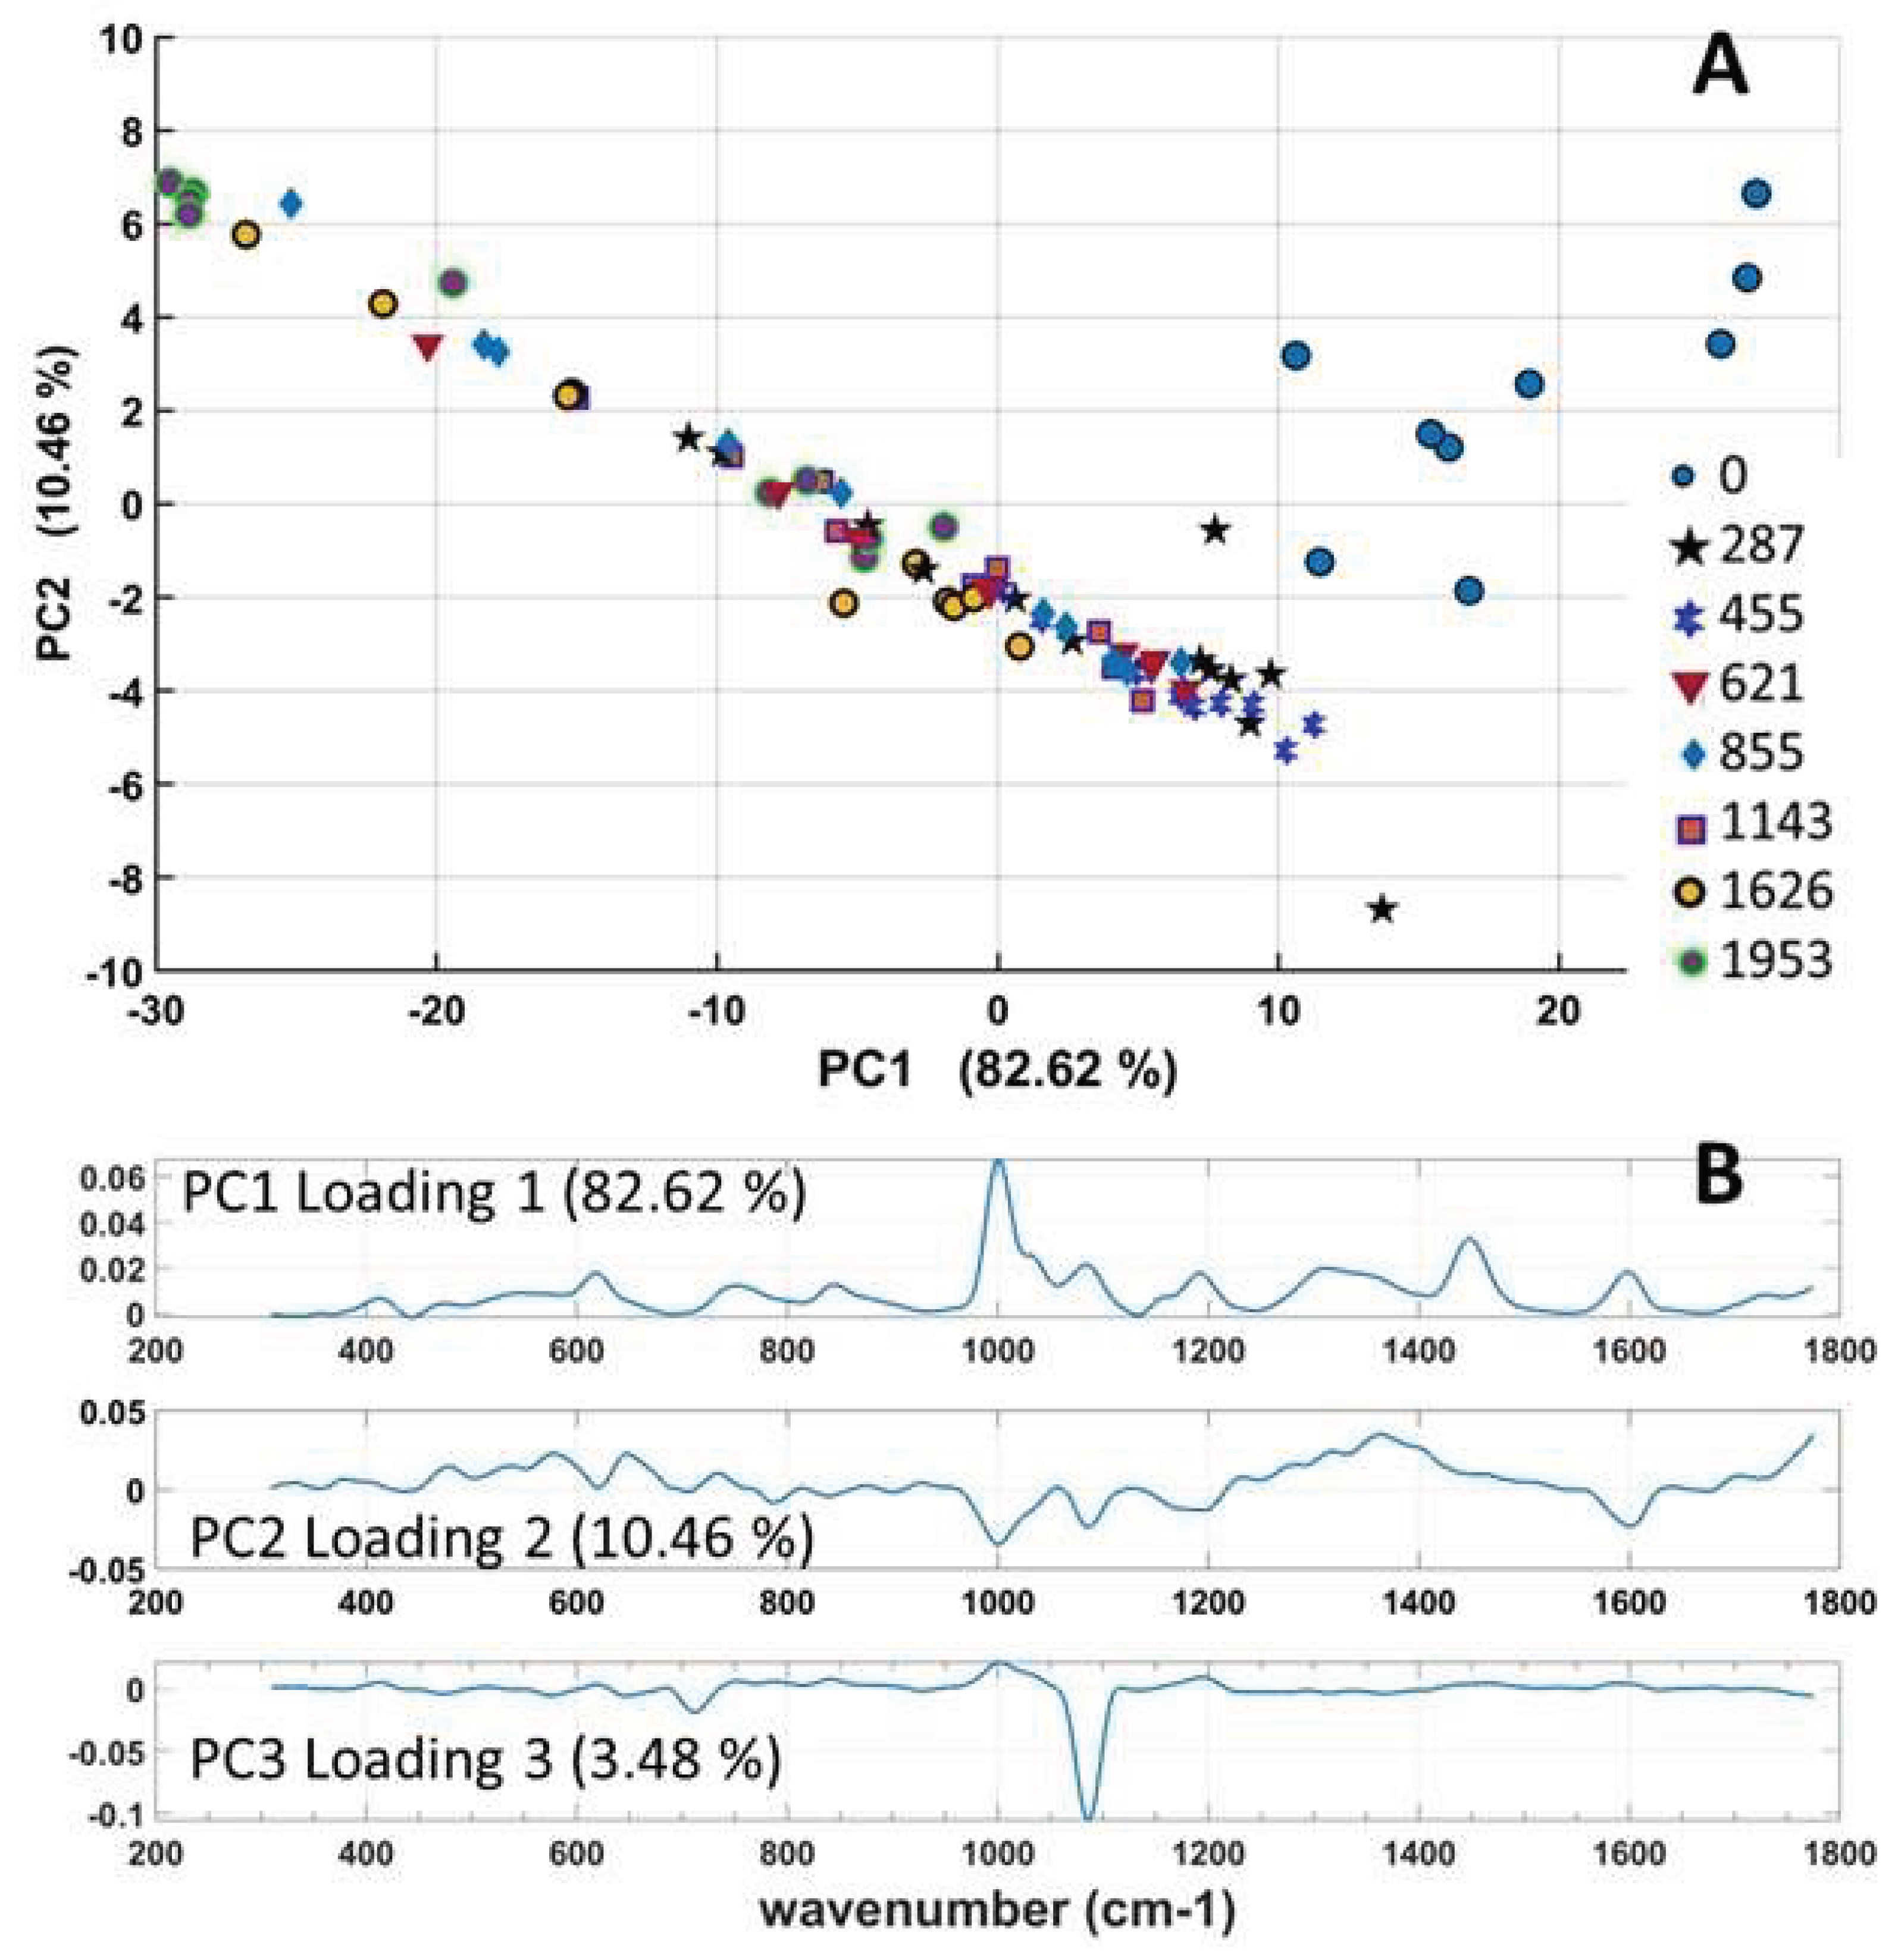
3.8. PCA Analysis of Raman Spectra
4. Discussion
4.1. Degradation Mechanism of Acrylic Paint ZnO PW4
5. Conclusion
Supplementary Materials
Author Contributions
Funding
Data Availability Statement
Acknowledgments
Conflicts of Interest
Abbreviations
| MDPI | Multidisciplinary Digital Publishing Institute |
| DOAJ | Directory of open access journals |
| ATR-FTIR | Attenuated Total Reflectance Fourier-Transform Infrared spectroscopy |
| SEM | Scanning electron microscopy |
| SEM-EDS | Scanning electron microscopy with energy dispersive X-ray spectroscopy |
| PEO | Polyethylene oxide |
| VIS | Visible |
| UV | Ultraviolet |
| PCA | Principal component analysis |
| RH | Relative humidity |
| SG | Savitzky-Golay algorithm |
References
- Jablonski, E.; Learner, T.; Hayes, J.; Golden, M. Conservation Concerns for Acrylic Emulsion Paints. Stud. Conserv. 2003, 48, 3–12. [Google Scholar] [CrossRef]
- Alonso-Villar, E.M.; Rivas, T.; Pozo-Antonio, J.S. Resistance to Artificial Daylight of Paints Used in Urban Artworks. Influence of Paint Composition and Substrate. Prog. Org. Coatings 2021, 154, 106180. [Google Scholar] [CrossRef]
- Doménech-Carbó, M.T.; Silva, M.F.; Aura-Castro, E.; Fuster-López, L.; Kröner, S.; Martínez-Bazán, M.L.; Más-Barberá, X.; Mecklenburg, M.F.; Osete-Cortina, L.; Doménech, A.; et al. Study of Behaviour on Simulated Daylight Ageing of Artists’ Acrylic and Poly(Vinyl Acetate) Paint Films. In Proceedings of the Analytical and Bioanalytical Chemistry; March 2011; Vol. 399, pp. 2921–2937.
- Hagan, E.W.S.; Charalambides, M.N.; Young, C.R.T.; Learner, T.J.S. The Effects of Strain Rate and Temperature on Commercial Acrylic Artist Paints Aged One Year to Decades. Appl. Phys. A Mater. Sci. Process. 2015, 121, 823–835. [Google Scholar] [CrossRef]
- Learner, T.; Chiantore, O.; Scalarone, D. Ageing Studies of Acrylic Emulsion Paints. 13th Trienn. Meet. ICOM CC Rio Janiero Prepr. 2002, 911–919. [Google Scholar]
- Learner, T. A Review of Synthetic Binding Media in Twentieth-century Paints. Conserv. 2000, 24, 96–103. [Google Scholar] [CrossRef]
- Pagnin, L.; Calvini, R.; Sterflinger, K.; Izzo, F.C. Data Fusion Approach to Simultaneously Evaluate the Degradation Process Caused by Ozone and Humidity on Modern Paint Materials. Polymers (Basel). 2022, 14. [Google Scholar] [CrossRef]
- Hamidi, F.; Aslani, F. Tio2-Based Photocatalytic Cementitious Composites: Materials, Properties, Influential Parameters, and Assessment Techniques. Nanomaterials 2019, 9. [Google Scholar] [CrossRef] [PubMed]
- Whitmore, P.M.; Colaluca, V.G. The Natural and Accelerated Aging of an Acrylic Artists’ Medium. Stud. Conserv. 1995, 40, 51–64. [Google Scholar] [CrossRef]
- Nguyen, T.V.; Dao, P.H.; Duong, K.L.; Duong, Q.H.; Vu, Q.T.; Nguyen, A.H.; Mac, V.P.; Le, T.L. Effect of R-TiO2 and ZnO Nanoparticles on the UV-Shielding Efficiency of Water-Borne Acrylic Coating. Prog. Org. Coatings 2017, 110, 114–121. [Google Scholar] [CrossRef]
- Nguyen, T.V.; Dao, P.H.; Nguyen, T.A.; Dang, V.H.; Ha, M.N.; Nguyen, T.T.T.; Vu, Q.T.; Nguyen, N.L.; Dang, T.C.; Nguyen-Tri, P.; et al. Photocatalytic Degradation and Heat Reflectance Recovery of Waterborne Acrylic Polymer/ZnO Nanocomposite Coating. J. Appl. Polym. Sci. 2020, 137. [Google Scholar] [CrossRef]
- Dodd, A.C.; McKinley, A.J.; Saunders, M.; Tsuzuki, T. Effect of Particle Size on the Photocatalytic Activity of Nanoparticulate Zinc Oxide. J. Nanoparticle Res. 2006, 8, 43–51. [Google Scholar] [CrossRef]
- Garcia-Segura, S.; Brillas, E. Applied Photoelectrocatalysis on the Degradation of Organic Pollutants in Wastewaters. J. Photochem. Photobiol. C Photochem. Rev. 2017, 31, 1–35. [Google Scholar] [CrossRef]
- Vu, T.V.; Nguyen, T.V.; Tabish, M.; Ibrahim, S.; Huong, T.; Hoang, T.; Gupta, R.K.; My, T.; Dang, L.; Nguyen, T.A.; et al. Water-Borne ZnO/Acrylic Nanocoating: Fabrication, Characterization, and Properties. 2021, 1–10.
- Digney-Peer, S.; Burnstock, A.; Learner, T.; Khanjian, H.; Hoogland, F.; Boon, J. The Migration of Surfactants in Acrylic Emulsion Paint Films. Stud. Conserv. 2004, 49, 202–207. [Google Scholar] [CrossRef]
- Anghelone, M.; Jembrih-Simbürger, D.; Pintus, V.; Schreiner, M. Photostability and Influence of Phthalocyanine Pigments on the Photodegradation of Acrylic Paints under Accelerated Solar Radiation. Polym. Degrad. Stab. 2017, 146, 13–23. [Google Scholar] [CrossRef]
- Tao, Y.; Mao, Z.; Yang, Z.; Zhang, J. CaCO3 as a New Member of High Solar-Reflective Filler on the Cooling Property in Polymer Composites. J. Vinyl Addit. Technol. 2021, 27, 275–287. [Google Scholar] [CrossRef]
- Joseph, E.; Ricci, C.; Kazarian, S.G.; Mazzeo, R.; Prati, S.; Ioele, M. Macro-ATR-FT-IR Spectroscopic Imaging Analysis of Paint Cross-Sections. Vib. Spectrosc. 2010, 53, 274–278. [Google Scholar] [CrossRef]
- Gomes De Oliveira, A.G.; Wiercigroch, E.; De Andrade Gomes, J.; Malek, K. Infrared and Raman Spectroscopy of Automotive Paints for Forensic Identification of Natural Weathering. Anal. Methods 2018, 10, 1203–1212. [Google Scholar] [CrossRef]
- Mokari, A.; Guo, S.; Bocklitz, T. Exploring the Steps of Infrared (IR) Spectral Analysis: Pre-Processing, (Classical) Data Modelling, and Deep Learning. Molecules 2023, 28, 1–21. [Google Scholar] [CrossRef]
- Pagnin, L.; Calvini, R.; Wiesinger, R.; Weber, J.; Schreiner, M. Photodegradation Kinetics of Alkyd Paints: The Influence of Varying Amounts of Inorganic Pigments on the Stability of the Synthetic Binder. Front. Mater. 2020, 7, 1–15. [Google Scholar] [CrossRef]
- Mokrzycki, W.S.; Tatol, M. Color Difference Delta E - A Survey. Mach. Graph. Vis. 2012, 20, 383–411. [Google Scholar]
- Bromba, M.U.A.; Ziegler, H. Application Hints for Savitzky-Golay Digital Smoothing Filters. Anal. Chem. 1981, 53, 1583–1586. [Google Scholar] [CrossRef]
- Liland, K.H.; Kohler, A.; Afseth, N.K. Model-Based Pre-Processing in Raman Spectroscopy of Biological Samples. J. Raman Spectrosc. 2016, 47, 643–650. [Google Scholar] [CrossRef]
- Rinnan, Å.; Berg, F. van den; Engelsen, S.B. Review of the Most Common Pre-Processing Techniques for near-Infrared Spectra. TrAC Trends Anal. Chem. 2009, 28, 1201–1222. [Google Scholar] [CrossRef]
- Coccato, A.; Caggiani, M.C. An Overview of Principal Components Analysis Approaches in Raman Studies of Cultural Heritage Materials. J. Raman Spectrosc. 2024, 55, 125–147. [Google Scholar] [CrossRef]
- Kim, D.; You, K. PCA, SVD, and Centering of Data. 2023. arXiv preprint arXiv:2307.15213.
- Mujica, L.E.; Rodellar, J.; Fernández, A.; Güemes, A. Q-Statistic and T2-Statistic Pca-Based Measures for Damage Assessment in Structures. Struct. Heal. Monit. 2011, 10, 539–553. [Google Scholar] [CrossRef]
- Whitmore, P.M.; Colaluca, V.G. The Natural and Accelerated Aging of an Acrylic Artists’ Medium. Stud. Conserv. 1995, 40, 51–64. [Google Scholar] [CrossRef]
- Senler, S.; Eren, M.; Mert, S. Progress in Organic Coatings Effect of Wollastonite Extender on the Properties of Exterior Acrylic Paints. 2016, 93, 34–40. [CrossRef]
- Alvarez, V.; Paulis, M. Effect of Acrylic Binder Type and Calcium Carbonate Filler Amount on the Properties of Paint-like Blends. Prog. Org. Coatings 2017, 112, 210–218. [Google Scholar] [CrossRef]
- Ševčík, R.; Šašek, P.; Viani, A. Physical and Nanomechanical Properties of the Synthetic Anhydrous Crystalline CaCO3 Polymorphs: Vaterite, Aragonite and Calcite. J. Mater. Sci. 2018, 53, 4022–4033. [Google Scholar] [CrossRef]
- Manabeng, M.; Mwankemwa, B.S.; Ocaya, R.O.; Motaung, T.E.; Malevu, T.D. A Review of the Impact of Zinc Oxide Nanostructure Morphology on Perovskite Solar Cell Performance. Processes 2022, 10, 1–19. [Google Scholar] [CrossRef]
- Cai, G. Bin; Chen, S.F.; Liu, L.; Jiang, J.; Yao, H. Bin; Xu, A.W.; Yu, S.H. 1,3-Diamino-2-Hydroxypropane-N,N,N′,N′-Tetraacetic Acid Stabilized Amorphous Calcium Carbonate: Nucleation, Transformation and Crystal Growth. CrystEngComm 2010, 12, 234–241. [Google Scholar] [CrossRef]
- Zhang, Y.; Gard, T.; Theron, C.; Apostoluk, A.; Masenelli-Varlot, K.; Canut, B.; Daniele, S.; Masenelli, B. Visible Luminescence Improvement of ZnO/PAA Nano-Hybrids by Silica Coating. Appl. Surf. Sci. 2021, 540, 148343. [Google Scholar] [CrossRef]
- Yousif, E.; El-Hiti, G.A.; Haddad, R.; Balakit, A.A. Photochemical Stability and Photostabilizing Efficiency of Poly(Methyl Methacrylate) Based on 2-(6-Methoxynaphthalen-2-Yl)Propanoate Metal Ion Complexes. Polymers (Basel). 2015, 7, 1005–1019. [Google Scholar] [CrossRef]
- Bosi, A.; Ciccola, A.; Serafini, I.; Guiso, M.; Ripanti, F.; Postorino, P.; Curini, R.; Bianco, A. Street Art Graffiti: Discovering Their Composition and Alteration by FTIR and Micro-Raman Spectroscopy. Spectrochim. Acta - Part A Mol. Biomol. Spectrosc. 2020, 225. [Google Scholar] [CrossRef]
- Yabagi, J.A.; Kimpa, M.I.; Muhammad, M.N.; Rashid, S. Bin; Zaidi, E.; Agam, M.A. The Effect of Gamma Irradiation on Chemical, Morphology and Optical Properties of Polystyrene Nanosphere at Various Exposure Time. IOP Conf. Ser. Mater. Sci. Eng. 2018, 298. [Google Scholar] [CrossRef]
- Zamo, A.; Rond, C.; Hamdan, A. Polystyrene (PS) Degradation Induced by Nanosecond Electric Discharge in Air in Contact with PS/Water. Plasma 2024, 7, 49–63. [Google Scholar] [CrossRef]
- Wu, S.; Luo, Y.; Ran, Q.; Shen, J. Effects of Comb Copolymer PAA-g-MPEO on Rheological and Dispersion Properties of Aqueous CaCO3 Suspensions. Polym. Bull. 2007, 59, 363–370. [Google Scholar] [CrossRef]
- Melo, M.J.; Bracci, S.; Camaiti, M.; Chiantore, O.; Piacenti, F. Photodegradation of Acrylic Resins Used in the Conservation of Stone. Polym. Degrad. Stab. 1999, 66, 23–30. [Google Scholar] [CrossRef]
- Beigzadeh, A.M.; Vaziri, M.R.R. Z-Scan Dosimetry of Gamma-Irradiated PMMA. Nucl. Instruments Methods Phys. Res. Sect. A Accel. Spectrometers, Detect. Assoc. Equip. 2021, 991, 165022. [Google Scholar] [CrossRef]
- Wochnowski, C.; Metev, S.; Sepold, G. UV-Laser-Assisted Modification of the Optical Properties of Polymethylmethacrylate. Appl. Surf. Sci. 2000, 154, 706–711. [Google Scholar] [CrossRef]
- Yousif, E.; Haddad, R. Photodegradation and Photostabilization of Polymers, Especially Polystyrene: Review. Springerplus 2013, 2, 1–32. [Google Scholar] [CrossRef]
- Xu, J.J.; Lu, Y.N.; Tao, F.F.; Liang, P.F.; Zhang, P.A. ZnO Nanoparticles Modified by Carbon Quantum Dots for the Photocatalytic Removal of Synthetic Pigment Pollutants. ACS Omega 2023, 8, 7845–7857. [Google Scholar] [CrossRef]
- Budlayan, M.L.M.; Patricio, J.N.; Lagare-Oracion, J.P.; Arco, S.D.; Alguno, A.C.; Basilio, A.; Latayada, F.S.; Capangpangan, R.Y. Improvised Centrifugal Spinning for the Production of Polystyrene Microfibers from Waste Expanded Polystyrene Foam and Its Potential Application for Oil Adsorption. J. Eng. Appl. Sci. 2021, 68, 1–11. [Google Scholar] [CrossRef]
- Pasichnyk, M.; Václavíková, M.; Gaálová, J.; Melnyk, I. Functional Finishing of Polyester Fabric With Polystyrene-Acrylic/Zno Nanocomposite for Effective Dyes Filtration. 2021.
- Bandyopadhyay, A.; Basak, G.C. Studies on Photocatalytic Degradation of Polystyrene. Mater. Sci. Technol. 2007, 23, 307–314. [Google Scholar] [CrossRef]
- Rodriguez-Blanco, J.D.; Shaw, S.; Benning, L.G. The Kinetics and Mechanisms of Amorphous Calcium Carbonate (ACC) Crystallization to Calcite, via Vaterite. Nanoscale 2011, 3, 265–271. [Google Scholar] [CrossRef]
- Zhang, Z.; Xie, Y.; Xu, X.; Pan, H.; Tang, R. Transformation of Amorphous Calcium Carbonate into Aragonite. J. Cryst. Growth 2012, 343, 62–67. [Google Scholar] [CrossRef]
- Oriols, N.; Salvadó, N.; Pradell, T.; Butí, S. Amorphous Calcium Carbonate (ACC) in Fresco Mural Paintings. Microchem. J. 2020, 154. [Google Scholar] [CrossRef]
- Dinoop lal, S.; Sunil Jose, T.; Rajesh, C.; Anju Rose Puthukkara, P.; Savitha Unnikrishnan, K.; Arun, K.J. Accelerated Photodegradation of Polystyrene by TiO2-Polyaniline Photocatalyst under UV Radiation. Eur. Polym. J. 2021, 153, 110493. [Google Scholar] [CrossRef]
- Kim, Y.; Caumon, M.C.; Barres, O.; Sall, A.; Cauzid, J. Identification and Composition of Carbonate Minerals of the Calcite Structure by Raman and Infrared Spectroscopies Using Portable Devices. Spectrochim. Acta - Part A Mol. Biomol. Spectrosc. 2021, 261, 119980. [Google Scholar] [CrossRef] [PubMed]
- Li, C.; Lv, J.; Zhou, B.; Liang, Z. Influence of Annealing Atmosphere on Optical Properties of Al-Doped ZnO Powders. Phys. Status Solidi Appl. Mater. Sci. 2012, 209, 1538–1542. [Google Scholar] [CrossRef]
- Bognár, S.; Jovanović, D.; Despotović, V.; Jakšić, S.; Panić, S.; Milanović, M.; Finčur, N.; Putnik, P.; Šojić Merkulov, D. Advanced Photocatalytic Degradation of Organic Pollutants Using Green Tea-Based ZnO Nanomaterials Under Simulated Solar Irradiation in Agri-Food Wastewater. Foods 2025, 14, 1–20. [Google Scholar] [CrossRef]
- Barroso-Solares, S.; Mediavilla-Martinez, I.; Sanz-Velasco, C.; Prieto, A.C.; Pinto, J. Pigments Identification and Analysis of the State of Conservation of the Decorative Elements of the Castle of Coca (XV-XVI AC, Segovia, Spain) by Raman Spectroscopy. J. Phys. Conf. Ser. 2022, 2204. [Google Scholar] [CrossRef]
- Donnelly, F.C.; Purcell-Milton, F.; Framont, V.; Cleary, O.; Dunne, P.W.; Gun’ko, Y.K. Synthesis of CaCO3 Nano- and Micro-Particles by Dry Ice Carbonation. Chem. Commun. 2017, 53, 6657–6660. [Google Scholar] [CrossRef] [PubMed]
- Fan, Y.; Cornelius, C.J. Raman Spectroscopic and Gas Transport Study of a Pentablock Ionomer Complexed with Metal Ions and Its Relationship to Physical Properties. J. Mater. Sci. 2013, 48, 1153–1161. [Google Scholar] [CrossRef]
- Bertoldo Menezes, D.; Reyer, A.; Benisek, A.; Dachs, E.; Pruner, C.; Musso, M. Raman Spectroscopic Insights into the Glass Transition of Poly(Methyl Methacrylate); 2021; Vol. 23; ISBN 0000000175.
- Boyden, M.N.; Kleist, E.M.; Asztalos, C.K.; Korter, T.M. Determination of the Polymer Composition of Mid-Twentieth Century Purses by Raman Spectroscopy. Herit. Sci. 2022, 10, 1–10. [Google Scholar] [CrossRef]
- Wang, Z.; Su, S.; Ling, F.C.C.; Anwand, W.; Wagner, A. Thermal Evolution of Defects in Undoped Zinc Oxide Grown by Pulsed Laser Deposition. J. Appl. Phys. 2014, 116. [Google Scholar] [CrossRef]
- Smith, L.M.; Aitken, H.M.; Coote, M.L. The Fate of the Peroxyl Radical in Autoxidation: How Does Polymer Degradation Really Occur? Acc. Chem. Res. 2018, 51, 2006–2013. [Google Scholar] [CrossRef]
- Hossain, F.M.; Murch, G.E.; Belova, I. V.; Turner, B.D. Electronic, Optical and Bonding Properties of CaCO3 Calcite. Solid State Commun. 2009, 149, 1201–1203. [Google Scholar] [CrossRef]
- Ishchenko, O.; Rogé, V.; Lamblin, G.; Lenoble, D.; Fechete, I. TiO2, ZnO, and SnO2-Based Metal Oxides for Photocatalytic Applications: Principles and Development. Comptes Rendus Chim. 2021, 24, 103–124. [Google Scholar] [CrossRef]
- Lipovsky, A.; Tzitrinovich, Z.; Friedmann, H.; Applerot, G.; Gedanken, A.; Lubart, R. EPR Study of Visible Light-Induced Ros Generation by Nanoparticles of ZnO. J. Phys. Chem. C 2009, 113, 15997–16001. [Google Scholar] [CrossRef]
- Kraeutler, B.; Jaeger, C.D.; Bard, A.J. Direct Observation of Radical Intermediates in the Photo Kolbe Reaction—HeterogeneousPhotocatalytic Radical Formation by Electron Spin Resonance. J. Am. Chem. Soc. 1978, 100, 4903–4905. [Google Scholar] [CrossRef]
- Schmitt, M. ZnO Nanoparticle Induced Photo-Kolbe Reaction, Fragment Stabilization and Effect on Photopolymerization Monitored by Raman-UV-Vis Measurements. Macromol. Chem. Phys. 2012, 213, 1953–1962. [Google Scholar] [CrossRef]
- Ibraheem, H.A.; El-Hiti, G.A.; Yousif, E.; Ahmed, D.S.; Hashim, H.; Kariuki, B.M. Investigation of the Impact of Chemical Modifications on the Photostability of Polymethyl Methacrylate. Int. J. Polym. Sci. 2024, 2024. [Google Scholar] [CrossRef]
- Sansul, S.; Yousif, E.; Ahmed, D.S.; El-Hiti, G.A.; Kariuki, B.M.; Hashim, H.; Ahmed, A. Pendant Modification of Poly(Methyl Methacrylate) to Enhance Its Stability against Photoirradiation. Polymers (Basel). 2023, 15, 1–15. [Google Scholar] [CrossRef] [PubMed]
- Kaczmarek, H.; Szalla, A. Photochemical Transformation in Poly(Acrylic Acid)/Poly(Ethylene Oxide) Complexes. J. Photochem. Photobiol. A Chem. 2006, 180, 46–53. [Google Scholar] [CrossRef]
| ATR-FTIR | IR absorption band (cm−1) | Functional group assignment | Compound assignment |
|---|---|---|---|
| (cm-1) the present study | |||
| 31130-3600 | 3130-3600 | –OH associated stretching vibration | PAA, Aging products, Water, and H-bonded[2,37] |
| 3027, 3044, 3060, 3086 | 3027-3059-3085 | =C-H stretch (aromatic) | Polystyrene [20,25] |
| 2927, 2959, | 2956 -2930- | –CH2 and –CH3 asymmetric stretching vibration | Polyethylene oxides (PEO) non-ionic surfactant PAA, Acrylic medium[3,38,39] |
| 2853, 2868 | 2873, 2856 | –CH2, -CH3 symmetric stretching vibrations | Polyethylene oxides (PEO)non-ionic surfactant, Acrylic medium, PAA[3,38,39] |
| 1727 | 1725 | –C=O stretching vibration | Acrylic medium[3] |
| 1675, 1686, 1699 | 1675 | –C=O (H-bonded) stretching vibration | Acrylic medium , PAA [40] |
| 1624, 1637 | 1632 | C=C stretching | Aging product[11,41,42,43] |
| 1603 | 1600 | Polystyrene [7,44] | |
| 1596 - 1624 | 1600 to1636 | O–H bending vibration | Adsorbed water[3,45] |
| 1560, 1576 | 1562 | COO− asymmetric stretching (carboxylate) | Metal carboxylate complexes[35,36] |
| 1487, 1500, 1516 | 1492 | Aromatic C=C in-plane bending, C–C ring stretching.[7] | Polystyrene [37,38,44,46] |
| 1448, 1458 | 1452 | -CH2 bending vibrations | Polystyrene [44], PAA, Acrylic medium [3,39,47,48] |
| 1414 | 1414 | CO32− stretching vibration (ν3) | Calcium carbonate extender [3,34,49,50,51] |
| 1371, 1387, 1401 | 1395-1300 | –CH3 , –CH2 Bending vibration | Polyethylene oxides (PEO) non-ionic surfactant ,Acrylic medium[3] |
| 1156, 1180, 1206, 1222, 1244, 1266 | 1267, 1254, 1159 | C-O stretching vibration | PAA, Acrylic medium [15] |
| 1095, 1110, 1122 | 1118, 1102 | –C–O–C– stretching vibration | Polyethylene oxides (PEO) non-ionic surfactant [3,7] |
| 1026, 1066 | 1027-1064 | -C–O- stretching vibration | PAA, Acrylic medium [38] |
| 902,912,922,940,963 | 906-940-963 | C-H out-of-plane bending vibration | Polystyrene [38,52] |
| 876 | 874 | CO32− stretching vibration (ν2) | Calcium carbonate extender[8,53] |
| 843 | 846 | C_H rocking vibration | Acrylic medium, Polystyrene [42,44] |
| 712 | 712 | CO32− stretching vibration (ν4) | Calcium carbonate extender[8,53] |
| 701 | 700, 732, 760 | C–H bending vibration | Acrylic medium [7,8], Polystyrene[44] |
| Raman shift (cm−1) | Functional group assignment | Compound assignment | |
|---|---|---|---|
| 1086 | 1086 | Symmetric CO32− Stretch (ν1) | Calcium carbonate extender[53,56,57] |
| 1034 | 1038 | C-H in-plane bending (aromatic ring) | Polystyrene [58] |
| 999 | 1000 | C-H symmetric in-plane vibrations (aromatic ring) | Polystyrene[20,38,58] |
| 752,799,843 | 700-900 | Vibrations of C-O, –C–COO, C-O-C, C-C and= C-H groups | Polystyrene, Polyethylene oxides (PEO) non-ionic surfactant (PEO), Acrylic medium [59] |
| 708 | 712 | In-plane CO32−Bend (ν4) | Calcium carbonate extender[53,56,57] |
| 619 | 612, 760 | C-H out-of-plane bending ( aromatic ring) | Polystyrene [38,58,60] |
| 543 | 546 | A1(LO) phonon mode (defective ZnO) | Zinc Oxide pigment[55,61] |
| 433 | 438 | E2(high) mode | Zinc Oxide pigment[54,55] |
| 380 | 384 | A1(TO) mode | Zinc Oxide pigment[54,55] |
| 332 | 328 | E2(low) mode | Zinc Oxide pigment[54] |
Disclaimer/Publisher’s Note: The statements, opinions and data contained in all publications are solely those of the individual author(s) and contributor(s) and not of MDPI and/or the editor(s). MDPI and/or the editor(s) disclaim responsibility for any injury to people or property resulting from any ideas, methods, instructions or products referred to in the content. |
© 2025 by the authors. Licensee MDPI, Basel, Switzerland. This article is an open access article distributed under the terms and conditions of the Creative Commons Attribution (CC BY) license (https://creativecommons.org/licenses/by/4.0/).


