Submitted:
01 September 2025
Posted:
02 September 2025
Read the latest preprint version here
Abstract
This study addresses the growing concern over declining school readiness and its long-term implications for children's educational and life outcomes. In response to limitations in traditional screening tools, we evaluated an enhanced version of the Developmental Profiling Tool (DPT), designed to provide a comprehensive, ecologically valid assessment of child development at school entry. Developed by a multidisciplinary team and grounded in developmental theory, the DPT comprises 58 dichotomous observations across seven domains: auditory skills, visual perception, internal senses and interoception, external senses, and motor coordination. Involving 51 educators and 391 children, the study demonstrated the tool’s strong psychometric properties, including face, ecological, and convergent validity, and high interrater reliability. The DPT enables EYFS teachers to identify developmental differences in 98-99% of four-year-olds, facilitating timely, targeted support without reliance on external referrals. Findings highlight the tool’s potential to reduce learning gaps, enhance SEND identification, and embed proactive intervention within everyday school practice. The study contributes a scalable, practitioner-led model for early developmental assessment, with implications for policy, training, and inclusive education systems.
Keywords:
school readiness
; developmental profiling
; early identification
; SEND (Special Educational Needs and Disabilities)
; educational outcomes
; proactive intervention
Introduction
The early years of development are pivotal to defining who we become. Our development is greatly influenced by our environment, including socio-economic status, culture, and religion but it is also driven by intrinsic factors, intertwining our experiences with biology and the growth of neural pathways (Guldberg, 2020). Supporting early development is crucial for ensuring children are prepared to access learning opportunities in school, achieving what is commonly referred to as ‘school readiness’ (Blair, 2002). While the concept is not without critique, this term is widely used in early childhood education globally, without clear definition and with different understandings of what it means (Britto et al, 2012). In broad terms, school readiness is generally defined as the ability of children to function successfully in the school context (Pan et al., 2023), although ‘school readiness’ has also been defined as a holistic and multidimensional concept involving several developmental domains (Garon-Carrier et al, 2024). Much discussion around ‘school readiness’ tends to focus on preschool children being unprepared for school entry. Fixed notions of ‘readiness for school’ have focused on a narrow range of academic skills and critiques also centre on the fact that children are being expected to be ready for formal education too early and not given enough opportunities for play-based learning (Kay, 2024). In this paper, our conceptualisation of school readiness is that it encompasses a child’s holistic development and readiness for being able to learn in the school environment. We see this as dynamic and contextual, recognising that school readiness depends on both the child’s level of development and the educators’ ability to understand and meet the needs of the child (High, 2008). It is therefore dependent on both the child’s readiness for schooling and the readiness of schools and communities to meet the needs of the child (Boyle et al., 2018). We also recognise that several, often interrelated, factors influence whether a child is ready to enter formal schooling, including social disadvantage, different language and cultural backgrounds, and that educational disparities need to be considered (Lynch & Soni, 2021; Jahreire, 2022).
In England, children’s ‘school readiness’ is assessed using the ‘Good Level of Development’ (GLD) measure, which is evaluated at the end of their first year of school through the Early Years Foundation Stage Profile (EYFSP) (Atkinson et al., 2022). A summative, statutory evaluation, this profile is intended to ‘provide a reliable, valid and accurate assessment of each child’s attainment at the end of the EYFS’ (DfE, 2024: 7). National results from the EYFSP showed that only 67% of children were considered school ready in 22-23. Disparities were identified, with lower readiness among children eligible for free school meals (52%), boys (61%), and certain ethnic groups like Gypsy/Roma (Powell et al., 2024). Moreover, demographic disadvantages were evident, with EYFSP scores ranging from 84% for school readiness in London, to 59% in Greater Manchester.
These statistics indicate that there are barriers for many children to access and learn (Mon-Williams et al., 2023). This is particularly the case for neurodivergent children, who understand, process and experience information about the world in ways that differ from many of the norms through which our education system is structured (Fisher et al., 2025). If developmental needs are not met, children are less likely to access and participate fully in our education system. This can be illustrated by the fact that children who are not deemed ‘school ready’ are more likely to have Special Educational Needs or Disabilities (SEND), perform poorly in early assessments, and become disengaged from education, increasing their risk of being NEET (Not in Employment, Education, or Training) by ages 16-17 (Powell et al., 2024).
Children in their early years clearly need to have their needs met, so that they can be better supported to thrive and succeed, through early identification of need alongside timely and targeted support (Atkinson et al., 2022; Ballinger, 2024). This has led to arguments for screening, which is the process of providing a snapshot of a child’s development to identify potential areas of concern (Moodie et al., 2014). The most frequent screening tools used globally are the Ages and Stages Questionnaire (ASQ; Squires & Bricker, 2009), Parents’ Evaluations of Developmental Status-Revised (PEDS-R; Glascoe, 2023), and Bayley Scale-III (Bayley, 2006) (Rah, et al., 2023; Albuquerque & Cunha, 2020). The motivation for developing screening programmes has arisen to measure delayed development and also to respond to meeting the needs of the large numbers of children who have a neurodevelopmental condition that is not confirmed until much later in their educational pathway (with structural inequalities observed related to ethnicity, gender, and socioeconomic position). These tools have been criticised for being based on subjective parent-based perspectives (Rah et al, 2023; Dizon-Ross, 2019; Moens et al., 2018; Cibralic et al., 2022). Furthermore, in cases where primary care providers lead screening, the practicality and long-term viability of screeners are questioned due to time, financial, and human resource constraints (Lipkin et al., 2020; Mukherjee et al., 2021).
A further challenge is the limited scope of screeners, which often focus on specific areas of development rather than taking a holistic view of a child (Moodie et al., 2014). Consequently, several tools are needed to acquire a comprehensive picture of development (Cibralic et al., 2022). Many screening tools, especially in Western contexts, are skewed towards measuring communication and language abilities. The ASQ’s ‘Communication’ section, for example, assesses expressive and receptive language at each age interval through vocalisation, comprehension, and response tasks (Squires & Bricker, 2009). While these areas are important, their narrow focus may limit effectiveness across cultures (Kaiser et al., 2022), with many tools implicitly assuming intact auditory processing by omitting it from assessment. Yet, auditory processing is a pivotal building block of language development, enabling children to discriminate and attend to sounds, and perceive subtle differences in speech that underpin listening, speaking and learning (Kautto et al., 2024).
In addition, screening rarely involves active contributions from the educational professionals. These professionals, whose job it is to observe every facet and detail of a child’s growth and development (DfE Teacher Standards, 2021), can offer valuable insights. However, their input is often supplemental rather than integral, creating a disconnect between education, health and policy makers (Kay, 2024). This separation undervalues the educational perspective, which is crucial for supporting a child’s comprehensive growth in everyday contexts. Given that screening tools offer only a preliminary glance at a child’s developmental status, there is recognition that a more holistic approach is needed to enable educators to delve deeper into development and provide a more comprehensive and nuanced picture of a child. Child development ‘profiling’ is the process of assessing and mapping a child’s development across many developmental domains (Hannant et al., 2023). Such tools include neurodiversity profiling tools which focus on detailed support for suspected neurodiverse children (Portsmouth Local Offer – 2025). These tools have been developed with the recognition that effective and timely holistic educational assessment is crucial for understanding a child’s strengths and needs (Atkinson et al., 2022), and that a clear picture of a child’s development across several developmental domains is needed (e.g. cognition, communication, sensory, social-emotional, and physical development).
This form of education profiling or assessment enables timely and responsive support within an inclusive framework. The aim of such assessment or profiling is to understand a child’s strengths and needs especially with a focus on their learning and how their other characteristics (e.g., sensory needs) affect their learning or other outcomes (e.g., social outcomes in the community). The depth of information provided by a ‘developmental profiling tool’ can make these tools particularly valuable in creating actionable outcomes. However, there is currently a lack of robust research and evaluation of such tools although research is now underway through the English Department for Education’s ‘What works in Special Educational Needs and Disabilities (SEND) programme.’ That said, a prototype for such a tool to profile development was created in 2023 by a skilled, multi-disciplinary team, including a developmental psychologist, paediatrician, speech and language therapist, and occupational therapist (Hannant et al., 2023). This tool, currently named the ‘Developmental Profiling Tool (DPT), is the focus of this paper. We describe the tool and its further development, justify the need for such a tool, and present the methodology and findings arising from its broader implementation.
The Developmental Profiling Tool (DPT)
Whilst Early Year Foundation Stage Profile (EYFSP) assessments have been shown to be indicators of neurodevelopment and SEND thresholds (Warburton et al., 2024), there is a need to also equip Early Years practitioners to acquire more in-depth understandings early in the child’s learning journey. The EYFSP asks teachers to make a series of observations relating to a child’s: ‘cognition and learning’; ‘communication and interaction’; Social Emotional Mental Health; and ‘sensory and physical’ skills. This takes account of the fact that despite the varied interaction between nature and nurture, certain aspects of development, or ‘milestones’, can be measured within a defined range (Zubler et al., 2022). Yet, it is the detail and interrelationships behind how each observable milestone is acquired that provides the variance and subtleties of development (McLeod, 2024).
Based on Taylor and Trott’s Pyramid of Learning (as cited in Williams & Shellenberger, 1996; Figure 1), the DPT provides a comprehensive overview of children’s development by focusing on sensory responsiveness, neural processing, coordination, and auditory skills. These early patterns form the foundation for later development, and variations have been linked to differences in social understanding (Egmose et al., 2021), cognition and educational achievement (Schonhaut et al., 2021) and exclusion (Chapman, 2023), as well as indicators of neurodiversity. The DTP acknowledges that early child development involves a complex interplay of neural, sensory, and motor pathways shaping each child’s unique trajectory. Research has shown significant associations between these developmental processes and academic outcomes (Ivanovic et al., 2019; Lopes et al., 2013; Taanila et al., 2005), with further evidence connecting variations in developmental trajectories to neurodivergence (Babu & Sasikuma, 2019; Banaschewski et al., 2001; Dewey et al., 2002; Hannant et al., 2016; Torres & Whyatt, 2017; Yochman et al., 2006). By mapping developmental patterns rather than behaviours, the DTP aims to comprehensively measure ‘school readiness’. While it is important to celebrate and nurture developmental diversity (Hens & Van Goidsenhoven, 2023), it is equally crucial to identify and support differences early on to help improve life-chances, life-choices and emotional wellbeing, particularly in the context of societal expectation.
Hence, the DPT, based on the Pyramid of Learning, clearly differs from existing assessments like the EYFSP, as it focuses on the foundational neurodevelopment that underpins a child’s ability to engage with learning. While the EYFSP capture observable outcomes, the DPT allows practitioners to identify underlying developmental needs that may not yet manifest in academic or behavioural indicators. By offering this deeper layer of understanding of a child’s readiness to learn, the DPT can complement the EYFSP, helping educators to target support that addresses the root differences before learning and emotional well-being gaps begin.
The DTP takes account of the fact that in the early stages of life, a child’s brain is adaptable through a process called experience-expectant synaptogenesis, where the brain forms neural connections in response to expected early environmental inputs, such as light and sound. This type of brain plasticity happens during finite windows of development or critical periods, many of which end before the ages of 5 and 6 (Phillips & Shonkoff, 2000). Consequently, identifying developmental delays or differences during or near these critical windows enables the provision of effective, targeted support at an early stage (Dehorter & Del Pino, 2020). To address this, it is essential to profile a child’s development at the point of school entry, rather than waiting until the end of their first year. The aim is to effectuate early intervention when different developmental trajectories arise, paramount for achieving beneficial educational and emotional outcomes (Pérez & Ríos, 2024), which is why the DTP is proposed for implementation at the start of school. By mapping developmental patterns rather than behaviours, the DTP offers a more comprehensive measure of school readiness. It is hoped that the insights gained through profiling will inform actionable interventions, fostering a more responsive and inclusive approach to early education.
The Pilot Study
The DPT was developed by professionals from various developmental fields, grounded in established research on child development and early learning. This was then rigorously developed and tested for reliability, validity, and usability through a pilot with 172 reception-aged children across the East and West Midlands, UK (see Hannant et al., 2023). All procedures were conducted in accordance with ethical guidelines and were approved by the University of Birmingham’s ethics committee (ERN_2022-0244). Piloted with reception-aged children from two academy trusts, EYFS teachers recorded Yes/No responses, which were visualised in radial charts to profile developmental strengths and weaknesses in children within their class (Figure 2).
This data enabled targeted interventions for areas of difficulty, supporting focused spring term interventions. The tool’s validity was analysed by comparing outcomes for a randomly selected subsample of children with established parent-report screeners and auditory assessments, showing strong alignment. Reliability was supported through consistent results across settings and roles, with inter-rater reliability explored via data distribution analysis. Feedback was suggested for improvements for the next phase, including refinement of questions deemed to measure similar constructs and data presentation.
Findings highlighted that the prototype successfully provided a comprehensive overview of children’s development, with EYFS teachers reporting increased awareness of individual needs, enhanced professional judgement, and improved curriculum planning through both targeted and universal interventions. SENCos also found the tool effective for applying the Graduated Approach and identifying children who may require SEND support. Overall, the prototype trial received strong endorsement for using the DPT to assess readiness to learn rather than prior attainment, laying the foundation for a broader study to validate its impact in promoting early intervention and educational equity, thus justifying the importance of trialling the DTP on a larger scale.
In response to recommendations from the pilot study, further discussions were held with key professionals, including professors of autism, educational psychologists, and associate professors specialising in early childhood education. These discussions, alongside further review of current research, identified missing measures for visual perception and interoception. Visual perception is defined as, “the processing and comprehension, via the eyes and the neural system, of holistic focal and non-focal stimuli” (Sample et al., 2020, p.406), distinct from visual acuity, which measures clarity of vision. Interoception describes the body’s ability to perceive internal signals, such as hunger, temperature, or pain, allowing for awareness of bodily states (Barker et al., 2021) (Figure 3 for the flow chart of tool creation).
As a result of the pilot study, and with the synergism of the multi-disciplinary team, in addition to the additional academic expertise and feedback from the initial study, a new fifty-nine item questionnaire was created. Areas of development were divided into seven areas: auditory skills (twelve questions (12Q), internal senses (proprioception and vestibular input) and interoception (17Q); external senses (auditory, visual, tactile, oral and olfactory - 6Q); visual perception (4Q); fine motor control (7Q); and gross motor control (13Q), with visual perception and interoception being new additions to the revised tool. To facilitate easy administration, activities designed by an associate professor in early years were added for each item. These activities aimed to seamlessly integrate the required observations into the already full early years curriculum, minimising impact on teacher workload and classroom learning. To support ease of access and distribution, a website was developed to cascade training to EYFS staff and SENCos within schools and to house the questionnaire. The website was linked to the University of Birmingham’s secure data storage system and data was treated confidentially.
The Main Study
Aims
The aim of the study described in this paper, is to trial the DPT on a larger scale to answer the following research questions:
- 1)
- Can the DPT reliably and validly assess multiple foundational constructs of child development at school entry?
- 2)
- Does the use of the DPT by Early Years Foundation Stage (EYFS) teachers support the early identification of developmental differences to enable timely intervention?
The study was ethically approved (University of Birmingham Ethics Committee ERN_0748-May 2023). Training took place during the first half term of the 2023-24 academic year (September to October) and the tool was administered by teachers during the second half term (October to November).
Participants
The population included 391 children at the beginning of their reception year (ages four and five), and 72 educators from 32 schools across the Midlands (Nottinghamshire, Leicestershire, Northamptonshire, Leicester, and Birmingham). After initial engagement, six schools withdrew after the summer holidays due to staff sickness (51 educators and 28 schools), and four more withdrew after training, leaving 298 children and 34 educators from 22 schools. Schools were selected through opportunistic sampling based on training attendance. Opportunistic sampling can introduce bias by limiting representativeness and generalisability. However, in this study, the sample included a mix of independent and state schools across both highly deprived and affluent areas of the UK, as measured by the Index of Multiple Deprivation (Deprivation in Birmingham, 2019; Rowlands et al., 2023). As such, a diverse demographic was captured in terms of socioeconomic background, ethnicity, and educational setting, this helped to mitigate some of the limitations typically associated with opportunistic sampling. Heritage and gender of the children are detailed in Table 1. Parental and setting consents were obtained for all participants.
Training in developmental psychology was a pre-requisite to undertaking observations of children’s development. The lead author delivered this content via a pre-recorded, interactive webinar, divided into six sessions lasting between four and ten minutes each. While concise in format, the training was designed to be engaging and cumulative, amounting to approximately two hours of focused content, providing a structured foundation in key developmental concepts to support informed observation. Educational professionals were introduced to the four foundational stages of development outlined in ‘The Pyramid of Learning’ (Taylor & Trott, as cited in Williams & Shellenberger, 1996; Figure 2), which support and enable higher-level processes such as cognition and academic learning. While learning can occur at all levels of the pyramid, this model helped illustrate that effective cognitive learning depends on the integration of earlier developmental stages, including the Nervous System, Sensory Systems, Sensorimotor Development, and Perceptual Motor Development.
Educators were asked to reflect on their training with the following open-ended prompts:
Were there any surprises in the training?
- What interested you the most?
- Which area of the pyramid of learning might impact a child’s learning the most?
- What have you learnt that you did not know before?
- Has the training helped you to understand why children have barriers to learning?
- What might you do in the future as an outcome of this training?
- How has the training impacted your teaching pedagogy?
Methods
The study used mixed methods, this was crucial to answer the research questions and to enable triangulation of data. These included i) an online reflective survey completed by teachers following training on the tool (n=51); ii) written reflections from teachers (n=34) after administering the tool across a range of school settings (independent, state, inner-city, and shire); iii) a sample of 10-15% of children from each participating school (n= 46 children) selected using simple random sampling; iv) each child’s interoception, sensory responsivity and coordination were assessed using standardised parent-reported questionnaires (see Table 2); and finally v) auditory skills and visual perception were measured using researcher-supplied standardised interactive assessments administered by the SENCos (see Table 2) to support validation. Additionally, the SENCo and EYFS teacher from each school were asked to administer the tool to the same child to allow for interrater comparison. This was completed by five schools, based on SENCo availability.
Face validity, whether the tool measures what it intends to (Kemper, 2020); and Ecological validity, how well it applies to real-life contexts, were both explored through these teacher reflections after administering the DTP. For the written reflections after administering the tool, teachers were asked two open-ended questions regarding the DPT: i) whether using the DPT changed their practice, and if it not, to state this; and ii) to give two stars and a wish for the DPT. Additionally, teachers selected from a drop-down list the assessments they found most informative and purposeful for supporting a child’s learning. Options included the DPT, the UK Government’s Reception Baseline Assessment, and a speech and language assessment.
Analysis
Qualitative Analysis
Findings from the training feedback and teacher reflections on the DTP were analysed using a thematic approach informed by Clarke and Braun’s (2013) six-phase framework. While the analysis followed their general structure, familiarisation, coding, theme development, review, definition, and reporting, it incorporated elements of a more structured, codebook-style approach. Specifically, reflections were coded separately in NVivo 14, with themes generated inductively from each dataset. Coding focused on repeated words and ideas, which formed the basis of theme development. Two independent EYFS educators reviewed the themes to support consistency and enhance the credibility of the findings. This reflects a departure from Clarke and Braun’s (2013) reflexive model, which emphasises researcher subjectivity and does not require inter-rater agreement.
Quantitative Analysis
While qualitative insights were explored through thematic analysis of teacher reflections, the robustness of the tool was further evaluated through quantitative analysis. This involved examining nearly 20,000 data items generated during tool administration, with a focus on assessing its validity and reliability across diverse educational settings. Statistical methods were applied to explore consistency, accuracy and interrater agreement, as detailed below.
- (a)
- Convergent validity, whether different measures of the same construct are closely aligned (Kemper, 2020) was assessed using data from the randomly selected sample of children (n=46). Paired samples correlations were conducted in SPSS (v29.0.1) to compare scores from standardised parent-reported questionnaires and SENCo-administered assessments with results from the DPT. This analysis aimed to determine the degree of alignment between external measures and the tool’s outputs
- (b)
- To assess construct validity, a bivariate correlation analysis was conducted using SPSS (v29.0.1) to explore relationships among the various constructs.
- (c)
- Subsequently, a regression analysis was performed to explore whether scores on certain constructs within the tool could statistically predict outcomes on other constructs. This approach was used to examine the internal coherence of the tool and to assess whether it captured a broad and interconnected range of developmental domains. If constructs meaningfully predicted one another, it suggests that the tool reflects a comprehensive model of development, rather than isolated skills or traits. The assumptions for regression analysis were also thoroughly checked, including: outliers, identified using Cook’s Distance, with participants exceeding a value of 1.0 being excluded; multicollinearity, assessed using tolerance scores, which needed to be greater than 0.2; and homoscedasticity, examined through scatterplots of zresid versus zpred and sresid versus zpred, ensuring that PP plots did not exhibit a pronounced S-shaped curve.
- (d)
- Inter-rater reliability (evaluates the level of agreement between different raters) was measured by requesting the SENCo and EYFS teacher from each school to administer the tool to the same child so that outcomes could be compared. This was done by five schools (due to time commitments of the SENCo). Five children equated to 295 responses that were analysed using paired samples correlations in SPSS (v29.0.1).
- (e)
- Reliability - The Kuder-Richardson Formula 20 (KR-20) was used in SPSS (v29.0.1) to measure how consistent responses were across all items on the tool. KR-20 is used to estimate the reliability of binary measurements, such as those used in the tool, noting whether a child was able to complete an activity successfully or not. Higher values, closer to 1.0 indicated higher reliability
Findings
EYFS teacher and SENCo Reflections on Training
Following training on child development, reflections were requested before access to the development tool. Table 3 illustrates a sample of results from the thematic analysis based on teachers’ and SENCos’ reflections on the given training (n=51). As can be seen in the Table, thematic analysis of responses identified two major themes: Shifting Perspectives on Learning Barriers and Deepening Professional Understanding of Child Development. Findings from feedback on the training showed significant ‘Shift on Perspectives on Learning Barriers’ as 59% of participants reported a better understanding of barriers to learning and increased confidence in identifying developmental delays. They reported that they gained valuable insights into the interconnected nature of skills and the importance of considering multiple factors when teaching. Additionally, the training ‘Deepened Professional Understanding’ with 80% of participants considering new concepts such as interoception and sensory responsivity. Overall, participants described a shift in how they perceive children’s learning challenges, moving from a surface-level understanding to recognising the complex, often hidden, developmental barriers. This shift was at times accompanied by a sense of regret or reflection on past practice (12%), suggesting a deeper professional transformation, with 14% of comments stating that the training should be cascaded across all staff.
Validity and Reliability of the Tool
To assess whether the DTP effectively evaluates its intended constructs in the real world, face validity and ecological validity were examined through thematic analysis of 34 teacher reflections after administering the tool to all children. High face and ecological validity are important in this study as a key aim was to assess the ability of the profiling tool to measure developmental constructs in everyday contexts. In this analysis two key themes emerged, ‘Reframing Assessment Priorities’ and ‘Enhancing Early and Targeted Support’. Educators reflected on what should be assessed at baseline with 58% noting that using the development tool had prompted them to reconsider any baseline assessment, emphasising the need to evaluate children’s development comprehensively. 68% of educators also recognised that understanding how a child learns and identifying learning barriers early allows for timely and targeted ‘intervention’. The development tool was reported to have facilitated the delivery of these interventions by 63% of participants, with comments such as, “the intervention resources being invaluable” and “the suggested resources for intervention were used for maximum impact”, supporting children from the start of their primary education. It also helped in tailoring interventions beyond the curriculum, addressing specific needs such as motor skills and spatial awareness, and providing valuable links to further support and resources. While some educators (21%) noted that the tool could be time-consuming, particularly when balancing it with other non-negotiable demands like the government baseline, this feedback highlights the importance of ensuring that any developmental tool used at the start of Reception is comprehensive. This helps to avoid unnecessary repetition and ensures that existing responsibilities are complemented rather than compounded. Together, the reflective themes suggest that the DPT prompted a shift in educators’ thinking, both in how they assess developmental readiness and how they respond to emerging needs. Educators reported that the tool supported more reflective, informed, and responsive practice, particularly in the early identification and support of children with developmental differences. Table 4 presents a sample of comments on the themes.
Educators (n=34) were also asked to prioritise which tool from the DPT, a Speech and Language assessment tool, or the Government Baseline Tool is the most informative and purposeful to learning, with the option of ‘other’. 68% of educators chose the DPT as being the most informative and purposeful to learning with 16% choosing a speech and language tool and 5% choosing the government baseline. 11% chose ‘other’ based on an assessment tool created specifically for the school (Figure 4). While each tool serves a distinct purpose, the DPT’s broader developmental scope may have influenced its perceived usefulness in this context. The tool demonstrated good face and ecological validity, as teachers were able to profile children’s development across the seven constructs and implement timely intervention.
Convergent Validity
The tool’s ability to assess whether different measures of the same construct (i.e., concept or trait) are closely aligned was examined through analysis of paired samples correlations using SPSS (v29.0.1). Data from standardised assessments completed by parents and SENCos were statistically compared with corresponding DPT scores for each child in the random sample (n=46). This allowed for the evaluation of convergence between external measures and the tool’s outputs across key developmental domains (see Table 2).
The DPT demonstrated significant correlations with standardised tools in several areas, supporting its convergent validity. Specifically, the tool showed a strong correlation in measuring internal and external senses (-.680 and .802 respectively). Moderate correlations were observed for visual perception (.463), fine motor skills (.509), and gross motor skills (.435). Although interoception also showed a statistically significant correlation, it was weak (-.243). The negative correlations for internal senses and interoception are likely attributable to differences in the framing of items between the compared assessments and the DPT. For instance, the SP2 (Sensory Profile 2; Dunn, 2014) scores reflect sensory difficulties, whereas the DPT captures normative sensory responsivity. The DPT’s auditory skills did not correlate significantly with the standardised tools (.116 and .061), suggesting a divergence in how auditory processing is assessed across the instruments. The standardised assessment used for comparison (ASA) was unique, focusing on sound discrimination and mimicry. The presence of Americanisms in the tool may also have influenced the results (Geffner & Goldman, 2010). Other validity and reliability measures for the DPT do not suggest this construct is an outlier, as teachers noted hearing difficulties and implemented early intervention. See Table 5.
Construct Validity
A bivariate correlation analysis was conducted in SPSS to identify any significant relationships between the seven constructs. A significant relationship was shown between all the constructs measured in the DPT, with all scores showing significant correlation with each other (p <.001), varying between moderate to high degrees of correlation (Table 6). This means that differences in development across all constructs closely aligned. It is important to note here that multicollinearity was also within acceptable limits, as all tolerance scores were above 0.2.
Multiple regression analyses were performed to determine whether each construct within the DPT could predict the values of the other measured outcomes. Assumptions for regression, including outliers, multicollinearity, and homoscedasticity, were checked. No outliers were detected, as indicated by Cook’s Distance, with the highest value being 0.11515. Homoscedasticity was assessed using scatterplots of zresid versus zpred and sresid versus zpred. PP plots showed only slight deviations from linearity for each regression, so bootstrapping was not deemed necessary (Figure 5).
The multiple regression analysis demonstrated that each individual construct could be predicted by the other seven constructs. The analysis showed that the total scores from seven constructs explained between 45-65% of the variance in single constructs. Notably, auditory skills significantly predicted constructs such as external senses, interoception, and fine motor skills. Results from the multiple regression are shown in the Table 7 below and supports the correlation analysis above, in that many of the constructs are related and predictive of each other.
Inter-rater reliability – (between rater reliability) was measured across five children from five schools, each evaluated on fifty-nine items of the DPT, resulting in a total of 295 items across all evaluations. Significant correlations were found in each assessment, ranging from moderate to perfect. One with perfect correlation (±1), two with strong correlation (±0.50 to ±1), and two with moderate correlation (±0.30 to ±0.49). While the limited number of children involved in the inter-rater testing could be seen as a limitation, the high level of correlation across the 295 items indicates strong inter-rater reliability. See Table 8.
Internal Consistency
The Kuder-Richardson Formula 20 (KR-20) was used in SPSS (v29.0.1) to measure how consistent responses were across all items on the tool. Internal consistency was found to be strong across all constructs, except for interoception, which demonstrated acceptable consistency. One item within the internal senses construct, specifically the only item related to olfactory sense and taste, was identified as reducing consistency by lowering the Cronbach’s alpha. When this item was removed, the internal consistency of the construct increased from 8.01 to 8.10. Therefore, the overall internal consistency of the tool can be considered good. The tool was split into individual constructs to establish each section’s reliability (see Table 9).
Discussion
We know that barriers to learning experienced by children (Kindred Squared School Readiness Survey, February 2024) have significant long-term implications for children’s future educational and life outcomes, as well as immediate resourcing challenges (Lipkin et al., 2020; Mukherjee et al., 2021). Consequently, identifying developmental differences and delays at an early stage is crucial for providing targeted support and enhancing school readiness (Atkinson et al., 2022; Ballinger, 2024). To better support children’s growth, we have highlighted a pressing need for more holistic assessment methods that consider and profile all aspects of development. The development and evaluation of such assessment methods must be tested and validated for ecological validity through engagement with schools and educators, ensuring their practical usefulness in identifying learning needs. Consequently, this study aimed to conduct a large-scale study of a previously piloted tool capable of profiling children’s development, the DPT (Hannant et al., 2023). The DPT goes beyond merely screening children’s development and aims to profile strengths and areas needing support across seven critical constructs of child development to measure fundamental building blocks. Our findings indicate that the tool demonstrates robust validity and reliability, relying minimally on language and focusing on foundational developmental domains, such as auditory, sensorimotor, and perceptual-motor skills, that are more biologically driven and less influenced by cultural or linguistic context. By emphasising the measurement of very early developmental systems, the tool has the potential to reduce the likelihood of cultural bias. Future research should therefore focus on investigating its applicability across further diverse populations.
This study showed that the tool has ecological validity as it can be administered by EYFS teachers, trained to observe and interpret a wide range of developmental behaviours in young children. Their familiarity with the children and expertise in recognising subtle developmental cues, help ensure that observations are both informed and contextually grounded. This approach reduces the likelihood of misinterpretation or overgeneralisation, which can occur when assessments are conducted by unfamiliar or less experienced observers. Additionally, our research found that the tool enhances the developmental knowledge of EYFS teachers, aiding in the identification and assessment of developmental differences. Its face, ecological, and convergent validity, alongside strong interrater reliability, demonstrate its efficacy in measuring children’s development through everyday educational observations. These findings support its use in identifying learning barriers early and enabling educators to play a central role in SEND referrals, rather than a supplementary one.
Psychometric analysis further reinforces the tool’s reliability, with strong internal consistency across most constructs and acceptable consistency in interoception. The moderate to strong intercorrelations between domains suggest that while each construct is distinct, they are developmentally interconnected, capturing a coherent and meaningful developmental profile. The identification of one item (olfactory/taste) that reduced consistency highlights the importance of ongoing refinement to enhance precision. Together, these findings indicate that the DPT is both practically useful and psychometrically sound, with future iterations potentially benefiting from targeted adjustments to further strengthen its alignment with external measures.
The primary goal of building a comprehensive understanding of each child’s needs is to enable timely and targeted support, especially when developmental differences emerge during critical windows. A key strength of the DPT is its ability to both identify developmental differences and signpost intervention with specificity, all without the need for external professionals or pathway referrals. This helps to ensure that support can begin promptly and that few children are overlooked. Our research showed that the DPT therefore offers promising potential to reduce learning gaps and effectively identify children more likely to have SEND.
To realise this potential, however, tools like the DPT must be embedded into everyday school practices in ways that are both sustainable and impactful. This requires not only practical adjustments, such as streamlining administration, but also broader cultural and systemic change. Embedding developmental profiling into routine assessment demands support from leadership, alignment with policy, and ongoing professional development. Future research should explore how the DPT can be integrated into existing school systems, including digital formats and staff training models, to ensure long-term feasibility and uptake. Investigating the feasibility of profiling children’s development at school entry will be crucial to enabling proactive support from the outset, within a needs-led system.
The study’s limitations primarily relate to the attrition rate of participating schools as research progressed. Initially, this was attributed to staff illness following the summer break. However, after the tool was implemented and results were shared with the schools, fewer teachers engaged in reflective feedback compared to the initial training phase, where participation was required to access the materials. Nonetheless, demand for the tool remained high, with nearly all schools requesting continued access for subsequent academic years. Another limitation is the use of dichotomous data, which did not allow for partial credit for emerging skills. However, it was important that children fully completed each task to receive a positive score. EYFS teachers also noted that a grid-format overview of the questionnaire would be more practical than accessing each child’s constructs individually, given time constraints. Additionally, some instructions would benefit from clearer language. For instance, when assessing whether a child can jump with feet together, it should be specified that the child must clear the floor, as this is an important stage of development. Minor adjustments are needed to enhance the tool’s accessibility for routine use.
Conclusion
This study investigated whether the DPT can reliably and validly assess foundational aspects of child development at school entry, and whether its use by EYFS teachers supports early identification and intervention. Findings indicate that the DPT effectively profiles development across seven key constructs, with strong indicators of validity and reliability. Its design, minimally reliant on language and administered by trained educators, has the potential to support culturally inclusive assessment. Teachers also reported that the DPT informed SEND referrals and support strategies, suggesting its potential to enable timely, school-based responses to developmental needs. Further research is needed to explore how profiling data is used in practice and its long-term impact on educational outcomes.
Declaration of Interests
The authors declare that there are no conflicts of interest regarding the publication of this paper.
Acknowledgements
Dr Nicola Smith1, Prof. Helen Breadmore1, Dr Anna Joyce2, Dr Anthea Gulliford1, Dr Sophia Mooncey – Paediatrician Spire Hospital, Rachel Garland – Occupational Therapist, Helen Eales – Speech and Language Therapist, and the schools involved in the study. 1. School of Education, University of Birmingham; 2. Regent’s University London
References
- Albuquerque, K. A., & Cunha, A. C. B. (2020). New trends in instruments for child development screening in Brazil: A systematic review. Journal of Human Growth and Development, 30(2), 88–196. Universidade Estadual Paulista (UNESP). [CrossRef]
- Atkinson, A. L., Hill, L. J. B., Pettinger, K. J., Wright, J., Hart, A. R., Dickerson, J., & Mon-Williams, M. (2022). Can holistic school readiness evaluations predict academic achievement and special educational needs status? Evidence from the Early Years Foundation Stage Profile. Learning and Instruction, 77, 101537. Elsevier. [CrossRef]
- Babu, A. G., & Sasikumar, N. (2019). Need for neurocognitive approach in teaching mathematics for children with dyscalculia. International Journal of Basic and Applied Research, 9(4), 194-200. Longman Publishing.
- Ballinger, L., (2024). New school starters not ready for learning. University of Leeds News. Date accessed [26th February 2024]. Available from: [https://tinyurl.com/ypauunyt].
- Banaschewski, T., Besmens, F., Zieger, H., & Rothenberger, A. (2001). Evaluation of sensorimotor training in children with ADHD. Perceptual and Motor Skills, 92(1), 137–149. Sage Publishing. [CrossRef]
- Barker, M., Brewer, R. and Murphy, J., 2021. What is Interoception and Why is it Important?. Front. Young Minds, 9, p.558246. Date accessed [26th February 2024]. Available from: [https://kids.frontiersin.org/articles/10.3389/frym.2021.558246].
- Bayley, N. (2006). Bayley scales of infant and toddler development, third edition: Administration manual. San Antonio, TX: Harcourt.
- Beery, K., Buktenica, N., Beery, N., & Keith, E. (2010). Developmental test of visual-motor integration 6th edition. Minneapolis, MN: NSC Pearson.
- Blair, C. (2002). School readiness: Integrating cognition and emotion in a neurobiological conceptualization of children’s functioning at school entry. American psychologist, 57(2), 111. American Psychological Association (APA). [CrossRef]
- Boyle, T., Petriwskyj, A., & Grieshaber, S. (2018). Reframing transitions to school as continuity practices: the role of practice architectures. The Australian Educational Researcher, 45(4), 419-434. Springer Nature. [CrossRef]
- Britto, P. R. (2012). Key to Equality: Early Childhood Development. [https://itacec.org/itadc/document/learning_resources/project_cd/International/Global%20Agreement%20-%20netotiations%20Key%20to%20Equality%20%20ECD%20Britto%20-%20Pia%20et%20al.pdf] (Accessed 5th August 2025).
- Chapman, E. (2023). Preventing unmet need from leading to school exclusion: Empowering schools to identify neurodiversity earlier (Doctoral dissertation, University of Leeds).
- Cibralic, S., Hawker, P., Khan, F., Mendoza Diaz, A., Woolfenden, S., Murphy, E., Deering, A., Schnelle, C., Townsend, S., Doyle, K., & Eapen, V. (2022). Developmental screening tools used with First Nations populations: A systematic review. International Journal of Environmental Research and Public Health, 19(23), 15627. MDPI. [CrossRef]
- Clarke, V. & Braun, V. (2013) Teaching thematic analysis: Overcoming challenges and developing strategies for effective learning. The Psychologist, 26(2), 120-123. British Psychological Society.
- Dehorter, N., & Del Pino, I. (2020). Shifting developmental trajectories during critical periods of brain formation. Frontiers in cellular neuroscience, 14, 283. Frontiers. [CrossRef]
- Department for Education (2021), “Teachers’ Standards,” [https://assets.publishing.service.gov.uk/media/61b73d6c8fa8f50384489c9a/Teachers__Standards_Dec_2021.pdf] (Accessed: 11th March 2025).
- Department for Education (2024), Standards and Testing Agency. “Early years foundation stage profile handbook”, [https://assets.publishing.service.gov.uk/media/6747436ba72d7eb7f348c08b/Early_years_foundation_stage_profile_handbook.pdf] (Accessed: 11th March 2025).
- Deprivation of Birmingham, (2019) https://www.birmingham.gov.uk/downloads/file/2533/index_of_deprivation_2019 [Accessed 11th March 2025].
- Dewey, D., Kaplan, B. J., Crawford, S. G., & Wilson, B. N. (2002). Developmental coordination disorder: Associated problems in attention, learning, and psychosocial adjustment. Human movement science, 21(5-6), 905-918. Elsevier. [CrossRef]
- Dizon-Ross, R. (2019). Parents’ beliefs about their children’s academic ability: Implications for educational investments. American Economic Review, 109(8), 2728-2765. American Economic Association. [CrossRef]
- Dunn, W. (2014). Sensory profile 2. Bloomington, MN, USA: Psych Corporation.
- Egmose, I., Smith-Nielsen, J., Lange, T., Stougaard, M., Stuart, A. C., Guedeney, A., & Væver, M. S. (2021). How to screen for social withdrawal in primary care: An evaluation of the alarm distress baby scale using item response theory. International Journal of Nursing Studies Advances, 3, 100038. Elsevier. [CrossRef]
- Fisher, E., MacLennan, K., Mullally, S., & Rodgers, J. (2025). Neuro-Normative Epistemic Injustice–Consequences for the UK Education Crisis and School Anxiety. Neurodiversity, 3. SAGE Publications. [CrossRef]
- Garon-Carrier, G., Boivin, M., Lemelin, J. P., Kovas, Y., Parent, S., Seguin, J. R.,. & Dionne, G. (2018). Early developmental trajectories of number knowledge and math achievement from 4 to 10 years: Low-persistent profile and early-life predictors. Journal of school psychology, 68, 84-98. Elsevier. [CrossRef]
- Geffner, D., & Goldman, R. (2010). Auditory skills assessment. Pearson Assessments.
- Glascoe, F. P., Woods, S. K., & Mills, T. D. (2023). Parents’ Evaluation of Developmental Status - Revised (PEDS-R) Handbook. Nolensville, TN: PEDStest.com, LLC.
- Guldberg, K. (2020). Developing excellence in autism practice: Making a difference in education. Routledge. [CrossRef]
- Hannant, P., Cassidy, S., Tavassoli, T., & Mann, F. (2016). Sensorimotor difficulties are associated with the severity of autism spectrum conditions. Frontiers in integrative neuroscience, 10, 28. Frontiers Media S.A. [CrossRef]
- Hannant, P., Gartland, R., Eales, H. and Mooncey, S., 2023. A tool to profile neural, sensory and motor development in children at school entry, identifying possible barriers to learning and emotional well-being in early childhood. Support for Learning, 38(4), pp.167-177. Wiley-Blackwell. [CrossRef]
- Harris, M., Franzsen, D., & De Witt, P. A. (2021). Relevance of norms and psychometric properties of three standardised visual perceptual tests for children attending mainstream schools in Gauteng. South African Journal of Occupational Therapy, 51(3), 4–13. Occupational Therapy Association of South Africa (OTASA). [CrossRef]
- Hens, K., & Van Goidsenhoven, L. (2023). Developmental diversity: Putting the development back into research about developmental conditions. Frontiers in Psychiatry, 13, 986732. Frontiers Media S.A. [CrossRef]
- High, P. C., & Committee on Early Childhood, Adoption, and Dependent Care and Council on School Health. (2008). School readiness. Pediatrics, 121(4), e1008-e1015.American Academy of Pediatrics (AAP).
- Ivanović, L., Ilić-Stošović, D., Nikolić, S., & Medenica, V. (2019). Does neuromotor immaturity represent a risk for acquiring basic academic skills in school-age children? Vojnosanitetski Pregled, 76(10), 1062–1070. University of Defence, Ministry of Defence of the Republic of Serbia. [CrossRef]
- Jahreie, J. (2022). The standard school-ready child: the social organization of ‘school-readiness’. British Journal of sociology of Education, 43(5), 661-679. Routledge. [CrossRef]
- Kaiser, A. P., Chow, J. C., & Cunningham, J. E. (2022). A case for early language and behavior screening: Implications for policy and child development. Policy Insights from the Behavioral and Brain Sciences, 9(1), 120-128. Sage Publications Inc. [CrossRef]
- Kautto, A., Railo, H., & Mainela-Arnold, E. (2024). Low-level auditory processing correlates with language abilities: An ERP study investigating sequence learning and auditory processing in school-aged children. Neurobiology of Language, 5(2), 341-359. MIT Press. [CrossRef]
- Kay, L. (2024). ‘I feel like the Wicked Witch’: Identifying tensions between school readiness policy and teacher beliefs, knowledge and practice in Early Childhood Education. British Educational Research Journal, 50(2), 632-652. Wiley. [CrossRef]
- Kemper, C. J. (2020). Face validity. In V. Zeigler-Hill & T. K. Shackelford (Eds.), Encyclopedia of Personality and Individual Differences (pp. 1540–1543). Springer. [CrossRef]
- Kindred Squared, 2023. School Readiness Report. https://kindredsquared.org.uk/wp-content/uploads/2024/02/Kindred-Squared-School-Readiness-Report-February-2024.pdf [Accessed 11th March 2025].
- Lipkin, P. H., Macias, M. M., Baer Chen, B., Coury, D., Gottschlich, E. A., Hyman, S. L.,. & Levy, S. E. (2020). Trends in pediatricians’ developmental screening: 2002–2016. Pediatrics, 145(4), e20190851. American Academy of Pediatrics. [CrossRef]
- Lopes, L., Santos, R., Pereira, B., & Lopes, V. P. (2013). Associations between gross motor coordination and academic achievement in elementary school children. Human Movement Science, 32(1), 9–20. Elsevier. [CrossRef]
- Lynch, P., & Soni, A. (2021). Widening the focus of school readiness for children with disabilities in Malawi: a critical review of the literature. International Journal of Inclusive Education, 29(1), 97-111. Routledge. [CrossRef]
- McLeod, S. (2024). Sensorimotor stage of cognitive development. https://www.simplypsychology.org/sensorimotor.html [Accessed 3rd August 2025].
- Moens, M. A., Weeland, J., Van der Giessen, D., Chhangur, R. R., & Overbeek, G. (2018). In the eye of the beholder? Parent-observer discrepancies in parenting and child disruptive behavior assessments. Journal of Abnormal Child Psychology, 46(6), 1147–1159. Springer. [CrossRef]
- Mon-Williams, M., Wood, M., & Taylor-Robinson, D. (2023). Addressing Education and Health Inequity: Perspectives from the North of England. A report prepared for the Child of the North APPG.
- Moodie, S., Daneri, P., Goldhagen, S., Halle, T., Green, K., & LaMonte, L. (2014). Early childhood developmental screening: A compendium of measures for children ages birth to five (OPRE Report 2014-11). Office of Planning, Research and Evaluation, Administration for Children and Families, U.S. https://acf.gov/sites/default/files/documents/opre/compendium_2013_508_compliant_final_2_5_2014.pdf [Accessed March 2024].
- Mukherjee, S. B., Aneja, S., Sharma, S., & Kapoor, D. (2021). Early childhood development: A paradigm shift from developmental screening and surveillance to parent intervention programs. Indian Pediatrics, 58(Suppl 1), S64–S68. Springer. [CrossRef]
- Pan, X. S., Li, C., & Watts, T. W. (2023). Associations between preschool cognitive and behavioral skills and college enrollment: Evidence from the Chicago School Readiness Project. Developmental Psychology, 59(3), 474–486. American Psychological Association (APA). [CrossRef]
- Pérez, M., & Ríos, N. (2024). The effectiveness of early intervention programs for children with special needs. International Journal of Literacy and Education. https://www. educationjournal. [Accessed 3rd August 2025].
- Phillips, D. A., & Shonkoff, J. P. (Eds.). (2000). From neurons to neighborhoods: The science of early childhood development. National Academies Press.
- Portsmouth Local Offer. (2025). The Neurodiversity (ND) Profiling Tool. https://portsmouthlocaloffer.org/information/the-neurodiversity-nd-profiling-tool/ [Accessed February 2025].
- Powell, L., Spencer, S., Clegg, J., Wood, M. L., et al. (2024). A country that works for all children and young people: An evidence-based approach to supporting children in the preschool years. N8 Research Partnership.
- Rah, S. S., Jung, M., Lee, K., Kang, H., Jang, S., Park, J.,. & Hong, S. B. (2023). Systematic review and meta-analysis: Real-world accuracy of children’s developmental screening tests. Journal of the American Academy of Child & Adolescent Psychiatry, 62(10), 1095–1109. Elsevier. [CrossRef]
- Rihtman, T., Wilson, B. N., & Parush, S. (2011). Development of the Little Developmental Coordination Disorder Questionnaire for preschoolers and preliminary evidence of its psychometric properties in Israel. Research in developmental disabilities, 32(4), 1378-1387. Elsevier. [CrossRef]
- Rowlands, H., Lee, F., & Tomlinson, H. (2023). Leicestershire LFRMS SEA Environmental Report. https://www.leicestershire.gov.uk/sites/default/files/2024-02/Leicestershire-LFRMS-SEA-Environmental-Report.pdf [Accessed 30th October 2024].
- Sample, K. L., Hagtvedt, H., & Brasel, S. A. (2020). Components of visual perception in marketing contexts: A conceptual framework and review. Journal of the Academy of Marketing Science, 48(3), 405–421. Springer. [CrossRef]
- Schonhaut, L., Maturana, A., Cepeda, O., & Serón, P. (2021). Predictive validity of developmental screening questionnaires for identifying children with later cognitive or educational difficulties: A systematic review. Frontiers in Pediatrics, 9, 698549. Frontiers Media. [CrossRef]
- Squires, J., Bricker, D. D., & Twombly, E. (2009). Ages & stages questionnaires (3rd ed., pp. 257–182). Brookes Publishing Company. [CrossRef]
- Steinhoff, J. M. (2024). Supporting Interoceptive Learning Across Environments: A Guide For Educators And Caregivers. University of North Dakota.
- Taanila, A., Murray, G. K., Jokelainen, J., Isohanni, M., & Rantakallio, P. (2005). Infant developmental milestones: A 31-year follow-up. Developmental Medicine & Child Neurology, 47(9), 581–586. Cambridge University Press. [CrossRef]
- Torres, E. B., & Whyatt, C. (Eds.). (2017). Autism: the movement sensing perspective. CRC Press.
- Warburton, M., Wood, M. L., Sohal, K., Wright, J., Mon-Williams, M., & Atkinson, A. L. (2024). Risk of not being in employment, education or training (NEET) in late adolescence is signalled by school readiness measures at 4–5 years. BMC public health, 24(1), 1375. Springer Nature. [CrossRef]
- Williams, S. W., & Shellenberger, S. (1996). How does your engine run? A leader’s guide to the Alert Program for self-regulation. TherapyWorks, Inc.
- Yochman, A., Ornoy, A., & Parush, S. (2006). Co-occurrence of developmental delays among preschool children with attention-deficit-hyperactivity disorder. Developmental Medicine & Child Neurology, 48(6), 483–488. Wiley. [CrossRef]
- Zubler, J. M., Wiggins, L. D., Macias, M. M., Whitaker, T. M., Shaw, J. S., Squires, J. K.,. & Lipkin, P. H. (2022). Evidence-informed milestones for developmental surveillance tools. Pediatrics, 149(3). American Academy of Pediatrics (AAP). [CrossRef]
Figure 1.
Taylor and Trott’s Pyramid of Learning, (as cited in Williams & Shellenberger, 1996).
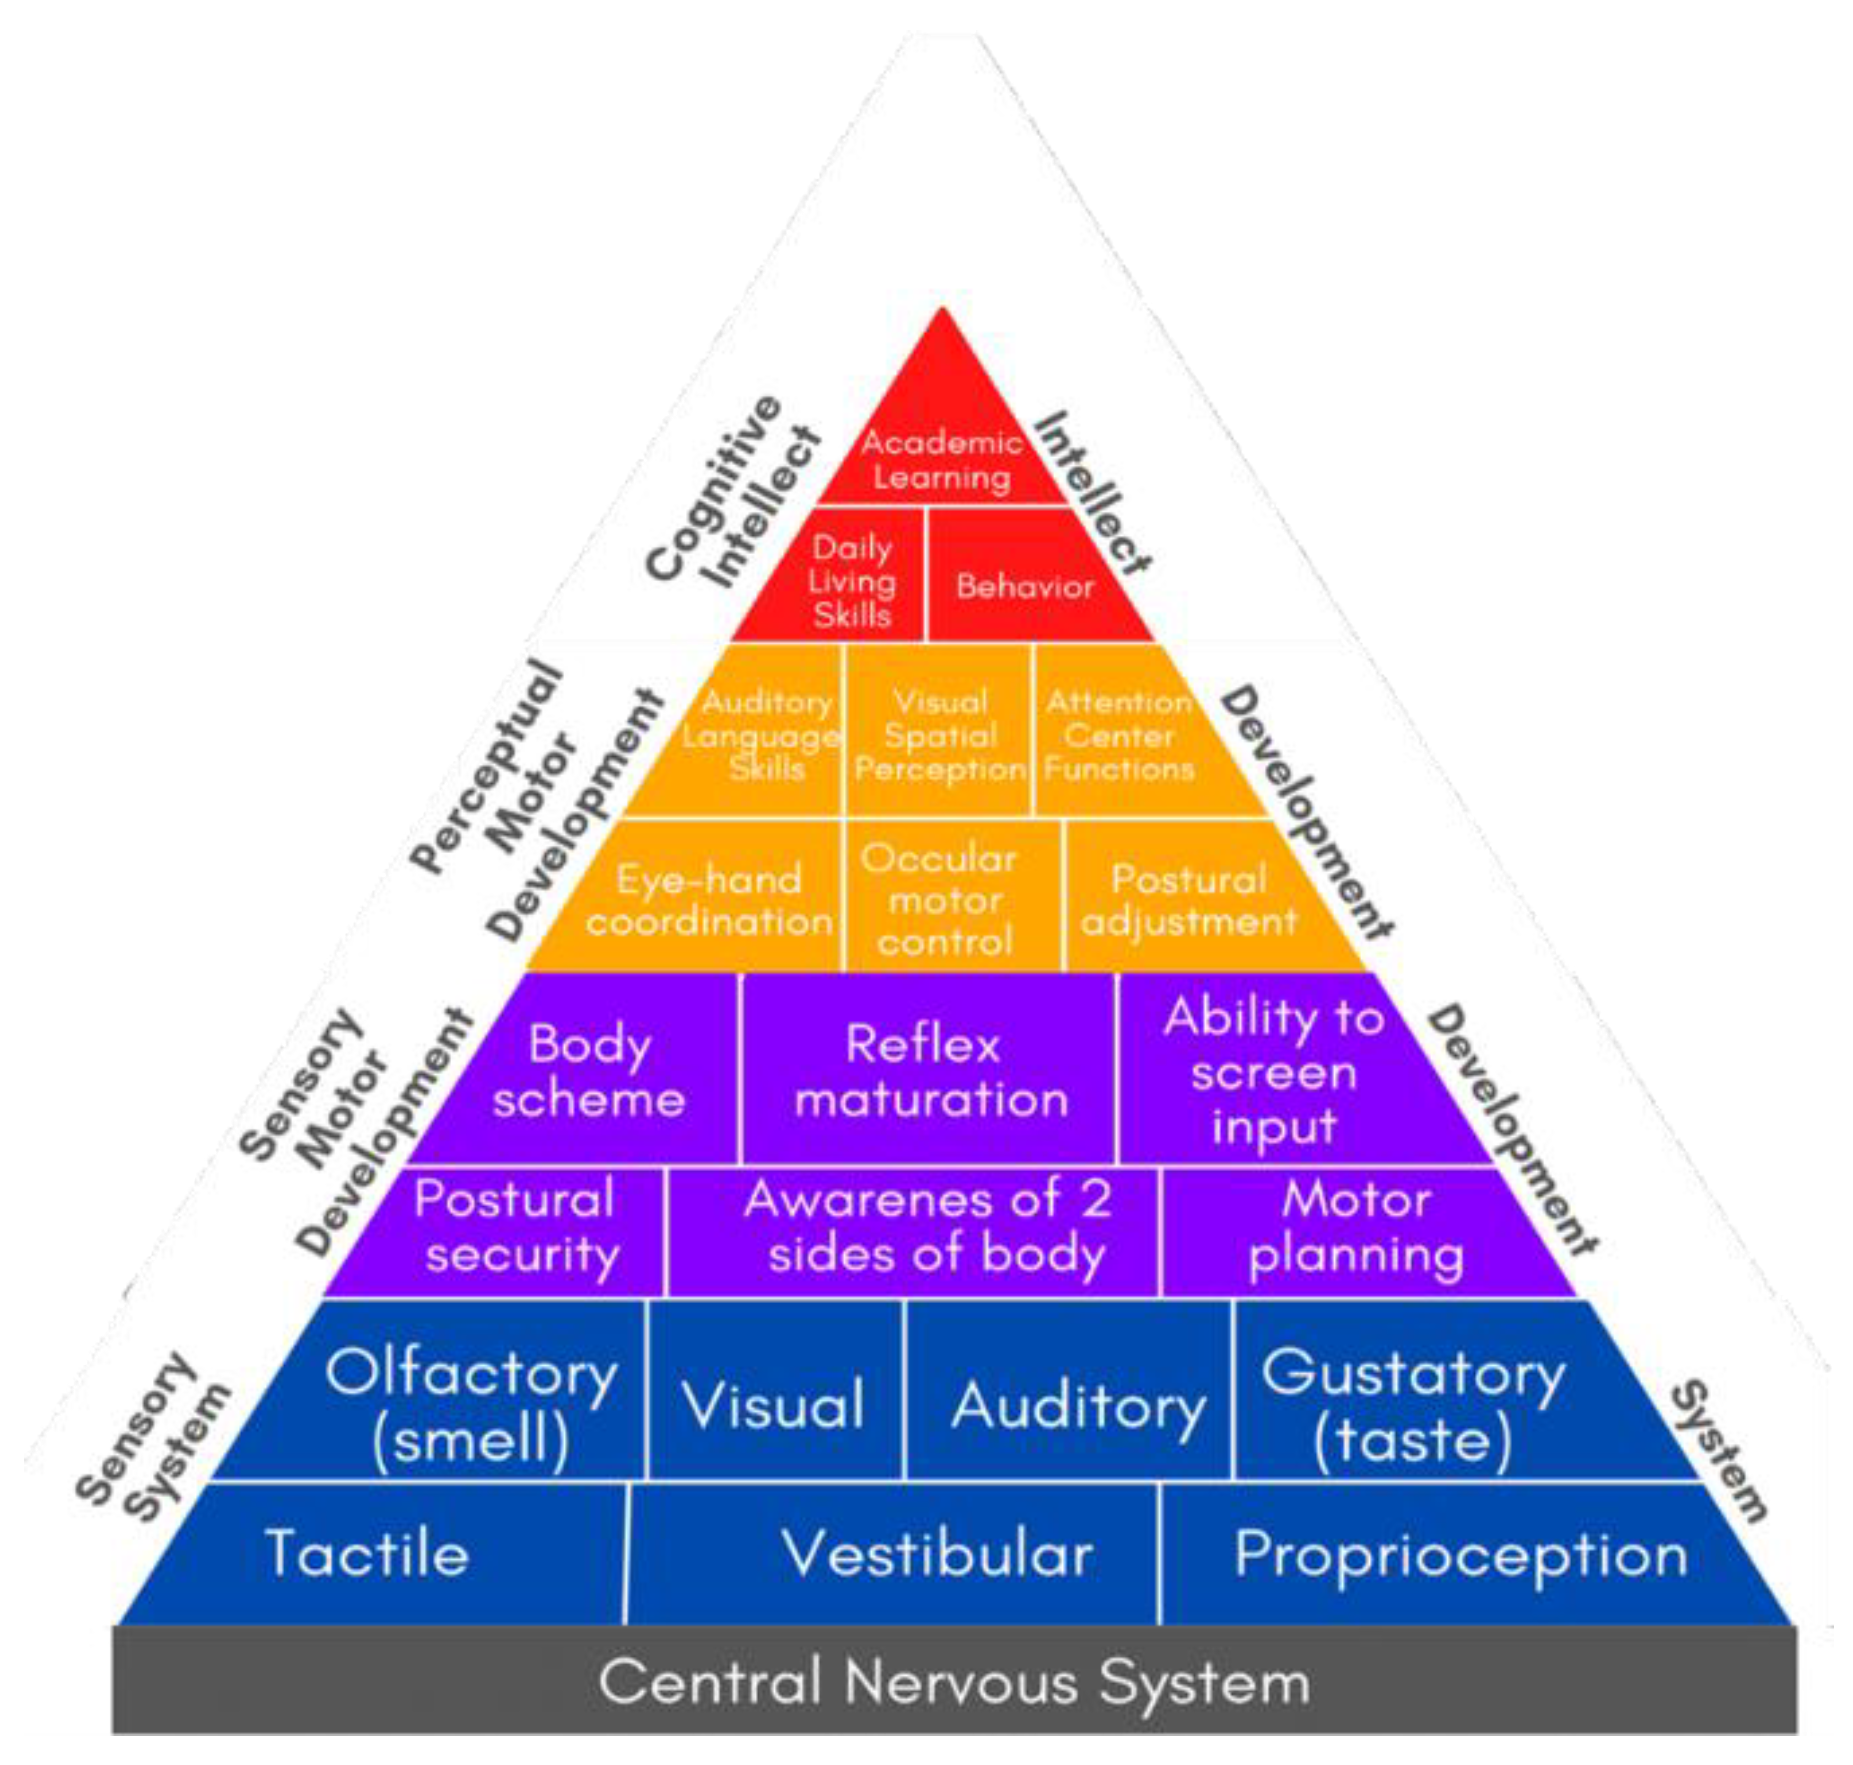
Figure 2.
Radial chart showing an anonymous child’s profile, accentuating areas of strength and weakness.
Figure 2.
Radial chart showing an anonymous child’s profile, accentuating areas of strength and weakness.
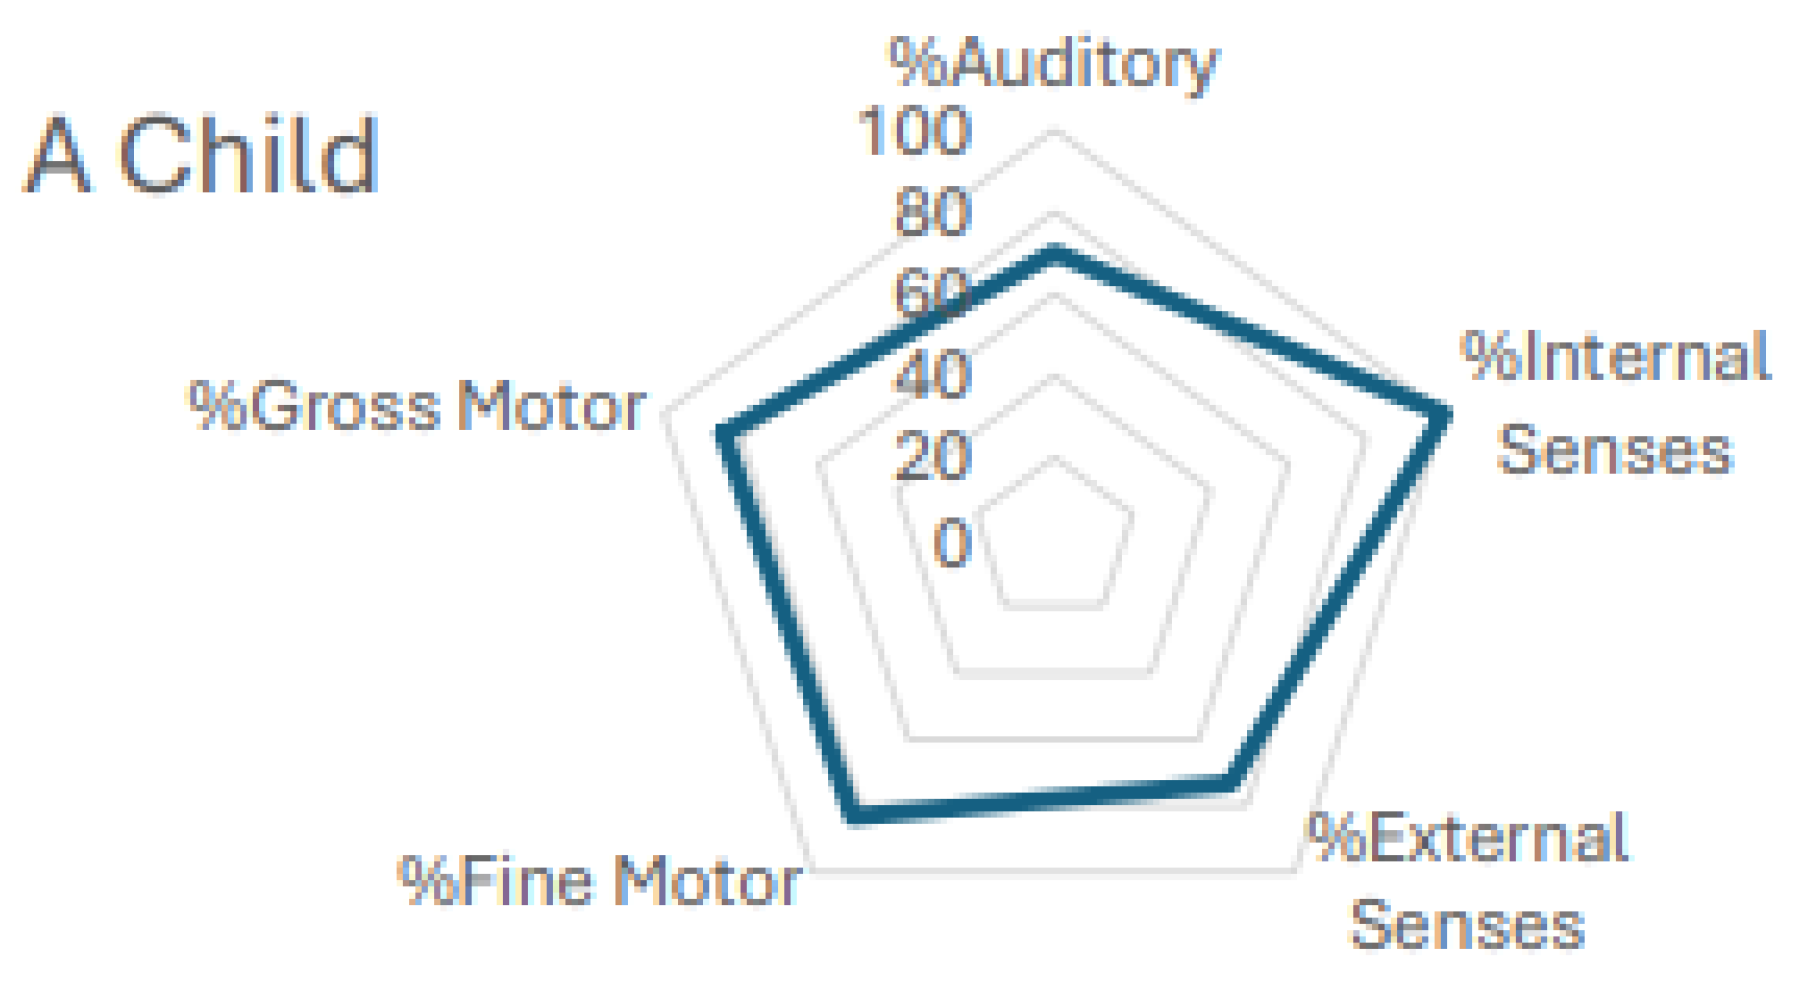
Figure 3.
A flow Diagram to show the Stages of DTP creation. PHASE I Creation – White. PHASE II Pilot – Blue. PHASE III This Study - Green.
Figure 3.
A flow Diagram to show the Stages of DTP creation. PHASE I Creation – White. PHASE II Pilot – Blue. PHASE III This Study - Green.
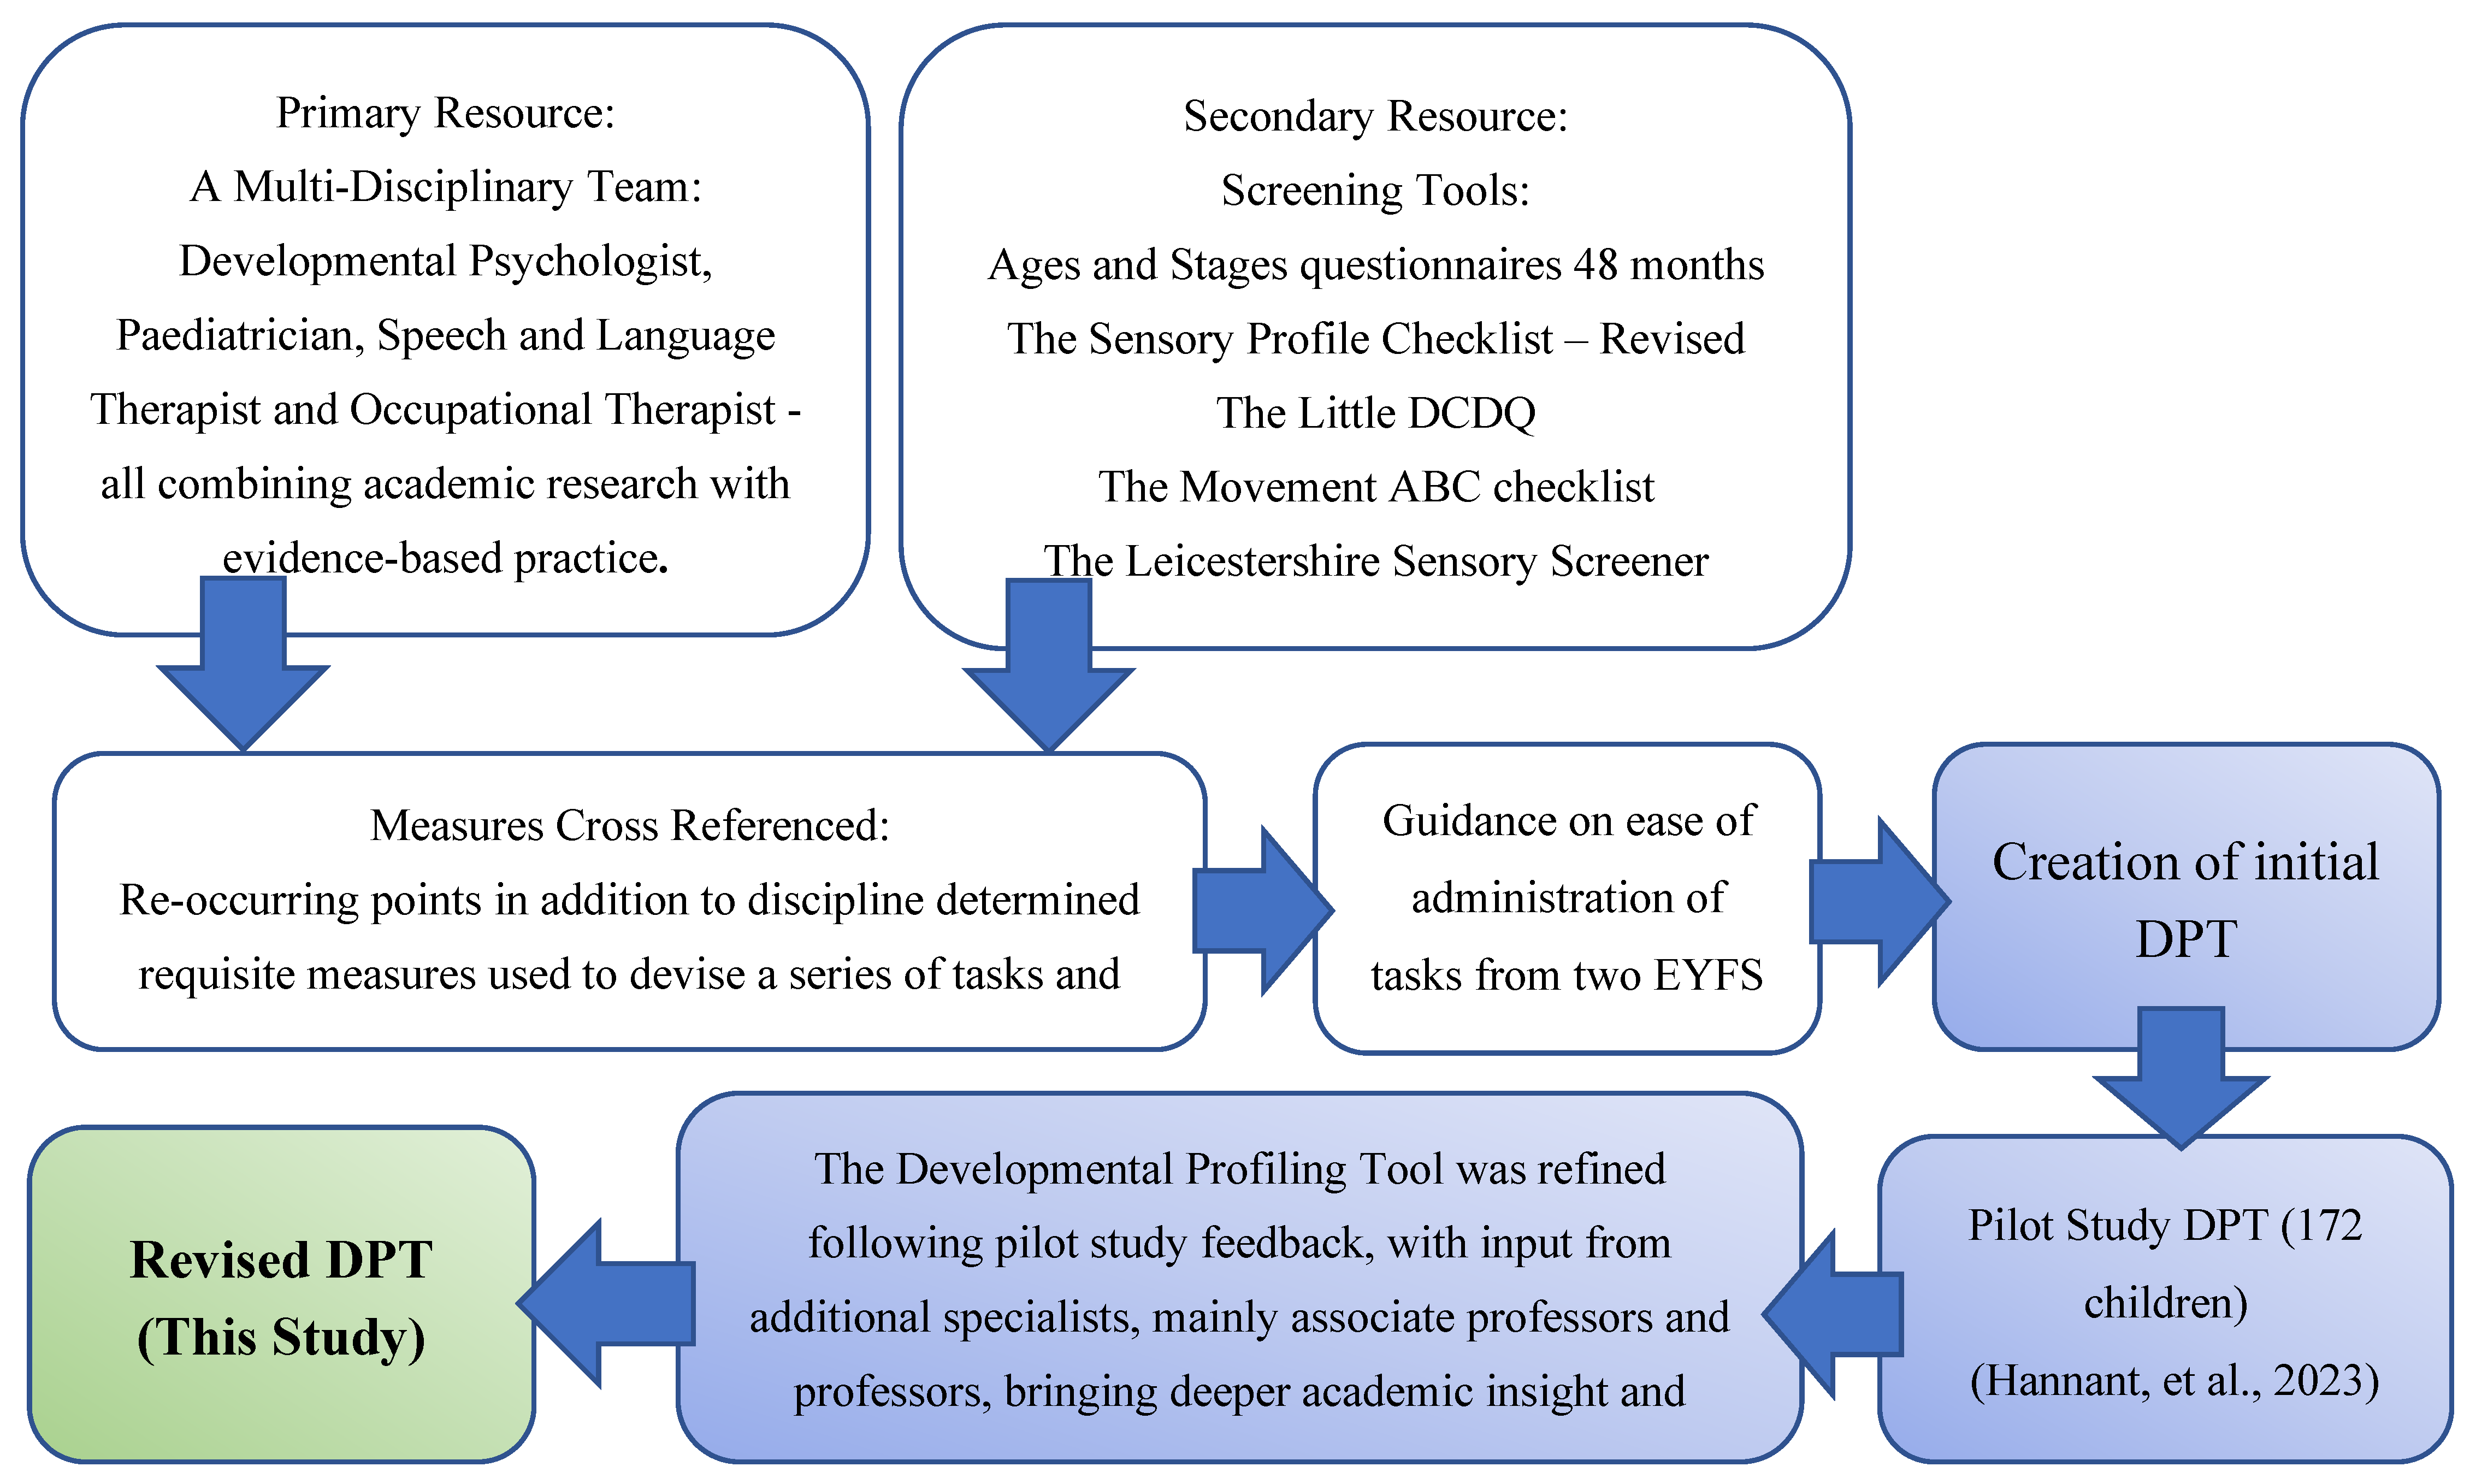
Figure 4.
Tool considered to be the most informative and purposeful to learning by EYFS teachers.
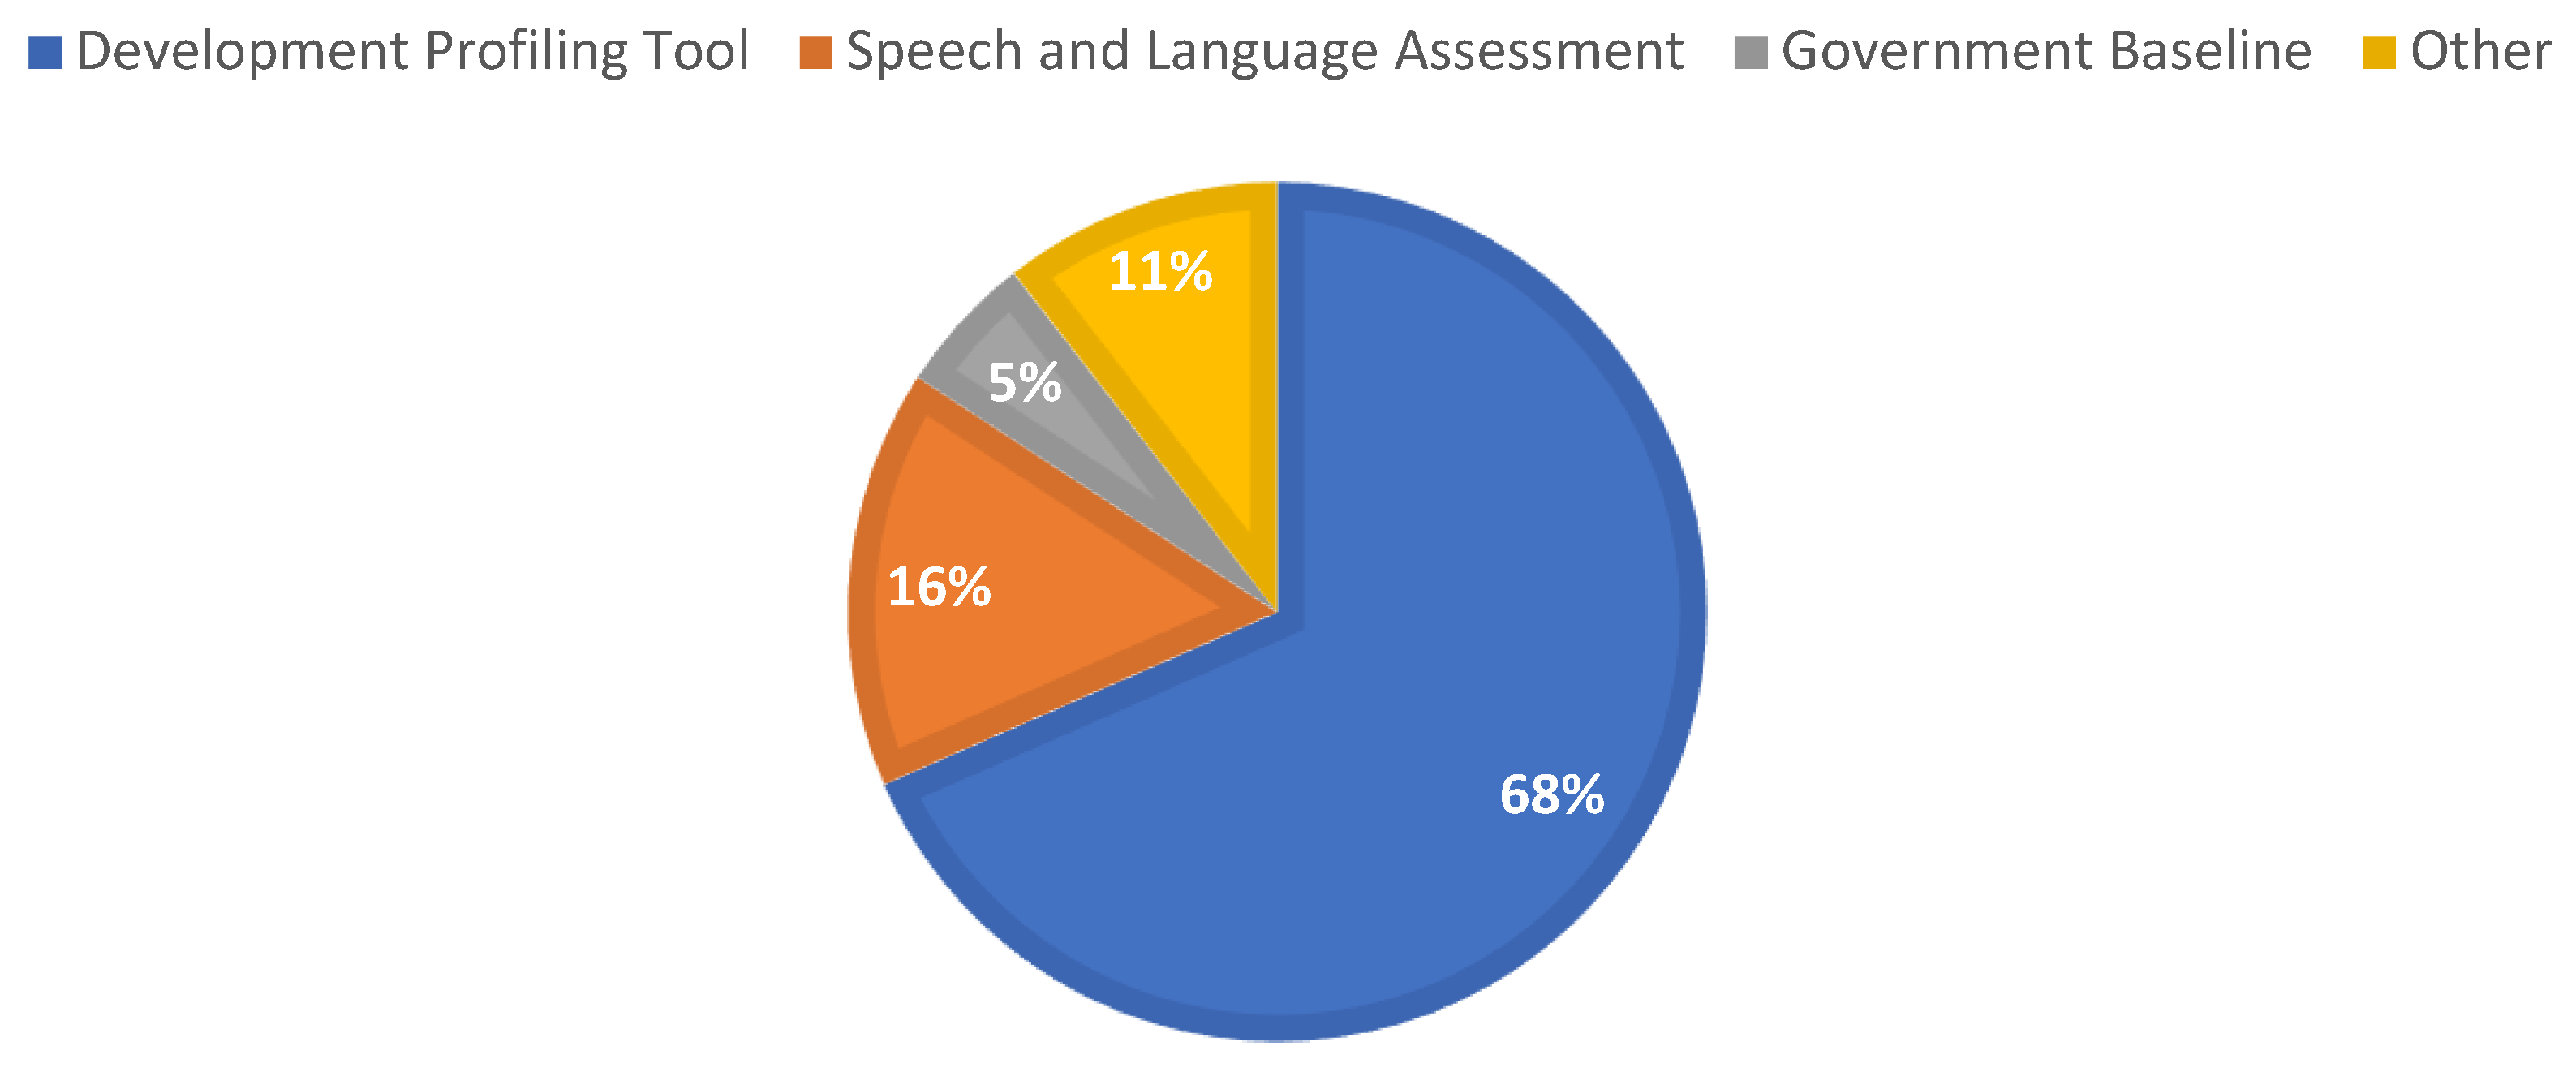
Figure 5.
Example of homoscedasticity (violation from linearity).
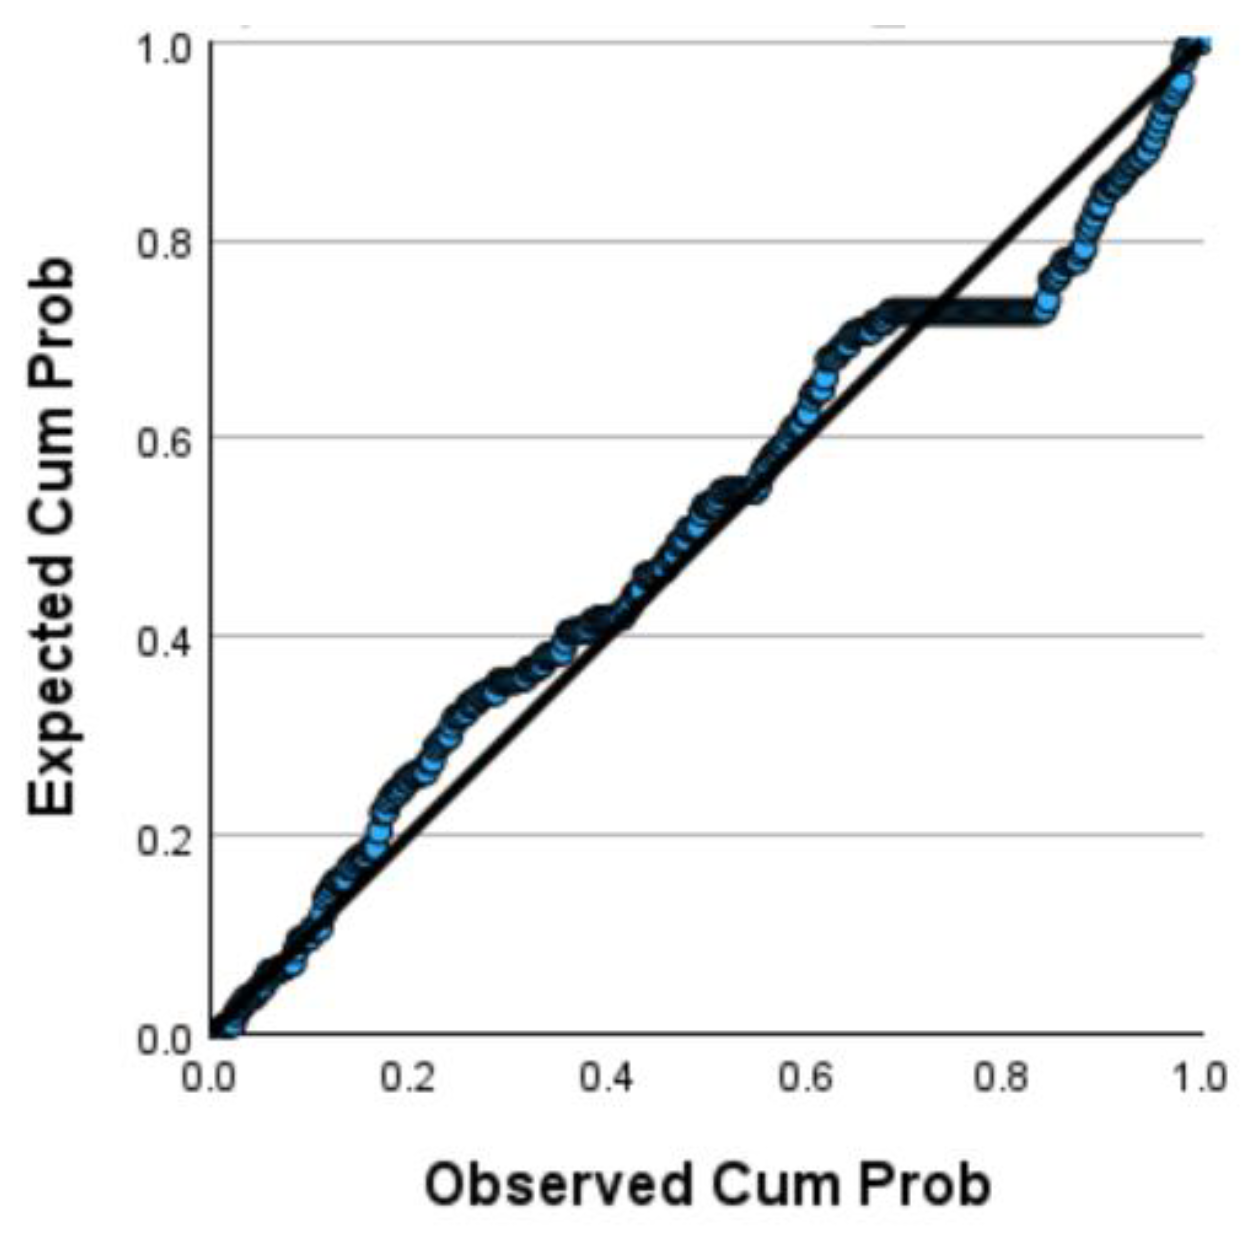

Table 1.
Heritage and gender of reception children aged 51 months to 62 months.
| Heritage | % of children |
|---|---|
| White | |
| English, Welsh, Scottish, Northern Irish or British | 46 |
| Irish | 0 |
| Gypsy or Irish Traveller | 0 |
| Roma | 0 |
| Any other White background | 6 |
| Black | |
| African | 3 |
| Caribbean | 0 |
| Any other Black, Black British, or Caribbean background | 6 |
| Asian or Asian British | |
| Indian | 7 |
| Pakistani | 13 |
| Bangladeshi | 3 |
| Chinese | 3 |
| Any other Asian background | 2 |
| Mixed or Multiple Ethnic Groups | |
| White and Black Caribbean | 0 |
| White and Black African | 1 |
| White and Asian | 3 |
| Any other Mixed or Multiple Ethnic background | 1 |
| Other Ethnic Groups | |
| Arab | 2 |
| Any other ethnic group | 5 |
| Gender | |
| Male | 53 |
| Female | 47 |
Table 2.
Assessments used to validate construct.
| Construct | Parent-reported Questionnaire Measured Against | Psychometrics |
|---|---|---|
| Sensory responsivity | Sensory Profile-2 (Dunn, 2014) | Sample 1,791 children (birth to 14 years) Internal consistency (.60–.90); inter-rater reliability (.49–.89), test-retest reliability (.87–.97), and high content and construct validity (Licciardi & Brown, 2021). |
| Coordination | Little DCDQ (Rihtman et al., 2011) | Sample 353 children (3–4 years) .96 test-retest reliability, .94 internal consistency, and strong construct and concurrent validity (Wilson et al., 2015). |
| Interoception | Questionnaire (Steinhoff, 2024) | Not standardised – no standardised questionnaire availability. |
| Construct | SENCo-reported Assessment | Psychometrics |
| Auditory skills | Speech Discrimination in Noise and Mimicry subtests in the Auditory Skills Assessment (Geffner & Goldman, 2010) | 225 children (3 years 6 months to 4 years 11 months); Internal consistency of .60 and test-retest reliability of .64 Limited Auditory Discrimination Assessment availability. |
| Visual perception | Visual Perception form BEERY VI form (Beery, Buktenica, & Beery, 2010) | High reliability: Cronbach’s alpha for internal consistency at 0.89, test-retest reliability at 0.88, and inter-scorer reliability at 0.93. (Harris et al., 2021). |
Table 3.
Domain ontology for training reflections for educators (EYFS and SENCos) n = 51).
| Thematic Area | First Order Theme | Examples of Comments |
|---|---|---|
| Shifting Perspectives on Learning Barriers | Better Understanding of Barriers to Learning: Reflecting a shift in how educators recognise and interpret developmental challenges. | ‘…a better understanding of why some children have different barriers to learning.’ ‘I found it interesting to see how many barriers to learning there are.’ ‘I’ve spent time reflecting back to children I have taught previously, now recognising those difficulties’ |
| Additional considerations needed when teaching: Highlighting increased awareness of the complexity behind learning and the need for tailored support. | ‘Knowing how much you need to consider when supporting children with their listening skills…’ ‘…how you can’t have one skill without other skills, like building a house.’ ‘Think about each child and how each child can be scaffolded based on fundamental skills,’ |
|
| More confident to identify children with difficulties / delays in development: Indicating growing confidence in recognising early signs of developmental delay. | ‘I am grateful to have joined this training and feel confident and ready to identify and support these early signs within our new Reception intake this year.’ ‘I feel much more confident with the other areas and believe that in the classroom I will be able to see why there are potentially barriers to some children learning.’ ‘It made me think of several children I have known and taught over the years and wished I’d had this training sooner.’ |
|
| Deepening Professional Understanding of Child Development | Able to recount new learning and concepts: Showing internalisation of new developmental knowledge and frameworks. | ‘I was really interested in interception - how children are not aware when they are full or hurt.’ ‘The stages of the pyramid was really interesting to learn about’ ‘The amount of processes and stages required within the body to carry out seemingly simple tasks’ ‘Sensory responses and coordination are the foundations of development.’ ‘…a better understanding of the senses.’ ‘…how the brain and spinal cord work together (Sensory, Relay, and Motor neurons) to build a foundation for movement and coordination.’ |
| Valuable Learning Experience: Demonstrating the perceived relevance and impact of the training on professional practice. | ‘I shall now look closely at each of the pyramid stages when observing and making judgements on a child’s learning. It will impact my teaching going forward as I will be more aware of the classroom setting/environment.’ ‘It would be a valuable learning experience for all colleagues.’ ‘The training is very informative to the initial stages of development which most practitioners are unaware of. This training would be great to share with all staff so that they have a thorough understanding of the underpinning skills that need to be in place in order for children to learn effectively.’ ‘I found the training very interesting and could relate a lot of this to the children.’ |
Table 4.
Domain ontology for DPT reflections for educators (EYFS and SENCos) n = 34).
| Thematic Area | First Order Theme | Examples of Comments |
|---|---|---|
| Reframing Assessment Priorities | Consideration as to what should be assessed at baseline: Reflecting a shift in educators’ thinking about the scope and purpose of baseline assessments. | ‘It has made me reconsider what we should assess during baseline assessments.’ ‘Using the development tool had initially helped with a baseline assessment when the children first started school.’ ‘As a teacher it has made me re-evaluate how we assess children at Baseline, taking more consideration of the children’s development.’ |
| Measurement of the fundamental skills needed to learn: Highlighting increased awareness of developmental foundations that underpin learning readiness. | ‘It has made me more aware of the fundamental developmental skills that children need in order to be able to access education.’ ‘It has given me insight further into the development of the children we have in our EYFS through assessment’ ‘The team were able to raise SEND concerns for some children after completing these assessments’ |
|
| Enhancing Early and Targeted Support | Early intervention is key: Emphasising the value of identifying needs early to enable timely and effective support. | ‘The earlier we learn how a child learns and what barriers they have to learning, the earlier we can intervene.’ ‘We have been able to deliver targeted intervention to children earlier than previous years and use the suggested resources for maximum impact’ ‘It has also helped to support and identify potential SEND monitoring concerns right from when the children start Primary School.’ |
| Tailored intervention: Showing how assessment outcomes informed more targeted, needs-based support strategies. | ‘The development tool has opened our eyes beyond the curriculum to help children through tailored interventions.’ ‘I was able to use the assessment outcomes, in some cases with the whole class, which was incredibly helpful, particularly in guiding our support in gross and fine motor skills, as well as spatial awareness.’ ‘The links once the assessment was completed to further support and resources have been invaluable.’ |
Table 5.
Paired Sample Correlation – Standardised Assessments with DPT.
| Paired Sample (n = 46) | Correlation | Significance One-Side p |
|---|---|---|
| DPT Auditory Skills and ASA Auditory Discrimination | .116 | .22 |
| DPT Auditory Skills and ASA Mimicry | .061 | .35 |
| DPT Internal Senses and SP2 Internal Senses | -.680 | <.001 |
| DPT External Senses and SP2 External Senses | .802 | <.001 |
| DPT Interoception and Interoceptive Skills Questionnaire | -.243 | .05 |
| DPT Visual perception and BEERY VI Visual perception | .463 | <.001 |
| DPT Fine motor skills and DCDQ Fine Motor Skills | .509 | <.001 |
| DPT Gross motor skills and DCDQ Gross Motor Skills | .435 | .001 |
ASA = Auditory Skills Assessment; SP2 = Sensory Profile 2; DCDQ = Little Developmental Coordination Disorder Questionnaire.
Table 6.
Means, Standard Deviations and Intercorrelations Between the seven constructs on the DPT (** = p <.001).
Table 6.
Means, Standard Deviations and Intercorrelations Between the seven constructs on the DPT (** = p <.001).
| Variable | Mean | SD | 1 | 2 | 3 | 4 | 5 | 6 | 7 |
|---|---|---|---|---|---|---|---|---|---|
| 1 DPT Auditory Skills Total | 77.18 | 22.77 | 1 | - | - | - | - | - | - |
| 2 DPT Internal Senses Total | 90.58 | 16.87 | .384** | 1 | - | - | - | - | - |
| 3 DPT Interception Total | 86.24 | 25.03 | .528** | .606** | 1 | - | - | - | - |
| 4 DPT External Senses Total | 87.64 | 21.82 | .477** | .735** | .669** | 1 | - | - | - |
| 5 DPT Visual Perception Total | 79.78 | 30.29 | .535** | .371** | .367** | .391** | 1 | - | - |
| 6 DPT Fine Motor Skills Total | 75.12 | 28.73 | .548** | .478** | .449** | .494** | .665** | 1 | - |
| 7 DPT Gross Motor Skills Total | 84.56 | 22.56 | .432** | .562** | .557** | .603** | .485** | .647** | 1 |
Table 7.
Outcomes from a multiple regression analysis, demonstrating the ability of constructs to predict others.
Table 7.
Outcomes from a multiple regression analysis, demonstrating the ability of constructs to predict others.
| Predicted Construct | Constructs Able to Predict Outcome with Significance | Multiple Regression Analysis Results When Combining All Constructs |
|---|---|---|
| Auditory skills | Interoception, external senses, visual perception and fine motor skills | R=.670, R2= .449 : F(6-291) = 39.55, p<.001 45 % of the variance explained. |
| Internal Senses | Interoception and external senses | R=.763, R2= .583 : F(6-291) = 67.77, p<.001 58% of variance explained |
| Interoception | Auditory skills, internal senses, external senses and gross motor skills | R=.738, R2= .554 : F(6-291) = 57.86, p<.001 55% of variance explained |
| External Senses | Auditory skills, internal senses, interoception and gross motor skills | R=.804, R2= .647 : F(6-291) = 88.79, p<.001 65% of variance explained |
| Visual Perception | Auditory skills and fine motor skills | R=.698, R2= .487 : F(6-291) = 45.98, p<.001 49% of variance explained |
| Fine Motor Skills | Auditory skills, visual perception and gross motor skills | R=.779, R2= .606 : F(6-291) = 74.64, p<.001 61% of variance explained |
| Gross Motor Skills | Interoception, external senses and fine motor skills | R=.743, R2= .552 : F(6-291) = 59.69, p<.001 55% of variance explained |
Table 8.
Paired Sample Correlation – Inter-rater reliability between EYFS teacher and SENCo.
| Paired Sample (5 children, 59 items each: n = 59 for each pair) | Correlation | Significance One-Side p |
|---|---|---|
| School A SENCo _ School A EYFS Teacher | 1 | <001 |
| School B SENCo _ School B EYFS Teacher | .390 | .001 |
| School C SENCo _ School C EYFS Teacher | .894 | <.001 |
| School D SENCo _ School D EYFS Teacher | .331 | .005 |
| School E SENCo _ School E EYFS Teacher | .696 | <.001 |
Table 9.
Shows Cronbach’s alpha scores using KR20 formula for each of the seven constructs in the DPT.
Table 9.
Shows Cronbach’s alpha scores using KR20 formula for each of the seven constructs in the DPT.
| Construct | Items (n) | Cronbach’s alpha | Description. |
|---|---|---|---|
| DPT Auditory Skills | 12 | .835 | Good Internal Consistency |
| DPT Internal Senses | 13 | .810 (.801 before item removed) |
Good Internal Consistency |
| DPT Interoception | 4 | .695 | Acceptable Internal Consistency |
| DPT External Senses | 6 | .715 | Good Internal Consistency |
| DPT Visual Perception | 4 | .743 | Good Internal Consistency |
| DPT Fine Motor Skills | 7 | .796 | Good Internal Consistency |
| DPT Gross Motor Skills | 13 | .837 | Good Internal Consistency |
Disclaimer/Publisher’s Note: The statements, opinions and data contained in all publications are solely those of the individual author(s) and contributor(s) and not of MDPI and/or the editor(s). MDPI and/or the editor(s) disclaim responsibility for any injury to people or property resulting from any ideas, methods, instructions or products referred to in the content. |
© 2025 by the authors. Licensee MDPI, Basel, Switzerland. This article is an open access article distributed under the terms and conditions of the Creative Commons Attribution (CC BY) license (http://creativecommons.org/licenses/by/4.0/).
Copyright: This open access article is published under a Creative Commons CC BY 4.0 license, which permit the free download, distribution, and reuse, provided that the author and preprint are cited in any reuse.


