2. Materials and Methods
2.1. Ethics Statements
Ethical approval for this study was obtained from the Institutional Bioethics Committee of Konkuk University (IRB, project number: 7001355-202404-HR-788) in May 2024, in compliance with the Declaration of Helsinki.
2.2. Study Design
This study employs a cross-sectional survey design to explore the mediating role of the human-animal bond in the relationship between depression and subjective well-being, as well as the moderating effect of pet attachment.
The survey included validated scales to measure depression, subjective well-being, the human-animal bond, and pet attachment. Participation in the study was voluntary, and informed consent was obtained electronically before participants accessed the questionnaire. The use of an online survey ensured accessibility and convenience for participants, while also facilitating the collection of a diverse sample. Statistical analyses, including mediation and moderation analyses, were per-formed to test the proposed hypotheses and examine the relationships among variables.
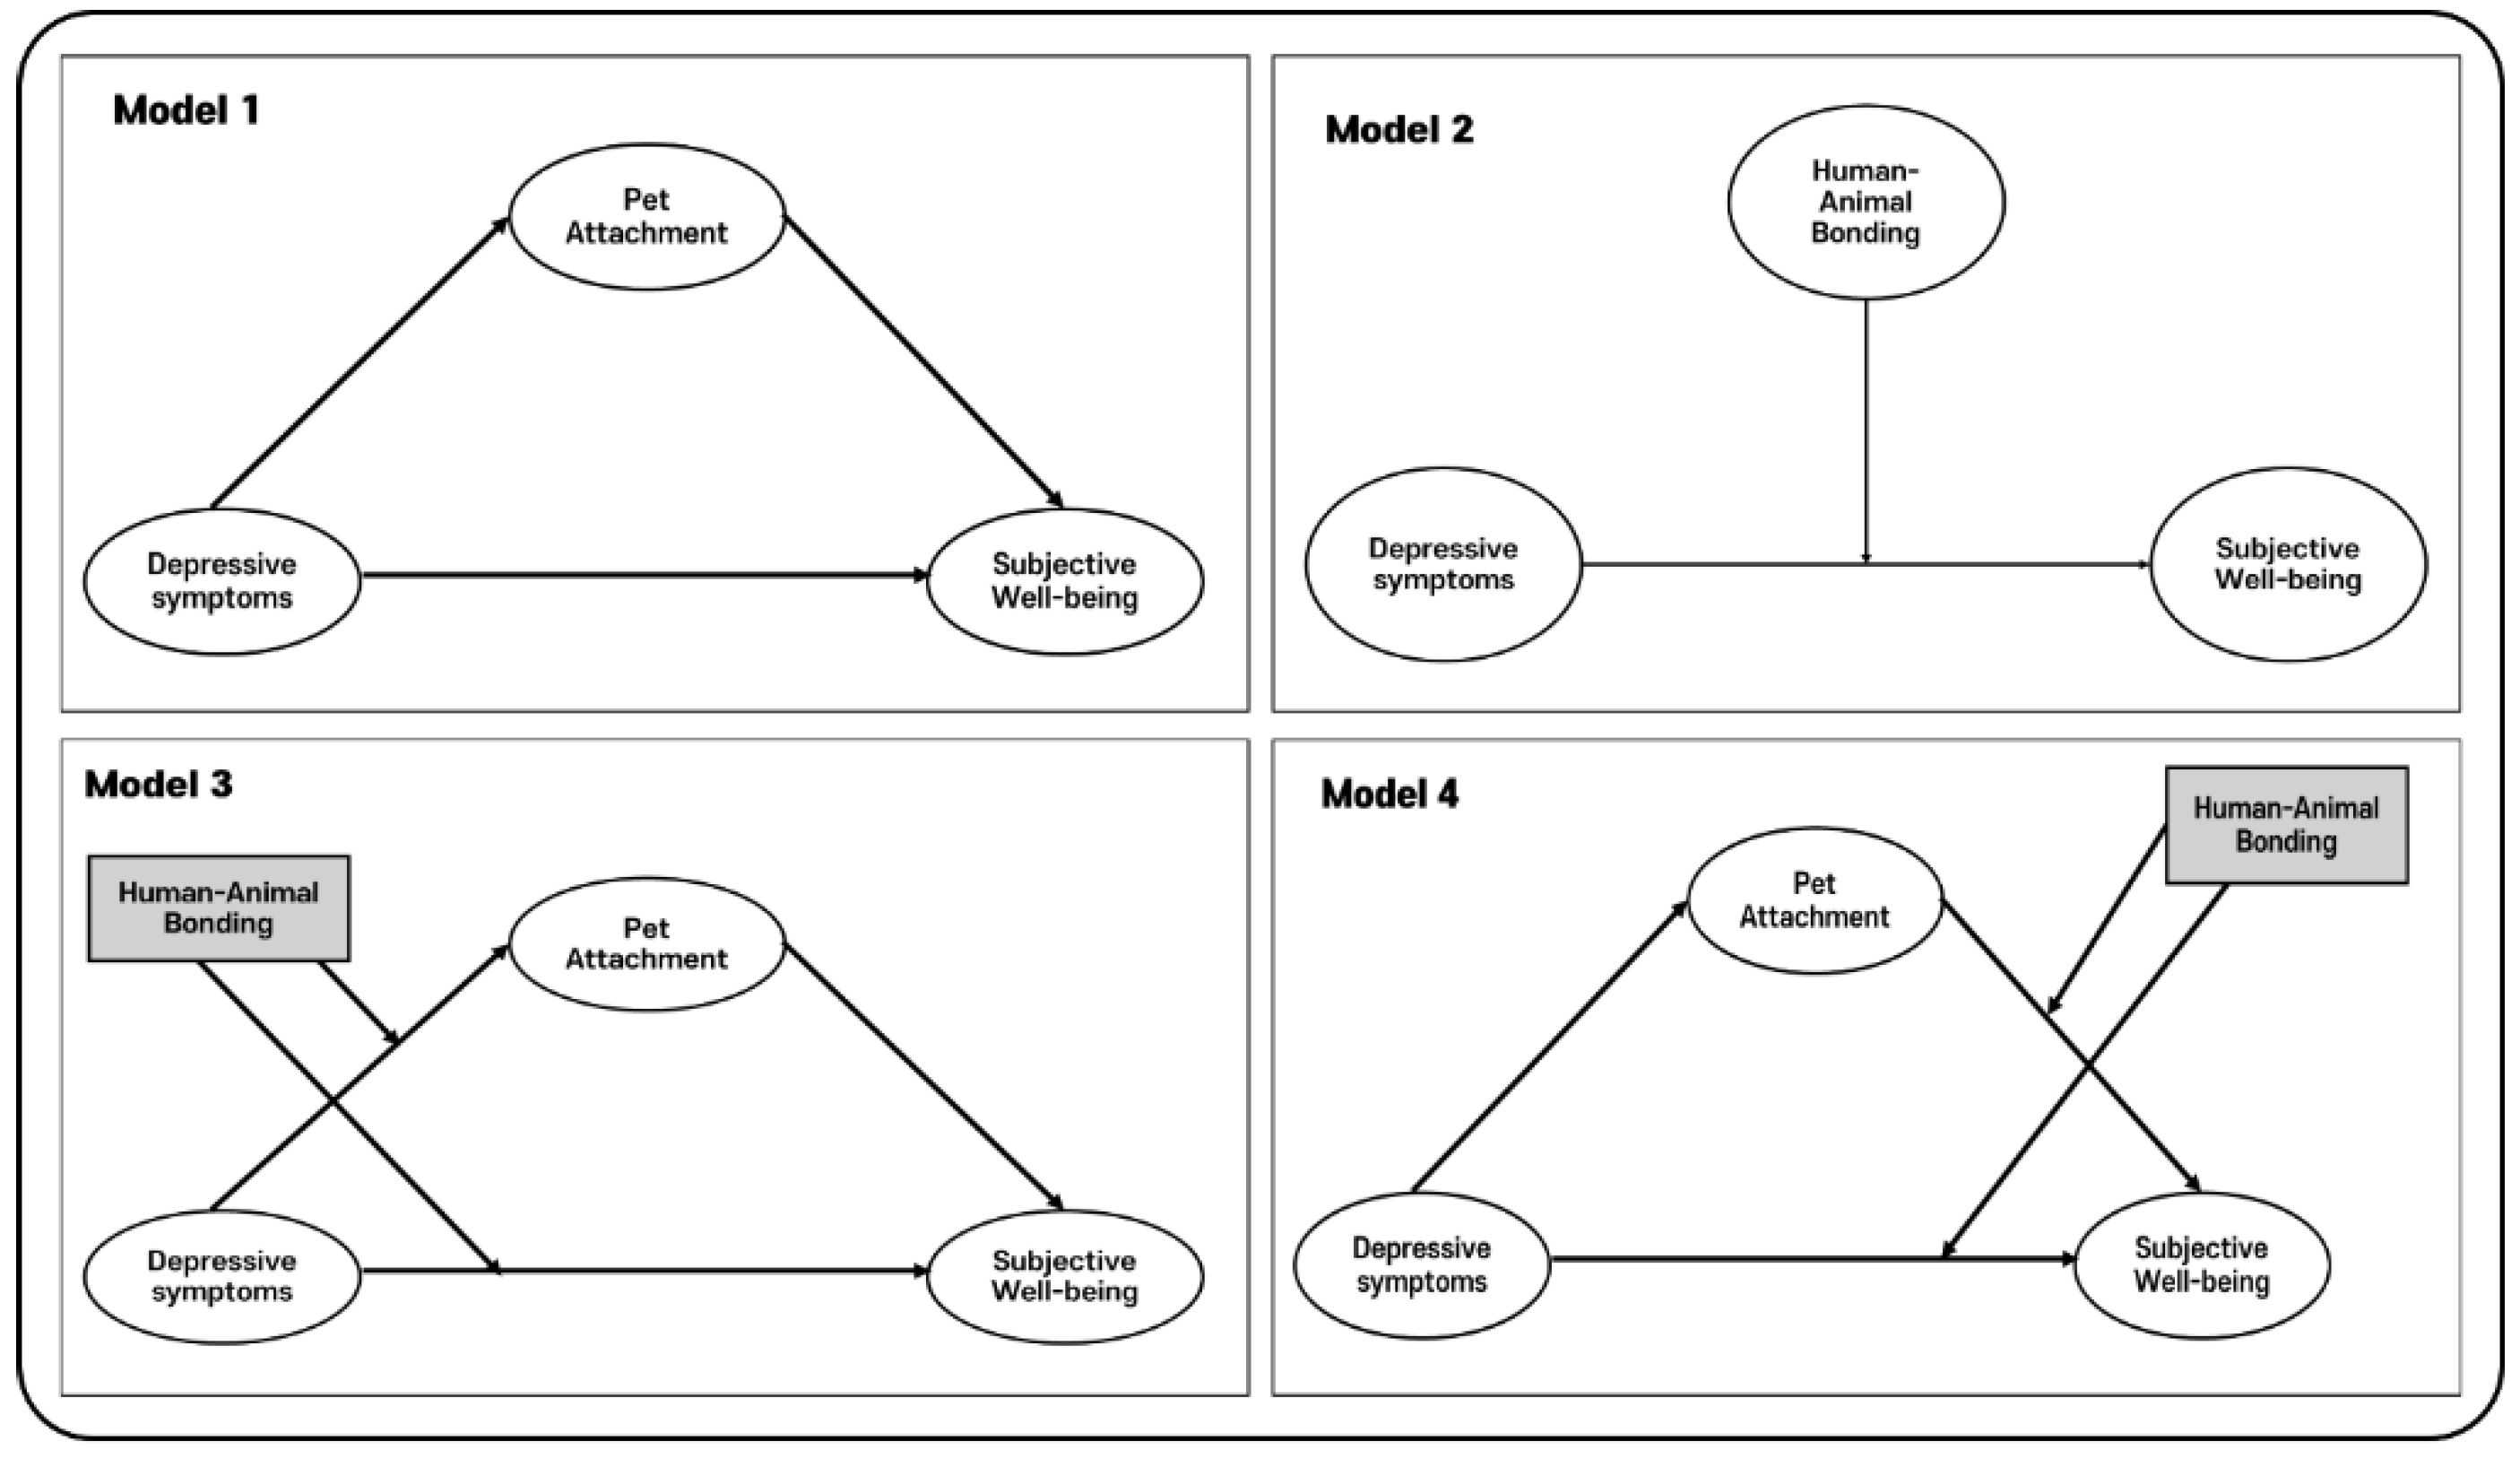
The research model is as follows. (
Figure 1)
H1: There is a negative association between depressive symptoms and subjective well-being.
H2: The human-animal bond mediates the relationship between depressive symptoms and subjective well-being.
H3: Pet attachment moderates the relationship between depressive symptoms and the human-animal bond.
H4: Pet attachment moderates the indirect effect of depressive symptoms on subjective well-being via the human-animal bond.
2.3. Data Collection
Data were collected through an online survey conducted on May 21, 2024. The survey targeted individuals aged 20 years or older residing in the Seoul metropolitan area of South Korea, which includes Seoul, Gyeonggi Province, and the city of Incheon. Participants were recruited through the researcher’s personal blog and Instagram account. A total of 400 responses were collected on the same day, and after excluding incomplete responses, 391 valid responses were included in the final analysis.
2.4. Participants
The study participants consisted of 391 adults aged 20 years or older who reside in the Seoul metropolitan area, including Seoul, Gyeonggi Province, and the city of Incheon. All participants were pet owners, owning animals such as dogs or cats. The sample was diverse in terms of demographic characteristics, which were analyzed to ensure representativeness within the target population.
2.5. Measures
This study employed four measurement tools to assess various psychological and behavioral con-structs relevant to its objectives.
The Center for Epidemiologic Studies Depression Scale (CES-D), developed by Radloff[
51] and validated in Korean by Jeon[
52], was employed to assess depressive symptoms among the study participants. This scale is a widely recognized tool for evaluating the prevalence and severity of depressive symptoms across diverse populations.
The Lexington Attachment to Pets Scale (LAPS), originally developed by Johnson[
53], was used in a modified format to evaluate attachment to companion animals. The re-vised version, which was translated into Korean by Sung and Han[
4], consisted of 18 items categorized into two subfactors: General Attachment and People Substituting.
The Companion Animal Bonding Scale (CABS), originally developed by Poresky[
54], was utilized to measure the emotional bond between humans and their companion animals. The scale has been widely used in previous studies and was translated into Korean for this research to ensure cultural appropriateness.
Finally, the Concise Measure of Subjective Well-Being (COMOSWB), developed by Seo and Koo[
55], was employed to measure subjective well-being. This tool provides a com-prehensive yet concise assessment of well-being, making it particularly appropriate for this study.
All instruments were selected for their established validity and cultural adaptability, ensuring reliable and relevant measurements within the context of this research. Responses for each item were recorded on a 5-point Likert scale, ranging from 1 (never felt) to 5 (always felt), with higher scores indicating greater levels of the measured construct.
2.6. Statistical Analysis
In this study, frequency analysis and descriptive statistics were conducted to evaluate the characteristics of the sample and identify trends in the key variables (depressive symptoms, attachment to pets, human-animal bond, and subjective well-being). Descriptive statistics included means (M), standard deviations (SD), skewness, and kurtosis to assess the normality of the data and determine whether it met the assumptions of a normal distribution. Pearson correlation analysis was used to examine the relationships among the key variables.
To determine control variables for the mediation, moderation, and moderated mediation analyses, independent sample t-tests and one-way ANOVA were conducted. For significant group differences, Scheffé's post-hoc test was used. If the assumption of homogeneity of variance was violated, Welch's ANOVA and Games-Howell post-hoc tests were applied. Finally, simple and multiple linear regression analyses identified significant control variables, such as education level and income status. Only significant variables were presented in the tables and results to ensure clarity and focus.
To assess the significance of mediation, moderation, and moderated mediation effects while controlling for relevant variables, Hayes's[
56] analytical framework was applied. The analyses were conducted using SPSS Process Macro version 4.2 with 5,000 bootstrap samples.
Mediation analysis used Model 4, moderation analysis applied Model 1, and moderated mediation analysis employed Models 8 and 15.
The significance of indirect and moderation effects was evaluated using 95% confidence intervals (CIs), with effects deemed significant if the CIs excluded zero[
57]. The Johnson-Neyman technique was also applied to explore moderation effects, identifying thresholds where the human-animal bond significantly moderated the relationships.
To facilitate the interpretation of interaction effects and reduce correlations between variables, all independent and control variables were mean-centered. Bootstrapping was employed to overcome the limitations of traditional methods such as the Sobel test and to avoid reliance on normality assumptions.
3. Results
3.1. Frequency Analysis
To analyze differences in human-animal bonding, depressive symptoms, subjective well-being among pet owners, frequency analysis was conducted on the demographic characteristics of 391 participants. (
Table A1)
Of the respondents, 65% were female, and 35% were male. Most participants were in their 30s (47.8%) or 20s (31.2%), with 79% aged under 40. Regarding education, 61.1% held a bachelor's degree or higher. Employment status showed 38% were employed, 17.1% self-employed, and 4.9% students. Income data revealed 85.2% had an income, with 39.1% earning $2,000–$3,000 monthly. Marital status indicated 69.1% were unmarried.
For pet ownership, 70.1% owned dogs, 26.9% cats, and 3.1% both. First-time pet owners accounted for 75.4%, and 87.5% owned one pet. Most pets were aged 3–6 years (43.7%), and 40.2% of participants had owned their pets for 3 years or less.
In this study, only statistically significant demographic variables are reported in the table and text to ensure clarity and focus on meaningful findings.
3.2. Reliability and Validity of Psychometric Scales
To assess the reliability of the measurement scales, Cronbach’s α coefficients were calculated for each scale (
Table 1 and
Table 2).
The results indicated satisfactory internal consistency across all measures. The Companion Animal Bonding Scale (CABS) demonstrated a Cronbach’s α coefficient of 0.829, reflecting strong internal consistency.
The Center for Epidemiologic Studies Depression Scale (CES-D) exhibited exceptionally high reliability, with a Cronbach’s α coefficient of 0.971.
The Lexington Attachment to Pets Scale (LAPS) showed an overall Cronbach’s α coefficient of 0.914, with subfactor reliabilities of 0.868 for General Attachment and 0.799 for People Substituting. Confirmatory factor analysis (CFA) for the LAPS revealed a robust model fit, with CFI = 0.966, TLI = 0.961, RMSEA = 0.041, and SRMR = 0.034, all meeting the recommended thresholds.
Lastly, the Concise Measure of Subjective Well-Being (COMOSWB) demonstrated strong reliability, with a Cronbach’s α coefficient of 0.867. Collectively, these findings confirm the reliability and validity of the scales utilized in this study.
3.3. Descriptive Statistics
The results, summarized in
Table 3, provide a detailed overview of the distribution and variability of the variables included in the study (n = 391). (
Table 3)
For the independent variable, depressive symptoms, the mean (M) was 1.759, the standard deviation (SD) was 0.837, with skewness and kurtosis values of 1.763 and 2.114, respectively. Similarly, the mediating variable (pet attachment) had an M of 4.275 and an SD of 0.517, with skewness and kurtosis values of -2.157 and 6.567. The moderating variable (human-animal bonding) showed an M of 4.279 and an SD of 0.538, with skewness and kurtosis values of -1.720 and 3.924. Among the control variables, education level had an M of 2.504 and an SD of 0.787, with skewness and kurtosis values of -0.837 and -0.402, while income status had an M of 1.852 and an SD of 0.356, with skewness and kurtosis values of -1.986 and 1.956. The dependent variable, subjective well-being, showed an M of 4.263 and an SD of 0.563, with skewness and kurtosis values of -2.096 and 5.304.
The results satisfied the assumption of normality, as all absolute skewness and kurtosis values were within Kline's[
58] recommended thresholds of < 3.0 and < 7.0, respectively.
3.4. Pearson Correlation Analysis of Variable Relationships
Table 4 presents a correlation matrix examining the relationships among psychological, behavioral, and environmental constructs related to human-animal bonding and well-being (n = 391). Correlation coefficients are reported with significance levels (*p < .05, **p < .01, ***p < .001). (
Table 4)
Depressive symptoms were negatively correlated with pet attachment (r = −0.581, p < .001), hu-man-animal bonding (r = −0.461, p < .001), and subjective well-being (r = −0.619, p < .001). These results indicate that higher levels of depressive symptoms are associated with lower levels of pet attachment, human-animal bonding, and subjective well-being.
Pet attachment exhibited strong positive correlations with human-animal bonding (r = 0.774, p < .001) and subjective well-being (r = 0.761, p < .001), suggesting that stronger attachment to pets is linked to greater well-being and stronger bonds with animals. Additionally, pet attachment was positively associated with education level (r = 0.183, p < .01) and income status (r = 0.176, p < .001).
Human-animal bonding was positively correlated with subjective well-being (r = 0.730, p < .001) and showed smaller but significant positive correlations with education level (r = 0.193, p < .001) and income status (r = 0.124, p < .05).
Education level was positively associated with income status (r = 0.377, p < .01). However, its relationships with depressive symptoms (r = 0.090) and subjective well-being (r = 0.074) were not statistically significant. Income status, on the other hand, was positively correlated with subjective well-being (r = 0.188, p < .01), while its association with depressive symptoms (r = 0.010) was negligible.
Overall, the findings underscore the critical role of pet attachment and human-animal bonding in promoting subjective well-being and mitigating depressive symptoms. These constructs are also meaningfully associated with socioeconomic factors such as education and income.
3.5. Mean Difference Analysis by Demographic Characteristics
3.5.1. Association Between Demographic Variables and Depressive Symptoms
The analysis reveals significant differences in pet attachment across demographic variables. (
Table 5)
Females reported higher depressive symptoms than males (t = -3.385, p = 0.001). Age groups also showed significant differences (F = 15.604, p = 0.001), with individuals aged 30–49 reporting higher symptoms than those aged 20–29 or 50–59.
Occupational status influenced depressive symptoms (F = 10.084, p = 0.001), with unemployed individuals reporting higher symptoms than students and office workers. Marital status was significant, as married individuals reported higher symptoms than singles (t = 2.312, p = 0.022).
Monthly income was associated with depressive symptoms (F = 7.599, p = 0.001). Those earning less than $1,500 reported higher symptoms compared to higher income groups. Pet ownership experience also mattered, as first-time pet owners reported higher symptoms (t = 2.866, p = 0.005). Additionally, individuals with younger pets (<3 years) or shorter ownership durations (<3 years) re-ported higher symptoms (F = 15.352, p = 0.001).
In summary, gender, age, occupation, marital status, income, and pet-related factors significantly influence depressive symptoms, emphasizing the need for targeted mental health interventions.
3.5.2. Association Between Demographic Variables and Pet Attachment
The findings demonstrate notable variations in subjective well-being based on demographic factors. (
Table 6)
Females reported higher attachment than males (t = −4.183, p = .001). Age groups showed differences (F = 3.001, p = .034), with individuals aged 20–29 reporting higher attachment than those aged 40–49.
Education level was significant (F=3.526, p=0.022), as undergraduate degree holders showed higher attachment than those with a high school education. Income status (t = −2.230, p = .029) and monthly income (F = 4.289, p = .007) influenced attachment, with those earning $1,500–$2,000 showing higher attachment than lower-income groups.
Pet age also mattered (F = 3.008, p = .036), as individuals with pets under three years old reported higher attachment than those with pets aged 7–9 years.
In summary, gender, age, education, income, and pet-related factors significantly influence pet attachment.
3.5.3. Association Between Demographic Variables and Human-Animal Bond
Significant disparities in subjective well-being were observed across demographic categories. (
Table 7)
Females reported significantly higher levels of human-animal bond than males (t = -3.385, p = .001). Age differences were significant (F = 4.552, p = .005), with individuals aged 20–29 years reporting higher bond scores than those in older age groups. Educational attainment also showed a significant effect (F = 4.639, p = .007); participants with undergraduate degrees reported higher bond scores compared to those with lower education levels. Marital status was significant, with single individuals reporting higher levels of human-animal bond than married individuals (t = -3.148, p = .002). Monthly income differences were observed (F = 3.818, p = .012), with those earning $1,500–$2,000 per month reporting higher bond scores than other income groups.
Pet ownership experience was significant, as individuals with experience owning more than one pet reported higher bond scores than first-time owners (t = -2.079, p = .038). Pet age also influenced the human-animal bond (F = 3.804, p = .014), with those whose pets were 4 to 6 years old reporting higher bond scores than those with younger pets. Similarly, the duration of pet ownership was significant (F = 3.986, p = .009), with individuals who had owned their pets for 4 to 6 years reporting higher bond scores than those with shorter durations. These findings highlight the importance of both demographic and pet-related factors in shaping the strength of the human-animal bond.
3.5.4. Association Between Demographic Variables and Subjective Well-Being
The results in
Table 8 reveal significant differences in subjective well-being across various demographic and contextual factors. (
Table 8)
Gender differences were evident, with females reporting significantly higher well-being scores compared to males (t = -3.593, p < .001). Age also played a significant role (F = 6.355, p < .001), where individuals aged 20–29 years exhibited the highest well-being, followed by a gradual decline in older age groups.
Occupational status influenced well-being (F = 3.749, p = .015), with self-employed individuals scoring higher than students and unemployed individuals. Marital status was also significant, with single individuals reporting higher well-being compared to married individuals (t = -2.320, p = .021). Income level showed notable differences (F = 7.652, p < .001), where those earning $1,500–$2,000 reported the highest well-being.
Pet ownership experience and pet-related factors significantly impacted well-being. Second-time pet owners reported higher well-being compared to first-time owners (t = -3.423, p < .001). Pet age (F = 5.807, p < .001) and ownership duration (F = 7.300, p < .001) also contributed, with older pets (4–6 years) and longer ownership durations (>10 years) associated with higher scores. These findings underscore the multifaceted nature of subjective well-being and its associations with demographic and contextual variables.
3.6. Analysis of Relationships Among Key Variables
3.6.1. Relationship Between Depressive Symptoms and Pet Attachment
Table 9 presents the results of a simple linear regression analysis examining the effect of depressive symptoms on pet attachment. (
Table 9).
The regression model reveals a statistically significant relationship between depressive symptoms and pet attachment, supported by the F-statistic (F = 197.887, p < .001).
The unstandardized coefficient (B = −0.358, SE = 0.025) indicates that a one-unit increase in de-pressive symptoms is associated with a 0.358-unit decrease in pet attachment. The standardized co-efficient (β = −0.581) demonstrates a strong negative relationship between the two variables. Furthermore, the t-value (t = −14.067, p< .001) confirms the statistical significance of depressive symptoms as a predictor variable. The coefficient of determination (R2 = 0.211) indicates that 21.1% of the variance in pet attachment is explained by depressive symptoms.
3.6.2. Relationship Between Depressive Symptoms and Subjective Well-Being
Table 10 presents the results of a simple linear regression analysis examining the effect of depressive symptoms on subjective well-being. (
Table 10)
The regression model indicates a statistically significant relationship, as evidenced by the F-statistic (F = 241.964, p < .001).
The unstandardized coefficient (B = −0.417, SE = 0.027) suggests that a one-unit increase in depressive symptoms is associated with a 0.417-unit decrease in subjective well-being. The standardized coefficient (β = −0.619) demonstrates a strong negative relationship between depressive symptoms and subjective well-being. The t-value (t = −15.555, p < .001) confirms the statistical significance of the predictor variable. The coefficient of determination (R2 = 0.382) indicates that 38.2% of the variance in subjective well-being is explained by depressive symptoms.
3.6.3. Multiple Linear Regression Analysis of the Effects of Depressive Symptoms, Pet Attachment, and Human-Animal Bond on Subjective Well-Being
Table 11 presents the results of a multiple linear regression analysis examining the effects of depressive symptoms, pet attachment, and the human-animal bond on subjective well-being, controlling for demographic and pet-related factors. (
Table 11)
The results indicated that depressive symptoms were significantly associated with lower subjective well-being (β = 0.340, p < .001). Pet attachment demonstrated a significant negative relationship with subjective well-being (B = −0.158, β = −0.234, p < .001), whereas the human-animal bond exhibited a significant positive effect (B = 0.372, β = 0.341, p < .001).
Among demographic variables, only education level (B = −0.059, β = −0.082, p = .012) and income status (B = 0.202, β = 0.127, p = .001) emerged as significant predictors of subjective well-being. Other demographic factors, including gender, age group, occupation, marital status, and monthly income, were not significantly associated with subjective well-being (all p > .05).
None of the pet-related factors—pet ownership experience, pet age, or duration of pet ownership—showed significant effects on subjective well-being (all p > .05).
The model accounted for 69.0% of the variance in subjective well-being (adjusted R² = 0.690), with no evidence of multicollinearity or autocorrelation (Durbin–Watson = 1.867). Collectively, these findings underscore the critical roles of depressive symptoms, pet attachment, and the human-animal bond in shaping subjective well-being.
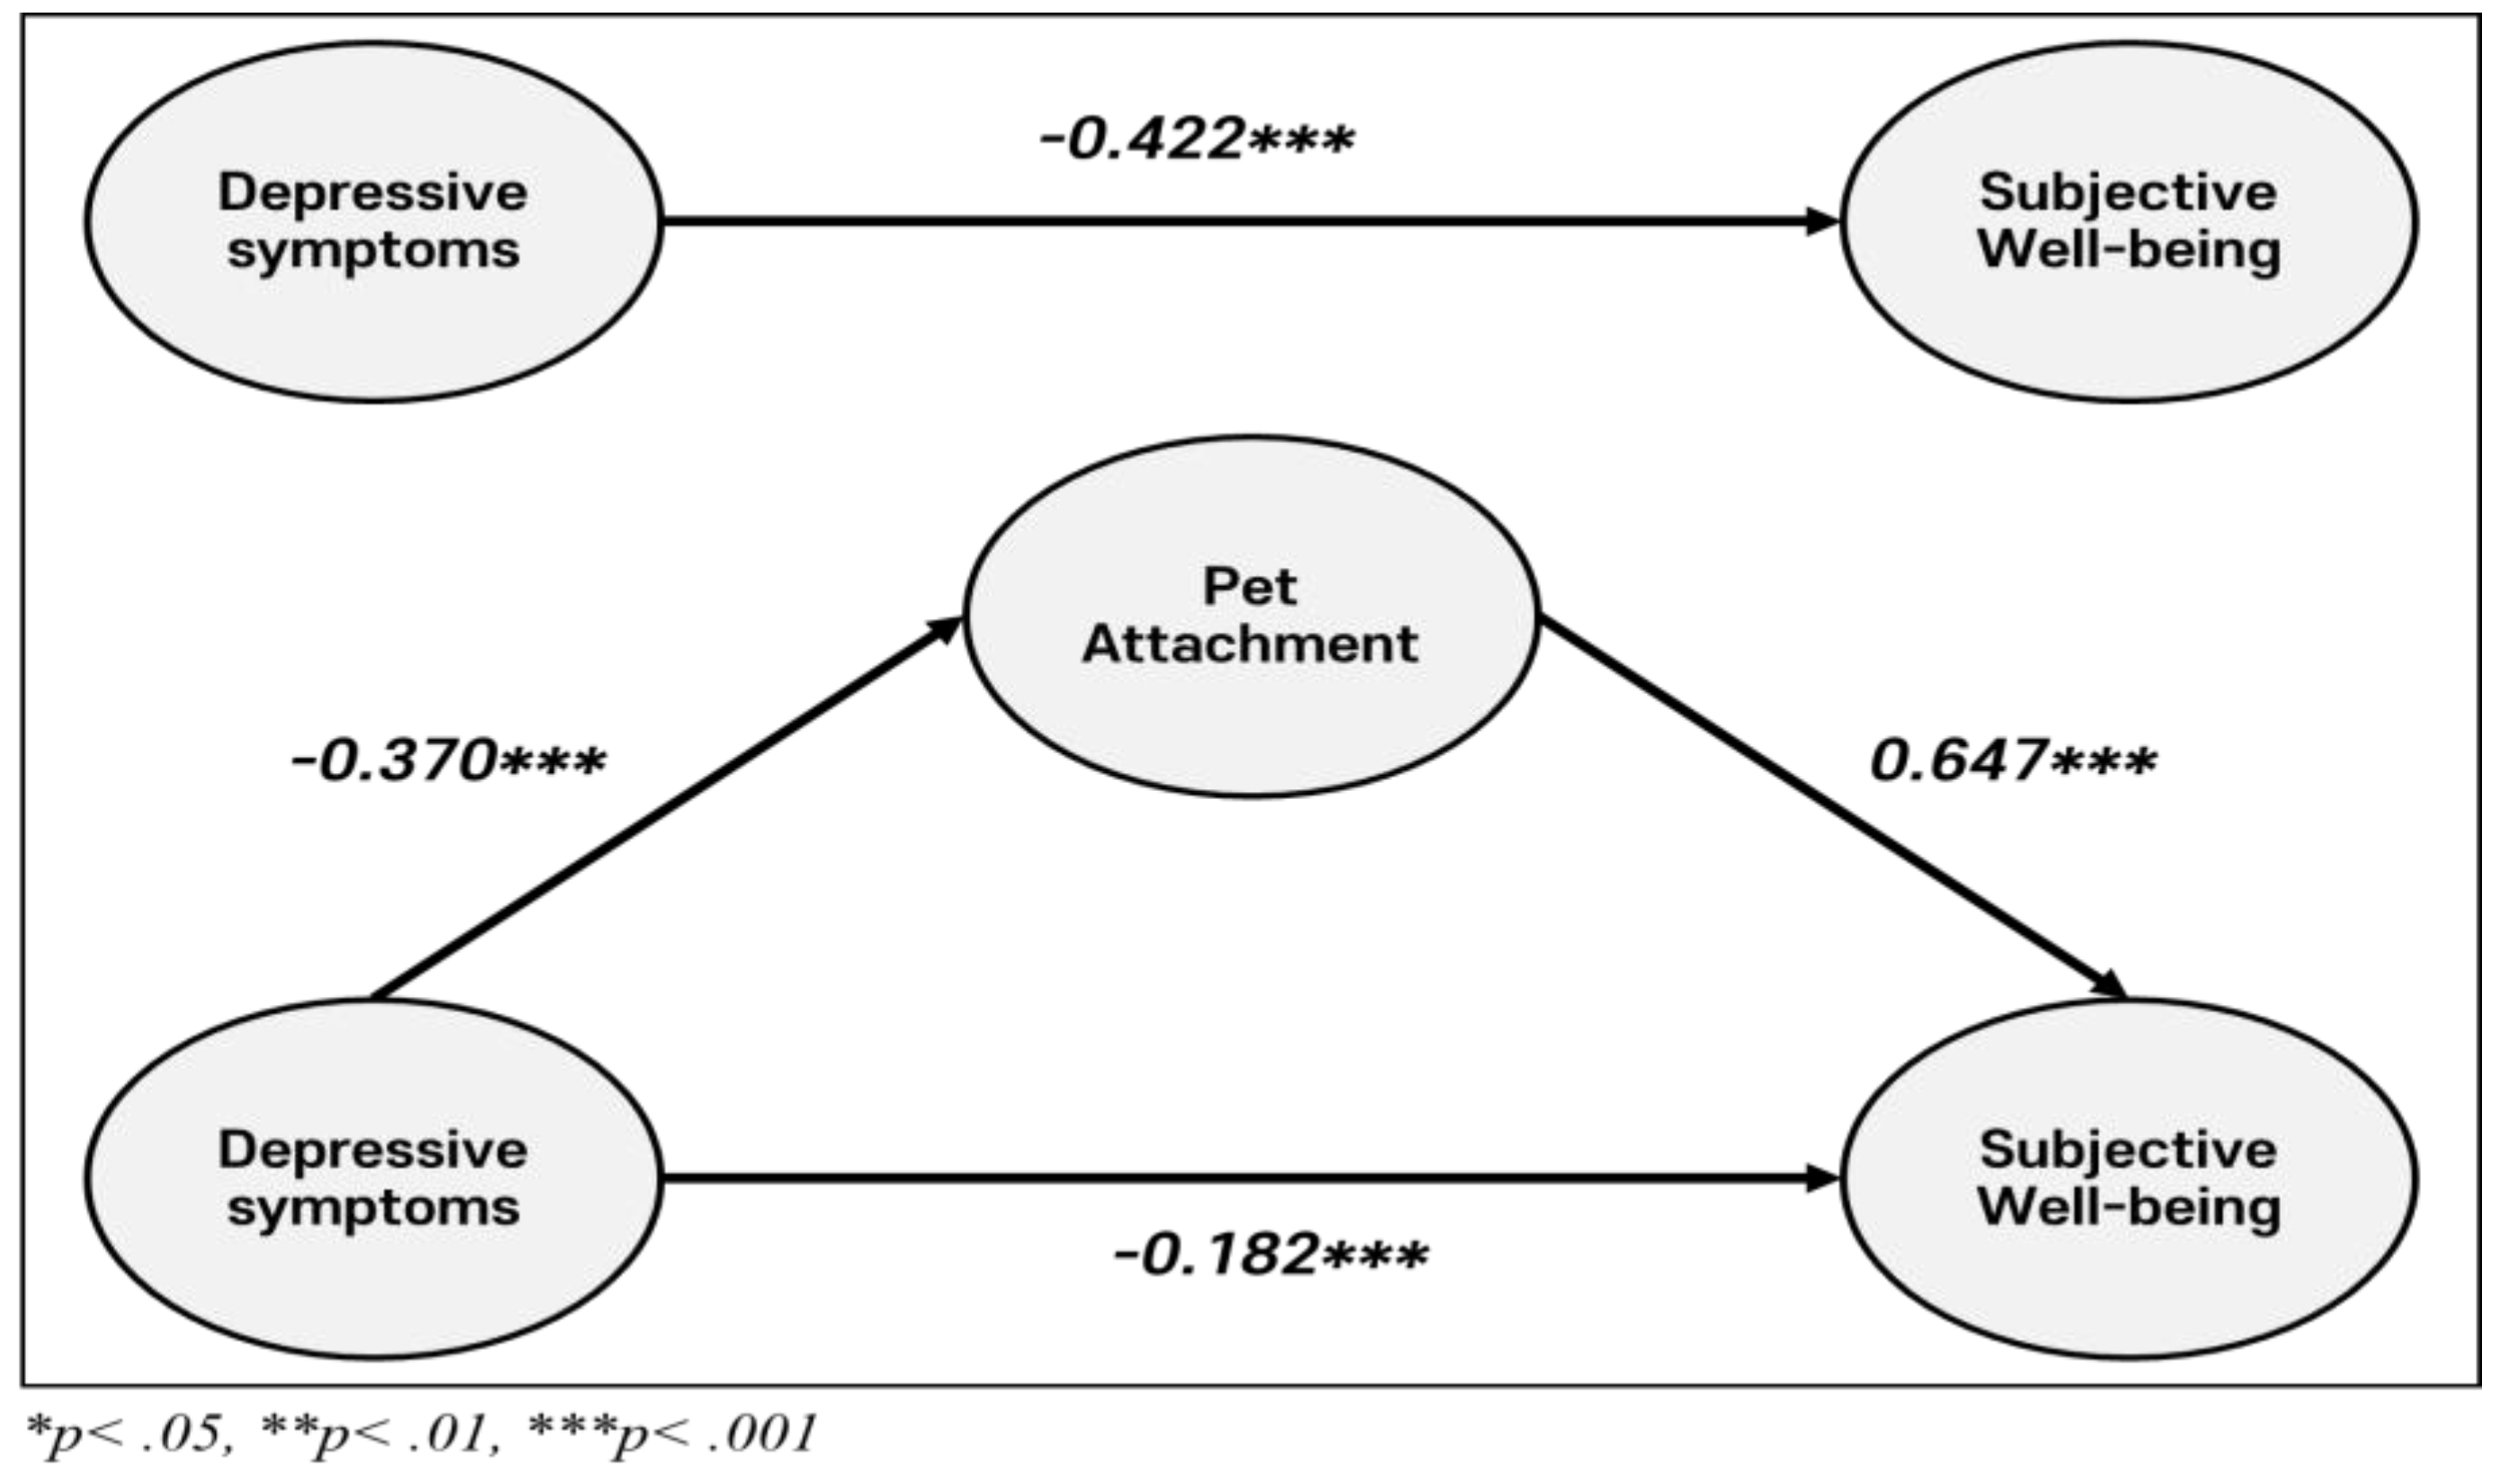
3.7. Examining the Mediating Role of Pet Attachment in the Relationship Between Depressive Symptoms and Subjective Well-Being
This analysis investigated the impact of depressive symptoms on subjective well-being, with pet attachment serving as a mediator, while controlling for education level and income status.)
3.7.1. Sequential Mediation Analysis of Pet Attachment in the Link Between Depressive Symptoms and Subjective Well-Being
The results of the mediation analysis are summarized in
Table 12.
Model 1: Depressive Symptoms and Pet Attachment
The results of Model 1 indicate that depressive symptoms significantly and negatively predict pet attachment (B = −0.370, SE = 0.024, t = −15.200, p < .001), suggesting that individuals with high-er levels of depressive symptoms tend to exhibit lower levels of attachment to their pets. Among the control variables, education level was found to have a significant positive association with pet attachment (B = 0.129, p < .001), indicating that individuals with higher educational attainment are more likely to report stronger attachment to their pets. Similarly, income status was positively as-sociated with pet attachment (B = 0.157, p < .05), implying that individuals with higher income levels also tend to develop stronger bonds with their pets.
Model 2: Pet Attachment and Subjective Well-Being
In Model 2, pet attachment emerged as a significant positive predictor of subjective well-being (B = 0.647, SE = 0.043, t = 14.928, p < .001), indicating that individuals who report stronger attachment to their pets tend to experience higher levels of subjective well-being. Among the control variables, income status was also found to significantly and positively predict subjective well-being (B = 0.166, p < .01), suggesting that individuals with higher income levels report greater subjective well-being. However, education level did not exhibit a significant effect on subjective well-being (B = −0.035, p > .05).
Model 3: Depressive Symptoms and Subjective Well-Being
The results from Model 3 demonstrate that depressive symptoms have a significant and negative direct effect on subjective well-being (B = −0.422, SE = 0.026, t = −16.195, p < .001), indicating that higher levels of depressive symptoms are directly associated with lower levels of subjective well-being. Regarding the control variables, education level did not significantly predict subjective well-being (B = 0.048, p > .05), while income status showed a significant positive effect (B = 0.267, p < .001). This finding suggests that individuals with higher income levels are more likely to report greater subjective well-being, even when controlling for depressive symptoms.
Notably, despite the significant effects of the control variables, the mediating effect of pet attachment remained significant.
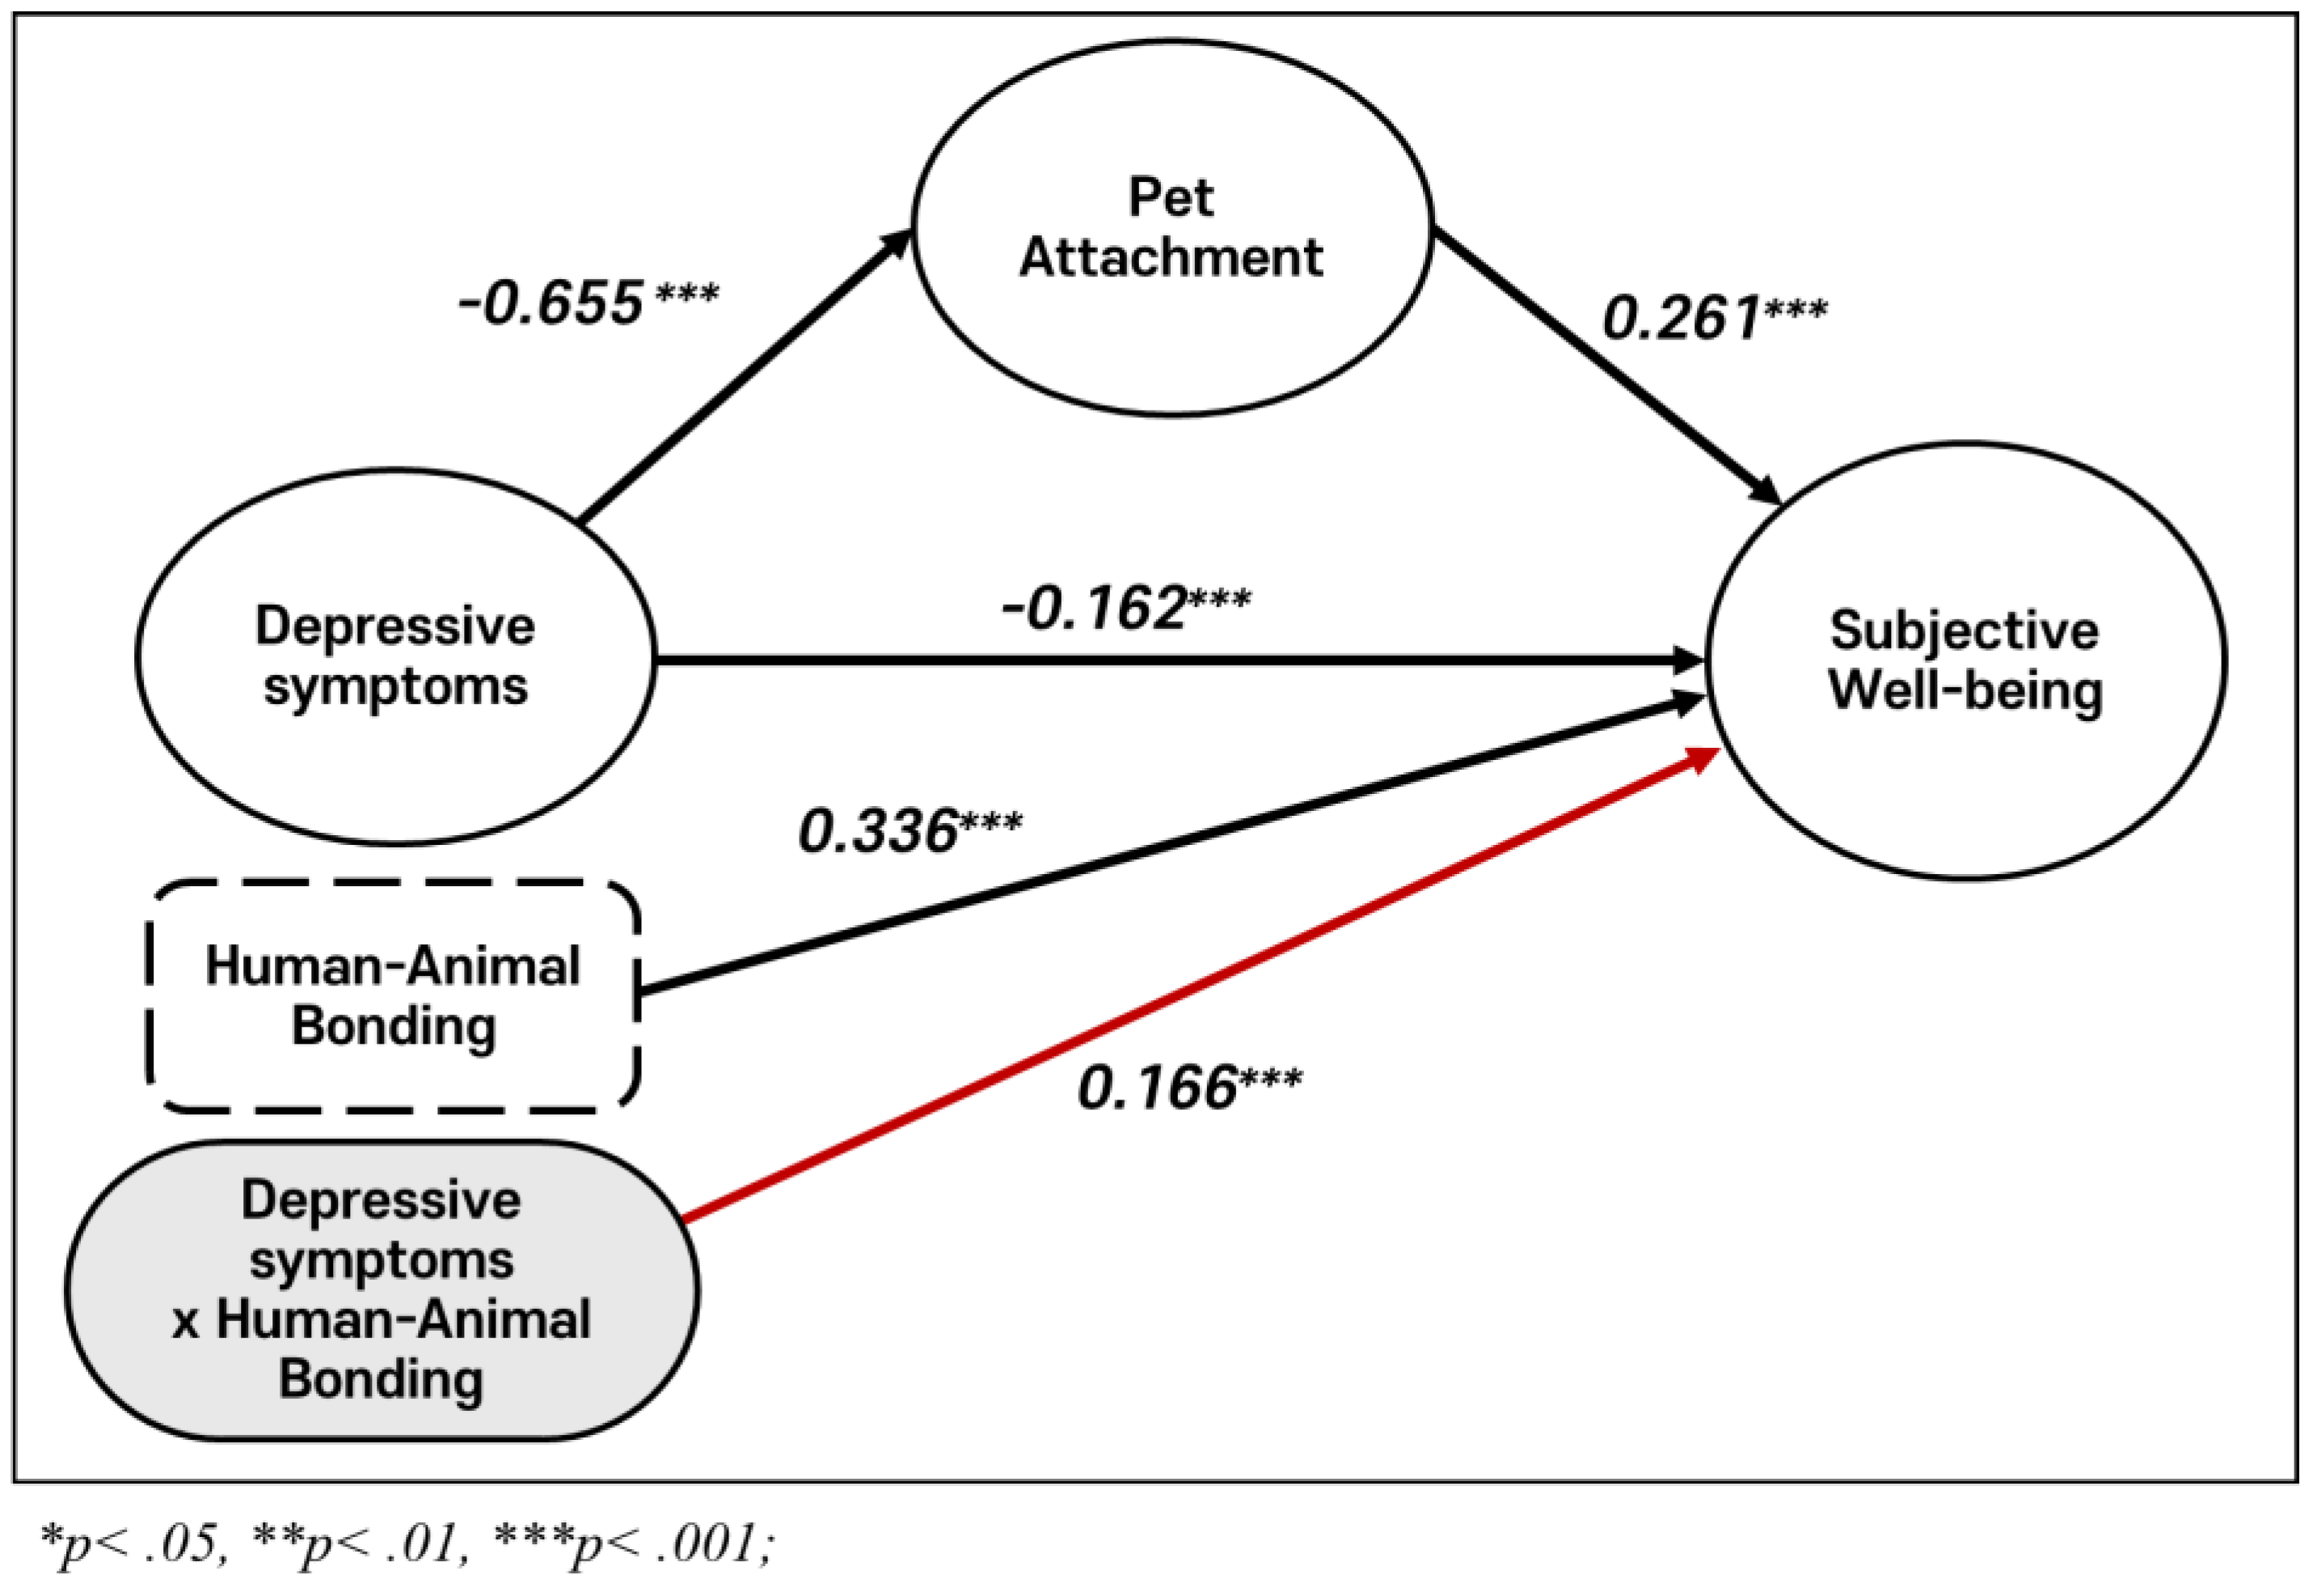
3.7.2. Direct, Mediating, and Moderating Effects Between Depressive Symptoms, Pet Attachment, and Subjective Well-Being
This analysis investigates the mediating role of pet attachment in the relationship between depressive symptoms and subjective well-being. (
Table 13)
The results of the mediation analysis revealed that depressive symptoms had a significant total effect on subjective well-being (B = −0.422, 95% CI [−0.473, −0.371]), indicating that higher levels of depressive symptoms are associated with lower levels of subjective well-being. The direct effect of depressive symptoms on subjective well-being was also significant (B = −0.182, 95% CI [−0.234, −0.131]), demonstrating that depressive symptoms negatively influence subjective well-being independently of pet attachment.
Furthermore, the indirect effect of depressive symptoms on subjective well-being, mediated through pet attachment, was significant (B = −0.240, 95% CI [−0.310, −0.170]). The absence of zero within the confidence interval confirms the statistical significance of the mediation effect.
A schematic diagram illustrating the sequential mediation model, with depressive symptoms acting as a mediator between the human-animal bond and subjective well-being, is presented in
Figure 2.
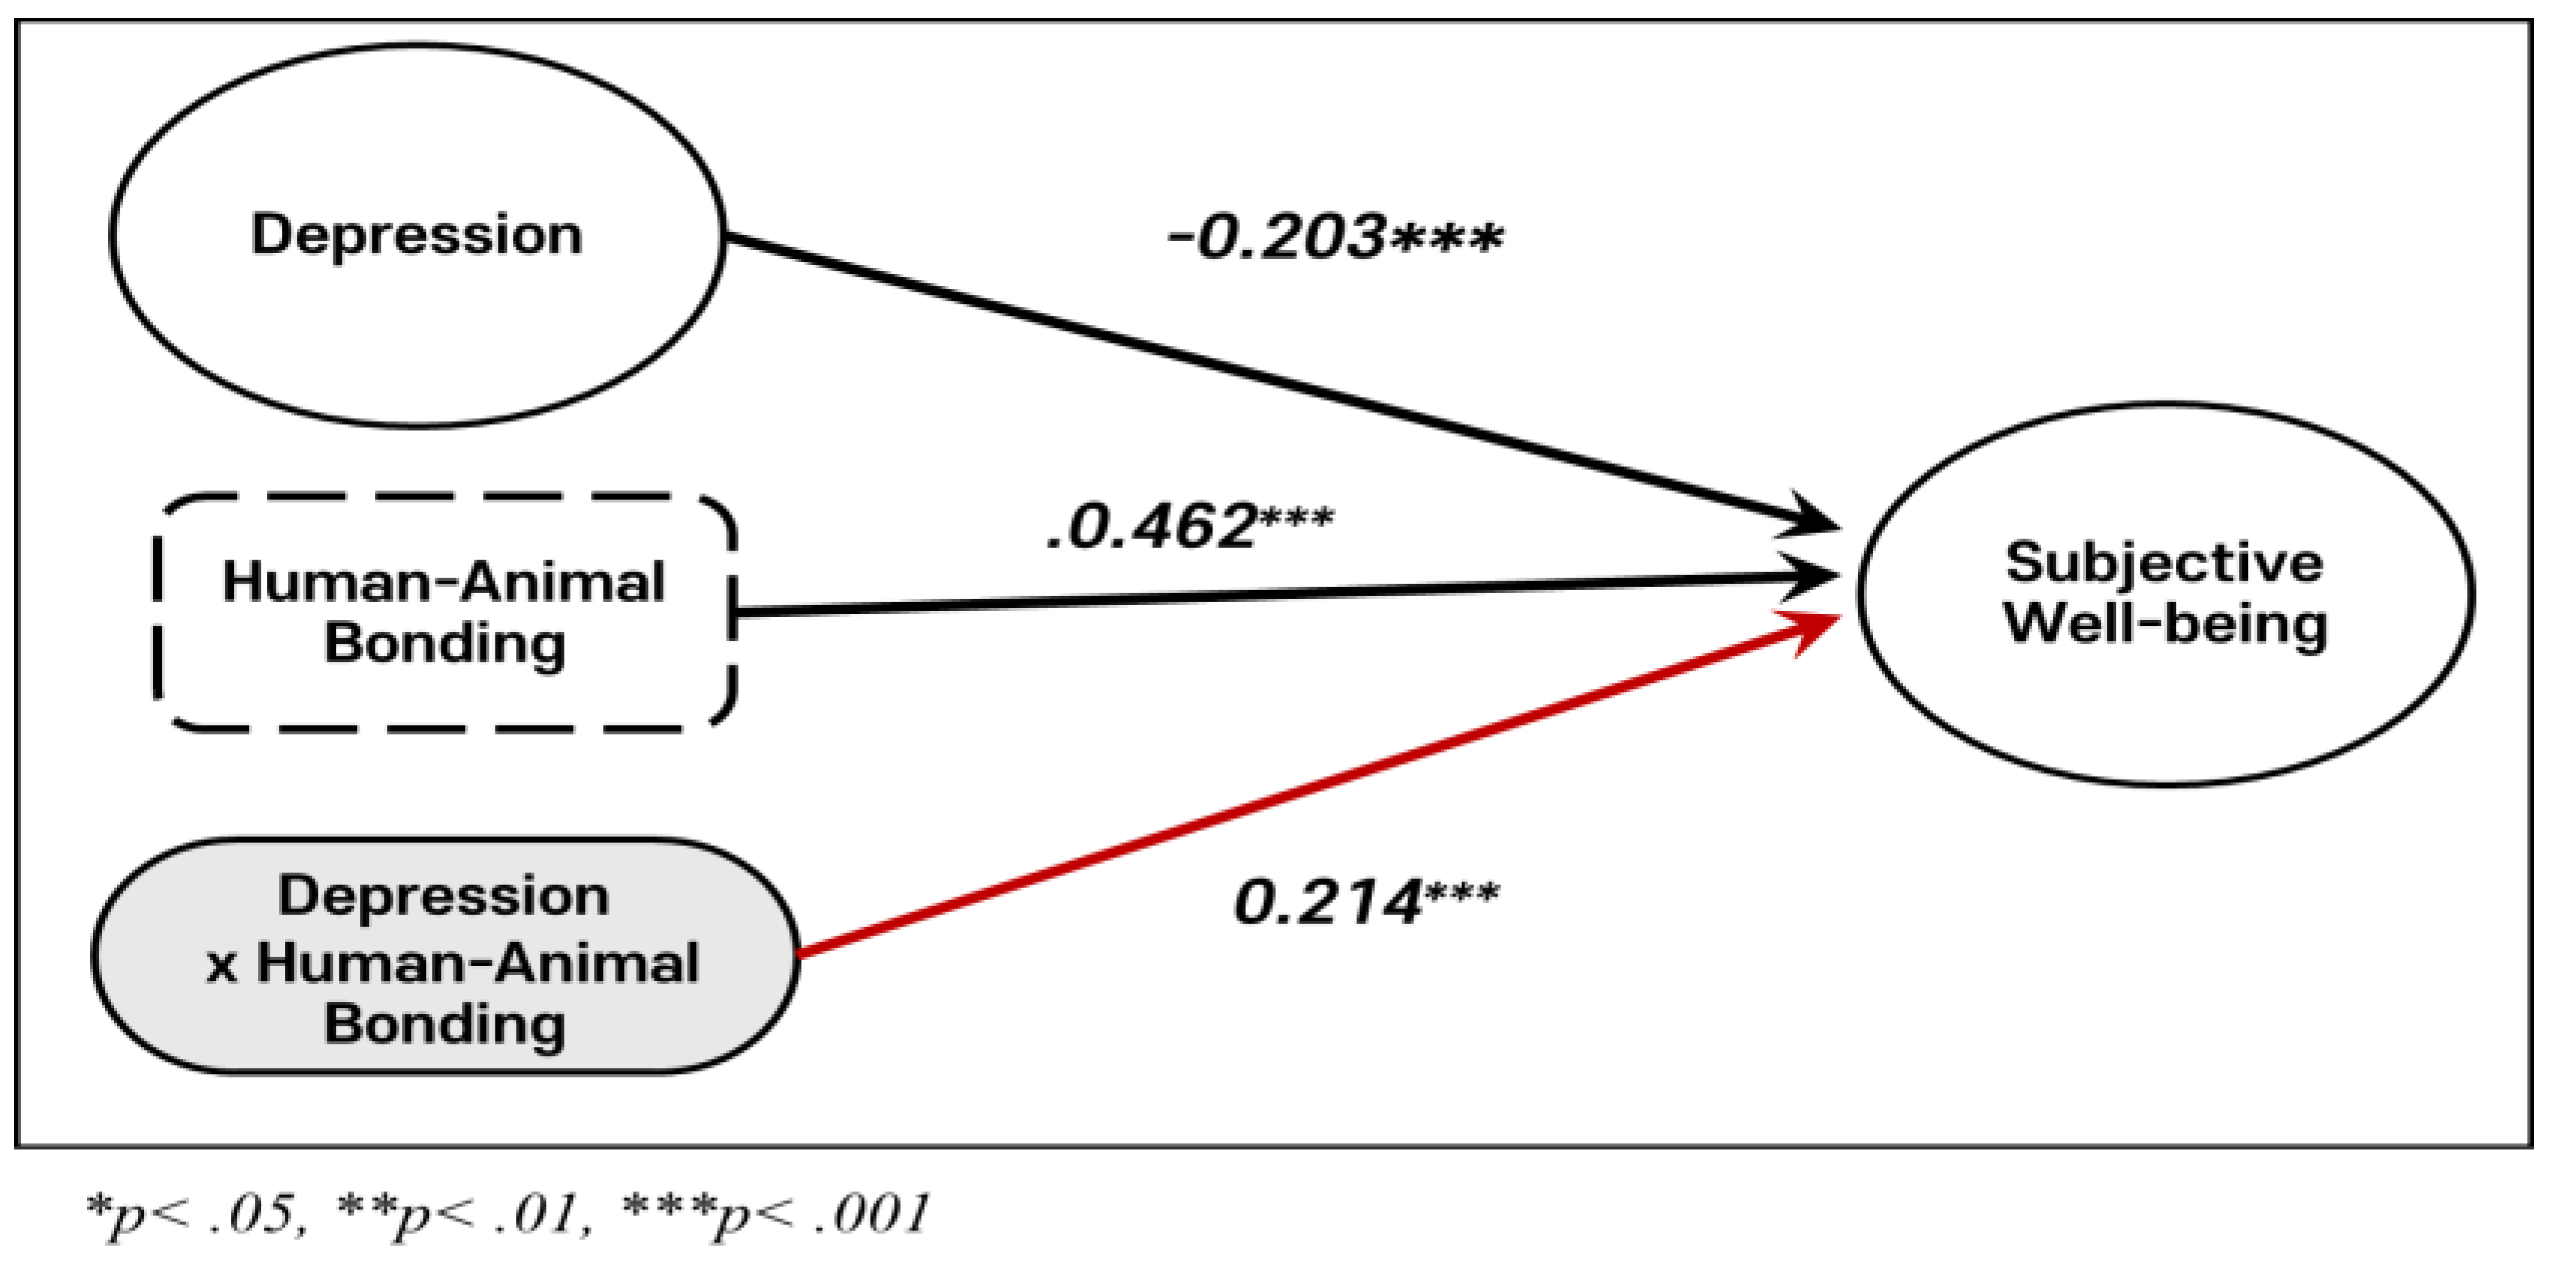
3.8. Moderation Analysis of the Effect of Human-Animal Bond on the Relationship Between Depressive Symptoms and Subjective Well-Being
Educational attainment and income status, identified as significant predictors in prior analyses, were included as control variables to account for potential confounding effects.
The results presented in
Table 14 demonstrate the moderating effect of the human-animal bond on the relationship between depressive symptoms and subjective well-being. (
Table 14)
Depressive symptoms (B = −0.203, SE = 0.023, t = −8.935, p < .001) were significantly and negatively associated with subjective well-being. In contrast, the human-animal bond (B = 0.462, SE = 0.039, t = 11.927, p < .001) exhibited a significant positive association. Importantly, a significant interaction effect between depressive symptoms and the human-animal bond (B = 0.214, SE = 0.031, t = 6.970, p < .001) was identified, indicating that the human-animal bond moderates the negative impact of depressive symptoms on subjective well-being. Specifically, a stronger human-animal bond mitigates the adverse effects of depressive symptoms on subjective well-being.
Among the control variables, income status (B = 0.163, SE = 0.049, t = 3.310, p = .001) was a significant positive predictor of subjective well-being, whereas education level (B = −0.009, SE = 0.023, t = −0.397, p = .691) did not exhibit a significant effect.
The overall regression model was highly significant (F = 1,710.881, p < .001) and explained 69.1% of the variance in subjective well-being (R² = 0.691). In addition, the inclusion of the interaction term significantly increased the explanatory power (ΔR² = 0.039, F = 48.585, p < .001). These findings underscore the critical role of the human-animal bond in mitigating the negative effects of depressive symptoms and enhancing subjective well-being.
The moderating effect of the human-animal bond on the relationship between depressive symptoms and subjective well-being is visually depicted in
Figure 3.
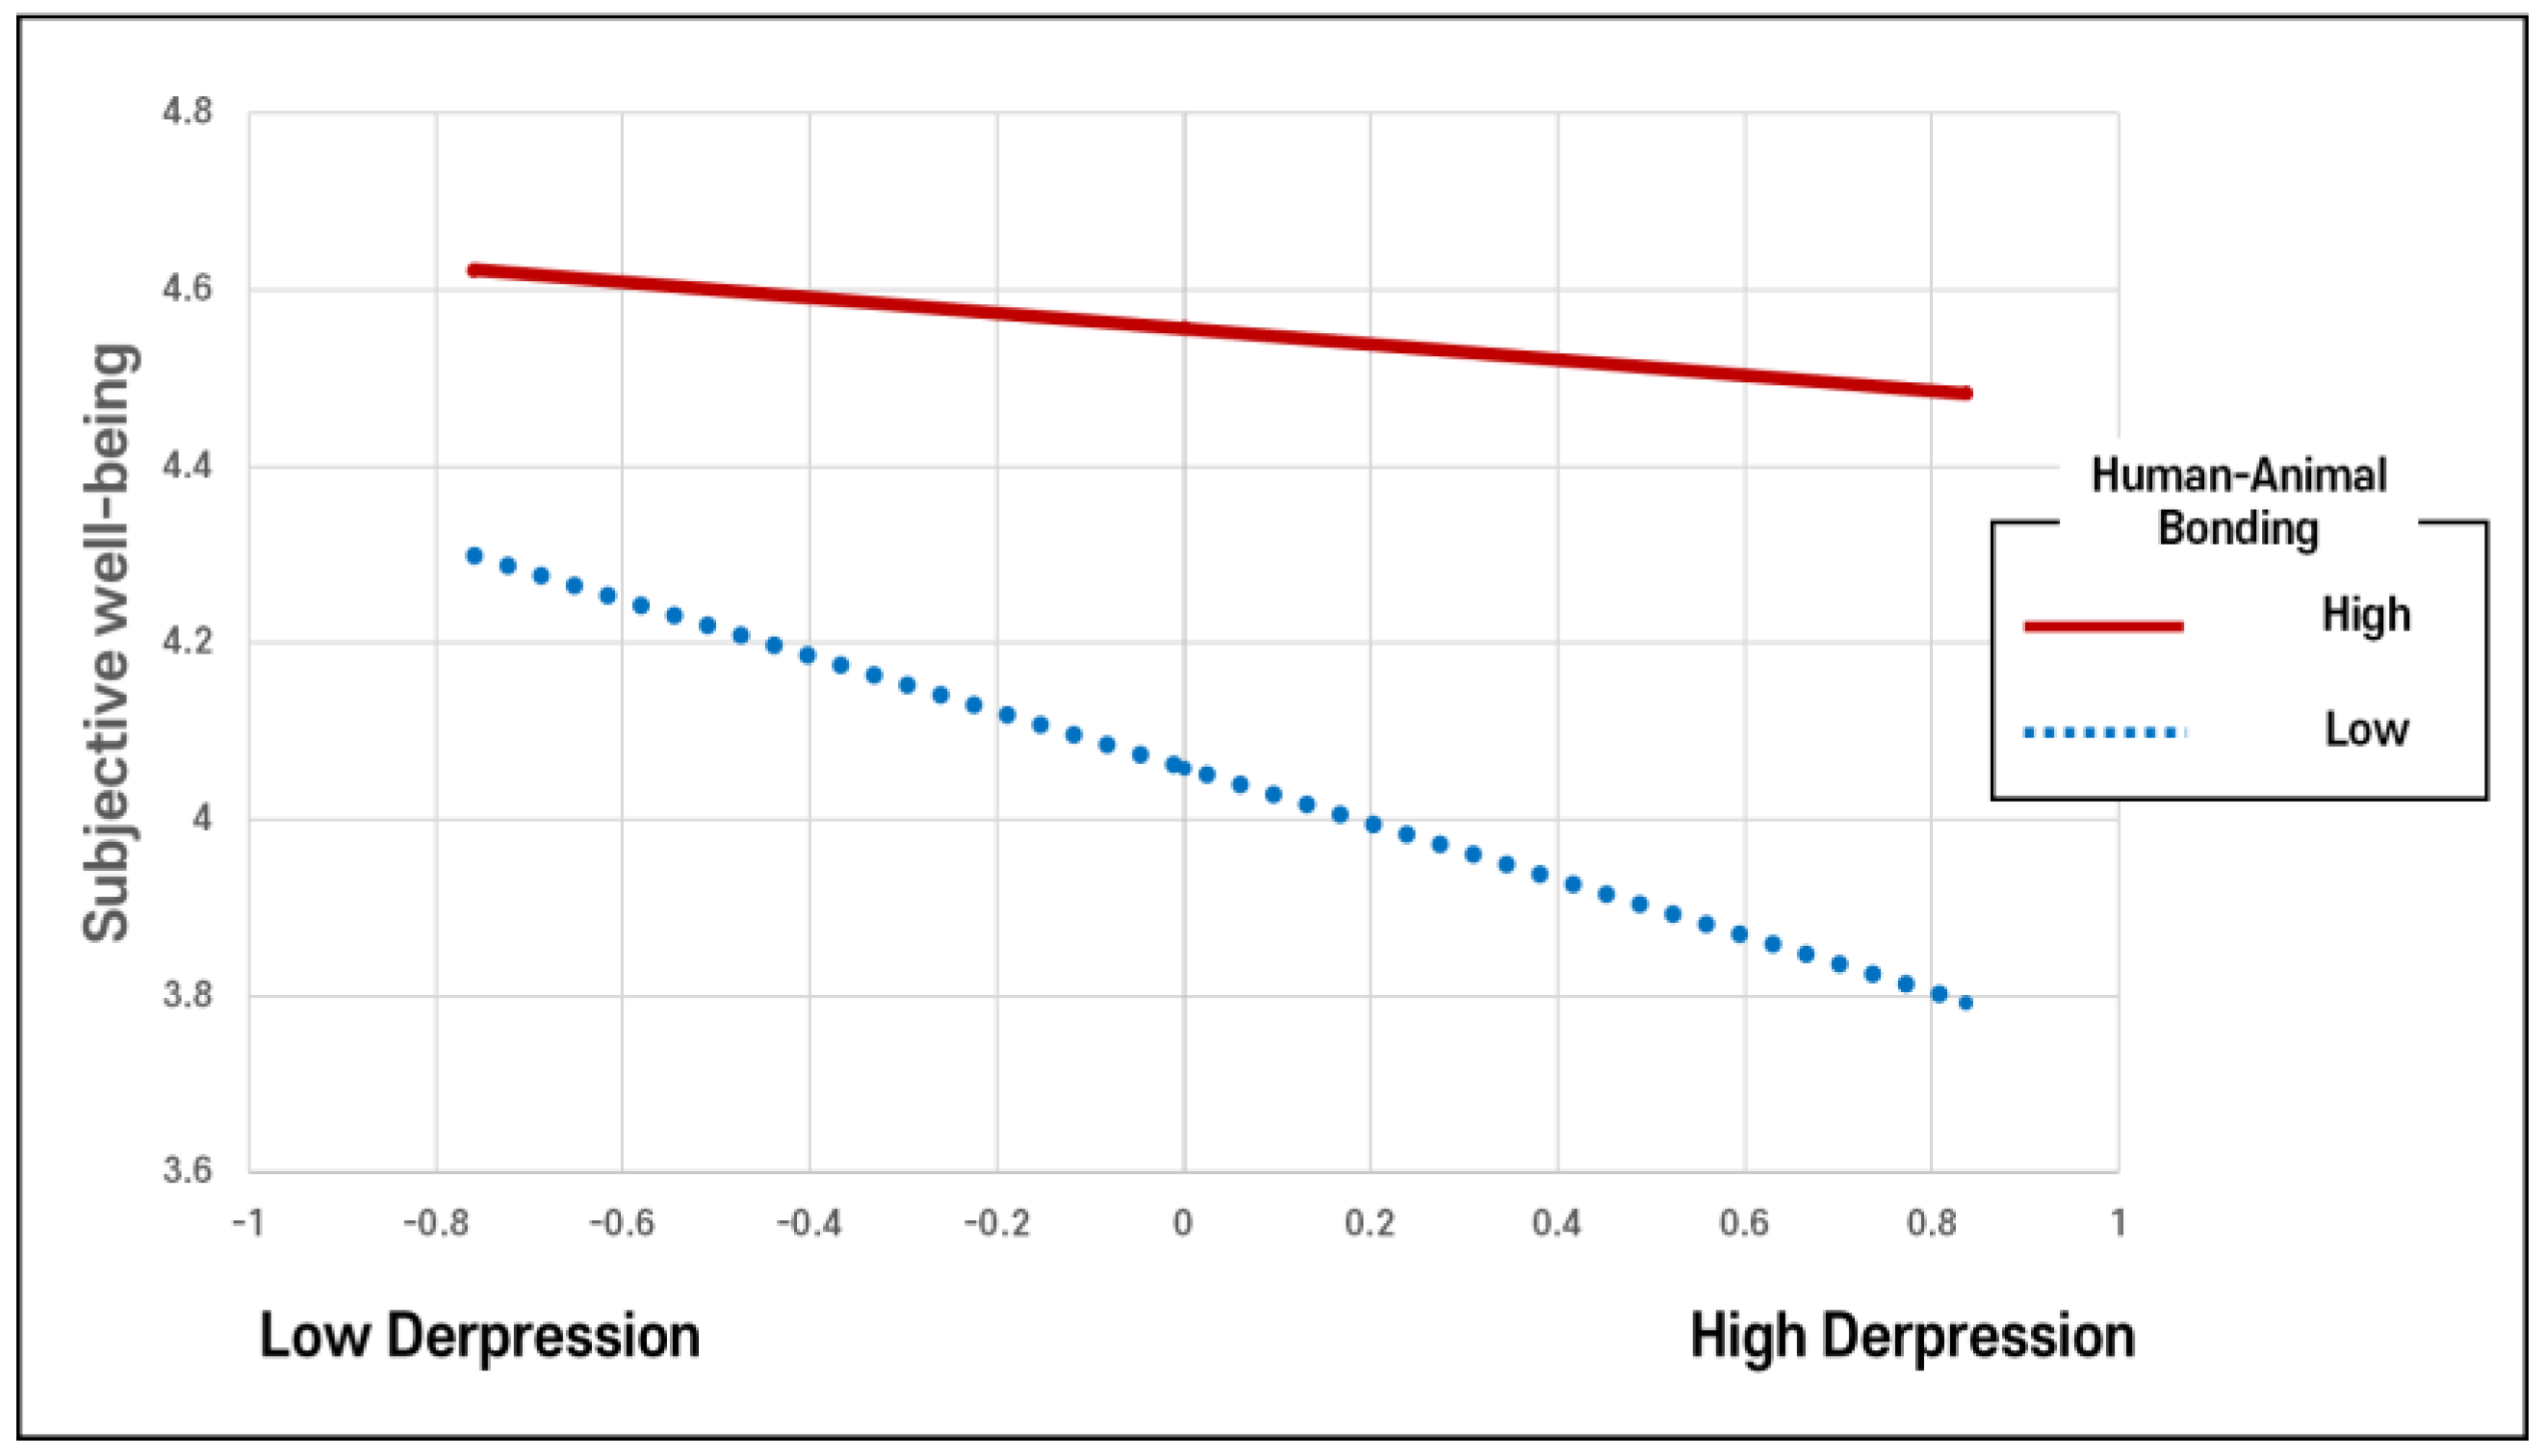
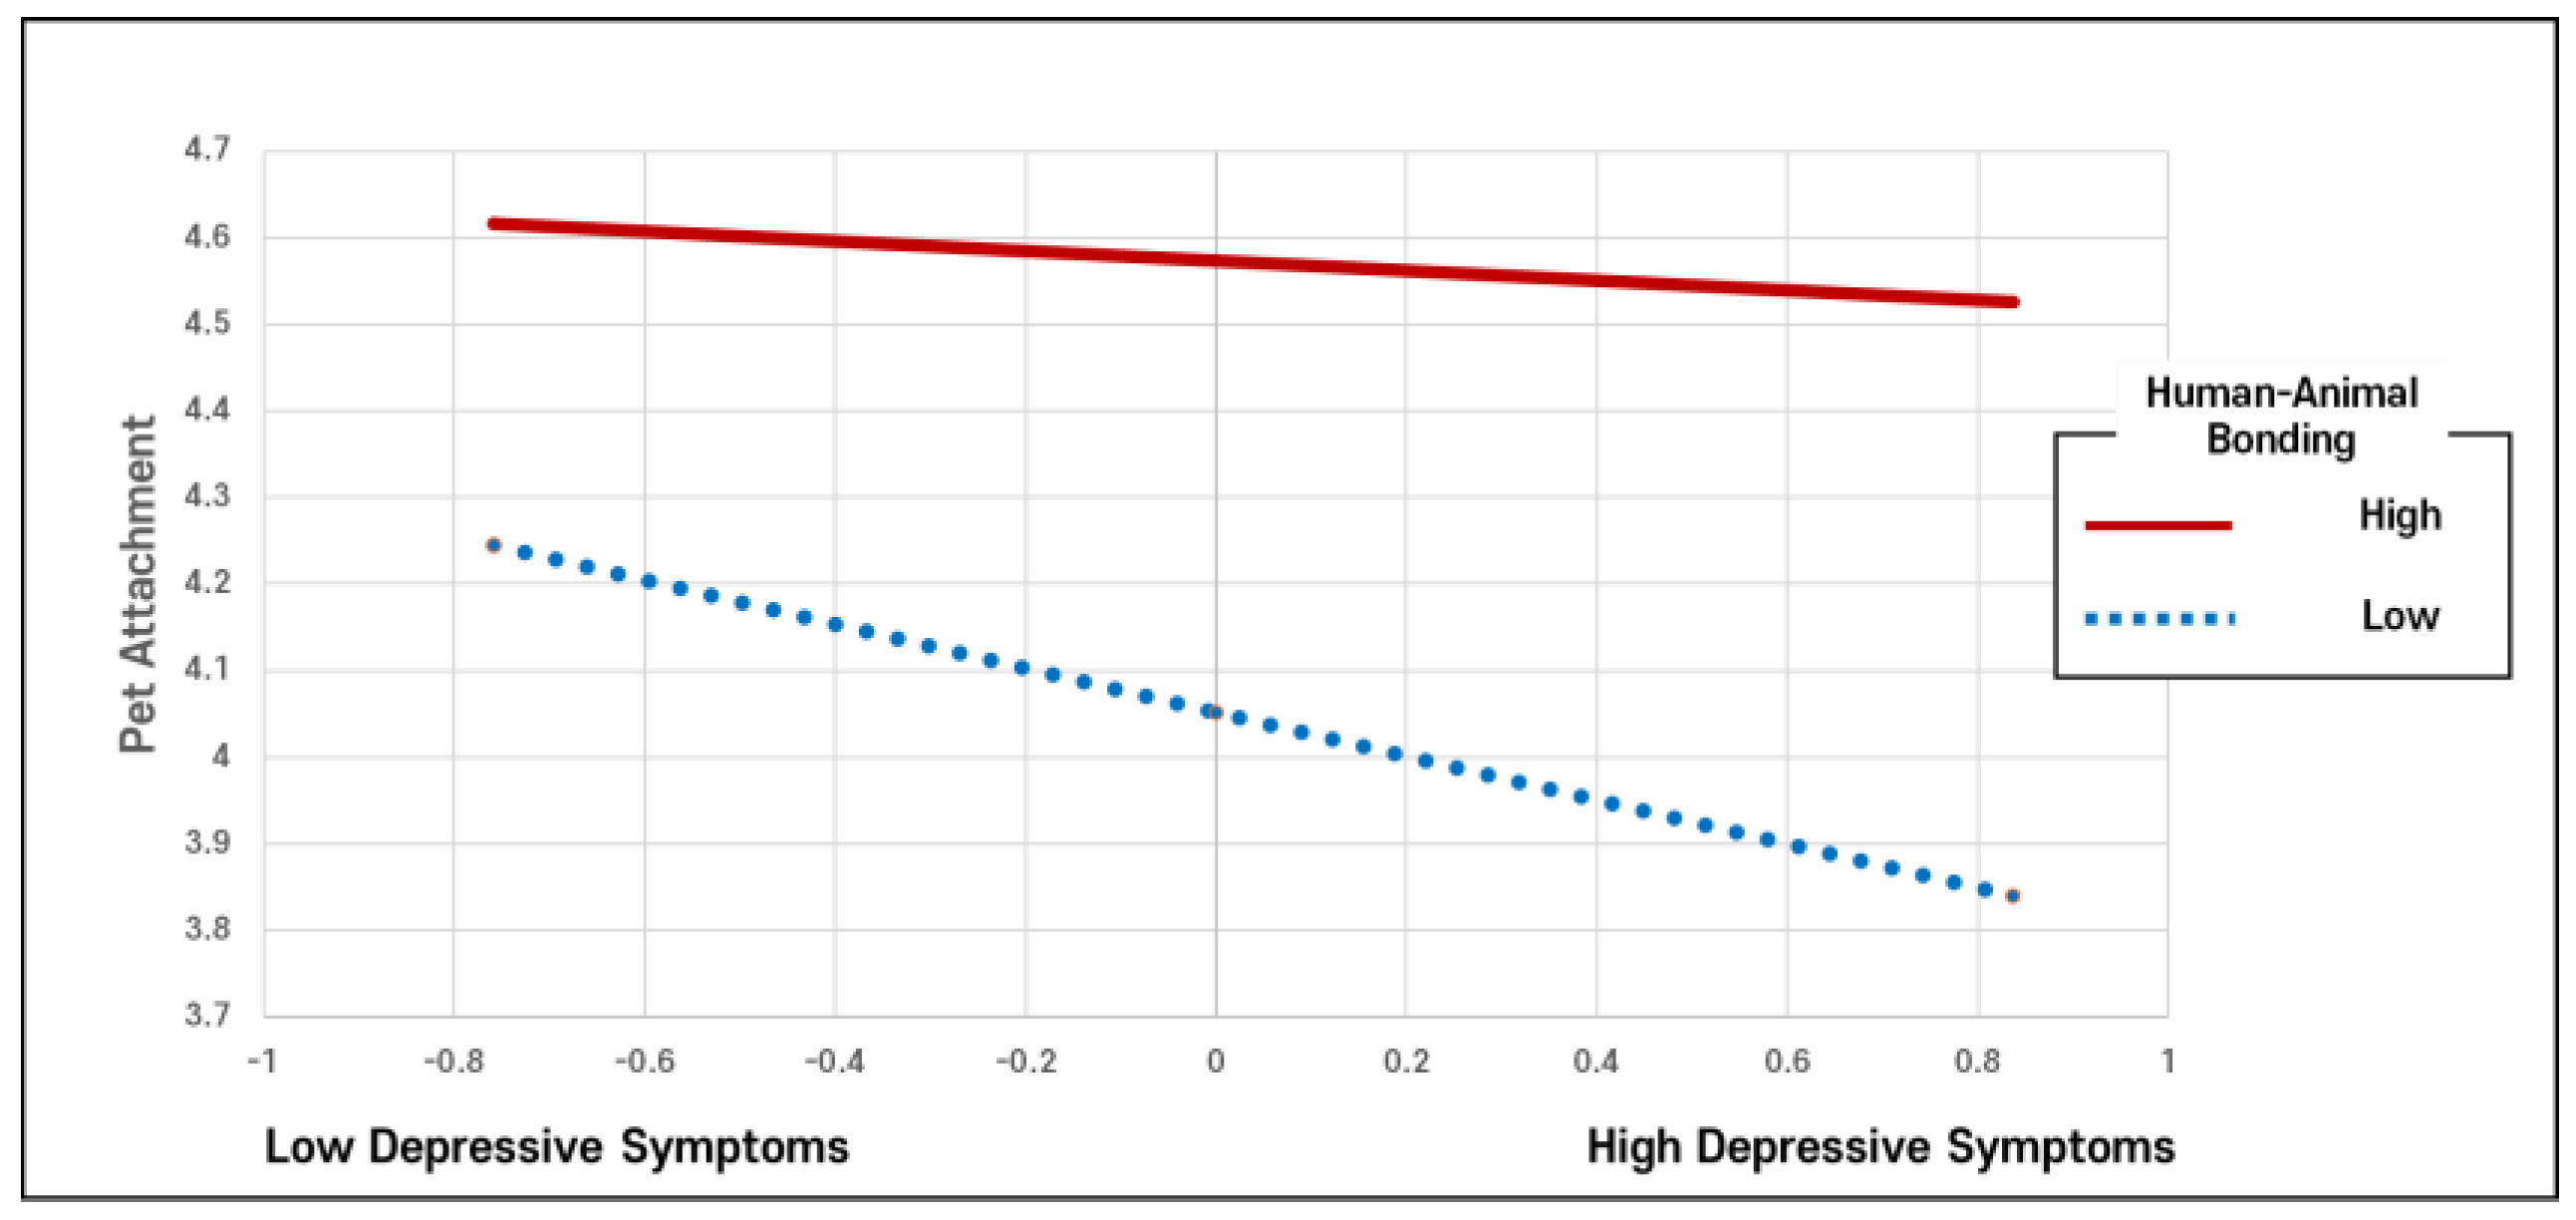
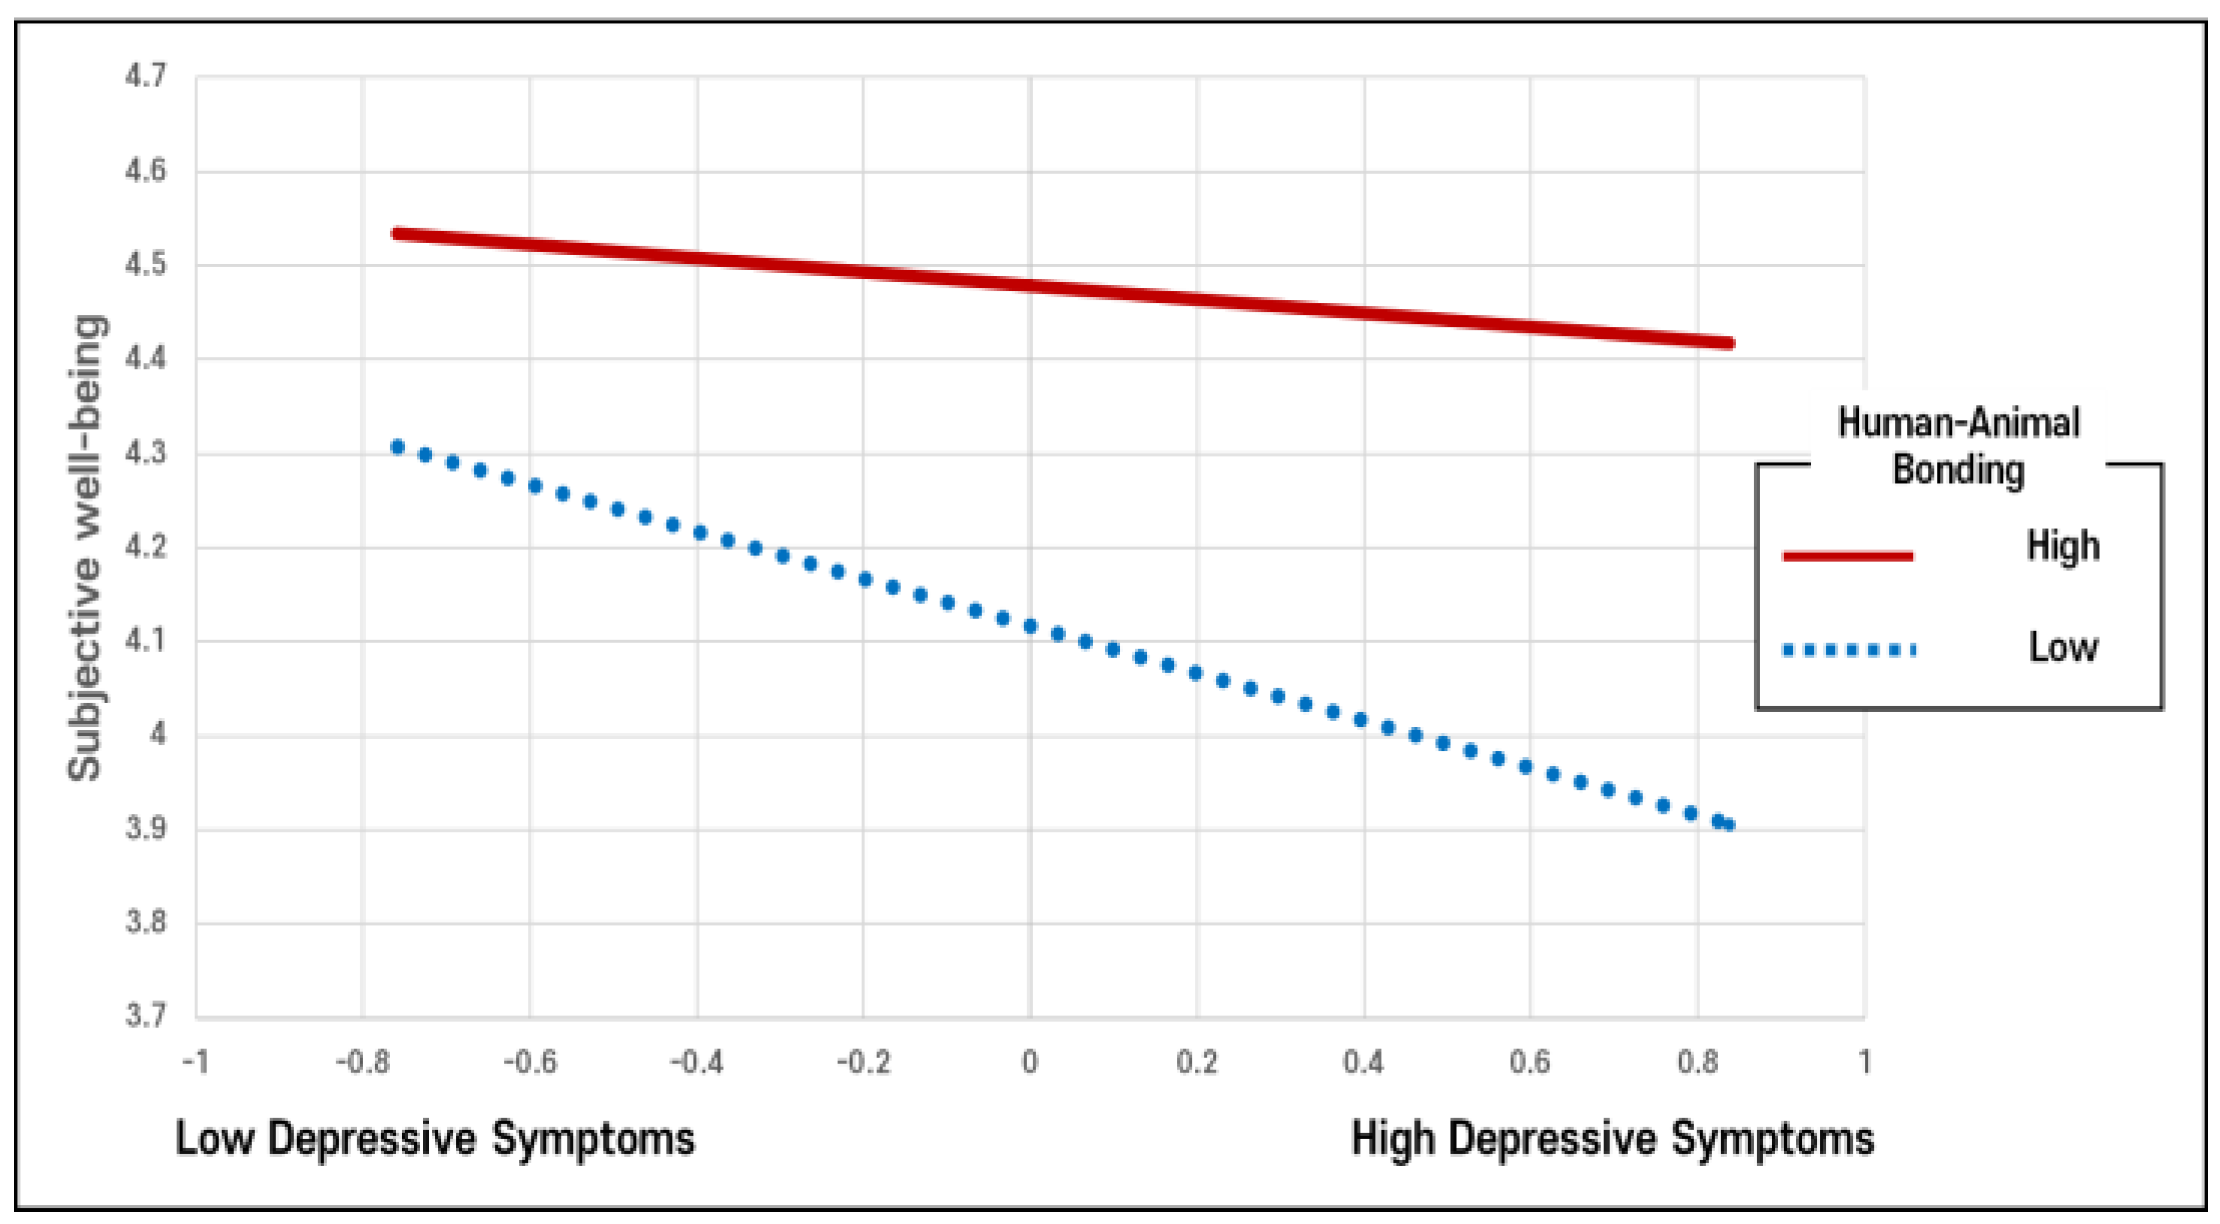
3.8.1. Conditional Moderation Analysis of the Human-Animal Bond on the Relationship Between Depressive Symptoms and Subjective Well-Being
This study examined the conditional moderating effect of the human-animal bond on the relationship between depressive symptoms and subjective well-being. For this analysis, the human-animal bond was categorized into three levels: low (-1 SD), medium (mean), and high (+1 SD). The results, presented in
Table 15, revealed that the negative effect of depressive symptoms on subjective well-being varied depending on the level of the human-animal bond. (
Table 15)
At the low level of the human-animal bond (-1 SD), depressive symptoms had a strong negative effect on subjective well-being (B = −0.318, SE = 0.025, t = −12.947, p < .001). At the medium level (mean), the negative effect was reduced but remained significant (B = −0.203, SE = 0.023, t = −8.935, p < .001). At the high level (+1 SD), the effect was further attenuated but still statistically significant (B = −0.087, SE = 0.031, t = −2.805, p = .005).
These findings underscore the moderating role of the human-animal bond in the relationship between depressive symptoms and subjective well-being. Specifically, higher levels of the bond mitigate the negative effects of depressive symptoms, highlighting its protective function in reducing adverse psychological outcomes.
To further explore this interaction, a simple slope analysis and the Johnson-Neyman technique were conducted[
59]. The Johnson-Neyman method identified specific thresholds of the human-animal bond where its moderating effect became significant, providing deeper insights into the interaction effects[
60,
61].
Figure 4 illustrates the conditional moderating effect of the human-animal bond on the relationship between depressive symptoms and subjective well-being.
The analysis differentiates between individuals with high levels of human-animal bonding (solid red line) and those with low levels (dotted blue line).
The steep downward slope of the dotted blue line indicates a strong negative association between depressive symptoms and subjective well-being for individuals with low human-animal bonding. This suggests that as depressive symptoms increase, subjective well-being declines significantly in this group.
In contrast, the relatively flat slope of the solid red line demonstrates that the negative association between depressive symptoms and subjective well-being is considerably attenuated for individuals with high levels of human-animal bonding. This implies that individuals with stronger human-animal bonds experience less of a decline in subjective well-being, even when facing similar levels of depressive symptoms.
These findings underscore the role of human-animal bonds as a protective moderator, mitigating the adverse effects of depressive symptoms on subjective well-being.
3.8.2. The Moderating Role of the Human-Animal Bond in the Relationship Between Depressive Symptoms and Subjective Well-Being: A Johnson-Neyman Analysis
The Johnson-Neyman technique was employed to identify the critical threshold at which the hu-man-animal bond significantly moderates the relationship between depressive symptoms and subjective well-being. The analysis revealed a critical value of 0.640 for the human-animal bond, beyond which the moderating effect becomes statistically significant. (
Table 16)
The results indicated that 98.465% of the sample scored below this threshold, suggesting that for the vast majority of participants, the human-animal bond did not significantly buffer the negative association between depressive symptoms and subjective well-being. Conversely, only 1.535% of the sample scored above the critical threshold, indicating a notable and statistically significant moderating effect.
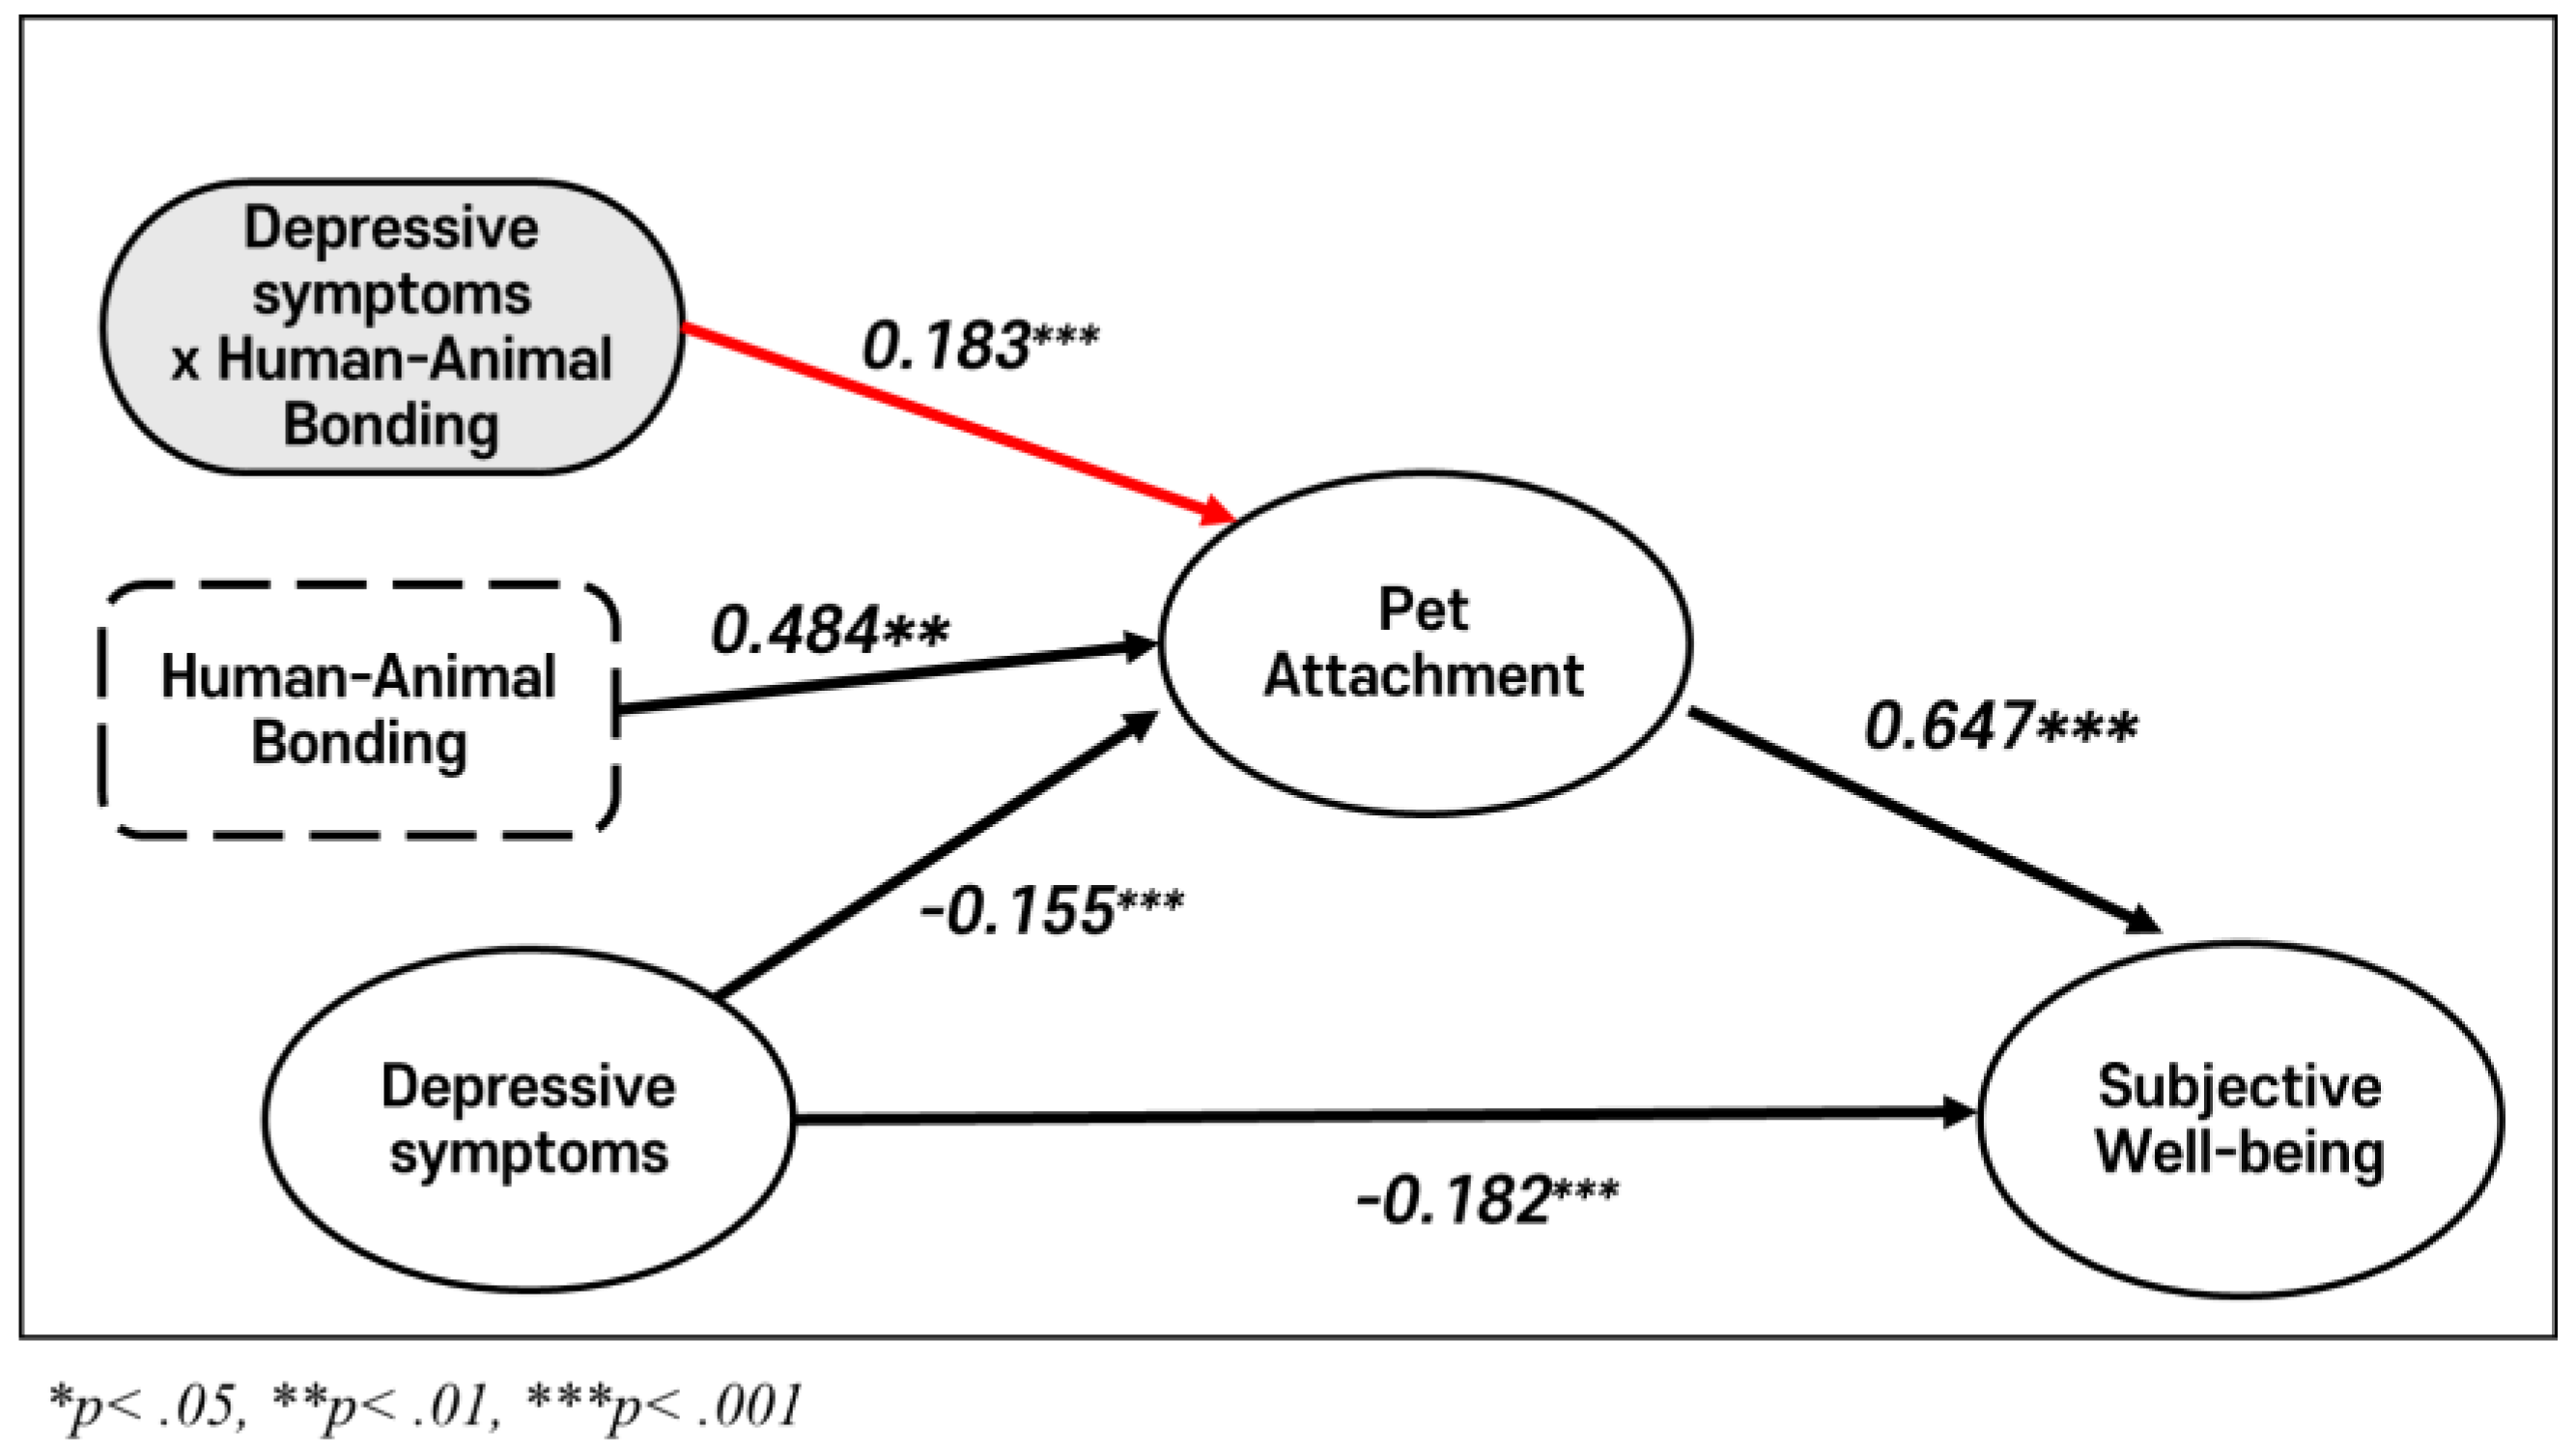
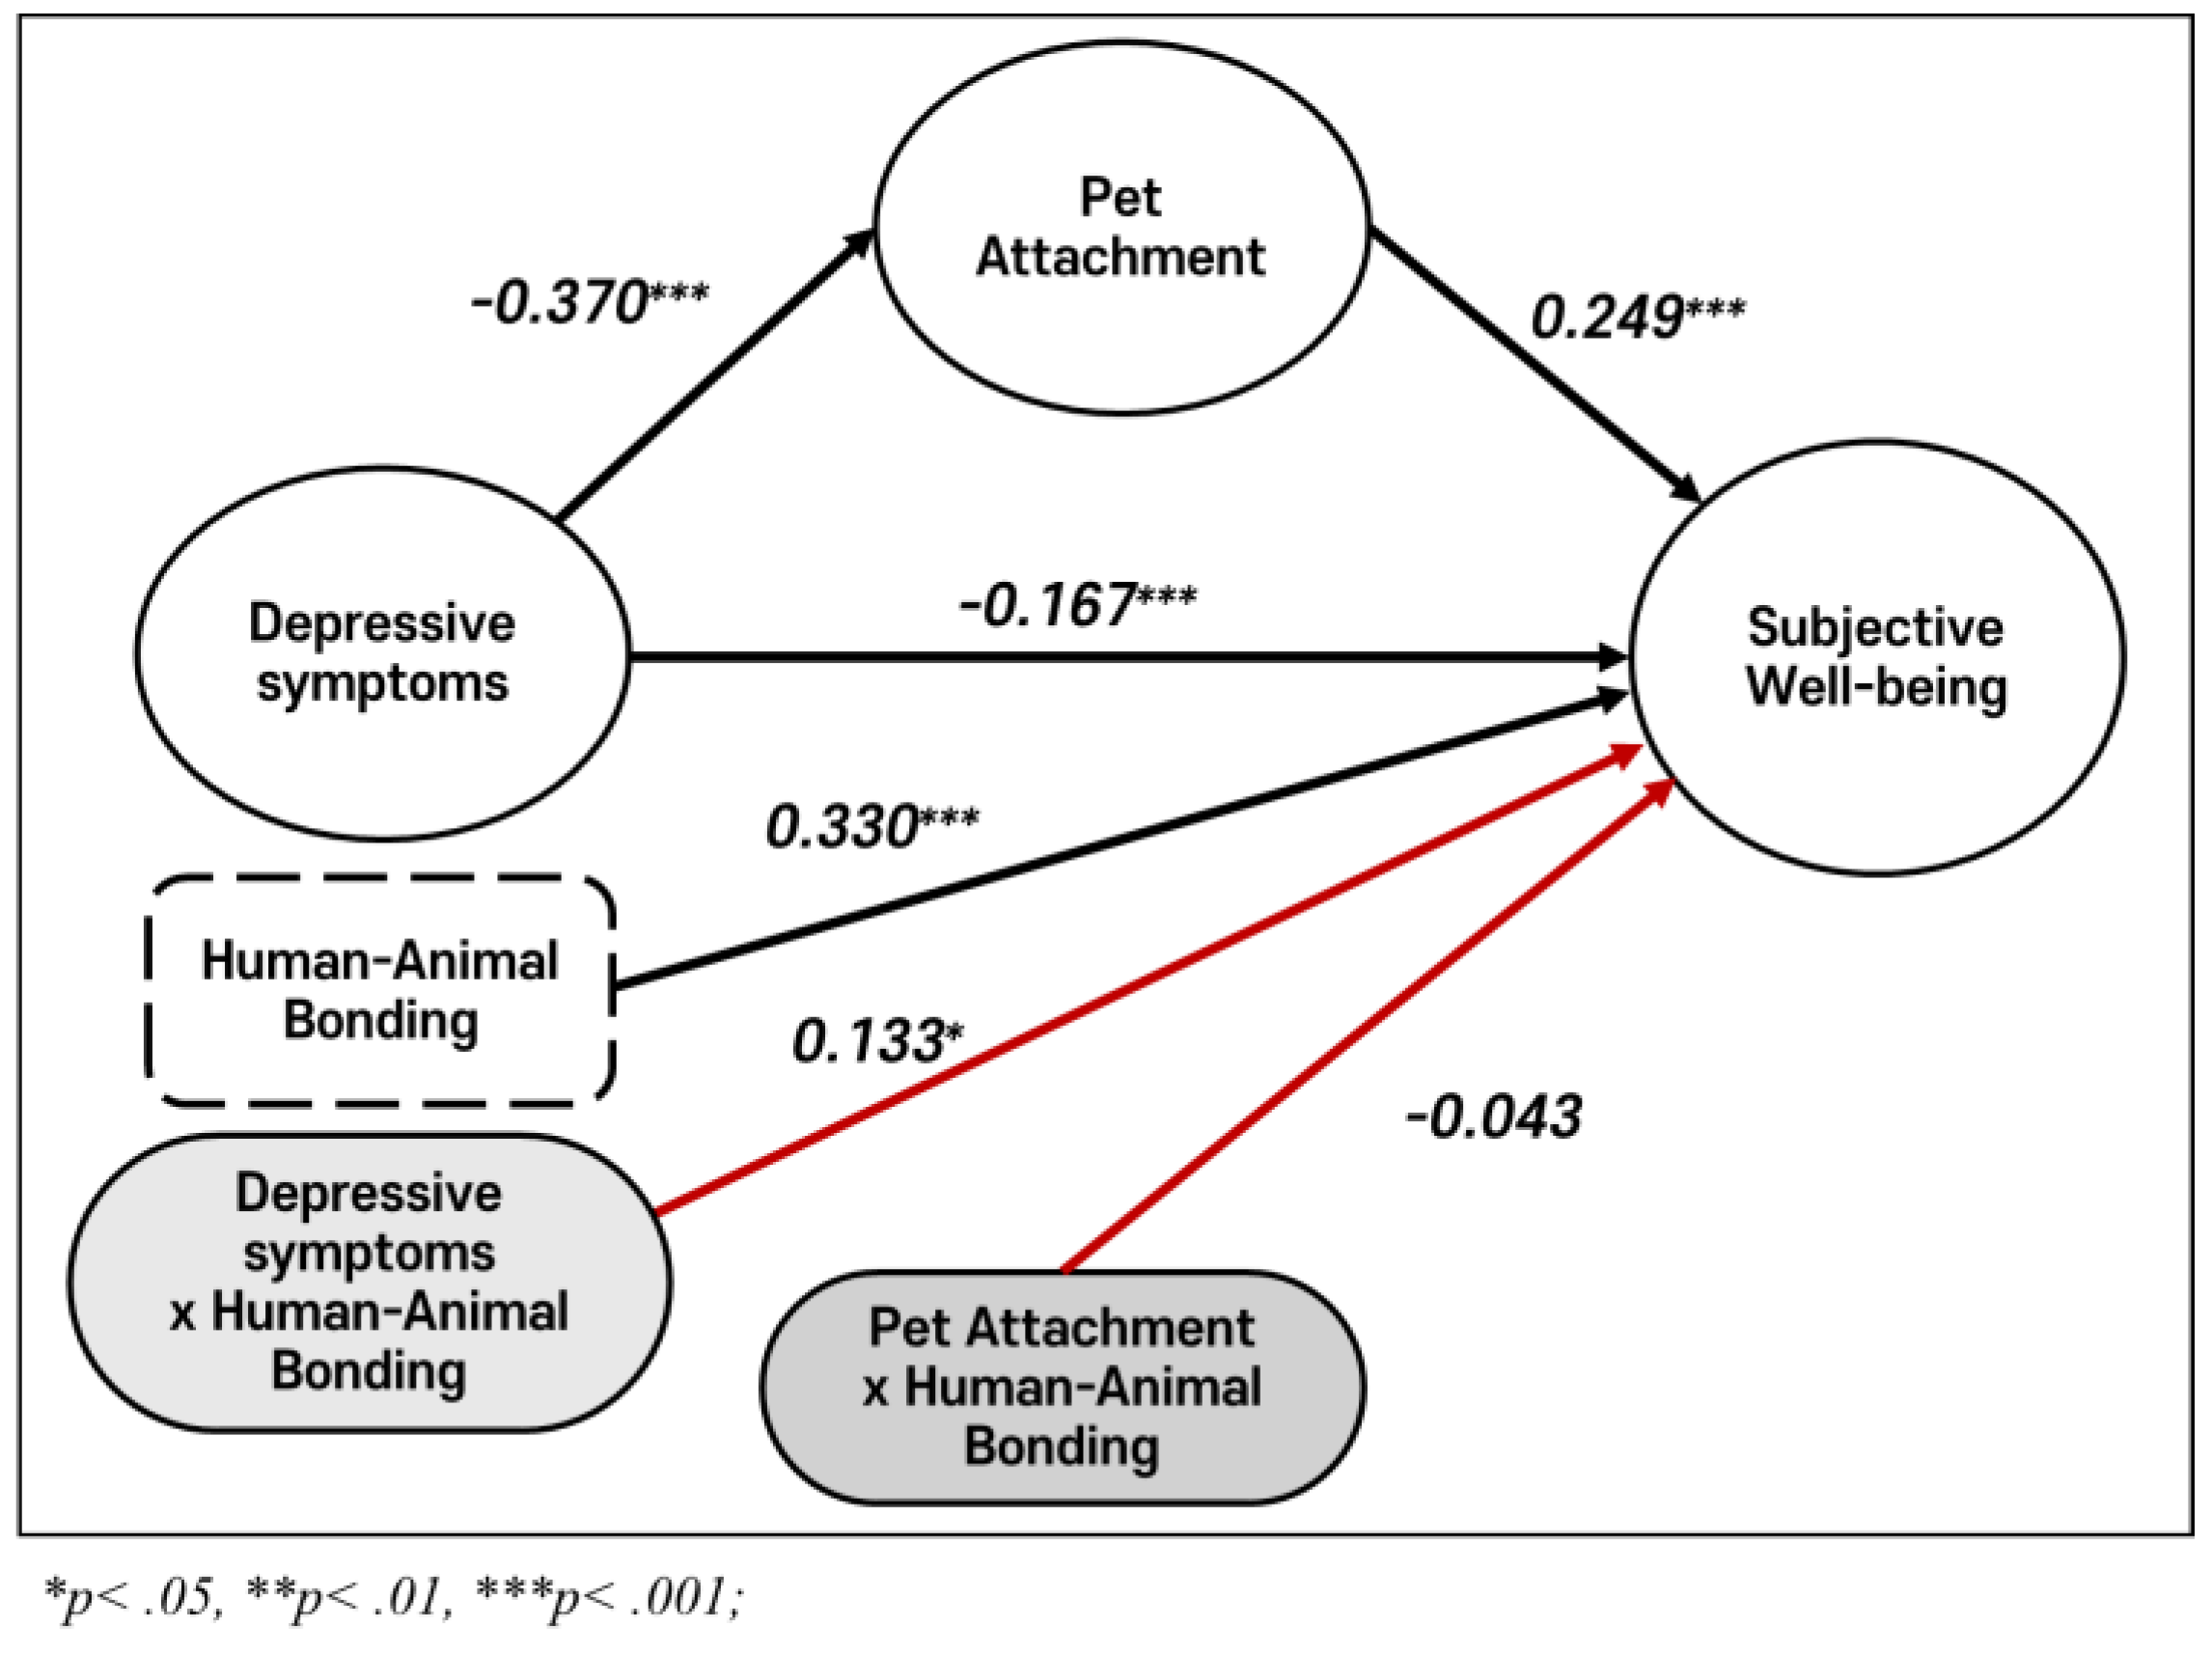
3.9. Dual Moderation in the Mediated Relationship Between Depressive Symptoms and Subjective Well-Being: Results from Model 15
Table 24 presents the results of analyses examining the mediating and moderating effects of the Human-Animal Bond on the relationship between Pet Attachment and Subjective Well-Being. Two distinct models were employed to test specific relationships between the mediator and dependent variables. (
Table 24)
The first model, referred to as the Mediator Model, examined Pet Attachment as the dependent variable. Depressive Symptoms had a significant negative effect on Pet Attachment (B = −0.370, SE = 0.024, t = −15.200, p < .001). Additionally, Education Level (B = 0.129, SE = 0.028, t = 4.625, p < .001) and Income Status (B = 0.157, SE = 0.062, t = 2.543, p < .05) exhibited significant positive effects on Pet Attachment. The model explained 40.3% of the variance in Pet Attachment (R² = .403).
The second model, referred to as the Dependent Model, examined Subjective Well-Being as the de-pendent variable. Depressive Symptoms had a significant negative effect on Subjective Well-Being (B = −0.167, SE = 0.024, t = −6.857, p < .001). Both Pet Attachment (B = 0.249, SE = 0.058, t = 4.329, p < .001) and the Human-Animal Bond (B = 0.330, SE = 0.047, t = 6.991, p < .001) had significant positive effects on Subjective Well-Being. Furthermore, the interaction between Depressive Symptoms and the Human-Animal Bond had a significant positive effect on Subjective Well-Being (B = 0.133, SE = 0.050, t = 2.656, p < .05). However, the interaction between Pet Attachment and the Human-Animal Bond was not significant (B = −0.043, SE = 0.051, t = −0.858, p > .05). This model explained 70.8% of the variance in Subjective Well-Being (R² = .708).
An evaluation of the increase in explanatory power due to interaction effects revealed that the inter-action between Depressive Symptoms and the Human-Animal Bond provided a significant additional contribution (ΔR² = 0.005, F = 7.055, p = .008). In contrast, the interaction between Pet Attachment and the Human-Animal Bond did not yield a significant increase in explanatory power (ΔR² = 0.001, F = 0.736, p > .05).
These findings suggest that the Human-Animal Bond moderates the direct effect of Depressive Symptoms on Subjective Well-Being but does not moderate the indirect pathway through Pet Attachment. Consequently, the moderated mediation effect in Model 15 was not significant. Additionally, the index of moderated mediation, as shown in Table 25, was not significant.
The moderating effect of the human-animal bond on the relationships between depressive symptoms, pet attachment, and subjective well-being is visually depicted in
Figure 9.
4. Discussion
Human-animal bond on subjective well-being, examining their relationships through mediation and moderation effects. The findings provide empirical evidence that relationships with pets can contribute to the enhancement of psychological well-being.
The negative impact of depressive symptoms on subjective well-being was partially mediated by attachment to pets. This result aligns with previous studies indicating that depressive symptoms reduce emotional stability and subjective well-being[
62] and that attachment to pets can mitigate these negative effects[
63]. Bowlby’s attachment theory, originally introduced in 1969, underscores the fundamental role of attachment in promoting emotional stability and psychological well-being[
9]. Emotional bonds with pets may serve as a valuable resource by reducing stress, fostering positive emotions, and providing a sense of emotional security[
2,
64].
The human-animal bond moderated both the direct relationship between depressive symptoms and subjective well-being and the indirect pathway from depressive symptoms through attachment to pets to subjective well-being. Specifically, a stronger human-animal bond attenuated the negative impact of depressive symptoms on subjective well-being, suggesting that the human-animal bond functions as a protective mechanism against psychological stress and emotional challenges[
6,
65]. These findings are consistent with social support theory[
66] and support prior research demonstrating that bonds with pets contribute to emotional stability and well-being[
4,
5].
While the human-animal bond moderated the direct relationship between depressive symptoms and subjective well-being, its moderating effect was not statistically significant in the indirect pathway involving attachment to pets. This suggests that the human-animal bond may exert a stronger influence on well-being through direct interactions with pets rather than through indirect emotional support[
7,
67]. These findings highlight the importance of direct interactions with pets, which may provide immediate emotional comfort and alleviate psychological stress.
Although dogs and cats exhibit distinct social behaviors and interaction patterns with humans[
13,
26,
27], no significant differences were observed between dog and cat owners in terms of depression, pet attachment, subjective well-being, or the human-animal bond. This suggests that the psychological benefits of pet ownership may not be species-specific but are instead influenced by the quality of the human-animal relationship. These results align with prior research emphasizing that the strength of the human-animal bond, rather than the type of pet, plays a more critical role in determining psychological outcomes[
5,
68].
The findings of this study have practical implications for psychological interventions and policy development. Integrating animal-assisted therapy programs into clinical settings may harness the emotional benefits of human-animal interactions. Public policies could promote pet adoption pro-grams and provide resources to strengthen human-animal bonds. For instance, community-based initiatives could include creating pet-friendly spaces, implementing educational campaigns on the psychological benefits of pet ownership, and offering support for individuals experiencing emotional difficulties.
Cultural differences in attitudes toward pets and human-animal relationships may influence the generalizability of these findings. For instance, in cultures where pet ownership is less common or where animals are viewed primarily as functional rather than emotional companions, the psycho-logical benefits of pet attachment may differ. Future studies could explore cross-cultural variations to provide a more global perspective.
This study is not without limitations. The cross-sectional design precludes causal inferences, and the lack of cultural diversity in the sample may limit the generalizability of the findings to groups with differing cultural attitudes toward pets. Future research should address these limitations by employing longitudinal designs, including diverse samples, and exploring psychological factors that shape human-animal relationships.
Figure 1.
Research models depicting mediating, moderating, mediated moderation, and moderated mediation effects in the relationships among depressive symptoms, human-animal bond, pet attachment, and subjective well-being. Model 1 examines the mediating effect of the human-animal bond, while Model 2 explores the moderating role of pet attachment. Models 3 and 4 investigate mediated moderation and moderated mediation, respectively.
Figure 2.
Sequential Mediation Model of the Effect of Pet Attachment in the Relationship Between Depressive Symptoms and Subjective Well-Being.
Figure 2.
Sequential Mediation Model of the Effect of Pet Attachment in the Relationship Between Depressive Symptoms and Subjective Well-Being.
Figure 3.
Moderating Effect of Human-Animal Bond on the Relationship Between Depressive Symptoms and Subjective Well-Being.
Figure 3.
Moderating Effect of Human-Animal Bond on the Relationship Between Depressive Symptoms and Subjective Well-Being.
Figure 4.
Simple Slope Analysis of the Moderating Effect of Human-Animal Bond on the Relationship Between Depressive Symptoms and Subjective Well-Being.
Figure 4.
Simple Slope Analysis of the Moderating Effect of Human-Animal Bond on the Relationship Between Depressive Symptoms and Subjective Well-Being.
Figure 5.
Moderated Mediation Model (PROCESS Model 8): The Role of the Human-Animal Bond in the Relationship Between Depressive Symptoms and Pet Attachment.
Figure 5.
Moderated Mediation Model (PROCESS Model 8): The Role of the Human-Animal Bond in the Relationship Between Depressive Symptoms and Pet Attachment.
Figure 6.
Visualization of the Moderating Effect of Human-Animal Bonding on the Relationship Between Depressive Symptoms and Pet Attachment.
Figure 6.
Visualization of the Moderating Effect of Human-Animal Bonding on the Relationship Between Depressive Symptoms and Pet Attachment.
Figure 1.
Moderated Mediation Model (PROCESS Model 8): The Role of the Human-Animal Bonding in the Indirect Effect of Depressive Symptoms on Subjective Well-Being through Pet Attachment.
Figure 1.
Moderated Mediation Model (PROCESS Model 8): The Role of the Human-Animal Bonding in the Indirect Effect of Depressive Symptoms on Subjective Well-Being through Pet Attachment.
Figure 2.
Visualization of the Moderating Effect of Human-Animal Bonding in the Indirect Effect of Depressive Symptoms on Subjective Well-Being through Pet Attachment.
Figure 2.
Visualization of the Moderating Effect of Human-Animal Bonding in the Indirect Effect of Depressive Symptoms on Subjective Well-Being through Pet Attachment.
Figure 3.
Moderated Mediation Model (PROCESS Model 8): The Role of the Human-Animal Bonding in the Relationship Between Depressive Symptoms, Pet Attachment, and Subjective Well-Being.
Figure 3.
Moderated Mediation Model (PROCESS Model 8): The Role of the Human-Animal Bonding in the Relationship Between Depressive Symptoms, Pet Attachment, and Subjective Well-Being.
Table 1.
Reliability Analysis of Measurement Scales.
Table 1.
Reliability Analysis of Measurement Scales.
| |
|
|
n=391 |
| Measure |
Number of Items |
Chrobach’s α |
| Depressive Symptoms Measure |
20 |
0.971 |
| Pet Attachment Measure |
18 |
0.914 |
| Human- Animal Bonding Measure |
8 |
0.829 |
| Subjective Well-Being Measure |
9 |
0.867 |
Table 2.
Model Fit Indices for the Confirmatory Factor Analysis(CFA) of the Lexington Pet Attachment Scale (LAPS).
Table 2.
Model Fit Indices for the Confirmatory Factor Analysis(CFA) of the Lexington Pet Attachment Scale (LAPS).
| |
|
n=391 |
| Fit Indices |
Value |
Acceptable Threshold |
| CFI |
0.966 |
≥ 0.90 (Good), ≥ 0.95 (Excellent) |
| TLI |
0.961 |
≥ 0.90 (Good), ≥ 0.95 (Excellent) |
| RMSEA |
0.041 |
< 0.06 (Good), < 0.08 (Acceptable) |
| SRMR |
0.034 |
< 0.08 |
| χ² |
222 (df = 134, p< .001) |
Non-significant preferred; sensitive to sample size |
Table 3.
Descriptive Statistics for Independent, Mediator, Moderator, Control, and depressive symptoms.
Table 3.
Descriptive Statistics for Independent, Mediator, Moderator, Control, and depressive symptoms.
| n=391 |
| Variable Types |
Variable Names |
M |
SD |
Skewness |
Kurtosis |
| Independent Variable |
Depressive Symptoms |
1.759 |
0.837 |
1.763 |
2.114 |
| Mediator Variable |
Pet Attachment |
4.275 |
0.517 |
-2.157 |
6.567 |
| Moderator Variable |
Human-Animal Bonding |
4.279 |
0.538 |
-1.720 |
3.924 |
| Control Variable |
Education Level |
2.504 |
0.787 |
-0.837 |
-0.402 |
| Income Status |
1.852 |
0.356 |
-1.986 |
1.956 |
| Dependent Variable |
Subjective Well-Being |
4.263 |
0.563 |
-2.096 |
5.304 |
| *p< .05, **p< .01, ***p< .001 |
Table 4.
Summary of Key Pearson Correlations Relevant to the Study Variables.
Table 4.
Summary of Key Pearson Correlations Relevant to the Study Variables.
| |
n=391 |
| |
Depressive Symptom |
Pet Attachment |
Human- Animal Bonding |
Education Level |
Income Status |
Subjective Well-Being |
| Depressive Symptoms |
1 |
|
|
|
|
|
| Pet Attachment |
-0.581** |
1 |
|
|
|
|
| Human- Animal Bonding |
-0.461** |
0.774** |
1 |
|
|
|
| Education Level |
0.090 |
0.183** |
0.193** |
1 |
|
|
| Income Status |
0.010 |
0.176** |
0.124* |
0.377** |
1 |
|
| Subjective Well-Being |
-0.619** |
0.761** |
0.730** |
0.074 |
0.188** |
1 |
| *p< .05, **p< .01, ***p< .001 |
Table 5.
Differences in Depressive Symptoms by Demographic Characteristics.
Table 5.
Differences in Depressive Symptoms by Demographic Characteristics.
| Outcome Variable |
N |
M |
SD |
t/F |
p |
Post-hoc |
| Gender |
Male |
137 |
4.15 |
0.58 |
-3.385*** |
.001 |
|
| Female |
254 |
4.35 |
0.502 |
| Age Group |
20 to 29 years old a
|
122 |
1.45 |
0.433 |
15.604*** |
.001 |
c>a |
| 30 to 39 years old b
|
187 |
1.91 |
0.973 |
| 40 to 49 years old c
|
57 |
2.03 |
0.955 |
| 50 to 59 years old d
|
25 |
1.52 |
0.245 |
| Occupation |
Student a
|
19 |
1.38 |
0.254 |
10.084*** |
.001 |
d>a |
| Office Worker b
|
266 |
1.78 |
0.893 |
| Self-employment c
|
67 |
1.68 |
0.684 |
| Other(unemployed) d
|
39 |
1.91 |
0.816 |
| Marital Status |
Married |
121 |
1.91 |
0.911 |
2.312* |
.022 |
|
| Single(non-marital) |
270 |
1.69 |
0.793 |
| Monthly Income |
Less than $1,500 a
|
41 |
1.92 |
0.797 |
7.599*** |
.001 |
a>b |
|
$1,500 and $2,000 b
|
145 |
1.53 |
0.601 |
|
$2,000 and $3,000 c
|
153 |
1.89 |
0.982 |
| Over $ 3,000 d
|
52 |
1.88 |
0.848 |
| Pet ownership Experience |
First |
295 |
1.82 |
0.883 |
2.866** |
.005 |
|
| Second over |
96 |
1.58 |
0.646 |
| Pet Age |
< 3 years old a
|
151 |
1.92 |
0.963 |
5.407** |
.002 |
a>d |
| 4 to 6 years old b
|
171 |
1.68 |
0.798 |
| 7 to 9 years old c
|
51 |
1.62 |
0.573 |
| >10 years old d
|
18 |
1.5 |
0.311 |
| Duration of Pet Ownership |
< 3 years a
|
157 |
1.93 |
0.975 |
15.352*** |
.001 |
a>d |
| 4 to 6 years b
|
147 |
1.72 |
0.805 |
| 7 to 9 years c
|
46 |
1.65 |
0.594 |
| >10 years d
|
41 |
1.38 |
0.282 |
| *p< .05, **p< .01, ***p< .001; M, mean; SD, standard deviation; Superscripts (a, b, c, d) denote significant group differences based on post-hoc analysis; NA, not applicable. |
Table 6.
Differences in Pet Attachment by Demographic Characteristics.
Table 6.
Differences in Pet Attachment by Demographic Characteristics.
| Outcome Variable |
N |
M |
SD |
t/F |
p |
Post-hoc |
| Gender |
Male |
137 |
4.13 |
0.529 |
-4.183*** |
.001 |
|
| Female |
254 |
4.36 |
0.492 |
| Age Group |
20 to 29 years old a
|
122 |
4.35 |
0.476 |
3.001* |
.034 |
a>c |
| 30 to 39 years old b
|
187 |
4.28 |
0.51 |
| 40 to 49 years old c
|
57 |
4.08 |
0.63 |
| 50 to 59 years old d
|
25 |
4.33 |
0.354 |
| Education Level |
Up to high school a
|
62 |
4.09 |
0.672 |
3.526* |
.022 |
c>a |
| College b
|
80 |
4.21 |
0.543 |
| Undergraduate degree c
|
239 |
4.34 |
0.454 |
| Graduate degree d
|
10 |
4.34 |
0.238 |
| Income Status |
Income |
58 |
4.06 |
0.856 |
-2.230* |
.029 |
|
| No Income |
333 |
4.31 |
0.422 |
| Monthly Income |
Less than $1,500 a
|
41 |
3.89 |
0.934 |
4.289** |
.007 |
b>a |
|
$1,500 and $2,000 b
|
145 |
4.37 |
0.33 |
|
$2,000 and $3,000 c
|
153 |
4.28 |
0.461 |
| Over $ 3,000 d
|
52 |
4.31 |
0.517 |
| Pet Age |
< 3 years old a
|
171 |
4.36 |
0.42 |
3.008* |
.036 |
b>a |
| 4 to 6 years old b
|
51 |
4.27 |
0.409 |
| 7 to 9 years old c
|
18 |
4.33 |
0.409 |
| >10 years old d
|
137 |
4.13 |
0.529 |
| *p< .05, **p< .01, ***p< .001; M, mean; SD, standard deviation; Superscripts (a, b, c, d) denote significant group differences based on post-hoc analysis; NA, not applicable. |
Table 7.
Differences in Human-Animal Bond by Demographic Characteristics.
Table 7.
Differences in Human-Animal Bond by Demographic Characteristics.
| Outcome Variable |
N |
M |
SD |
t/F |
p |
Post-hoc |
| Gender |
Male |
137 |
4.15 |
0.58 |
-3.385*** |
.001 |
|
| Female |
254 |
4.35 |
0.502 |
| Age Group |
20 to 29 years old a
|
122 |
4.38 |
0.478 |
4.552** |
.005 |
b>a |
| 30 to 39 years old b
|
187 |
4.31 |
0.497 |
| 40 to 49 years old c
|
57 |
4.04 |
0.687 |
| 50 to 59 years old d
|
25 |
4.13 |
0.567 |
| Education Level |
Up to high school a
|
19 |
4.01 |
0.702 |
4.639** |
.007 |
c>a |
| College b
|
266 |
4.28 |
0.551 |
| Undergraduate degree c
|
67 |
4.35 |
0.462 |
| Graduate degree d
|
39 |
4.16 |
0.51 |
| Marital Status |
Married |
121 |
4.14 |
0.604 |
-3.148** |
.002 |
|
| Single(non-marital) |
270 |
4.34 |
0.495 |
| Monthly Income |
Less than $1,500 a
|
41 |
4.03 |
0.888 |
3.818* |
.012 |
NS. |
|
$1,500 and $2,000 b
|
145 |
4.38 |
0.372 |
|
$2,000 and $3,000 c
|
153 |
4.27 |
0.499 |
| Over $ 3,000 d
|
52 |
4.22 |
0.616 |
| Pet ownership Experience |
First |
295 |
4.25 |
0.54 |
-2.079* |
.038 |
|
| Second over |
96 |
4.38 |
0.525 |
| Pet Age |
< 3 years old a
|
151 |
4.16 |
0.63 |
3.804* |
.014 |
b>a |
| 4 to 6 years old b
|
171 |
4.37 |
0.453 |
| 7 to 9 years old c
|
51 |
4.3 |
0.478 |
| >10 years old d
|
18 |
4.32 |
0.466 |
| Duration of Pet Ownership |
< 3 years a
|
157 |
4.17 |
0.619 |
3.986** |
.009 |
b>a |
| 4 to 6 years b
|
147 |
4.38 |
0.46 |
| 7 to 9 years c
|
46 |
4.27 |
0.522 |
| >10 years d
|
41 |
4.36 |
0.405 |
| *p< .05, **p< .01, ***p< .001; M, mean; SD, standard deviation; Superscripts (a, b, c, d) denote significant group differences based on post-hoc analysis; NA, not applicable. |
Table 8.
Differences in Subjective Well-Being by Demographic Characteristics.
Table 8.
Differences in Subjective Well-Being by Demographic Characteristics.
| Outcome Variable |
N |
M |
SD |
t/F |
p |
Post-hoc |
| Gender |
Male |
137 |
4.12 |
0.649 |
-3.593*** |
.001 |
|
| Female |
254 |
4.34 |
0.494 |
| Age Group |
20 to 29 years old a
|
122 |
4.42 |
0.496 |
6.355*** |
.001 |
a>c |
| 30 to 39 years old b
|
187 |
4.24 |
0.589 |
| 40 to 49 years old c
|
57 |
4.04 |
0.617 |
| 50 to 59 years old d
|
25 |
4.24 |
0.301 |
| Occupation |
Student a
|
19 |
4.37 |
0.308 |
3.749* |
.015 |
a>d |
| Office Worker b
|
266 |
4.3 |
0.518 |
| Self-employment c
|
67 |
4.35 |
0.298 |
| Other(unemployed) d
|
39 |
3.83 |
0.983 |
| Income Status |
Income |
58 |
4.01 |
0.86 |
-2.570* |
.013 |
|
| No Income |
333 |
4.31 |
0.482 |
| Marital Status |
Married |
121 |
4.17 |
0.499 |
-2.320* |
.021 |
|
| Single(non-marital) |
270 |
4.31 |
0.585 |
| Monthly Income |
Less than $1,500 a
|
41 |
3.92 |
1.003 |
7.652** |
.001 |
b>a |
|
$1,500 and $2,000 b
|
145 |
4.41 |
0.305 |
|
$2,000 and $3,000 c
|
153 |
4.24 |
0.551 |
| Over $ 3,000 d
|
52 |
4.19 |
0.553 |
| Pet ownership Experience |
First |
295 |
4.22 |
0.598 |
-3.423** |
.001 |
|
| Second over |
96 |
4.4 |
0.409 |
| Pet Age |
< 3 years old a
|
151 |
4.14 |
0.696 |
5.807** |
.001 |
d>a |
| 4 to 6 years old b
|
171 |
4.38 |
0.445 |
| 7 to 9 years old c
|
51 |
4.22 |
0.47 |
| >10 years old d
|
18 |
4.41 |
0.277 |
| Duration of Pet Ownership |
< 3 years a
|
157 |
4.14 |
0.685 |
7.300** |
.001 |
d>a |
| 4 to 6 years b
|
147 |
4.35 |
0.459 |
| 7 to 9 years c
|
46 |
4.22 |
0.477 |
| >10 years d
|
41 |
4.46 |
0.32 |
| *p< .05, **p< .01, ***p< .001; M, mean; SD, standard deviation; Superscripts (a, b, c, d) denote significant group differences based on post-hoc analysis; NA, not applicable. |
Table 9.
Simple Linear Regression Analysis of the Effect of Depressive Symptoms on Pet Attachment.
Table 9.
Simple Linear Regression Analysis of the Effect of Depressive Symptoms on Pet Attachment.
| Variable |
B |
SE |
β |
t (p) |
F (p) |
R² |
| (Constant) |
4.905 |
0.050 |
|
98.841*** |
197.887*** |
0.211 |
| Depressive Symptoms |
-0.358 |
0.025 |
-0.581 |
-14.067*** |
| *p< .05, **p< .01, ***p< .001 |
Table 10.
Simple Linear Regression Analysis of the Effect of Depressive Symptoms on Pet Attachment.
Table 10.
Simple Linear Regression Analysis of the Effect of Depressive Symptoms on Pet Attachment.
| Variable |
B |
SE |
β |
t (p) |
F (p) |
R² |
| (Constant) |
4.997 |
0.052 |
|
95.750*** |
241.964*** |
0.382 |
| Depressive Symptoms |
-0.417 |
0.027 |
-0.619 |
-15.555*** |
| *p< .05, **p< .01, ***p< .001 |
Table 11.
Multiple Linear Regression Analysis of the Effects of Depressive Symptoms, Pet Attachment, and Human-Animal Bond on Subjective Well-Being.
Table 11.
Multiple Linear Regression Analysis of the Effects of Depressive Symptoms, Pet Attachment, and Human-Animal Bond on Subjective Well-Being.
| Variable |
B |
SE |
β |
t |
p |
TOL |
VIF |
| (Constant) |
1.389 |
0.258 |
|
5.393*** |
.000 |
|
|
| Depressive Symptoms |
0.356 |
0.048 |
0.340 |
7.363*** |
.000 |
0.373 |
2.681 |
| Pet Attachment |
-0.158 |
0.025 |
-0.234 |
-6.246*** |
.000 |
0.566 |
1.767 |
| Human-Animal Bond |
0.372 |
0.057 |
0.341 |
6.556*** |
.000 |
0.294 |
3.399 |
| Gender |
0.037 |
0.037 |
0.032 |
1.000 |
.318 |
0.793 |
1.261 |
| Age Group |
-0.031 |
0.027 |
-0.047 |
-1.146 |
.252 |
0.470 |
2.126 |
| Education Level |
-0.059 |
0.023 |
-0.082 |
-2.511* |
.012 |
0.750 |
1.334 |
| Occupation |
-0.053 |
0.027 |
-0.068 |
-1.957 |
.051 |
0.654 |
1.529 |
| Income Status |
0.202 |
0.059 |
0.127 |
3.402** |
.001 |
0.567 |
1.765 |
| Marital Status |
-0.073 |
0.047 |
-0.060 |
-1.547 |
.123 |
0.535 |
1.869 |
| Monthly Income |
-0.030 |
0.025 |
-0.045 |
-1.225 |
.221 |
0.578 |
1.730 |
| Pet Ownership Experience |
0.038 |
0.052 |
0.029 |
0.732 |
.464 |
0.511 |
1.958 |
| Pet Age |
0.071 |
0.060 |
0.042 |
1.183 |
.237 |
0.643 |
1.556 |
| Duration of Pet Ownership |
-0.041 |
0.038 |
-0.060 |
-1.072 |
.284 |
0.258 |
3.882 |
| F(p) |
62.193*** |
|
adj.R2
|
0.690 |
| Durbin-Watson |
1.867 |
| *p< .05, **p< .01, ***p< .001 |
Table 12.
Mediation Analysis of the Effect of Depressive Symptoms on Subjective Well-Being through Pet Attachment.
Table 12.
Mediation Analysis of the Effect of Depressive Symptoms on Subjective Well-Being through Pet Attachment.
| Model |
Independent variable |
Dependent Variable |
B |
SE |
t |
95% CI |
| LLCI |
ULCI |
| 1 |
Depressive Symptoms |
Pet Attachment |
-0.370 |
0.024 |
-15.200*** |
-0.418 |
-0.322 |
| |
Education Level |
0.129 |
0.028 |
4.625*** |
0.074 |
0.184 |
| Income Status |
0.157 |
0.062 |
2.543* |
0.035 |
0.278 |
| |
F= 87.179***, R2= 0.403 |
| 2 |
Depressive Symptoms |
Subjective Well-Being |
-0.182 |
0.026 |
-6.947*** |
-0.234 |
-0.131 |
| Pet Attachment |
0.647 |
0.043 |
14.928*** |
0.562 |
0.733 |
| |
Education Level |
-0.035 |
0.024 |
-1.445 |
-0.084 |
0.013 |
| Income Status |
0.166 |
0.053 |
3.135** |
0.062 |
0.270 |
| |
F= 168.274***, R2= 0.636 |
| 3 |
Depressive Symptoms |
Subjective Well-Being |
-0.422 |
0.026 |
-16.195*** |
-0.473 |
-0.371 |
| |
Education Level |
0.048 |
0.030 |
1.614 |
-0.011 |
0.107 |
| Income Status |
0.267 |
0.066 |
4.058*** |
0.138 |
0.397 |
| |
F= 95.395***, R2= 0.425 |
| *p< .05, **p< .01, ***p< .001; † LLCI: the lower bound within the 95% confidence interval of the bootstrap indirect effect; ‡ ULCI: the upper bound within the 95% confidence interval of the bootstrap indirect effect.; The results are presented in unstandardized coefficients. |
Table 13.
Mediation Analysis Results for the Effect of Depressive Symptoms on Subjective Well-Being.
Table 13.
Mediation Analysis Results for the Effect of Depressive Symptoms on Subjective Well-Being.
| Category |
Effect |
Boot S.E. |
95% CI |
| Boot LLCI |
Boot ULCI |
| Total effect(t) |
-0.422 |
0.026 |
-0.473 |
-0.371 |
| Direct Effect (c) |
-0.182 |
0.026 |
-0.234 |
-0.131 |
| Indirect Effect (a×b) |
-0.240 |
0.040 |
-0.310 |
-0.170 |
| † LLCI: Lower bound of the 95% confidence interval for the bootstrap indirect effect; ‡ULCI: Upper bound of the 95% confidence interval for the bootstrap indirect effect.; Boot S.E, Bootstrap Standard Error |
Table 14.
Moderating Effect of Human-Animal Bond on the Relationship Between Depressive Symptoms and Subjective Well-Being.
Table 14.
Moderating Effect of Human-Animal Bond on the Relationship Between Depressive Symptoms and Subjective Well-Being.
| Variable |
B |
SE |
t |
p |
| Depressive Symptoms |
-0.203 |
0.023 |
-8.935*** |
.000 |
| Human-Animal Bond |
0.462 |
0.039 |
11.927*** |
.000 |
Depressive Symptoms x
Human-Animal Bond |
0.214 |
0.031 |
6.970*** |
.000 |
| Education Level |
-0.009 |
0.023 |
-0.397 |
.691 |
| Income Status |
0.163 |
0.049 |
3.310** |
.001 |
| F |
1,710.881*** |
| R2
|
0.691 |
|
∆R2
|
0.039 (F = 48.585, p = .000)
|
| *p< .05, **p< .01, ***p< .001 |
Table 15.
Conditional Moderating Effect of Human-Animal Bond on the Relationship Between Depressive Symptoms and Subjective Well-Being.
Table 15.
Conditional Moderating Effect of Human-Animal Bond on the Relationship Between Depressive Symptoms and Subjective Well-Being.
| Variable |
B |
SE |
t |
p |
| -.538(-1SD) |
-0.318 |
0.025 |
-12.947*** |
.000 |
| .000(Mean) |
-0.203 |
0.023 |
-8.935*** |
.000 |
| .538(+1SD) |
-0.087 |
0.031 |
-2.805** |
.005 |
| *p< .05, **p< .01, ***p< .001 |
Table 16.
Johnson-Neyman Analysis of Human-Animal Bond on the Relationship Between Depressive Symptoms and Subjective Well-Being.
Table 16.
Johnson-Neyman Analysis of Human-Animal Bond on the Relationship Between Depressive Symptoms and Subjective Well-Being.
| Human-Animal Bond Level |
Percentage (%) |
| % below |
98.465% |
| % above |
1.535% |
| Critical Value |
0.640 |
| Critical Value, Threshold. |
Table 17.
Moderated Mediation Effect of Human-Animal Bonding on the Relationship Between Depressive Symptoms and Pet Attachment.
Table 17.
Moderated Mediation Effect of Human-Animal Bonding on the Relationship Between Depressive Symptoms and Pet Attachment.
| Model |
Variable |
B |
SE |
t |
95% CI |
| LLCI |
ULCI |
| Mediator Model (Dependent Variable: Pet Attachment) |
| 1 |
Depressive Symptoms |
-0.155 |
0.020 |
-7.703*** |
-0.195 |
-0.115 |
| Human-Animal Bonding |
0.484 |
0.034 |
14.063*** |
0.416 |
0.551 |
| Depressive Symptoms x Human-Animal Bonding |
0.183 |
0.027 |
6.728*** |
0.130 |
0.237 |
| Education Level |
0.067 |
0.020 |
3.276** |
0.027 |
0.107 |
| Income Status |
0.061 |
0.044 |
1.400 |
-0.025 |
0.147 |
| F= 188.870*** |
| R2= .710 |
|
∆R2 = 0.034(F=45.262, p= 0.000)
|
| *p< .05, **p< .01, ***p< .001; † LLCI: the lower bound within the 95% confidence interval of the bootstrap indirect effect; ‡ ULCI: the upper bound within the 95% confidence interval of the bootstrap indirect effect.; The results are presented in unstandardized coefficients. |
Table 1.
The Conditional Direct Effect of Human-Animal Bonding on the Relationship Between Depressive Symptoms and Pet Attachment.
Table 1.
The Conditional Direct Effect of Human-Animal Bonding on the Relationship Between Depressive Symptoms and Pet Attachment.
| Variable |
B |
SE |
t |
p |
| -.538(-1SD) |
-0.254 |
0.022 |
-11.646 |
.000 |
| .000(Mean) |
-0.155 |
0.02 |
-7.703 |
.000 |
| .538(+1SD) |
-0.056 |
0.028 |
-2.038 |
.042 |
| *p< .05, **p< .01, ***p< .001 |
Table 19.
Threshold Analysis of Pet Attachment Level in Moderating the Effect of Depressive Symptoms Pet Attachment.
Table 19.
Threshold Analysis of Pet Attachment Level in Moderating the Effect of Depressive Symptoms Pet Attachment.
| Human-Animal Bonding Level |
Percentage(%) |
| % below |
92.327% |
| % above |
7.673% |
| Critical Value |
0.547 |
| Critical Value, Threshold. |
Table 2.
Moderated Mediation Analysis of the Effect of Human-Animal Bonding on the Relationship Between Depressive Symptoms and Subjective Well-Being.
Table 2.
Moderated Mediation Analysis of the Effect of Human-Animal Bonding on the Relationship Between Depressive Symptoms and Subjective Well-Being.
| Model |
Variable |
B |
SE |
t |
95% CI |
| LLCI |
ULCI |
| Dependent Model (Dependent Variable: Subjective Well-Being) |
| 1 |
Depressive Symptoms |
-0.162 |
0.024 |
-6.835*** |
-0.209 |
-0.116 |
| Pet Attachment |
0.261 |
0.056 |
4.658*** |
0.151 |
0.371 |
| Human-Animal Bonding |
0.336 |
0.046 |
7.238*** |
0.245 |
0.428 |
| Depressive Symptoms x Human-Animal Bonding |
0.166 |
0.032 |
5.258*** |
0.104 |
0.228 |
| Education Level |
-0.027 |
0.023 |
-1.169 |
-0.071 |
0.018 |
| Income Status |
0.147 |
0.048 |
3.058* |
0.053 |
0.242 |
| F= 154.548*** |
| R2= .707 |
|
∆R2 = 0.021(F=27.644, p= 0.000)
|
| *p< .05, **p< .01, ***p< .001; † LLCI: the lower bound within the 95% confidence interval of the bootstrap indirect effect; ‡ ULCI: the upper bound within the 95% confidence interval of the bootstrap indirect effect.; The results are presented in unstandardized coefficients. |
Table 21.
The Conditional Direct Effect of Human-Animal Bonding on the Relationship Between Depressive Symptoms and Subjective Well-Being.
Table 21.
The Conditional Direct Effect of Human-Animal Bonding on the Relationship Between Depressive Symptoms and Subjective Well-Being.
| Variable |
B |
SE |
t |
p |
| -.538(-1SD) |
-0.252 |
0.028 |
-9.052 |
.000 |
| .000(Mean) |
-0.162 |
0.024 |
-6.835 |
.000 |
| .538(+1SD) |
-0.073 |
0.031 |
-2.383 |
.018 |
| *p< .05, **p< .01, ***p< .001 |
Table 22.
Threshold Analysis of Human-Animal Bonding Level in Moderating the Effect of Depressive Symptoms on Subjective Well-Being.
Table 22.
Threshold Analysis of Human-Animal Bonding Level in Moderating the Effect of Depressive Symptoms on Subjective Well-Being.
| Human-Animal Bonding Level |
Percentage(%) |
| % below |
98.465% |
| % above |
1.535% |
| Critical Value |
0.600 |
| Critical Value, Threshold. |
Table 23.
Conditional Indirect Effects of Depressive Symptoms on Subjective Well-Being at Varying Levels of Human-Animal Bonding and the Moderated Mediation Index.
Table 23.
Conditional Indirect Effects of Depressive Symptoms on Subjective Well-Being at Varying Levels of Human-Animal Bonding and the Moderated Mediation Index.
| Human-Animal Bonding |
Effect |
Boot SE |
Boot LLCI |
Boot ULCI |
| -.538(-1SD) |
-0.066 |
0.018 |
-0.102 |
-0.033 |
| .000(Mean) |
-0.040 |
0.012 |
-0.065 |
-0.019 |
| .538(+1SD) |
-0.015 |
0.009 |
-0.035 |
0.002 |
| Moderated Mediation Index |
Index |
Boot SE |
Boot LLCI |
Boot ULCI |
| Human-Animal Bonding |
0.016 |
0.026 |
-0.029 |
0.074 |
| † LLCI: the lower bound within the 95% confidence interval of the bootstrap indirect effect; ‡ ULCI: the upper bound within the 95% confidence interval of the bootstrap indirect effect.; The results are presented in unstandardized coefficients. |
Table 24.
Mediation and Moderated Mediation Effects of the Human-Animal Bond on the Relationship Between Pet Attachment and Subjective Well-Being: Model 15 Results.
Table 24.
Mediation and Moderated Mediation Effects of the Human-Animal Bond on the Relationship Between Pet Attachment and Subjective Well-Being: Model 15 Results.
| Model |
Variable |
B |
SE |
t |
95% CI |
| LLCI |
ULCI |
| Mediator Model (Dependent Variable: Pet Attachment) |
| 1 |
Depressive Symptoms |
-0.370 |
0.024 |
-15.200*** |
-0.418 |
-0.322 |
| Education Level |
0.129 |
0.028 |
4.625*** |
0.074 |
0.184 |
| Income Status |
0.157 |
0.062 |
2.543* |
0.035 |
0.278 |
| F= 87.179***, R2= .403 |
| Dependent Model (Dependent Variable: Subjective Well-Being) |
| 2 |
Depressive Symptoms |
-0.167 |
0.024 |
-6.857*** |
-0.215 |
-0.119 |
| Pet Attachment |
0.249 |
0.058 |
4.329*** |
0.136 |
0.362 |
| |
Human-Animal Bonding |
0.330 |
0.047 |
6.991*** |
0.237 |
0.422 |
| Depressive Symptoms x Human-Animal Bonding |
0.133 |
0.050 |
2.656* |
0.035 |
0.231 |
| Pet Attachment x Human-Animal Bonding |
-0.043 |
0.051 |
-0.858 |
-0.143 |
0.056 |
| Education Level |
-0.029 |
0.023 |
-1.250 |
-0.073 |
0.016 |
| Income Status |
0.141 |
0.049 |
2.894** |
0.045 |
0.237 |
| F= 132.484*** |
| R2= 0.708 |
| Depressive Symptoms x Human-Animal Bonding |
∆R2 = 0.005(F=7.055, p= 0.008)
|
| Pet Attachment x Human-Animal Bonding |
∆R2 = 0.001(F=0.736, p= 0.000)
|
| *p< .05, **p< .01, ***p< .001; † LLCI: the lower bound within the 95% confidence interval of the bootstrap indirect effect; ‡ ULCI: the upper bound within the 95% confidence interval of the bootstrap indirect effect.; The results are presented in unstandardized coefficients. |