

Submitted:
01 September 2025
Posted:
02 September 2025
You are already at the latest version
Abstract
In order to alleviate the constraints of global warming and sustainable development, digitalization has become an inevitable trend to promote agricultural carbon emission reduction. Under this situation, China insists on promoting moderate scale operation of agriculture. However, could -moderate scale operation promote -digital emission reduction in agriculture? Based on the data of three follow-up surveys from 2022 to 2024 to quantify the level of moderate scale operation in Jiangsu China, We verified that the boosting effect of carbon-constrained moderate scale management (MSM) in agricultural digital emission reduction, and the intermediary and regulation mechanism of agricultural internal and external scale management. We found that: (1) Calculated DEA model ,the scale of agricultural land in Jiangsu showed an "inverted S" trend with MSM and an "inverted W" trend with the overall agricultural carbon emission efficiency (ACEE), and the highest agricultural carbon emission efficiency is 0.855 in the moderate scale range of 20-36.667 hm2; (2)Tobit model showed that digital technology (DTE) has a significant inhibitory effect on ACEE(p< 10%), and the boosting effect of moderate scale management with carbon constraints is studied from the whole and the part respectively. On the whole, DTE has a better inhibitory effect on ACEE, while data resources (DRE), DTE and network platform (NTE) all significantly inhibit ACEE locally-that was DTE > DRE > NTE. (3) In digital carbon emission,the negative mediating effect about Employment of labor (EOL) in internal scale operation is as follows: DTE>NTE>DRE, and the negative mediating effect of agricultural mechanization (AML) is as follows: DRE > DTE > NTE; (4) In the external scale operation, organized operation (OML) significantly positively regulates the inhibitory effect of DRE on ACEE, while social service (SSS) significantly positively regulates the inhibitory effect of DTE on ACEE. Finally ,we provided suggestions and measures for the digital, large-scale and low-carbon development of agriculture in China and even in the world.
Keywords:
Agricultural carbon emission efficiency
; Moderate scale management level with carbon constraints
; Tobit model
; Intermediary mechanism model
; Regulatory effect model
1. Introduction
Realizing digital effective carbon emission reduction is the endogenous need of high-quality agricultural development in China, which is of great significance to alleviating global warming and promoting sustainable agricultural development. Agriculture, as the second largest carbon source in the world, has the property of carbon sink (Wang et al.,2022) [1]. With its rapid development, high input such as pesticides, fertilizers, agricultural machinery, and high emission of livestock manure have increased agricultural carbon emissions. The 2023 Low Carbon Development Report of China Agriculture and Rural Areas shows that the total carbon emissions of agricultural in China are 828 million tons of carbon dioxide equivalent, accounting for 6.7% of the national carbon emissions, and the agricultural "carbon deficit" (emission-absorption > 0) will exist for a long time (Yang Al., 2019) [2]. In order to solve the problem of resource and environment constraints and achieve sustainable development, in 2022, China put forward the strategic plan of "actively and steadily promoting carbon neutrality in peak carbon dioxide emissions", and has contributed more than 10% of emission effects to various industries with the help of digital model (GSMA,2020; Balyan.,2024) [3,4]. However, the environmental problems caused by agricultural non-agricultural and non-food, intensive and large-scale production and operation activities have brought severe impacts on the green and low-carbon transformation of agriculture, resulting in the synergistic effect of agricultural carbon sequestration and digital development (Guo et al.,2025; Crippa al., 2022) [5,6], and there is an inverted U-shaped relationship between grain yield and sown area of land, agricultural scale and agricultural low-carbon development level (Zheng Zhihao et al., 2024; Li et al.,2022) [7,8], various factors have aggravated the pressure of agricultural carbon emission reduction (Guo Yi et al., 2022) [9]. Therefore, exploring the key factors that affect the efficiency of agricultural carbon emission, clarifying the mechanism path of digitalization, scale and low carbon, and making the future agriculture develop towards mechanization, digitalization, standardization, industrialization and greening by realizing moderate scale operation of agriculture will become an important issue that needs to be solved urgently under the coupling background of China’s "double carbon" goal and rural revitalization strategy.
Existing scholars have conducted in-depth research on carbon emission reduction of digital empowerment agriculture, and explored the contribution of digital agriculture to carbon emission reduction and the nonlinear relationship between digitalization and carbon (Ma et al.,2022; Zhu et al.,2024) [10,11], which proved that agriculture digitalization can significantly inhibit the intensity of l carbon emissions (Zhu et al.,2023; Li et al.,2024) [12,13], and its’ technology spillover will reduce the intensity of carbon emissions, which is persistent. Differences in the usage of digital technology will have an impact on environmental regulation and pollution of carbon emissions (Feng al., 2019) [14], some scholars have also found that digital technology significantly reduces the utilization rate of pesticides and fertilizers in rice production, especially among large-scale and part-time farmers (Deng et al., 2024) [15]. About research on scale and carbon emissions, scholars (Xu et al.,2024) [16] verified that the scale of agricultural land has a positive impact on the adoption of green technologies, and proved that socialized services can break the labor constraints by promoting the scale effect, thus reducing the intensity of agricultural carbon emissions (Chen et al.,2022) [17], and the scale of planting land in major rice and wheat producing areas in China has a threshold effect on agricultural carbon emissions. Among them, the change of carbon emissions from chemical fertilizers is the main one (Li et al.,2022; Li et al.,2023) [8,18], the expansion of agricultural land management scale significantly increased foreign exchange emissions (Wu et al.,2024) [19]; About digitalization and agricultural scale, some scholars have found that farmland circulation promotes the development of digital agriculture by transferring labor (Yu et al.,2022) [20], and the popularization of digital agricultural technology has a greater impact on small-scale farmers’ adoption of ecological control technology (Zhang et al.,2024) [21], and land scale management and service could positively affect agricultural production efficiency (Liang et al.,2024) [22]. Some scholars also found that agricultural digitalization can improve fertilizer utilization efficiency by expanding the scale of farmland management, promoting the development of agricultural socialized services and using green technology (Wang Huimin et al., 2024) [23]. Farmland circulation had a significant positive mediating effect between digitalization and income of large-scale farmers, and has a significant relationship with agricultural low carbon (Zhang et al.,2023; Song et al.,2024) [24,25]. In addition, a few scholars have studied the moderate-scale operation of agriculture, and found that the moderate-scale operation at the farmer level is generally increasing, which has no obvious correlation with the change of plot size, and the scale, quantity, distance of plots and the fragmentation of agricultural land all affect operating effect (Yu et al.,2022; Shi et al., 2022) [20,26], and social services can break labor constraints by promoting scale effect thus reducing the intensity of agricultural carbon emissions in scale management(Chen et al.,2022) [17].
We found that, firstly, most of the existing literature studies digitalization and low carbonization, digitalization and scale, or scale and low carbonization. and there are few studies linking the three; Second, most of the research only analyzes and discusses the scale operation, and rarely explores the influence mechanism and path of "moderate scale operation" on agricultural carbon emission reduction; Third, most of the existing studies use DEA model to measure the scale operation level, but less about the moderate scale operation level of agriculture, and even less about the moderate scale operation level of agriculture under low-carbon constraints. Therefore, this paper measures agricultural carbon emission efficiency based on the SBM-DEA model of unexpected output, improved the measurement method of agricultural moderate scale operation level, and explored the mechanism of agricultural digital emission reduction under the moderate scale operation environment with carbon constraints by using intermediary and regulation models, and provide some reference for agricultural green and low-carbon development.
The potential marginal contributions of this study were as follows: first, innovatively design the measurement method of agricultural moderate scale operation level, and bring "carbon" into the measurement range of moderate scale operation level; Secondly, based on farmers’ survey data, measure the agriculture moderate scale management level and interval of Jiangsu china, and further explore the trend relationship among land scale, carbon-constrained moderate scale management level and agricultural carbon emission efficiency; Third, based on Tobit model, explore the boosting effect of digital empowerment factors on agricultural carbon emission efficiency under the boosting effect of moderate scale operation level, and quantitatively analyze the contribution of digital empowerment; The fourth is to analyze the intermediary and regulation mechanism of internal scale operation and external scale operation in agricultural digital emission reduction. These were helpful for China to better control the scale of moderate-scale agricultural operation, achieve effective carbon reduction under both economic and green benefits, and provide scientific reference for promoting moderate-scale agricultural operation and formulating effective carbon emission reduction measures.
2. Theoretical Framework and Research Assumptions
2.1. Theoretical Framework Analysis
Based on the perspective of efficiency innovation under the theory of economies of scale and returns to scale, this study establishes a research model to measure the internal logic and influence mechanism of agricultural digital emission reduction, so as to better clarify the internal logic relationship between digital empowerment level, internal scale operation, external scale operation and agricultural carbon emission efficiency.
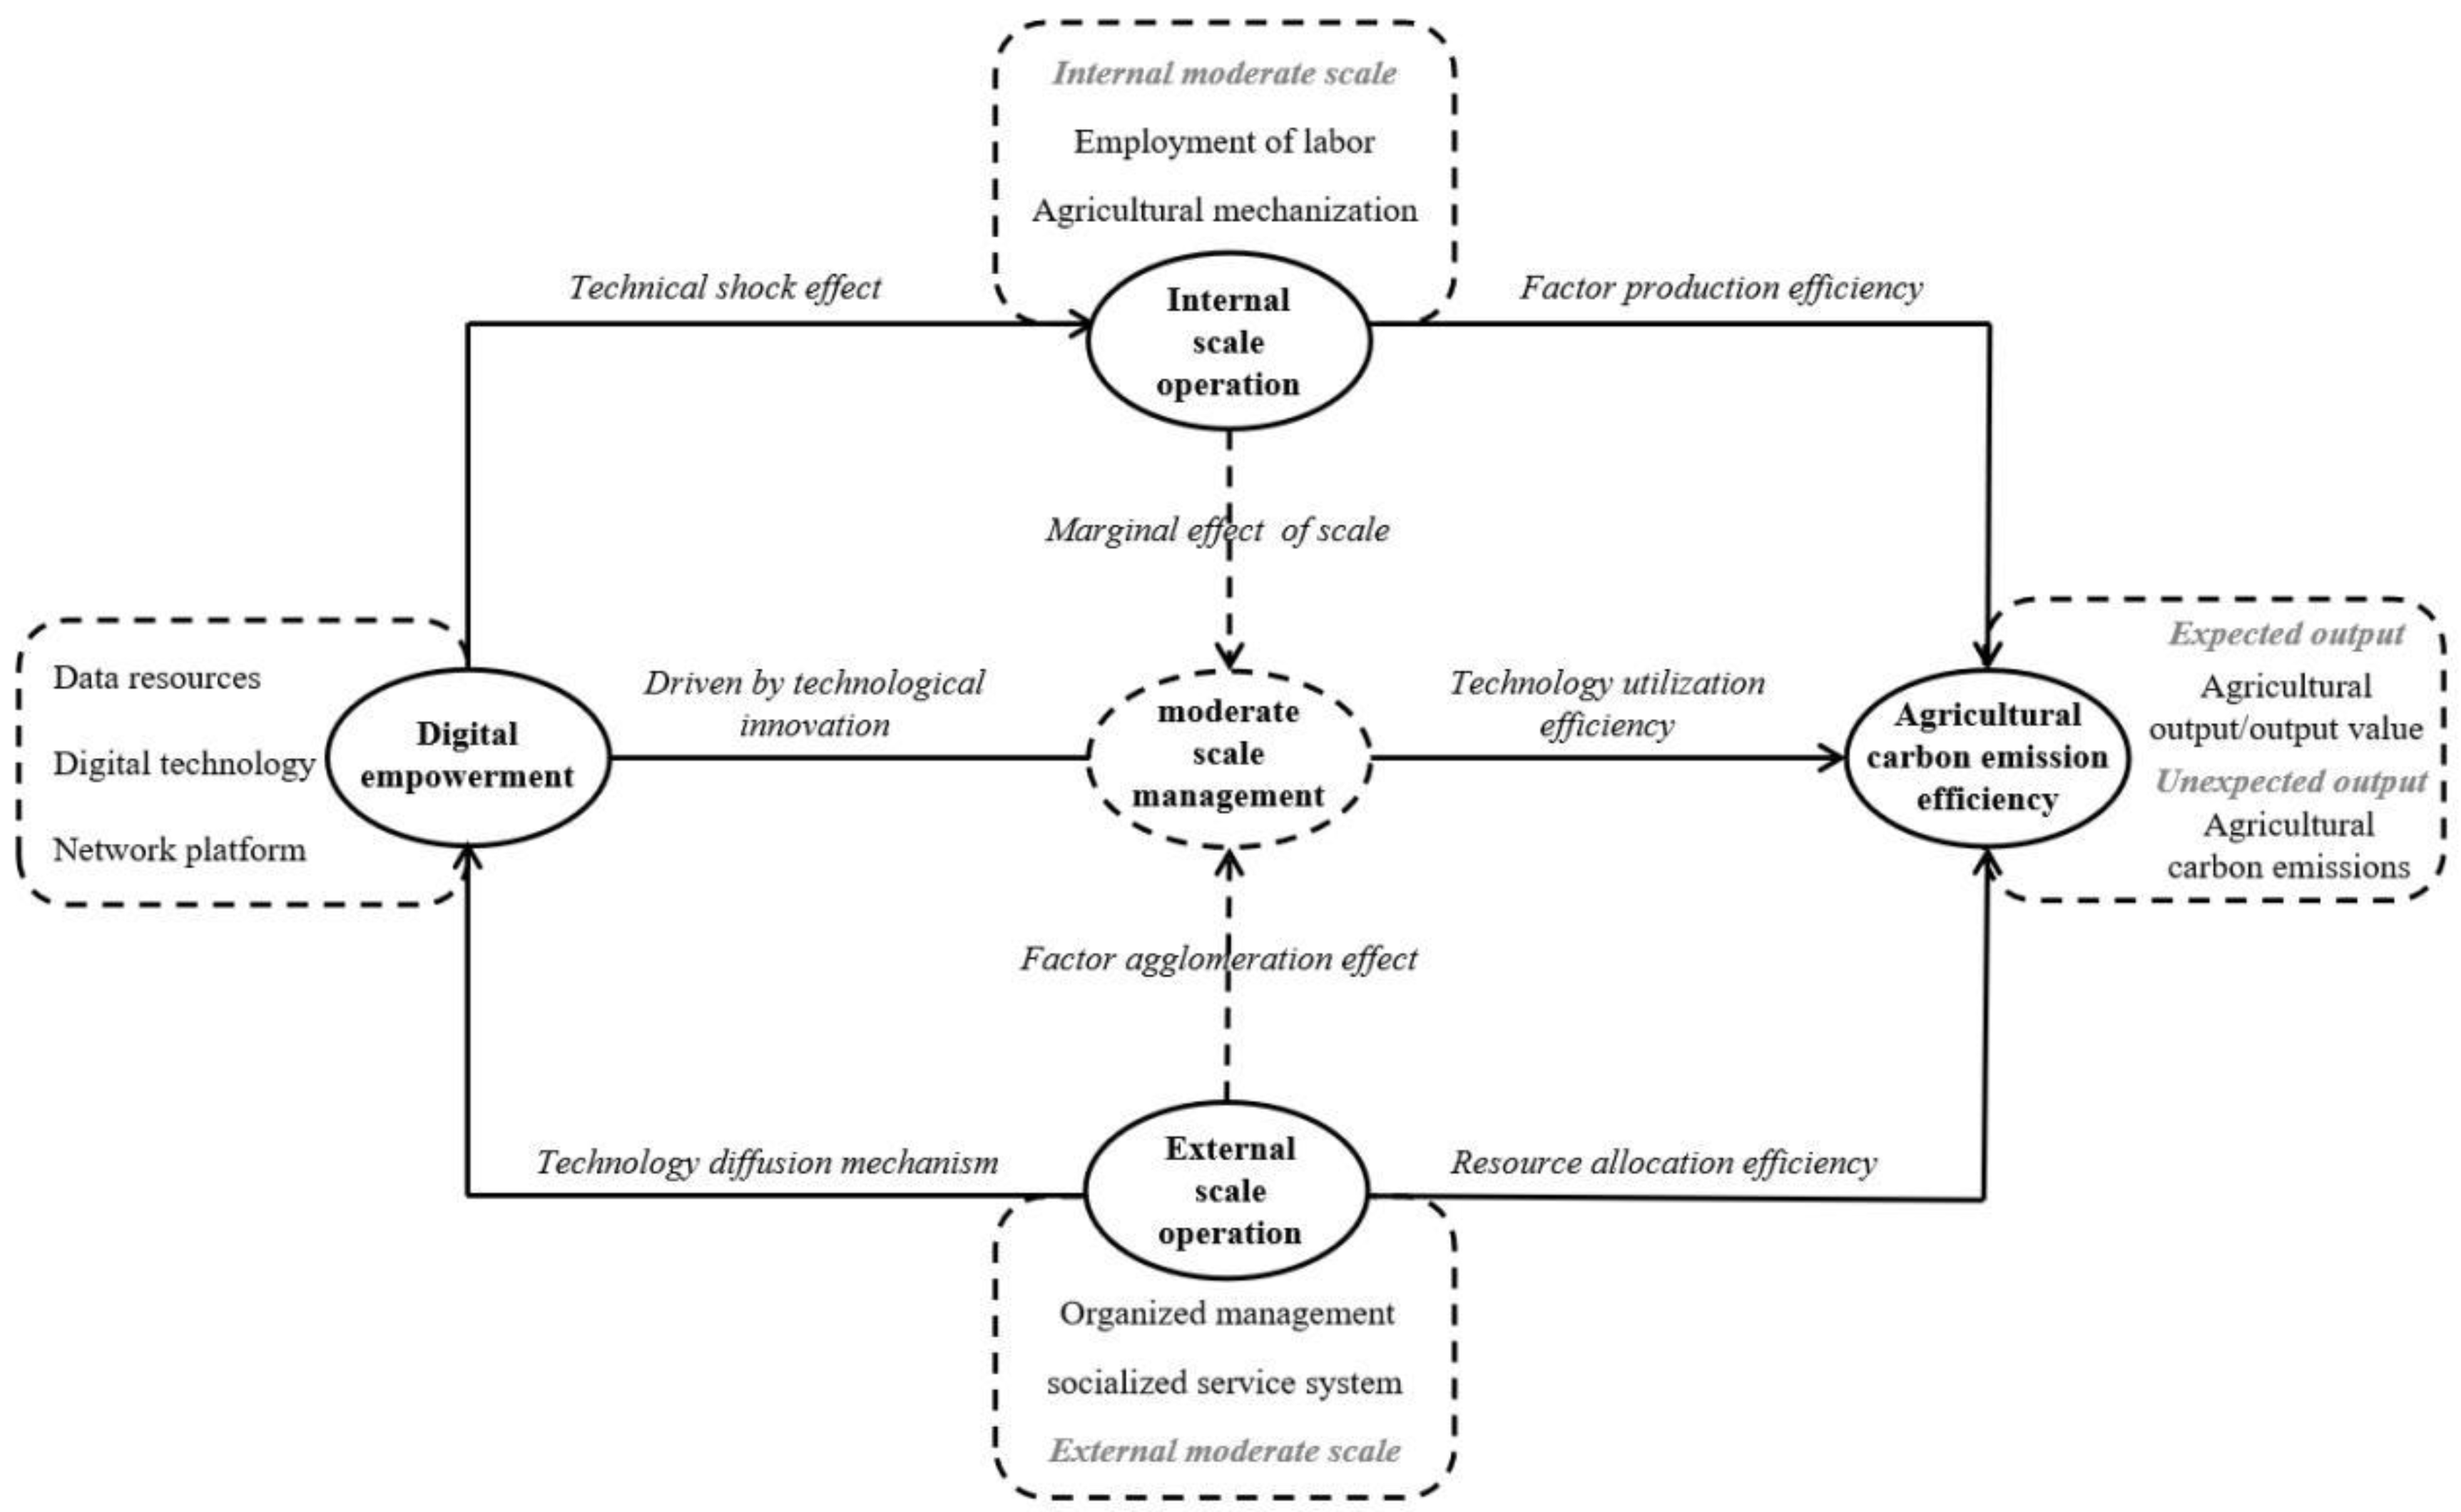
Figure 2.1.
Framework model of this study.
Based on the Figure 2.1, we established the theoretical basis of this study as follows:
Digital empowerment elements include data elements, digital technology and network platform. First, digital empowerment can act on agricultural carbon emission efficiency through the innovation of digital technology, so as to realize effective emission reduction of agricultural digital, and realize effective use of technology in this process, thus improving technology utilization efficiency; Second, the digital empowerment act on the internal scale operation of agriculture, and realize the synchronous operation of digitalization and scale through the impact effect of digital technology, thus affecting the internal scale operation of agriculture; Third, the digital empowerment act on the external scale operation of agriculture, and through the spillover of digital technology, they have an impact on the surrounding business entities and simultaneously affect the production, operation and management processes of surrounding farms.
Internal scale operation includes labor employment and agricultural mechanization, which represents moderate scale operation within agriculture and plays an intermediary role in agricultural digital emission reduction, mainly because scale operation within agriculture will affect the total factor productivity of agriculture, affect farmers’ willingness to adopt low carbon mode, and thus affect agricultural carbon emission reduction.
External scale operation includes organized operation and socialized service, which represents the external scale operation of the farm and plays a regulatory role in agricultural digital emission reduction. First, based on the technology diffusion mechanism, a farm adopts a series of production, operation and management activities through scale operation, which spreads and affects the surrounding farms, thus regulating its digital development; Second, the external scale operation mainly considers the optimal allocation of agricultural resources. Reasonable resource utilization and division of resources will have an impact on agricultural carbon emission efficiency to a certain extent, and the impact on neighboring farmers will indirectly regulate agricultural carbon emission reduction.
2.2. Research Hypothesis
Hypothesis H1:
Digital empowerment can significantly inhibit agricultural carbon emission efficiency
The influence of digital empowerment factors on agricultural carbon emissions mainly lies in the effect of resources such as data, technology and platform invested in agricultural production, operation and management, and the purpose of reducing carbon emissions is achieved by accurately controlling the processes of fertilizers, pesticides and agricultural machinery. Existing academic research generally proves that digitalization significantly inhibits the intensity of agricultural carbon emissions (Hong et al.,2024; Zhang et al.,2024) [27,28], effectively promote agricultural carbon emission reduction (Ning et al.,2022) [29], thus promoting the realization of the double carbon target (Sun et al., 2023) [30]. There is a nonlinear relationship between digitalization and agricultural carbon emissions (Zhu et al., 2024; Li et al.,2024) [11,31], the impact of digital application on agricultural carbon emission efficiency will be different under different land scales. Small-scale operation makes the effect of digital emission reduction slow, while large-scale operation has greater investment and risk, so it is necessary for us to control an optimal land scale.
Hypothesis H2: By enhancing the input of internal scale management, the digital emission reduction of agriculture will be significantly negatively affected. The influence of internal scale operation of agriculture on agricultural digital emission reduction mainly lies in the effect of resources such as labor and machinery invested in agricultural production, operation and management, and further affects agricultural carbon emission by changing the input of labor and machinery. Existing studies have proved that digital development has a positive impact on improving land circulation (Sun et al.,2022) [34], and the expansion of land management scale will significantly increase foreign exchange emissions (Wu et al.,2024) [19], that is, the expansion of cultivated land and the promotion of green technology will contribute to carbon emissions (Xu et al.,2023) [33]. Some studies have also found that labor transfer plays an intermediary role between digital economy and agricultural sustainable development (Jiang et al.,2023) [34], and mechanization not only has a positive impact on agricultural carbon emissions, but existing scholars have proved that mechanization may hinder the realization of carbon neutrality (Yang et al.,2022; Zhuang et al.,2025) [35,36].
Hypothesis H3: By strengthening the external scale operation, the digital emission reduction of agriculture will be significantly positively affected The influence of external scale operation of agriculture on agricultural digital emission reduction mainly lies in the effect of organized operation and socialized service in the process of agricultural production, operation and management, through the regulation of large-scale operation and the investment of scale economy, the consumption of chemical inputs is reduced, thus further reducing agricultural carbon emissions. The existing literature found that cooperative management can significantly improve the efficiency of agricultural land use (Ran et al.,2023) [37], social services can support the reduction of agricultural chemical fertilizers (Wang et al.,2024) [38], and effectively improve agricultural total factor productivity (Yao et al.,2024; Li et al.,2024) [39,40], and some studies have also shown that socialized services can break labor constraints by promoting scale effect, thus reducing the intensity of agricultural carbon emissions (Chen et al.,2022) [17].
3. Methods and Data
3.1. Research Methods
The method of this study is mainly included two aspects: first, the SBM-DEA model with unexpected output was used to measure the efficiency of agricultural carbon emission under different land scales, and the calculation method of agricultural moderate scale management level under carbon constraints was designed by combining the theory of scale economy and reward. The second is to explore the agricultural digital emission reduction mechanism under the moderate scale operation level of carbon constraints. The effect of digital empowerment factors (including data resources, digital technology and network platform) on agricultural carbon emission reductionwas quantified through Tobit model, and the effect of agricultural digital emission reduction under the overall and local function of moderate scale operation level was explored. The intermediary mechanism of internal scale management (including labor employment and agricultural mechanization) in agricultural digital emission is explored through the intermediary effect model The regulation mechanism of external scale operation (including organized operation and socialized service) in agricultural digital emission was analyzed by using the regulation model.
3.1.1. SBM-DEA Model of Unexpected Output
Based on the research perspective of economies of scale and efficiency innovation, this study refers to former scholars (Cheng et al., 2024; Feng et al.,2023) [41,42], the unexpected output model (SBM- DEA model, developed from the traditional Data Envelop-ment Analysis), is selected to measure the agricultural carbon emission efficiency (ACEE). Considering each scale interval as a production decision-making unit (DMU), the SBM-DEA model for evaluating the efficiency of DMU with unexpected output can be expressed as follows:
Subject to
In this formula, ACEE represents the value of agricultural carbon emission efficiency, represent the index numbers of input, expected output and unexpected output respectively, represents the slack of input and output, represent the input redundancy, insufficient expected output and excessive expected output respectively, and represents the weight vector. In the judgment of efficiency value, when , it means that the efficiency of the production unit is invalid, and the production efficiency of the production unit needs to be improved and optimized. When , the efficiency of the production unit is effective, and the larger the value, the higher the efficiency value.
3.1.2. Calculation and Analysis of Agriculture Moderate Scale Level
Most of the existing studies use entropy weight method to measure the level of key elements (Huang et al., 2024; Hao Yan et al., 2024) [43,44], based on the former’s research and combined with the practical experience during the investigation, this study designed the measurement method of the moderate scale level of agriculture from the perspective of operational efficiency. The product of scale efficiency (SE, derived from calculation results of DEA model) and scale frequency (ST) is emphasized to represent the moderate scale management level (MSM) with carbon constraints.
where s is the scale size, is the scale proportion, is the median value of the scale interval group, and n is the sample number.
where MSM stands for moderate scale operation level with carbon constraints, SE stands for scale efficiency, and ST stands for scale frequency, and n is the sample number.
3.1.3. Measurement Model
First of all, in order to examine the influence of digital empowerment (DE) on agricultural carbon emission efficiency (ACEE), this study takes all components of digital empowerment as explanatory variables (data resources, digital technology and network platform) and agricultural carbon emission efficiency as explained variables, and evaluates the agricultural digital emission effect by constructing Tobit benchmark mod model to ensure the effectiveness and robustness of calculation. The form of this model is as follows:
In the formula, represents the agricultural carbon emission efficiency value, * represents the truncated dependent variable, represents the intercept term, represents the correlation coefficient, represents the components in digital empowerment, and represents the random error term, and it obeys the normal distribution N(0, ).
Secondly, on the basis of the above analysis, this study examines whether the factors in digital empowerment can achieve effective carbon reduction in agriculture by increasing the factors in internal scale operation (ISO) through the intermediary effect model. In this study, the factors of internal scale operation (labor employment and agricultural mechanization) are used as intermediary variables, and the step-by-step method is combined with Sobel-Goodmen method to test the significance of the intermediary effect. The intermediary model is constructed as follows:
Among them, represents the agricultural carbon emission efficiency of the I-th new business entity with moderate scale operation, represents the input of digital enabling factors (including data resources, digital technology and network platform), represents the internal scale operation and use of the I-th new business entity with moderate scale operation (including labor employment and agricultural mechanization), and represents other control variables.
Finally, on the basis of the above analysis, this study examined whether the factors in digital empowerment can achieve effective carbon reduction in agriculture by regulating the factors in external scale operation (ESO). In this study, the factors of external scale operation (organized operation and socialized service) are taken as regulatory variables, and the regulatory effect model is set based on the verification of the intermediary model to test the significance of the regulatory effect:
Among them, represents the agricultural carbon emission efficiency of the I-th new business entity with moderate scale operation, represents the input of digital empowerment factors (including data resources, digital technology and network platform), represents the external scale operation and use of the I-th new business entity with moderate scale operation (including organized operation and socialized service), represents the interaction between digital empowerment level and external scale operation, and represents other control variables.
3.2. Selection and Treatment of Variables
3.2.1. Agricultural Carbon Emission Efficiency as Explained Variable:
(1) Calculation of agricultural carbon emissions
Because of the radial relationship between carbon absorption and crop yield in Table 3.2, the carbon emission of this study mainly considered crop production processes, mainly include the carbon emissions produced by the consumption of agricultural materials such as fertilizers, pesticides, agricultural films and diesel oil(Li et al., 2011; Zhou et al.,2024; Wang et al.,2024) [45,46,47], as well as the loss of organic carbon caused by ploughing and the carbon emissions caused by irrigation. The absolute consumption of carbon emission sources obtained through social research is multiplied by their respective carbon emission coefficients, and the multiplied carbon emissions are summed up to obtain agricultural carbon emissions. The specific carbon emission coefficients are as follows:

Table 3.1.
Carbon Emission Coefficient to Adopt.
| Carbon emission source | Corresponding index name | Carbon emission coefficient | Reference source |
|---|---|---|---|
| Chemical fertilizer | Fertilizer application rate | 0.8956 kgC/kg | T.O.West, Oak Ridge National Laboratory, USA |
| Pesticide | Pesticide consumption | 4.934 kgC/kg | T.O.West, Oak Ridge National Laboratory, USA |
| Agricultural plastic sheeting | Usage of agricultural plastic film | 5.18 kgC/kg | IREEA Nanjing Agricultural University Institute of Resources and Ecological Environment |
| Diesel | Consumption of agricultural diesel oil | 0.5927 kgC/kg | IPCC United Nations Intergovernmental Panel of Experts on Climate Change |
| Turn over | Sowing area of grain crops | 3.126 kgC/HM2 | CABCAU College of Agriculture and Biotechnology, China Agricultural University |
| Irrigate | effective irrigation area | 266.48 kgC/HM2 | Dubey et.al |
The specific calculation formula is as follows:
Where is agricultural carbon emission, is agricultural carbon emission caused by carbon emission source I, is absolute consumption of carbon emission source I, and is carbon emission coefficient of carbon emission source I.
(2) Calculation of carbon emission efficiency
This study comprehensively designed the input-output index system of agricultural carbon emission efficiency that fits this study (Zhu et al., 2024; Yang et al., 2021) [48,49]. Input indicators include land input, agricultural inputs and machinery inputs, and output indicators include expected output and unexpected output. Grain output and agricultural output value are regarded as expected outputs to reflect the social and economic benefits generated by crop planting activities, and agricultural carbon emissions are regarded as unexpected outputs to reflect the negative environmental impact brought by crop planting activities. SBM-DEA model with unexpected output is selected to measure the efficiency of agricultural carbon emissions, and the specific expression is shown in 3.1.2, in which the design of input-output index system.
Table 3.2.
Design of input-output index system for measuring agricultural carbon emission efficiency.
Table 3.2.
Design of input-output index system for measuring agricultural carbon emission efficiency.
| Indicator name | Indicator type | Specific indicators | |
|---|---|---|---|
| Agricultural carbon emission efficiency | Input index | Land input | |
| Agricultural input | |||
| Mechanical input | |||
| Output index | Expected output | Grain yield | |
| Grain output value | |||
| Unexpected output | Carbon emissions | ||
3.2.2. Digital Empowerment Elements as Core Explanatory Variables:
This study draws lessons from former scholars (Jiang Tuanbiao et al., 2024; Liu Ying et al., 2024) [50,51] On the construction of digital index system, it is planned to design the digital empowerment factor index system in this paper. The core explanatory variable is the digital empowerment factor. Based on the digital components, a digital index system is constructed from three variables: data resources, digital technology and network platform, and the contribution of digital empowerment in three dimensions is studied respectively. The specific index design is as follows:
Table 3.3.
Index System Design of Digital Empowerment Level.
| Primary index | Secondary index | Three-level index | Indicator description |
|---|---|---|---|
| Digital empowerment elements | Data resources | Resource integration ability | Product online sales ability, agricultural online purchase ability, and access to business information. |
| Data sharing level | Order channel push effect, expert resource push effect and four new technologies push effect. | ||
| Digital technology | Online perception level | Perception of production environment, monitoring of agricultural productivity, and visualization of production process. | |
| Fine management level | Grid management level, refined operation level, remote control level, automatic execution level, etc. | ||
| Intelligent decision-making level | Ambient intelligence’s early warning ability, process intelligent diagnosis ability and production intelligent decision-making ability. | ||
| Network platform | Application of digital platform for industrial chain | Digitization of enterprise-driven model, cooperative cooperation model and broker-driven model. | |
| Business Support Digital Platform Services | Service level of financial digital platform, insurance digital platform and training digital platform. | ||
| Application of agricultural machinery service digital platform | Agricultural machinery dispatching service level, technical guidance service level, and technical achievement display level. | ||
| Supervise the application of digital platform | Agricultural input management ability, product quality traceability management ability |
3.2.3.Internal Scale Operation as Intermediate Variable
This study draws lessons from former scholars (Xu et al., 2024; LI et al.,2023) [16,18] The index system of scale operation is constructed, and the internal index system of scale operation is designed comprehensively. This study takes internal scale operation as an intermediary variable, in which two dimensions are designed: one is labor employment, which refers to the cost paid by hiring labor during production, operation and management activities, that is, the capital invested by hiring labor to participate in the production, operation and management of rice and wheat; The second is agricultural mechanization, which refers to the ratio of agricultural rental equipment input to all inputs during production, operation and management activities, that is, the utilization rate of agricultural machinery. Study the intermediary mechanism of internal scale operation under three dimensions respectively, and the specific indicators are designed as follows:
Table 3.4.
Design of Index System for Internal Scale Operation.
| Primary index | Secondary index | Three-level index | Indicator description |
|---|---|---|---|
| Internal scale operation | Employment of labor | Labor input | Labor quantity of new business entities |
| educational level of workers | Overall quality education of new business entities | ||
| Labor cost | Average daily wage and employment days of employed workers | ||
| Agricultural mechanization | Mechanical operation level | Proportion of investment in leased equipment such as cultivated land and sowing to all inputs |
3.2.4. External Scale Operation as Control Variables
This study draws lessons from former scholars (Chen et al., 2022; Zhang et al.,2024) [17,52] The index system of scale operation is constructed, and the external index system of scale operation is designed comprehensively. This study takes external scale operation as the control variable, and studies the control mechanism of external scale operation in two dimensions respectively. Among them, two control variables are designed: one is organized management, which refers to the business risks and benefits of the business entities, that is, the values, risks and benefits in the process of rice and wheat production; The second is socialized service, which refers to the network system formed by various services provided by social and economic organizations related to agriculture to meet the needs of agricultural production, that is, land trust, government support, training services and so on in the process of rice and wheat production, operation and management. Specific indicators are designed as follows:
Table 3.5.
Design of Index System for External Scale Operation.
| Primary index | Secondary index | Three-level index | Indicator description |
|---|---|---|---|
| External scale operation | Organized management | Value co-creation | Are you willing to cooperate with other farmers and join cooperatives |
| Pooling-of-interest | Agricultural insurance premium income, order contract | ||
| Risk sharing | Whether to obtain a stable sales channel, whether to provide safety monitoring of agricultural products, whether to unify the postpartum quality satisfaction of agricultural materials, and whether to use chemical fertilizers and pesticides in accordance with regulations. | ||
| Socialized service system | Land trusteeship | The actual number of links to obtain land custody services | |
| Position condition | Kilometers between land and farm | ||
| Commercialized service | Whether technical guidance, field guidance and frequency of technical guidance are provided by cooperatives, and whether centralized training is provided and the frequency of training is provided. |
3.2.5. Environmental Variables
In this paper, the moderate scale management level of carbon constraints required in 3.1.2 is taken as the environmental variable to study the boosting effect of this variable and the empowerment effect of digital agricultural carbon emission reduction under this environmental influence.
3.2.6. Control Variables
Draw lessons from the existing research results (Li et al., 2024; Zhang et al., 2023) [53,54], this study selects three variables, namely, the willingness to adopt digital technology, the willingness to expand land scale and the average annual agricultural income, as control variables from the individual characteristics of new business entities that carry out moderate scale operations, which will control and influence whether they adopt agricultural carbon emission efficiency.
3.3 Regional Selection and Data Sources
Jiangsu Province is selected as the research area, as a representative of a strong agricultural province in the Yangtze River Delta and even the whole country, its grain area has been stable at more than 80 million mu for 14 consecutive years, and its total output has been stable at more than 70 billion Jin for 10 consecutive years. In 2024, it reached 75.95 billion Jin, completing the task of building 1.2 million mu of high-standard farmland and significantly improving the level of agricultural modernization. Last year, the work report of the provincial government mentioned that the contribution rate of agricultural scientific and technological progress in the province reached 71.8%, and the mechanization rate reached 85%, of which 95% were rice, wheat and corn, and the land transfer area reached 33 million mu, with a transfer rate of 62%. The moderate scale operation of agriculture was in good condition. Jiangsu, China. com shows that the Yangtze River Delta is at the forefront of the country in the development of smart agriculture. The data shows that the contribution rate of agricultural science and technology progress in the Yangtze River Delta has reached 72%, and digital technology covers over 60% of the large-scale business entities. Therefore, Jiangsu, as the research area, has a good representation.
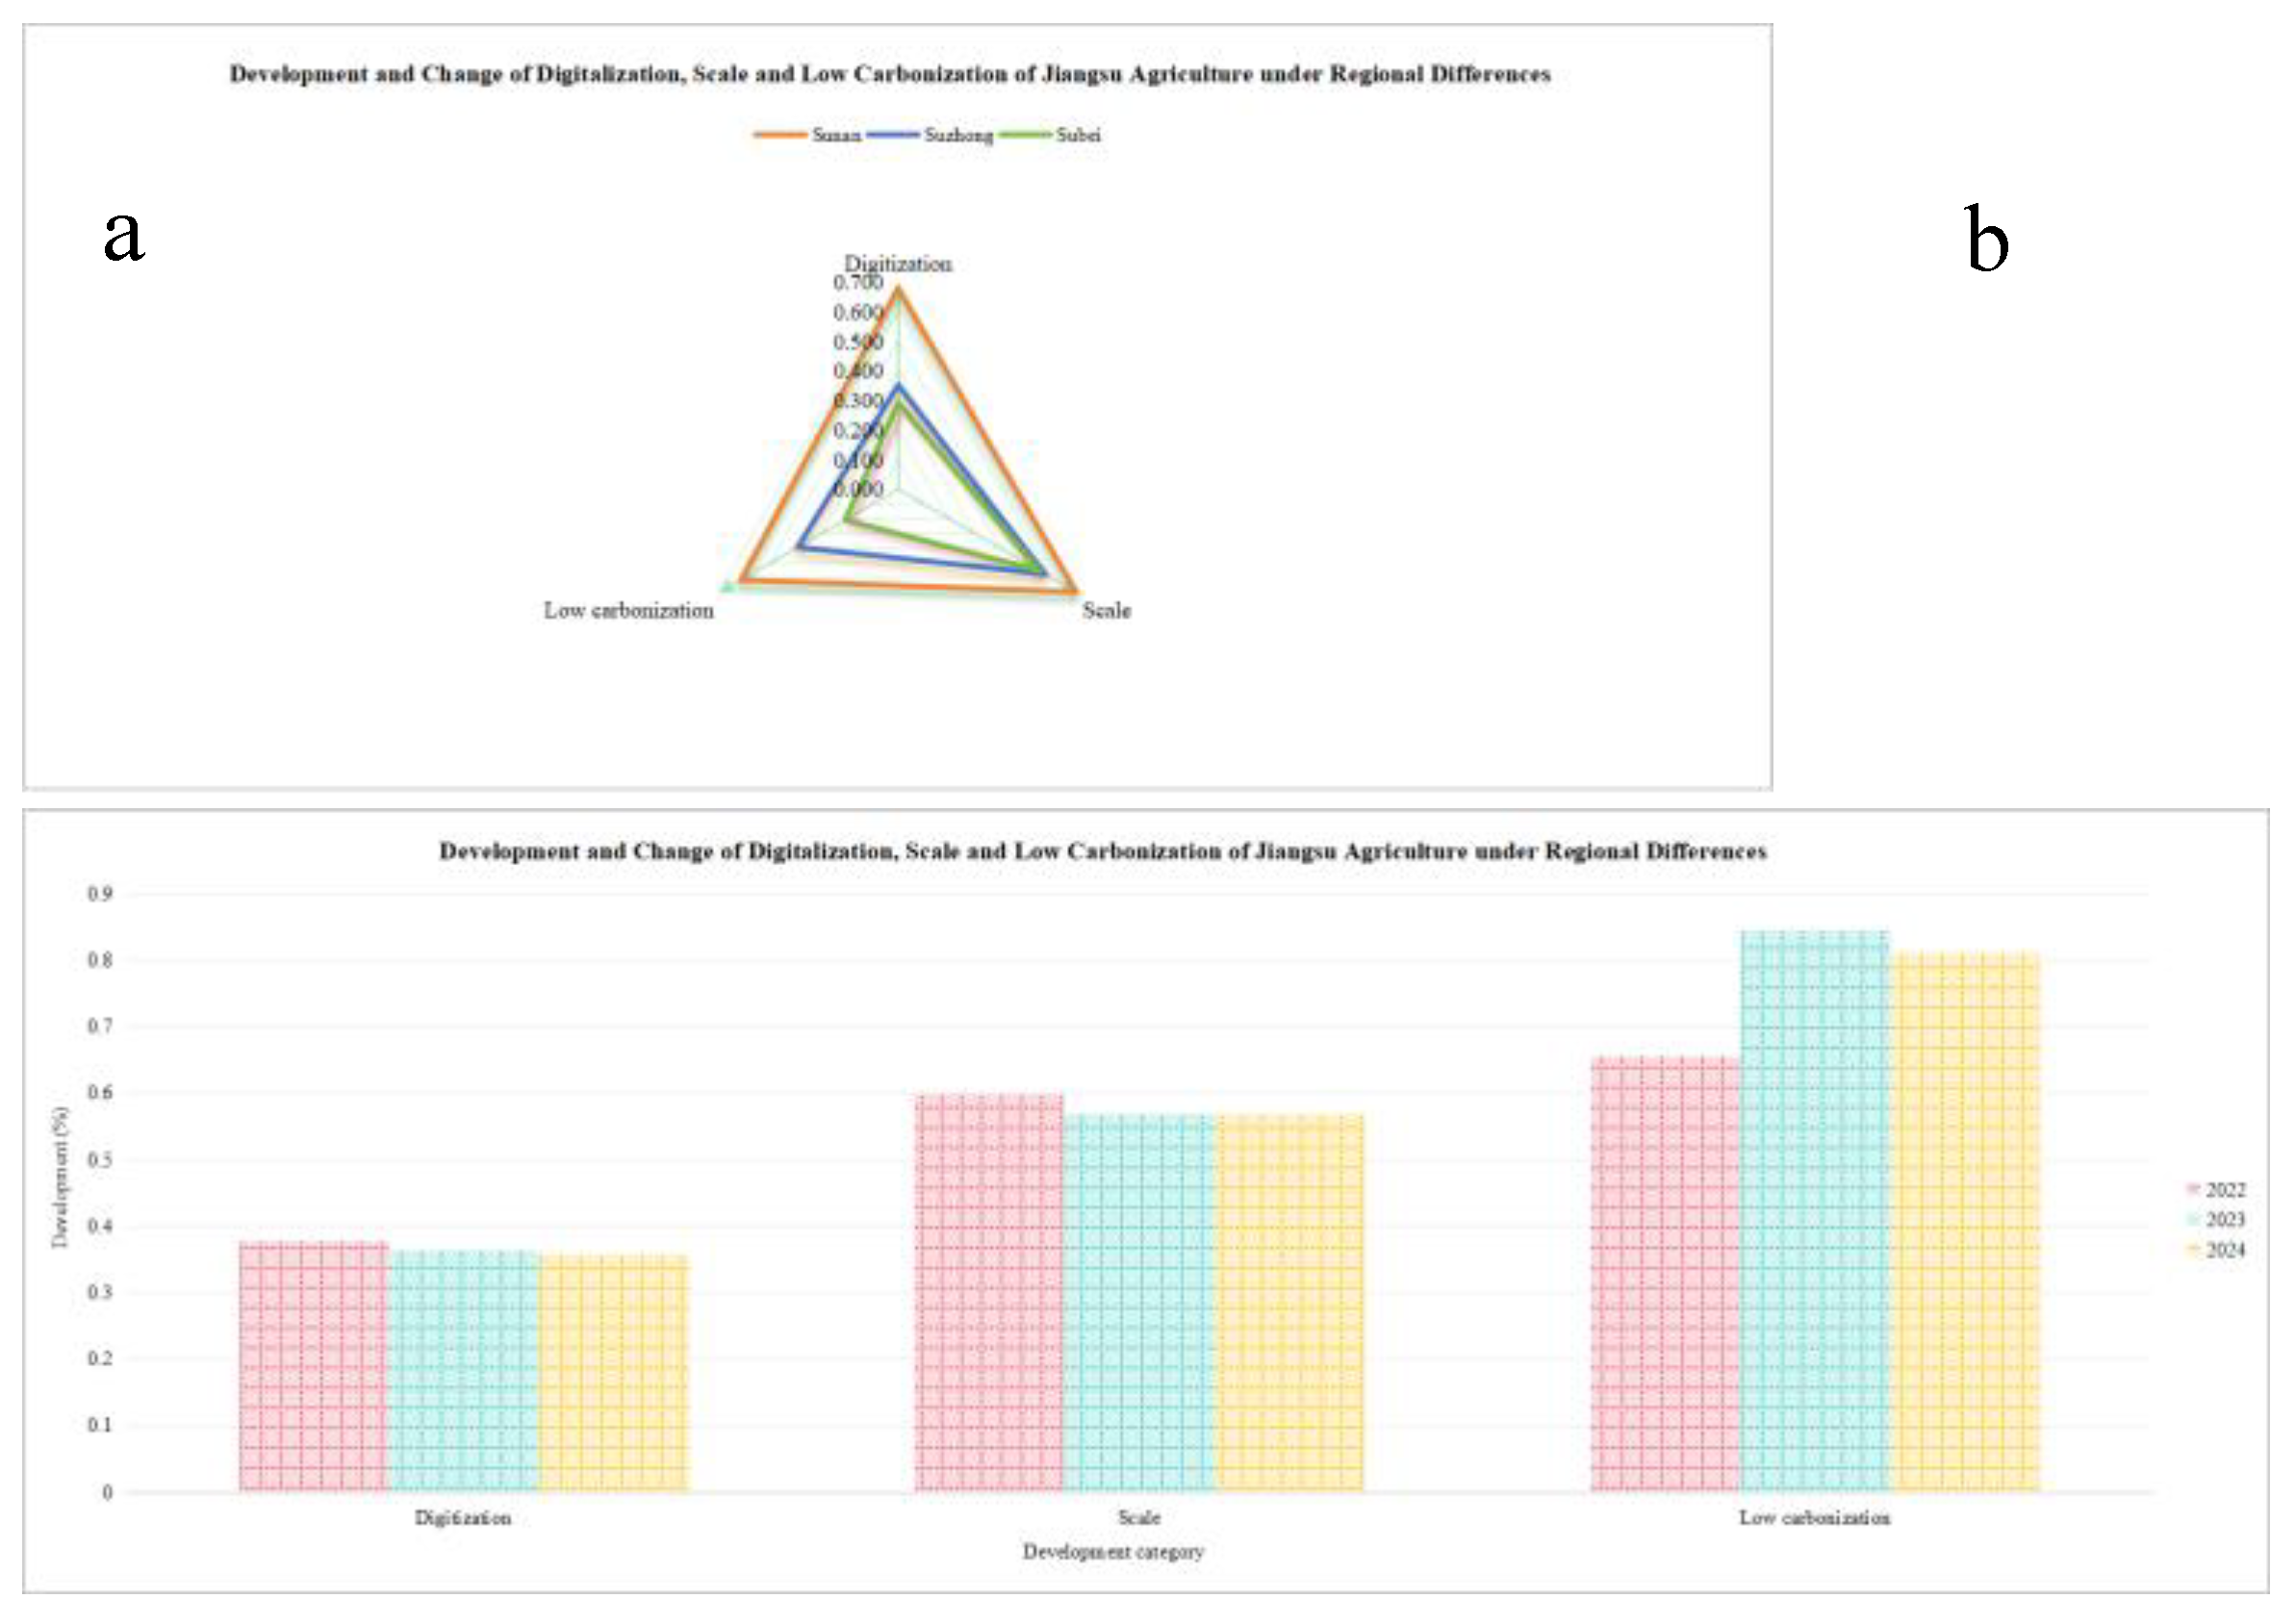
The data used in this study comes from the social practice survey carried out by the research group in Jiangsu Province from 2022 to 2024. Taking the new agricultural businesses(such as family farm and large farmer et al.,) with moderate scale as the research object and the rice and wheat industry as the research focus, this paper studies the development status and existing problems of its moderate agricultural scale management. Based on the consideration of the differences in Jiangsu’s topography, scale, environment, digitalization and carbon emissions, the research team was divided into three teams in 2023 to conduct a random sampling survey of 13 prefectures and cities in Jiangsu. Among them, Nanjing has launched a survey in July 2022, and in 2024, it launched a supplementary survey in northern Jiangsu. Through the analysis of the survey data, we find that the data samples have little change trend in time, so they can be combined into a whole analysis. Please refer to Appendix A for the specific research breakdown and the development of digitalization, scale and low-carbon agriculture in Jiangsu under regional and year differences.
Among them, a total of 258 valid questionnaires on rice and wheat industry were obtained, from which the influence mechanism of agricultural digital emission reduction under the moderate scale operation level of carbon constraints was explored. Descriptive statistical analysis of the main variables is as follows:
Table 3.6.
Descriptive Statistical Analysis of Main Variables.
| Variable type | Variable names and symbols | Minimum value | Maximum value | average value | Standard deviation | Median |
|---|---|---|---|---|---|---|
| Explained variable | Agricultural carbon emission efficiency (ACEE) | 0.004 | 1.046 | 0.780 | 0.309 | 0.913 |
| Core explanatory variable | Data resources (DRE) | 0.000 | 0.833 | 0.324 | 0.191 | 0.321 |
| Digital technology (DTE) | 0.000 | 0.893 | 0.385 | 0.298 | 0.500 | |
| Network platform (NPE) | 0.000 | 0.825 | 0.389 | 0.160 | 0.395 | |
| Mediator variable | Employment of labor (EOL) | 0.037 | 0.750 | 0.382 | 0.104 | 0.375 |
| Agricultural mechanization (AML) | 0.000 | 1.046 | 0.180 | 0.221 | 0.108 | |
| Regulatory variable | Organized management (OML) | 0.400 | 1.000 | 0.835 | 0.098 | 0.841 |
| Socialized service system (SSS) | 0.400 | 1.000 | 0.914 | 0.082 | 0.935 | |
| Envionment variables | Moderate scale management level with carbon constraints (MSM) | 0.223 | 1.000 | 0.827 | 0.174 | 0.861 |
| Control variable | Willingness to adopt digital technology (DTA) | 0.200 | 0.600 | 0.379 | 0.126 | 0.400 |
| Willingness to expand land scale (LSE) | 0.500 | 1.000 | 0.572 | 0.176 | 0.500 | |
| Annual agricultural income (AAI) | 0.000 | 1.000 | 0.485 | 0.235 | 0.400 |
4. Empirical Analysis
4.1. The Relationship Between Land Management Scale and Carbon Emission Efficiency
Figure 4.1.
Relationship between moderate agricultural scale level and carbon emission efficiency in Jiangsu Province under different scale intervals. A shows the moderate scale boundary of rice and wheat industry; B shows the changing trend of moderate scale operation level and carbon emission efficiency; C shows the relationship between the scale level of rice and wheat industry and carbon emission efficiency.
Figure 4.1.
Relationship between moderate agricultural scale level and carbon emission efficiency in Jiangsu Province under different scale intervals. A shows the moderate scale boundary of rice and wheat industry; B shows the changing trend of moderate scale operation level and carbon emission efficiency; C shows the relationship between the scale level of rice and wheat industry and carbon emission efficiency.
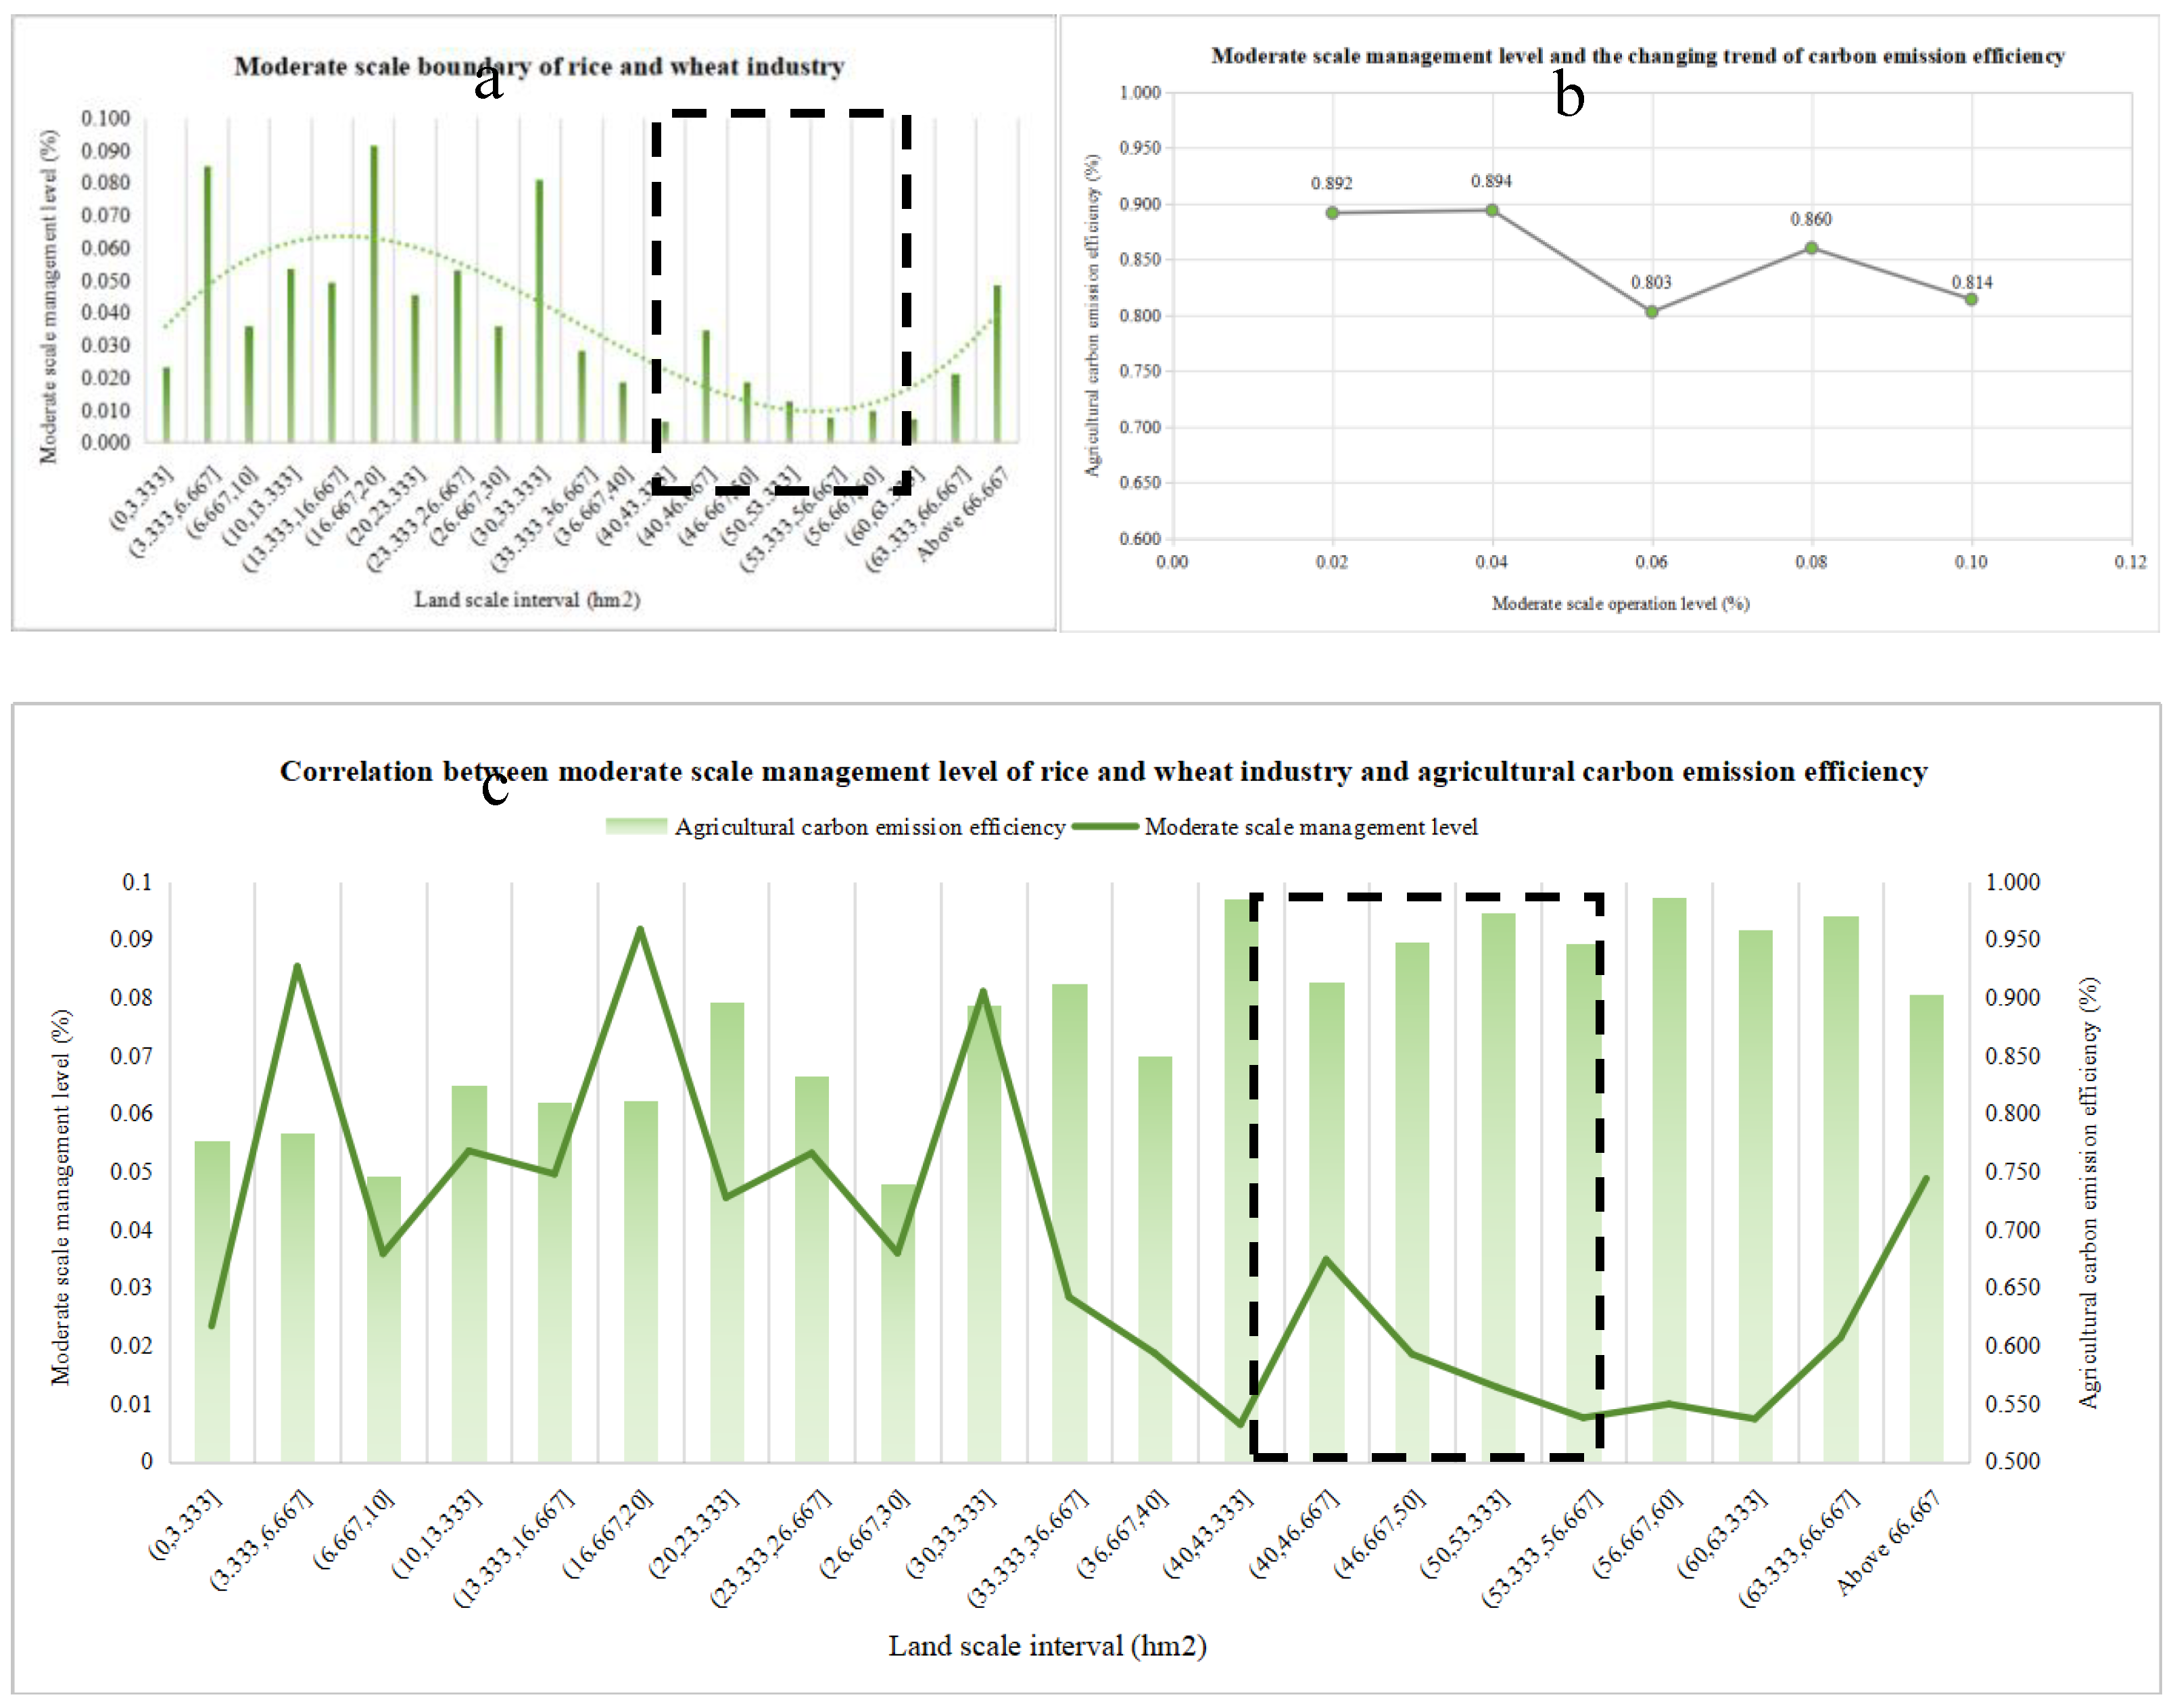
Figure A showed that, in Jiangsu, the scale of land management and the level of agricultural moderate scale management (MSM) with carbon constraints show an "inverted S-shaped" trend, that is, with the increase of land scale, MSM shows a trend of rising at first, falling and finally rising. Therefore, within the established scale of 66.667 hm2, when we divide the land with moderate agricultural scale into 10-26.667 hm2, MSM is the best and the agricultural management efficiency is better. From Figure B, MSM and agricultural carbon emission efficiency (ACEE) show a downward trend as a whole, that is, the higher MSM is, the lower its ACEE is, and the smaller its ACEE is. When MSM is at the highest level, the ACEE is 0.814. Figure C showed that, the relationship between land scale and ACEE is inverted ‘W-shaped’, and MSM and ACEE between 20-36.667 hm2 are in a relatively stable and effective state From this, we find that the land scale of Jiangsu rice and wheat industry is controlled within the range of 20-36.667 hm2, and its economic benefits and green benefits will reach a good state, which is regarded as the moderate scale range in this study.
Based on this, we bring digital empowerment factors, internal scale operation and external scale operation into the research framework of agricultural carbon emission reduction, and analyze the digital empowerment mechanism and large-scale regulation mechanism of agricultural carbon emission reduction.
4.2. Digital Empowerment Mechanism
4.2.1. Impacts of Digital Empowerment Factors to Agricultural Carbon Emission Efficiency
Based on the research framework in Figure 2.1, we divide the variable of digital empowerment factors into data resources (DRE), digital technology (DTE) and network platform (NTE), and explore the impact of digitalization on agricultural carbon emission efficiency through Tobit model.
Table 4.1.
Tobit model regression analysis of the factors of digital empowerment level on agricultural carbon emission efficiency.
Table 4.1.
Tobit model regression analysis of the factors of digital empowerment level on agricultural carbon emission efficiency.
| Coefficient | Std. err. | t | [95% conf. interval] | |
|---|---|---|---|---|
| _cons | 1.526*** | 0.083 | 18.390 | 1.363 1.690 |
| DRE | -0.090 | 0.158 | -0.570 | -0.400 0.220 |
| DTE | -0.160* | 0.083 | -0.055 | -0.324 0.003 |
| NPE | -0.149 | 0.193 | -0.770 | -0.529 0.231 |
| DTA | -0.336** | 0.149 | -2.260 | -0.629 -0.043 |
| LSE | -0.845*** | 0.098 | -8.620 | -1.038 -0.652 |
| AAI | 0.052 | 0.071 | 0.730 | -0.089 0.193 |
| var(e.c1) | 0.069 | 0.006 | 0.057 0.082 |
Note: "*" in the table is significant, in which * p<0.1 ** p<0.05 ***<0.001.
The table 4.1 showed that digital empowerment factors have a negative impact on agricultural carbon emission efficiency. DRE should inhibit ACEE, though the significance is not high.DTE can effectively inhibit ACEE, that is, for every 10% increase in DTE, ACEE will decrease by 0.16; While NTE inhibits ACEE, the effect of DRE and NTE on ACEE is negative, but not significant. This discovery does not deny the potential of digitalization, but reflects the influence of regional differences of samples to some extent. At this time, digital adoption willingness (DTA) and land scale expansion willingness (LSE) have significant control effects on ACEE, while agricultural annual income (AAI) has no significant control effect on ACEE. And by observing the upper and lower bounds of the confidence interval, we can find that the results of this study have a good accuracy. To sum up, digital empowerment factors will promote agricultural carbon emission reduction, and the promotion of digital technology is more significant and effective. That is, assume that the H1 part holds.
In order to ensure the robustnes of the empirical results, this study uses the methods of reducing sample size, replacing explanatory variables and shortening the research period to conduct Tobit regression analysis again. The results show that the significance of the three core variables is basically unchanged, and the action direction has not changed, and the basic conclusions are still similar to the previous ones, which shows that the regional selection and time limit selection of the research are reliable, and the above analysis results are highly stable, further enhancing the credibility and persuasiveness of the research results. The regression results are shown in the following table:
Table 4.2.
Robustness Test Results.
| Model1 | Model2 | Model3 | Model4 | Model5 | |
|---|---|---|---|---|---|
| _cons | 1.508*** (t=15.910) |
1.487*** (t=17.490) |
1.527*** (t=18.380) |
1.534*** (t=17.920) |
0.862*** (t=7.610) |
| DRE | -0.059 (t=-0.340) |
-0.319* (t=-1.900) |
-0.113 (t=-0.730) |
-0.124 (t=-0.890) |
-0.006 (t=-0.040) |
| DTE | -0.198** (t=-2.060) |
-0.097 (t=-1.110) |
-0.124* (t=-1.860) |
-0.176** (t=-2.200) |
-0.130* (t=-1.690) |
| NPE | -0.124 (t=-0.560) |
-0.027 (t=-0.150) |
-0.172 (t=-0.900) |
-0.076 (t=-0.680) |
0.143 (t=0.780) |
| DTA | -0.420** (t=-2.570) |
-0.335** (t=-2.280) |
-0.346** (t=-2.320) |
-0.339** (t=-2.270) |
-0.061 (t=-0.420) |
| LSE | -0.813*** (t=-7.490) |
-0.797*** (t=-7.910) |
-0.837*** (t=-8.580) |
-0.859*** (t=-8.910) |
-0.102 (t=-0.790) |
| AAI | 0.104 (t=1.260) |
0.061 (t=0.870) |
0.053 (t=0.750) |
0.054 (t=0.760) |
0.133* (t=1.720) |
| var(e.c1) | 0.069 | 0.068 | 0.069 | 0.069 | 0.862 |
Note: "*" in the table is significant, in which * p<0.1 ** p<0.05 ***<0.001.Model1 is the robustness test result of reducing the sample size, and samples are randomly selected within the scale range of (0,20], (20,36.667] and (36,667,66.667] for elimination; Model2-4 is the robustness test result of replacing the core explanatory variables, and replaces the three core explanatory variables in turn; Model5 is the result of robustness test to shorten the research cycle, that is, to remove the research data of one year.
4.2.2. The Role of Moderate Scale Operation Level in Boosting Agricultural Digital Emission Reduction
Then, we explore how the effect of digital agricultural emission reduction will change under the environment of moderate scale management (MSM) with carbon constraints.
Table 4.3.
Tobit Regression Analysis on the Boosting Effect of Moderate Scale Management with Carbon Constraints.
Table 4.3.
Tobit Regression Analysis on the Boosting Effect of Moderate Scale Management with Carbon Constraints.
| Model1 | Model2 | Model3 | Model4 | |
|---|---|---|---|---|
| _cons | 1.563*** (t=18.730) |
1.541 *** (t=18.510) |
1.559*** (t=18.730) |
1.571*** (t=18.780) |
| MSM | -1.291** (t=-2.650) |
-1.337** (t=-2.730) |
-1.246** (t=-2.550) |
-1.353** (t=-2.760) |
| DRE | -0.098 (t=-0.630) |
-0.360*** (t=-3.860) |
||
| DTE | -0.146* (t=-1.770) |
-0.242*** (t=-4.170) |
||
| NPE | -0.167 (z=-0.870) |
-0.458*** (t=-3.870) |
||
| DTA | -0.320** (t=-2.170) |
-0.386** (t=-2.770) |
-0.399** (t=-2.910) |
-0.297** (t=-2.010) |
| LSE | -0.807*** (t=-8.240) |
-0.793*** (t=-8.260) |
-0.854*** (t=-9.060) |
-0.774*** (t=-7.980) |
| AAI | 0.069 (t=0.970) |
0.078 (t=1.100) |
0.067 (t=0.940) |
0.055 (t=0.770) |
Note: "*" in the table is significant, in which * p<0.1 ** p<0.05 ***<0.001. Among them, Model1 is the overall boosting result, and Model2-Model4 is the local boosting result.
From the table 4.3,we found that the moderate scale management level (MSM) with carbon constraints has a significant inhibitory effect on agricultural carbon emission efficiency (ACEE), that is, with the increase of the moderate scale level, the agricultural carbon emission efficiency will decrease, and the agricultural emission reduction effect will be better; On the whole, for every 10% increase in MSM, ACEE decreases by 1.291, and DTE has a better inhibitory effect on ACEE with the help of MSM. Separately, MSM has a significant inhibitory effect on ACEE. With the help of MSM, DRE, DTE and NPE all significantly inhibit ACEE, and the boosting effect is DTE>DRE>NPE.
4.3. Internal Scale Operation of the Intermediary Mechanism Test
Next, in this study, we use the employment of labor (EOL) and agricultural mechanization (AML) to express internal scale operation, and use Sobel-Goodman model to test and explore the intermediary role of internal scale operation in agricultural digital emission reduction.
Table 4.4.
Analysis on the Mediating Effect of Internal Scale Operation in Data Resources Empowering Agricultural Emission Reduction Efficiency.
Table 4.4.
Analysis on the Mediating Effect of Internal Scale Operation in Data Resources Empowering Agricultural Emission Reduction Efficiency.
| DRE | DTE | NPE | ||||
|---|---|---|---|---|---|---|
| EOL | AML | EOL | AML | EOL | AML | |
| Sobel | -0.059** (z=-2.296) |
-0.043** (z=-1.685) |
-0.038** (z=-2.338) |
-0.046** (z=-2.602) |
-0.055** (z=-1.804) |
-0.072** (z=-2.142) |
| Goodman-1 (Aroian) |
-0.059** (z=-2.245) |
-0.043** (z=-1.648) |
-0.038** (z=-2.288) |
-0.046** (z=-2.556) |
-0.055** (z=-1.758) |
-0.072** (z=-2.097) |
| Goodman-2 | -0.059** (z=-2.350) |
-0.043** (z=-1.726) |
-0.038** (z=-2.393) |
-0.046** (z=-2.651) |
-0.055** (z=-1.855) |
-0.072** (z=-2.190) |
| Indirect effect | -0.059** (z=-2.296) |
-0.043** (z=-1.685) |
-0.038** (z=-2.338) |
-0.046** (z=-2.602) |
-0.055** (z=-1.804) |
-0.072** (z=-2.142) |
| Direct effect | -0.297*** (z=-3.342) |
-0.313*** (z=-3.599) |
-0.194*** (z=-3.509) |
-0.186*** (z=-3.352) |
-0.402*** (z=-3.588) |
-0.385*** (z=-3.436) |
| Total effect | -0.356*** (z=-3.982) |
-0.356*** (z=-3.982) |
-0.232*** (z=-4.175) |
-0.232*** (z=-4.175) |
-0.457*** (z=-4.003) |
-0.457*** (z=-4.003) |
| Proportion of total effect that is mediated | 0.166 | 0.120 | 0.162 | 0.199 | 0.119 | 0.157 |
Note: "*" in the table is significant, in which * p<0.1 ** p<0.05 ***<0.001.
It can be seen from the table that EOL has a significant negative impact on agricultural digital emission reduction. Among them, enhancing EOL will significantly inhibit the emission reduction effect of agricultural data resources, enhancing EOL will significantly inhibit the emission reduction effect of agricultural data technology, and enhancing EOL will also significantly inhibit the emission reduction effect of agricultural network platform, and the mediating intensity of labor employment in agricultural digital emission reduction is DTE>NTE>DRE. AML has a significant negative impact on agricultural digital emission reduction. Enhancing AML will significantly inhibit the emission reduction effect of agricultural data resources, agricultural data technology, and agricultural network platform. The intensity of mediating role of agricultural mechanization in agricultural digital emission reduction is DRE>DTE>NTE. That is, assume that H2 is all true.
4.4. Inspection of the Control Mechanism of External Scale Operation
Finally, we use organized operation (OML) and social service (SSS) to express external scale operation, and explore the regulatory role of external scale operation in agricultural digital emission reduction through regulatory model.
Table 4.5.
Analysis of the regulatory effect of external scale operation in data resources enabling agricultural emission reduction efficiency.
Table 4.5.
Analysis of the regulatory effect of external scale operation in data resources enabling agricultural emission reduction efficiency.
| Model1 | Model2 | Model3 | Model4 | Model5 | Model6 | |
|---|---|---|---|---|---|---|
| _cons | 1.261*** (t=7.080) |
0.941*** (t=4.010) |
||||
| DRE | -0.392*** (t=-4.180) |
-0.343*** (t=-3.870) |
||||
| OML | 0.173 (t=1.020) |
|||||
| SSS | 0.482** (t=2.280) |
|||||
| DRE*OML | 2.061** (t=2.120) |
|||||
| DRE*SSS | 1.069 (t=1.120) |
|||||
| _cons | 1.412*** (t=7.360) |
1.039*** (t=4.380) |
||||
| DTE | -0.224*** (t=-3.680) |
-0.220*** (t=-3.980) |
||||
| OML | 0.072 (t=0.400) |
|||||
| SSS | 0.402* (t=1.890) |
|||||
| DTE*OML | 0.154 (t=0.270) |
|||||
| DTE*SSS | 1.100* (t=1.760) |
|||||
| _cons | 1.319*** (t=7.210) |
1.110*** (t=4.450) |
||||
| NPE | -0.446*** (t=-3.770) |
-0.425*** (t=-3.730) |
||||
| OML | 0.156 (t=0.900) |
|||||
| SSS | 0.330 (t=1.430) |
|||||
| NPE*OML | 1.299 (t=1.210) |
|||||
| NPE*SSS | 1.706 (t=1.550) |
Note: "*" in the table is significant, in which * p<0.1 ** p<0.05 ***<0.001.
From the table, it can be seen that OML has a positive regulatory role in agricultural digital emission reduction, among which OML has a significant positive impact on DRE, that is, it can significantly promote the effective carbon emission reduction of agricultural data resources by strengthening organizational management behavior. However, OML has a positive effect on DTE and NPE, but it is not significant, which may be because the current agricultural organization has certain limitations, and relying on the traditional organization path to promote digital emission reduction may have limited effect, and the policy needs more refined design. SSS plays a positive role in agricultural digital emission reduction, among which SSS has a significant positive impact on DTE, that is, enhancing SSS can significantly promote the effective carbon emission reduction of digital technology. However, SSS has a positive effect on DRE and NPE, but it is not significant, which may be because the current social service system is still highly focused on improving technical efficiency and economies of scale, and has not fully included environmental externalities as part of its service value, thus solving the problem of "who will plant the land", but has not yet solved the problem of "how to plant the land more green". That is, assume that part H3 holds.
4.5. Heterogeneity Analysis of Moderate Scale Management Level of Different Land
In order to further and comprehensively explain the empowerment mechanism of digitalization on agricultural carbon emission efficiency, this study conducted heterogeneity analysis on scale differences and regional differences respectively.
Table 4.6.
Analysis of Heterogeneity Test Results of Different Moderate Land Scale Levels.
| Model1 | Model2 | Model3 | Model4 | Model5 | Model6 | |
|---|---|---|---|---|---|---|
| _cons | 1.378*** (t=9.660) |
1.676*** (t=13.030) |
1.668*** (t=12.390) |
1.811*** (t=13.860) |
0.814*** (t=4.780) |
0.992*** (t=4.980) |
| DRE | 0.163 (t=0.600) |
-0.096 (t=-0.360) |
-0.310 (t=-1.330) |
-0.448* (t=-1.670) |
0.016 (t=0.070) |
0.154 (t=0.500) |
| DTE | -0.133 (t=-0.990) |
-0.120 (t=-1.280) |
-0.136 (t=-1.170) |
0.017 (t=0.120) |
-0.198 (t=-1.490) |
-0.082 (t=-0.520) |
| NPE | -0.533 (t=-1.600) |
0.055 (t=0.160) |
0.244 (t=0.930) |
-0.214 (t=-0.670) |
0.168 (t=0.610) |
-0.160 (t=-0.420) |
| DTA | -0.432* (t=-1.720) |
-0.295 (t=-1.200) |
-0.264 (t=-1.260) |
-0.449* (t=-1.860) |
-0.117 (t=-0.550) |
0.057 (t=0.190) |
| LSE | -0.552** (t=-3.590) |
-0.944*** (t=-5.950) |
-1.358*** (t=-7.530) |
-1.106*** (t=-7.540) |
0.047 (t=0.220) |
-0.264 (t=-1.060) |
| AAI | 0.084 (t=0.550) |
-0.298** (t=-2.530) |
0.164 (t=1.620) |
0.078 (t=0.770) |
0.150 (t=1.290) |
-0.006 (t=-0.040) |
| var(e.c1) | 0.081 | 0.057 | 0.037 | 0.055 | 0.050 | 0.069 |
Note: "*" in the table is significant, in which * p<0.1 ** p<0.05 ***<0.001. Among them, Model1-3 is a heterogeneous analysis of scale differences, that is, a comparative analysis of the differences in three scale intervals (0,20], (20,36.667] and (36,667,66.667); Model4-6 is the result of heterogeneity analysis of regional differences, that is, comparative analysis of the differences in southern Jiangsu, central Jiangsu and northern Jiangsu.
It can be seen from the table that digital empowerment factors have a negative impact on agricultural carbon emission efficiency in most of these three scale intervals, and DRE has the best carbon emission reduction effect in (0,20), NPE in (20,36.667) and NPE in (36,667,66.667). Digital empowerment factors in southern Jiangsu, central Jiangsu and northern Jiangsu have a negative impact on agricultural carbon emission efficiency. The carbon emission reduction effect of DTE in southern Jiangsu is the best, but that of DRE is significantly effective. The carbon emission reduction effect of NPE in central Jiangsu is the best, and that of DRE in northern Jiangsu is the best. To sum up, the heterogeneity results of this study are well analyzed.
5. Results and Discussion
Based on the data analysis of the above empirical results, we find that the purpose of this study is to explore the relationship among land management scale, moderate scale management level with carbon constraints and agricultural carbon emission reduction, find the boosting effect of moderate scale management level with carbon constraints, show the intermediary and regulation mechanism of large-scale management in agricultural digital emission reduction, and provide some reference for the development of agricultural digital emission reduction and moderate scale management in China.
According to the research findings, (1) There is a certain development trend among the agricultural land scale, moderate scale management level with carbon constraints and agricultural carbon emission efficiency in Jiangsu, and we find that the land scale of rice and wheat industry in Jiangsu is controlled within the range of 20-36.667hm2, and its economic benefits and green benefits will reach a good state. From this, we can learn from it, so as to draw the boundary of moderate land management scale in the Yangtze River Delta and even the whole country, and provide scientific basis for the future digital, large-scale and low-carbon development; According to the research findings (2), DTE can effectively and significantly inhibit ACEE, and the robustness test of three methods, namely reducing sample size, replacing explanatory variables and shortening research period, is basically valid, that is, assuming H1 part is valid. This is consistent with the research of most scholars at present, that is, digital technology can effectively promote agricultural carbon emission reduction, and the effect of DRE and NTE on ACEE is negative, but not significant. This discovery does not deny the potential of digitalization, but reflects the influence of regional differences of samples to some extent; According to the research findings (3): MSM significantly inhibited ACEE, and ACEE decreased by 1.291 for every 10% increase of MSM. On the whole, DTE has a better inhibitory effect on ACEE with the help of MSM. Locally speaking, with the help of MSM, DRE, DTE and NPE all significantly inhibit ACEE, and their boosting effects are DTE>DRE>NPE. This study found that taking moderate scale management level as the environmental factor, observing the change degree of agricultural digital emission reduction with its help, and connecting digitalization, scale and low carbon more deeply; According to the research findings (4), both EOL and AML play a significant negative mediating role in agricultural digital emission reduction, and their mediating effects are different in different digital enabling factors. Among them, the mediating effect of EOL in agricultural digital emission reduction is DTE>NTE>DRE, and the mediating effect of AML in agricultural digital emission reduction is DRE>DTE>NTE, that is, assuming that H2 is all established. From this, we can see that labor employment and agricultural mechanization play different intermediary roles in carbon emission reduction of data resources, carbon emission reduction of digital technology, and the discussion of the batch on the network platform. Through these findings, we can further achieve effective carbon reduction in various fields. According to the research findings (5), both OML and SSS play a significant positive regulatory role in agricultural digital emission reduction, and the regulatory role of OML in carbon emission reduction of data resources is significantly effective, and the regulatory role of SSS in carbon emission reduction of digital technology is significantly effective, that is, assuming that H3 is partially established. Based on this, we can achieve effective carbon reduction by regulating organized operation in the field of data resources and by regulating social services in the field of digital technology. However, OML has a positive effect on DTE and NPE, but it is not significant, which may be because the current agricultural organization has certain limitations, and relying on the traditional organization path to promote digital emission reduction may have limited effect, and the policy needs more refined design. SSS also has a positive effect on DRE and NPE, but it is not significant, which may be because the current social service system is still highly focused on improving technical efficiency and economies of scale, and environmental externalities have not been fully included as part of its service value, which has solved the problem of "who will plant the land", but has not yet solved the problem of "how to plant the land more green"; According to the research findings (6), in the heterogeneity analysis of scale differences, DRE has the best carbon emission reduction effect in (0,20), NPE has the best carbon emission reduction effect in (20,36.667) and NPE has the best carbon emission reduction effect in (36,667,66.667); In the heterogeneity analysis of regional differences, the carbon emission reduction effect of DTE in southern Jiangsu is the best, but the carbon emission reduction effect of DRE is significantly effective. The carbon emission reduction effect of NPE in central Jiangsu is the best, and that of DRE in northern Jiangsu is the best. The overall heterogeneity results are better.
Based on the existing literature research, through comparison, we find that this study has provided some supplements and improvements for the related research from the aspects of measuring the moderate scale management level with carbon constraints, controlling the boundary of moderate scale management, boosting the moderate scale management level, and comprehensively considering digital scale and low carbon. The regional choice of this study is Jiangsu Province, which is at the forefront of the Yangtze River Delta region. To a certain extent, it can provide theoretical basis and reference for the research in this area, which has certain applicability. Because of the differences in topography, environment, digitalization, scale and low-carbon development in the whole country, its research methods can be used as a reference, but the reference of research results needs further in-depth exploration.
6. Conclusions and Suggestions
6.1. Conclusions
Based on the perspective of efficiency innovation under the theory of economies of scale and returns to scale, this study designs a method to measure the level of agricultural moderate scale operation and takes "carbon" into consideration. Using 258 data of Jiangsu rice and wheat industry obtained from the three-phase follow-up survey in 2022-2024, this study takes new business entities that carry out moderate scale operation as the survey object, clarifies the relationship among land management scale, moderate scale operation level and carbon emission efficiency, and delineates the moderate range of Jiangsu land scale. This paper studies the boosting effect of agricultural digital emission reduction under the moderate scale operation level of carbon constraint, and discusses its internal intermediary and regulation mechanism. The specific conclusions are as follows: (1) The scale of agricultural land and the moderate scale operation level of carbon constraint in Jiangsu show an "inverted S" trend and an "inverted W" trend with agricultural carbon emission efficiency as a whole, while the moderate scale operation level of carbon constraint and agricultural carbon emission efficiency show a downward trend as a whole, and in the moderate scale range of 20-36.667 hm2. (2) Tobit model shows that digital technology has a significant inhibitory effect on agricultural carbon emission efficiency, and the boosting effect of moderate-scale operation under carbon constraints is studied from the whole and the part respectively. On the whole, digital technology has a better inhibitory effect on agricultural carbon emission efficiency, and on the part, data resources, digital technology and network platform all significantly inhibit agricultural carbon emission efficiency, with the boosting effect as follows: digital technology > data resources > network platform; (3) Both labor employment and agricultural mechanization in internal scale operation negatively significantly affect agricultural carbon emission reduction, in which the negative intermediary role played by labor employment is digital technology > network platform > network platform, and the negative intermediary role played by agricultural mechanization is data resources > digital technology > network platform; (4) Organized operation and socialized service in external scale operation have a significant positive impact on agricultural carbon emission reduction, in which organized operation significantly positively regulates the effective carbon emission reduction of agricultural data resources and socialized service significantly positively regulates the effective carbon emission reduction of agricultural digital technology. In addition, the results are still valid under the robustness test and heterogeneity test, and have good reliability and persuasiveness.
6.2. Suggestion
According to the above conclusions, this paper puts forward the following suggestions for the future agricultural development in Jiangsu: (1) In view of exploring the scope of Jiangsu’s land scale, we should flexibly control the best scale of Jiangsu’s agricultural moderate scale operation, refer to the standard of 20-36.667hm2 of land moderate scale operation, guide the grain business entities to develop moderate scale operation, and gradually improve the development level of standardization, digitalization, ecology and organization in southern Jiangsu, central Jiangsu and northern Jiangsu in a moderate range based on regional differences. (2) Based on the agricultural emission reduction effect of digital empowerment factors, we need to deepen and strengthen agricultural carbon emission reduction measures in three aspects: data resources, digital technology and network platform, especially digital technology can effectively achieve agricultural carbon emission reduction; (3) In view of the intermediary role of internal scale management, we advocate combining the regional differentiation of Jiangsu to reasonably reduce the input of labor and mechanization, steadily improve the level of cultivated land fertility, and promote the green transformation of agricultural production process; (4) Based on the adjustment of external scale, we encourage efforts to improve the degree of organization of agricultural production and operation, innovate social services, and provide production services such as labor introduction, land transfer and production custody for business entities.
6.3. Limitations and Prospects
Although this study evaluates the agricultural digital emission reduction mechanism under the moderate scale operation level, it still has certain limitations and deserves further study. First, a total of 258 valid samples were obtained from the survey data, and the number of samples was limited, among which the number of samples in some scale intervals was small, so the representativeness of simultaneously evaluating the three indicators of digital empowerment level, large-scale operation and low-carbon agriculture was limited; Secondly, this paper takes Jiangsu Province as the key research area, which can well show the mechanism analysis and path effect of agricultural carbon emissions in the Yangtze River Delta region, but the research on agricultural carbon emissions covering a wider area of China needs to be deepened. Although this problem has not been solved in our current research, it is a direction of future research work.
Funding
This research is supported by two fund projects, and Associate Professor Yu Degui is the main person in charge of the project. First, a major project of philosophy and social science research in Jiangsu universities, "Study on the Internal Mechanism and Potential Measurement of Digital Economy Empowering Agricultural Carbon Emission Reduction" (2022SJZD091); Second, the research project "Jiangsu Practice Research on Moderate Scale Management of China Characteristic Agriculture" was commissioned by the Agriculture Office of Jiangsu Provincial Committee and the Rural Revitalization Soft Science Department of Jiangsu Province (23RVSS003).
Appendix A
Figure A1.
2022-2024 Subdivision of Jiangsu Survey.
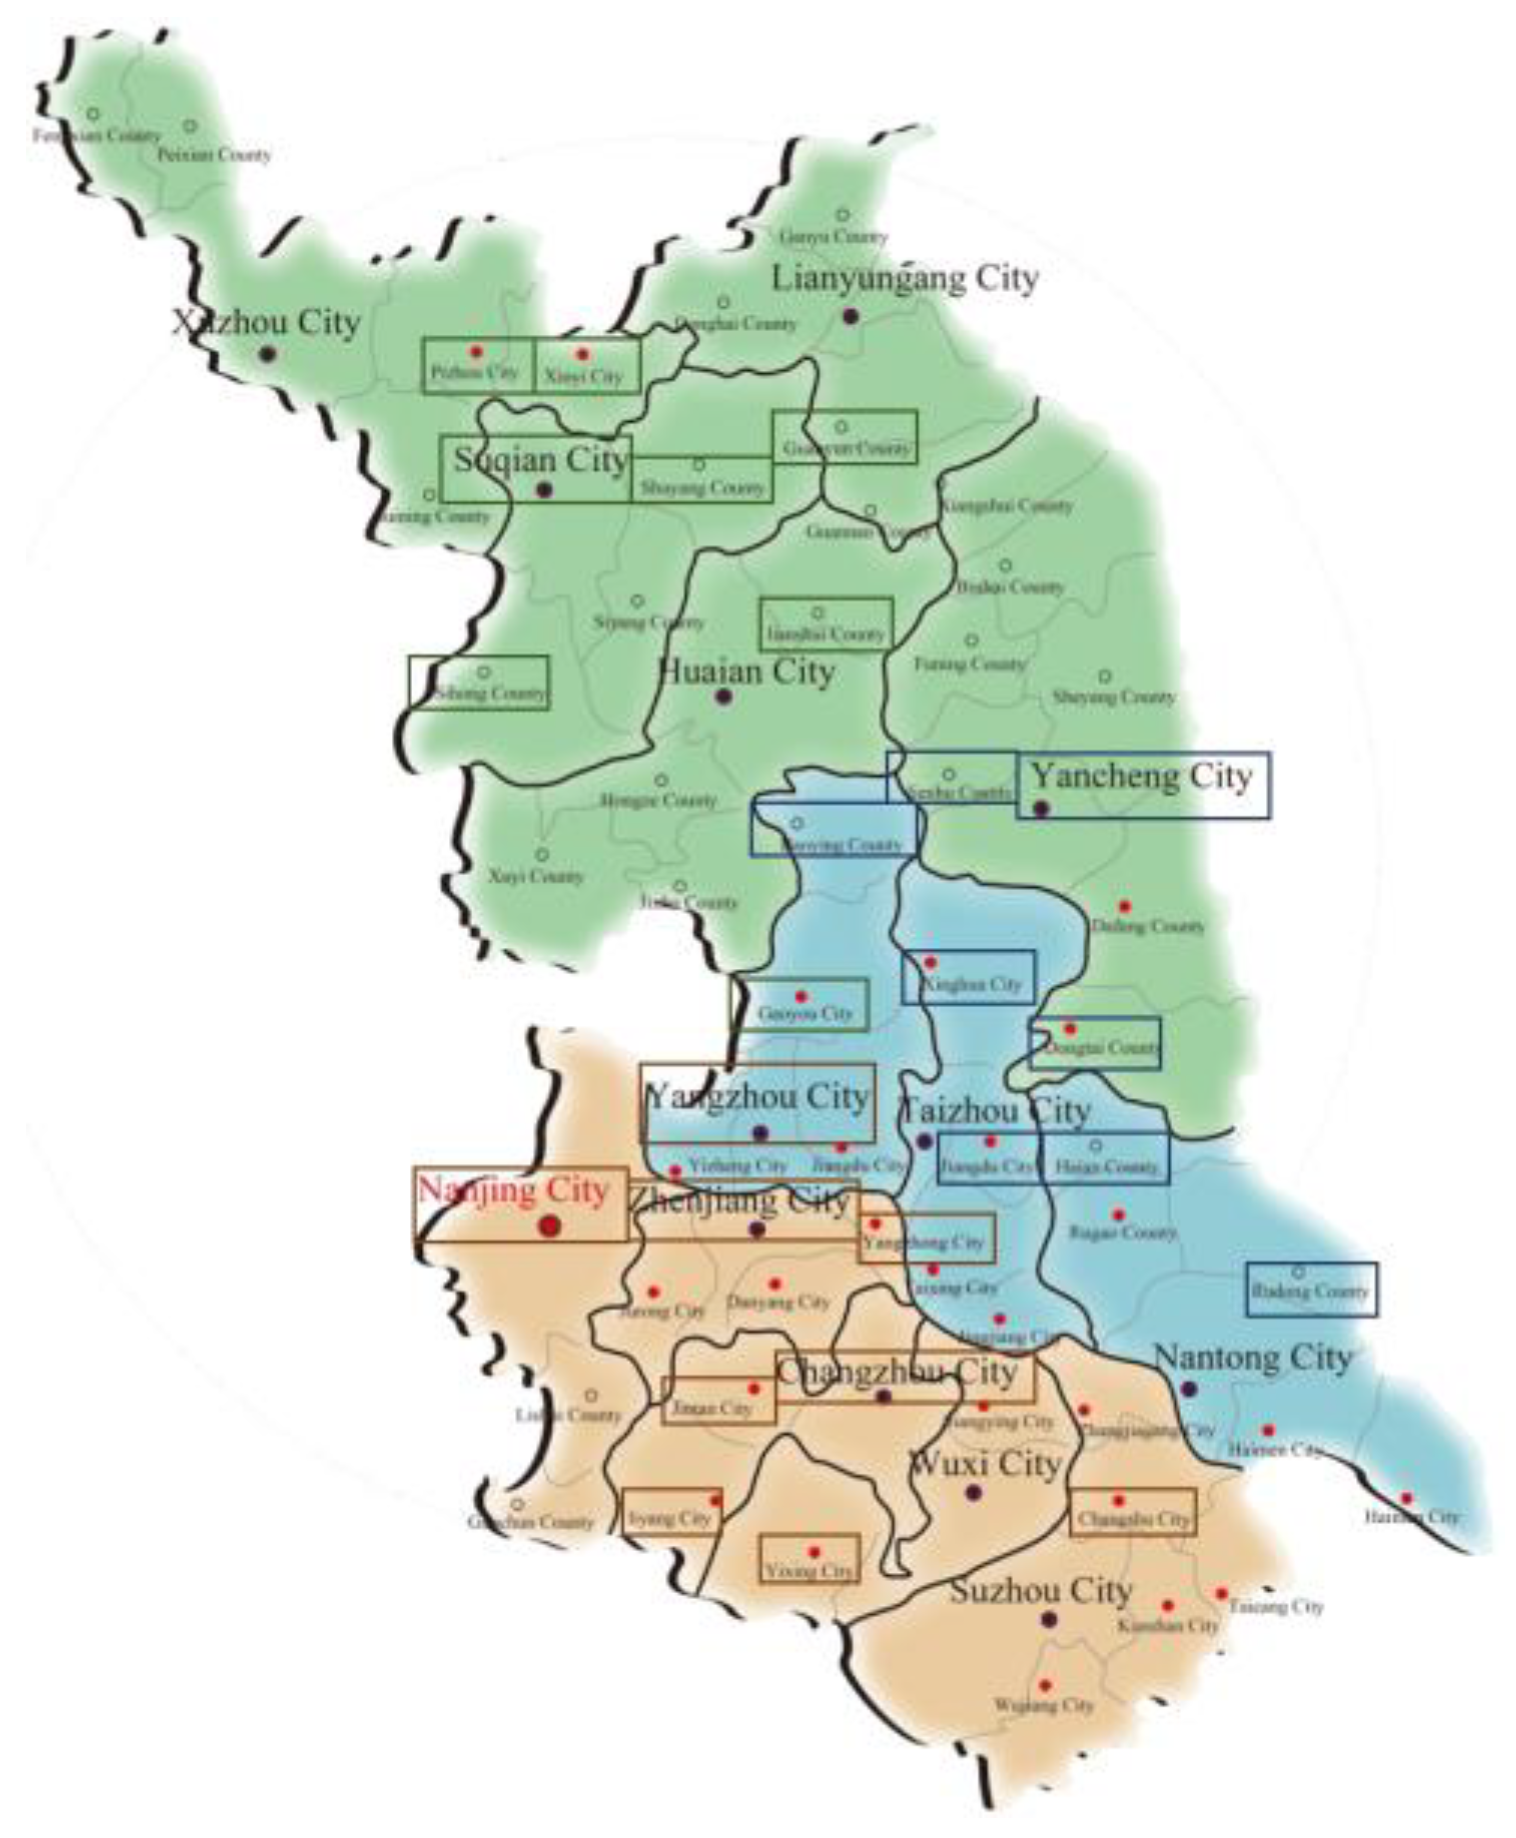
Table A1.
Subdivision of survey data in southern Jiangsu Province.
| Area | Research subdivision | Investigation time | Investigation form | Number of questionnaires |
|---|---|---|---|---|
| Su Nan | Nanjing City (multi-district investigation) |
2022.8 | Questionnaire surve Meeting discussion |
42 |
| Yixing City (Wuxi City) |
2023.7 | Questionnaire surve | 15 | |
| Liyang City (Changzhou City) |
2023.7 | Questionnaire surve | 4 | |
| Dantu District (Zhenjiang City) |
2023.7 | Meeting discussion | 20 | |
| Yangzhong City (Zhenjiang City) |
2023.7 | Questionnaire surve | 20 | |
| Xinbei District (Changzhou City) |
2023.7 | Questionnaire surve | 18 | |
| Changshu City (Suzhou City) |
2023.7 | Meeting discussion | 12 | |
| Jintan City (Changzhou) |
2023.7 | Questionnaire surve | 17 | |
| Guangling District (Yangzhou City) |
2023.7 | Base co-construction | 12 |
Table A2.
Subdivision of survey data in central Jiangsu province.
| Area | Research subdivision | Investigation time | Investigation form | Number of questionnaires |
|---|---|---|---|---|
| Su Zhong | Xinghua City (Taizhou City) |
2023.7 | Questionnaire surve | 20 |
| Baoying County (Yangzhou City) |
2023.7/ 2024.8 |
Questionnaire surve | 25 | |
| Jianhu County (Yancheng City) |
2023.7 | Meeting discussion | 8 | |
| Yandu District (Yancheng City) |
2023.7 | Base co-construction | 14 | |
| Dongtai City (Yancheng City) |
2023.7/ 2024.8 |
Questionnaire surve | 18 | |
| Rudong County (Nantong City) |
2023.7 | Questionnaire surve | 18 | |
| Haian City (Nantong City) |
2023.7 | Meeting discussion | 2 | |
| Jiangyan District (Taizhou City) |
2023.7/ 2024.8 |
Questionnaire surve | 24 |
Table A3.
Subdivision of survey data in northern Jiangsu.
| Area | Research subdivision | Investigation time | Investigation form | Number of questionnaires |
|---|---|---|---|---|
| Su Bei | Gaoyou City (Yangzhou City) |
2023.7 | Questionnaire surve | 22 |
| Lianshui County (Huaian City) |
2023.7 | Questionnaire surve | 16 | |
| Guanyun County (Lianyungang City) |
2023.7 | Questionnaire surve | 18 | |
| Xinyi City (Xuzhou City) |
2023.7 | Meeting discussion | 11 | |
| Pizhou City (Xuzhou City) |
2023.7 | Questionnaire surve | 18 | |
| Sucheng District (Suqian City) |
2023.7 | Questionnaire surve | 4 | |
| Muyang County (Suqian City) |
2023.7 | Meeting discussion | 12 | |
| Sihong County (Suqian City) |
2023.7/ 2024.8-8 |
Questionnaire surve | 13 |
Figure A2.
Development of Digitalization, Scale and Low Carbonization of Agriculture in Jiangsu Province under Regional and Year Differences. Note: Figure A shows the agricultural development under regional differences, and Figure B shows the agricultural development under year differences.
Figure A2.
Development of Digitalization, Scale and Low Carbonization of Agriculture in Jiangsu Province under Regional and Year Differences. Note: Figure A shows the agricultural development under regional differences, and Figure B shows the agricultural development under year differences.
References
- Wang, S.; Huang, Y.; Liu, H. Measurement and Spatial–Temporal Characteristics of Agricultural Carbon Emission in China: An Internal Structural Perspective. Agriculture 2022, 12, 1749. [Google Scholar] [CrossRef]
- Yang, G.; Shang, P.; He, L.; et al. Interregional Carbon Compensation Cost Forecast and Priority Index Calculation Based on the Theoretical Carbon Deficit: China as a Case. Sci. Total Environ. 2019, 654, 786–800. [Google Scholar] [CrossRef]
- GSMA. The Enablement Effect: The Impact of Mobile Communications Technologies on Carbon Emission Reductions; GSMA: London, UK, 2020. [Google Scholar]
- Balyan, S.; Jangir, H.; Tripathi, N.S.; et al. Seeding a Sustainable Future: Navigating the Digital Horizon of Smart Agriculture. Sustainability 2024, 16, 502. [Google Scholar] [CrossRef]
- Guo, Z.; Ho, S.C.; Ling, T.H.G.; et al. Spatial Spillover Heterogeneity and Moderated Effects of the Digital Economy on Agricultural Carbon Emissions: Evidence from 30 Chinese Provinces. Environ. Dev. Sustain. 2025, republish, 1–31. [Google Scholar] [CrossRef]
- Crippa, M.; Solazzo, E.; Guizzardi, D.; et al. Food Systems Are Responsible for a Third of Global Anthropogenic GHG Emissions. Nat. Food. 2021, 2, 198–209. [Google Scholar] [CrossRef]
- Zheng, Z.; Gao, Y.; Huo, X. Re-exploration of the Relationship between Farm Management Scale and Land Productivity: Evidence from Large-Scale Farmers in the Third National Agricultural Census. Manag. World. 2024, 40, 89–108. [Google Scholar] [CrossRef]
- Li, J.; Wu, W.; Liu, M.; et al. Impact of Land Management Scale on the Carbon Emissions of the Planting Industry in China. Land 2022, 11, 816. [Google Scholar] [CrossRef]
- Guo, Y.; Cao, X.; Wei, W.; et al. Research on the Impact of Yangtze River Delta Regional Integration on Urban Carbon Emissions. Geogr. Res. 2022, 41, 181–192. [Google Scholar] [CrossRef]
- Ma, S.L.; Liu, J.F.; Wang, W.T. The Carbon Emission Reduction Effect of Digital Agriculture in China. Environ. Sci. Pollut. Res. 2022. [Google Scholar] [CrossRef]
- Zhu, S.; Huang, J.; Li, Y.; et al. A Non-Linear Exploration of the Digital Economy’s Impact on Agricultural Carbon Emission Efficiency in China. Agriculture 2024, 14, 2245. [Google Scholar] [CrossRef]
- Zhu, Y.; Wang, X.; Zheng, G. Blessing or Curse? The Impact of Digital Technologies on Carbon Efficiency in the Agricultural Sector of China. Sustainability 2023, 15, 15482. [Google Scholar] [CrossRef]
- Li, B.; Gao, Y. Impact and Transmission Mechanism of Digital Economy on Agricultural Energy Carbon Emission Reduction. Int. Rev. Econ. Financ. 2024, 95, 103457. [Google Scholar] [CrossRef]
- Feng, M.; Li, X. Technological Innovation Threshold Characteristic of the Impact of Environmental Regulation on Carbon Emission Based on Chinese Provincial Panel Data. J. Sci. Ind. Res. 2019, 78, 273–277. [Google Scholar]
- Deng, Q.; Zhang, Y.; Lin, Z.; et al. The Impact of Digital Technology Application on Agricultural Low-Carbon Transformation—A Case Study of the Pesticide Reduction Effect of Plant Protection Unmanned Aerial Vehicles (UAVs). Sustainability 2024, 16, 10920. [Google Scholar] [CrossRef]
- Xu, D.; Liu, Y.; Li, Y.; et al. Effect of Farmland Scale on Agricultural Green Production Technology Adoption: Evidence from Rice Farmers in Jiangsu Province, China. Land Use Policy 2024, 147, 107381. [Google Scholar] [CrossRef]
- Chen, Z.; Tan, C.; Liu, B.; et al. Can Socialized Services Reduce Agricultural Carbon Emissions in the Context of Appropriate Scale Land Management? Front. Environ. Sci. 2022, 10, 984687. [Google Scholar] [CrossRef]
- Li, Y.; Yi, F.; Yang, C. Influences of Large-Scale Farming on Carbon Emissions from Cropping: Evidence from China. J. Integr. Agric. 2023, 22, 3209–3219. [Google Scholar] [CrossRef]
- Wu, W.; Yu, Q.; Chen, Y.; et al. Land Management Scale and Net Carbon Effect of Farming in China: Spatial Spillover Effects and Threshold Characteristics. Sustainability 2024, 16, 6392. [Google Scholar] [CrossRef]
- Yu, P.; Fadnavis, S.; Chen, Y.; et al. Positive Impacts of Farmland Fragmentation on Agricultural Production Efficiency in Qilu Lake Watershed: Implications for Appropriate Scale Management. Land Use Policy 2022, 117, 106118. [Google Scholar] [CrossRef]
- Zhang, J.; Xie, S.; Li, X.; et al. Adoption of Green Production Technologies by Farmers through Traditional and Digital Agro-Technology Promotion–An Example of Physical versus Biological Control Technologies. J. Environ. Manag. 2024, 370, 122813. [Google Scholar] [CrossRef]
- Liang, Y.; Wang, Y.; Sun, Y.; et al. Study on the Influence of Agricultural Scale Management Mode on Production Efficiency Based on Meta-Analysis. Land 2024, 13, 968. [Google Scholar] [CrossRef]
- Wang, H.; Zhu, J. An Empirical Study on the Impact of Agricultural Digitalization on Fertilizer Use Efficiency. Chin. J. Eco-Agric. 2024, 32, 1857–1868. [Google Scholar] [CrossRef]
- Zhang, L.; Li, Y.; Sun, J. The Environmental Performance of Agricultural Production Trusteeship from the Perspective of Planting Carbon Emissions. China Agric. Econ. Rev. 2023, 15, 853–870. [Google Scholar] [CrossRef]
- Yang, S.; Zhang, X. Towards a Low-Carbon and Beautiful World: Assessing the Impact of Digital Technology on the Common Benefits of Pollution Reduction and Carbon Reduction. Environ. Monit. Assess. 2024, 196, 695. [Google Scholar] [CrossRef]
- Shi, Y.; Yang, Q.; Zhang, L.; et al. Can Moderate Agricultural Scale Operations Be Developed against the Background of Plot Fragmentation and Land Dispersion? Evidence from the Suburbs of Shanghai. Sustainability 2022, 14, 8697. [Google Scholar] [CrossRef]
- Hong, H.; Sun, L.; Zhao, L. Exploring the Impact of Digital Inclusive Finance on Agricultural Carbon Emissions: Evidence from the Mediation Effect of Capital Deepening. Sustainability 2024, 16, 3071. [Google Scholar] [CrossRef]
- Zhang, H.; Guo, K.; Liu, Z.; et al. How Has the Rural Digital Economy Influenced Agricultural Carbon Emissions? Agricultural Green Technology Change as a Mediated Variable. Front. Environ. Sci. 2024, 12, 1344567. [Google Scholar] [CrossRef]
- Ning, X.; Zhang, D.; Zhang, W.; et al. Does Digital Transformation Promote Agricultural Carbon Productivity in China? Land 2022, 11, 1966. [Google Scholar] [CrossRef]
- Sun, Y.; Chen, Y. The Promotion Mechanism of Digital Phantomization of Enterprises for "Double Carbon" Goal: A Chinese Case Study. Environ. Sci. Pollut. Res. 2023, 30, 80741–80757. [Google Scholar] [CrossRef]
- Li, J.; Sheng, X.; Zhang, S.; et al. Research on the Impact of the Digital Economy and Technological Innovation on Agricultural Carbon Emissions. Land 2024, 13, 821. [Google Scholar] [CrossRef]
- Sun, K.; Tang, Y.; Zhang, D.; et al. Does Digital Finance Increase Relatively Large-Scale Farmers’ Agricultural Income through the Allocation of Production Factors? Evidence from China. Agriculture 2022, 12, 1915. [Google Scholar] [CrossRef]
- Xu, D.; Guo, W. Low-Carbon Transformation of China’s Smallholder Agriculture: Exploring the Role of Farmland Size Expansion and Green Technology Adoption. Environ. Sci. Pollut. Res. 2023, 30, 105522–105537. [Google Scholar] [CrossRef]
- Jiang, X. Digital Economy, Factor Allocation, and Sustainable Agricultural Development: The Perspective of Labor and Capital Misallocation. Sustainability 2023, 15, 4418. [Google Scholar] [CrossRef]
- Yang, T.; Hu, X.; Wang, Y.; et al. Dynamic Linkages among Climate Change, Mechanization and Agricultural Carbon Emissions in Rural China. Int. J. Environ. Res. Public Health. 2022, 19, 14508. [Google Scholar] [CrossRef]
- Zhuang, M.; Wang, X.; Yang, Y.; et al. Agricultural Machinery Could Contribute 20 % of Total Carbon and Air Pollutant Emissions by 2050 and Compromise Carbon Neutrality Targets in China. Nat. Food. 2025, 6, 1–10. [Google Scholar] [CrossRef]
- Ran, G.; Wang, G.; Du, H.; et al. Relationship of Cooperative Management and Green and Low-Carbon Transition of Agriculture and Its Impacts: A Case Study of the Western Tarim River Basin. Sustainability 2023, 15, 9024. [Google Scholar] [CrossRef]
- Wang, L.; Lyu, J.; Zhang, J. Explicating the Role of Agricultural Socialized Services on Chemical Fertilizer Use Reduction: Evidence from China Using a Double Machine Learning Model. Agriculture 2024, 14, 2148. [Google Scholar] [CrossRef]
- Yao, W.; Zhu, Y.; Liu, S.; et al. Can Agricultural Socialized Services Promote Agricultural Green Total Factor Productivity? From the Perspective of Production Factor Allocation. Sustainability 2024, 16, 8425. [Google Scholar] [CrossRef]
- Li, P.; He, L.; Zhang, J.; et al. Research on the Impact of Agricultural Socialization Services on the Ecological Efficiency of Agricultural Land Use. Land 2024, 13, 853. [Google Scholar] [CrossRef]
- Cheng, Y.; Zhang, D.; Wang, X. Agricultural Total Factor Productivity Based on Farmers’ Perspective: An Example of CCR, BCC, SBM and Technology Optimization Malmquist-Leuenberger Index. JRE 2024, 15, 267–279. [Google Scholar] [CrossRef]
- Feng, Y.; Zhang, Y.; Wang, Z.; et al. Evaluation of Agricultural Eco-Efficiency and Its Spatiotemporal Differentiation in China, Considering Green Water Consumption and Carbon Emissions Based on Undesired Dynamic SBM-DEA. Sustainability 2023, 15, 3361. [Google Scholar] [CrossRef]
- Huang, Q.; Guo, W.; Chen, Y. Measuring the Digitization Level of China’s Grain Industry Chain and Its Spatial–Temporal Evolution. Agriculture 2024, 14, 1371. [Google Scholar] [CrossRef]
- Hao, Y.; Zhang, Y. Coupling Coordination between Cultivated Land Intensification and Scale in Inner Mongolia from 2006 to 2021. BULL SOIL WATER CONSERV 2024, 44, 314–325. [Google Scholar] [CrossRef]
- Li, B.; Zhang, J.; Li, H. Spatio-Temporal Characteristics and Influencing Factors Decomposition of Agricultural Carbon Emissions in China. CJ PRE 2011, 21, 80–86. [Google Scholar] [CrossRef]
- Zhou, Y.; Zhang, E.; He, L.; et al. The Carbon Emission Reduction Benefits of the Transformation of the Intensive Use of Cultivated Land in China. J. Environ. Manage. 2024, 370, 122978. [Google Scholar] [CrossRef] [PubMed]
- Wang, Y.; Liang, S.; Liang, Y.; et al. A Comprehensive Accounting of Carbon Emissions and Carbon Sinks of China’s Agricultural Sector. Land 2024, 13, 1452. [Google Scholar] [CrossRef]
- Zhu, T.; Cao, J. Analysis of Agricultural Ecological Efficiency in the Yellow River Basin from the Perspective of Carbon Source and Carbon Sink. Ecol. Econ. 2024, 40, 129–135. [Google Scholar] [CrossRef]
- Yang, X.; Chen, Y.; Gao, R. Measurement of Agricultural Environmental Efficiency and Agricultural Total Factor Productivity under Carbon Emission Constraints in Gansu Province. Chin. J. Agric. Resour. Reg. Plan. 2021, 42, 13–20. [Google Scholar] [CrossRef]
- Jiang, T.; Zhong, M.; Ma, G. The Impact of Digital Economy on Agricultural Green Total Factor Productivity: Analysis Based on the Mediating Role of Land Management Efficiency. J. China Agric. Univ. 2024, 29, 27–39. [Google Scholar] [CrossRef]
- Liu, Y.; Xu, S. Research on the Impact of Digital Economy Development on Agricultural Carbon Emissions in China. Chin. J. Agric. Resour. Reg. Plan. 2025, 1–11. [Google Scholar] [CrossRef]
- Zhang, S.; Wen, X.; Sun, Y.; et al. Impact of Agricultural Product Brands and Agricultural Industry Agglomeration on Agricultural Carbon Emissions. J. Environ. Manag. 2024, 369, 122238. [Google Scholar] [CrossRef] [PubMed]
- Li, Y.; Li, J.; Li, X.; et al. Does Participation in Digital Supply and Marketing Promote Smallholder Farmers’ Adoption of Green Agricultural Production Technologies? Land 2024, 14, 54. [Google Scholar] [CrossRef]
- Zhang, R.; Tang, R.; Yao, Y.; et al. Research on the Willingness of Large-Scale Farmers to Produce Green and High-Quality Agricultural Products under the TPB-NAM Framework: Based on Survey Data from Jiangsu Province. Chin. J. Agric. Resour. Reg. Plan. 2023, 44, 184–194. [Google Scholar] [CrossRef]
Disclaimer/Publisher’s Note: The statements, opinions and data contained in all publications are solely those of the individual author(s) and contributor(s) and not of MDPI and/or the editor(s). MDPI and/or the editor(s) disclaim responsibility for any injury to people or property resulting from any ideas, methods, instructions or products referred to in the content. |
© 2025 by the authors. Licensee MDPI, Basel, Switzerland. This article is an open access article distributed under the terms and conditions of the Creative Commons Attribution (CC BY) license (http://creativecommons.org/licenses/by/4.0/).
Copyright: This open access article is published under a Creative Commons CC BY 4.0 license, which permit the free download, distribution, and reuse, provided that the author and preprint are cited in any reuse.