Submitted:
27 August 2025
Posted:
01 September 2025
You are already at the latest version
Abstract
Pathway enrichment analysis (PEA) is fundamental for interpreting omics signatures. Standard PEA practice reduces results to tabular significance lists, where complex systems‑biology insights reside undisclosed. Here, we present Hyperpathway, an open-access network-based visualization webtool for PEA’s results interpretation. Given a table of statistically significant pathways and enriched molecules, Hyperpathway transforms this tabular information into a pathway–molecule bipartite network. Then it embeds the network into a two-dimensional hyperbolic disk, providing a holistic geometric representation of the nodes hierarchical organization along the radial coordinates, and the nodes similarity patterns along the angular coordinates. On genomic, metabolomic, and lipidomic datasets, Hyperpathway allows a deeper understanding of the interplay between pathways and their molecular components, facilitating the visualization and identification of latent functional systems biology modules not readable in conventional PEA tabular outputs. By bridging statistical enrichment analysis with network geometry, Hyperpathway advances pathway analysis from a list-based to a systems-level visualization paradigm.
Keywords:
pathway enrichment analysis (PEA)
; omics signatures
; systems biology
; network-based visualization
; bipartite networks
; hyperbolic embedding
; network geometry
; functional modules
; genomics
; metabolomics
; Lipidomics
; complex networks
; systems-level analysis
; web tool
; data interpretation
Introduction
Pathway enrichment analysis (PEA) is a pivotal method in systems biology to uncover the functional implications of biological data by interpreting the role of a set of molecules - often discriminative for a certain phenotype - within the context of predefined biological pathways [1]. The pathways are molecular circuits that implement a biological function: they are characterized by networks of genes, lipids, metabolites and other molecules involved in critical biological processes. In biomedical omics studies, particularly in genomics and metabolomics, researchers aim to identify molecular signatures - sets of genes, metabolites, or other biomolecules that exhibit significant changes under specific biological conditions [2,3]. However, interpreting these signatures requires a secondary analysis step to contextualize them within biological processes and identify relevant functional pathways [4]. Traditional PEA approaches, such as Over Representation Analysis (ORA) [5] and Functional Class Scoring (FCS) [6], have become widely used to identify biologically relevant pathways for molecular signatures learned from high-throughput biological data [7,8]. However, these methods have inherent limitations, particularly in how they treat pathway components and interactions. While ORA relies on statistical significance to detect enriched pathways, it often disregards the relationships between pathway components, leading to oversimplified interpretations [9,10]. FCS methods, on the other hand, extend ORA by considering coordinated changes in gene expression, offering a more nuanced approach but still treating pathways as static gene sets, failing to capture the interplays between pathway components [6,11].
To meet the growing demands of omics-scale biological interpretation, many functional enrichment tools have been developed across diverse domains, including GSEA for genomics [6], MPEA and MBRole for metabolomics [4,12], GeneTrail2 for multi-omics analysis [13] and LIPEA for lipidomics [14].
Here, we introduce Hyperpathway, a network-based computational framework for the visualization and interpretation of pathway enrichment analysis (PEA) results derived from omics studies. In addition, we demonstrate how Hyperpathway builds upon traditional PEA methods, augmenting the interpretability of their outputs.
Given a PEA results table reporting the statistically significant pathways and the molecules enriched in each pathway, Hyperpathway first transforms this tabular information into a pathway–molecule bipartite network. The network is then embedded into a two-dimensional hyperbolic disk using coalescent embedding [15], a widely recognized model-free methodology for mapping complex networks into the hyperbolic space (see Figure 1d). The hyperbolic disk representation is adopted because it offers a holistic geometric view of the network: the radial coordinates capture the hierarchical organization of nodes, while the angular coordinates reflect similarity patterns that underlie pathway–molecule interactions. This geometry enables deeper insight into the interplay between pathways and their molecular components, revealing, for example, the centrality of certain molecules across multiple pathways or the relative prominence of specific pathways with respect to subsets of molecules. Therefore, by leveraging a hyperbolic geometry, Hyperpathway projects complex bipartite interactions into an interpretable two-dimensional (2D) space, uncovering latent hierarchical and similarity structures hidden in the raw tabular outputs obtained by PEA.
Hyperbolic representations have recently been successfully applied in diverse fields, including, to name a few: Internet topology analysis [16], social network community structure representation [15], human brain connectome visualization and analysis [17,18], protein–protein interaction mapping [19], sparse artificial neural network architecture visualization and analysis [20]; demonstrating their ability to efficiently capture hierarchical and community-like patterns in large, heterogeneous datasets. Hyperpathway extends these advances to the biomedical domain, enabling the intuitive exploration of pathway–molecule relationships in omics data through a mathematically grounded geometric lens.
We demonstrate the utility of Hyperpathway by analyzing three public datasets encompassing genes, metabolites, and lipids. Our results reveal that representing pathway-molecule interactions in a hyperbolic bipartite network offers a more nuanced interpretation of biological information than traditional PEA alone. These results highlight the ability of Hyperpathway to identify central elements within biological networks associated with significant pathways, providing insights that go beyond p-value-based significance testing and therefore offering a robust add-on to traditional pathway enrichment methods.
By introducing an innovative network-based perspective, Hyperpathway represents a step forward in the pathway analysis field, offering both a powerful analytical tool and a novel approach to visualize and interpret biological and biomedical omics data.
Results
Hyperpathway
Given a set of molecules significantly associated with a phenotype (e.g., a disease or a cellular state change), also known as a molecular signature, the standard PEA output is typically presented as a table (Figure 1a). Each row of this table contains: (i) a significant pathway, (ii) the subset of signature molecules statistically enriched in that pathway, and (iii–v) the corresponding enrichment p-values (uncorrected, Benjamini–Hochberg–corrected, and Bonferroni–corrected). The first two columns define a bipartite structure linking pathways to molecules, while the p-values provide visual labels of enrichment significance in the final embedding. This bipartite structure arises because pathways connect only indirectly through shared enriched molecules, and molecules connect only indirectly by appearing in multiple enriched pathways. Such two-step indirect connections between nodes of the same class are a defining structural feature of bipartite networks [21,22,23].
The first step of Hyperpathway is to convert a tabular representation of bipartite knowledge into a bipartite network of pathway-molecule interactions, as shown in Figure 1b. The second step is to perform coalescent embedding (Figure 1c and see Method section) of the PEA bipartite network to infer the radial and angular coordinates of the network’s nodes in the 2D hyperbolic disk. Figure 1d shows the final step that visualizes the pathway–molecule interaction network in a 2D hyperbolic disk using a native hyperbolic representation [18], with significant pathway nodes color-coded by their significance level: uncorrected, i.e., raw p-value (grey node), Benjamini–Hochberg-corrected (orange node) and Bonferroni-corrected (red node). In the 2D hyperbolic disk representation, the radial coordinates are associated with the node degree centrality in the network. Nodes that are located towards the center of the disk are of higher relevance in the network hierarchical organization, and they are expected to play a pivotal role in the communication architecture of the system. In this study, they might indicate molecules of central hierarchical relevance across many enriched pathways, or pathways of higher relevance with respect to a certain subset of molecules. The angular coordinates are associated with the node similarity; this means that nodes that share a similar network neighborhood will take very close angular coordinates in the geometric space, and they have a similar role in the functioning of the system. These pathways typically share a similar subset of enriched molecules and collectively form a mesoscale structure, referred to as a ‘network community’ in social science and as ‘network module’ in systems biology [24]. The innovation of this Hyperpathway visualization is that it can display groups of pathways and molecules that co-locate in similar angular sectors of the 2D hyperbolic disk representation. This can reveal the presence of distinct network modules (see example in Figure 2), each differentiated by their pathway–molecule components, which contribute in varied ways to the mechanisms driving the phenotype investigated in the omics study. Moreover, Hyperpathway can be used not only to represent the output of PEA analysis, but also to represent any bipartite network. The link for the open-access webtool to generate figures using Hyperpathway is: https://hyperpathway-app.streamlit.app/.
In the next sections, we provide real-world examples in omics data science that demonstrate the practical applicability of Hyperpathway in revealing and visualizing biological pathways, molecular entities (genes, lipids, and metabolites) and their interconnections. Across all examples, the layout consistently exhibits a clear bipartite architecture, where molecular entities (circle-shaped nodes) connect solely to pathway nodes (diamond-shaped nodes), accurately preserving the structural properties of the original output of the PEA analysis.
Hyperpathway Visualization of Genomic Data
Gene-level functional enrichment was performed using DAVID (Database for Annotation, Visualization, and Integrated Discovery), [5] a widely used web-based tool (https://davidbioinformatics.nih.gov/) that provides comprehensive annotation and over-representation analysis across diverse biological categories. As input, we used the example gene list demolist2 provided by DAVID, which includes official gene symbols mapped to Homo sapiens. This list was submitted to identify significantly enriched terms and associated pathways. Default parameters were used, and the background was set to the entire human genome. The resulting table of enriched pathways served as input for our subsequent Hyperpathway visualization (Supplementary Information S2, Table S1). At a significance threshold of p-value < 0.05, 38 pathways were enriched after Bonferroni correction, 68 after Benjamini-Hochberg correction, and 403 before multiple testing correction, i.e. uncorrected.
Figure 2 reports the Hyperpathway visualization of the significantly enriched gene-pathway interaction network including only the 68 pathways remaining after Benjamini-Hochberg correction. We observe that dense network modules emerge around key biological processes. For example, one angular sector was densely populated with pathways involved in ‘Transcriptional and epigenetic regulation in the nucleus’, creating a module (module 2, Figure 2) including positive regulation of transcription by RNA polymerase II, DNA-binding transcription activator activity, and chromatin. Another angular sector revealed a module (module 3, Figure 2) grouped pathways associated with ‘Cytokine signaling and inflammatory immune activation’, including NF-κB, TNF, IL-17 signaling, cytokine activity, malaria and hepatitis B. This inflammatory hub integrates multiple cytokine and pathogen-induced signaling pathways central to immune response, stress adaptation, and inflammation-associated disease. Another angular region revealed a module (module 2, Figure 2) of ‘Membrane dynamics and host-pathogen interaction’, such as Amoebiasis, Legionellosis, Cell adhesion, Calcium signaling, and glutamatergic synapse, highlighting the spatial co-localization of genes involved in membrane-associated signaling, pathogen entry, and intercellular communication.
The visualization of these densely connected regions, which emerge as network modules, confirms that the Hyperpathway embedding captures functional proximity through angular space and biological specificity along radial coordinates. Notably, genes located at higher radial coordinates tend to exhibit tighter pathway specificity, suggesting that radial stratification in the embedding encodes a biologically meaningful hierarchy. Supplementary Figure S1. (Supplementary Information S1) reports the extended Hyperpathway visualization including all 403 pathways before multiple testing correction.
Hyperpathway Visualization of Metabolomics Data
We used MetaboAnalyst 6.0 [25], a webtool for metabolomics data functional interpretation (https://www.metaboanalyst.ca/MetaboAnalyst/upload/PathUploadView.xhtml). We ran the pathway analysis with the example data provided by the webtool to identify biological pathways significantly enriched with metabolites of interest. The resulting output table (Supplementary Information S2, Table S2), listing pathways and their associated metabolites along with adjusted p-values, served as input for our subsequent Hyperpathway visualization. At a significance threshold of p < 0.05, 6 pathways were enriched after Bonferroni correction, 8 after Benjamini-Hochberg adjustment, and 16 before multiple testing correction.
Figure 3 reports the Hyperpathway visualization of the significantly enriched metabolite-pathway interaction network including only the 8 pathways remaining after Benjamini-Hochberg correction. Pathways are distributed along distinct angular branches, suggesting functional modularity. In the Hyperpathway representation, significant metabolic pathways often appear close to one another when they share common metabolites (precursors or intermediates). For instance, Phenylalanine metabolism and Phenylalanine, tyrosine and tryptophan biosynthesis are both located near L-Phenylalanine, L-Tyrosine and Phenylpyruvic acid, creating a network module (module 1, Figure 3). Another spatial arrangement of interest is that formed by Glycine, serine and threonine metabolism, Cysteine and methionine metabolism, and One carbon pool by folate (module 3, Figure 3). These pathways are enriched with a large number of common metabolites in their close neighborhood, resulting in their co-localization within the hyperbolic space. The co-localization of these nodes in the Hyperpathway representation highlights the presence of a network module, illustrating the central role of these pathways in one-carbon metabolism, methylation, and amino acid regulation, as well as their interconnectedness in maintaining cellular homeostasis [26]. Remarkably, the extended Hyperpathway visualization (Supplementary Information S1, Supplementary Figure S2) by adding uncorrected significant pathways influences the overall network structure and spatial relationships between the pathways, rearranging the network modules in a broader context. Thus, even a new module related to cellular energy production (module 4, Supplementary Figure S2 in Supplementary Information S1 and Figure 3) can be identified.
The emergence of network modules in the geometric representation means that the layout reflects biochemical relationships: pathways that depend on the same core metabolites are placed nearby in the hyperbolic space. This feature supports the interpretability of the visualization, as it mirrors known biochemical connectivity in a geometric form.
Hyperpathway Visualization of Lipidomic Data
We used lipidomic data from a multi-omics study [27] involving 2,608 individuals across three type 2 diabetes (T2D) cohorts. The dataset includes high-quality measurements of 162 lipid species, including triacylglycerols and sphingomyelins, after rigorous quality control and batch correction. The dataset of potential lipid markers for T2D was subsequently analyzed using LIPEA (Lipid Pathway Enrichment Analysis), [14] a web-based tool (https://hyperlipea.org/home). LIPEA performs over-representation analysis to identify biological pathways enriched in lipid signatures. The analysis was conducted using the default background for Homo sapiens, meaning all lipids annotated in human metabolic pathways were considered as the reference set from which the input signature was derived. LIPEA returns a list of enriched pathways sorted by adjusted p-values (Bonferroni, Benjamini-Hochberg). At a significance threshold of p-value < 0.05, 4 pathways were enriched after Bonferroni correction, 14 after Benjamini-Hochberg adjustment, and 38 before multiple testing correction (Supplementary Information S2, Table S3).
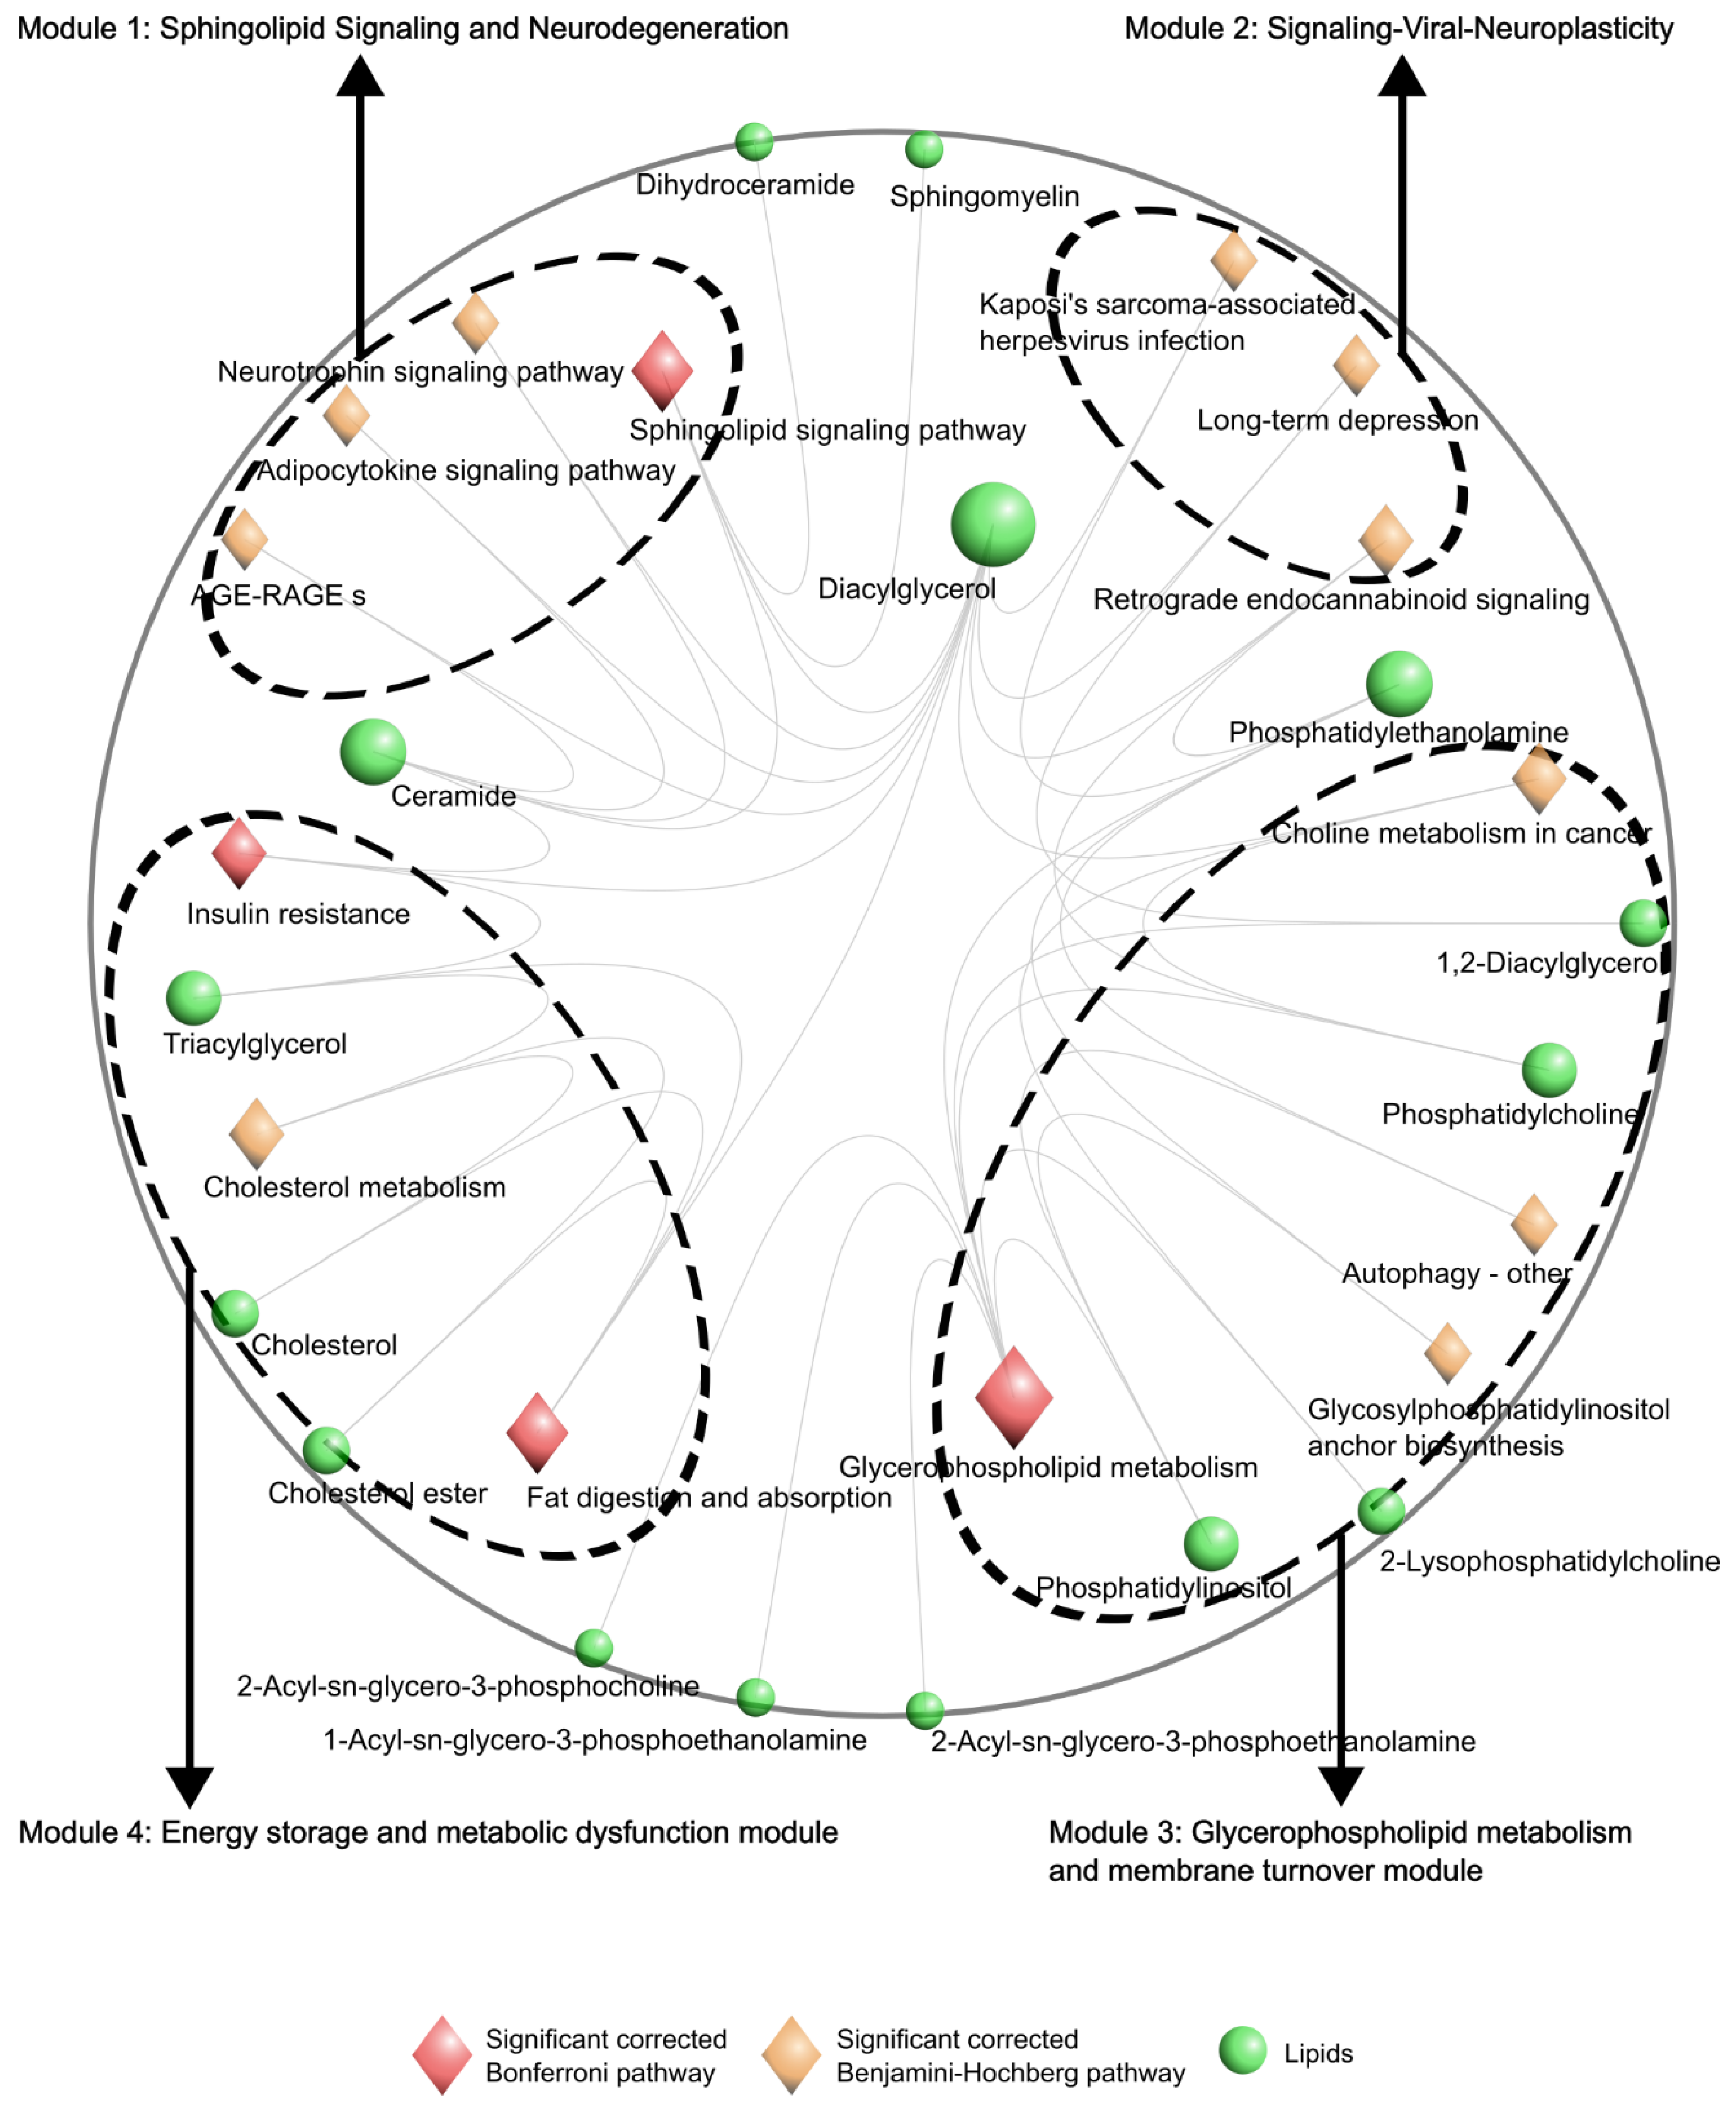
Figure 4 reports the Hyperpathway visualization of the significantly enriched lipid-pathway interaction network including only the 14 pathways remaining after Benjamini-Hochberg correction. Central lipids such as Diacylglycerol (DAG) and Phosphatidylethanolamine (PE) emerge as key hubs, linking multiple network modules involved in various critical biological processes including membrane dynamics, energy storage, and inflammation. Pathways like Glycerophospholipid metabolism and Sphingolipid signaling pathway appear closer to the core, suggesting higher connectivity or shared lipids with multiple other pathways. Glycerophospholipids are crucial for maintaining membrane integrity, mediating insulin signaling and regulating inflammatory responses; all of which are dysregulated in type 2 diabetes (T2D) [28,29].
Glycerophospholipid metabolism and Choline metabolism in cancer co-locate together, forming a network module (module 3, Figure 4), which shares several lipid species. This is biologically coherent, as choline-containing phospholipids play roles in both pathways. Choline-containing phospholipid metabolisms were shown to be altered in incident T2D groups [28,29,30]
Also, key metabolic pathways relevant to T2D, like Insulin resistance, Cholesterol metabolism, and Fat digestion and absorption, are not only significantly enriched but also densely connected (module 4, Figure 4) to multiple central lipids (e.g., Triacylglycerol, Cholesterol), reinforcing their relevance to the lipidomic signature of T2D progression. Their positioning near the core of the network reflects robust and multi-lipid associations.
In contrast, some pathways, although statistically significant, are connected to the lipid signature via a single lipid node. These isolated connections, while valid by enrichment statistics, may reflect more tenuous or specific biochemical relationships and thus benefit from cautious interpretation. The presence in peripheral or weakly connected regions (Supplementary Information S1, Supplementary Figure S1–S3) of numerous significant uncorrected pathways provides a background for comparison and highlights the structural coherence of the top-enriched terms.
The Hyperpathway representation for lipidomic data offers a visual summary of how lipidomic signals map onto functionally distinct yet disease-relevant biochemical axes in T2D. Supplementary Figure S3 reports the extended Hyperpathway visualization including all 38 pathways before multiple testing correction (i.e., uncorrected).
Discussion
Hyperpathway is designed to provide a fast and informative visual summary of the bipartite pathway-molecule relationships derived from omics datasets via Pathway enrichment analysis (PEA). Hyperpathway takes as input the enriched pathways, their associated molecules, and enrichment p-values (corrected or uncorrected for multiple testing). It rapidly maps the pathway–molecule interaction network onto a 2D hyperbolic disk and color-codes pathway nodes according to the level of statistical significance after multiple testing correction. The radial coordinate in the 2D Hyperpathway representation is associated with the hierarchical role of a node; hence, central nodes have higher hierarchical relevance. The angular coordinate instead reflects the level of similarity between the nodes; thus, nodes in the same angular sector are more closely associated. Hyperpathway generates a mapping that transforms the molecule-pathway interaction network’s topological hierarchy and similarity into geometric distances, thereby revealing and deepening our understanding of its complex modular structure. Functional modules emerge as ensembles of nodes co-localized within similar angular coordinate sectors, while integration across distinct modules is mediated by nodes exhibiting higher radial centrality.
The user can adopt two complementary visualizations: one displaying only statistically significant molecule-pathway interactions adjusted for multiple testing, and another that includes significant interactions that lose their significance after adjustment. This dual output is provided for contextual interpretation; indeed, it allows researchers to differentiate core functional modules from peripheral or borderline associations, offering a multi-layered perspective that is particularly useful in complex, multi-omics studies. The use of hyperbolic geometry ensures that both global context and local details are preserved [31], enabling an intuitive interpretation of hierarchical and modular structures in biological networks [32].
In future development, we plan to extend Hyperpathway with additional post-visualization algorithms, such as automated node clustering and community detection, to provide users with computational support for identifying putative network modules. For the initial release, however, our focus remains on simplicity and user-friendliness through data visualization, with subsequent expansions guided by user feedback. In terms of limitations, we could argue that incorporating direct molecule–molecule interactions from curated databases into the PEA bipartite network is feasible. However, this would complicate and destabilize the network’s structure, disrupting its bipartite organization and deviating from the outcomes of the original PEA analysis. Introducing such links would shift the visualization’s focus away from a direct interpretation of the PEA output, resulting in a more intricate and less tractable landscape. This presents a distinct representational challenge that warrants investigation in future studies. Currently, Hyperpathway operates exclusively at the molecular scale, focusing on relationships between pathways and entities such as genes, proteins, lipids, metabolites, etc. This focus is already valuable for understanding system-level organization and deriving mechanistic hypotheses on pathway-molecule interactions underlying molecular signatures. However, we recognize a critical need to extend the scope of Hyperpathway beyond molecule-level data to encompass sample-level embeddings. This expansion would allow pathway-based representations of individual samples, creating the potential for personalized pathway fingerprints. In clinical and translational settings, transforming thousands of raw molecular measurements into a smaller, interpretable set of pathway activities per sample is a desirable goal. This reduction can enhance interpretability, support clustering or stratification of patients, and ultimately aid in personalized therapeutic decisions. Sample-scale analysis would also enable the study of dynamic changes in pathway activity over time or in response to treatment, making Hyperpathway a more versatile tool for systems medicine. We envision integrating this sample-level functionality by projecting sample profiles onto the existing pathway hyperbolic space using similarity measures, such as pathway activity scores. This would allow Hyperpathway to serve as a unified interface for both molecule-to-pathway and sample-to-pathway interpretations, maintaining its visual and topological strengths while broadening its analytical capabilities.
In summary, Hyperpathway introduces an innovative way to visualize and interpret functional pathway enrichment results through the lens of hyperbolic geometry. While its current utility lies in molecular-scale visualization, future extensions to sample-level embedding could position it as a powerful tool for personalized omics analysis and pathway-informed decision-making in precision medicine.
Methods
Genomic Data
Gene-level functional enrichment analysis was performed using DAVID (Database for Annotation, Visualization, and Integrated Discovery) [5]; https://davidbioinformatics.nih.gov/summary.jsp. All analyses were run with default parameters. For DAVID, default settings include a modified Fisher’s exact test (EASE score threshold = 0.1) for enrichment analysis, the human genome as background, Benjamini–Hochberg correction and Bonferroni correction for multiple testing. The example gene list “demolist2” provided by DAVID (official gene symbols mapped to Homo sapiens) was used as input. The resulting enrichment table (Supplementary Information S2, Table S1) was subsequently visualized with Hyperpathway.
Metabolomic Data
We used MetaboAnalyst 6.0 [25], a user-friendly web-based tool for statistical and functional interpretation of metabolomics data. The tool supports a wide variety of univariate or multivariate statistical and machine learning methods to identify important features and patterns. It supports Pathway Analysis for 26 organisms as well as enrichment analysis of ~ 9,000 metabolite sets. We ran the pathway analysis module with the example data provided by the webtool to identify biological pathways significantly enriched with metabolites of interest. The resulting table (Supplementary Information S2, Table S2) of enriched pathways served as input for our subsequent hyperpathway visualization.
Lipidomic data
Lipidomic data were obtained in the study [27] from plasma samples of 2,608 individuals across three type 2 diabetes (T2D) cohorts. Lipid profiling was performed using the Lipotype Shotgun Lipidomics platform on a QExactive mass spectrometer (Thermo Scientific) following standardized guidelines. A total of 614 lipid species were initially measured; after quality control and batch correction using reference plasma samples, 162 high-quality lipid species were retained for analysis. Lipid identification and quantification were conducted using LipidXplorer-based software, with stringent criteria on signal-to-noise ratio and blank comparisons. The resulting lipidomic data were analyzed on the web-based tool called LIPEA (Lipid Pathway Enrichment Analysis) [14], a new valid resource for biologists and physicians to mine pathways significantly associated with a set of lipids, helping them to discover whether common and collective mechanisms are hidden behind those lipids. LIPEA performs over-representation analysis to identify biological pathways enriched in lipid signatures. The analysis was conducted using the default background for Homo sapiens, meaning all lipids annotated in human metabolic pathways were considered as the reference set from which the input signature was derived. LIPEA returns a list of enriched pathways. The resulting table (Supplementary Information S2, Table S3) of enriched pathways served as input for our subsequent hyperpathway visualization.
Hyperpathway
Hyperpathway is composed of three steps: conversion of the pathway analysis outputs into a bipartite network representation; coalescent embedding of the PEA bipartite network; visualization of the embedded network in the 2D native hyperbolic disk.
The users can download from the webtool the final figure to include in their studies; or they can download the node coordinates, node color (associated with the multiple testing correction), node molecule names and list of network interactions. The webtool is available at the following link: https://hyperpathway-app.streamlit.app/.
Conversion of the Pathway Analysis Outputs into Bipartite Network Representation
Based on the output of the PEA, the first entry is the list of significant pathways and the second entry is the subset of enriched molecules for each pathway. We created an algorithm to convert these two entries into a PEA bipartite network. The time complexity of the algorithm is, in most cases O((P+M)2), with P as the number of pathways and M as the number of unique molecules. The pseudo-code is provided in Supplementary Information S1, Algorithm S1. The bipartite network presents pathway and molecule (e.g., metabolites, lipids, genes, etc.) nodes and it links molecular entities to the biological pathways in which they are significantly enriched. This bipartite structure is then used as input for coalescent embedding.
Coalescent Embedding of the PEA Bipartite Network
Coalescent embedding [15] is a class of topological-based machine learning algorithms for nonlinear unsupervised dimensionality reduction and embedding of networks in a geometric space, such as hyperbolic one. The approach always involves 4 steps: (1) pre-weighting links with topological rules that approximate the underlying network geometry; (2) computing non-linear dimension reduction; (3) calculating angular coordinates; and (4) calculating radial coordinates. In this study, we implemented coalescent embedding considering the settings used in the original study [15], which offered excellent results in across many tests: Repulsion-attraction (RA1) pre-weighting (1), noncentered Isomap [33] (ncISO) (2); Equidistant adjustment (EA) (3); log-based popularity fading formula (4). In this way, we can effectively embed the original network for visualization into 2D hyperbolic space, reconstructing the network organization according to its latent manifold structure. The pseudo-code is provided in Supplementary Information S1, Algorithm S2.
Artificial Linking Strategy Between Separated components
A key methodological innovation of Hyperpathway is its ability to embed pathway-molecule association networks that consist of multiple separated components, a scenario frequently encountered in real-world biological datasets due to sparsity. Standard embedding algorithms often fail or provide misleading layouts when applied to disconnected graphs. To address this, we developed a procedure that automatically links graph components selectively before embedding, thereby allowing coherent hyperbolic layout without distorting the intrinsic topology.
Given an input matrix encoding pathway-molecule associations, we first computed the adjacency graph and identified the number of graph components. If the graph consists of a single connected component, we proceed directly with coalescent embedding as described above. If multiple components are detected, we apply an artificial linking strategy to connect components to each other with negligible bias to the network structure.
For each component, we identify two representative nodes: one for the pathway class (pathway anchor) and one for the molecule class (molecule anchor). Each of these two nodes is selected as the one with the highest degree with respect to its own class within the component. If multiple nodes have the same highest degree inside a class, we only select the first one encountered in the respective class. Each component is then connected to the rest of the network by linking its pathway anchor to the molecule anchor with the highest degree across the other components. This procedure ensures that only a minimal number of inter-component links are introduced, resulting in a bipartite graph augmented with exactly c − 1 links, where c is the number of original disconnected components. This minimally augmented graph is then processed by the coalescent embedding algorithm, allowing for a coherent global layout that maintains the distinct visual identity of each original module. The artificially created links do not need to be represented in the visualization layout, because they are exclusively used as putative bridges to allow a meaningful global embedding of the bipartite disconnected network in the same representation space.
The time complexity of the artificial linking strategy described is O(N2 + C⋅ N + C2), where C is the number of connected components in the input graph, N and E denote the total number of nodes and edges, respectively. The details of the algorithm and its time complexity are in Supplementary Information S1, Algorithm S3.
Visualization of the Embedded Network in the 2D Native Hyperbolic Disk
The time complexity of the visualization algorithm is O(N+E), where N and E denote the total number of nodes and edges, respectively. The pseudo-code is provided in Supplementary Information S1, Algorithm S4.
Supplementary Materials
The following supporting information can be downloaded at the website of this paper posted on Preprints.org.
Author Contributions
C.V.C. envisaged the study, designed the experiments and invented the artificial link strategy. A. L. worked on the initial data collection and testing parts of the Hyperpathway algorithm. I.A. and C.V.C. analyzed the results. I.A. and Y.L. realized the figures under the C.V.C. guidance. A.A. worked on the Python code implementation of the Hyperpathway algorithm. Z. L. double-checked the correctness of pseudo-code and time complexity analysis. I.A. realized the webtool. C.V.C., I.A. and Y.L. wrote the article with input and corrections from all the other authors. C.V.C. led, directed, and supervised the study.
Data Availability Statement
The demolist2 genomic data can be found at DAVID: https://david.ncifcrf.gov/tools.jsp. The metabolomic data are accessible at MetaboAnalyst 6.0 under the “Pathway Analysis” feature https://www.metaboanalyst.ca/MetaboAnalyst/upload/PathUploadView.xhtml. The lipidomic data are available from the original publication and can be downloaded from their Supplementary Data 3: https://doi.org/10.1038/s41467-023-38148-7. All these data are reported in the Suppl. Info 2 file together with the results of their PEA.
Acknowledgments
This work was supported by the Zhou Yahui Chair Professorship award of Tsinghua University (to C.V.C.), the National High-Level Talent Program of the Ministry of Science and Technology of China (grant number 20241710001, to C.V.C.), and the Shuimu Tsinghua Scholar Program (to I.A.).
References
- Reimand, J.; et al. Pathway enrichment analysis and visualization of omics data using g:Profiler, GSEA, Cytoscape and EnrichmentMap. Nat Protoc, 2019; 14, 482–517. [Google Scholar] [CrossRef]
- Ciucci, S.; et al. Enlightening discriminative network functional modules behind Principal Component Analysis separation in differential-omic science studies. Sci Rep, 2017; 7, 43946. [Google Scholar] [CrossRef]
- Huang, D. W. , Sherman, B. T. & Lempicki, R. A. Bioinformatics enrichment tools: paths toward the comprehensive functional analysis of large gene lists. Nucleic Acids Res, 2009; 37, 1–13. [Google Scholar] [CrossRef]
- Chagoyen, M. & Pazos, F. MBRole: enrichment analysis of metabolomic data. Bioinformatics, 2011; 27, 730–731. [Google Scholar] [CrossRef]
- Huang, D. W. , Sherman, B. T. & Lempicki, R. A. Systematic and integrative analysis of large gene lists using DAVID bioinformatics resources. Nat Protoc, 2009; 4, 44–57. [Google Scholar] [CrossRef]
- Subramanian, A.; et al. Gene set enrichment analysis: A knowledge-based approach for interpreting genome-wide expression profiles. Proceedings of the National Academy of Sciences, 2005; 102, 15545–15550. [Google Scholar] [CrossRef]
- Xie, C. , Jauhari, S. & Mora, A. Popularity and performance of bioinformatics software: the case of gene set analysis. BMC Bioinformatics, 2021; 22, 191. [Google Scholar] [CrossRef]
- García-Campos, M. A. , Espinal-Enríquez, J. & Hernández-Lemus, E. Pathway Analysis: State of the Art. Front Physiol, 2015; 6. [Google Scholar] [CrossRef]
- Pavlidis, P. , Qin, J., Arango, V., Mann, J. J. & Sibille, E. Using the Gene Ontology for Microarray Data Mining: A Comparison of Methods and Application to Age Effects in Human Prefrontal Cortex. Neurochem Res, 2004; 29, 1213–1222. [Google Scholar] [CrossRef]
- Khatri, P. , Sirota, M. & Butte, A. J. Ten Years of Pathway Analysis: Current Approaches and Outstanding Challenges. PLoS Comput Biol, 2012; 8, e1002375. [Google Scholar] [CrossRef]
- Drier, Y. , Sheffer, M. & Domany, E. Pathway-based personalized analysis of cancer. Proceedings of the National Academy of Sciences, 2013; 110, 6388–6393. [Google Scholar] [CrossRef]
- Kankainen, M. , Gopalacharyulu, P., Holm, L. & Orešič, M. MPEA—metabolite pathway enrichment analysis. Bioinformatics, 2011; 27, 1878–1879. [Google Scholar]
- Stöckel, D.; et al. Multi-omics enrichment analysis using the GeneTrail2 web service. Bioinformatics, 2016; 32, 1502–1508. [Google Scholar] [CrossRef]
- Acevedo, A. , Durán, C., Ciucci, S., Gerl, M. & Cannistraci, C. V. LIPEA: Lipid Pathway Enrichment Analysis. Preprint, 2018. [Google Scholar] [CrossRef]
- Muscoloni, A. , Thomas, J. M., Ciucci, S., Bianconi, G. & Cannistraci, C. V. Machine learning meets complex networks via coalescent embedding in the hyperbolic space. Nat Commun, 2017; 8, 1615. [Google Scholar] [CrossRef]
- Boguñá, M. , Papadopoulos, F. & Krioukov, D. Sustaining the Internet with hyperbolic mapping. Nat Commun, 2010; 1, 62. [Google Scholar] [CrossRef]
- Cacciola, A.; et al. Coalescent embedding in the hyperbolic space unsupervisedly discloses the hidden geometry of the brain. arXiv, 2017; arXiv:1705.04192. [Google Scholar]
- Cannistraci, C. V. & Muscoloni, A. Geometrical congruence, greedy navigability and myopic transfer in complex networks and brain connectomes. Nat Commun, 2022; 13, 7308. [Google Scholar] [CrossRef]
- Alanis-Lobato, G. , Mier, P. & Andrade-Navarro, M. The latent geometry of the human protein interaction network. Bioinformatics, 2018; 34, 2826–2834. [Google Scholar] [CrossRef]
- Zhang, Y. , Zhao, J., Wu, W. & Muscoloni, A. Epitopological learning and cannistraci-hebb network shape intelligence brain-inspired theory for ultra-sparse advantage in deep learning. in The Twelfth International Conference on Learning Representations (2024).
- Daminelli, S. , Thomas, J. M., Durán, C. & Vittorio Cannistraci, C. Common neighbours and the local-community-paradigm for topological link prediction in bipartite networks. New J Phys, 2015. [Google Scholar] [CrossRef]
- Kovács, I. A.; et al. Network-based prediction of protein interactions. Nat Commun, 2019; 10, 1–8. [Google Scholar]
- Muscoloni, A. , Abdelhamid, I. & Cannistraci, C. V. Local-community network automata modelling based on length-three-paths for prediction of complex network structures in protein interactomes, food webs and more. [CrossRef]
- Muscoloni, A. & Cannistraci, C. V. A nonuniform popularity-similarity optimization (nPSO) model to efficiently generate realistic complex networks with communities. New J Phys, 2018; 20, 052002. [Google Scholar] [CrossRef]
- Pang, Z.; et al. MetaboAnalyst 6.0: towards a unified platform for metabolomics data processing, analysis and interpretation. Nucleic Acids Res, 2024; 52, W398–W406. [Google Scholar] [CrossRef]
- Lionaki, E. , Ploumi, C. & Tavernarakis, N. One-Carbon Metabolism: Pulling the Strings behind Aging and Neurodegeneration. Cells, 2022; 11, 214. [Google Scholar] [CrossRef]
- Slieker, R. C.; et al. Identification of biomarkers for glycaemic deterioration in type 2 diabetes. Nat Commun, 2023; 14, 2533. [Google Scholar] [CrossRef]
- Lv, C.; et al. β- cell dynamics in type 2 diabetes and in dietary and exercise interventions. J Mol Cell Biol, 2022; 14. [Google Scholar] [CrossRef]
- Folli, F.; et al. Altered Insulin Receptor Signalling and β-Cell Cycle Dynamics in Type 2 Diabetes Mellitus. PLoS One, 2011; 6, e28050–e28050. [Google Scholar] [CrossRef]
- Yang, S. J. , Kwak, S.-Y., Jo, G., Song, T.-J. & Shin, M.-J. Serum metabolite profile associated with incident type 2 diabetes in Koreans: findings from the Korean Genome and Epidemiology Study. Sci Rep, 2018; 8, 8207. [Google Scholar] [CrossRef]
- Papadopoulos, F. , Kitsak, M., Serrano, M. Á., Boguñá, M. & Krioukov, D. Popularity versus similarity in growing networks. Nature, 2012; 489, 537–540. [Google Scholar] [CrossRef]
- Papadopoulos, F. , Kitsak, M., Serrano, M. Á., Boguñá, M. & Krioukov, D. Popularity versus similarity in growing networks. Nature, 2012; 489, 537–540. [Google Scholar] [CrossRef]
- Tenenbaum, J. B. , Silva, V. de & Langford, J. C. A Global Geometric Framework for Nonlinear Dimensionality Reduction. Science (1979), 2000; 290, 2319–2323. [Google Scholar] [CrossRef]
Figure 1.
Schematic overview of the Hyperpathway visualization. a A functional enrichment table listing pathways, associated molecules, and significance values (uncorrected, BH- and Bonferroni-corrected p-values). b The table is converted into a bipartite graph where molecules (circles) and pathways (diamonds) are nodes, and edges represent pathway-molecule associations. c The bipartite graph is embedded into hyperbolic space using coalescent embedding (CE). Each node is assigned angular (θ) and radial (ρ) coordinates that reflect functional similarity and hierarchy, respectively. d The embedding is visualized in a hyperbolic 2D disk. Functionally related molecules and pathways co-locate into angular sectors, revealing modular structure and hierarchical organization. The colors of the embedded pathway nodes (diamonds) are assigned according to the significance of p-values in the original functional enrichment table.
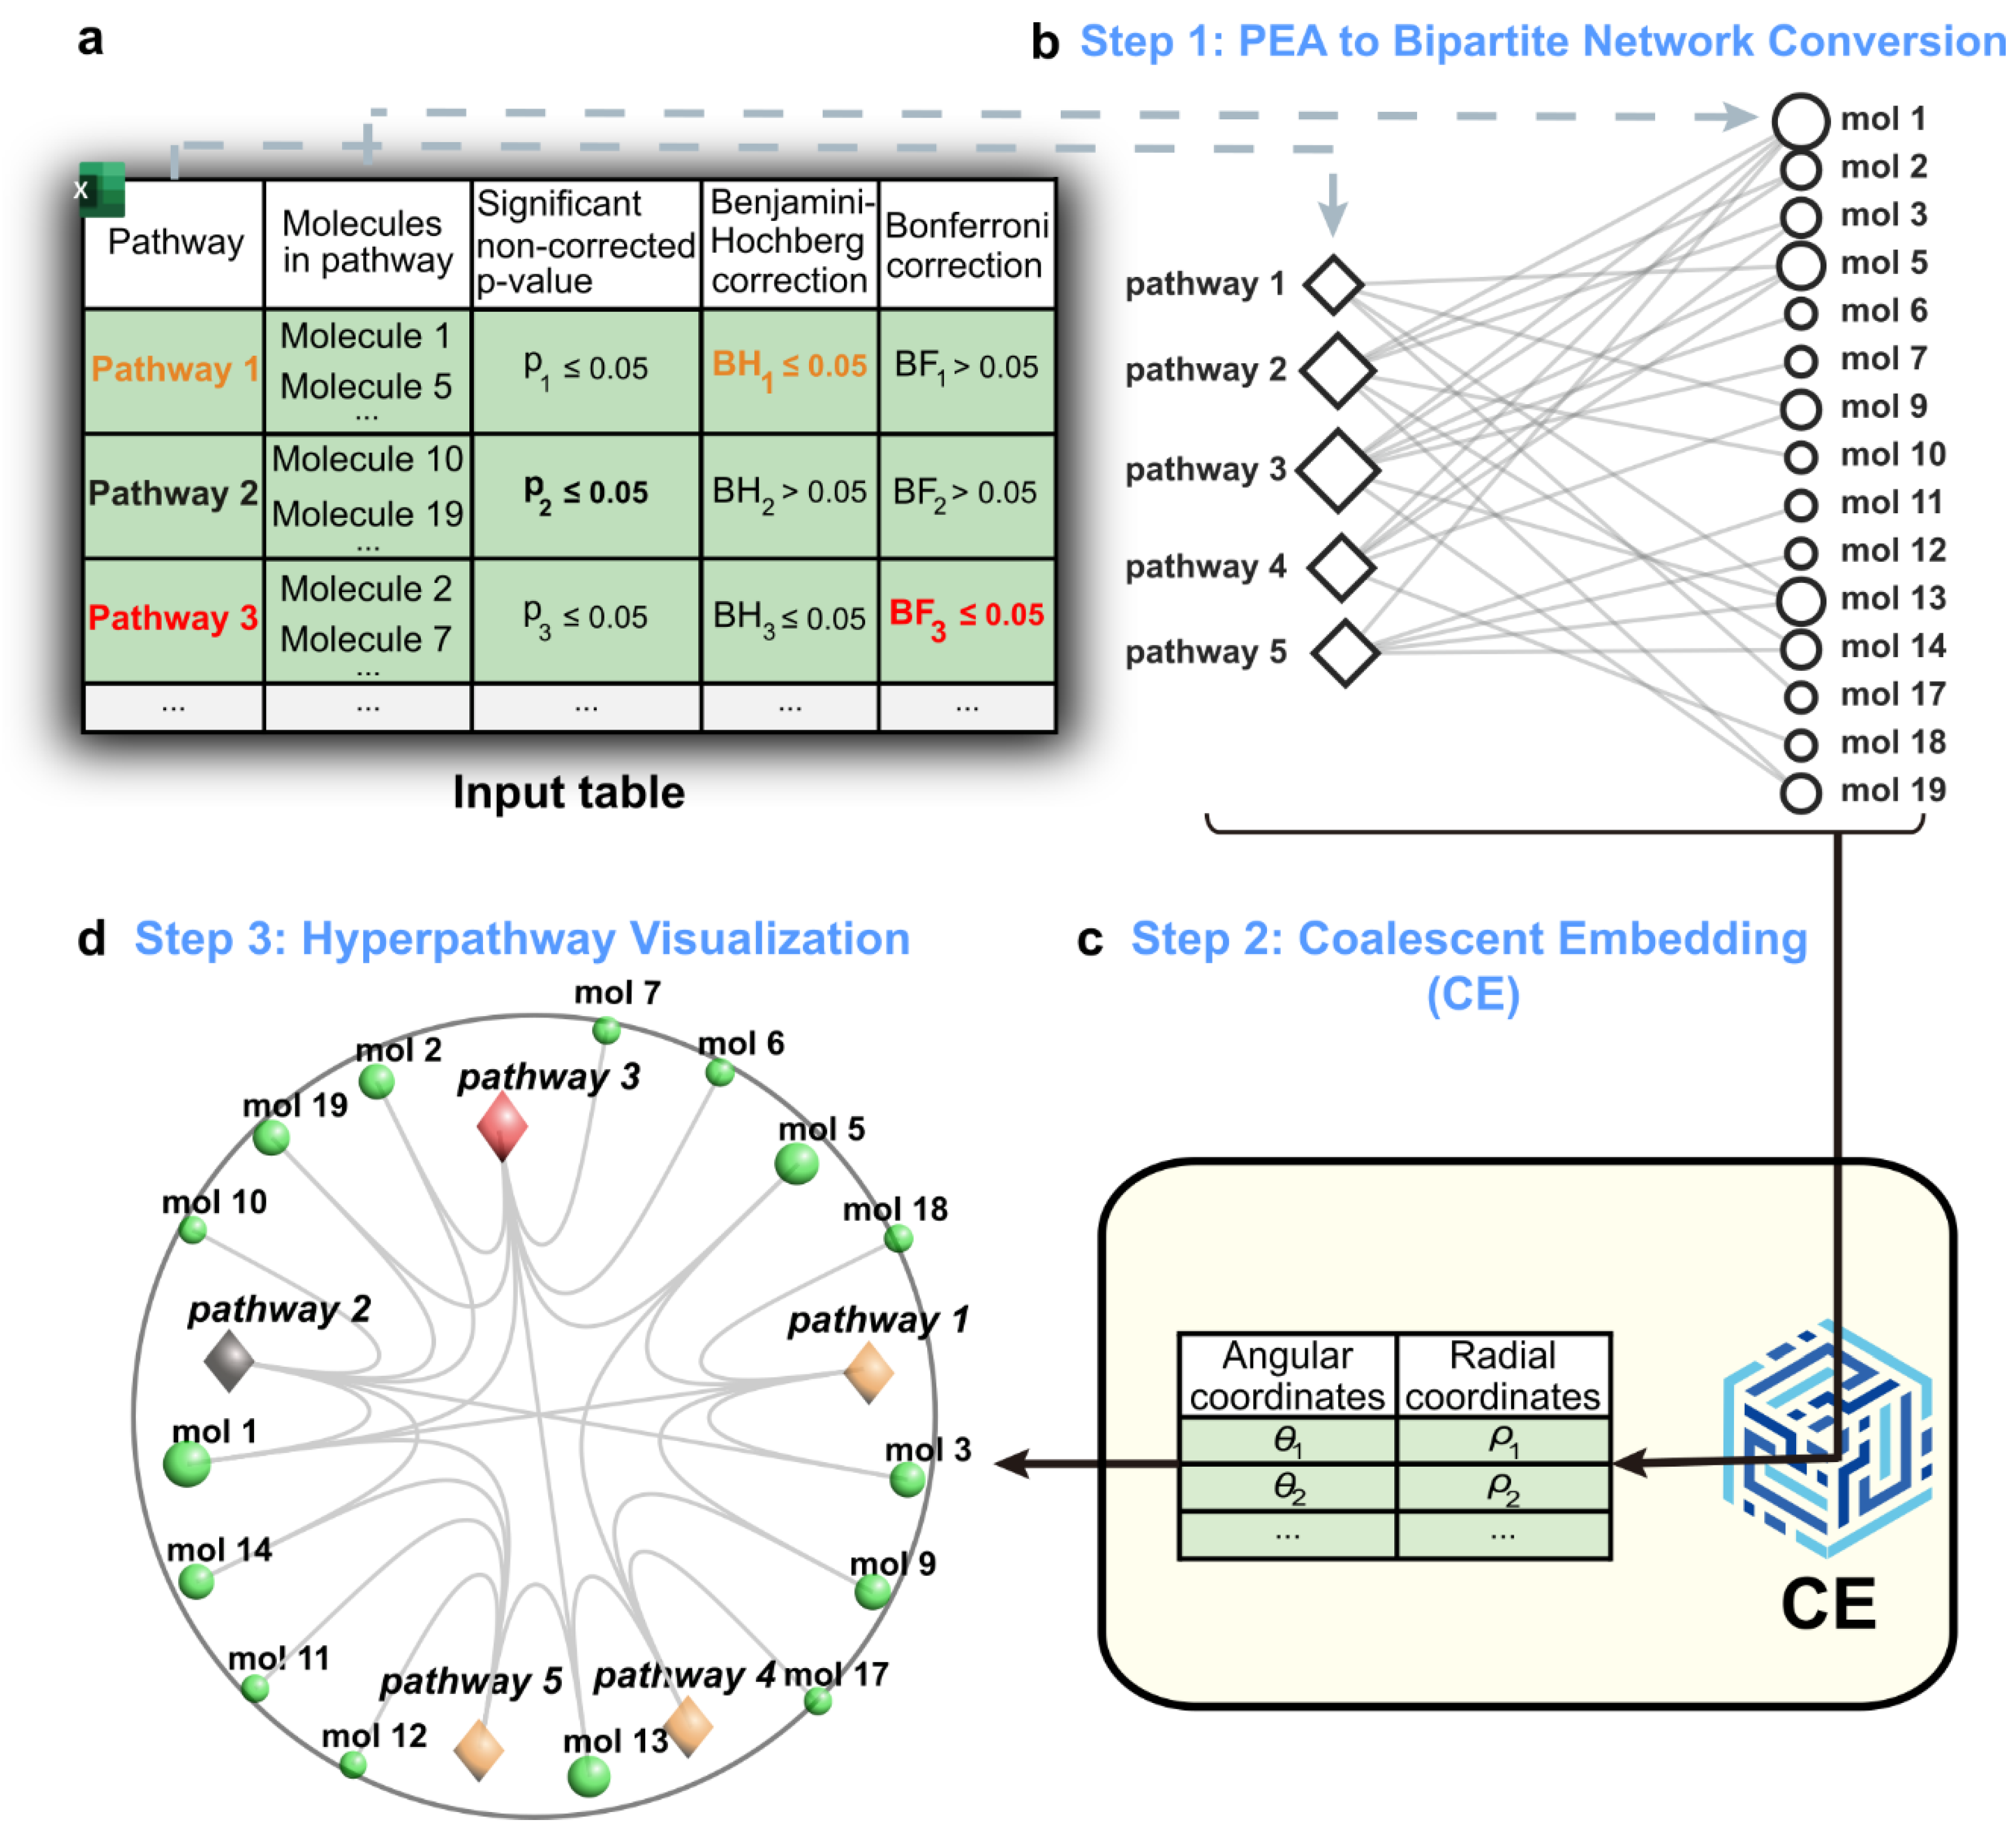
Figure 2.
Hyperpathway visualization of genomic data. Hyperpathway visualization in the 2D disk of the gene-pathway interactions. Genes and enriched pathways are visualized in a hyperbolic space embedding. Nodes representing pathways are highlighted according to their statistical significance: red indicates significant corrected Bonferroni pathways, while orange indicates significant corrected Benjamini–Hochberg (BH) pathways. Visually identified modules are marked by dashed ellipses, highlighting the set of pathways belonging to each module. Note that for clarity only the pathways are enclosed within the dashed ellipses; associated molecules may extend beyond the ellipses.

Figure 3.
Hyperpathway visualization of metabolic data. Hyperpathway visualization in the 2D disk of the metabolite-pathway interactions. Metabolites and enriched pathways are visualized in a hyperbolic space embedding. Nodes representing pathways are highlighted according to their statistical significance: red indicates significant corrected Bonferroni pathways, while orange indicates significant corrected Benjamini–Hochberg (BH) pathways. Visually identified modules are marked by dashed ellipses, highlighting the set of pathways belonging to each module. Note that for clarity only the pathways are enclosed within the dashed ellipses; associated molecules may extend beyond the ellipses.
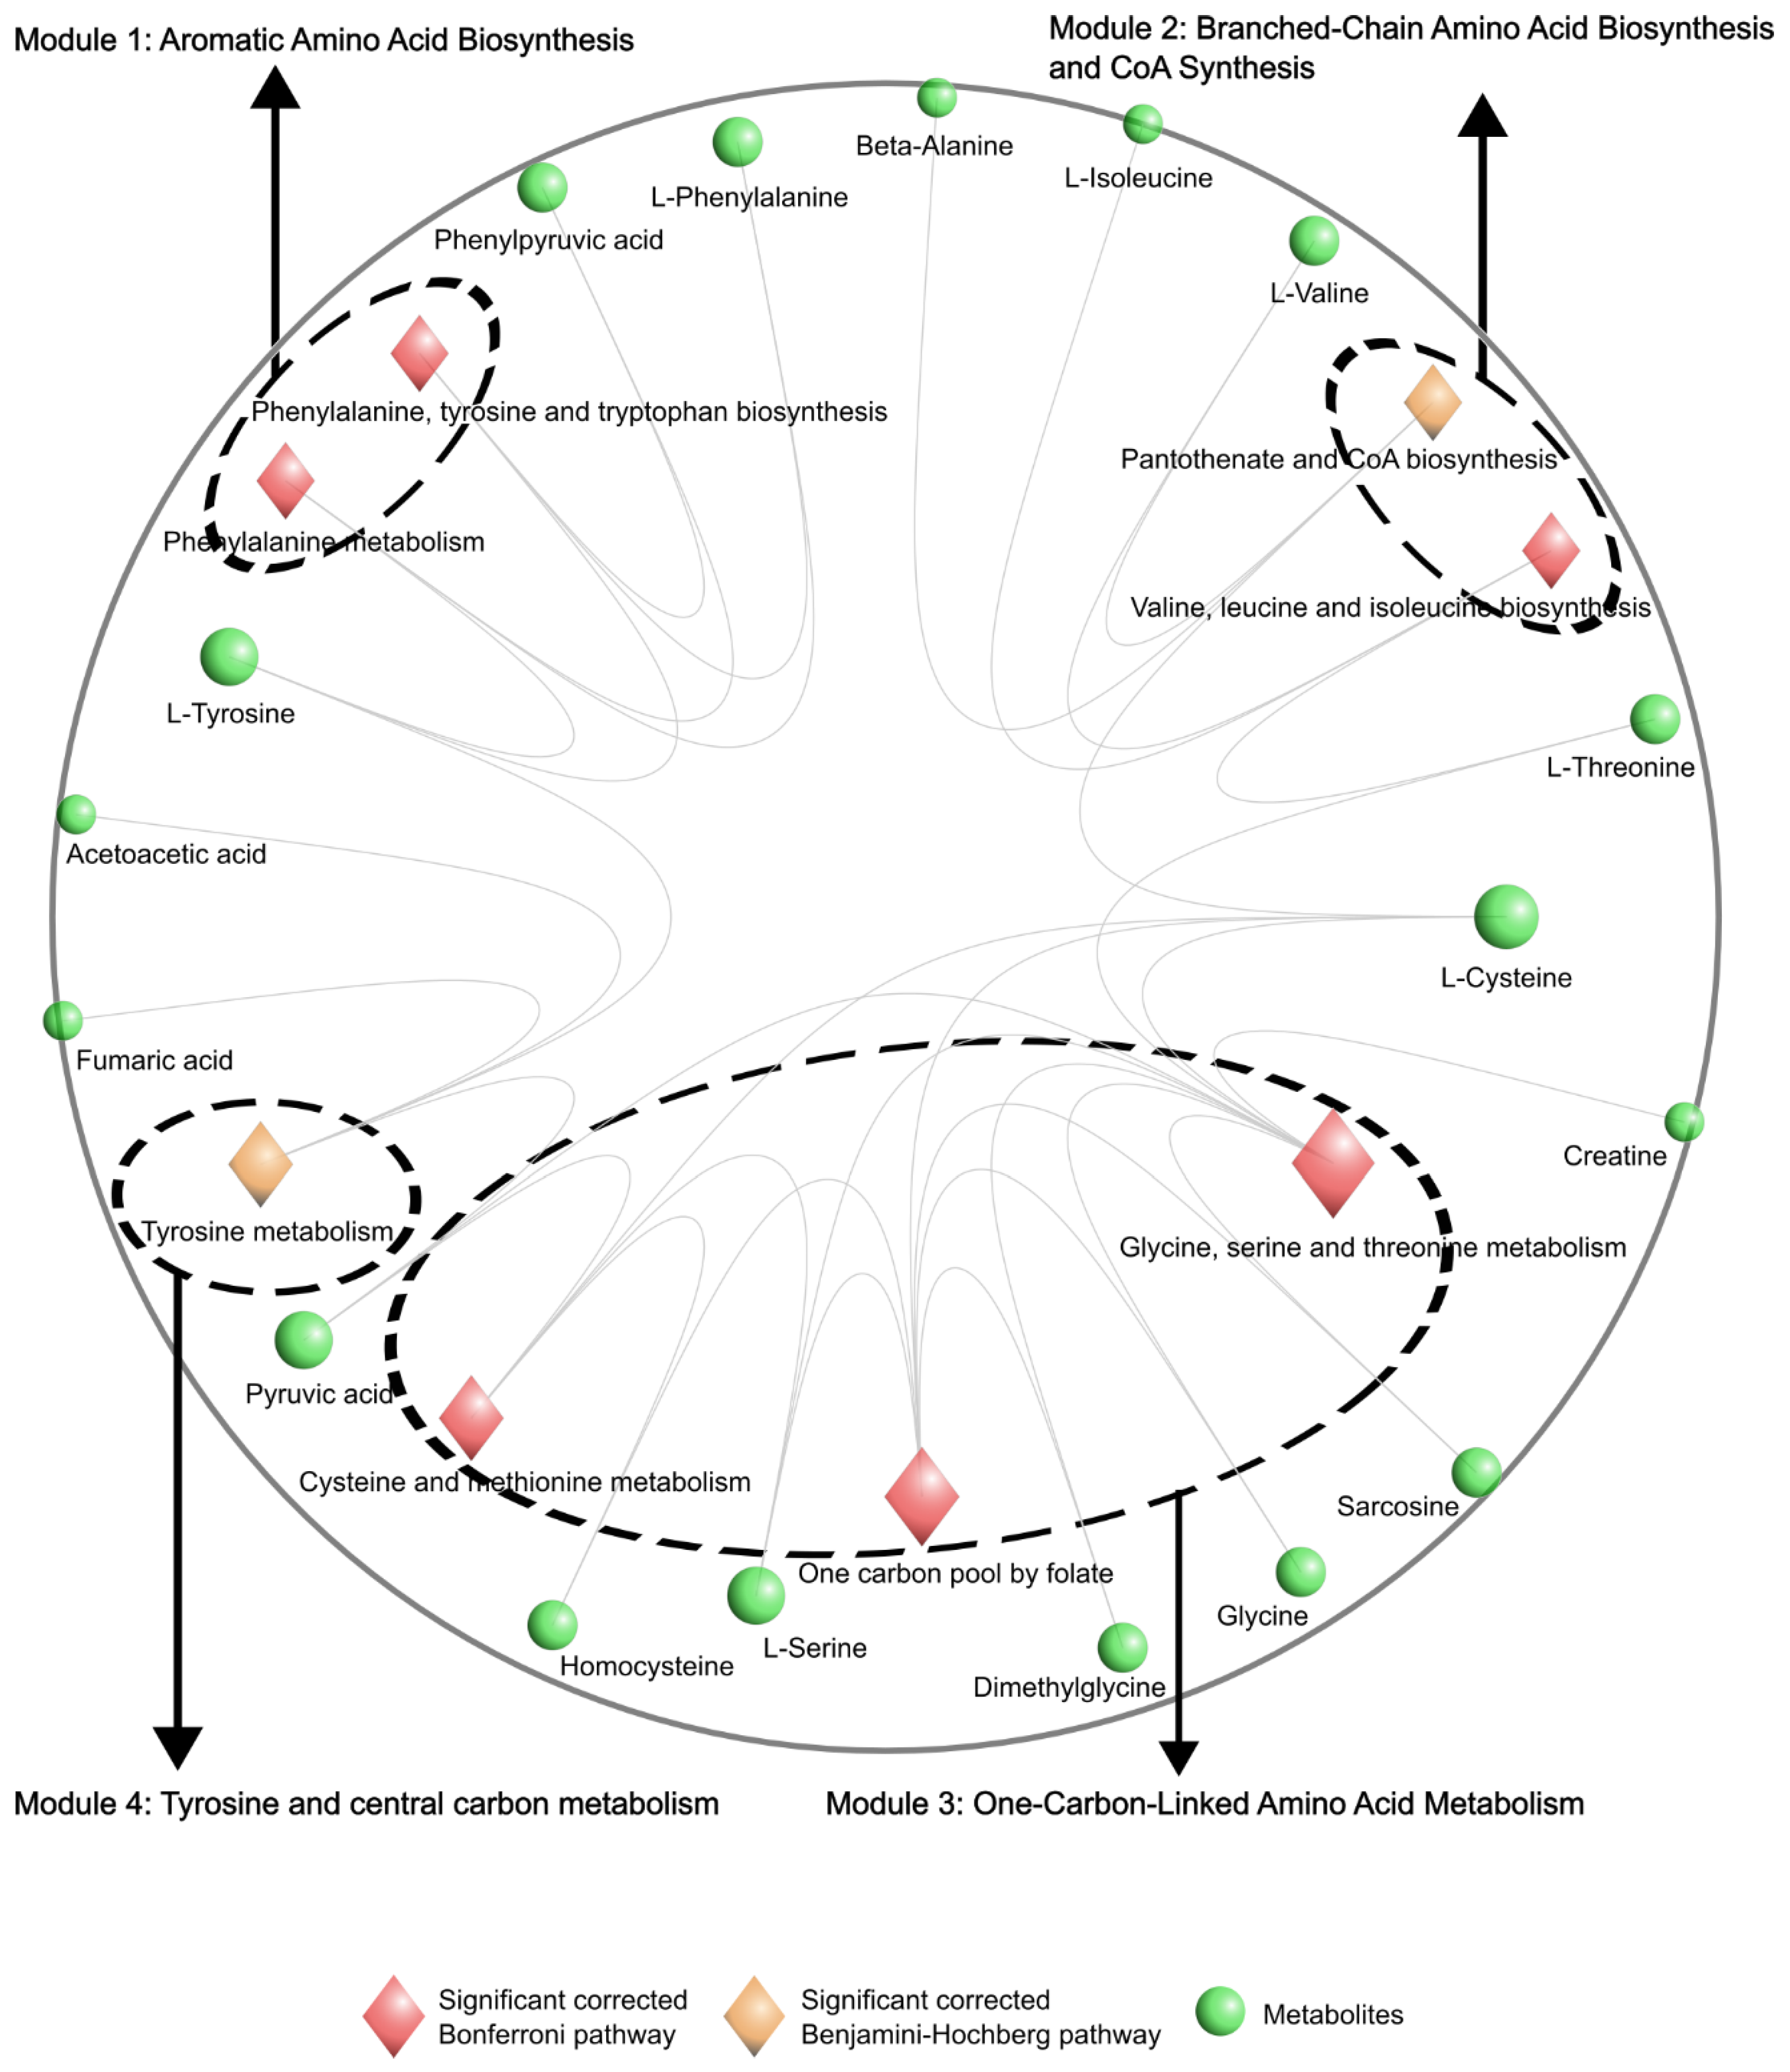
Figure 4.
Hyperpathway visualization of lipidomic data. Hyperpathway visualization in the 2D disk of the lipid-pathway interactions. Lipids and enriched pathways are visualized in a hyperbolic space embedding. Nodes representing pathways are highlighted according to their statistical significance: red indicates significant corrected Bonferroni pathways, while orange indicates significant corrected Benjamini–Hochberg (BH) pathways. Visually identified modules are marked by dashed ellipses, highlighting the set of pathways belonging to each module. Note that for clarity only the pathways are enclosed within the dashed ellipses; associated molecules may extend beyond the ellipses.
Disclaimer/Publisher’s Note: The statements, opinions and data contained in all publications are solely those of the individual author(s) and contributor(s) and not of MDPI and/or the editor(s). MDPI and/or the editor(s) disclaim responsibility for any injury to people or property resulting from any ideas, methods, instructions or products referred to in the content. |
© 2025 by the authors. Licensee MDPI, Basel, Switzerland. This article is an open access article distributed under the terms and conditions of the Creative Commons Attribution (CC BY) license (http://creativecommons.org/licenses/by/4.0/).
Copyright: This open access article is published under a Creative Commons CC BY 4.0 license, which permit the free download, distribution, and reuse, provided that the author and preprint are cited in any reuse.


