
Submitted:
27 August 2025
Posted:
27 August 2025
You are already at the latest version
Abstract
Recent computing technologies and modern information systems require an access control model that provides flexibility, granularity, and dynamism. The Attribute-Based Access Control (ABAC) model was developed to address the new challenges of emerging applications. Designing and implementing an ABAC policy manually is usually a complex and costly task; therefore, many organizations prefer to keep their access control mechanisms in operation rather than incur the costs associated with the migration process. A solution to the above is to automate the process of creating access control policies. This action is known as policy mining. In this paper, we present a novel approach, based on complex network analysis, for mining an ABAC policy from an access control log. The proposed approach is based on the data and the relationships that can be generated from them. The proposed methodology is divided into five phases: 1) data preprocessing, 2) network model, 3) community detection, 4) policy rules extraction, and 5) policy refinement. The results show that it is possible to obtain an ABAC policy using the approach based on complex networks. In addition, our proposed methodology outperforms existing ABAC mining algorithms in terms of quality. Finally, we present a novel access decision process that reduces the number of rules to evaluate based on a rule network.
Keywords:
policy mining
; access control
; complex networks
1. Introduction
The importance of information security has increased as the world has become more interconnected [1]. The main objective of information security is to protect sensitive and confidential data from unauthorized access, use, and disclosure. According to a 2024 study by IBM and the Ponemon Institute, the average cost of a data breach was USD 4.88 million [2]. It is clear to observe that organizations, industries, and national security depend on a robust information security program to prevent security breaches and protect critical information.
By adopting an Access Control (AC) mechanism, resources and information can be protected from unauthorized entities and malicious activity. The goal of access control is to ensure that only authorized entities are granted access to the resources and information they need to perform their job functions [3]. AC has become more important due to the development of recent technologies such as cloud computing [4], Internet of Things [5], and Fog Computing [6].
The process of how the AC mechanism permits or denies an access request depends on the implemented AC model. There are four traditional AC models: Discretionary Access Control (DAC), Mandatory Access Control (MAC), Role-based Access Control (RBAC), and Attribute-based Access Control (ABAC). The AC model, in addition to the evaluation process, has an AC policy that defines the set of rules and requirements by which the AC mechanism is regulated. When an access request is received, the AC mechanism interacts with the policy to determine if the subject has the right to access the requested object.
In addition to traditional AC models, we can find other AC models developed to improve the AC mechanism or address their limitations. For example, the RBAC and ABAC Combining Access Control (RACAC) model [7] adopts the strengths of both models. Approaches such as the Hierarchical Group and Attribute-Based Access Control (HGABAC) model [8] and Higher-order Attribute-Based Access Control (HoBAC) model [9] formally introduce the concept of hierarchy in ABAC. Ciphertext-Policy Attribute-Based Encryption (CP-ABE) [10] adds a layer of encryption to the data in the ABAC model. The Hierarchical, Extensible, Advanced, and Dynamic Access Control (HEAD) metamodel [11] is a proposal that confronts most of the challenges of recent technologies.
To address the present application problems and overcome the limitations of DAC, MAC, and RBAC models that make them less suitable for emerging large and dynamic application domains, the ABAC model was developed [12,13,14,15]. The ABAC model uses attributes to make access control decisions making it a flexible, scalable, and context-sensitive model. The attributes are the characteristics of an entity (subject, object, environment) in the AC mechanism. The ABAC policy is the set of authorization rules defined over these attributes. An ABAC rule specifies whether a subject can access a resource in a particular environment. When an access request is received, the ABAC model evaluates the subject (requester) attributes, the object attributes, and the environmental conditions with a set of rules (policy) overall attributes.
However, the main problem with implementing an ABAC model is the policy specification. The task of policy specification is typically performed by expert humans, which can make it a costly, time-consuming, subjective, complex, and error-prone process. Consequently, organizations prefer to keep their traditional models (MAC, DAC, and RBAC) in operation rather than be exposed to all the challenges of the migration and implementation process. Policy mining techniques can be used to automate the policy specification process and address these challenges.
Policy mining is a technique that automates the process of AC policy specification based on an existing AC state, such as Access Control Lists (ACLs), natural language, or access logs. Specifically, the access log contains information on all access requests that are either permitted or denied by the AC mechanism. By using the access log as input, a policy mining process can generate an AC policy as an output. In the context of the ABAC model, this process involves identifying a reduced set of AC rules that properly model the request records in the access log.
Several approaches have been developed for policy mining. Xu and Stoller [16] pioneered this field by creating rules from user-permission logs, progressively refining them for broader coverage. However, their algorithm experiences reduced performance with larger access logs. Iyer and Masoumzadeh [17] introduced an ABAC policy mining approach using the PRISM algorithm [18]. Despite its effectiveness in generating positive and negative rules, scalability becomes a challenge with larger access logs, leading to an excess of rules. Cotrini et al. [19] proposed the Rhapsody algorithm based on APRIORI-SD [20], featuring stages for rule generation, extraction, and length reduction. While introducing are liability metric, the exponential growth of rules in the presence of numerous attributes remains a limitation. Jabal et al. [21] presented an ABAC policy mining framework integrating data mining, statistics, and machine learning techniques. Despite its effectiveness, the approach faces challenges due to the substantial number of combinations required for policy extraction. Karimi et al. [22] contributed to the first machine learning-based approach involving phases such as parameter selection, clustering, rule extraction, and clean-up. Recent investigations [23,24,25] have chosen to detect clusters of access requests before the policy mining process, then the rule generation algorithms are applied to those clusters. Table 1 summarizes the challenges and techniques of the state-of-the-art ABAC policy mining approaches.
In summary, an AC mechanism is a complex and dynamic system in which a large number of entities (subjects, objects, environmental conditions, attributes, operations) interact with each other. A purely data-driven approach for policy mining is not sufficient to functionally capture the high complexity of the AC mechanism. To overcome these limitations, recent studies have turned to complex network theory, a powerful mathematical framework for analyzing and modeling complex systems. Specifically, an AC system network model is able to detect hidden patterns and implicit relationships between entities that may not be apparent in the original access log.
Briefly, a complex network is a network (graph) with a set of nodes (vertices) joined together in pairs by a set of links (edges). A network has the function of reducing a complex system to an abstract structure. It captures only the fundamental aspects of entities, which play as nodes, and their connection patterns, which play as links. This theory has been a powerful tool for scientists to model and analyze real-world systems from a wide range of fields such as sociology, neuroscience, biology, and technology [27,28]. Specifically, in security information research some investigations use complex networks analysis for anomaly detection in computer networks [29], vulnerability analysis [30], or modeling cyber-physical cybersecurity networks [31]. In the complex network theory, we can find several network properties such as scale-free degree distribution, community structure, density, and centrality that can help to extract hidden knowledge from the complex interactions system. With the above, we can discover a wide range of added information, e.g., how data flows on the Internet, who is the most important person in a terrorist group, the reliability of a power grid, or groups of people in social-media apps.
This paper presents a new proposal for ABAC policy mining based on complex networks. Our proposal uses the access log to generate an ABAC policy that best represents the access requests in the access log. The access log reflects the behavior of the system in a real environment; therefore, it can be used to model a complex network. A bipartite network is generated based on user-resource interactions. Then, a weighted projection to the bipartite network is performed to obtain a user network. A community detection algorithm is applied to the user network to group users and attributes based on the network topology. Each detected community is analyzed to extract the patterns that best represent the community. In this way, it is possible to generate policy rules according to user and resource attributes. In the end, an algorithm is applied to refine the mined ABAC policy and increase its quality. The main contributions of this work are the following:
- A new method based on complex-network theory for mining ABAC access control policies from access records.
- A bipartite network model to represent user-resource interactions (access requests) in an access control system.
- A rule extraction algorithm to extract patterns that best represent the users and the resources of the community.
- A network model of the mined rules for evaluating access requests.
The rest of the paper is organized as follows. Section 2 defines the ABAC policy mining problem, discusses the challenges and requirements, and presents the evaluation metrics in this problem. Section 3 presents our proposed ABAC policy mining approach. In Section 4 we describe the process of access decision in our policy based on the rule network Section 5 presents the performance of our approach on two datasets as well as detailed results in every phase of the proposed. Finally, Section 6 provides additional discussions and conclusions.
2. Fundamental Principles
2.1. ABAC Model
In the ABAC model, the authorization of a set of requests is determined by evaluating the attributes associated with a subject, an object, an operation, and the environmental conditions against a set of rules that describe the allowed operations for a given resource.
Attributes are characteristics that define specific aspects of the subject, object, and environment. These attributes can be set by the security administrator and by the dynamics of the system. A subject is an entity that requests access to an object. A subject can be a user, application, process, or service. The object is the entity to which the subjects access. The objects can be resources, files, devices, registries, processes, services, or programs. An operation is the execution of a function towards an object. Operations can read, write, execute, modify, delete, etc. A rule is the combination of attributes and operations that condition the access of a request. Rules are statements of the type "If, then" which can grant or deny resources, they can even have the function of overriding other rules. Each ABAC rule specifies whether a subject can access a resource in a particular environment. When an access request is received, the ABAC model evaluates the subject (requester) attributes, the object attributes, and the environmental conditions with a set of rules (policy). An example of rule is Ifclass=CP01andtype=taskandop=readthenpermit. In this approach, we use an adapted ABAC policy model definition from the work [22].
Definition 1
(ABAC Policy Model ). An ABAC policy model is composed of the following elements:
- refers to the set of users, resources, sessions, and operations respectively in the system. is the set of all system entities.
- refers to the set of user attributes, resource attributes, and session attributes, respectively. is the set of all system attributes. Given an attribute , the attribute range is the set of all valid values for attribute a in the system.
- function returns the value of attribute for entity .
- An attribute filter is a set of tuples defined as .
- An access request is a tuple where a user initiates an operation request to the resource in the session and d is the access decision made by the access control system.
- An Access decision d has two possible values: permit or deny. If , the user u can access to the resource r performing an operation in session s. In contrast, if the user u cannot access to resource r..
-
The access log is the union of positive access log and negative access log defined as:An access request from positive (negative) access log () is called a positive access request (negative access request).
- A rule is a tuple , where is an attribute filter, is an operation and d an access decision.
- A rule satisfies an access requests iff
- An ABAC policy is a tuple , where E is the set of entities, the set of operations, A is the set of attributes, is the attribute function and is the set of rules.
-
The decision of policy for an access request q denoted as is permit iff:otherwise, the decision is deny.
Policy mining algorithms help to migrate traditional AC models to the ABAC model automatically. The following ABAC policy mining problem defined below is an adaptation of [22]:
Problem 1
(ABAC Policy Mining Problem). Given an access log , the ABAC policy mining problem is to find a set of rules that achieves high quality with respect to , ensuring that clearly defines the entities, attributes, operations, and access decisions in the AC mechanism.
We refer to the original policy as the access control policy that gave rise to the access log . In contrast, we refer to the mined policy as the set of rules that was automatically inferred from . In this context, the ABAC policy mining problem aims for the mined policy to approximate or replicate the access decisions made by the original policy.
2.2. Challenges and Requirements
The following challenges associated with the ABAC policy mining problem from can be highlighted:
- Accuracy: The extracted rules must be consistent with the access log of the original policy. In inconsistent situations, rules are more permissive or more restrictive than the original policy.
- Complexity: Policies are managed by humans; therefore, rules need to be easy to interpret, manage, and audit.
- Imbalanced access log: There is an imbalance between permitted and denied access requests, the former being the majority class. Denied access requests occur less frequently because they are mainly user errors.
- Sparse access log: In most cases, the access log does not represent the complete behavior of the system. Therefore, it is necessary that an access log with few records can extract a useful policy for the entire access control system.
- Noisy access log: It is possible to find access requests that are erroneous or present some inconsistency. This happens when there is a misconfiguration in the system, some of them due to updates made by the administrators. Noisy access requests can affect the quality of the mined policy, making it more permissive or more restrictive than it originally was.
- Private access log: The data information in access control systems is sensitive, therefore, it is difficult to obtain an access log due to the security that this implies for the company.
- Negative rules: Both positive and negative rules can exist in access control policies. Negative rules are used to establish exceptions to what is permitted by positive rules. Therefore, generating this type of rule can help improve the quality of the mined policy.
- What is not permitted, is it denied?: In the access-log we can discover what it is explicitly permitted or denied. What was not considered by the mined policy is really denied from the original policy. The same goes for What is not denied, is it permitted?.
2.3. Policy Mining Algorithms
Although there exist different approaches for the policy mining there are common processes shared among them. The general methodology is composed of three phases: 1) data preprocessing, 2) rule mining, and 3) policy refinement. During the first phase, data cleaning and data preprocessing tasks are conducted, for example, handling of missing values and the conversion of numerical values into categorical ones. In the second phase, candidate ABAC rules are generated based on the attribute-value tuples frequency. Additionally, rules are modified to generalize them, meaning to cover a broader set of attribute-value tuples, or to make them more specific. In the last phase, the complete policy generated in the previous phase is evaluated to measure its quality. An accurate and comprehensible policy is a high-quality policy. Generating new rules, merging candidate rules, or simplifying candidate rules can help to improve the policy quality.
There are some variations in the policy mining approaches. For instance, Iyer and Masoumzadeh [17], Davari et al. [23], and Quan et al. [24] proposals permit the generation of both positive and negative rules. Karimi et al. [22], Davari et al. [23], Quan et al. [24] and, Shang et al. [25] works employ an algorithm to detect clusters in their access logs previous rule mining process.
2.4. Evaluation Metrics
To evaluate the performance of our approach we compare the access decision made by the mined policy with the original policy. It is a classification problem where the two classes are permitted and denied. If an access request is permitted in the original policy, the same access request must be permitted by the mined policy, we called this true positive (TP). If an access request is permitted by the original policy but not in the mined policy, it is known as false negative (FN). If an access request is denied by the original policy and the mined policy, then it is a true negative (TN). If an access request is denied by the original policy and permitted by the mined policy, we call this false positive (FP).
We use F-score to measure the accuracy of our proposal. It is the harmonic mean of precision (exactness) and recall (completeness The precision measures how many of the permitted requests are correct, while recall measures how many of the correct requests are permitted. The F-score, precision, and recall are calculated as follows
We seek that the mined policies to be easy to interpret, manage, and audit by human operators. The Weighted Structural Complexity (WSC) is a generalization of policy size. It was introduced for RBAC policies [26] and then adapted for ABAC policies [16]. WSC is the sum of the attribute-value expressions used to describe the extracted rules. It is calculated by the formula
Where is the ABAC rule set, is an ABAC rule, and is the attribute filter of the ABAC rule. Our objective is to generate policies with a high F-score, which are more equivalent to the original policies, and with a low WSC, which are easier to manage.
3. Policy Mining Proposed Approach
The conceptual methodology of our proposed ABAC policy mining is shown in Figure 1. Our approach is divided into five phases: 1) data preprocessing, 2) network model, 3) community detection, 4) rule extraction, and 5) rule refinement. The input of the methodology is an access log and the output is a set of rules .
3.1. Data Pre-Processing
In this phase, we convert raw data into a cleaner form, so that, in the next phases of the methodology, it provides more useful information. The input of the phase is the access log and the output is the new clean access log . We execute four tasks in this phase: 1) handling missing and null values, 2) converting continuous values to categorical values, 3) removing duplicated access requests, and 4) selecting the most used resources
In the access log, we can find access requests with an error, present some inconsistency, or are incomplete, because there is a misconfiguration in the system, or a modification is made by the administrators. This noisy access request and null values can affect the quality of the mined policy. For each attribute in A with a missing or null value, we introduce a unique placeholder value. For example, if there is a null value in a user attribute u.class and a missing value in a resource attribute r.type, we create two new values UNK1 and UKN2, respectively.
In the second task, we convert continuous values to categorical values. Some attributes have continuous values, for instance, the size of a resource r.size, in this case, there are an infinite number of values. To address such an issue, we map the continuous values into categories. In the example above, we can generate groups based on ranges of values.
Our bipartite network model consists of positive unique access requests; therefore, we remove all duplicated access requests, i.e., the same user accessing the same resource. In the last task, we calculate the access frequency of each resource in the access log. There are many resources with few access requests. In other words, just a small number of resources could help to extract more information to build a bipartite network model. We remove all resources under a specified number of access requests threshold .
3.2. Network Model
The objective of this phase is to build a network model from access log data. The input of the phase is the positive access log and the output is a complex network that models access interactions of users and resources in the AC mechanism. In this phase we execute three tasks: 1) bipartite network construction, 2) user network construction, and 3) user network analysis.
3.2.1. Access Request Bipartite Network
The first task is to identify both the entities that will function as the nodes of the network, as well as the relationship between entities that will represent the links. The basic function of the access control mechanism is to decide whether to grant or reject an access request made by a user toward a resource. Therefore, we identify two disjoint sets of nodes: users and resources. A link exists between a user node and a resource node if a user makes an access request toward a resource. A user cannot make an access request toward another user and a resource cannot make an access request toward another resource, for that reason, the bipartite network definition condition holds. We define the access request bipartite network formally as follows:
Definition 2
(Access Request Bipartite Network (ARBN)). The access request bipartite network is triplet where:
- is the set of nodes that represent users U.
- is the set of nodes that represent resources R.
- is the set of links that exists between a user node towards a resource node if .
3.2.2. User Network
Bipartite network projection is a method to get two one-mode networks, in our case: a user network (a network with only user nodes) and a resource network (a network with only resource nodes). The one-mode networks are less informative than the bipartite network, but it is possible to apply a weighted projection to minimize the information loss. Our proposed approach only uses the user network. Two user nodes are joined by a link if both users have an access request to the same resource. The weight of the link is equal to the product of the importance of the common resource of each user node. The importance is determined based on the total number of resources each user accesses. We define the user network formally as follows:
Definition 3
(User Network (UN)). Let be an access request bipartite network. The projection generates a user network where:
- is the set of nodes that represent users U.
-
is the set of links that exists between two user nodes if they have at least one common neighbor in of the network . The weight of a link is given bywhere is the neighborhood of the node u, i.e. the set of nodes that are linked to node u. is the degree of the node u, i.e. the number of nodes linked to node u.
We analyze the generated user network to evaluate its properties and conclude if we can use it as a complex network. We use complex network definition from [34]:
Definition 4
(Complex Network). A Complex Network is a network consisting of a non-empty set of nodes V and a set of links E. Furthermore, it complies with the following properties:
- , commonly in the order of thousands or millions.
- Low average degree .
- Low density .
- Scale-free distribution .
- Low average path length .
- High average cluster coefficient .
3.3. Community Detection
The main objective of this phase is to group the user nodes in communities or subnetworks. When we identify communities, the nodes within a community may share common properties or play similar roles in the complex network [35]. A community is a group of nodes where there are a large number of links between nodes within the same community and with the rest of the nodes in other communities. From the communities, it is feasible to extract user characteristics or properties that can help the generation of ABAC policy rules.
The input data of this phase is the user network obtained in the previous phase. The output data will be a node partition . In the current phase, two tasks are executed: 1) community detection and 2) community classification.
In the first task, a node partition is obtained by a community detection algorithm and then they are classified into three groups based on the number of resources accessed by each community.
3.3.1. Community Detection
We use the Louvain algorithm [36], which is based on optimizing the modularity quality function. Modularity is one of the most popular quality functions for measuring the quality in obtained community partition [37]. It compares the link density of each community with the density that could be obtained from the same community, but from a random network, where is not to get a community structure [35]. By definition, , a value close to unity indicates a better partition. The definition of modularity is:
where m is the number of links in the network, A is the adjacency matrix. The term represents the expected number of links given the degree of the two nodes and the total number of links in the network. The function returns one if the nodes i and j belong to the same community, it returns zero in the other case.
Louvain’s algorithm to detect communities iteratively executes two phases. First, each node is a new community. Next, each node joins the community of one of its neighbors which provides a higher modularity value. The above is repeated for all nodes until the modularity value does not improve with new node joins. In the second phase, all the nodes of a community are grouped, and a new network is built where the nodes are the communities of the previous phase. The time complexity of the Louvain algorithm is , where n is the number of nodes in the network. The algorithm is non-deterministic and belongs to the group of agglomerative hierarchical algorithms.
In our approach, the goal of detecting communities is to group users who have similar interactions in the access control system. We have a good community if all users have access to the same resources. At the end of the algorithm, we will get the user communities defined as follows:
Definition 5
(User Communities). Let be a user network. A community is a sub-network of the user network , where and . The user communities of the user network is:
In the community partition , we can find sparse communities, i.e., networks with a low density. Our objective is to obtain dense communities, for this reason, we apply the Louvain algorithm to those sparse communities to get dense sub-communities. In the end, we expect that all communities and sub-communities have a density value close to a unit, in other words, the groups of users detected are densely connected.
3.3.2. Community Classification
We classify communities based on the number of resources accessed by each community. There are three types of communities: F-type: focused, M-type: Medium, and S-type: Sparse. Regardless of the size of the community, focused communities access few resources, typically one or two. Sparse communities, on the other hand, have access to a large number of resources, greater than a threshold . Medium communities access between three and less than .
Each detected community is evaluated based on the number of resources accessed . To begin, we find the maximum number of resources accessed by any community, denoted as . Two thresholds and are set at and , respectively. S-type communities have greater resources than . M-type communities have resources between and , and F-type communities have resources below .
3.4. Policy Rules Extraction
In this phase, we analyze the communities, and we generate ABAC policy rules. Then, a rule network is generated. The input data are the classified user communities, obtained from the previous phase. The output is a network of ABAC policy rules.
According to the definition 1, a rule is a tuple . In our proposal, rules are limited to having only the attribute filter , and the decision value d. Additionally, we add the unique identifier of the communities from which the rules were inferred. The identifier will help the access decision in the AC. An example of a rule generated in our proposal is shown below:
3.4.1. Rule Inference
There are three ways to extract rules from communities, depending on the type of community. The algorithm 1 outlines the process of inferring rules. The input to the algorithm is the community classification , and the output is the set of rules .
| Algorithm 1 Rule inference algorithm. |
|
F-type communities. The first step is to extract the resource set that is accessed by all users in the community. If there is more than one resource (), all attribute-value pairs in common, among all resources in , are taken to add to the rule. If there is only one resource that all users in the community access, then all the attribute-value tuples that identify the resource are taken to generate the rule. The next step is to get the attribute-value tuples of the users. The tuples with the highest frequency in the community are obtained.
M-type communities. A less frequent resource pruning process is used (algorithm 1, line 7). In M-type communities it is possible to identify less frequent resources which are accessed by a small number of users compared to the rest of the resources. The information that less frequent resources can offer us does not have any meaningful impact on the generation of rules, on the contrary, it could add noise to the rule. Less frequent resources do not describe or reflect user access in a community.
To prune less frequent resources, it is necessary to set a threshold based on the number of users accessing a resource . The threshold value can vary, but it is recommended that it be or up to for all users. For example, if there are 20 users in community C, and a threshold of is established, that is, . In this example, the resources that are accessed by 2 users or less are considered less frequent resources, therefore, they are removed from the total of resources in the community. Once the resource pruning is executed, the same process applied than F-type communities.
S-type communities. This type of communities are characterized by having a large number of users and resources. As there are more resources in the community, it is more difficult to generate rules that characterize the community. It is possible to identify a small set of resources that are accessed by the most users in the community. The set of most frequent resources called significant resources, is useful to characterize the entire community of users.
As in the M-type communities, filtering of less frequent resources is carried out. Subsequently, the F-type community approach is applied with a slight modification. Rules are generated with the set of significant resources, the common attribute-value tuples are taken from the set, and the rule is completed with the users of the community. Then, with the less significant resources not eliminated, rules are generated with the F-type community approach. S-type communities tend to generate more rules than the rest of the communities
3.4.2. Rule Network Modeling
The construction of the rule network takes as nodes the rules of the set . A link joins two nodes if the Jaccard index is above a given threshold as it given in Definition 6. The threshold is determined to ensure a low density. Having a densely connected rule network is not beneficial because it would result in all rules being connected, which is not desirable during evaluation. The goal is to preserve the distinctiveness of individual rules.
Definition 6
(Rule Network). The rule network is a tuple , where:
- is the set of nodes that represent rules .
- is the set of links that exists between a node towards a node if the Jaccard index is above a given threshold .
where
3.5. Policy Refinement
The objective of policy refinement is to improve the quality of the mined policy in the previous phase by tackling false negatives and false positives. We create new rules to overcome false negatives and negative rules for false positives. Negative rules restrict access to requests that match their attribute-value tuples. They have the opposite functionality of the rules generated. Since they are specific rules, they tend to contain many attribute-value tuples.
The input of policy refinement is the set of false negatives (FN), false positives (FP), and rule network . At the end, the output is an augmented set of rules and an updated rule network. The phase is composed of three tasks: 1) FN-refinement, 2) FP-refinement, and 3) rule network update.
FN-refinement. The set of FNs is those access requests that are allowed by the original policy but not by the mined policy. The rule inference process is applied but as the input the access requests in the FN set. At the end of the process, a set of rules based on the FN requests will be obtained.
FP-refinement. For FPs, it is not possible to apply the complete rule inference approach since there are no relationships between users and resources in the access requests. Refinement in FP tracks the rules that produce the requests in FP and, from these rules, generates negative rules. Value attribute tuples of requests in FP are added to the positive rule generated by FP to generate a specific negative rule.
Rule network update. Once the rules are generated in the two previous stages, the rule network is updated by adding the new rules obtained in the FN-refinement. In the same way, Jaccard similarity index is used to create new links between the existing and new nodes. For the resolution of the requests, the community identifier obtained in the rule inference phase is considered.
4. Access Decision
In the traditional ABAC, the Policy Decision Point (PDP) computes access decisions by evaluating the ABAC policy. In our approach, we add a new stage in the PDP that computes a smaller subset of rules to compare. The main advantage of our proposal is that we reduce the number of rules to evaluate. Figure 2 shows our proposal to add in the PDP the stage Rule Selection by ID (RS) which uses the topological structure of the rule network to decide the subset of rules to evaluate for a specific access request. With this, we optimize the access decision process specifically for complex and big policies.
The flow chart of the RS stage is shown in Figure 3. First, we need to know if a user node from the access request exists in the user network. If it does not exist, we add it as a neighbor of all nodes that access the same resource. With this, we simulate the topological position of the new user node in the projection operation. The weight of the new links will be equal to 1. The algorithm 2 shows the process. Lines 3-6 get all nodes that access the same resource from the access request. In line 8 we add the user node in the network and, in the last for loop, we add all links from the new user node to each node with the same resource. The next process is to assign the new user to the community with a higher modularity value. The assignCommunity function (algorithm 3) gets all communities from all neighbors of the user node. Then the user node removes and moves into the community of each neighbor and calculates the modularity value. The user node is placed into the community with the greatest modularity value. At this point, the user node belongs to a community, and all rules have the ID of the communities from which they were generated. Thus, we can get all rules by ID user node community. getRulesbyID function returns all rules with the ID user node community and getNRules function returns the rule node neighbors of each rule with the ID user node community. All the rules of both functions are used for evaluating the request and computing an access decision.
| Algorithm 2 Add a new user node to the user network. |
|
| Algorithm 3 Add a new user node to the best community. |
|
5. Results
5.1. Datasets
To evaluate the performance of our proposed methodology, there are two types of access logs (datasets): synthetic/manual and real-world. The synthetic access logs are manually written or randomly generated by an algorithm. It is possible to set parameters such as the number of rules, attributes, users, and resources which is advantageous for testing purposes. The real-world access logs are extracted from access control systems implemented by an organization. The availability of real datasets is limited due to the security risk and data sensitivity. In our experiments, we use three datasets:
Healthcare (HC). This dataset has access control records of a health center staff. Users are nurses, doctors, and patients. The resources are electronic health and history files. It is a synthetic dataset and is adapted from [16]. There are 1,000 users and 2,000 resources. The size of the access log is equal to 18,000 access requests: 9,000 requests positive and negative.
Amazon Kaggle (AMZ). This dataset has access control records of Amazon’s employees. It is a real-world dataset where the users and resources are replaced by numerical values to maintain the organization’s privacy. The dataset contains more than 12,000 users, 7,000 resources, and 32,000 access requests of which 30,000 are positive access requests and 2,000 are negative access requests. This dataset is from a Kaggle competition [38].
Smart Building IoT (IoT). This is a synthetic dataset to create interactions between individuals and IoT devices in a smart building. First, we developed the policy rules. Then, we established attributes and values for users and resources. To generate the access log, we relied on the participation distribution of both users and resources in the real-world dataset from Amazon. Our dataset contains 120 users, 990 resources, and 49,925 access requests, where approximately the same number of positive and negative accesses occur.
Table 2 shows the details of the datasets. is the number of attributes, is the number of unique values that the A attributes can take in the log, shows the number of access requests in the dataset, shows positive access requests, and shows negative access requests by policy.
5.2. Experimental Setup
We use a computer with PopOs Linux 5.16, 3.3 GHz Intel Core i5-2500, 8GB of RAM, and a GTX 780 graphic card. The implementation is done in Python 3.7. We use the NetworkX library to build the network models and the igraph library for network analysis. To validate the results of our experiments, we use K-fold Cross-Validation [39] with , train data, and test data.
5.3. General Results
Table 3 shows the results obtained after the first three phases of both datasets. After the data pre-processing phase, we get 2,437 access requests with 621 users and 211 resources from the HC dataset. With the AMZ dataset, we get 9,504 access requests with 5,436 users and 150 resources. In the IoT dataset, we get 49,925 access requests with 120 users and 990 resources. In the second phase, the network model, we generate a user network with 621 nodes and 14,923 links from the HC dataset. With AMZ dataset we generate a user network with 5,436 nodes and 743,311 links. From IoT dataset, we generate a user network with 120 nodes and 2,095 links. In the community detection phase, we get a modularity value of 0.48, 0.65, and 0,72 for HC, AMZ, and IoT datasets respectively.
Table 4 shows the results of the quality and complexity of the policies generated after the rule inference and policy refinement phase. The results show how the F-score improves after the refinement phase in all datasets.
Table 5 shows a comparative analysis of the policy quality and complexity results using Cotrini et al. [19], Jabal et al. [21] and Karimi et al. [22] approaches. We only compare the HC and AMZ datasets because no previous work is evaluated with the IoT dataset. The results conclude that our approach generates policies with high quality but are more complex than the state-of-the-art approaches.
5.4. Detailed Results
5.4.1. HC
Analyzing the HC dataset, the size of positive access requests is equal to and negative access requests equal to . It contains five user attributes and six user attributes. Applying task one, we get ten new elements, at least we add one element for each attribute. Task two does not apply to the dataset as there are no continuous values in the values. Then, in task three, the positive access request is reduced to with users and resources. Figure 4a shows the distribution of access requests. It is observed that there is a small number of resources that have a high number of access requests. On the other hand, there is a large number of resources that have few access requests. For the experiment, all those resources that are accessed with a number of requests greater than six are used. The dotted line shows the resources with more requests, which is equal to the of all resources. Each request that accesses the 211 resources is accepted i.e., positive requests with 621 users and 211 resources
In the network model phase, the ARBN where , and generate the UN where and . Table 6 shows the complex network properties of the UN and Figure 5a its degree distribution. According to the topological properties, the UN is a complex network.
In the third phase, community detection, the Louvain algorithm detects 13 communities with modularity value equal to . When applying sub-community detection, an average of 42 communities are generated. Then, the 42 communities are classified into three groups. The community with the largest number of resources is 94 of the 211 resources. Taking the previous community as , the threshold to determine S-type-type communities is that they have access to more than 47 () resources, and the threshold to determine M-type communities is that they have access to more of 23 () resources but less than 48 and the threshold to determine F-type communities is that they have access to less than 23 resources. On average, two S-type, 12 M-type, and 28 F-type communities are generated.
Once the communities are classified the rule inference algorithm is applied to each community. It generates 42 rules, one per community. The threshold is set to 0.2 and the threshold is 0.5. With the rules, it generates a rule network where and with a threshold . At this point, the generated policy has a value equal to and a complexity .
Finally, in the policy refinement phase, the augmented rule network where and . Figure 6 shows the rule network after the refinement phase. It is possible to identify the community where the rules were generated and in which phase of the methodology they were generated. The F-score of the generated policy is equal to , FN decreases as well as FP. The former is because of applying our approach again in FN and the latter is a result of the generation of negative rules. The complexity of the generated policy es equal to 389.
5.4.2. AMZ
This dataset has positive access requests and negative access requests. It contains only eight user attributes. It does not have null values or continuous values. Thus, task one and two of the data preprocessing phase does not apply. In task three, duplicate access requests are eliminated, and positive access requests are reduced to . Figure 4b shows the distribution of access requests. At final of the first phase, the AMZ dataset has positive access requests, users, and 150 resources.
The AMZ ARBN network where , and generate the UN where and . According to the topological properties shown in Table 7, the UN is a complex network.
In the community detection phase, the first execution of the Louvain algorithm detects 16 communities with a modularity value equal to . Then, the second execution generates an average of 82 communities. The threshold to determine S-type communities is that they have access to more than 51 () resources, the threshold to determine M-type communities is that they have access to more of 25 () resources but less than 51, and the threshold to determine F-type communities is that they have access to less than 25 resources. On average, seven S-type, eight M-type, and 67 F-type communities are generated.
The fourth phase, rule inference extraction, extracts 82 rules, one per community. Like the CS dataset, the same values are used for the thresholds: and . The generated rule network where and with a threshold . At this point, the generated policy has a F-score value equal to and a complexity .
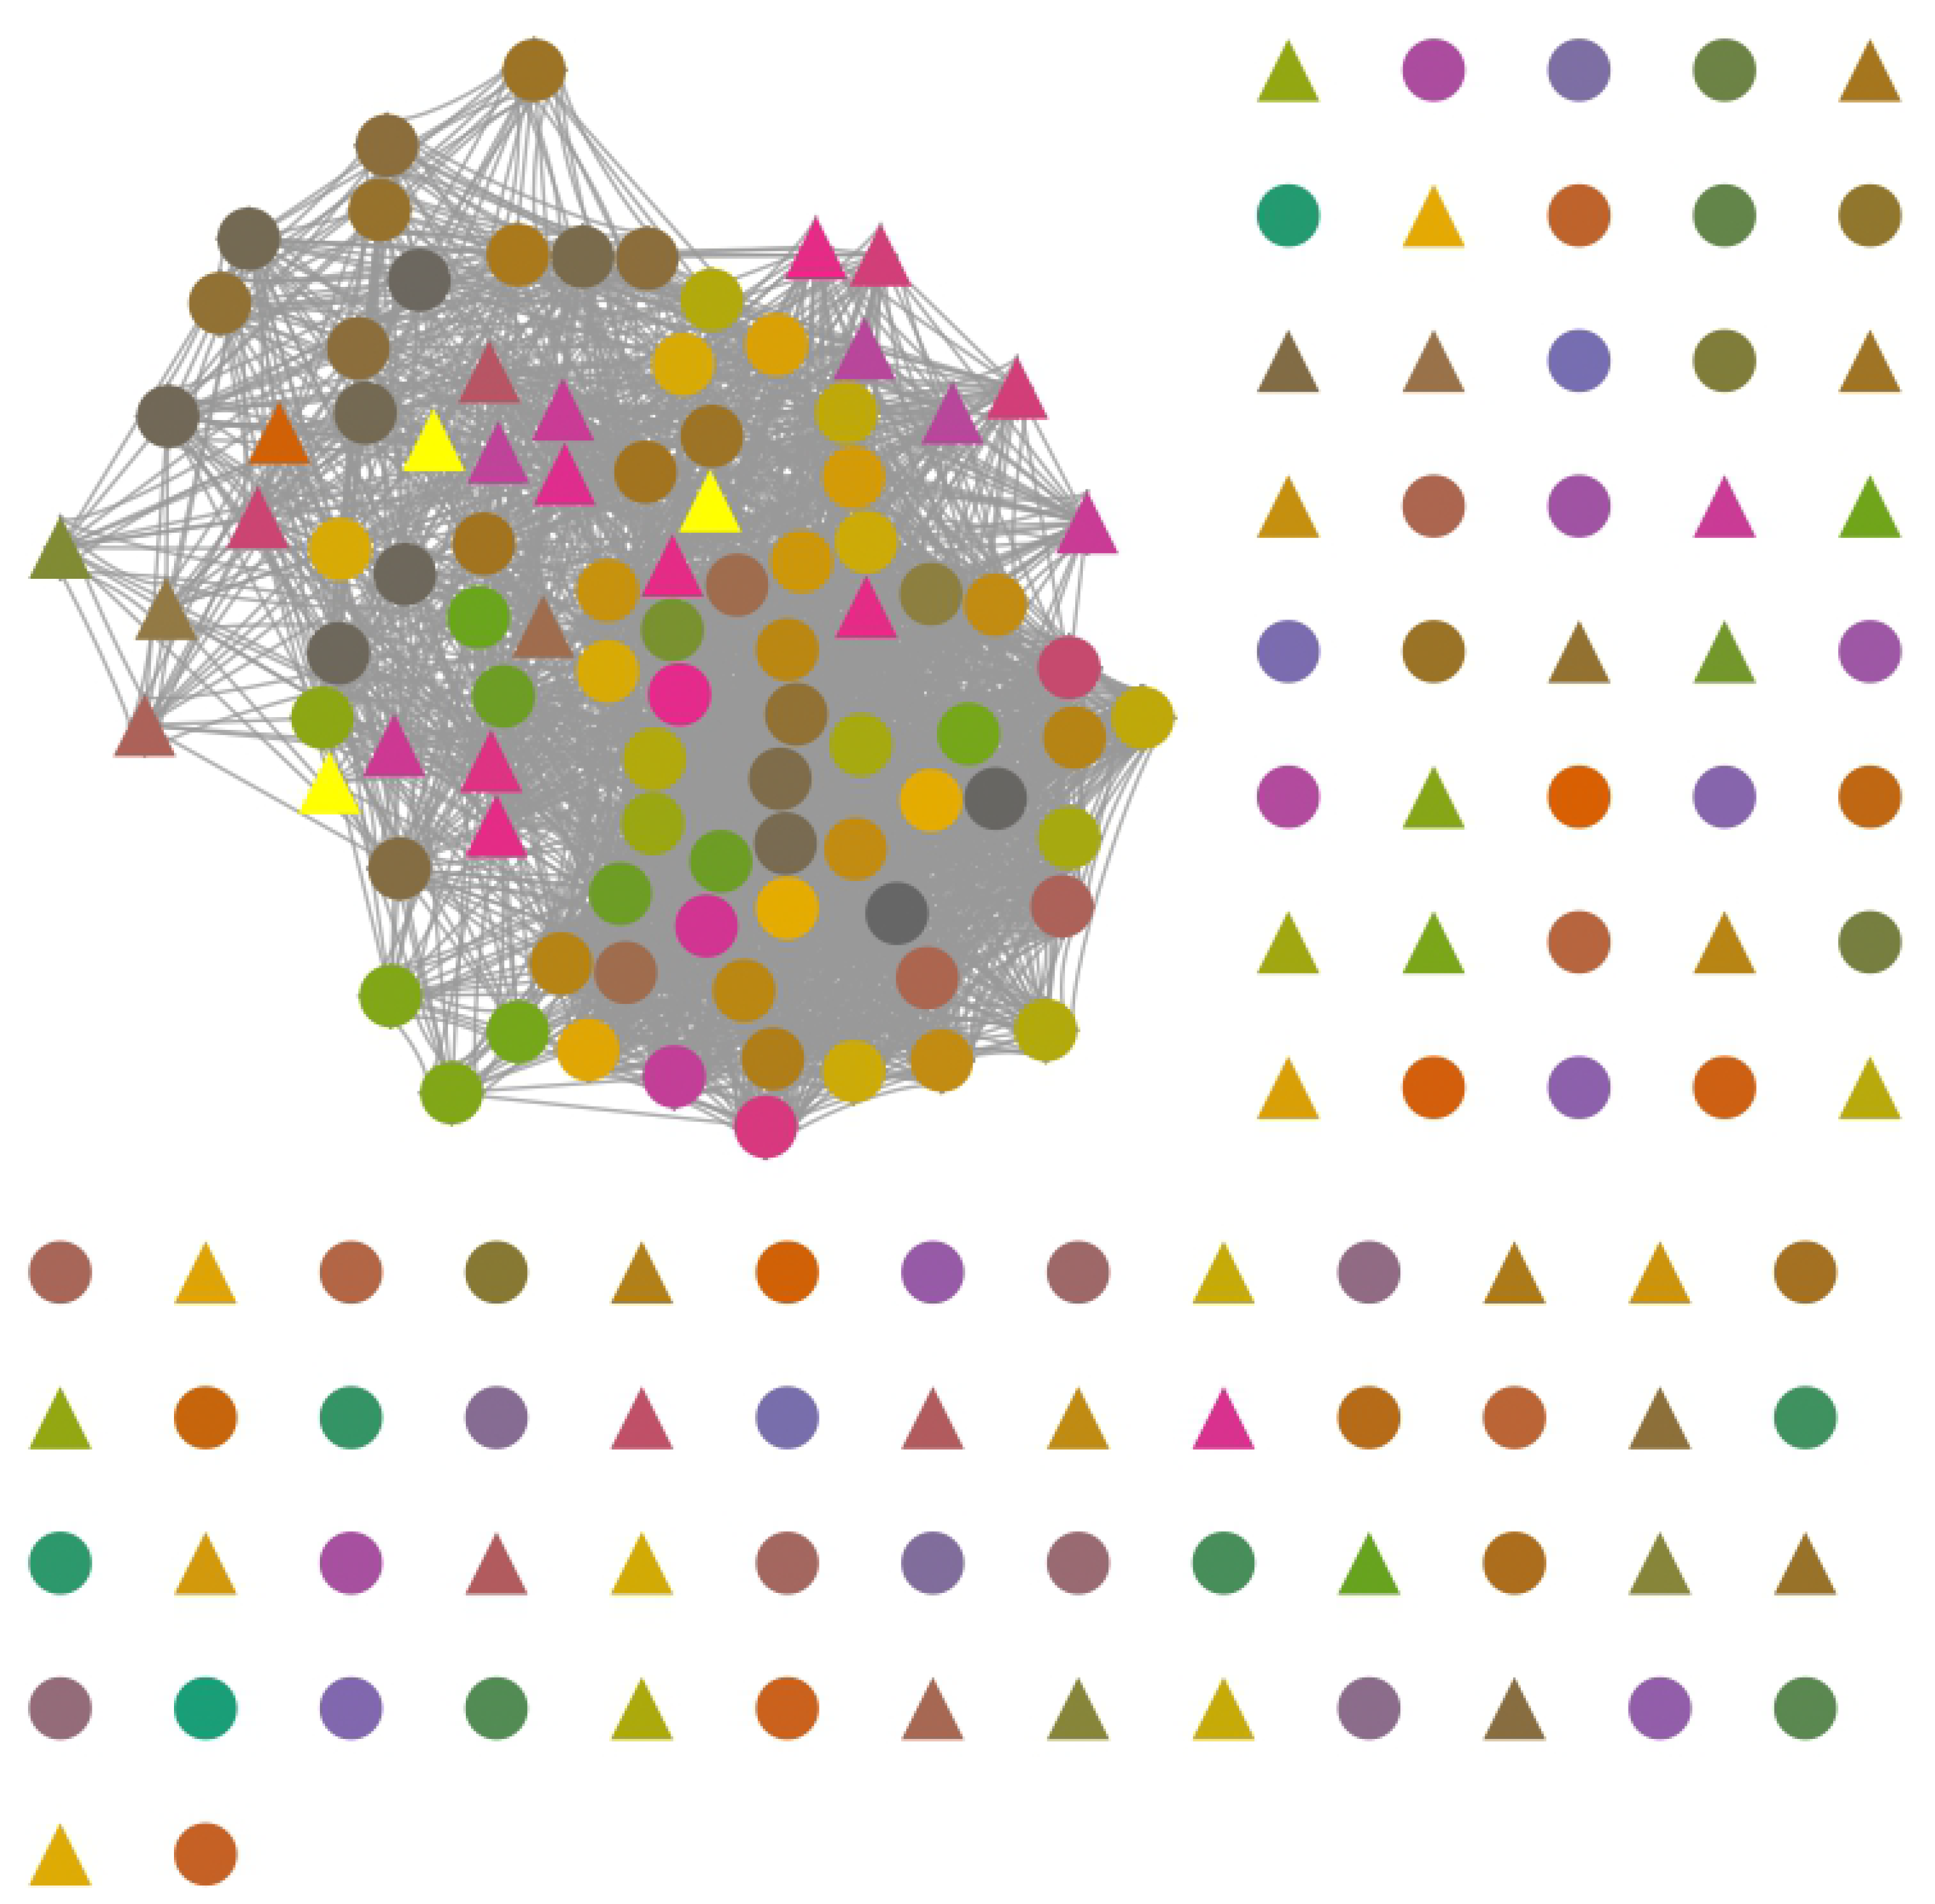
In the last phase, the augmented rule network where and . Figure 6 shows the rule network after the refinement phase. We can see a large number of isolated nodes, about of all nodes. This type of node describes a small set of access requests that have particular attribute-value tuples, for this reason, it is not possible to reach the threshold of similarity to add a link with other rules. The of the generated policy is equal to and its complexity .
Figure 7.
Mined AMZ ABAC policy rule network . , . The color of the nodes indicates the community where they were generated. The shape of the vertex represents the phase where they were generated. A circular shape means that the rule was generated at the policy rules extraction phase and a triangular shape at the policy refinement phase.
5.4.3. IoT
In the preprocessing phase, the first three tasks—handling missing/null values, converting continuous values, and removing duplicate requests—are skipped due to the absence of such cases in the dataset. However, a selection of the most frequently accessed resources are still selected. Figure 4c shows the distribution of the frequency of accesses to each resource. From a total of 990 resources, 400 more frequent resources are obtained. In the end, we got 120 users and 400 resources with about of requests.
In the network model phase, we generate a IoT ARBN where , and . Then, we generate the UN where and . According to the topological properties shown in Table 8, the UN is a complex network.
In the third phase, community detection, the first execution of the Louvain algorithm detects 11 communities with a modularity value equal to 0.75. Then, the second execution generates an average of 49 communities. The threshold to determine S-type communities is that 200 () resources, M-type communities access to lower than 200 resources and greater than 100 (). F-type communities have access to less than 100 resources. On average, eleven S-type, five M-type, and five type F communities are generated
The fourth phase, rule inference, extracts 49 rules. The thresholds values used are and . The generated rule network where and with a threshold . At this point, the mined policy has a F-score value equal to and a complexity .
Finally, in the policy refinement phase, the augmented rule network where and . Figure 8 shows the rule network after the refinement phase. The F-score of the mined policy is equal to . The complexity of the generated policy es equal to 461.
5.5. Computational Efficiency
Table 9 summarizes the time complexity of each phase and task in our approach. The first phase of our proposal includes four tasks: handling missing/null values, converting continuous values, removing duplicates, and selecting frequently accessed resources. The first two tasks have a time complexity of while the last two run in . The time complexity of the first phase is dominated by . In the second phase, the bipartite network task has a time complexity of and user network task .
Note that in all datasets thus the network model phase is determined by . The community detection phase has a time complexity obtained by the Louvain algorithm . In the fourth phase, the rule inference task has a time complexity where the is the resources in the community c. The time complexity of the rule network is equal to thus the time complexity of the rule mining phase is dominated by the rule inference task, i.e., . Finally, the policy refinement phase is determined by the number of false negatives or false positives. Policy rules extraction phase dominates the total complexity of our proposal.
6. Conclusions and Discussions
In this work, a novel approach for ABAC policy mining based on the analysis of complex networks was proposed. Each phase of the proposal is described, and experimental results are presented. Our work receives as input an access control log which contains the records of access requests, both permitted and denied. The output is the ABAC access control policy, modeled as a network, which contains the rules and their relationships that will be evaluated to determine whether an access request is permitted or denied.
In general, the access log is modeled as a bipartite network with two types of nodes: users and resources. A user node would join a resource node if the user made an access request towards it. With the bipartite network, a weighted projection is performed and generates a user network. The weighted projection is based on the number of resources that two users share. The user network models the relationships present in the data of groups of users sharing resources. The Louvain community detection algorithm is applied to the user network to group users with common characteristics. The detected communities are classified into three groups according to the number of resources accessed by the community users. For each community, an algorithm for rule inference is applied based on the frequency of the attribute-value tuples of users and resources. Depending on the type of community, the algorithm applies some additional steps. Then, a rule network is modeled with the set of rules. In the end, to improve the quality of the policy, the methodology is reapplied to those positive access requests that do not have a rule that covers them. For negative access requests, negative rules are created to prevent access. Thus, the refinement process generates an augmented rule network to improve the accuracy of the evaluation scheme.
Network modeling and complex network analysis are widely used in each phase of the proposal. The present work demonstrates that it is possible to model a complex network from access logs with access request records and to use community detection algorithms, particularly multilevel clustering techniques for rule inference and generation of access control policies.
The topological properties of the modeled network were used to detect those nodes having common attributes or play similar roles within the network. The results obtained show that applying community detection algorithms to group records can be an alternative to conventional machine learning data clustering techniques.
We applied a rule inference algorithm to the detected communities in the user network. Depending on the type of community, additional processes are applied. The type of a community is determined by the number of resources commonly accessed by all its members. Each type guides the inference process differently, allowing the method to tailor rule generation to the characteristics of the community members. In addition, we generate a rule network with the generated set of rules. The rule network helped in the resolution of the new access requests.
Our network analysis-based approach generates ABAC policies with high accuracy, that is, they replicate with high similarity the access control policy that originated the access log. The set of extracted rules is modeled as a network, the policy obtained is not a list of rules but a structure of rules which helps the process of rule evaluation. This constitutes a novel approach to modeling access control rules not previously reported in the literature.
Our approach generates policies with a greater number of rules this causes the complexity of the mined policy to be high. But it is possible to measure the complexity in a different way by considering the structure of the rule network. We plan to work on this aspect in future work.
Author Contributions
These authors contributed equally to this work. All authors have read and agreed to the published version of the manuscript.
Funding
This research was funded by SECIHTI grant number 1074880.
Institutional Review Board Statement
Not applicable.
Informed Consent Statement
Not applicable.
Data Availability Statement
The Healthcare (HC) data presented in this study are openly available in author repository at https://doi.org/10.1007/978-3-662-43936-4_18, reference number [38]. The Amazon (AMZ) dataset can be found here: https://www.kaggle.com/datasets/lucamassaron/amazon-employee-access-challenge. Smart Building IoT (IoT) data presented in this study are openly available in Github at https,
Conflicts of Interest
The authors declare no conflict of interest.
References
- Krit, S.d.; Haimoud, E. Review on the IT security: Attack and defense. In Proceedings of the 2016 International Conference on Engineering & MIS (ICEMIS 2016). Agadir, Morocco, 22–24 September 2016; pp. 1–12.
- Cost of a Data Breach 2024. Available online: https://www.ibm.com/downloads/cas/E3G5JMBP (accessed on 20 January 2025).
- Sandhu, R.; Samarati, P. Access control: principle and practice. IEEE Commun Mag 1994, 32, 40–48. [Google Scholar] [CrossRef]
- Qiu, J.; Tian, Z.; Du, C.; Zuo, Q.; Su, S.; Fang, B. A Survey on Access Control in the Age of Internet of Things. IEEE Internet Things J 2020, 7, 4682–4696. [Google Scholar] [CrossRef]
- Ravidas, S.; Lekidis, A.; Paci, F.; Zannone, N. Access control in Internet-of-Things: A survey. J Netw Comput Appl 2019, 144, 79–101. [Google Scholar] [CrossRef]
- Zhang, P.; Liu, J.; Yu, F.; Sookhak, M.; Au, M.; Luo, X. A survey on access control in fog computing. IEEE Commun Mag 2018, 56, 144–149. [Google Scholar] [CrossRef]
- Long S.; Yan L. RACAC: An Approach toward RBAC and ABAC Combining Access Control. In 2019 IEEE 5th International Conference on Computer and Communications (ICCC 2019). Chengdu, China, 6–9 December 2019; pp. 1609-1616.
- Servos, D.; Osborn, S. HGABAC: Towards a formal model of hierarchical attribute-based access control. In Foundations and Practice of Security: 7th International Symposium (FPS 2014). Montreal, QC, Canada, 3–5 November 2014; pp. 187-204.
- Aliane, L.; Adda, M. HoBAC: Toward a higher-order attribute-based access control model. Procedia Comput. Sci 2019, 155, 303–310. [Google Scholar] [CrossRef]
- Bethencourt, J.; Sahai, A.; Waters, B. Ciphertext-policy attribute-based encryption. In 2007 IEEE symposium on security and privacy (SP ’07). Oakland, California, USA, 20–23 May 2007; pp. 321-334.
- Kashmar, N.; Adda, M.; Ibrahim, H. HEAD metamodel: Hierarchical, extensible, advanced, and dynamic access control metamodel for dynamic and heterogeneous structures. Sensors 2021, 21(19), 6507. [Google Scholar] [CrossRef]
- Yuan, E.; Tong, J. Attributed based access control (ABAC) for web services. In Proceedings of the IEEE International Conference on Web Services (ICWS 2005). Florida, USA, 11–15 July 2005; pp. 569.
- Coyne, E.; Weil, T. ABAC and RBAC: Scalable, Flexible, and Auditable Access Management. IT Prof 2013, 15, 14–16. [Google Scholar] [CrossRef]
- Hu, V. C.; Ferraiolo, D.; Kuhn, R.; Schnitzer, A.; Sandlin, K.; Miller, R.; Scarfone, K. Guide to Attribute Based Access Control (ABAC) Definition and Considerations. National Institute of Standards and Technology 2014 Natl. Inst. Stand. Technol. Spec. Publ. 800-162.
- Ubale, A.; Modani, G.; Apte, S. Analysis of DAC MAC RBAC access control based models for security. Int J Comput Appl 2014, 104, 6–13. [Google Scholar]
- Xu, Z.; Stoller, S. Mining attribute-based access control policies. IEEE Trans Dependable Secure Comput 2014, 12, 533–545. [Google Scholar] [CrossRef]
- Iyer, P.; Masoumzadeh, A. Mining Positive and Negative Attribute-Based Access Control Policy Rules. In Proceedings of the 23rd ACM on Symposium on Access Control Models and Technologies (SACMAT 2018). Indiana, USA, 13–15 June 2018; pp. 161–172.
- Cendrowska, J. PRISM: An algorithm for inducing modular rules. Int J Man-Mach Stud 1987, 27, 349–370. [Google Scholar] [CrossRef]
- Cotrini, C.; Weghorn, T.; Basin, D. Mining ABAC Rules from Sparse Logs. In Proceedings of the 3rd IEEE European Symposium on Security and Privacy (EuroS&P 2018). London, UK, 24–16 April 2018; pp. 31–46.
- Kavšek, B.; Lavrač, N. APRIORI-SD: Adapting association rule learning to subgroup discovery. Appl Artif Intell 2006, 20, 543–583. [Google Scholar]
- Abu Jabal, A.; Bertino, E.; Lobo, J.; Law, M.; Russo, A.; Calo, S.; Verma, D. Polisma-a framework for learning attribute-based access control policies. In Proceedings of the 25th European Symposium on Research in Computer Security (ESORICS 2020). Guildford, UK, 14–18 September 2020; pp. 523–544. [Google Scholar]
- Karimi, L.; Aldairi, M.; Joshi, J.; Abdelhakim, M. An automatic attribute-based access control policy extraction from access logs. IEEE Trans Dependable Secure Comput 2021, 19, 2304–2317. [Google Scholar] [CrossRef]
- Davari, M., Zulkernine, M. (2022, December). Mining attribute-based access control policies. In International Conference on Information Systems Security (ICISS 2022). Tirupati, India, 16–20 December 2022; pp. 186-201.
- Quan, S.; Zhao, Y.; Helil, N. Attribute-Based Access Control Policy Generation Approach from Access Logs Based on the CatBoost. Computing and Informatics 2023, 42(3), 615–650. [Google Scholar] [CrossRef]
- Shang, S. , Wang, X., Liu, A. ABAC policy mining method based on hierarchical clustering and relationship extraction. Computers & Security 2024, 139, 103717. [Google Scholar]
- Molloy, I.; Chen, H.; Li, T.; Wang, Q.; Li, N.; Bertino, E.; Calo, S.; Lobo, J. Mining roles with multiple objectives. ACM Trans Inf Syst Secur 2010, 13(4), 1–35. [Google Scholar] [CrossRef]
- Costa, L.; Oliveira, O.; Travieso, G.; Rodrigues, F.; Boas, P.; Antiqueira, L.; Viana, M.; da Rocha, L. Analyzing and Modeling Real-World Phenomena with Complex Networks: A Survey of Applications. Adv Phys 2011, 60, 329–412. [Google Scholar]
- Newman, M. E. J. (2003). The Structure and Function of Complex Networks. SIAM Rev 2003, 45, 167–256. [Google Scholar] [CrossRef]
- Li, H.; Zhao, C.; Liu, Y.; Zhang, X. Anomaly detection by discovering bipartite structure on complex networks. Comput Netw 2021, 190, 107899. [Google Scholar]
- Wang, P.; Wen, G.; Yu, X.; Yu, W.; Wan, Y. Synchronization of resilient complex networks under attacks. IEEE Trans Syst Man Cybern: Syst 2019, 51, 1116–1127. [Google Scholar]
- Wen, G.; Yu, W.; Yu, X.; Lü, J. Complex cyber-physical networks: From cybersecurity to security control. J Syst Sci Complex 2017, 30, 46–67. [Google Scholar] [CrossRef]
- Agrawal, R.; Srikant, R. Fast algorithms for mining association rules in large databases. In Proceedings of the 20th International Conference Very Large Databases (VLDB 1994), San Francisco, USA, 12–15 September 1994; pp. 487–499. [Google Scholar]
- Cao, F.; Liang, J.; Bai, L. A new initialization method for categorical data clustering. Expert Syst Appl 2009, 36, 10223–10228. [Google Scholar] [CrossRef]
- Yanez-Sierra, J. Distribution of Access Control Policies to Large Document Collections. Ph.D. Thesis. Centro de Investigación y Estudios Avanzados del Instituto Politécnico Nacional. Guadalajara, México.
- Fortunato, S. Community detection in graphs. Phys Rep 2010, 486, 75–174. [Google Scholar] [CrossRef]
- Blondel, V.; Guillaume, J.; Lambiotte, R.; Lefebvre, E. Fast unfolding of communities in large networks. J Stat Mech Theor Exp 2008, 10, P100008. [Google Scholar] [CrossRef]
- Newman, M.; Girvan, M. Finding and evaluating community structure in networks. Phys. Rev. E 2004, 69, 026113. [Google Scholar] [CrossRef]
- Hammer, B. Amazon.com - Kaggle Employee Access Challenge. Available online: https://kaggle.com/ competitions/amazon-employee-access-challenge (accessed on 20 January 2025).
- Stone, M. Cross-validation and multinomial prediction. Biometrika 1974, 61, 509–515. [Google Scholar] [CrossRef]
Figure 1.
Policy mining proposed approach conceptual methodology.
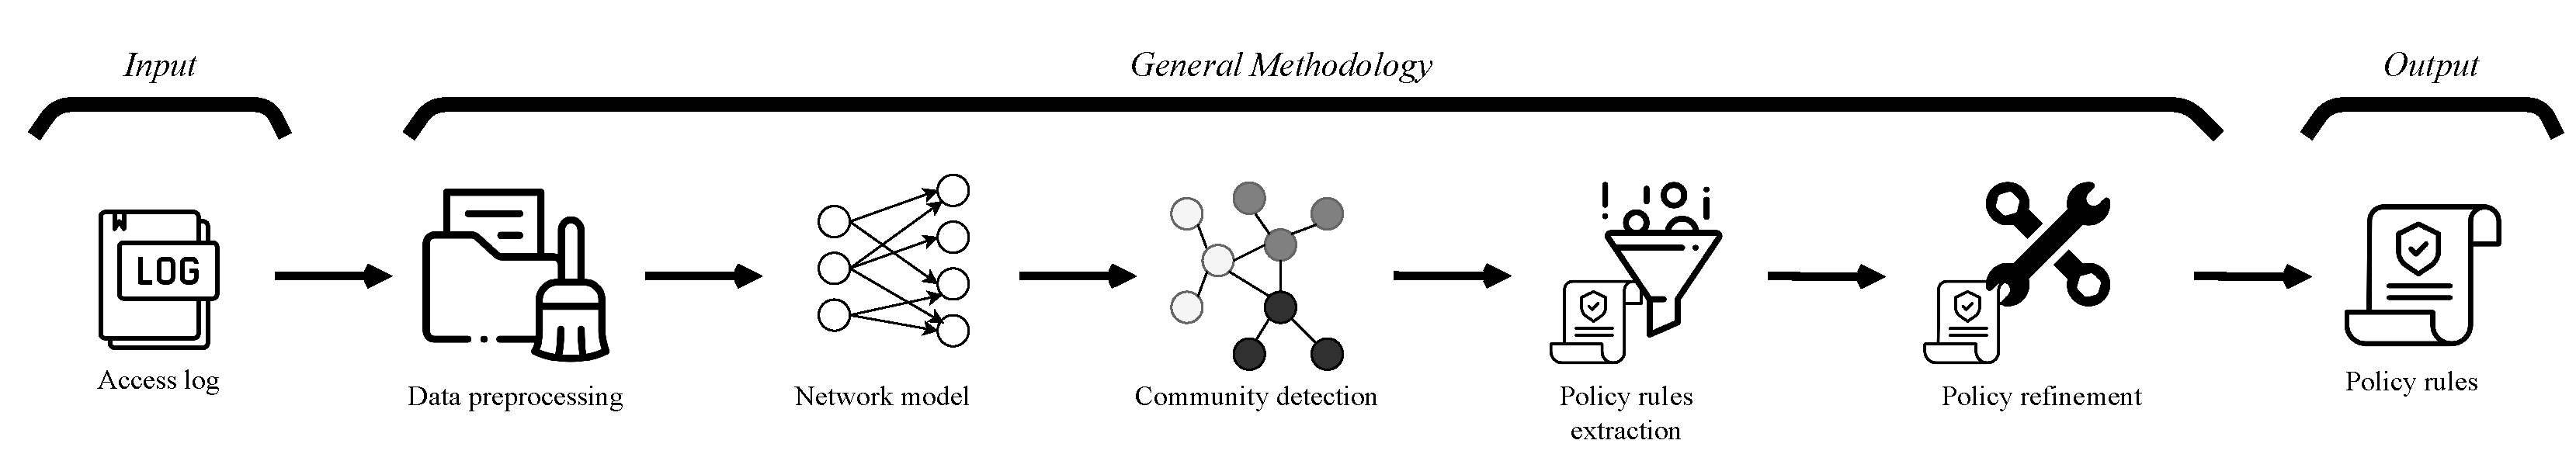
Figure 2.
Proposed ACM functional points.
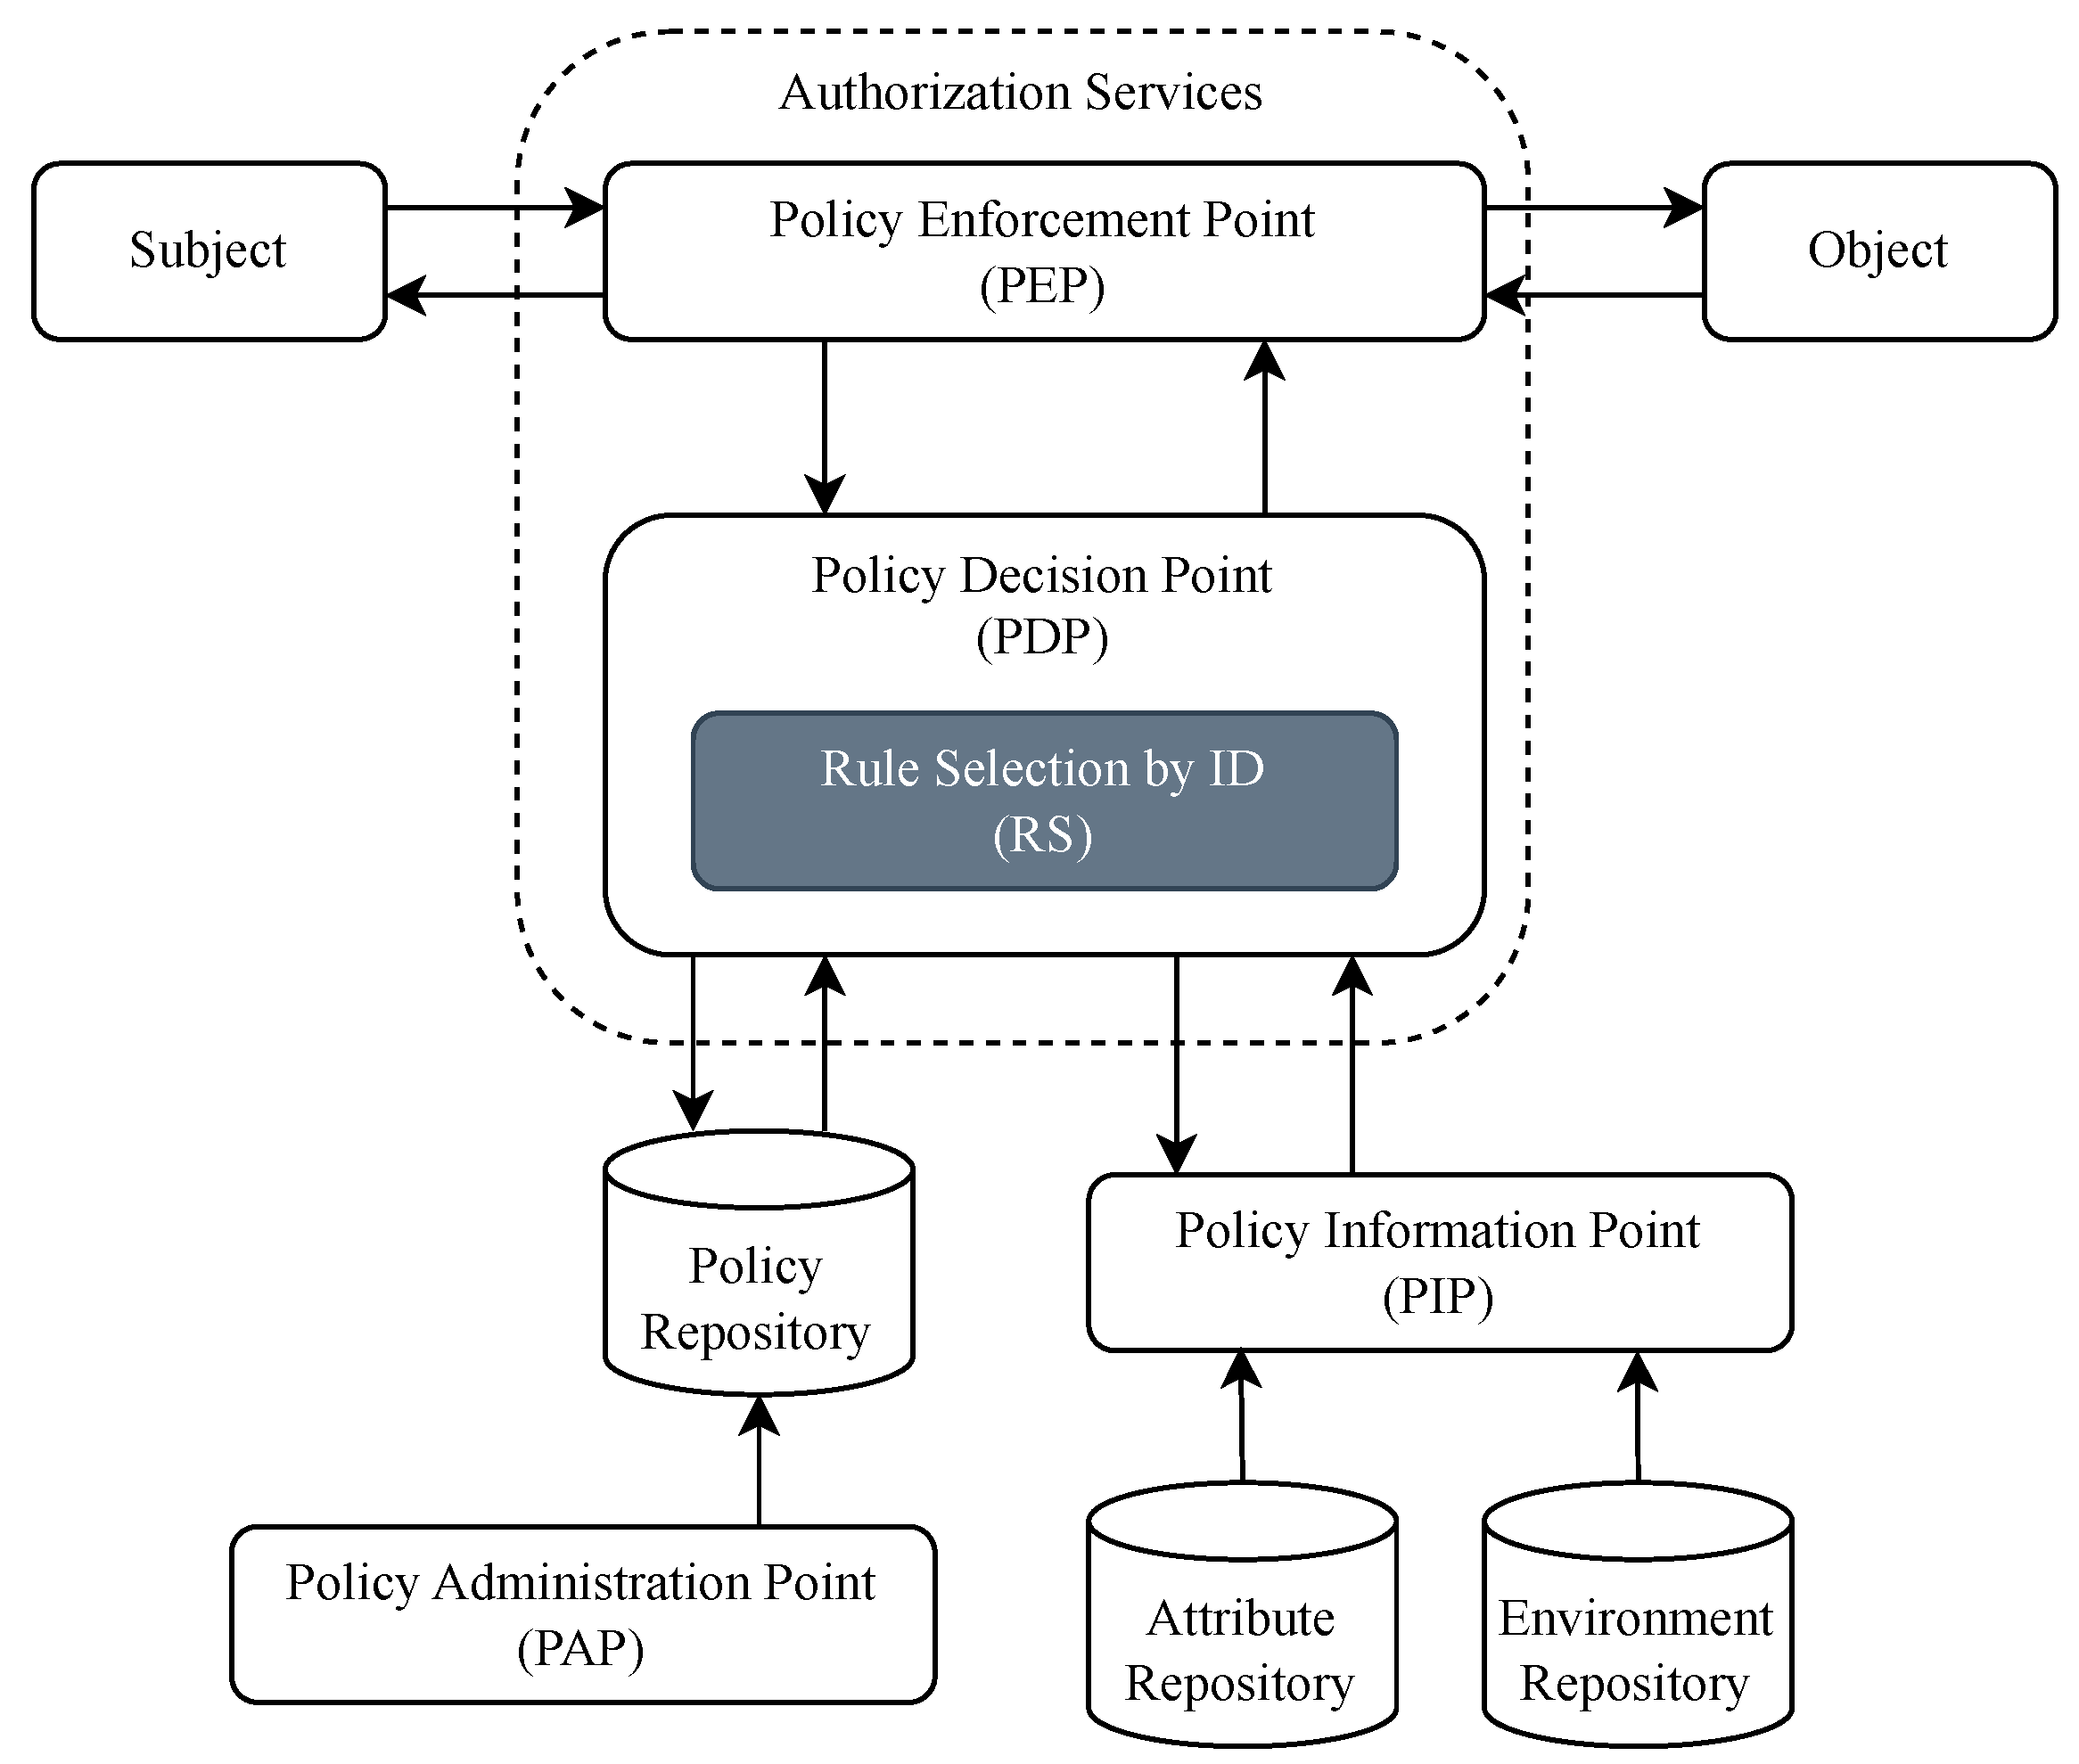
Figure 3.
Flow chart of the proposed RS stage in the PDP.
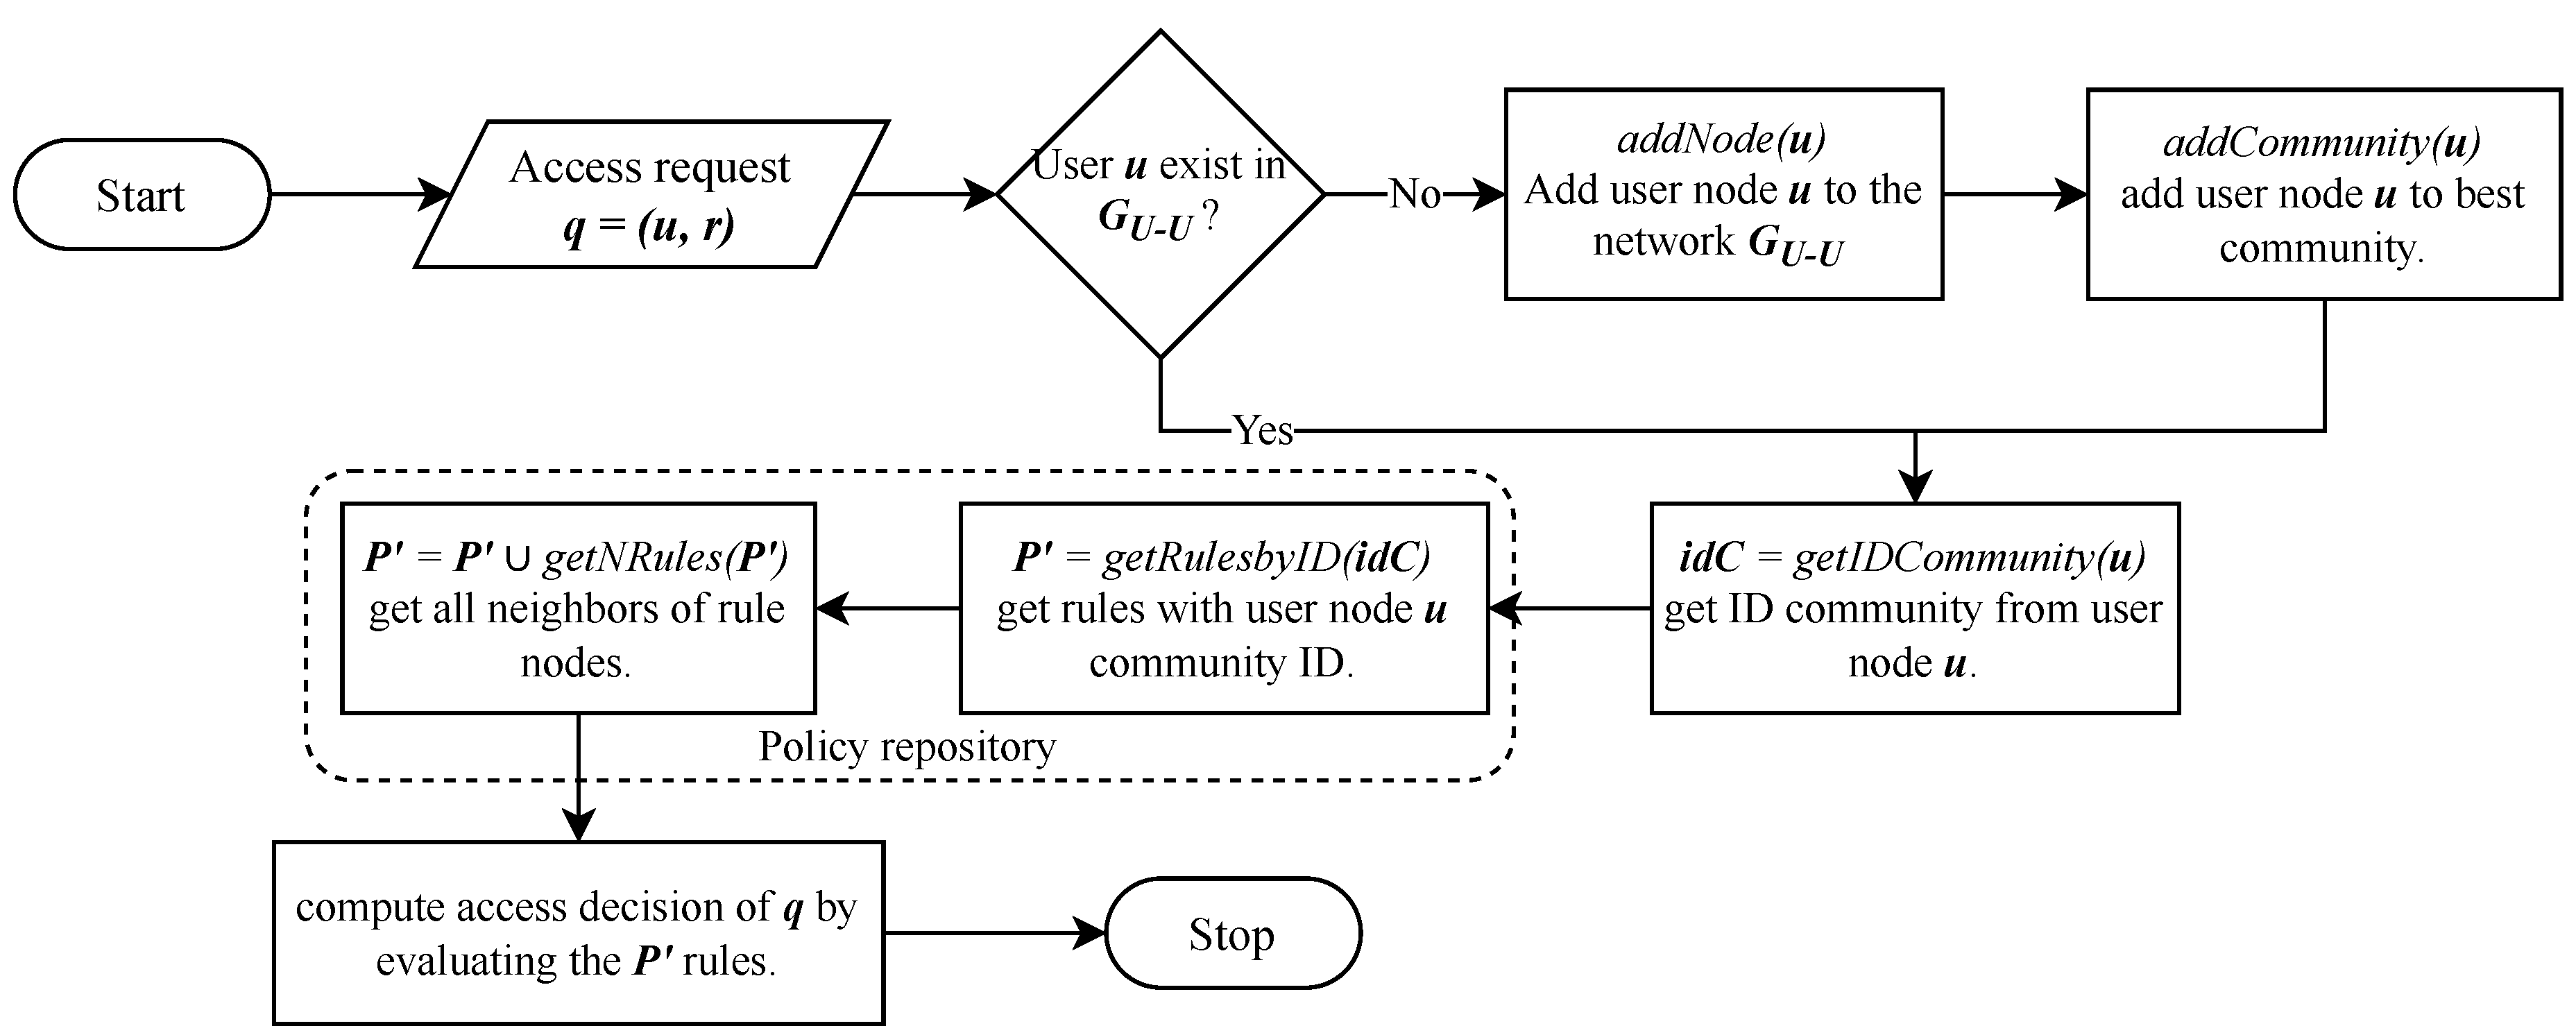
Figure 4.
Frequency of access requests to resources. The dotted line splits more and less frequent resources.
Figure 4.
Frequency of access requests to resources. The dotted line splits more and less frequent resources.
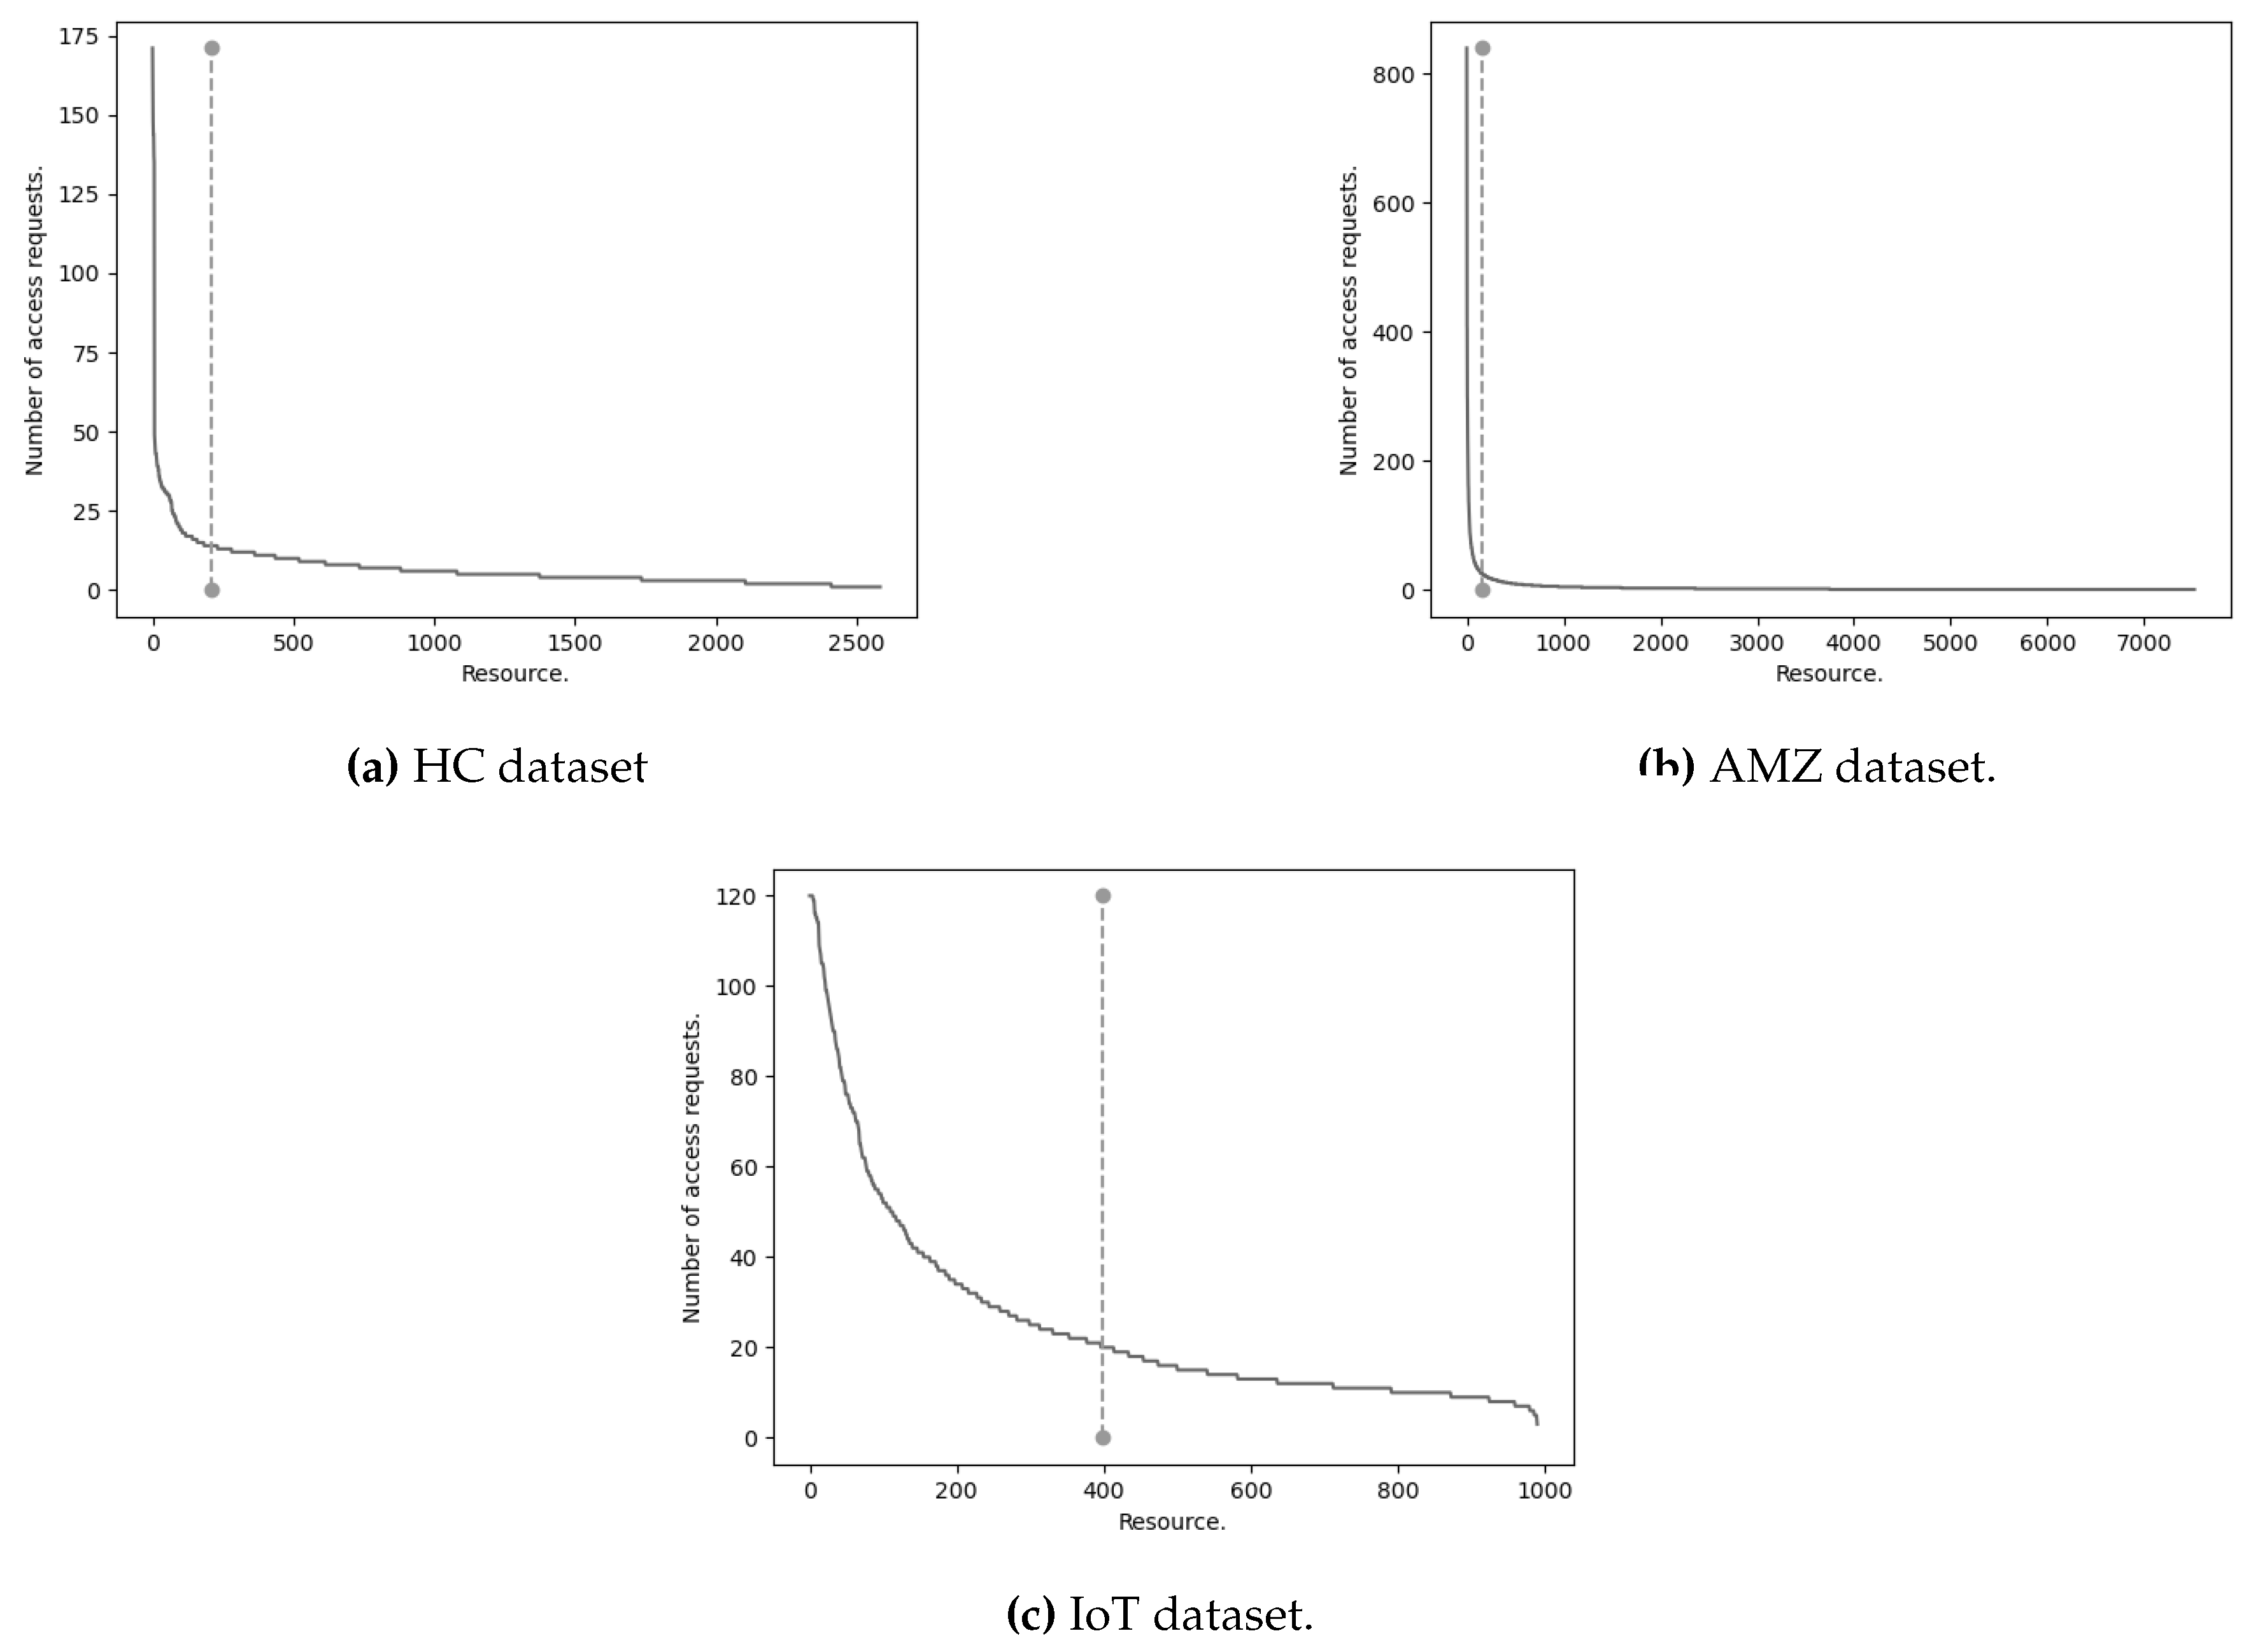
Figure 5.
Degree distribution of user networks. The vertical axis indicates the fraction of nodes that have degree k. The horizontal axis represents the different degrees’ values. The graph is presented on a logarithmic scale.
Figure 5.
Degree distribution of user networks. The vertical axis indicates the fraction of nodes that have degree k. The horizontal axis represents the different degrees’ values. The graph is presented on a logarithmic scale.
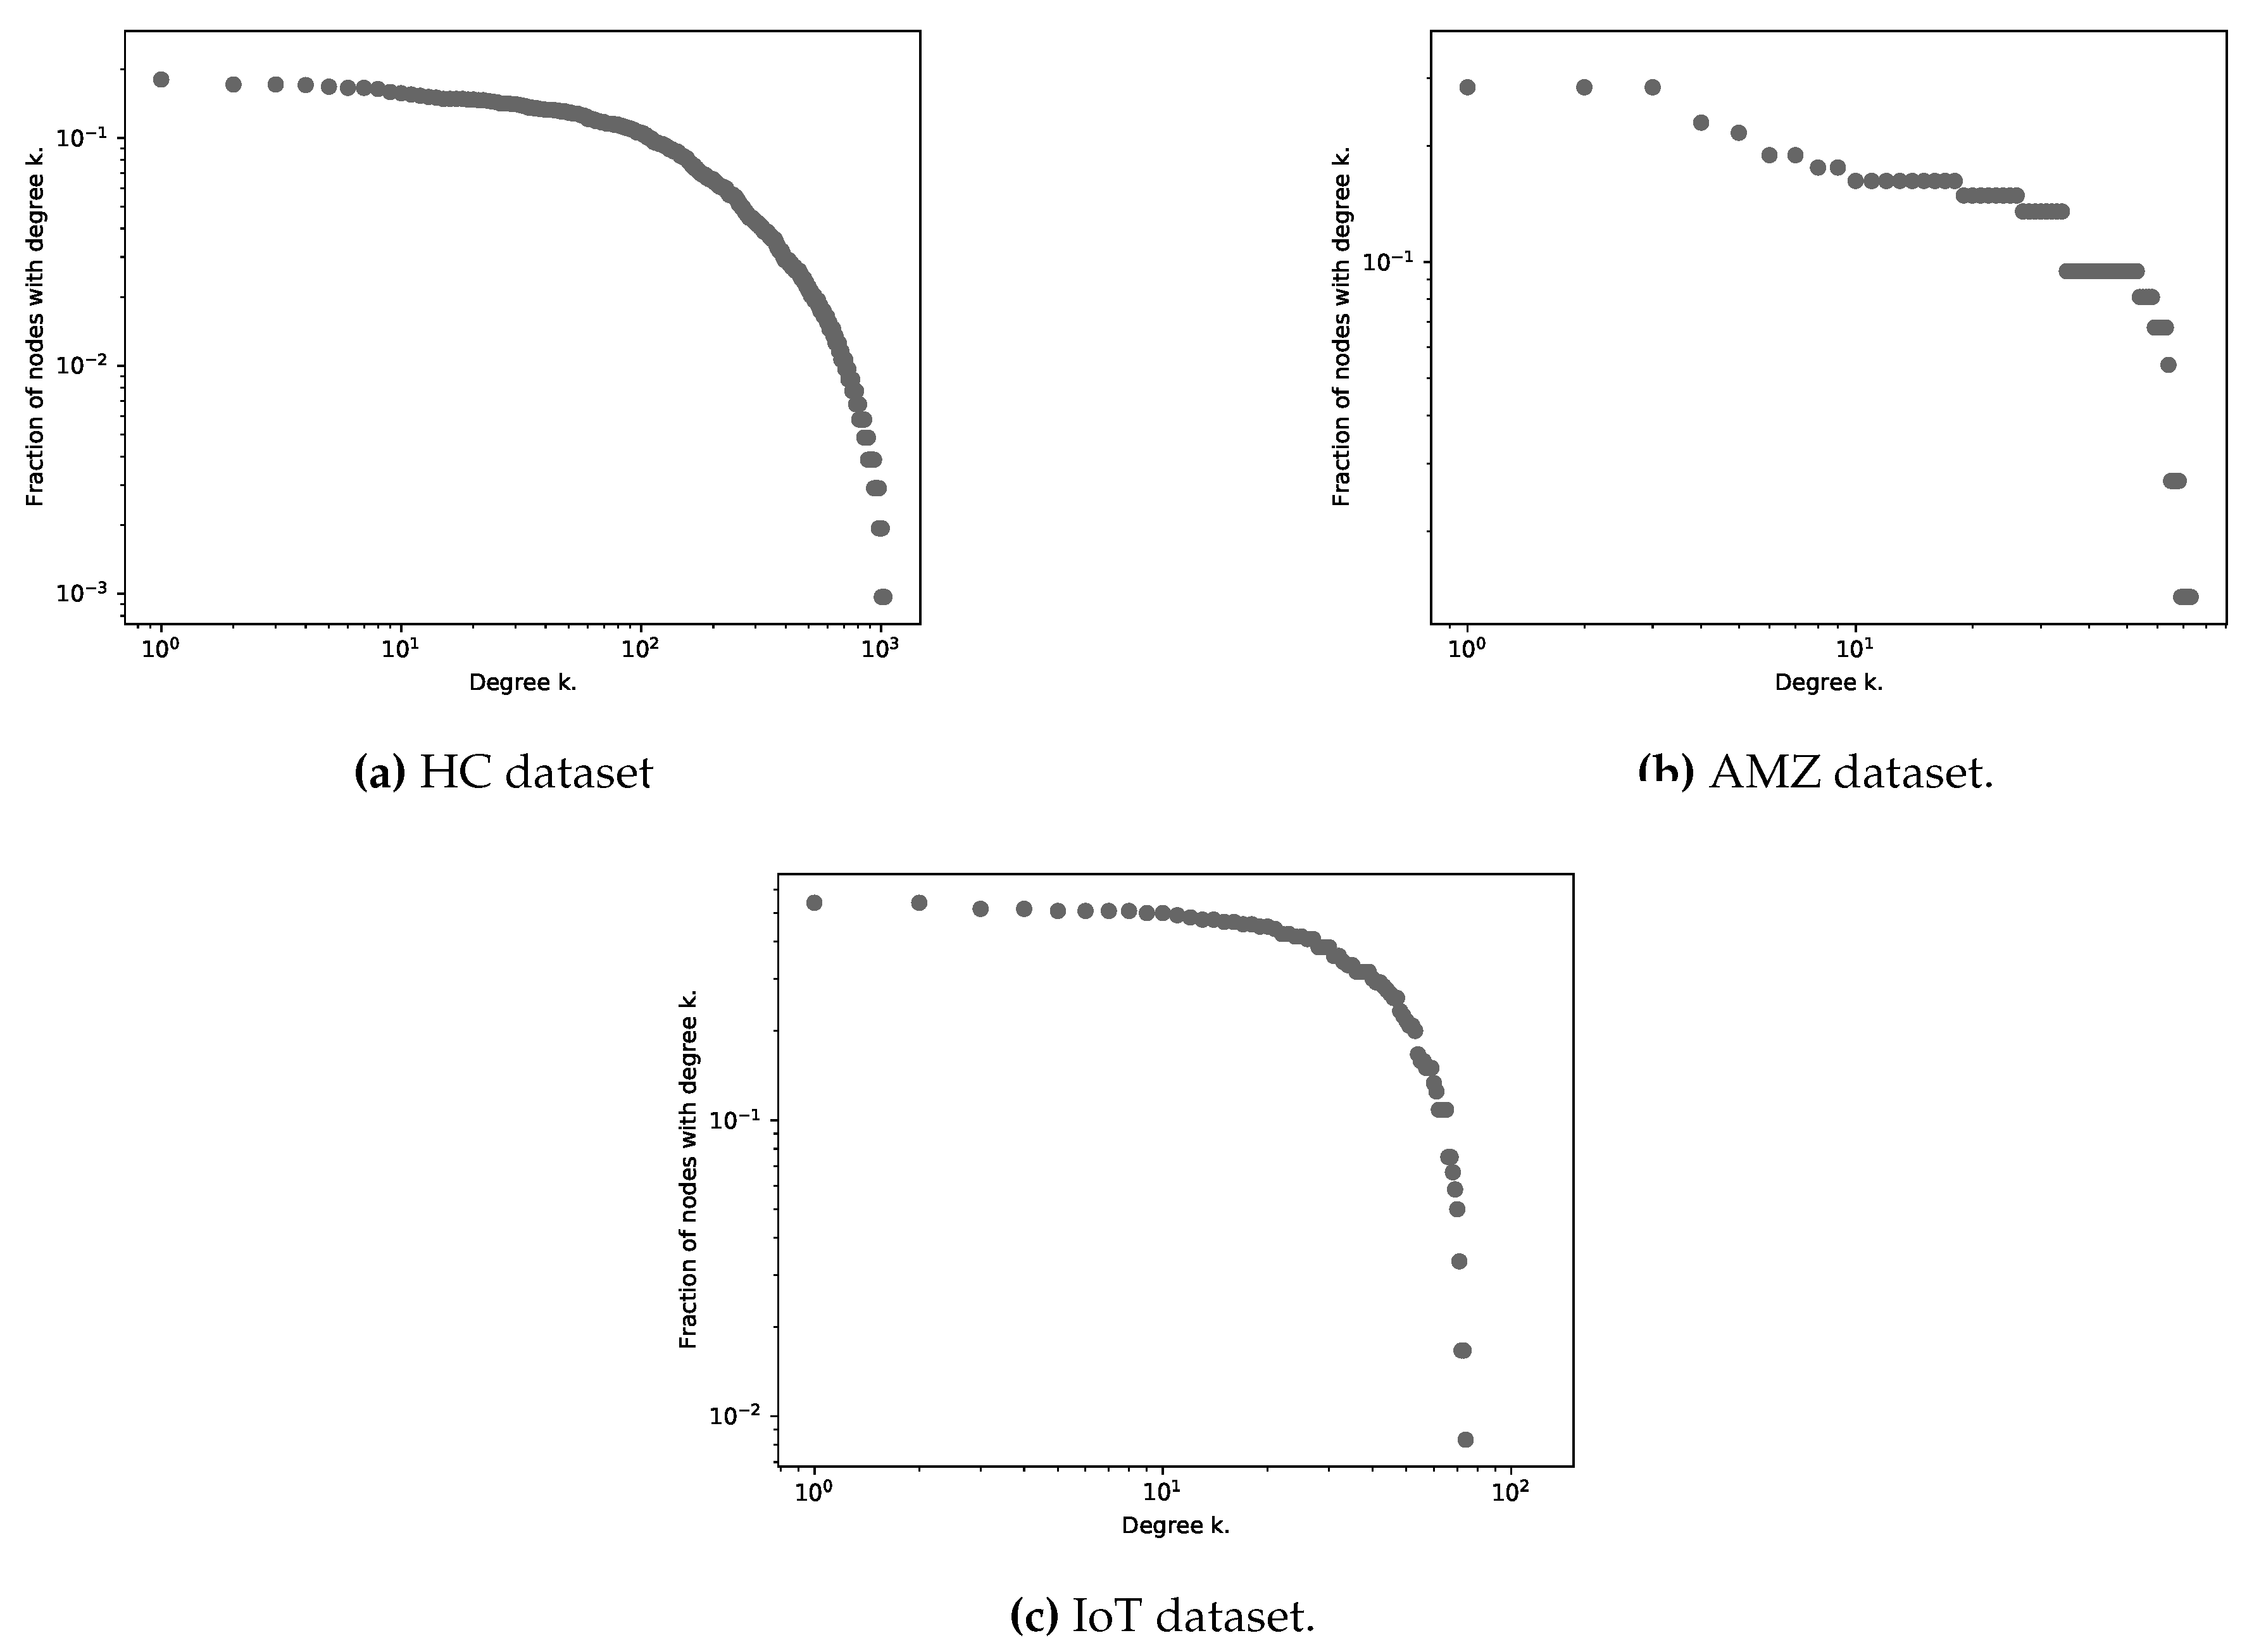
Figure 6.
Mined HC ABAC policy rule network . , . The color of the nodes indicates the community where they were generated. The shape of the vertex represents the phase where they were generated. A circular shape means that the rule was generated at the policy rules extraction phase and a triangular shape at the policy refinement phase.
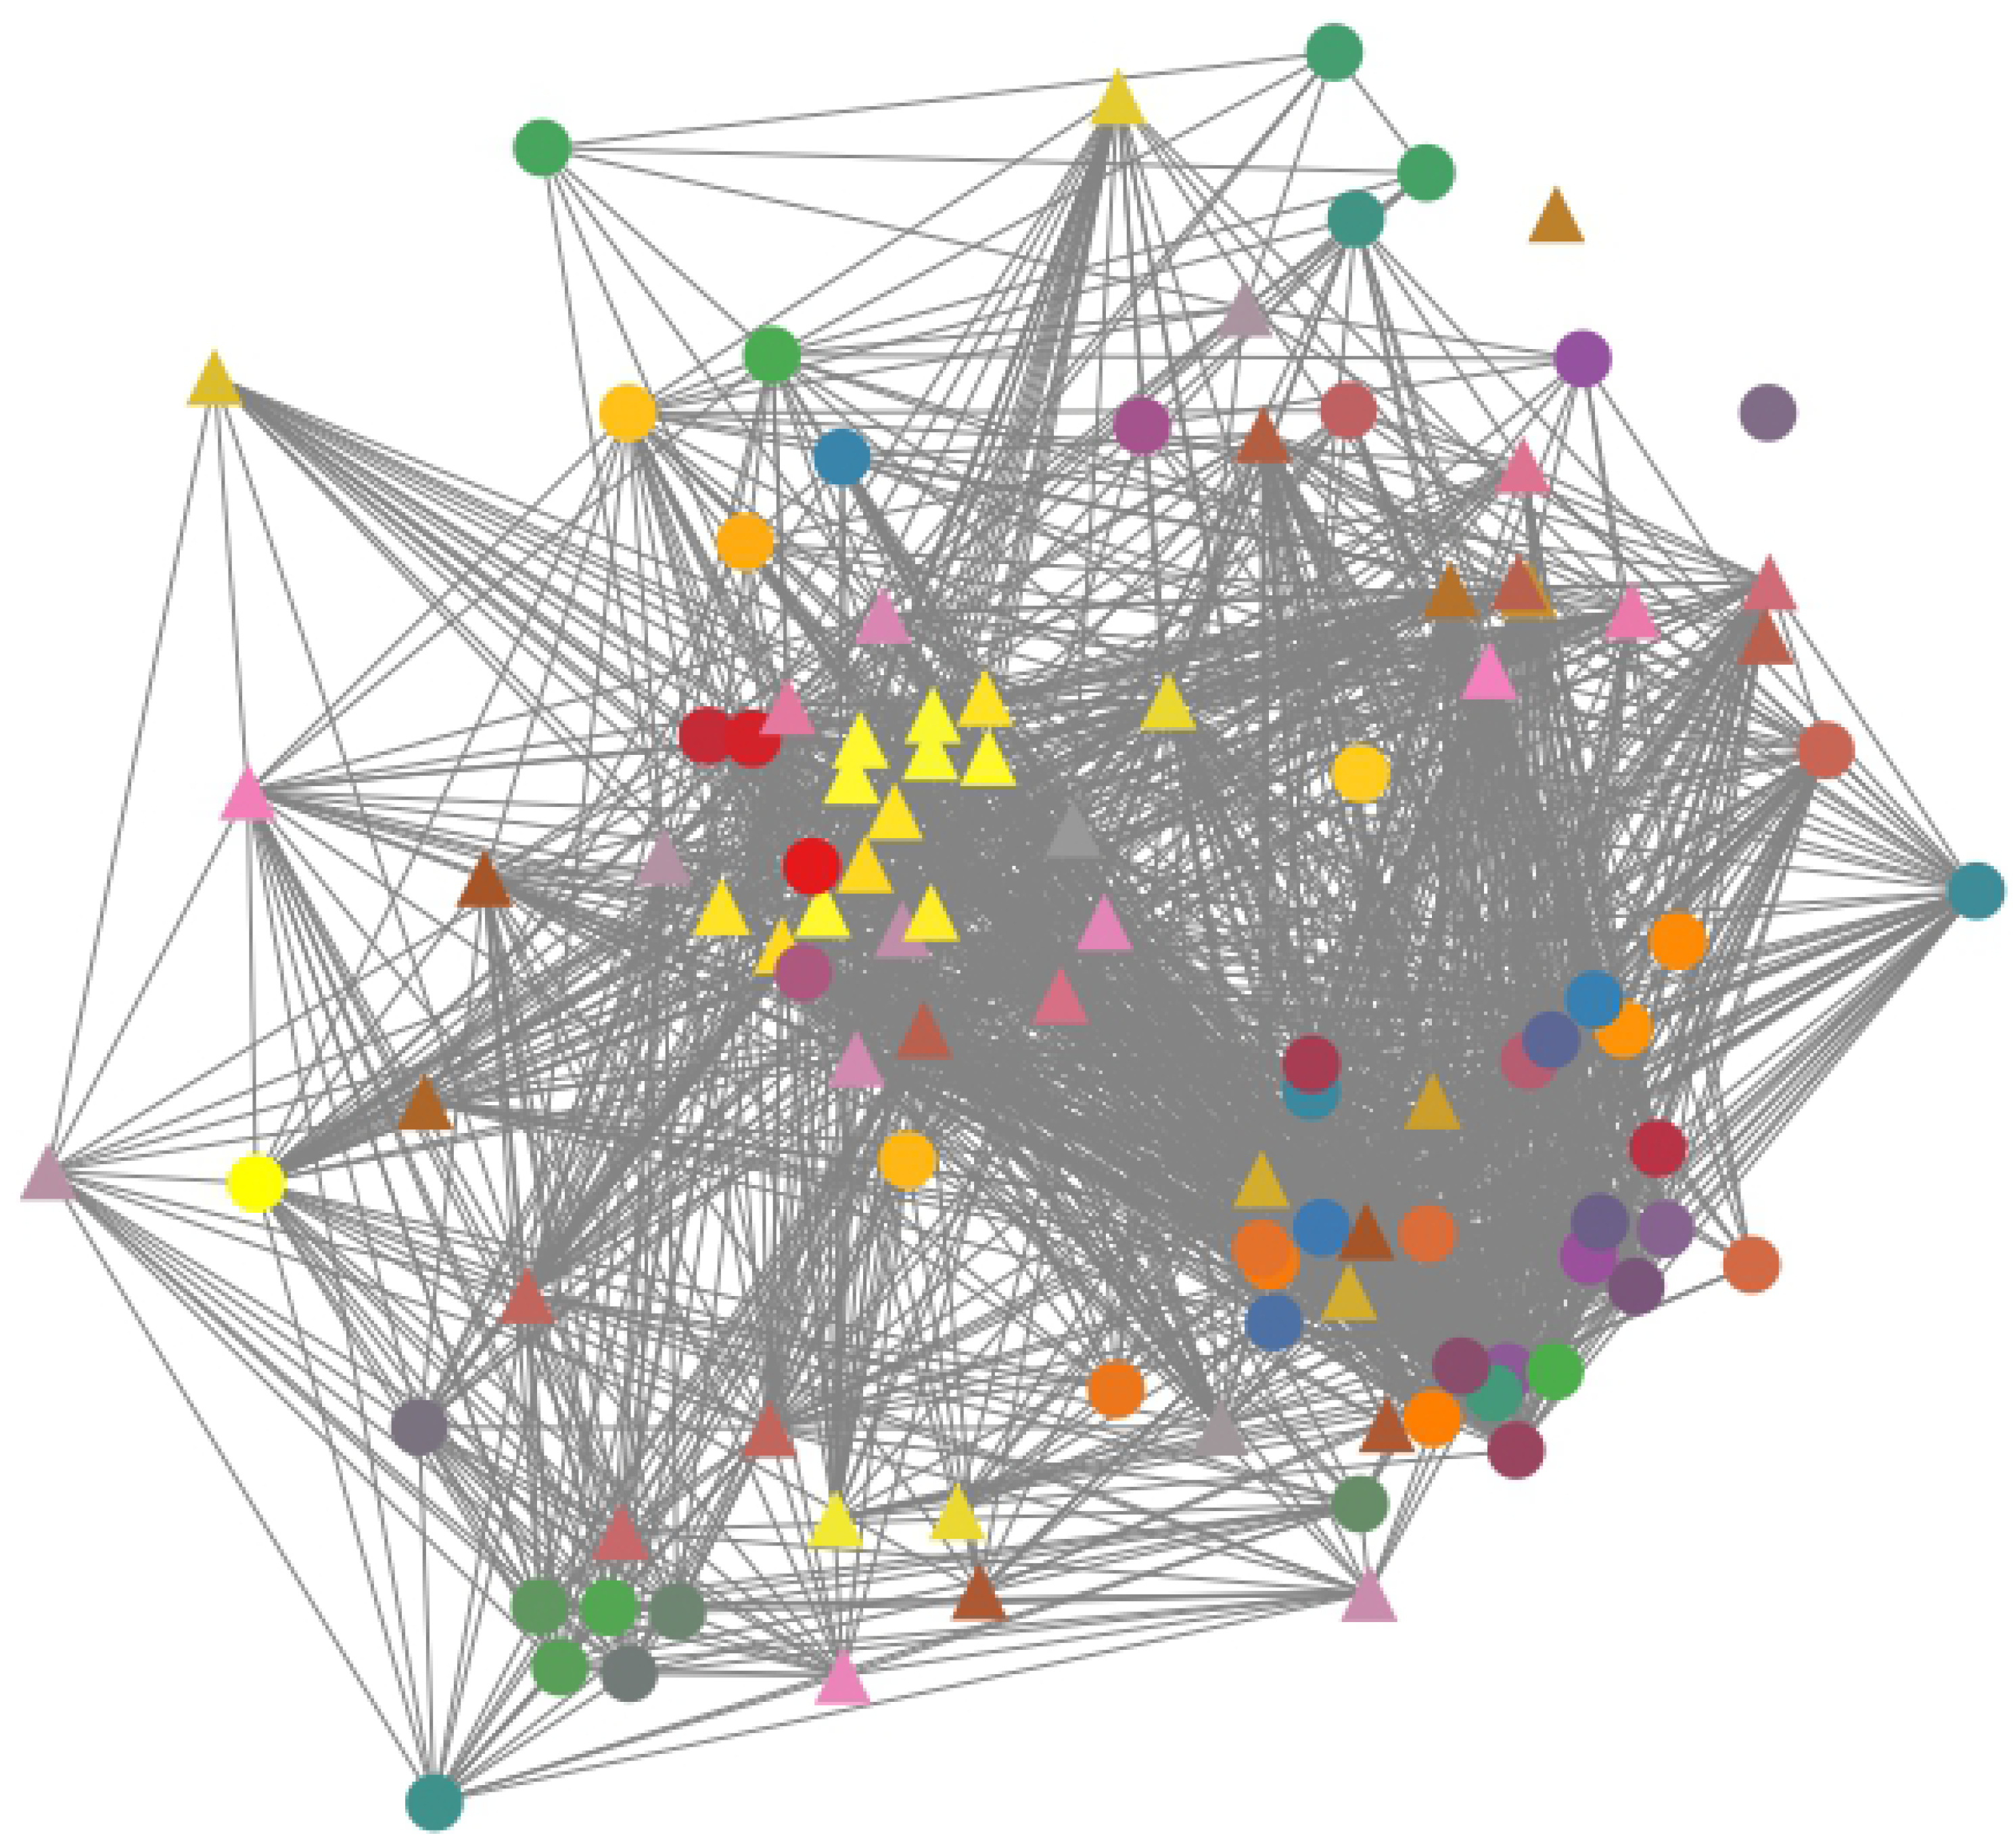
Figure 8.
Mined IoT ABAC policy rule network . , . The color of the nodes indicates the community where they were generated. The shape of the vertex represents the phase where they were generated. A circular shape means that the rule was generated at the policy rules extraction phase and a triangular shape at the policy refinement phase.
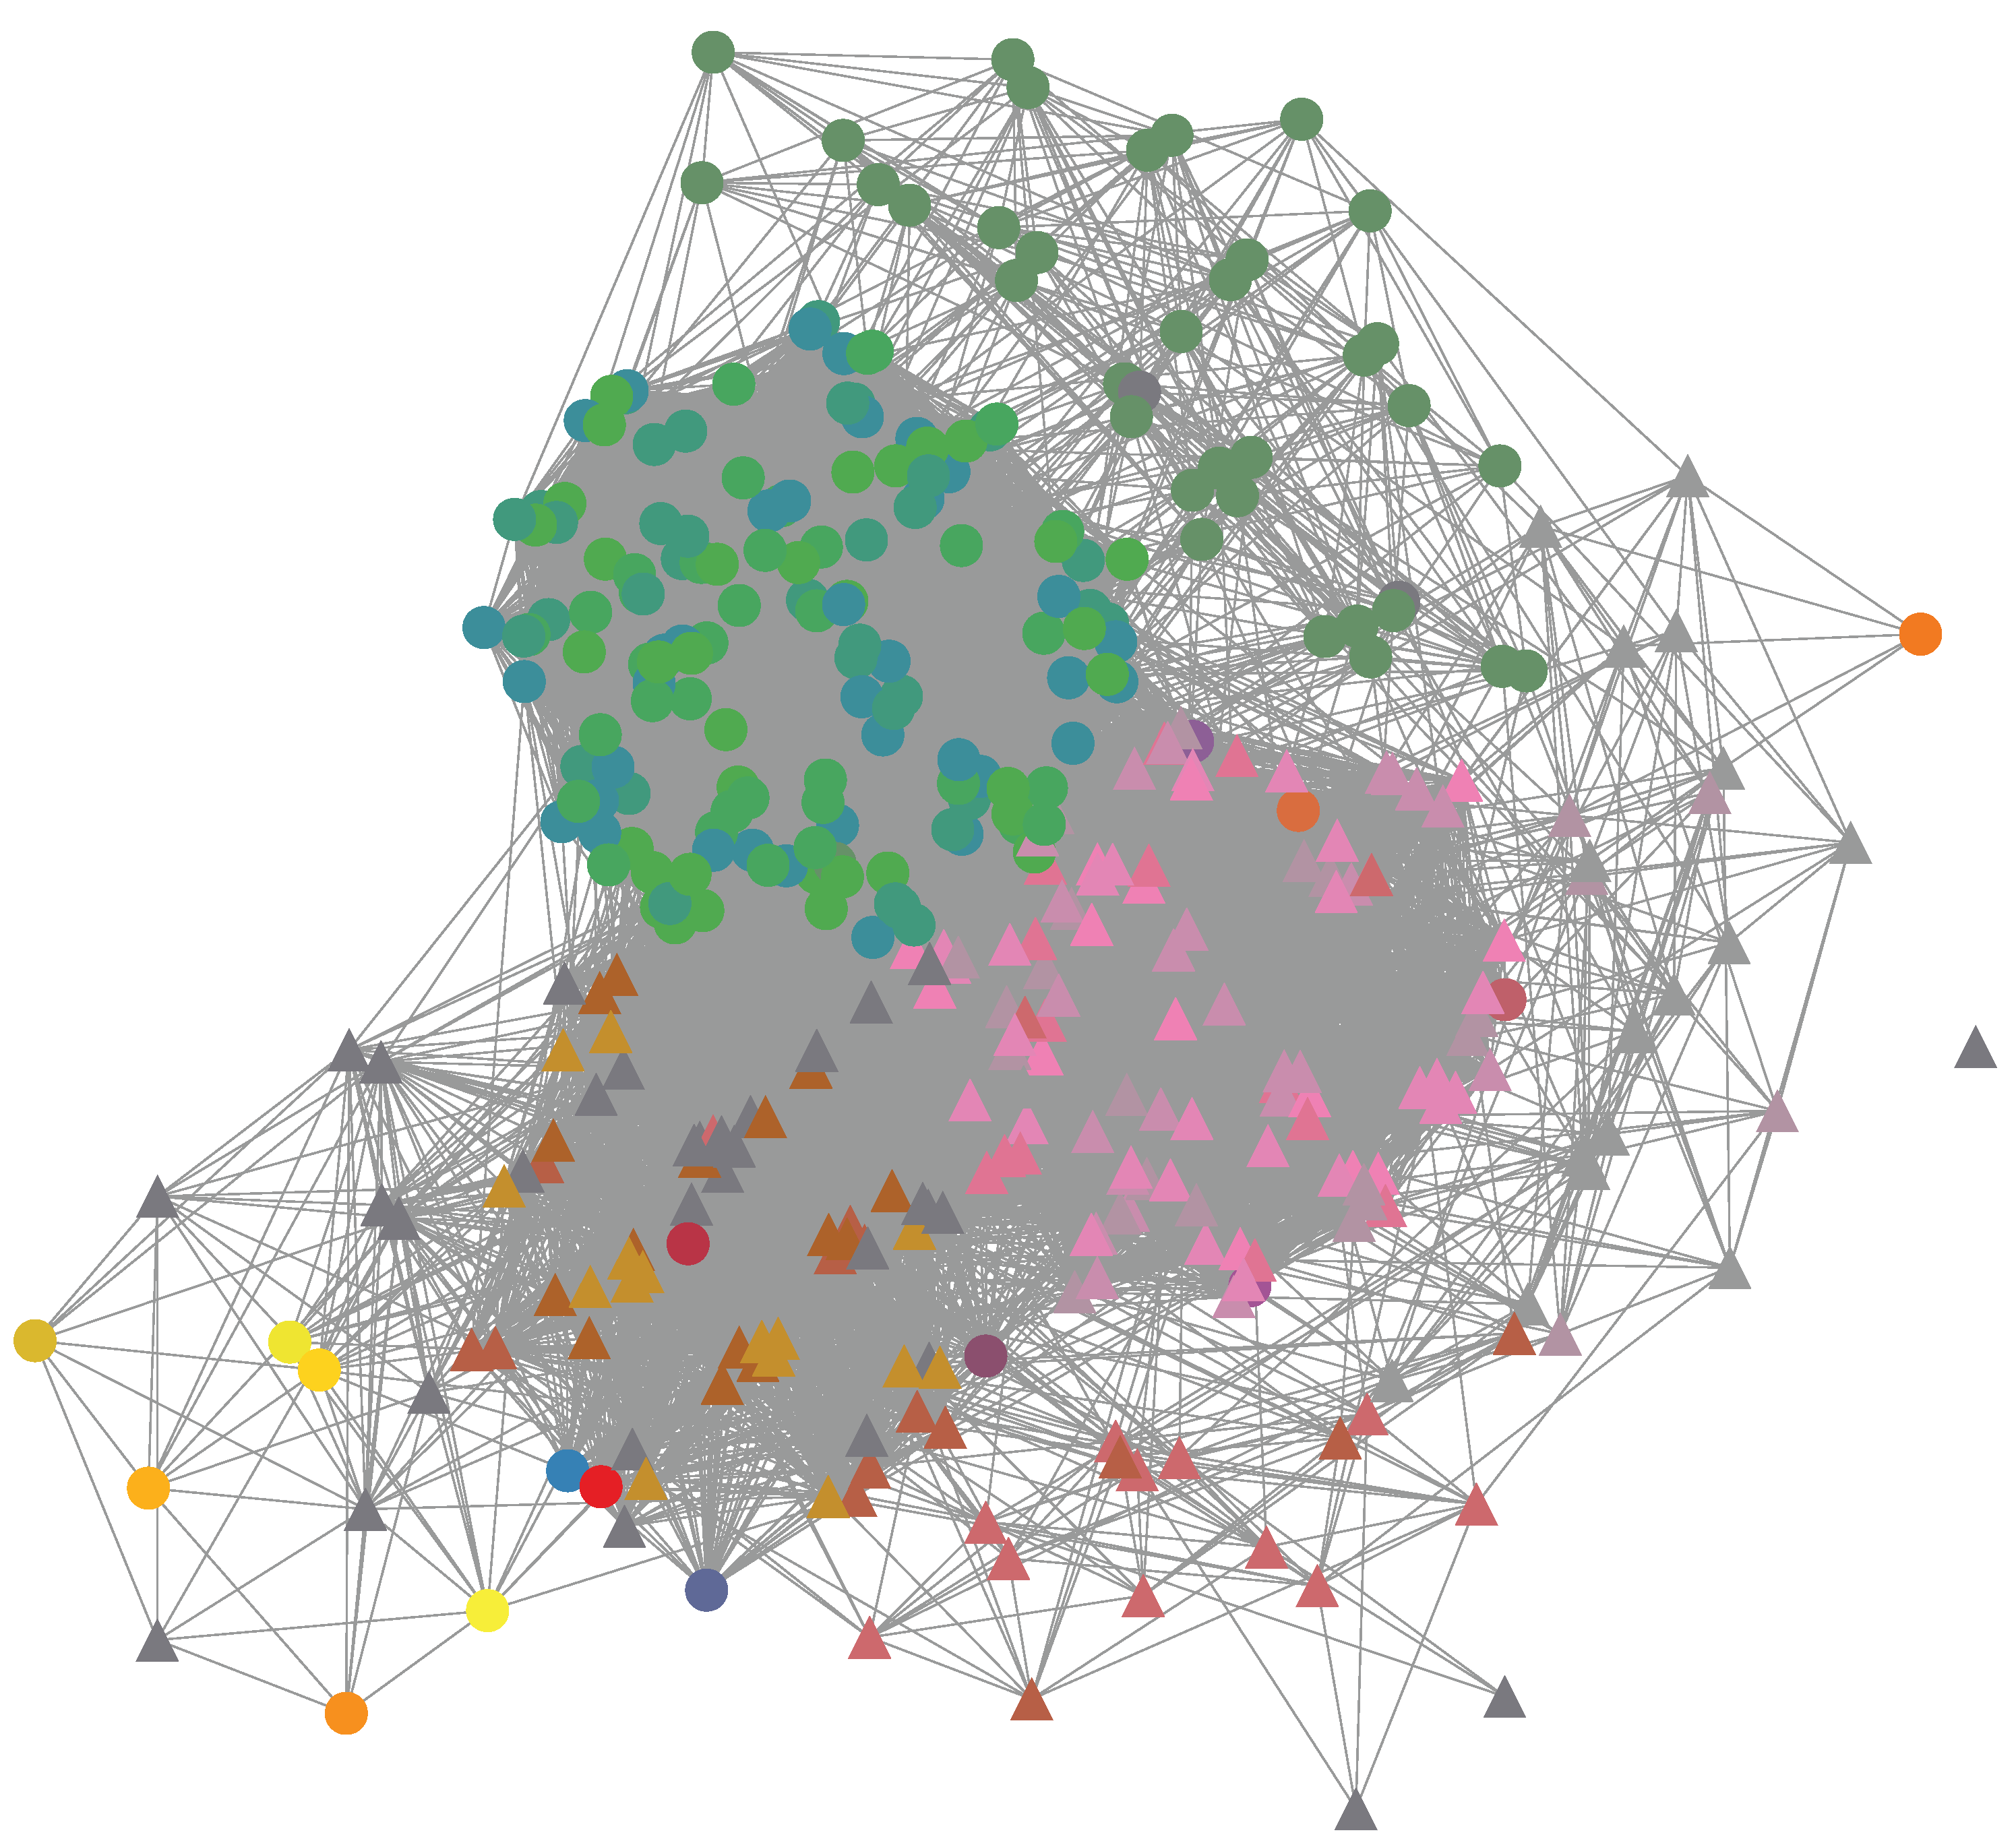

Table 1.
State of the art ABAC policy mining approaches.
| Authors | Data application | Rule extraction approach | Negative rule extraction | Noisy log | Sparse log |
|---|---|---|---|---|---|
| Xu and Stoller, 2014 [16] | Access log. | Association rule mining algorithm. | ✗ | ✓ | ✗ |
| Iyer and Masoumzadeh, 2018 [17] | Access log. | Association rule mining algorithm. | ✓ | ✗ | ✗ |
| Cotrini et al., 2018 [19] | Access log. | Association rule mining algorithm. | ✗ | ✗ | ✓ |
| Jabal et al., 2020 [21] | Access log. | Association rule mining algorithm. | ✗ | ✓ | ✗ |
| Karimi et al., 2021 [22] | Clusters in access log. | Frequency of attribute-value tuples in a cluster. | ✗ | ✓ | ✓ |
| Davari et al., 2022 [23] | Clusters in access log. | Association rule mining algorithm. | ✓ | ✓ | ✓ |
| Quan et al., 2023 [24] | Clusters in access log. | CatBoost algorithm. | ✓ | ✓ | ✓ |
| Shang et al., 2024 [25] | Clusters in access log. | Hierarchical relation in a cluster. | ✗ | ✓ | ✓ |
Table 2.
Details of the datasets used.
| Dataset | |||||
|---|---|---|---|---|---|
| Healthcare (HC) | 12 | 77 | |||
| Amazon Kaggle (AMZ) | 7 | ||||
| Smart Building IoT (IoT) | 9 | 52 |
Table 3.
Results at the end of each phase. Data pre-processing, network model, and community detection phase are shown as 1, 2, and 3, respectively.
Table 3.
Results at the end of each phase. Data pre-processing, network model, and community detection phase are shown as 1, 2, and 3, respectively.
| Phase | CS | AMZ | IoT |
|---|---|---|---|
| 1 | , | , | , |
| 2 | where , | where , | where , |
| 3 |
|
|
|
Table 4.
Results of the quality and complexity of the policy in the phases of rule inference and policy refinement.
Table 4.
Results of the quality and complexity of the policy in the phases of rule inference and policy refinement.
| Dataset | Phase | FN | FP | Precision | Recall | F-score | ||
|---|---|---|---|---|---|---|---|---|
| HC | 4 | 672 | 17 | 0.9899 | 0.7129 | 0.8289 | 41 | 231 |
| 5 | 63 | 10 | 0.9956 | 0.9730 | 0.9842 | 90 | 389 | |
| AMZ | 4 | 511 | 30 | 0.9966 | 0.9462 | 0.9707 | 82 | 274 |
| 5 | 134 | 11 | 0.9988 | 0.9858 | 0.9923 | 156 | 564 | |
| IoT | 4 | 3,681 | 2,760 | 0.7899 | 0.8337 | 0.8112 | 49 | 203 |
| 5 | 1,255 | 1,402 | 0.9300 | 0.9207 | 0.9254 | 101 | 461 |
Table 5.
Comparative analysis of the quality and complexity of the mined policy with previous work of the mining of ABAC policies from the access log. The ’-’ symbol represents that it was not reported by the authors.
Table 5.
Comparative analysis of the quality and complexity of the mined policy with previous work of the mining of ABAC policies from the access log. The ’-’ symbol represents that it was not reported by the authors.
| Mining approach | Precision | Recall | F-score | |||
|---|---|---|---|---|---|---|
| our approach | 0.9956 | 0.9730 | 0.9842 | 90 | 389 | |
| Karimi et al. [22] | - | - | 0.62 | 15 | 67 | |
| our approach | 0.9988 | 0.9858 | 0.9923 | 156 | 564 | |
| Karimi et al. [22] | - | - | 0.97 | 20 | 44 | |
| Cotrini et al. [19] | - | - | 0.8495 | 1055 | 2431 | |
| Jabal et al. [21] | - | - | 0.8600 | - | - |
Table 6.
Complex network properties of HC User Network.
| Property | Value |
|---|---|
| 1. , commonly in the order of thousands or millions. | , |
| 2. Low average degree . | |
| 3. Low density . | |
| 4. Scale-free distribution . | See Figure 5a. |
| 5. Low average path length . | |
| 6. High average cluster coefficient . |
Table 7.
Complex network properties of AMZ User Network.
| Property | Value |
|---|---|
| 1. , commonly in the order of thousands or millions. | , |
| 2. Low average degree . | |
| 3. Low density . | |
| 4. Scale-free distribution . | See Figure 5b. |
| 5. Low average path length . | |
| 6. High average cluster coefficient . |
Table 8.
Complex network properties of IoT User Network.
| Property | Value |
|---|---|
| 1. , commonly in the order of thousands or millions. | , |
| 2. Low average degree . | |
| 3. Low density . | |
| 4. Scale-free distribution . | See Figure 5c. |
| 5. Low average path length . | |
| 6. High average cluster coefficient . |
Table 9.
Time complexity of all phases and tasks in our approach. Notation: L is the access log, is positive access log, A is the set of attributes, is the set of user nodes in the ARBN, is the set of user nodes in the UN, R is the set of resources, is the initial set of rules, is the refined set of rules, FN is the set of false negatives, and FP is the set of false positives.
| Phase | Task | Time complexity |
|---|---|---|
| Data Pre-processing | Null values | |
| Continuous to categorical | ||
| Remove duplicates | ||
| Frequent resources | ||
| Network Model | ARBN | |
| UN | ||
| Community Detection | Community detection | |
| Community classification | ||
| Rule Mining | Rule inference | |
| Rule network | ||
| Policy Refinement | FN refinement | |
| FP refinement | ||
| Rule network |
Disclaimer/Publisher’s Note: The statements, opinions and data contained in all publications are solely those of the individual author(s) and contributor(s) and not of MDPI and/or the editor(s). MDPI and/or the editor(s) disclaim responsibility for any injury to people or property resulting from any ideas, methods, instructions or products referred to in the content. |
© 2025 by the authors. Licensee MDPI, Basel, Switzerland. This article is an open access article distributed under the terms and conditions of the Creative Commons Attribution (CC BY) license (http://creativecommons.org/licenses/by/4.0/).
Copyright: This open access article is published under a Creative Commons CC BY 4.0 license, which permit the free download, distribution, and reuse, provided that the author and preprint are cited in any reuse.


