Submitted:
26 August 2025
Posted:
27 August 2025
You are already at the latest version
Abstract
Background: Phosphoglucomutase-1 (PGM1) is an enzyme that plays important roles in glycolysis, glycogen metabolism, and glycosylation. The PGM1 gene harbors two common nonsynonymous single-nucleotide variants (rs1126728 and rs11208257), which result in four functional PGM1 phenotypes. Correlations between PGM1 polymorphisms and sev-eral pathological conditions have been suggested. Methods: To identify the rs1126728 and rs11208257 concurrently, a fluorescence melting curve analysis (FMCA) was developed that utilizes two distinct dual-labeled fluorescence probes. Two distinct Taq polymerases, one with and one without 5’-3’exonuclease activity, were compared. This method was then applied to 95 unrelated Japanese subjects. Results: Both Taq polymerases, with and without 5’-3’exonuclease activity, were found to be sufficiently functional. Furthermore, the results of the FMCA using both Taq polymerases were compared with the direct Sang-er sequencing results of PCR products from the 95 Japanese subjects, demonstrating 100% concordance. Conclusions: The duplex probe-based FMCA developed in this study is useful for examining the association between rs1126728 or rs11208257 and a range of pathological conditions using a relatively large number of subjects.
Keywords:
fluorescence melting curve analysis
; phosphoglucomutase-1
; rs1126728
; rs11208257
; dual-labeled fluorescence probe
1. Introduction
Phosphoglucomutases (PMGs) belong to the phosphohexose mutase family and fulfill important roles in glycolysis, gluconeogenesis, and glycosylation. These enzymes catalyze the bidirectional conversion of glucose-1-phosphate and glucose-6-phosphate [1]. Currently, five different human PGMs have been documented: PGM1, PGM2, PGM3, PGM4, and PGM5 [2,3,4,5,6]. PGMs have been reported to be polymorphic proteins, and various techniques such as starch gel electrophoresis, agarose gel electrophoresis, or isoelectric focusing, have been employed to determine the polymorphism of PGMs, especially PGM1, PGM2, and PGM3. In the context of forensic practice, these techniques have historically been employed for the purposes of personal identification and paternity testing because they are Mendelian traits.
In most tissues, PGM1 is the predominant enzyme responsible for 85-95% of the total PGM activity [7]. However, the relative amounts of PGM1 and PGM2 in red cells are approximately equivalent, while PGM3 is not detected [7]. In 1964, two common phenotypes, designated PGM1*1 and PGM1*2, were identified through the application of starch gel electrophoresis [2]. Then, these phenotypes were clearly divided into two subtypes by isoelectric focusing, designated acidic isozyme + (PGM1*1+, PGM1*2+) and basic isozyme − (PGM1*1−, PGM1*2−) [8]. Subsequent molecular genetic analysis indicated that two nonsynonymous single nucleotide variants (SNVs) (rs1126728; c.661C>T in exon 4; p.R221C, resulting in the 1/2 phenotypes, and rs11208257; c.1258T>C in exon 8; p.Y420H, resulting in the +/- phenotypes) generate four haplotypes [9,10]. One of these is hypothesized to have arisen from homologous intragenic recombination between these two SNVs [9,10]. The distribution of these two SNVs across various global populations exhibits a high degree of similarity (dbSNP; https://www.ncbi.nlm.nih.gov/snp/rs1126728#frequency_tab, or https://www.ncbi.nlm.nih.gov/snp/rs11208257#frequency_tab).
It has been documented that the enzymatic activity of PGM1 in erythrocytes exhibits slight variations among the four phenotypes, with the following order: PGM1*1- < PGM1*1+ = PGM1*2- < PGM1*2+ [11]. Additionally, the enzyme activity of PGM1*2+ expressed in Escherichia coli has been reported to be slightly higher than that of PGM1*1+ [12]. In contrast to the enzyme activity of PGM1 in erythrocytes, the enzyme activity of PGM1*1- expressed in E. coli was slightly higher than that of PGM1*1+ [12]. Furthermore, the P-21-activated kinase has been demonstrated to bind to, phosphorylate, and enhance the enzymatic activity of PGM1, and the degree of this activation may vary depending on the PGM1 polymorphism [13,14]. The PGM1 polymorphism has been associated with various pathological conditions including type 2 diabetes mellitus, low birthweight, and repeated spontaneous abortion [14,15,16,17], likely due to slight differences in enzyme activity between polymorphisms, as mentioned above.
Despite the existence of numerous methods for detecting SNVs, probe-based fluorescence melting curve analysis (FMCA) has proven to be a particularly robust approach for the analysis of a relatively large number of subjects [18,19]. In the present study, an FMCA method was developed using dual-labeled fluorescence probes for the simultaneous determination of the genotypes of rs1126728 and rs11208257 in PGM1. This method may facilitate the execution of association studies of considerable scale between these SNVs and pathological conditions.
2. Materials and Methods
2.1. Ethical Approval
This research protocol, which used existing anonymized genomic DNA, was reviewed and approved by the Kurume University Ethical Committee (approval number: 22158; approval date: 31 October 2022).
2.2. DNA Samples
This study used previously collected and anonymized genomic DNA from 95 unrelated Japanese individuals from Fukuoka, Japan [20].
2.3. Probes and Primers for a Symmetric Real-Time PCR for Amplification of rs1126728 and rs11208257 in PGM1
Primer3Plus (https://www.bioinformatics.nl/cgi-bin/primer3plus/primer3plus.cgi) [21] was used to select PCR primers. The forward primer employed for the amplification of a 194-bp fragment containing rs1126728 was 5′-AGAAGCATCTTTGATTTCAGTGC-3′, while the reverse primer was 5′-TATCCTCAAGAGATGGGAATTGA-3′. The forward primer for the amplification of a 201-bp fragment containing rs11208257 was 5′ AGTGTGGAGGACATTCTCAAAGA 3′, while the reverse primer was 5′ CAAGAATTCTCTCTGCCCACTT 3′. A dual-labeled fluorescence probe for the detection of rs1126728 was labeled with 5-carboxyfluorescein (FAM) (5'-FAM-CCGACTGAAGATCCGTATTGATGCT- Black Hole Quencher 1. The position of rs1126728 is underlined). A dual-labeled fluorescence probe for the detection of rs11208257 was labeled with cyanine 5 (Cy5) (5'-Cy5-CATTGGCAAAAGCATGGCCGGAA- Black Hole Quencher 2. The position of rs11208257 is also underlined). The synthesis of all primers and probes was conducted by Eurofins Genomics (Tokyo, Japan).
2.4. Genotyping of rs1126728 and rs11208257 in PGM1 by Sequence analysis
Direct Sanger sequencing of all PCR products from 95 Japanese subjects containing rs1126728 or rs11208257 in PGM1 was performed. Each PCR primer was used as a sequence primer, as previously described [22].
2.5. Genotyping of rs1126728 and rs11208257 in PGM1 by FMCA
Real-time PCR and melting curve analysis were conducted with the LightCycler 480 Instrument II (Roche Diagnostics, Tokyo, Japan). This study compared two premix reagents: Premix Ex Taq (Probe qPCR) and TaKaRa Taq HS Perfect Mix (Takara Bio, Shiga, Japan). The DNA polymerases containing Premix Ex Taq (Probe qPCR) have 5’-3’ exonuclease activity, while TaKaRa Taq HS Perfect Mix lacks this activity. The reaction mixture, with a total volume of 10 µL, comprised 5 µL of 2 x either premix, 50 nM each forward primer, 500 nM each reverse primer, 200 nM each dual-labeled fluorescence probe, and 1–10 ng genomic DNA. The same thermal profile was applied to either Premix Ex Taq (Probe qPCR) or TaKaRa Taq HS Perfect Mix: denaturation at 95°C for 30 sec, followed by 45 cycles of 5 sec denaturation at 95°C, 10 sec annealing, and extension at 60°C. Fluorescence data were obtained at the end of each annealing and extension step for both premixes with a combination of FAM (465 nm to 510 nm) and Cy5/Cy5.5 (618 nm to 660 nm) filters.
The probe-based FMCA for both premixes comprised three steps: denaturation at 95°C for 1 min, hybridization at 40°C for 2 min, and the acquisition of fluorescence data three times for each temperature range between 50 and 80°C, with a ramp rate of 0.10°C/sec using FAM and Cy5/Cy5.5 filters. The melting temperature (Tm) calling and melting curve genotyping was carried out with the LightCycler 480 Software, version 1.5.0 (Roche Diagnostics), utilizing the default settings. Samples exhibiting analogous melting-curve patterns were then systematically consolidated into coherent groups.
3. Results
3.1. Comparison of Different DNA Polymerases in Probe-Based FMCA to Determine rs1126728 and rs11208257 Genotypes in PGM1
Initially, the rs1126728 and rs11208257 genotypes were ascertained by Sanger sequencing of PCR products which were amplified by forward and reverse primers of rs112678 or rs11208257 in 95 Japanese subjects. Six subjects were selected for the purpose of validation through probe-based FMCA analysis. Subsequently, two DNA polymerase premixes were utilized to assess the resolution of duplex probe-based FMCA. The analysis revealed that three genotypes each of rs1126728 and rs11208257 of the PGM1 could be effectively distinguished when both premixes were used. The employment of Premix Ex Taq (Probe qPCR) or TaKaRa Taq HS Perfect Mix as PCR polymerase resulted in the identification of a single Tm peak at approximately 67.5°C in the allele homozygous for C/C at rs1126728 (Figure 1A and B). A single Tm peak at approximately 60.0°C was identified in the allele homozygous for T/T, while double Tm peaks at approximately 60.0°C and 67.5°C were identified in the heterozygous for C/T (Figure 1a and b). Furthermore, a single Tm peak at approximately 70.5°C was identified in the allele homozygous for C/C at rs11208257 (Figure 1c and d). A single Tm peak at approximately 63.0°C was identified in the homozygous for T/T, while double Tm peaks at approximately 63.0°C and 70.5°C were identified in the heterozygous for C/T (Figure 1c and d).
3.2. Genotyping of rs1126728 and rs11208257 in 95 Japanese Subjects Using Probe-Based FMCA
Subsequently, the method was applied to genomic DNA samples from 95 unrelated Japanese subjects. A clear distinction was observed among three genotypes of rs1126728 of PGM1 in all subjects when each premix was used (Figure 2a and b). Furthermore, three genotypes of rs11208257 of PGM1 were distinctly identified in all subjects (Figure 2c and d). The genotyping results for both rs1126728 and rs11208257, obtained using two premixes for probe-based FMCA, were completely consistent. Additionally, the genotyping results of FMCA were in precise concord with those of direct Sanger sequencing of PCR products from all 95 Japanese subjects. Consequently, both the sensitivity and specificity of the FMCA in this study were found to be 100%.
3.3. PGM1 Phenotypes Estimated by Genotyping Results of rs1126728 and rs11208257 in 95 Japanese Subjects
The genotyping results obtained for rs1126728 and rs11208257 were used to estimate the PGM1 phenotype in 95 Japanese subjects. As demonstrated in Table 1, the 1/2 or +/- phenotypes can be estimated from the genotypes of rs1126728 (C corresponding to PGM1*1 and T corresponding to PGM1*2) and rs11208257 (C corresponding to PGM1*- and T corresponding to PGM1*+). With the exception of cases in which both rs1126728 and rs11208257 are heterozygous, eight of the ten possible combinations of the four common polymorphisms can be estimated. However, 14 out of 95 individuals were found to be heterozygous for both rs1126728 and rs11208257. Thus, it was not possible to estimate whether these 14 individuals were PGM1*1+/PGM1*2- or PGM1*1-/PGM1*2+ using the present method.
4. Discussion
As indicated in earlier research, there is a demonstrable association between the PGM1 phenotypes, rs1126728 or rs11208257, and various pathological conditions, including type 2 diabetes mellitus, low birthweight, and repeated spontaneous abortion. PGM1 deficiency was known to be a congenital disorder of glycosylation (CDG) due to several SNVs in PGM1 [23]. In contrast to the SNVs of PGM1-CDG, the impact of the two SNVs of PGM1 (rs1126728 and rs11208257) on the encoded proteins was negligible [12]. In vitro, the enzyme activities of the resulting four polymorphic isozymes exhibited a variable order of magnitude, with the following order: PGM1*1- < PGM1*1+ = PGM1*2- < PGM1*2+. The relative activity ranged from 1 to 1.24 [11]. Therefore, these subtle differences may have an impact on certain physiological processes and pathological conditions. Some association studies have employed methods based on the determination of protein phenotypic polymorphism [14,15]. However, such association studies necessitate the implementation of a cost-effective, reliable, and high-throughput genotyping method.
In this study, independent analysis of the rs1126728 and rs11208257 genotypes enabled estimation of the 1/2 polymorphism and +/– phenotype polymorphism. However, when both rs1126728 and rs11208257 are heterozygous, it is not possible to estimate the combination of the two genotypes, i.e., the haplotype. As a result, haplotype-dependent phenotypic polymorphisms may be either PGM1*1+/PGM1*2- or PGM1*1-/PGM1*2+, and it is not possible to estimate either one. This is considered a limitation of this study.
A variety of methodologies were employed to genotype these SNVs in PGM1 [9,10,17], including direct Sanger sequencing of the PCR product [24], PCR-restriction fragment length polymorphism (PCR-RFLP) [25], PCR-single-strand conformation polymorphism (PCR-SSCP) [26], and hydrolysis probe genotyping (TaqMan) methods [27]. Sanger sequencing is currently considered the gold standard for genotyping SNVs because of its high level of accuracy [28]. However, as with the PCR-RFLP and PCR-SSCP techniques, it necessitates time-consuming and labor-intensive post-PCR procedures, as well as the use of costly reagents. Consequently, it is not well-suited for large-scale analysis [29].
On the other hand, probe-based FMCA does not require additional processing after PCR. Therefore, it reduces the risk of contamination. The dual-labeled fluorescence probe is commonly utilized in a test known as the TaqMan assay. The 5'-3' exonuclease activity of Taq polymerase causes degradation when the double-labeled probe hybridizes with a completely complementary target sequence. As a result, the fluorescence intensity of one dye increases as the quenching effect of the other dye is removed [30]. This assay requires two probes to detect a single SNV, one complementary to the wild-type sequence and one to the mutant sequence, which must be labeled with different fluorescent dyes. The dual-labeled probe can be used for more than just hydrolysis probe assays. It can also be used for FMCA. For FMCA, the 5'-3' exonuclease activity of Taq polymerase is not required, and therefore, an enzyme lacking this activity would appear advantageous as it would not degrade the fluorescent probe. However, in practice, enzymes with 5'-3' exonuclease activity can also be used. In this study, Premix Ex Taq (Probe qPCR), which contains enzymes with 5'-3' exonuclease activity, and TaKaRa Taq HS Perfect Mix, which does not exhibit such activity, were utilized without encountering any issues. In either case, asymmetric PCR is required, in which the primer concentration of the complementary strand of the probe is much higher than the primer that amplifies the complementary strand [19]. In this study, the primer concentration of the complementary strand of the probe was 10-fold higher than the primer that amplifies the complementary strand. FMCA has some key benefits, like using one probe for SNV detection and being able to mix different fluorescence dyes, making it better than a TaqMan assay.
In our previous experiments, only a specific premix (Probe qPCR Mix MultiPlus) produced clear melting curves in triplex assays in probe-based FMCA [31]. In this experiment, however, clear melting curves were obtained with Probe qPCR Mix MultiPlus and several other premixes that had previously failed to generate adequate melting curves for analysis (data not shown). Consequently, it is hypothesized that a broad array of Taq polymerase premixes can be utilized with the primers and probe combinations employed in this study. Furthermore, the reaction mixtures containing the two types of Taq polymerase utilized in this study exhibit minimal enzyme activation time requirements, and amplification times are also brief. Given that amplification is conducted in two stages, it is hypothesized that the process from PCR amplification to FMCA analysis can be accomplished in approximately one hour. These points are regarded as the present assay's advantages.
5. Conclusions
In this study, a probe-based FMCA was developed in order to ascertain the genotypes of rs1126728 and rs11208257 in PGM1 simultaneously. The present method has the potential to facilitate association studies of these SNVs with various pathological conditions and traits, including diabetes.
Author Contributions
Conceptualization: Y.K.; methodology: Y.K.; investigation: M.S.; resources: M.S. and Y.K.; writing - original draft: M.S.; writing - review and editing: Y.K.; supervision: Y.K.
Funding
This research received no external funding.
Institutional Review Board Statement
The study was conducted in accordance with the Declaration of Helsinki and this research protocol, which uses existing anonymized genomic DNA, was reviewed and approved by the Kurume University Ethical Committee (approval number: 22158; approval date: 31 October 2022).
Informed Consent Statement
The need for patient consent was waived due to the use of existing and already anonymized DNA subjects.
Data Availability Statement
The data presented in this study are available on request from the corresponding author.
Acknowledgments
We thank Ms. Katherine Ono for editing the English in this manuscript.
Conflicts of Interest
The authors declare no conflicts of interest.
Abbreviations
The following abbreviations are used in this manuscript:
| Cy5 | cyanine 5 |
| FAM | 5-carboxyfluorescein |
| FMCA | fluorescence melting curve analysis |
| PCR-RFLP | PCR-restriction fragment length polymorphism |
| PCR-SSCP | PCR-single-strand conformation polymorphism |
| PMG | Phosphoglucomutase |
| SNV | single nucleotide variant |
| Tm | melting temperature |
References
- Muenks, A.G.; Stiers, K.M.; Beamer, L.J. Sequence-structure relationships, expression profiles, and disease-associated mutations in the paralogs of phosphoglucomutase 1. PLoS One 2017, 12, e0183563. [Google Scholar] [CrossRef]
- Spencer, N.; Hopkinson, D.A.; Harris, H. Phosphoglucomutase polymorphism in man. Nature 1964, 204, 742–745. [Google Scholar] [CrossRef] [PubMed]
- Hopkinson, D.A.; Harris, H. Rare phosphoglucomutase phenotypes. Ann Hum Genet 1966, 30, 167–181. [Google Scholar] [CrossRef] [PubMed]
- Hopkinson, D.A.; Harris, H. A third phosphoglucomutase locus in man. Ann Hum Genet 1968, 31, 359–367. [Google Scholar] [CrossRef] [PubMed]
- Cantu, J.M.; Ibarra, B. Phosphoglucomutase: evidence for a new locus expressed in human milk. Science 1982, 216, 639–640. [Google Scholar] [CrossRef]
- Edwards, Y.H.; Putt, W.; Fox, M.; Ives, J.H. A novel human phosphoglucomutase (PGM5) maps to the centromeric region of chromosome 9. Genomics 1995, 30, 350–353. [Google Scholar] [CrossRef]
- McAlpine, P.J.; Hopkinson, D.A.; Harris, H. The relative activities attributable to the three phosphoglucomutase loci (PGM1, PGM2, PGM3) in human tissues. Ann Hum Genet 1970, 34, 169–175. [Google Scholar] [CrossRef]
- Kuhnl, P.; Schmidtmann, U.; Spielmann, W. Evidence for two additional common alleles at the PGM1 locus (phosphoglucomutase--E.C.: 2.7.5.1). A comparison by three different techniques. Hum Genet 1977, 35, 219–223. [Google Scholar] [CrossRef]
- March, R.E.; Putt, W.; Hollyoake, M.; Ives, J.H.; Lovegrove, J.U.; Hopkinson, D.A.; Edwards, Y.H.; Whitehouse, D.B. The classical human phosphoglucomutase (PGM1) isozyme polymorphism is generated by intragenic recombination. Proc Natl Acad Sci U S A 1993, 90, 10730–10733. [Google Scholar] [CrossRef]
- Takahashi, N.; Neel, J.V. Intragenic recombination at the human phosphoglucomutase 1 locus: predictions fulfilled. Proc Natl Acad Sci U S A 1993, 90, 10725–10729. [Google Scholar] [CrossRef]
- Scacchi, R.; Corbo, R.M.; Palmarino, R.; Sacco, G.; Arnone, M.; Lucarelli, P. Human phosphoglucomutase locus 1: red cell enzymatic activities associated with common isoelectric focusing phenotypes. Hum Hered 1983, 33, 218–222. [Google Scholar] [CrossRef] [PubMed]
- Lee, Y.; Stiers, K.M.; Kain, B.N.; Beamer, L.J. Compromised catalysis and potential folding defects in in vitro studies of missense mutants associated with hereditary phosphoglucomutase 1 deficiency. J Biol Chem 2014, 289, 32010–32019. [Google Scholar] [CrossRef] [PubMed]
- Gururaj, A.; Barnes, C.J.; Vadlamudi, R.K.; Kumar, R. Regulation of phosphoglucomutase 1 phosphorylation and activity by a signaling kinase. Oncogene 2004, 23, 8118–8127. [Google Scholar] [CrossRef] [PubMed]
- Gloria-Bottini, F.; Magrini, A.; Antonacci, E.; La Torre, M.; Di Renzo, L.; De Lorenzo, A.; Bergamaschi, A.; Bottini, E. Phosphoglucomutase genetic polymorphism and body mass. Am J Med Sci 2007, 334, 421–425. [Google Scholar] [CrossRef]
- Gloria-Bottini, F.; Lucarini, N.; Palmarino, R.; La Torre, M.; Nicotra, M.; Borgiani, P.; Cosmi, E.; Bottini, E. Phosphoglucomutase genetic polymorphism of newborns. Am J Hum Biol 2001, 13, 9–14. [Google Scholar] [CrossRef]
- Inshaw, J.R.J.; Sidore, C.; Cucca, F.; Stefana, M.I.; Crouch, D.J.M.; McCarthy, M.I.; Mahajan, A.; Todd, J.A. Analysis of overlapping genetic association in type 1 and type 2 diabetes. Diabetologia 2021, 64, 1342–1347. [Google Scholar] [CrossRef]
- Kumar, K.P.; Kamarthy, P.; Balakrishna, S.; Manu, M.; Ramaswamy, S. Association between phosphoglucomutase-1 gene y420h polymorphism and type 2 diabetes mellitus: A Case-control study. Arch Med Health Sci 2021, 9, 225. [Google Scholar] [CrossRef]
- El Housni, H.; Heimann, P.; Parma, J.; Vassart, G. Single-nucleotide polymorphism genotyping by melting analysis of dual-labeled probes: examples using factor V Leiden and prothrombin 20210A mutations. Clin Chem 2003, 49, 1669–1672. [Google Scholar] [CrossRef]
- Huang, Q.; Liu, Z.; Liao, Y.; Chen, X.; Zhang, Y.; Li, Q. Multiplex fluorescence melting curve analysis for mutation detection with dual-labeled, self-quenched probes. PLoS One 2011, 6, e19206. [Google Scholar] [CrossRef]
- Soejima, M.; Koda, Y. Estimation of Lewis blood group status by fluorescence melting curve analysis in simultaneous genotyping of c.385A>T and fusion gene in FUT2 and c.59T>G and c.314C>T in FUT3. Diagnostics (Basel) 2023, 13. [Google Scholar] [CrossRef]
- Untergasser, A.; Cutcutache, I.; Koressaar, T.; Ye, J.; Faircloth, B.C.; Remm, M.; Rozen, S.G. Primer3--new capabilities and interfaces. Nucleic Acids Res 2012, 40, e115. [Google Scholar] [CrossRef]
- Soejima, M.; Koda, Y. FUT2 polymorphism in Latin American populations. Clin Chim Acta 2020, 505, 1–5. [Google Scholar] [CrossRef]
- Conte, F.; Morava, E.; Bakar, N.A.; Wortmann, S.B.; Poerink, A.J.; Grunewald, S.; Crushell, E.; Al-Gazali, L.; de Vries, M.C.; Morkrid, L.; et al. Phosphoglucomutase-1 deficiency: Early presentation, metabolic management and detection in neonatal blood spots. Mol Genet Metab 2020, 131, 135–146. [Google Scholar] [CrossRef]
- Solin, M.L.; Kaartinen, M. Allelic polymorphism of mouse Igh-J locus, which encodes immunoglobulin heavy chain joining (JH) segments. Immunogenetics 1992, 36, 306–313. [Google Scholar] [CrossRef] [PubMed]
- Higuchi, R.; von Beroldingen, C.H.; Sensabaugh, G.F.; Erlich, H.A. DNA typing from single hairs. Nature 1988, 332, 543–546. [Google Scholar] [CrossRef] [PubMed]
- Suzuki, Y.; Orita, M.; Shiraishi, M.; Hayashi, K.; Sekiya, T. Detection of ras gene mutations in human lung cancers by single-strand conformation polymorphism analysis of polymerase chain reaction products. Oncogene 1990, 5, 1037–1043. [Google Scholar] [PubMed]
- Heid, C.A.; Stevens, J.; Livak, K.J.; Williams, P.M. Real time quantitative PCR. Genome Res 1996, 6, 986–994. [Google Scholar] [CrossRef]
- Cheng, C.; Fei, Z.; Xiao, P. Methods to improve the accuracy of next-generation sequencing. Front Bioeng Biotechnol 2023, 11, 982111. [Google Scholar] [CrossRef]
- Hippman, C.; Nislow, C. Pharmacogenomic testing: Clinical evidence and implementation challenges. J Pers Med 2019, 9. [Google Scholar] [CrossRef]
- Lee, L.G.; Connell, C.R.; Bloch, W. Allelic discrimination by nick-translation PCR with fluorogenic probes. Nucleic Acids Res 1993, 21, 3761–3766. [Google Scholar] [CrossRef]
- Soejima, M.; Koda, Y. Simultaneous genotyping of three nonsynonymous SNVs, rs1042602, rs1426654, and rs16891982 involved in skin pigmentation by fluorescent probe-based melting curve analysis. Hum Mutat 2025, 2025, 3468799. [Google Scholar] [CrossRef]
Figure 1.
Melting-curve patterns to determine the rs1126728 and rs11208257 genotypes of PGM1 in selected Japanese subjects. (a) and (b): Subjects with the rs1126728 C/C genotype (blue), C/T genotype (red), or T/T genotype (green) could be clearly separated. Light blue represents the negative control. (c) and (d): Subjects with the rs11208257 C/C genotype (green), C/T genotype (red), or T/T (blue) could also be clearly separated. Light blue represents the negative control. (a) and (c) used Premix Ex Taq (Probe qPCR), and (b) and (d) used TaKaRa Taq HS Perfect Mix.
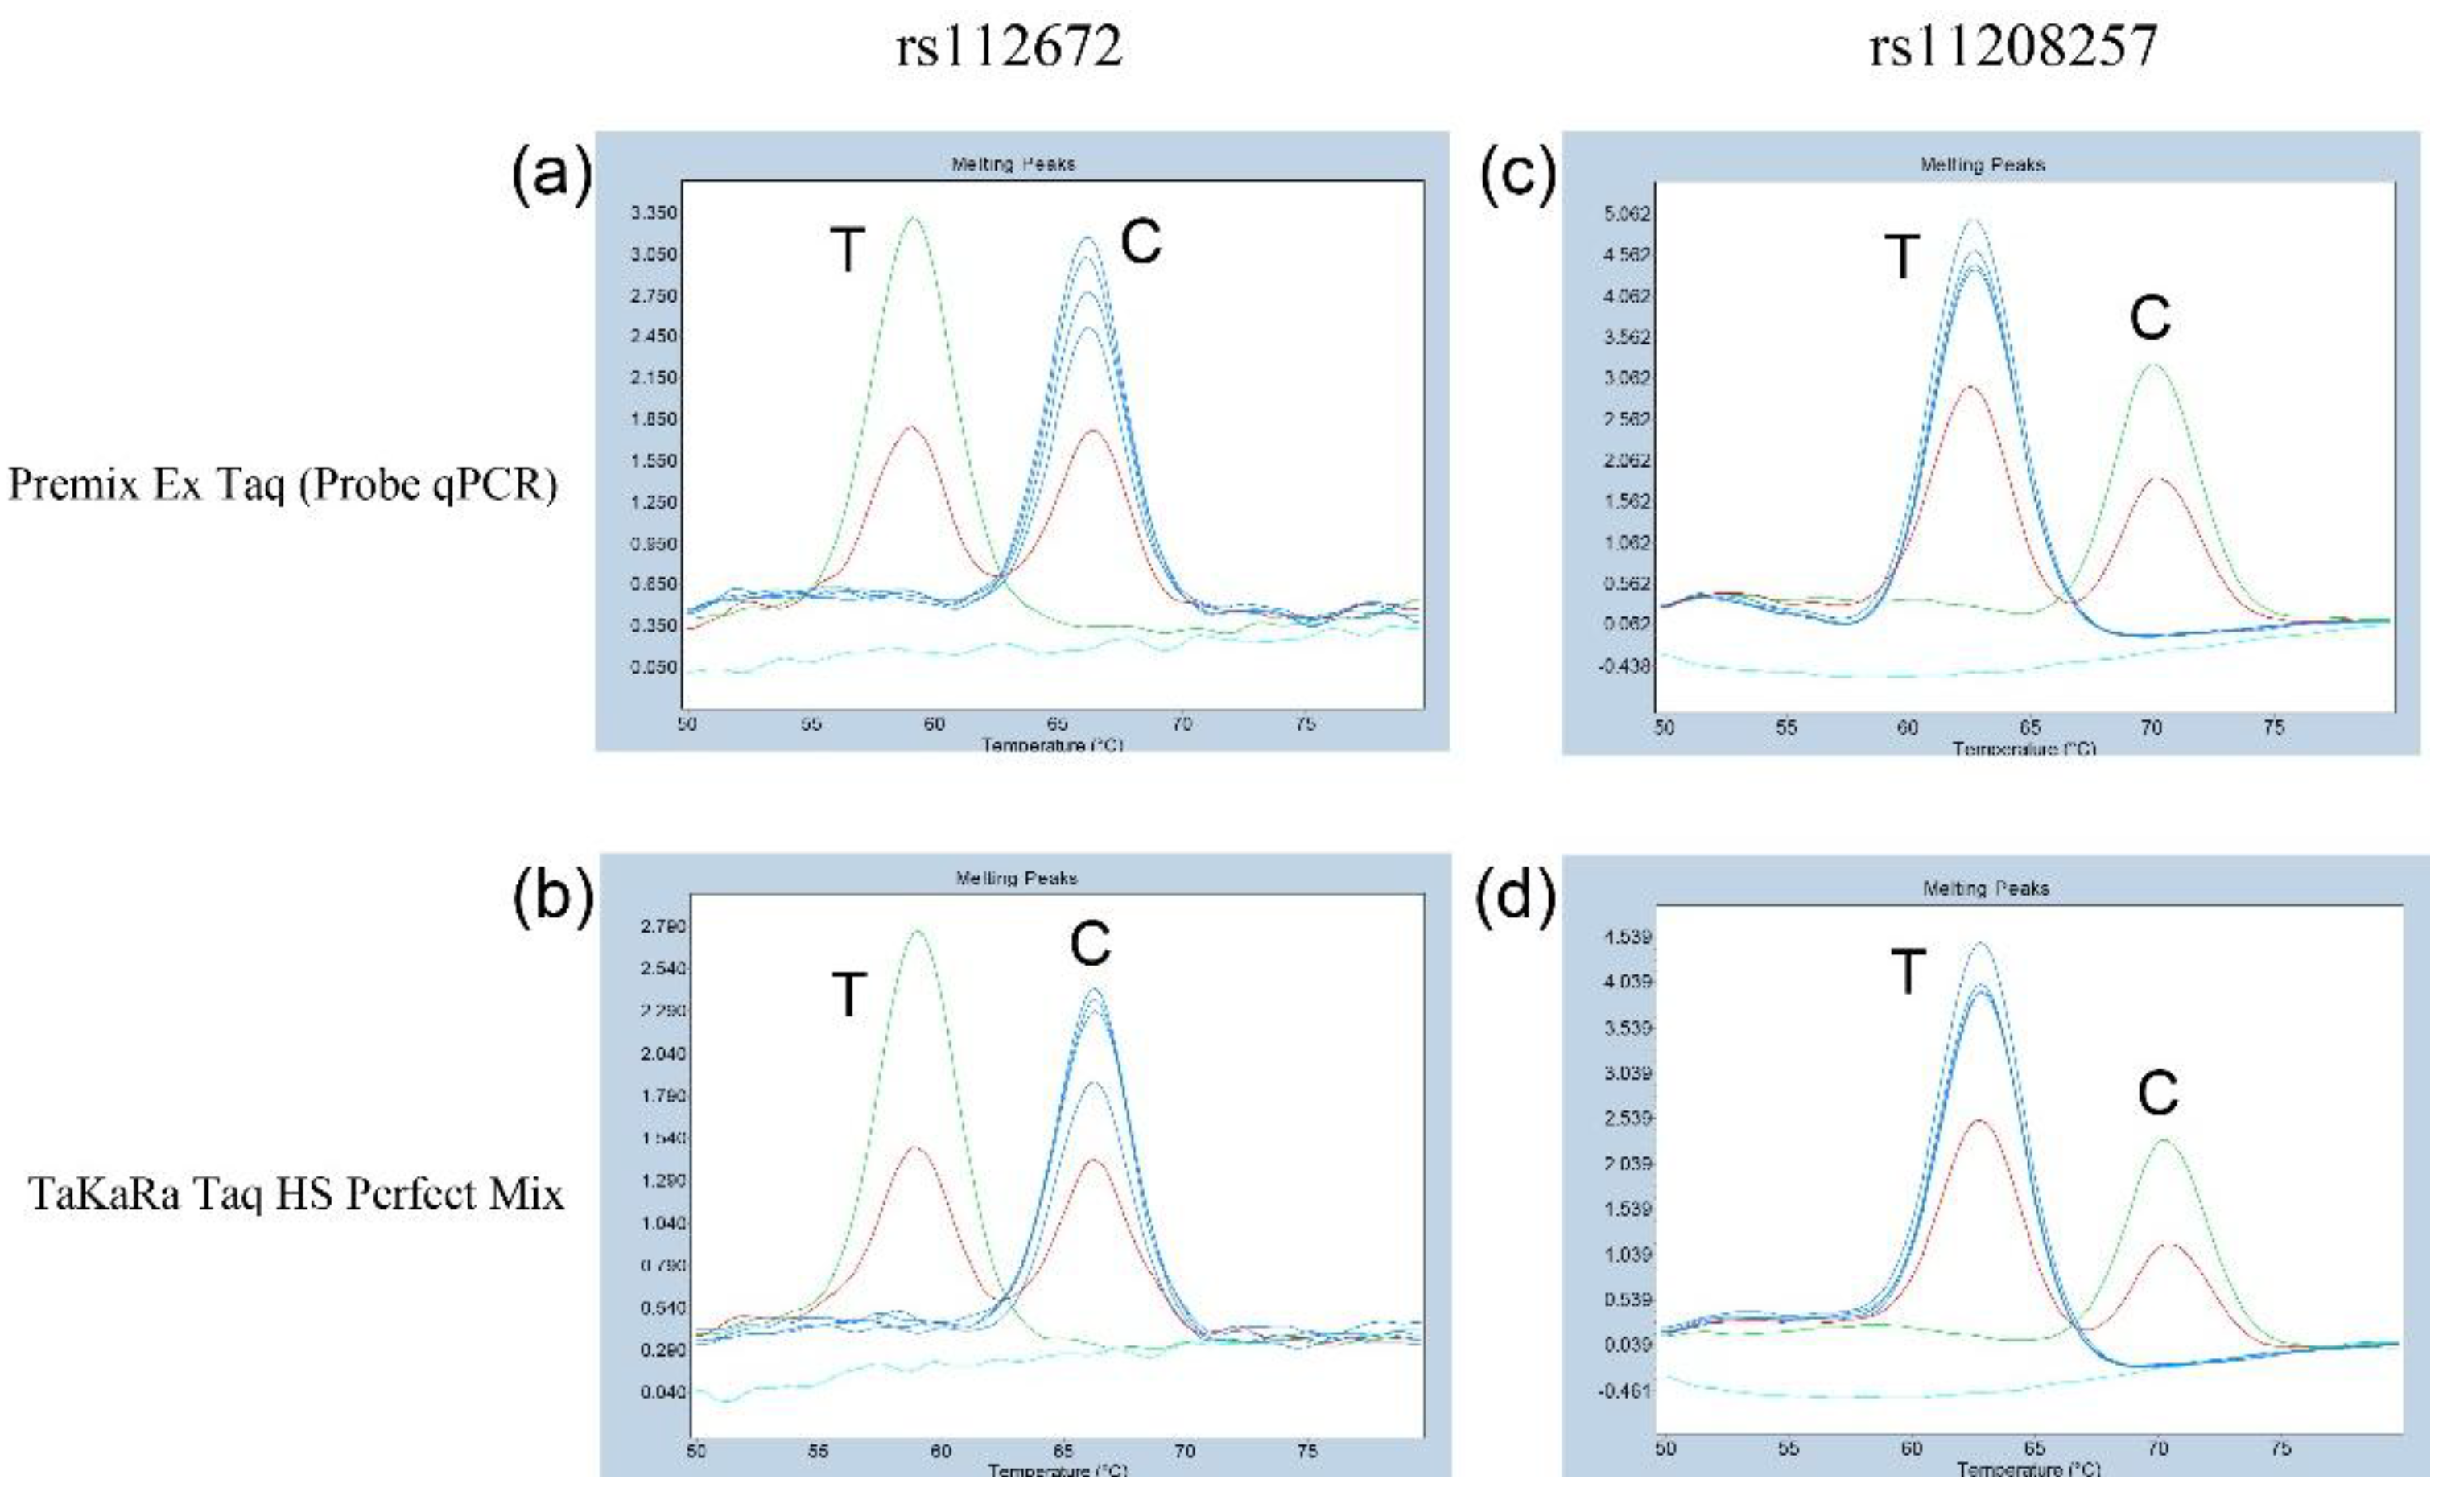
Figure 2.
Melting-curve patterns to determine the rs1126728 and rs11208257 genotypes of PGM1 in 95 Japanese subjects. (a) and (b): Subjects with the rs1126728 C/C genotype (blue), C/T genotype (red), and T/T genotype (green) could be clearly separated. Light blue represents the negative control. (c) and (d): Subjects with the rs11208257 C/C genotype (green), C/T genotype (red), and T/T genotype (blue) could also be clearly separated. Light blue represents the negative control. (a) and (c) used Premix Ex Taq (Probe qPCR), and (b) and (d) used TaKaRa Taq HS Perfect Mix.
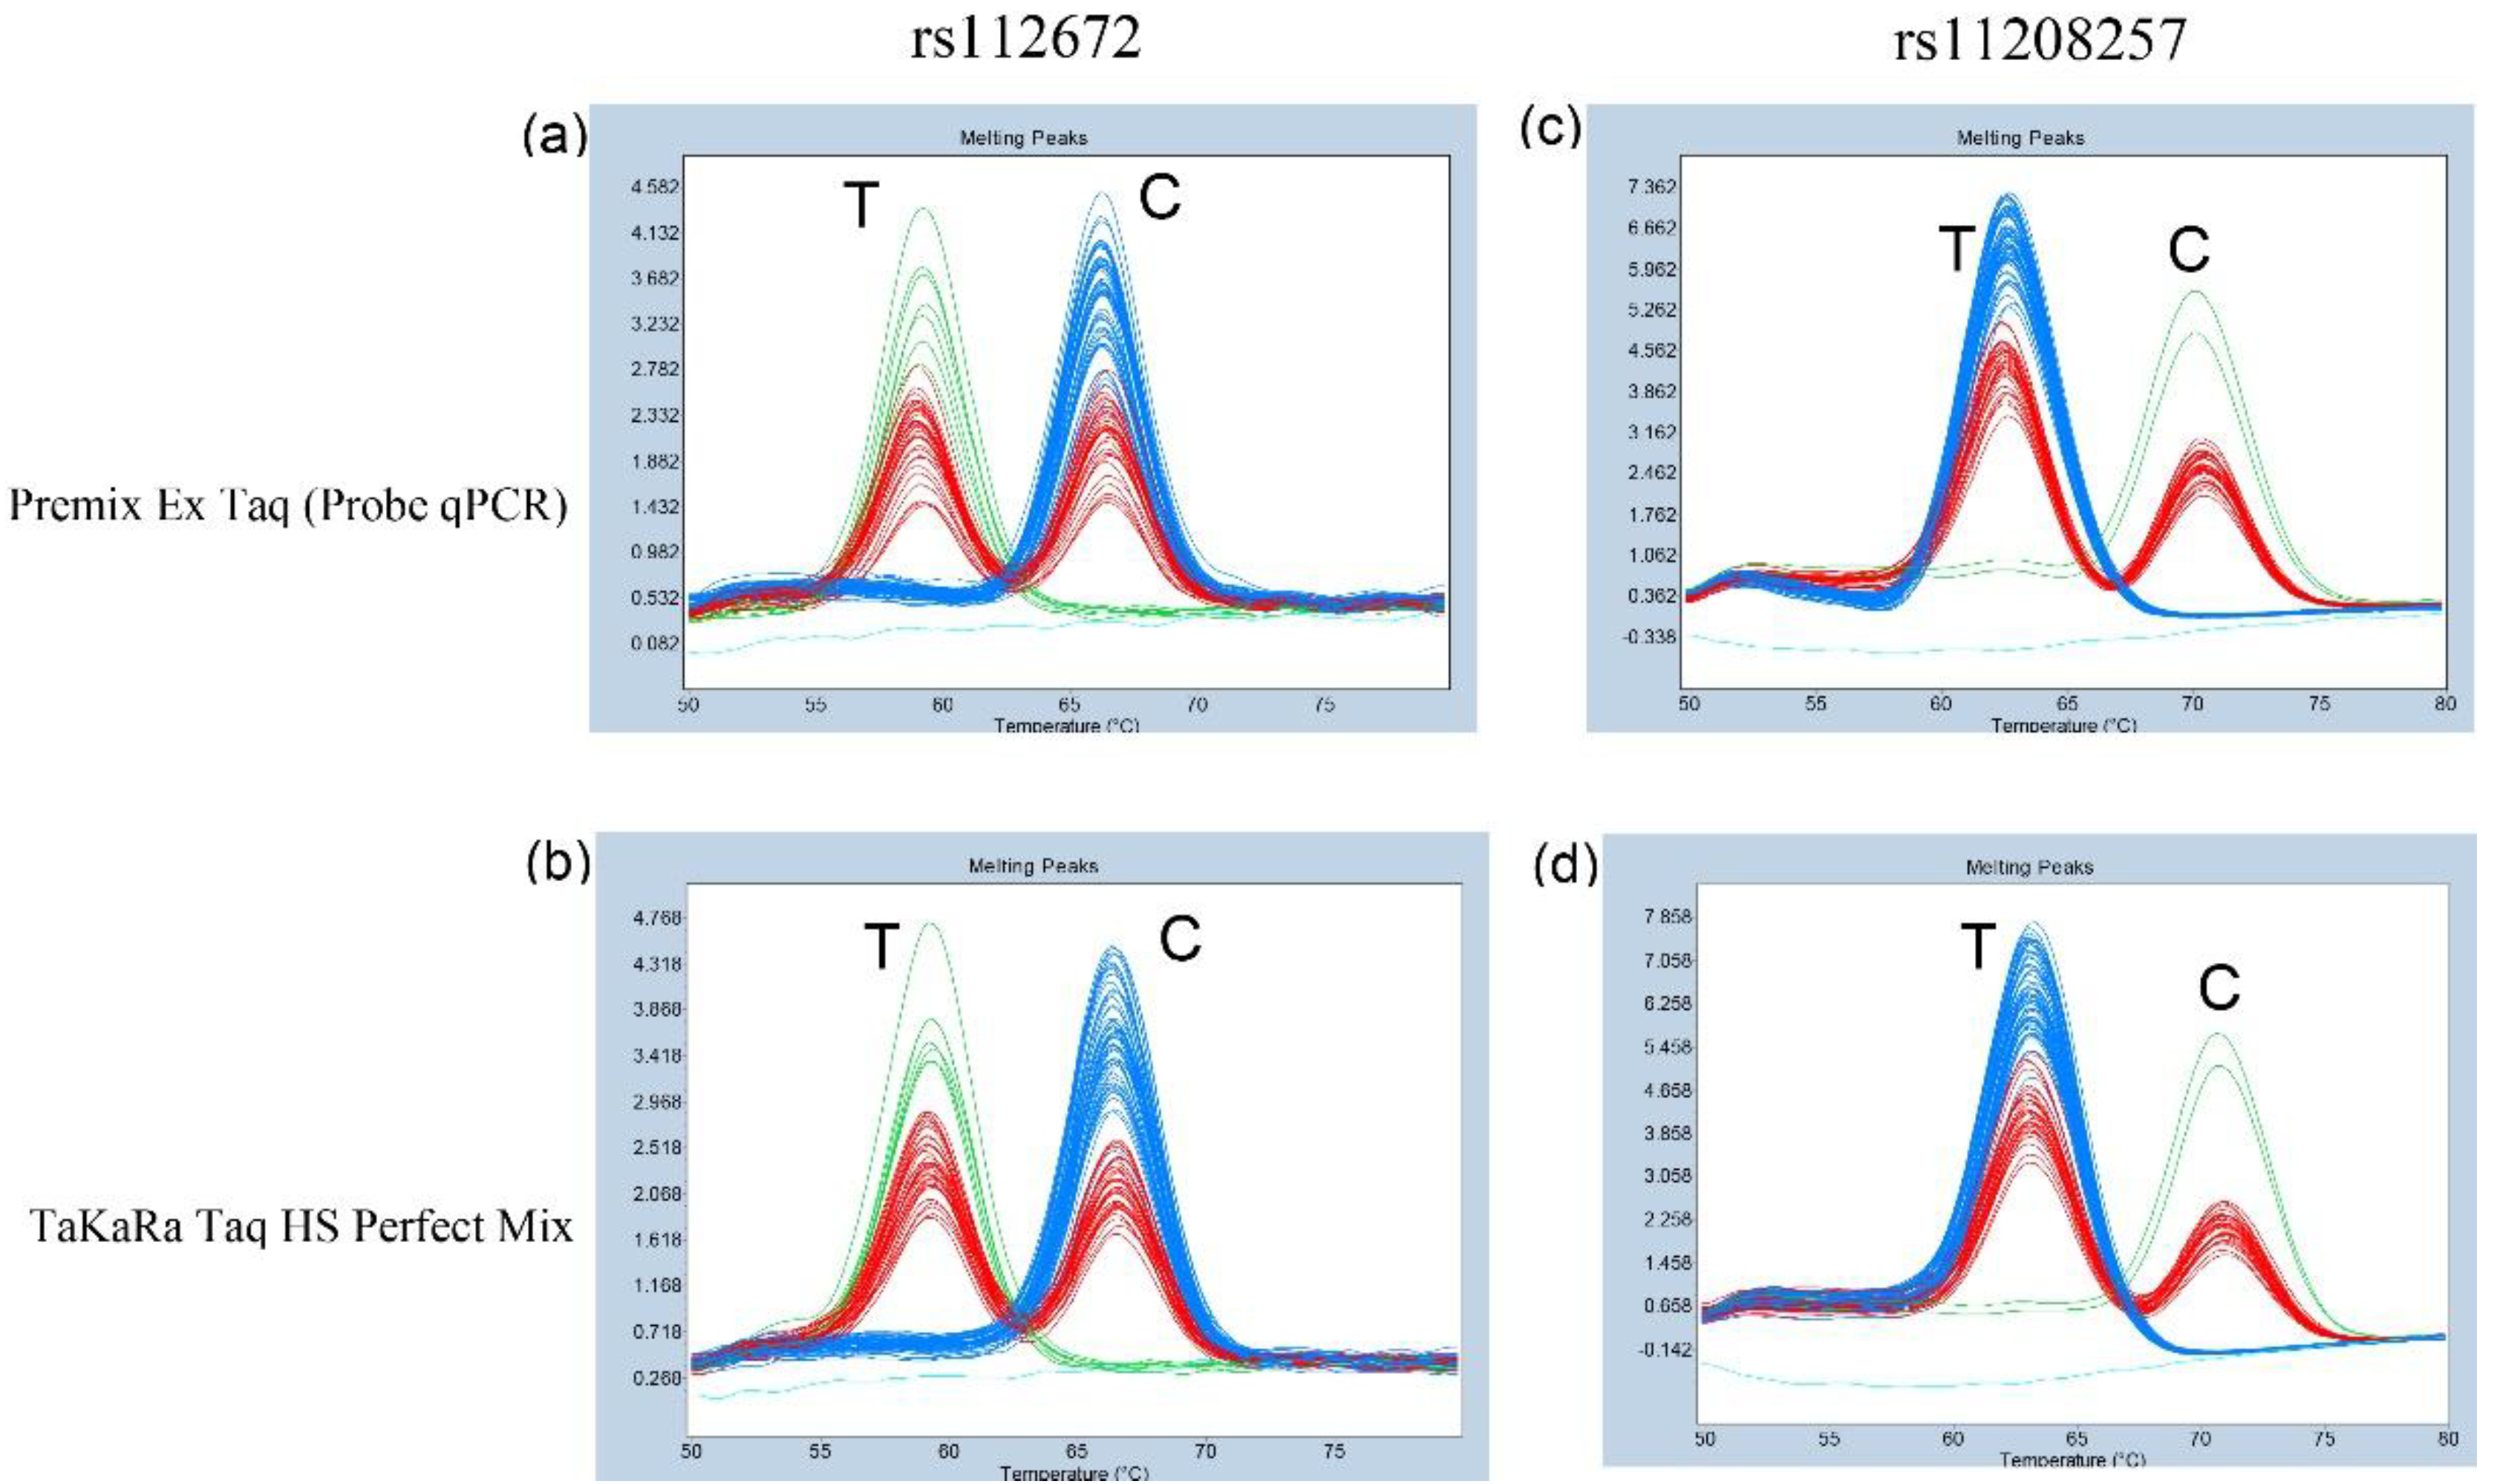

Table 1.
Allele frequencies of rs1126728 and rs11208257 and estimated PGM1 phenotypes of 95 Japanese subjects.
Table 1.
Allele frequencies of rs1126728 and rs11208257 and estimated PGM1 phenotypes of 95 Japanese subjects.
| rs1126728 | rs11208257 | Estimated phenotype |
Number of subjects |
||||
| Melting temperature |
Genotype | Estimated phenotype | Melting temperature |
Genotype | Estimated phenotype | ||
| High | C/C | 1/1 | High | C/C | -/- | 1-/1- | 1 |
| Double | C/T | +/- | 1+/1- | 15 | |||
| Low | T/T | +/+ | 1+/1+ | 39 | |||
| Double | C/T | 1/2 | High | C/C | -/- | 1-/2- | 1 |
| Double | C/T | +/- | 1+/2- or 1-/2+ | 14 | |||
| Low | T/T | +/+ | 1+/2+ | 18 | |||
| Low | T/T | 2/2 | High | C/C | -/- | 2-/2- | 0 |
| Double | C/T | +/- | 2+/2- | 0 | |||
| Low | T/T | +/+ | 2+/2+ | 7 | |||
Disclaimer/Publisher’s Note: The statements, opinions and data contained in all publications are solely those of the individual author(s) and contributor(s) and not of MDPI and/or the editor(s). MDPI and/or the editor(s) disclaim responsibility for any injury to people or property resulting from any ideas, methods, instructions or products referred to in the content. |
© 2025 by the authors. Licensee MDPI, Basel, Switzerland. This article is an open access article distributed under the terms and conditions of the Creative Commons Attribution (CC BY) license (http://creativecommons.org/licenses/by/4.0/).
Copyright: This open access article is published under a Creative Commons CC BY 4.0 license, which permit the free download, distribution, and reuse, provided that the author and preprint are cited in any reuse.


