
Submitted:
25 August 2025
Posted:
26 August 2025
You are already at the latest version
Abstract
Reliable land cover (LC) information is essential for scaling plot-based measurements in National Forest Inventories (NFIs). This study assessed the impact of using remote sensing (RS)-derived LC compared with field-assigned LC on the precision of key forest indicators in Bangladesh’s NFI (2015–2019). Field data from 1,781 plots were integrated with a 2015 national LC map produced from SPOT-6/7, Landsat, and Sentinel-2 imagery. Sampling errors of forest indicator estimates were evaluated across LC classes and ecological zones. Results show that RS derived LC reduced sampling errors for most biomass related indicators, including above- and below-ground biomass, tree volume, basal area, and carbon pools, by 15–20% on average, with some reductions exceeding 50%. Improvements were less consistent for regeneration related indicators (saplings, seedlings). These findings highlight the advantages of RS derived LC for improving NFI precision, while underscoring the continued need for advancing ontology driven approaches with necessary strengthening of field crew capacity to ensure consistent application of land cover standards.
Keywords:
land cover standards
; knowledge representation
; indicator assessment
; land cover mapping
; remote sensing
; field survey
; uncertainty
; national forest inventory
; LCML
; REDD+
1. Introduction
Accurate and reliable land cover (LC) information is essential for environmental monitoring, land management, and global reporting initiatives such as Reducing Emissions from Deforestation and forest Degradation (REDD+) and the Sustainable Development Goals (e.g., SDG 15) [1,2]. National forest inventories, global reporting frameworks, and spatial decision support systems all depend on robust LC data to estimate forest extent, land use change, and biophysical indicators including tree density, above-ground biomass (AGB), growing stock and carbon stocks in different pools [2,3]. The increasing urgency of climate change mitigation and the growing demand for transparent forest carbon accounting under international frameworks have intensified the need for precise and cost-effective land cover data collection methods [4].
Land cover data are typically derived from either sample-based field observations or wall-to-wall maps generated through remote sensing (RS) [5]. Field-based data are often regarded as the most accurate source of LC information due to their direct, ground level perspective. The implicit assumption in much of the literature is that field-based land cover information provides better accuracy and lower uncertainty, with RS products considered less precise due to misclassification errors [6,7]. However, these assumptions are not always empirically tested or contextually validated, particularly in tropical environments where field surveys face significant logistical constraints, observer subjectivity, and accessibility limitations [8]. Recent advances in remote sensing, particularly the availability of free satellite data (e.g., Landsat, Sentinel) and the application of machine learning algorithms, have made RS-based mapping increasingly consistent, scalable and operationally feasible [9,10,11]. The integration of multisensor data, including optical (e.g., Landsat 8, Sentinel 2), radar (e.g., Sentinel 1) and lidar (e.g., GEDI), has further enhanced land cover mapping capabilities, especially in cloud-prone tropical regions [12,13].
This article compares the precision of forest inventory estimates based on land cover data from remote sensing and that from direct field observations. Results reveal that, in most cases, the sampling error associated with field-based estimates is higher than that of RS-derived estimates, suggesting a need to revisit common assumptions regarding the superiority of field data for land cover. The findings highlight the potential of remote sensing-based land cover information as a reliable, spatially explicit, and scalable alternative for estimating land-based indicators. This has important implications for national forest monitoring, REDD+ reporting, and the design of targeted interventions, especially in data-sparse environments.
The Bangladesh National Forest Inventory provides an ideal case study for examining these methodological questions due to its representative tropical forest conditions, ongoing deforestation pressures, limited technical resources typical of developing countries, and the urgent need for reliable forest monitoring to support climate reporting and sustainable forest management objectives. The insights from this study offers broader relevance for forest inventory design and land cover monitoring systems in similar settings, where balancing accuracy, cost-efficieny, and international reporting needs remains a persistent challenge.
2. Materials and Methods
The Bangladesh National Forest Inventory (NFI) was designed as a multipurpose system integrating biophysical measurements, socio-economic surveys, and remote sensing–based land cover mapping. The design process followed international best practices and was developed in consultation with national and international experts. The aim was to generate consistent, statistically robust, and spatially explicit estimates of tree and forest resources to support both national decision-making and international reporting requirements [14,15].
2.1. Satellite-Based Land Cover Map Development
A National Land Representation System (NLRS) was developed for Bangladesh [16] using the Land Cover Classification System (LCCS v3) [17], in compliance with the Land Cover Meta Language (LCML, ISO 19144-2). This framework was created through multiple steps, including compiling existing legends from national land cover/use maps, translating them into LCML terms, and identifying gaps in class definitions. The process supported consistent interpretation of land cover classes while accommodating the objectives of national institutions involved in land cover mapping.
Field data were collected from 1,144 locations across Bangladesh using Open Foris Collect [18] to characterize NLRS classes ([19]. Initial draft legend classes were developed through an expert workshop, and subsequently refined during map production. Some classes were subdivided (e.g., bamboo forest, rubber plantation), while others were merged (e.g., short- and long-rotation plantations into a general “forest plantation” category) where spectral differences could not be distinguished in satellite imagery. The final 2015 land cover map included 33 classes.
Map development was primarily based on multispectral SPOT-6/7 ortho Level-3 images (6 m resolution, ≤10% cloud cover). An Object-Based Image Analysis (OBIA) approach using a multi-resolution segmentation algorithm was applied to generate image objects from green, red, and near-infrared bands. Segments were assigned land cover codes through expert visual interpretation. Manual digitization was used when automated segmentation did not align with recognizable geo-objects. Seasonal dynamics, especially in croplands and wetlands, were accounted for by incorporating Landsat 8 and Sentinel-2 imagery from multiple seasons.
Quality assurance was performed throughout the production chain using spatial topology, attribute consistency checks, expert review, and field validation. Accuracy assessment was based on stratified random sampling by district and land cover class, combined with visual interpretation of very high-resolution imagery, following the recommendations in Olofsson, et al. [20]. The overall accuracy was estimated at 89%. Full details of the methodology, adjusted area estimates, and uncertainty measures are provided in Jalal, et al. [20].
2.2. Field Inventory
2.2.1. Design
The Bangladesh Forest Inventory (BFI) employed a stratified random sampling design, with five zones (Sal, Sundarbans, Hill, Coastal, and Village) used as strata (Figure 1). These zones capture major differences in forest types, soils, and land use, and allow stratified estimates with variable sampling intensities to improve precision. The number of plots in each zone was optimized using the Forest Resource Inventory, Edit and Design (FRIED) tool to minimize costs while achieving ±5–10% precision (90% confidence level) for key indicators such as biomass and tree density.
Sample plot layouts consisted of clusters of circular subplots (Figure 2): five subplots in the Sal, Hill, Village, and Coastal zones, and three subplots in the Sundarbans due to logistical constraints. Each subplot had a 19 m radius and contained concentric nested plots of 8 m and 2.5 m radii to measure trees at different diameter thresholds. Subplot centers were spaced 38 m apart in cardinal directions.
To determine the plot locations, a hexagonal grid reflecting the desired stratum sample size was constructed as the sampling frame, such that the hexagon area was the stratum area divided by the stratum sample size. One plot from the grid was randomly selected in each hexagonal grid cell.
2.2.2. Field Data Collection
Data were collected on plot location, land features, live and dead trees, bamboo, saplings, seedlings, down woody debris, and forest health using digital forms in the Open Foris Collect Mobile app on tablets. Data were uploaded to an online repository and periodically converted into standard formats (CSV, XML) via the desktop version for validation. Automated validation checks included data type constraints, range limits, missing values, and logical consistency across fields. In total, 1,781 plots (out of 1,858 planned) were measured, with 1,480 fully accessible and 301 partially accessible, representing 96% coverage.
2.3. Land Cover Class Area Estimation
Land feature related information, i.e. land cover, canopy cover, vegetation type, crown density, was collected at the plot level during the field survey. Field teams assigned land cover classes defined for the national land cover map 2015 derived from the National Land Representation System (NLRS) [20]. For each plot, the teams also recorded the proportion of subplots covered by each observed land cover type. To facilitate accurate estimation of these proportions, field teams used standardized tools and methods outlined in the field enumeration guidelines [21], including measuring tapes, compasses, and grid overlays. In parallel, land cover area was also estimated using the remote sensing (RS)-based land cover map. For this, subplot boundaries were spatially overlaid with the RS-derived land cover map, allowing land cover classes and their respective areas to be calculated directly within each subplot.
These subplot-level land cover proportions, from field survey and land cover map, were then used to estimate the sampled area for each land cover type within a plot, which formed the basis for assessing indicators. The land cover classes area were estimated using ratio to size approach applying Eq 1 and Eq 2 as below:
where:
pid = area of plot i in domain of interest d (i.e., Hill Forest area or the area of any category of interest)
ai = area measured on plot i (this excludes inaccessible or out-of-population areas)
A = total area in the population
The variance of the extent of land cover area within each strata was estimated using the (Eq 3 and 4) as follows:
Variance of the total area of the LCC of interest at stratum level, -
where,
n = number of plots that fall (even partially) in the population.
The variance for the total area estimates of each land cover class at national level was estimated using Eq 5 as follows:
2.4. Assessment of Indicators
Two sets of land cover data were generated and evaluated: direct field-collected data, and remote sensing based land cover map. Each dataset was independently used to estimate key indicators of the Bangladesh National Forest Inventory (NFI), including tree density, above-ground biomass, growing stock, and carbon across different pools. Detail estimation procedures are available in [22]. The precision of the two datasets was assessed using the sampling error, expressed as the coefficient of variation (%). For the uncertainty analysis, only those land cover classes recorded in at least 10 field plots were included to ensure adequate sample representation.
3. Results
Figure 3 presents the percentage change in sampling error of indicator estimates when using RS-derived land cover compared with field-survey-based land cover data. Differences are expressed relative to the field-based sampling error.
Note: BNl - Built-Up Non-Linear; FDp - Plain Land Forest (Sal Forest); FH - Hill Forest; FMp - Mangrove Plantation; FP - Forest Plantation; FPr - Rubber Plantation; H - Herb Dominated Area; NMF - Mangrove Forest; OS - Orchards and Other Plantations (Shrub); OT - Orchards and Other Plantations (Trees); PCm - Multiple Crop; PCs - Single Crop; RB - River Banks; RS - Rural Settlement.
Across most indicators, RS-derived land cover substantially reduced sampling error. The largest improvements were observed for tree volume, where the average reduction was about −19% (median reduction −21%), with allmost all classes show decreases. Similarly, above-ground biomass (AGB) and its associated carbon pool showed average reductions of −16%. Forest plantation (FP) classes achieved reduction exceeding −50%, underscoring the strong precision gains when RS-based land cover was used. Below-ground biomass (BGB) and carbon in BGB showed nearly identical outcomes, with average reductions of −16% and Forest plantation (FP) reaching up to −57% improvement. Basal area followed a similar pattern, with an average reduction of −15% and a median close to −23%. For dead biomass sampling error also reduced with RS based approach, though slightly less strongly, with average reductions of about −14%. For most forest-related classes, RS-based estimation consistently lowered the sampling error for these indicators.
In contrast, structural and regeneration related indicators showed more variability. Tree and sapling density showed an overall reduction (mean −15%, median −25%), but some land cover classes such as Orchards and Other Plantations (Shrub) (OS) exhibited sharp increases, with sampling error rising by up to +86%. Sapling density was even more variable, averaging a +8% increase, with values ranging from a reduction of −26% in some classes to an increase of more than +115% in others. Seedling density also displayed large variability, with an overall increase of +10% on average and extremes ranging from −35% to +91%. These indicators highlight the difficulty of capturing fine-scale structural heterogeneity of young vegetation using RS-derived land cover.
Overall, the results indicate that RS-derived land cover consistently improves the precision of biomass-related indicators (AGB, BGB, basal area, tree volume, and carbon pools), with average reductions in sampling error of 15–20% and maximum reductions exceeding 50%. Improvements are more modest for dead biomass, while sapling and seedling density show increased sampling error, reflecting the greater challenge of classifying heterogeneous or dynamic vegetation types.
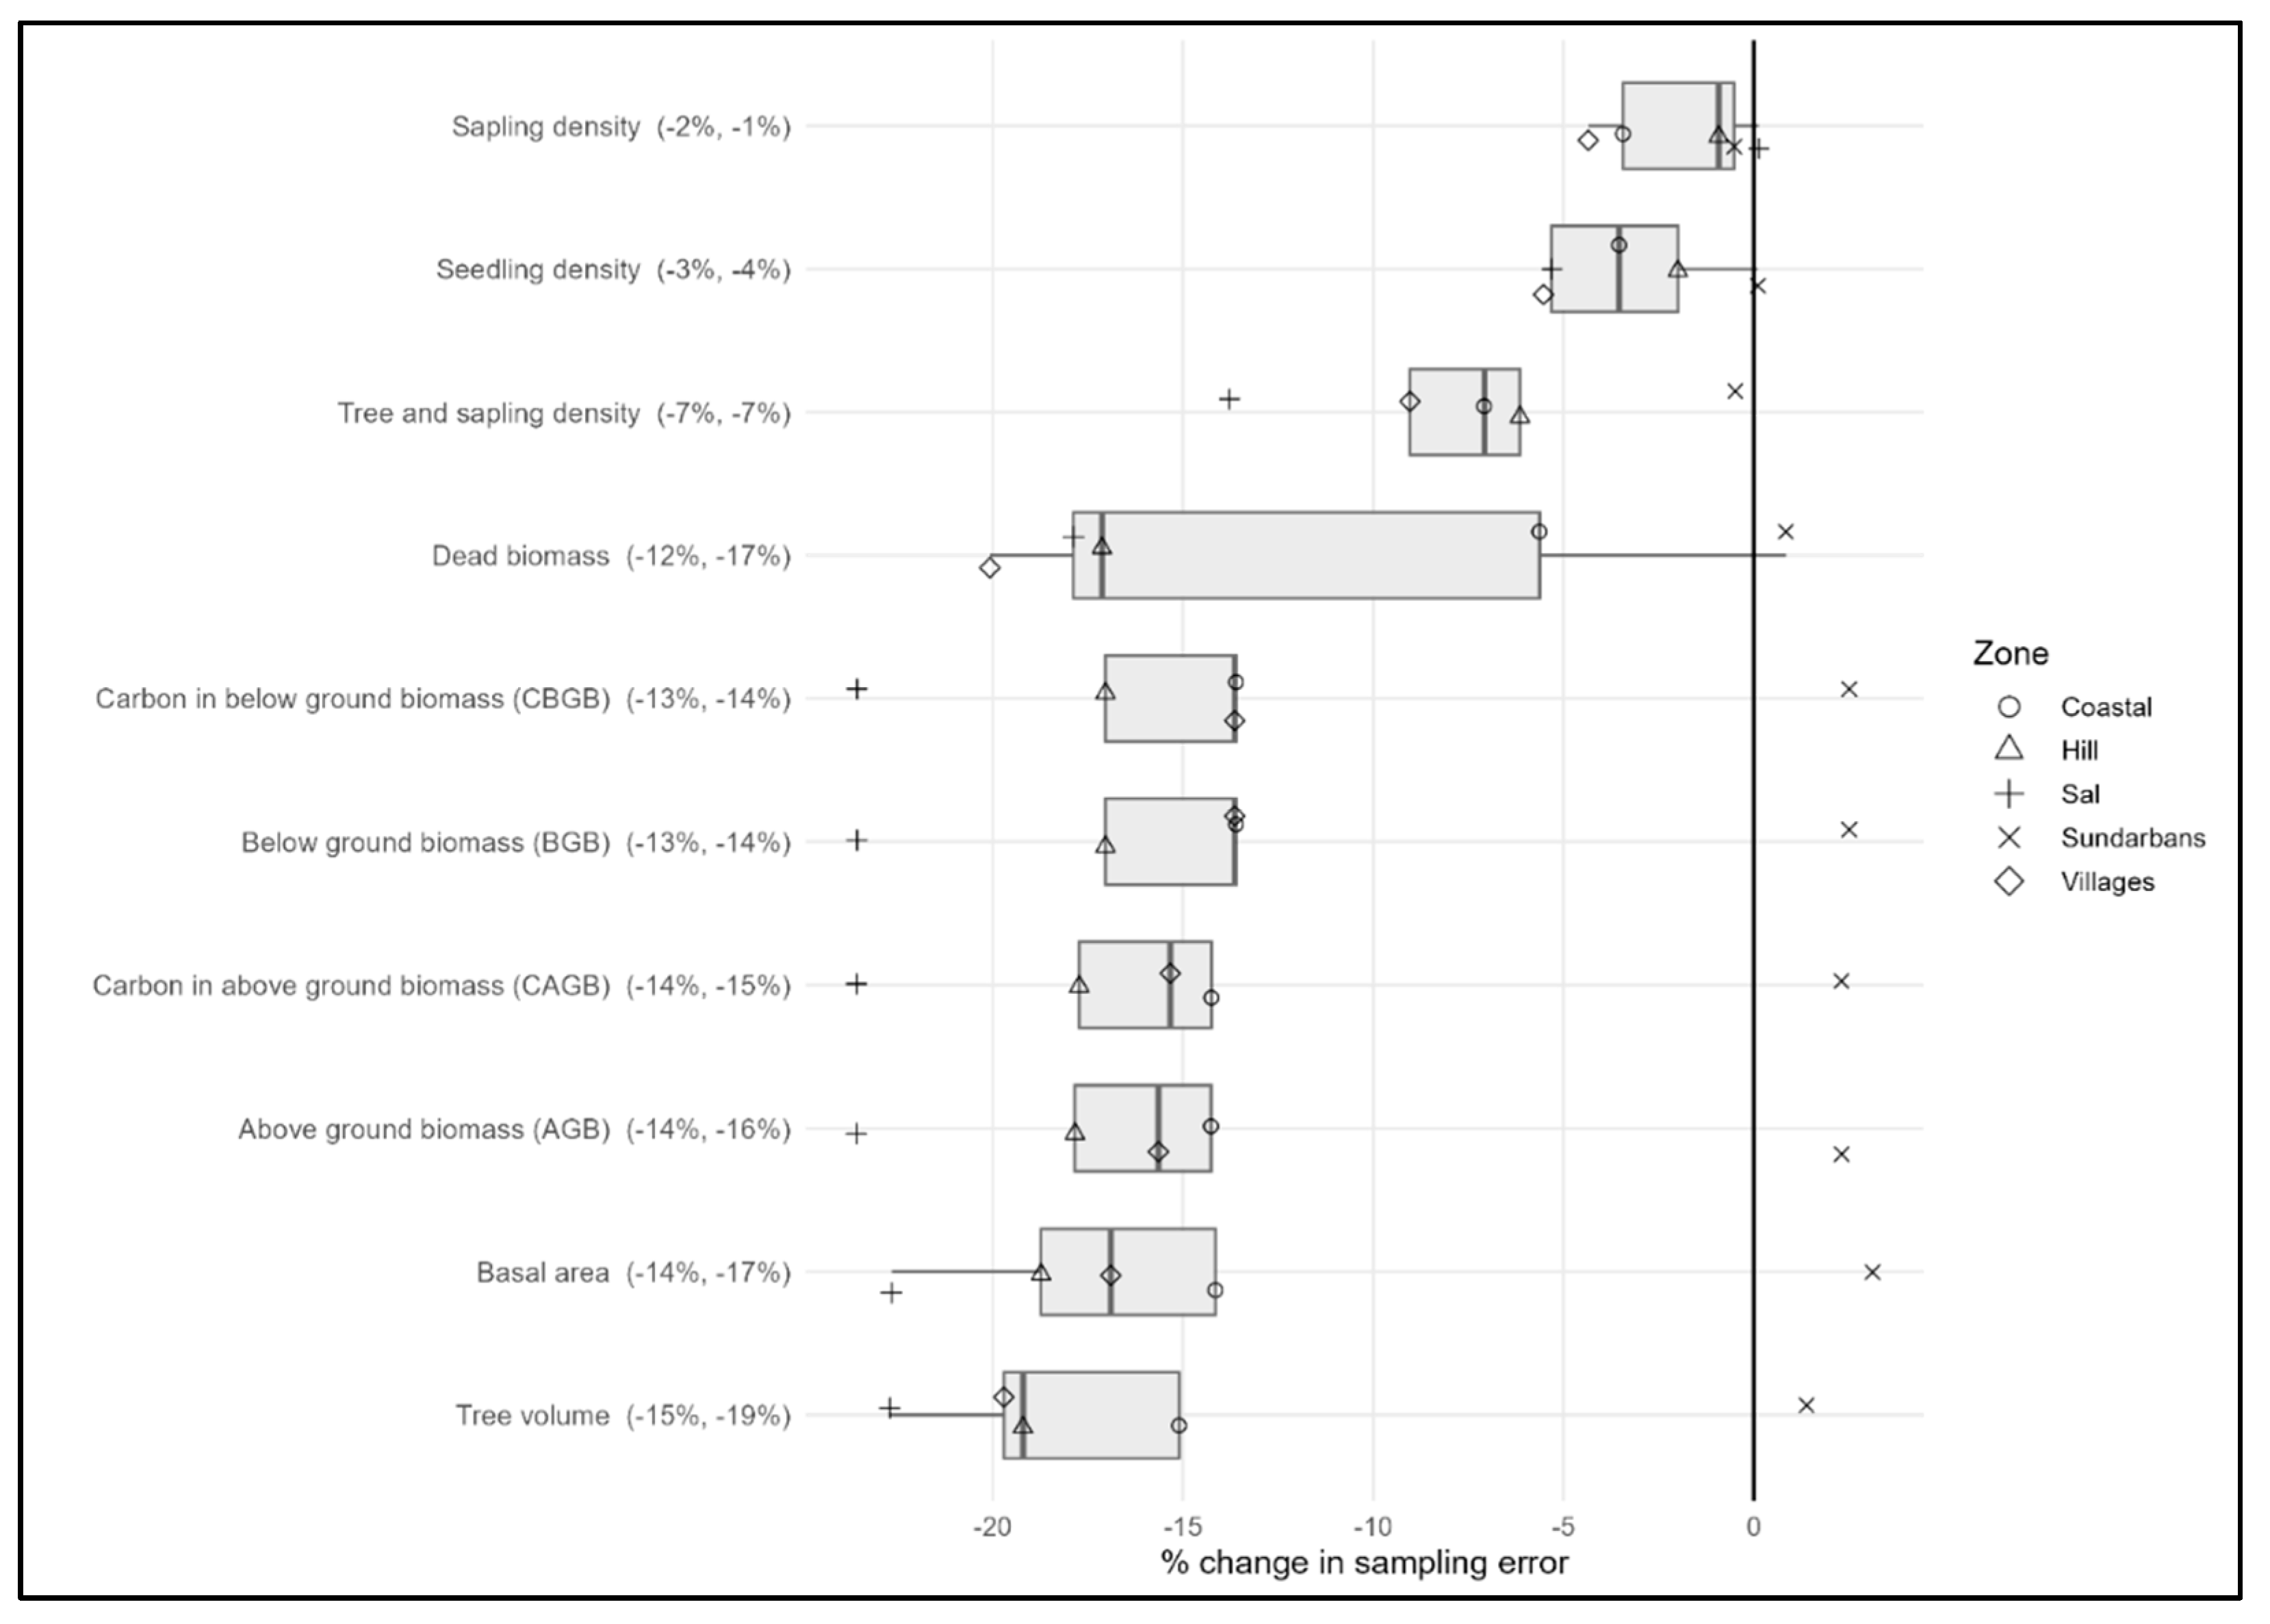
Figure 4 shows the percentage change in sampling error of indicator estimates when RS-derived land cover was used in place of field-survey-based land cover data, expressed relative to the field-based sampling error.
Across indicators, RS-derived land cover generally led to consistent reductions in sampling error, although the magnitude of improvement varied between indicators. Biomass related indicators showed the strongest and most systematic reductions. For example, tree volume exhibited the largest overall improvement, with average reductions of about −15%. Similar trends were observed for basal area, above-ground biomass (AGB), and carbon in above-ground biomass (CAGB), where reductions were about −14%. Below-ground biomass (BGB) and carbon in BGB (CBGB) followed the same pattern, with mean reductions of about −13%. Dead biomass also showed reductions, with a mean decrease of around −12%. However, the wider spread of values across zones indicates greater heterogeneity compared with live biomass indicators.
In contrast, structural and regeneration indicators showed smaller improvements. Tree and sapling density showed modest reductions (around −7% on average), while sapling density and seedling density exhibited very small changes, with mean decreases of only −2% and −3%, respectively. Zone-level patterns reveal that the Sal zone consistently experienced some of the largest reductions, while in the Sundarbans zone sampling errors were reduced with field survey based land cover data. Overall, the zone level results confirm the pattern observed at the land cover class level that RS-derived land cover substantially improves the precision of most of the indicators.
4. Discussion
Accurate delineation of land cover (LC) classes and their associated areas forms the foundation for extrapolating plot-level measurements to regional and national scales. Such information is crucial for forest management, environmental monitoring, land use planning, and international reporting initiatives such as REDD+ and SDG 15. Robust LC data support the estimation of forest extent, land use change, and key biophysical indicators such as tree density, above- and below-ground biomass, growing stock, and carbon stocks [3,12,23].
Traditionally, LC classification in NFIs relied on field observations, where inventory crews recorded the dominant cover type within a plot or estimated the proportion of multiple classes intersecting the plot [24]. Field-based observations have long been regarded as the most reliable source of LC information and are often used as reference data for validating remote sensing (RS) products [6,25].
However, this study provides empirical evidence that RS-derived land cover can significantly reduce the sampling error of indicator estimates compared with field-survey-based land cover. For biomass-related indicators—including above- and below-ground biomass, tree volume, basal area, and associated carbon pools—average reductions of 15–20% were observed, with some cases exceeding 50%. These results are consistent with recent findings in other NFIs, such as the U.S., where RS integration improved efficiency [26] , and across the Nordic region, where combining RS, airborne laser scanning, and NFI data yielded significant gains in precision [27]. In contrast, gains were less consistent for regeneration and structural indicators (e.g., sapling and seedling density), echoing broader challenges in capturing fine-scale forest structure with RS data [28].
A key source of uncertainty lies in the interpretation of land cover classes by field crews. In our study, dissimilarities of up to 38% were observed between field-assigned classes and those derived from the LCML-compliant land cover map and very high-resolution imagery. Such discrepancies arise from difficulties in consistently classifying small parcels, areas with overlapping land uses, or vegetation types subject to temporal dynamics (e.g., seasonal cropping). These findings resonate with studies highlighting systematic biases and subjectivity in field-based forest measurements—for example, underestimation of tree heights by 5–25% compared to terrestrial laser scanning (TLS), with extreme cases up to 41% for tall tropical trees ([29,30]. Classification accuracy also varies with crew training and interpretation, with inter-observer variability representing a significant source of error [6,31]. Visual interpretation of fine-resolution imagery confirmed that the RS-based map characterized LC more consistently than field-based classification (one example in Appendix A). The availability of differential GPS coordinates for most plots further reduced potential misalignments between plots and RS layers, a known source of error in field–RS integration [32].
These findings raise broader questions about the design, implementation, and inherent subjectivity of field-based LC data collection. They underscore the need for consistent, transparent, and interoperable approaches to producing and validating LC information. The emergence and application of standardized ontological frameworks, such as the LCML, for land cover classification represents a critical advancement in this regard. LCML provides a structured and extensible basis for defining LC classes [33,34], supporting the integration of heterogeneous data sources, enabling semantic interoperability, and facilitating automated classification and reasoning process that can enhance both field-based and remote sensing-based workflows [23,35]. By capturing expert knowledge and establishing contextual relationships among LC types, ontologies improve semantic clarity and enable integration of heterogeneous data sources [36]. We also tested an object-based classification approach using field-collected descriptors aligned with the Land Cover Meta Language (LCML). However, preliminary results indicated that more detailed data, improved methodologies, and enhanced crew training in LCML-based classification are required before such approaches can deliver reliable results.
5. Conclusion
This study demonstrates that integrating RS-derived land cover into the Bangladesh National Forest Inventory substantially improves the precision of most key indicators compared with field-survey-based land cover. Biomass-related indicators, including above- and below-ground biomass, tree volume, basal area, and associated carbon pools, showed the largest and most consistent reductions in sampling error, with improvements ranging from 15–20% and in some cases exceeding 50%. By contrast, regeneration-related indicators such as sapling and seedling density exhibited greater variability and increased sampling error, underscoring the persistent challenges of capturing fine-scale forest dynamics through RS-based stratification alone.
The findings underscore two critical insights. First, RS-derived land cover can serve as a reliable and cost-effective alternative to field-based delineation of land cover for national monitoring, offering wall-to-wall, spatially explicit coverage that reduces uncertainty in biomass estimation. Second, field surveys remain indispensable for calibration, validation, and for indicators less well captured through RS, particularly regeneration and structural attributes. A hybrid approach that leverages the strengths of both data sources, supported by standardized ontological frameworks such as LCML, represents a robust pathway for future NFIs.
These results have direct implications for national forest monitoring, REDD+ reporting, and SDG 15.3.1 assessments in Bangladesh and similar contexts. By reducing uncertainty and improving comparability, the integration of RS and field data enhances transparency, cost-effectiveness, and interoperability in land information systems. Future work should focus on refining RS-based classification of heterogeneous land covers, advancing object-based and ontology-driven approaches, and strengthening field crew capacity to ensure consistent application of land cover standards.
Author Contributions
Conceptualization, R.J., M.A.H., Z.I. and K.J.; methodology, R.J. and M.A.H.; software, R.J. and M.A.H.; formal analysis, R.J. and M.A.H.; investigation, Z.I. M.A., T.A., R.M., F.K.M., S.I., A.H., A.G., F.M., G.S., L.C. and K.J.; writing—original draft preparation, R.J. and M.A.H.; writing—review and editing, R.J., M.A.H., Z.I. M.A., T.A., R.M., F.K.M., S.I., A.H., A.G., F.M., G.S., L.C. and K.J.; supervision, K.J., Z.I. and M.A.All authors have read and agreed to the published version of the manuscript.
Funding
This research received no external funding.
Data Availability Statement
Not applicable.
Conflicts of Interest
The authors declare no conflict of interest.
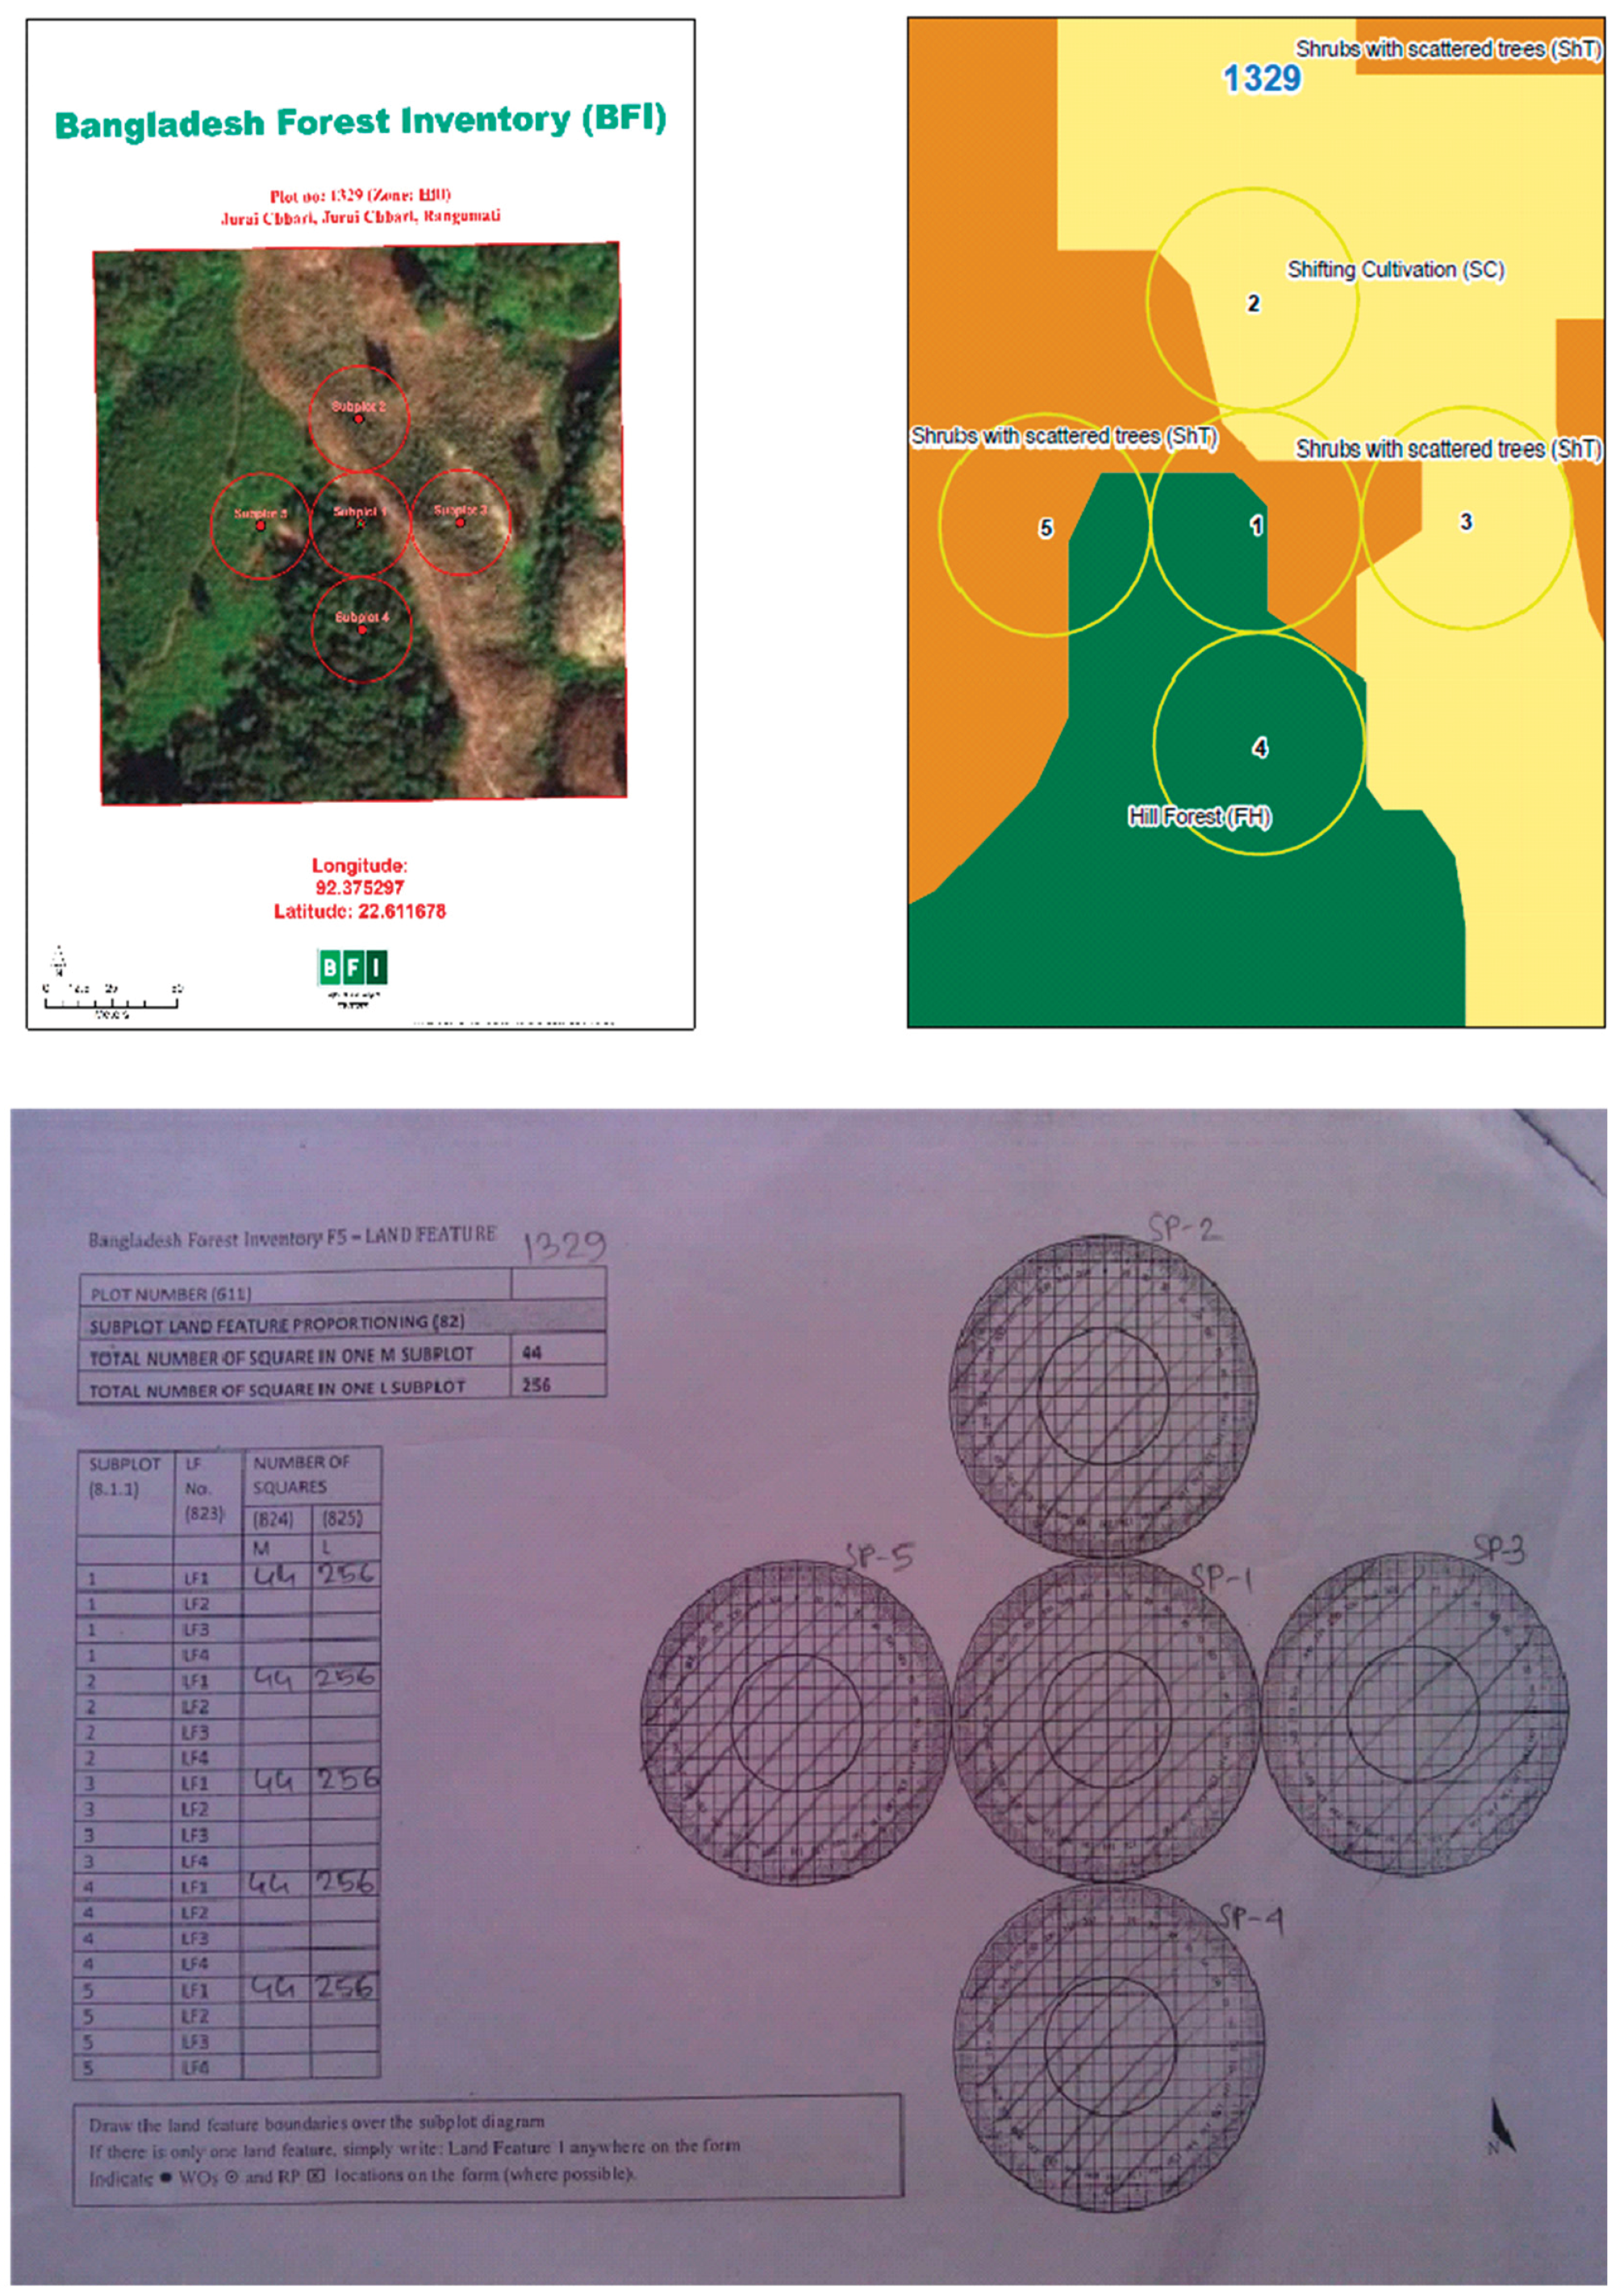
Appendix A
An illustration of differences between (A) very high-resolution satellite imagery, (B) land cover mapping and (C) field crew observation for the identification and delineation of land classes in the Hill forest. Only one land class was assigned by the field crew.
References
- F. Achard, S. Brown, M. Brady, R. DeFries, G. Grassi, M. Herold, et al., "A sourcebook of methods and procedures for monitoring and reporting anthropogenic greenhouse gas emissions and removals associated with deforestation, gains and losses of carbon stocks in forests remaining forests, and forestation," GOFC-GOLD Project Office, Wageningen University, Wageningen, Netherlands2013-03-15 2013.
- M. Herold, R. M. Román-Cuesta, V. Heymell, Y. Hirata, P. Van Laake, G. P. Asner, et al., "A review of methods to measure and monitor historical carbon emissions from forest degradation," Unasylva, vol. 62, pp. 16-24, 2011.
- P. Olofsson, G. M. Foody, M. Herold, S. V. Stehman, C. E. Woodcock, and M. A. Wulder, "Good practices for estimating area and assessing accuracy of land change," Remote Sensing of Environment, vol. 148, pp. 42-57, 2014/05/25/ 2014.
- S. Saarela, S. Schnell, A. Grafström, S. Tuominen, K. Nordkvist, J. Hyyppä, et al., "Effects of sample size and model form on the accuracy of model-based estimators of growing stock volume," Canadian Journal of Forest Research, vol. 45, pp. 1524-1534, 2015.
- G. M. Foody, "Status of land cover classification accuracy assessment," Remote Sensing of Environment, vol. 80, pp. 185-201, 2002/04/01/ 2002.
- R. G. Congalton and K. Green, Assessing the Accuracy of Remotely Sensed Data: Principles and Practices, 2nd ed. ed.: CRC Press, 2008.
- J. Chave, R. Condit, S. Aguilar, A. Hernandez, S. Lao, and R. Perez, "Error propagation and scaling for tropical forest biomass estimates," Phil. Trans. R. Soc. Land. B, vol. 359, 2004.
- Q. Molto, V. Rossi, and L. Blanc, "Error propagation in biomass estimation in tropical forests," Methods in Ecology and Evolution, vol. 4, pp. 175-183, 2013.
- C. Pelletier, S. Valero, J. Inglada, N. Champion, and G. Dedieu, "Assessing the robustness of Random Forest-based classifiers in land cover mapping," ISPRS Journal of Photogrammetry and Remote Sensing, vol. 114, pp. 38-49, 2016.
- S. Fritz, L. See, C. Perger, I. McCallum, C. Schill, D. Schepaschenko, et al., "A global dataset of crowdsourced land cover and land use reference data," Scientific Data, vol. 4, p. 170075, 2017.
- N. Gorelick, M. Hancher, M. Dixon, S. Ilyushchenko, D. Thau, and R. Moore, "Google Earth Engine: Planetary-scale geospatial analysis for everyone," Remote Sensing of Environment, vol. 202, pp. 18-27, 2017/12/01/ 2017.
- P. Potapov, X. Li, A. Hernandez-Serna, A. Tyukavina, M. C. Hansen, A. Kommareddy, et al., "Mapping global forest canopy height through integration of GEDI and Landsat data," Remote Sensing of Environment, vol. 253, p. 112165, 2021/02/01/ 2021.
- K. Shimizu, T. Ota, and N. Mizoue, "Detecting Forest Changes Using Dense Landsat 8 and Sentinel-1 Time Series Data in Tropical Seasonal Forests," Remote Sensing, vol. 11, p. 1899, 2019.
- GOB, "The socioeconomic survey of the Bangladesh Forest Inventory," Bangladesh Forest Department2017.
- M. Henry, Z. Iqbal, K. Johnson, M. Akhter, L. Costello, C. Scott, et al., "A multi-purpose National Forest Inventory in Bangladesh: design, operationalisation and key results," Forest Ecosystems, vol. 8, p. 12, 2021/02/07 2021.
- GoB, "National Land Representation System of Bangladesh," Forest Department, Ministry of Environment and Forests, Government of the People’s Republic of Bangladesh., Dhaka2017.
- Di Gregorio and, U. Leonardi, "Land Cover Classification System Software version 3 - User Manual," Food and Agriculture Organization of the United Nations, Rome, Italy2016.
- L. Costello and M. Piazza, "Proceedings from the training Survey Design and Data Management Using Open Foris Collect for NFI and Carbon Stock Assessment in Bangladesh," Food and Agricultural Organization of the United Nations, Dhaka2-6 November 2015.
- BSGI, BFD, and FAO, "National Land Cover Field Inventory Form 2016, Bangladesh," Bangladesh Society of Geo-informatics, Bangladesh Forest Department, Food and Agriculture Organization of the United Nations.2016.
- R. Jalal, Z. Iqbal, M. Henry, G. Franceschini, M. S. Islam, M. Akhter, et al., "Toward Efficient Land Cover Mapping: An Overview of the National Land Representation System and Land Cover Map 2015 of Bangladesh," IEEE Journal of Selected Topics in Applied Earth Observations and Remote Sensing, vol. 12, pp. 3852-3861, 2019.
- L. Costello, M. Hossain, H. Hayden, L. Rahman, Z. Iqbal, F. Sidik, et al., "Field instructions for the Bangladesh Forest Inventory," Bangladesh Forest Department, United States Forest Service, Food and Agriculture Organization of the United Nations.2016.
- M. A. Hossain, A. R. Anik, N. Chakma, K. Johnson, M. Henry, R. Jalal, et al., "Estimation Procedures of Indicators and Variables of the Bangladesh Forest Inventory," Dhaka2019.
- M. Herold, P. Mayaux, C. E. Woodcock, A. Baccini, and C. Schmullius, "Some challenges in global land cover mapping: An assessment of agreement and accuracy in existing 1 km datasets," Remote Sensing of Environment, vol. 112, pp. 2538-2556, 2008/05/15/ 2008.
- E. Tomppo, T. Gschwantner, M. Lawrence, and R. E. McRoberts, National Forest Inventories, Pathways for Common Reporting: Springer, 2010.
- G. M. Foody, "Explaining the unsuitability of the kappa coefficient in the assessment and comparison of the accuracy of thematic maps obtained by image classification," Remote Sensing of Environment, vol. 239, p. 111630, 2020/03/15/ 2020.
- J. Lister, H. Andersen, T. Frescino, D. Gatziolis, S. Healey, L. S. Heath, et al., "Use of Remote Sensing Data to Improve the Efficiency of National Forest Inventories: A Case Study from the United States National Forest Inventory," Forests, vol. 11, p. 1364, 2020.
- J. Breidenbach, J. Ivanovs, A. Kangas, T. Nord-Larsen, M. Nilsson, and R. Astrup, "Improving living biomass C-stock loss estimates by combining optical satellite, airborne laser scanning, and NFI data," Canadian Journal of Forest Research, vol. 51, pp. 1472-1485, 2021/04/09/ 2021.
- F. E. Fassnacht, J. C. White, M. A. Wulder, and E. Næsset, "Remote sensing in forestry: current challenges, considerations and directions," Forestry: An International Journal of Forest Research, vol. 97, pp. 11-37, 2023.
- X. Liang, V. Kankare, J. Hyyppä, Y. Wang, A. Kukko, H. Haggrén, et al., "Terrestrial laser scanning in forest inventories," ISPRS Journal of Photogrammetry and Remote Sensing, vol. 115, pp. 63-77, 2016/05/01/ 2016.
- K. Calders, G. Newnham, A. Burt, S. Murphy, P. Raumonen, M. Herold, et al., "Nondestructive estimates of above-ground biomass using terrestrial laser scanning," Methods in Ecology and Evolution, vol. 6, pp. 198-208, 2015.
- Comber, P. Mooney, R. S. Purves, D. Rocchini, and A. Walz, "Crowdsourcing: It Matters Who the Crowd Are. The Impacts of between Group Variations in Recording Land Cover," PLOS ONE, vol. 11, p. e0158329, 2016.
- S. P. Healey, W. B. Cohen, Z. Yang, C. Kenneth Brewer, E. B. Brooks, N. Gorelick, et al., "Mapping forest change using stacked generalization: An ensemble approach," Remote Sensing of Environment, vol. 204, pp. 717-728, 2018/01/01/ 2018.
- N. Mosca, A. D. Gregorio, M. Henry, R. Jalal, and P. Blonda, "Object-Based Similarity Assessment Using Land Cover Meta-Language (LCML): Concept, Challenges, and Implementation," IEEE Journal of Selected Topics in Applied Earth Observations and Remote Sensing, vol. 13, pp. 3790-3805, 2020.
- Di Gregorio and L. J., M. Jansen, Land Cover Classification System (LCCS): Classification Concepts and User Manual. Rome: FAO, 2000.
- N. E. Tsendbazar, S. de Bruin, and M. Herold, "Assessing global land cover reference datasets for different user communities," ISPRS Journal of Photogrammetry and Remote Sensing, vol. 103, pp. 93-114, 2015/05/01/ 2015.
- J. Comber, W. R. A., and P. F. and Fisher, "Using semantics to clarify the conceptual confusion between land cover and land use: the example of ‘forest’," Journal of Land Use Science, vol. 3, pp. 185-198, 2008/10/16 2008.
Figure 1.
Zones for the biophysical component of the Bangladesh Forest Inventory.
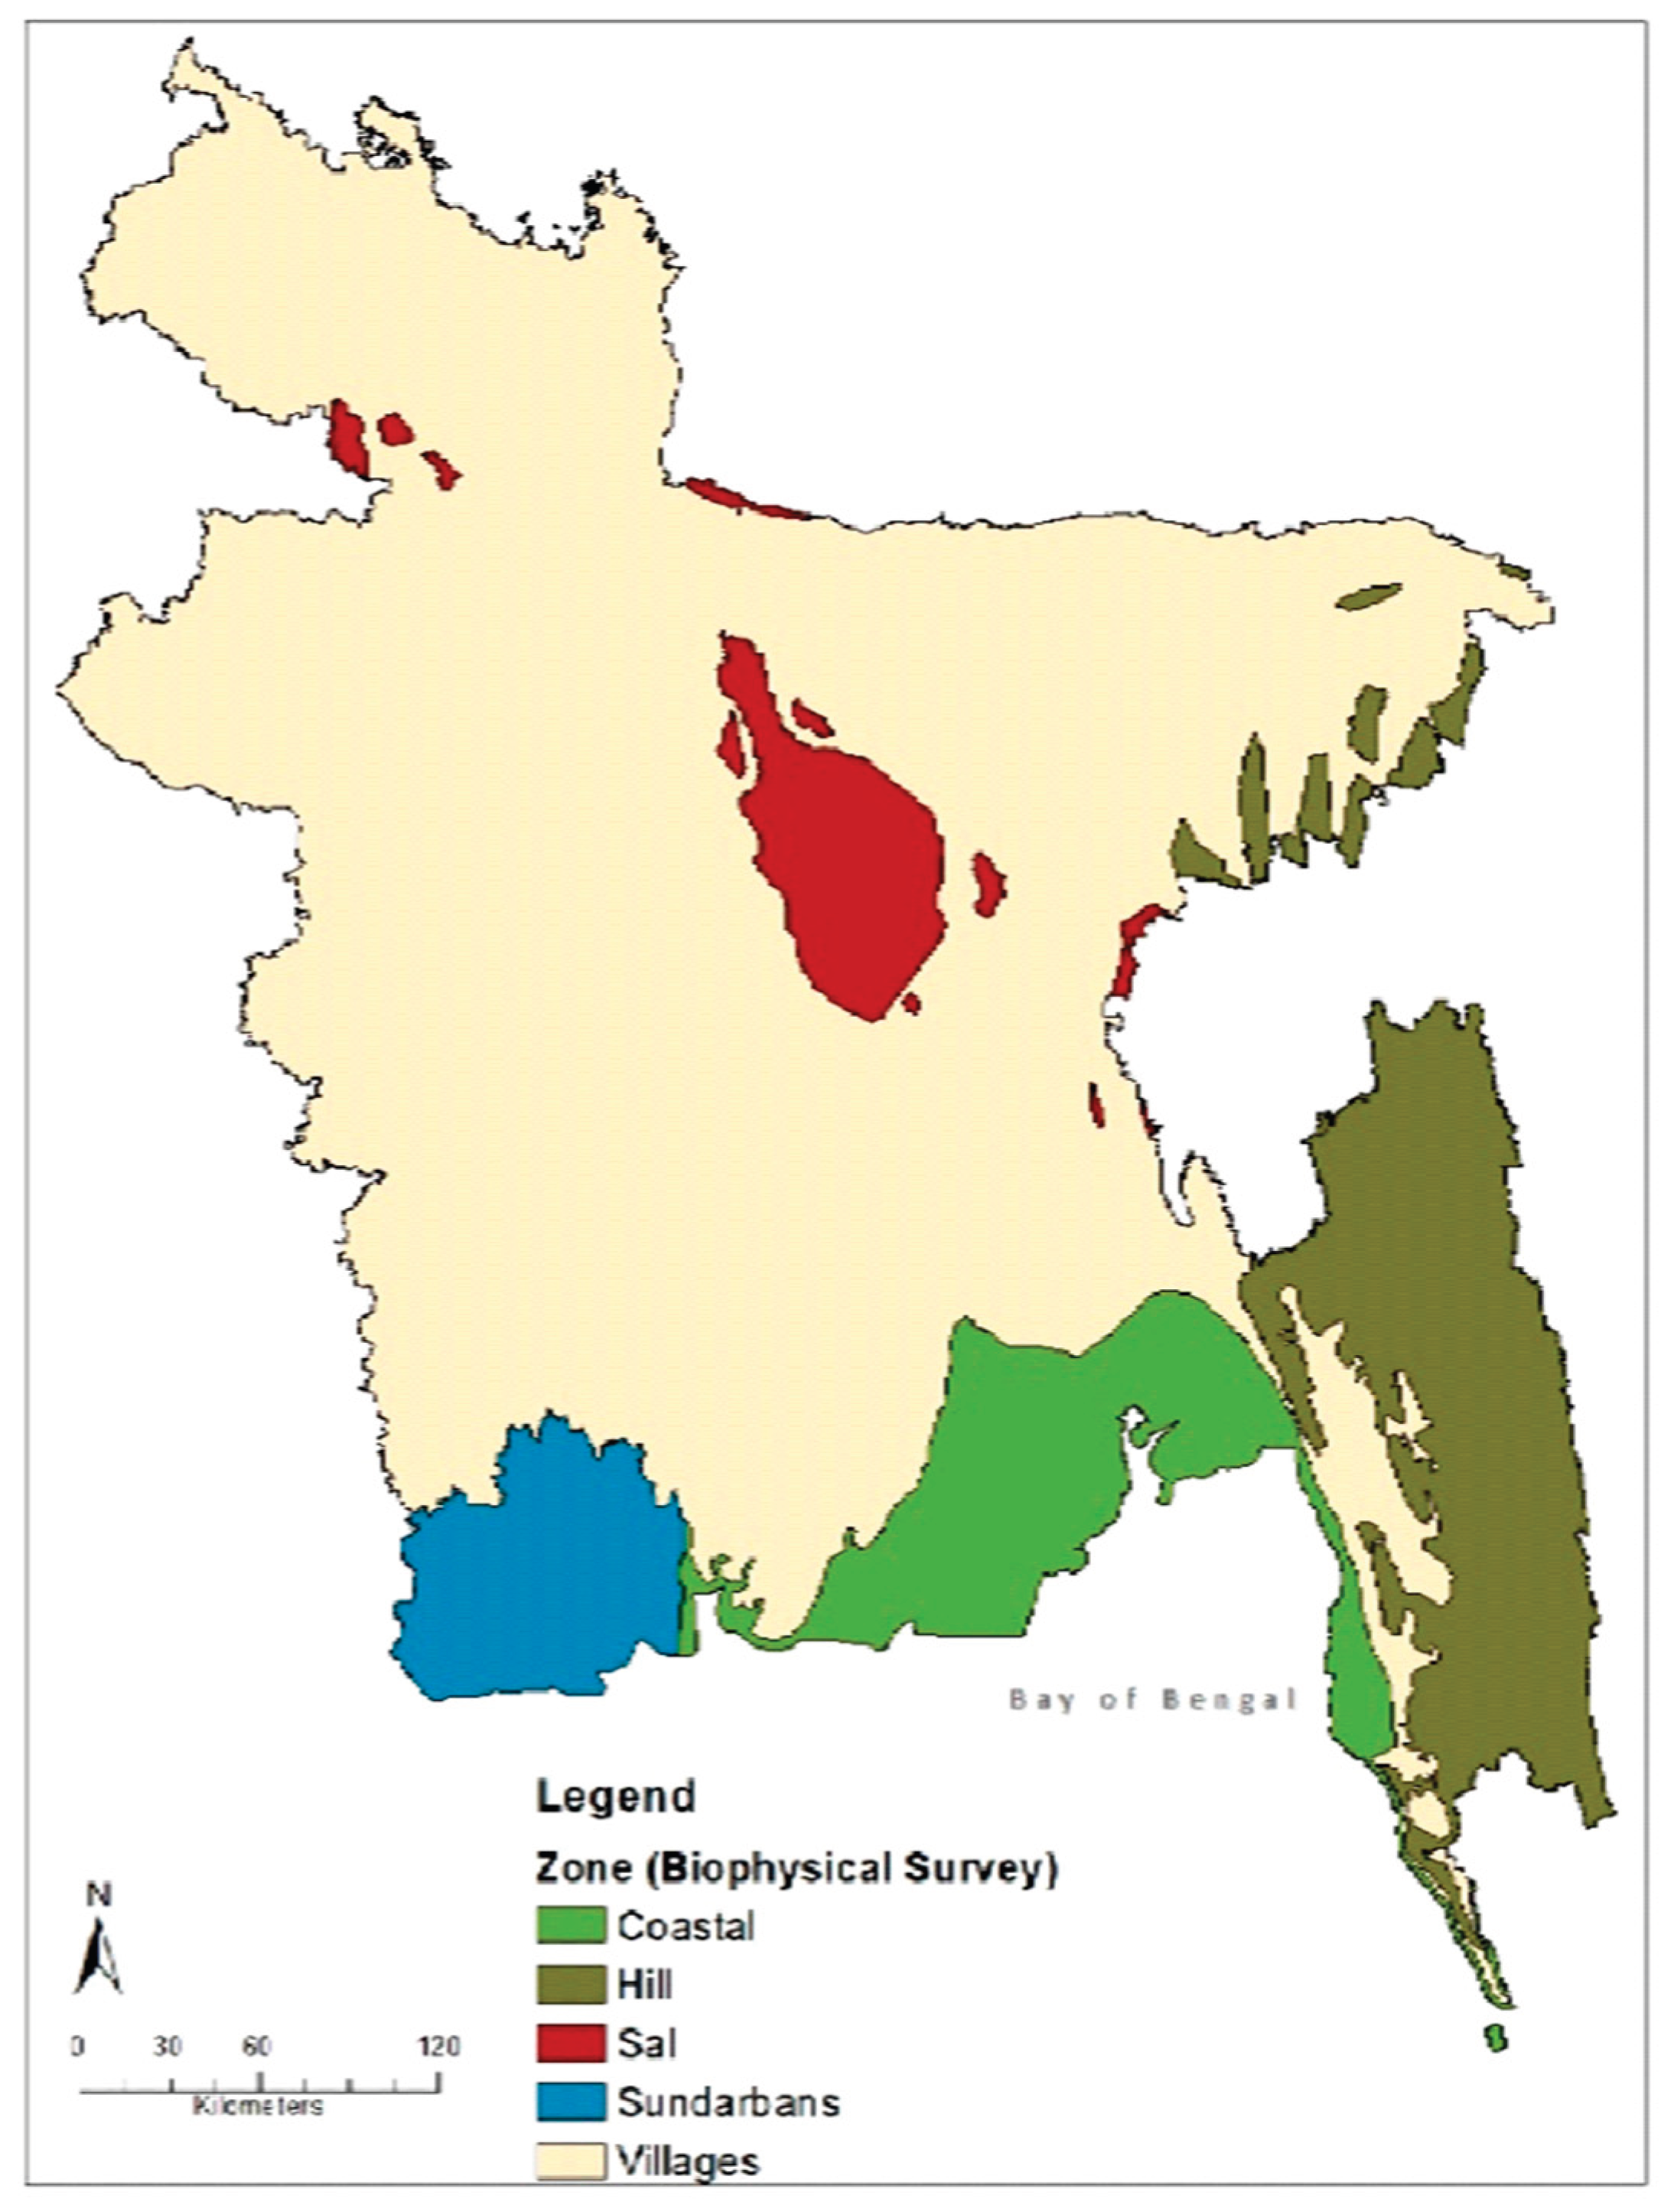
Figure 2.
Plot and subplot layouts (A) Sal, Hill, Village and Coastal zones, (B), Sundarban zone and (C) subplots (Source [15]).
Figure 2.
Plot and subplot layouts (A) Sal, Hill, Village and Coastal zones, (B), Sundarban zone and (C) subplots (Source [15]).
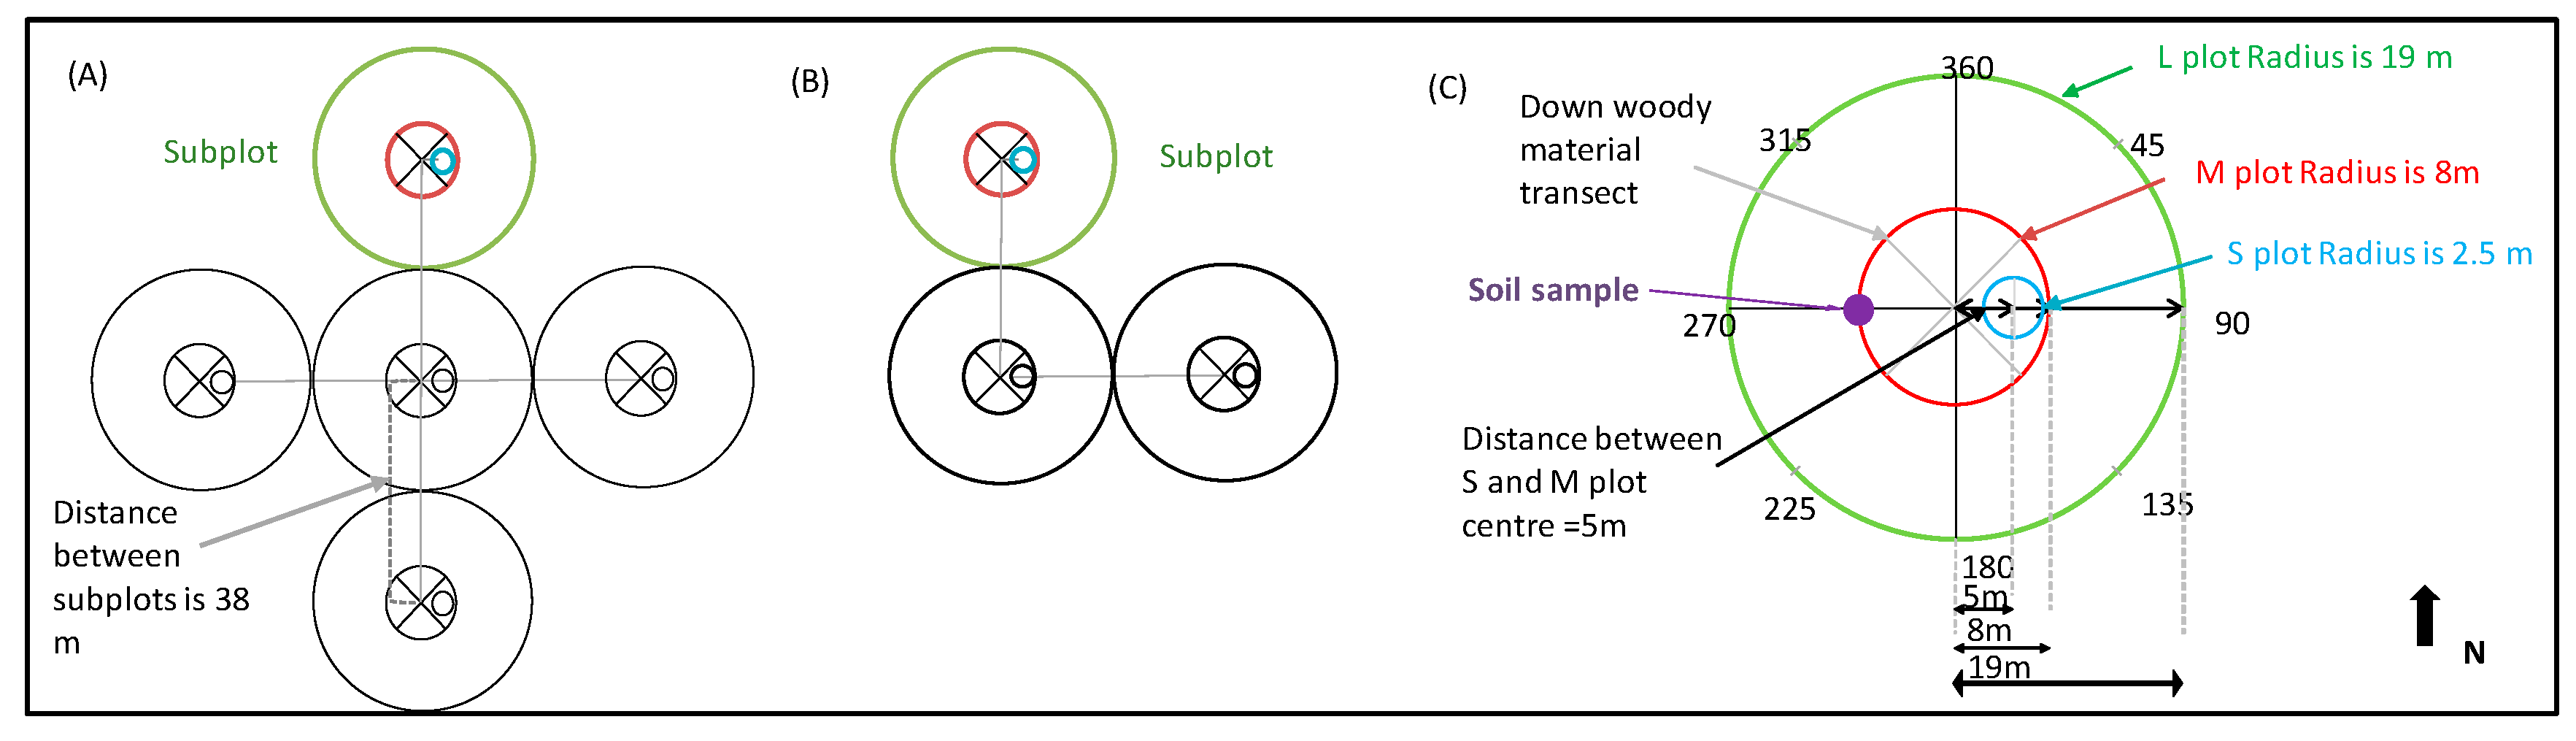
Figure 3.
Change in sampling error of indicator estimates based on RS-derived land cover compared with field-survey-based land cover data across land cover classes. The difference is expressed as a percentage of the sampling error from the field-survey-based estimation. Boxplots show the distribution of percentage change across land cover classes for each indicator, while individual points (distinguished by shapes) represent specific land cover classes. The values in parentheses after each indicator name denote the mean and median of the % change in sampling error across classes (format: mean%, median%). Negative values indicate reduced sampling error when using RS-derived land cover, while positive values indicate increased error.
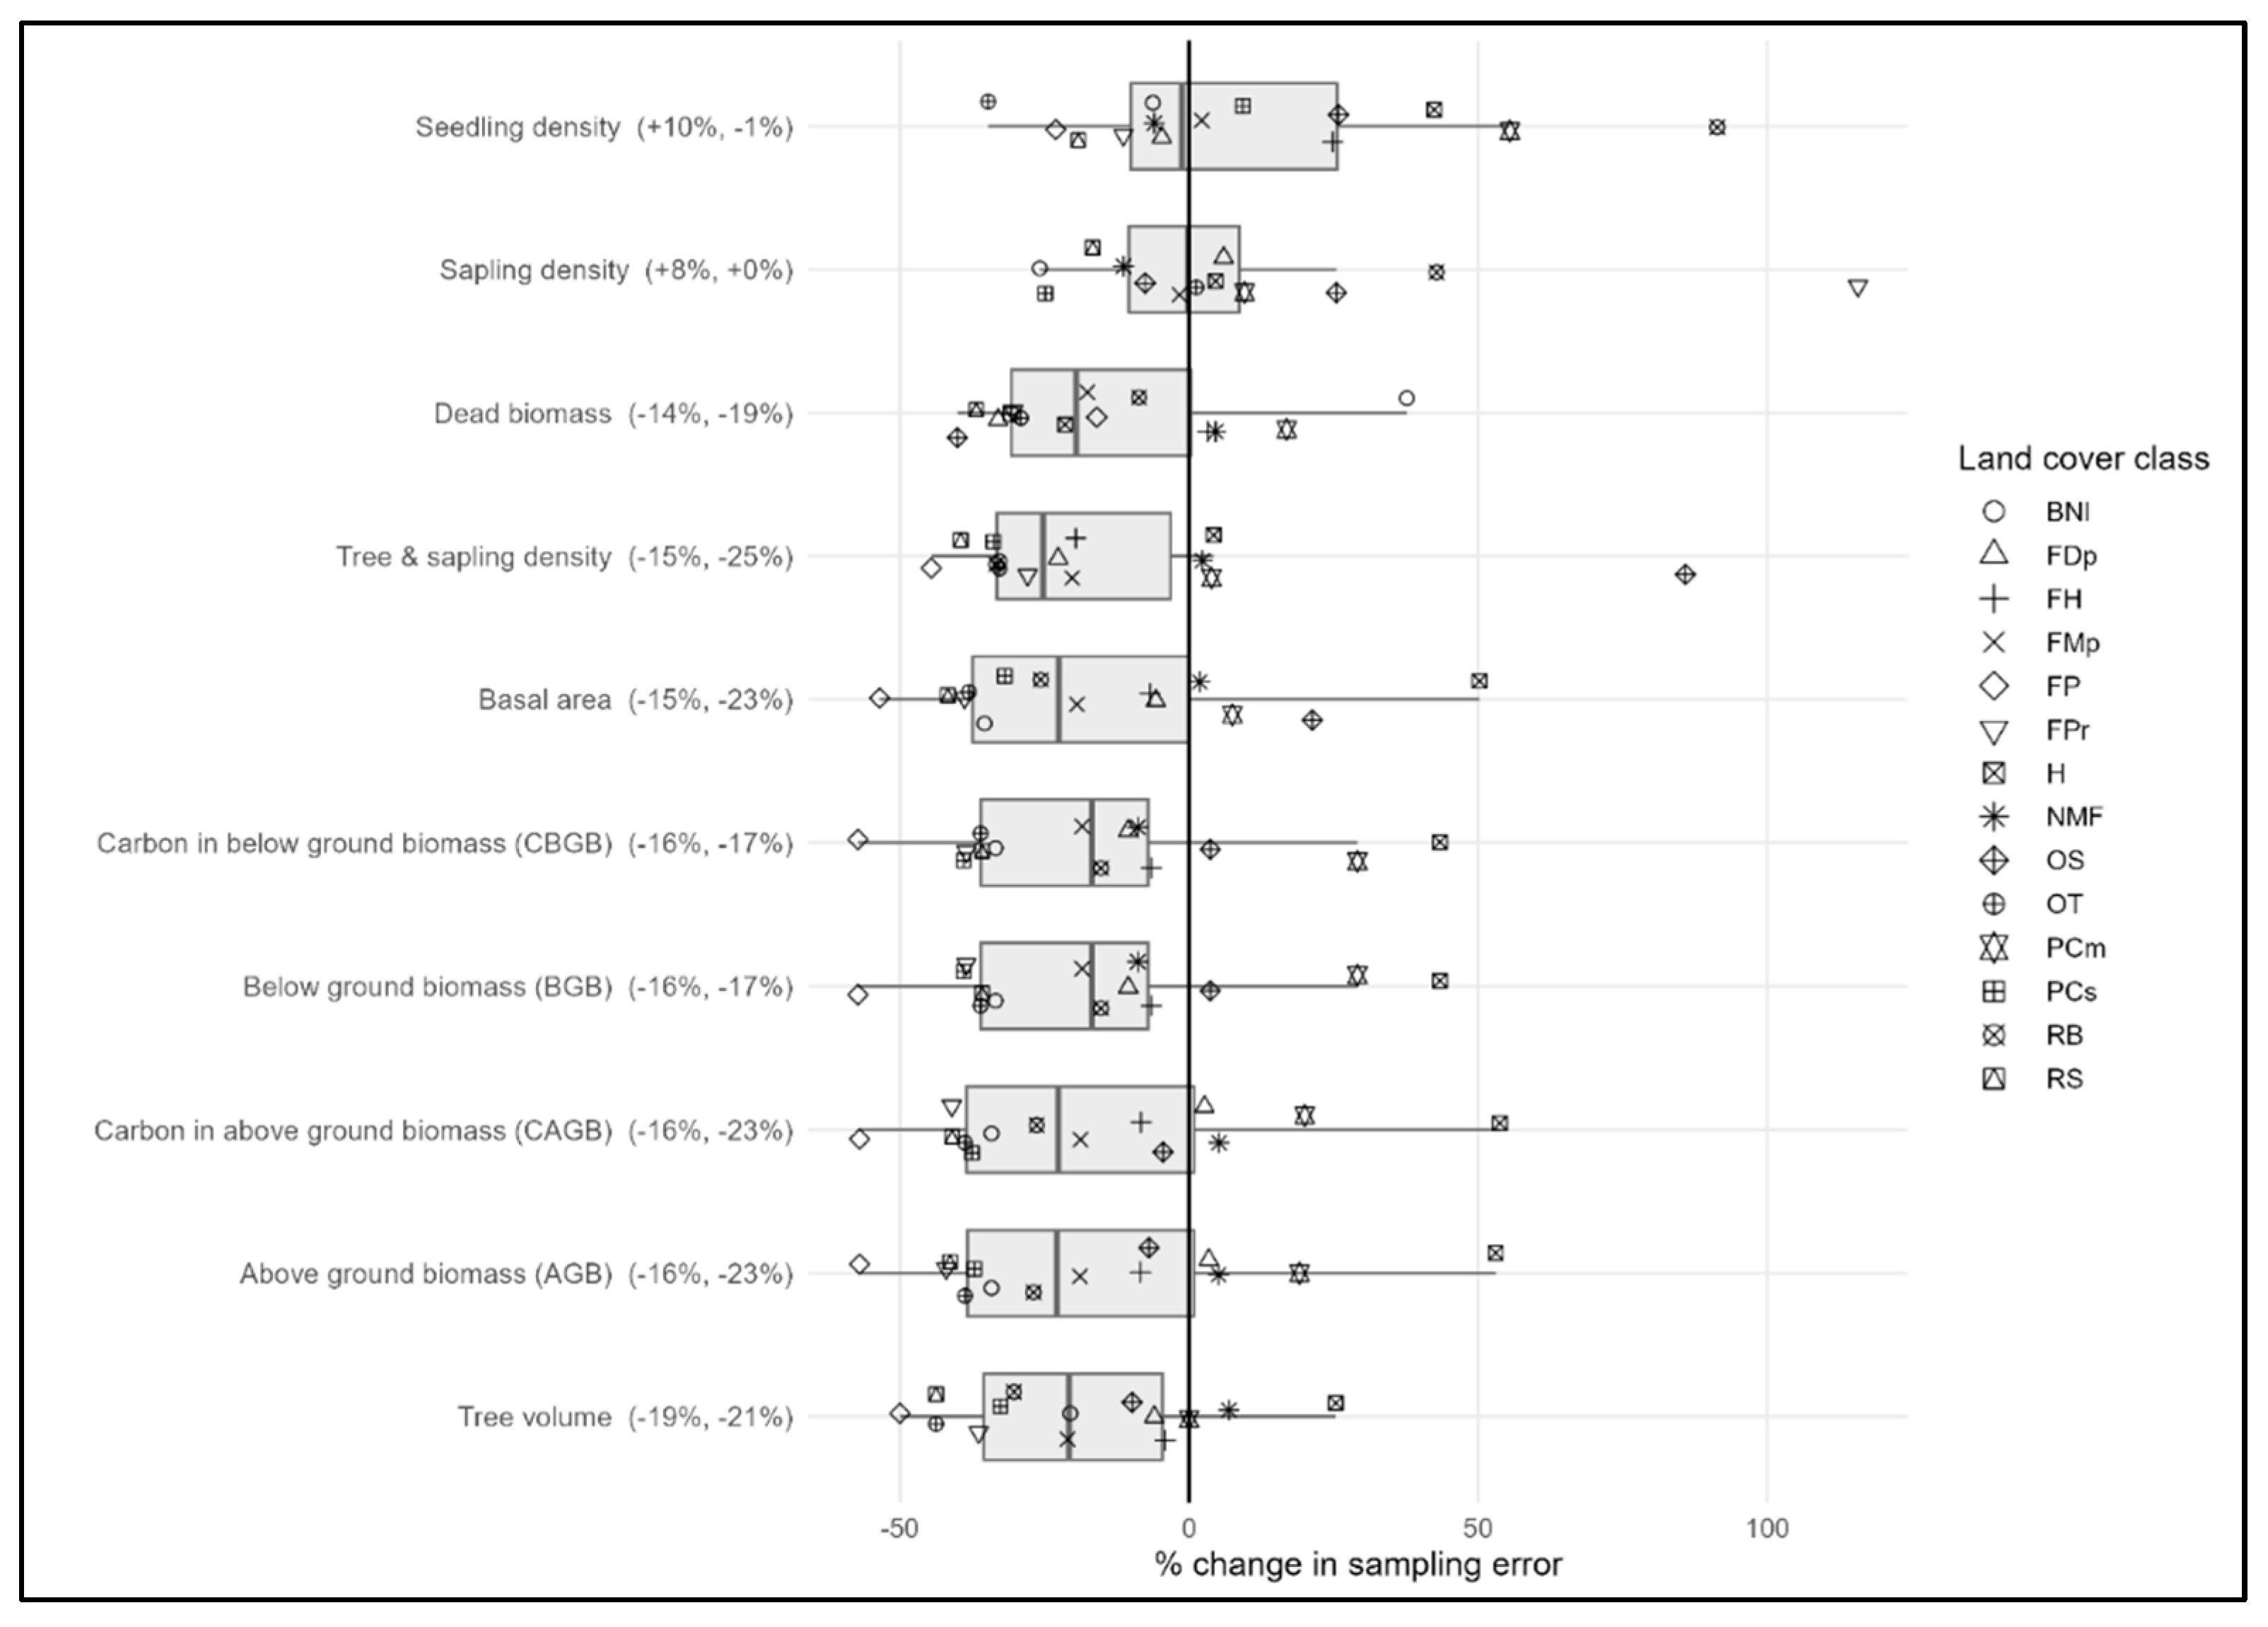
Figure 4.
Change in sampling error of indicator estimates based on RS-derived land cover compared with field-survey-based land cover data across zones. The difference is expressed as a percentage of the sampling error from the field-survey-based estimation. Boxplots show the distribution of percentage change across zones for each indicator, while individual points (distinguished by shapes) represent specific zone. The values in parentheses after each indicator name denote the mean and median of the % change in sampling error across zones (format: mean%, median%). Negative values indicate reduced sampling error when using RS-derived land cover, while positive values indicate increased error.
Disclaimer/Publisher’s Note: The statements, opinions and data contained in all publications are solely those of the individual author(s) and contributor(s) and not of MDPI and/or the editor(s). MDPI and/or the editor(s) disclaim responsibility for any injury to people or property resulting from any ideas, methods, instructions or products referred to in the content. |
© 2025 by the authors. Licensee MDPI, Basel, Switzerland. This article is an open access article distributed under the terms and conditions of the Creative Commons Attribution (CC BY) license (http://creativecommons.org/licenses/by/4.0/).
Copyright: This open access article is published under a Creative Commons CC BY 4.0 license, which permit the free download, distribution, and reuse, provided that the author and preprint are cited in any reuse.


